December 12 th , 2012 Valuation Final Project Company Ticker Analyst Hipermarcas BOV:HYPE3 Paula W. Nestrovski Karsten BOV:CTKA4 Leonardo Boguszewski LinkedIn NYSE:LNKD Andre Botelho Bastos Tesoro Corporation NYSE: TSO Henrique Morsoletto Valuation, Fall 2012 Prof. Aswath Damodaran

Valuation Project Damodaran
Jul 14, 2015
Welcome message from author
This document is posted to help you gain knowledge. Please leave a comment to let me know what you think about it! Share it to your friends and learn new things together.
Transcript
December 12th
, 2012
Valuation Final Project
Company Ticker Analyst
Hipermarcas BOV:HYPE3 Paula W. Nestrovski
Karsten BOV:CTKA4 Leonardo Boguszewski
LinkedIn NYSE:LNKD Andre Botelho Bastos
Tesoro Corporation NYSE: TSO Henrique Morsoletto
Valuation, Fall 2012
Prof. Aswath Damodaran
aswath1
Sticky Note
Excellent analysis. I may borrow from it for future classes.Overall grade: 30/30
Table of Contents 1. Summary ............................................................................................................................................... 4
2. Hypermarcas ....................................................................................................................................... 5
2.1. Company Overview .............................................................................................................................. 5
2.2. DCF Valuation ...................................................................................................................................... 5
2.2.1. Cost of Equity ....................................................................................................................... 5
2.2.2. Cost of Debt .......................................................................................................................... 6
2.2.3. Cost of Capital ...................................................................................................................... 6
2.2.4. Model .................................................................................................................................... 6
2.3. Relative Valuation ................................................................................................................................ 9
2.3.1. Multiple ................................................................................................................................. 9
2.3.2. Sector Regression .................................................................................................................. 9
2.3.3. Market-Wide Regression: Emerging Markets .................................................................... 10
2.4. Conclusion .......................................................................................................................................... 10
3. Karsten ............................................................................................................................................... 11
3.1. Company Overview ............................................................................................................................ 11
3.2. DCF Valuation .................................................................................................................................... 12
3.2.1. Cost of Equity ..................................................................................................................... 12
3.2.2. Cost of Debt ........................................................................................................................ 13
3.2.3. Cost of Capital .................................................................................................................... 13
3.2.4. Model .................................................................................................................................. 14
3.3. Relative Valuation .............................................................................................................................. 16
3.3.1. Multiple ............................................................................................................................... 16
3.3.2. Sector Regression ................................................................................................................ 16
3.3.3. Market-Wide Regression: Emerging Markets .................................................................... 17
3.4. Option Valuation ................................................................................................................................. 17
3.5. Conclusion .......................................................................................................................................... 18
4. LinkedIn............................................................................................................................................. 19
4.1. Company Overview ............................................................................................................................ 19
4.2. DCF Valuation .................................................................................................................................... 21
4.2.1. Cost of Equity ..................................................................................................................... 21
4.2.2. Cost of Debt ........................................................................................................................ 22
4.2.3. Cost of Capital .................................................................................................................... 22
4.2.4. Model .................................................................................................................................. 23
4.3. Relative Valuation .............................................................................................................................. 25
4.3.1. Multiple ............................................................................................................................... 25
4.3.2. Sector Regression ................................................................................................................ 25
4.3.3. Market-Wide Regression: United States ............................................................................. 26
4.4. Conclusion .......................................................................................................................................... 27
5. Tesoro ................................................................................................................................................. 28
5.1. Company Overview ............................................................................................................................ 28
5.2. DCF Valuation .................................................................................................................................... 29
5.2.1. Cost of Equity ..................................................................................................................... 29
5.2.2. Cost of Debt ........................................................................................................................ 30
5.2.3. Cost of Capital .................................................................................................................... 30
5.2.4. Model .................................................................................................................................. 30
5.3. Relative Valuation .............................................................................................................................. 32
5.3.1. Multiple ............................................................................................................................... 32
5.3.2. Sector Regression ................................................................................................................ 33
5.3.3. Market-Wide Regression: United States ............................................................................. 34
5.4. Conclusion .......................................................................................................................................... 34
1. Summary The objective of this project is to use different tools and valuation methodologies to value
companies in different industries and markets, determining whether they are currently under or
overvalued and giving a recommendation about their stocks.
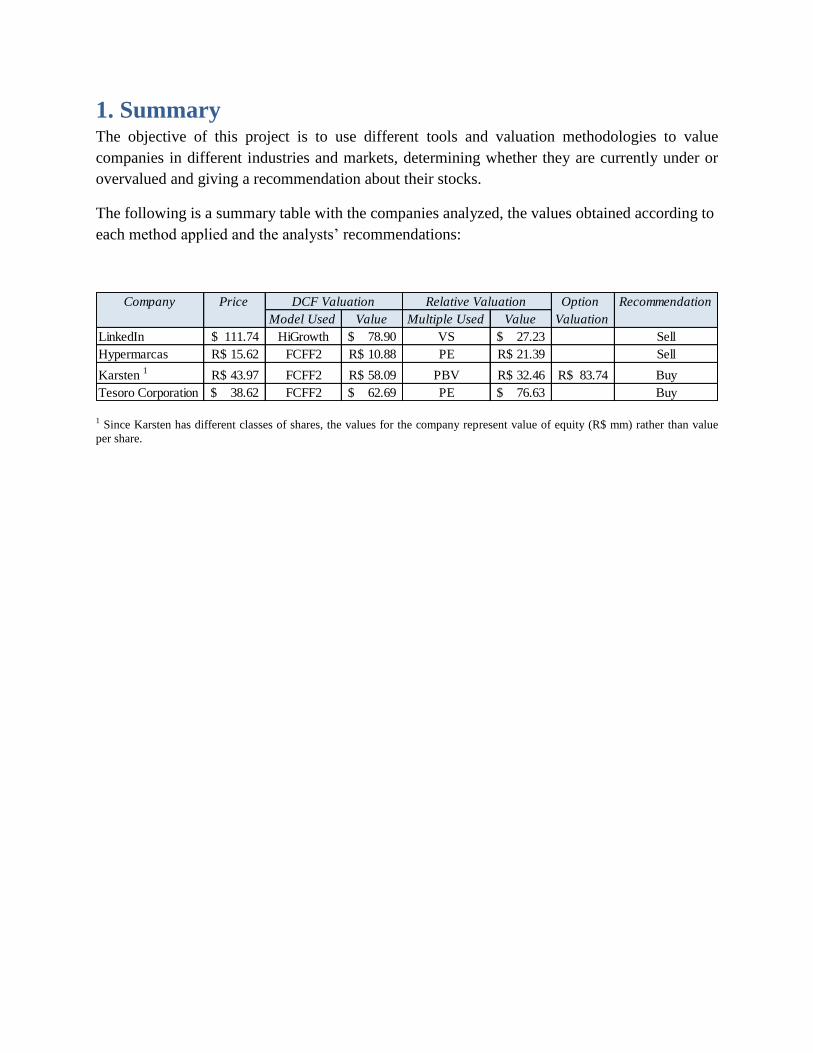
The following is a summary table with the companies analyzed, the values obtained according to
each method applied and the analysts’ recommendations:
1 Since Karsten has different classes of shares, the values for the company represent value of equity (R$ mm) rather than value
per share.
Company Price Option Recommendation
Model Used Value Multiple Used Value Valuation
LinkedIn 111.74$ HiGrowth 78.90$ VS 27.23$ Sell
Hypermarcas 15.62R$ FCFF2 10.88R$ PE 21.39R$ Sell
Karsten 1
43.97R$ FCFF2 58.09R$ PBV 32.46R$ 83.74R$ Buy
Tesoro Corporation 38.62$ FCFF2 62.69$ PE 76.63$ Buy
DCF Valuation Relative Valuation
2. Hypermarcas
2.1. Company Overview
Hypermarcas is one of the largest consumer goods companies in Brazil and has the most
diversified portfolio of brands in the country, including predominantly leading brands in their
respective segments. The company operates in two business lines: Drugs and Personal Care,
developing, producing and selling products that are part of an entire portfolio of brands.
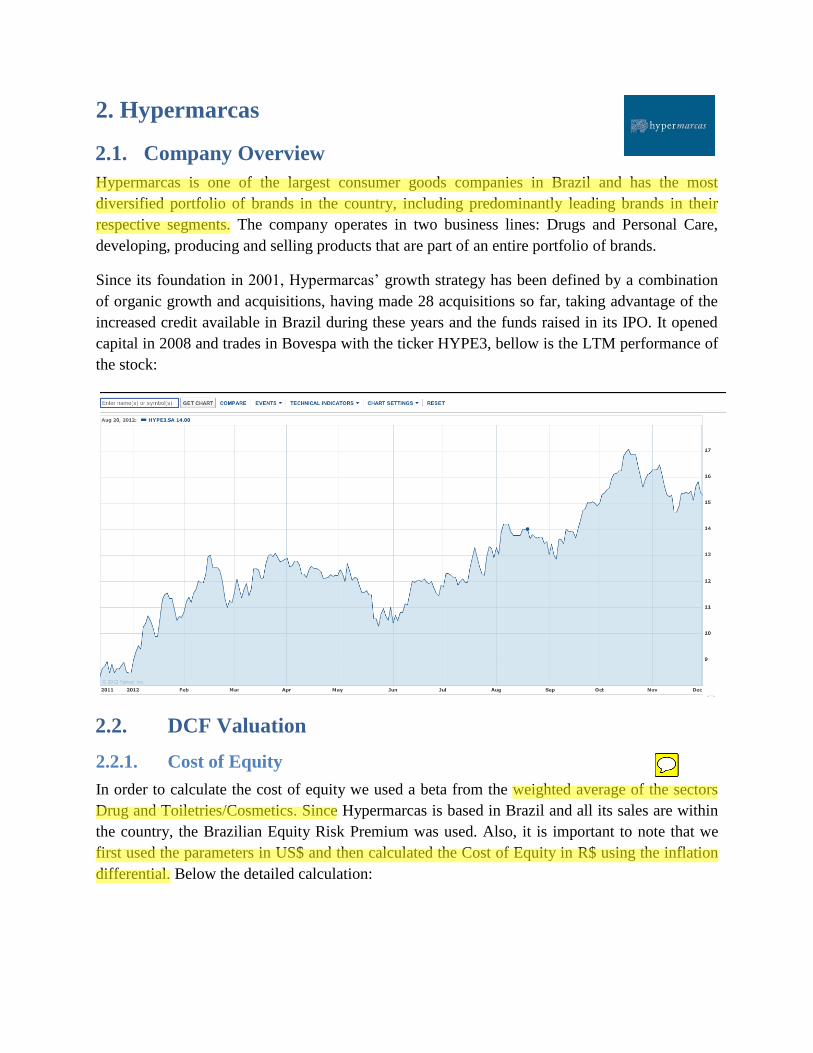
Since its foundation in 2001, Hypermarcas’ growth strategy has been defined by a combination
of organic growth and acquisitions, having made 28 acquisitions so far, taking advantage of the
increased credit available in Brazil during these years and the funds raised in its IPO. It opened
capital in 2008 and trades in Bovespa with the ticker HYPE3, bellow is the LTM performance of
the stock:
2.2. DCF Valuation
2.2.1. Cost of Equity
In order to calculate the cost of equity we used a beta from the weighted average of the sectors
Drug and Toiletries/Cosmetics. Since Hypermarcas is based in Brazil and all its sales are within
the country, the Brazilian Equity Risk Premium was used. Also, it is important to note that we
first used the parameters in US$ and then calculated the Cost of Equity in R$ using the inflation
differential. Below the detailed calculation:
aswath1
Highlight
aswath1
Highlight
aswath1
Sticky Note
I assume that these were US averages.
aswath1
Highlight

2.2.2. Cost of Debt
The majority of the company’s debt is denominated in the local currency; according to the
3Q2012 Earnings Release, the cost of debt is CDI (a money market interest rate in Brazil) minus
0.2 basis points, current leading to an average of 7.05%.
2.2.3. Cost of Capital
The company’s Cost of Capital is calculated based on the weighted average of the Cost of Equity
and Cost of Debt described above. Below are the details:
2.2.4. Model
Hypermarcas growth strategy required intense working capital and capex investments. Besides
acquisitions, the company used commercial policy (extending terms to clients) to drive sales
growth. This patterned changed in 2011 when a slowing demand from Brazilian consumers and
high leverage forced the company to review its commercial policy.
Since then Hypermarcas’ investments shifted to optimize organic growth and profitability in its
operations; recently invested in order to consolidate pharma production in the Brazilian state of
Goias (Project Matrix). Future plans include consolidating the personal care production (Project
Magnum) in the same state. The change in commercial terms has been reflected in 3Q2012
results; free cash flow from operation increased 248% when compared to the same period last
year.
Business Revenues EV/SalesEstimated
Value
Unlevered
Beta
Drug 1,958.53 2.9 5,586.05 1.1
Toiletries/Cosmetics 1,730.16 1.5 2,566.98 1.2
Company 3,688.69 8,153.03 1.1
MV Equity
Shares Outstanding 627.4
Current Price per Share 15.6
9,799.93
Cost of Equity
US 10y T 1.63%
Equity RP 8.63%
Levered Beta 1.43
Cost of Equity USD 13.97%
Inflation US 2%
Inflation BR 4.50%
Cost of Equity BRL 16.76%
Equity Debt Capital
Market Value 9799.9 4211.5 14011.5
Weight in Cost of Capital 70% 30% 100%
Cost 16.8% 7% 13.8%
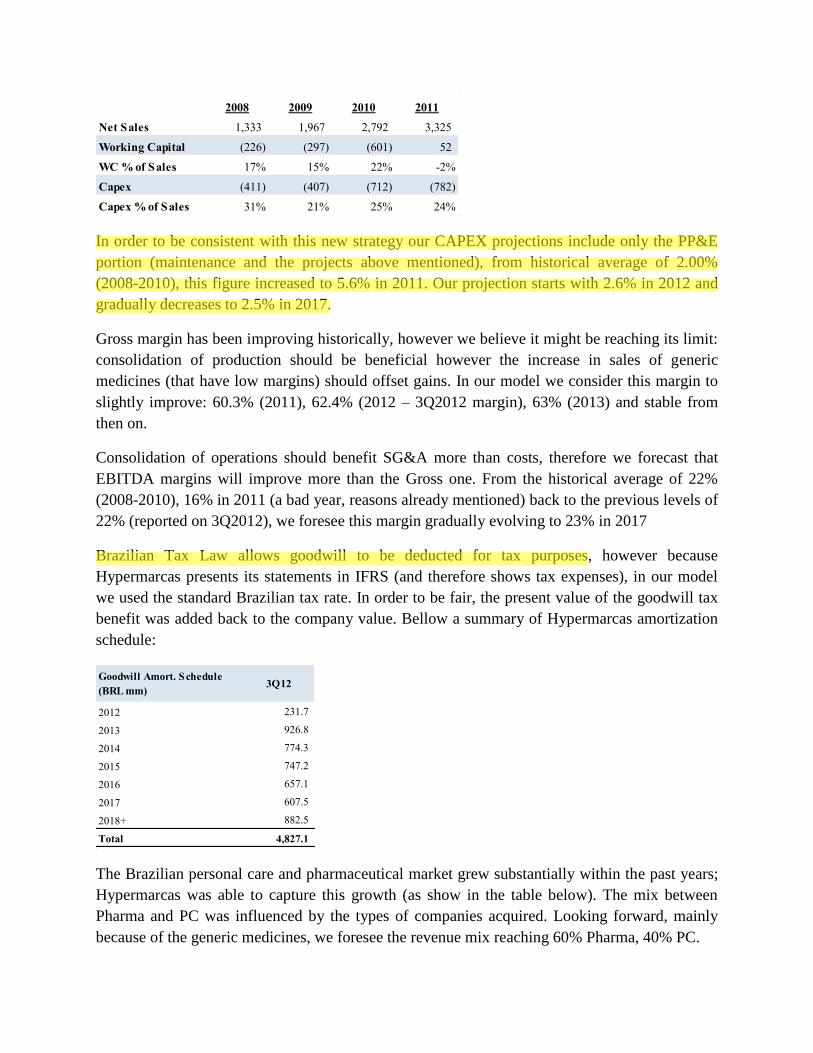
In order to be consistent with this new strategy our CAPEX projections include only the PP&E
portion (maintenance and the projects above mentioned), from historical average of 2.00%
(2008-2010), this figure increased to 5.6% in 2011. Our projection starts with 2.6% in 2012 and
gradually decreases to 2.5% in 2017.
Gross margin has been improving historically, however we believe it might be reaching its limit:
consolidation of production should be beneficial however the increase in sales of generic
medicines (that have low margins) should offset gains. In our model we consider this margin to
slightly improve: 60.3% (2011), 62.4% (2012 – 3Q2012 margin), 63% (2013) and stable from
then on.
Consolidation of operations should benefit SG&A more than costs, therefore we forecast that
EBITDA margins will improve more than the Gross one. From the historical average of 22%
(2008-2010), 16% in 2011 (a bad year, reasons already mentioned) back to the previous levels of
22% (reported on 3Q2012), we foresee this margin gradually evolving to 23% in 2017
Brazilian Tax Law allows goodwill to be deducted for tax purposes, however because
Hypermarcas presents its statements in IFRS (and therefore shows tax expenses), in our model
we used the standard Brazilian tax rate. In order to be fair, the present value of the goodwill tax
benefit was added back to the company value. Bellow a summary of Hypermarcas amortization
schedule:
The Brazilian personal care and pharmaceutical market grew substantially within the past years;
Hypermarcas was able to capture this growth (as show in the table below). The mix between
Pharma and PC was influenced by the types of companies acquired. Looking forward, mainly
because of the generic medicines, we foresee the revenue mix reaching 60% Pharma, 40% PC.
2008 2009 2010 2011
Net Sales 1,333 1,967 2,792 3,325
Working Capital (226) (297) (601) 52
WC % of Sales 17% 15% 22% -2%
Capex (411) (407) (712) (782)
Capex % of Sales 31% 21% 25% 24%
Goodwill Amort. Schedule
(BRL mm)3Q12
2012 231.7
2013 926.8
2014 774.3
2015 747.2
2016 657.1
2017 607.5
2018+ 882.5
Total 4,827.1
aswath1
Highlight
aswath1
Highlight
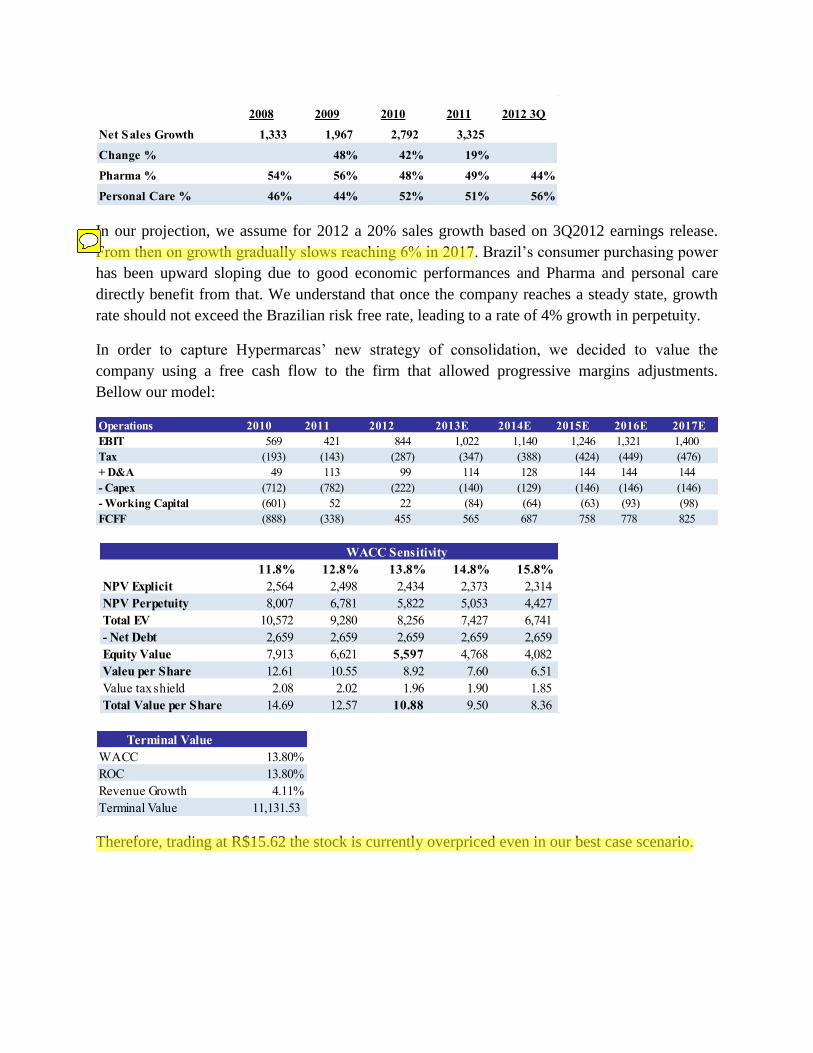
In our projection, we assume for 2012 a 20% sales growth based on 3Q2012 earnings release.
From then on growth gradually slows reaching 6% in 2017. Brazil’s consumer purchasing power
has been upward sloping due to good economic performances and Pharma and personal care
directly benefit from that. We understand that once the company reaches a steady state, growth
rate should not exceed the Brazilian risk free rate, leading to a rate of 4% growth in perpetuity.
In order to capture Hypermarcas’ new strategy of consolidation, we decided to value the
company using a free cash flow to the firm that allowed progressive margins adjustments.
Bellow our model:
Therefore, trading at R$15.62 the stock is currently overpriced even in our best case scenario.
2008 2009 2010 2011 2012 3Q
Net Sales Growth 1,333 1,967 2,792 3,325
Change % 48% 42% 19%
Pharma % 54% 56% 48% 49% 44%
Personal Care % 46% 44% 52% 51% 56%
Operations 2010 2011 2012 2013E 2014E 2015E 2016E 2017E
EBIT 569 421 844 1,022 1,140 1,246 1,321 1,400
Tax (193) (143) (287) (347) (388) (424) (449) (476)
+ D&A 49 113 99 114 128 144 144 144
- Capex (712) (782) (222) (140) (129) (146) (146) (146)
- Working Capital (601) 52 22 (84) (64) (63) (93) (98)
FCFF (888) (338) 455 565 687 758 778 825
11.8% 12.8% 13.8% 14.8% 15.8%
NPV Explicit 2,564 2,498 2,434 2,373 2,314
NPV Perpetuity 8,007 6,781 5,822 5,053 4,427
Total EV 10,572 9,280 8,256 7,427 6,741
- Net Debt 2,659 2,659 2,659 2,659 2,659
Equity Value 7,913 6,621 5,597 4,768 4,082
Valeu per Share 12.61 10.55 8.92 7.60 6.51
Value tax shield 2.08 2.02 1.96 1.90 1.85
Total Value per Share 14.69 12.57 10.88 9.50 8.36
WACC Sensitivity
Terminal Value
WACC 13.80%
ROC 13.80%
Revenue Growth 4.11%
Terminal Value 11,131.53
aswath1
Highlight
aswath1
Highlight
aswath1
Sticky Note
In $R, right?
2.3. Relative Valuation
2.3.1. Multiple
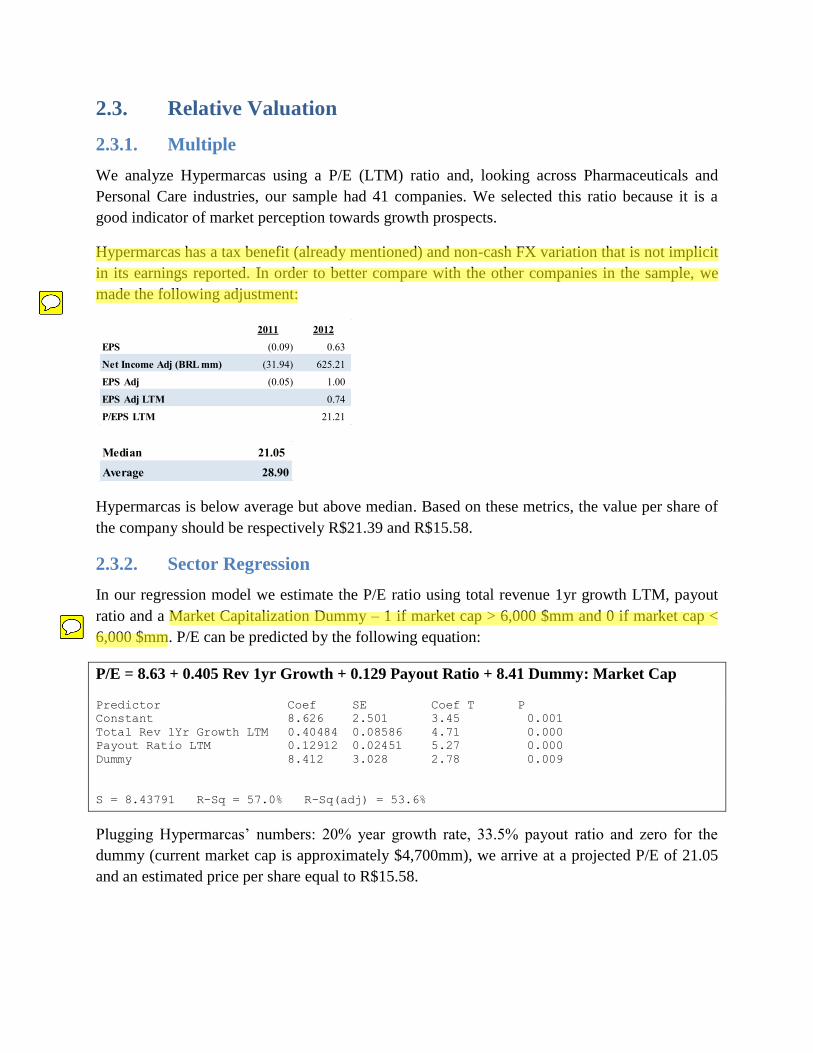
We analyze Hypermarcas using a P/E (LTM) ratio and, looking across Pharmaceuticals and
Personal Care industries, our sample had 41 companies. We selected this ratio because it is a
good indicator of market perception towards growth prospects.
Hypermarcas has a tax benefit (already mentioned) and non-cash FX variation that is not implicit
in its earnings reported. In order to better compare with the other companies in the sample, we
made the following adjustment:
Hypermarcas is below average but above median. Based on these metrics, the value per share of
the company should be respectively R$21.39 and R$15.58.
2.3.2. Sector Regression
In our regression model we estimate the P/E ratio using total revenue 1yr growth LTM, payout
ratio and a Market Capitalization Dummy – 1 if market cap > 6,000 $mm and 0 if market cap <
6,000 $mm. P/E can be predicted by the following equation:
P/E = 8.63 + 0.405 Rev 1yr Growth + 0.129 Payout Ratio + 8.41 Dummy: Market Cap
Plugging Hypermarcas’ numbers: 20% year growth rate, 33.5% payout ratio and zero for the
dummy (current market cap is approximately $4,700mm), we arrive at a projected P/E of 21.05
and an estimated price per share equal to R$15.58.
2011 2012
EPS (0.09) 0.63
Net Income Adj (BRL mm) (31.94) 625.21
EPS Adj (0.05) 1.00
EPS Adj LTM 0.74
P/EPS LTM 21.21
Median 21.05
Average 28.90
Predictor Coef SE Coef T P
Constant 8.626 2.501 3.45 0.001
Total Rev 1Yr Growth LTM 0.40484 0.08586 4.71 0.000
Payout Ratio LTM 0.12912 0.02451 5.27 0.000
Dummy 8.412 3.028 2.78 0.009
S = 8.43791 R-Sq = 57.0% R-Sq(adj) = 53.6%
aswath1
Highlight
aswath1
Sticky Note
I am impressed...
aswath1
Highlight
aswath1
Sticky Note
Why not leave market cap as a continuous variable?

2.3.3. Market-Wide Regression: Emerging Markets
Because we have analyzed PE ratio so far, we decided to continue our market wide comparison
with the same multiple.
P/E = 15.48 + 9.03 ROE - 2.77 Beta + 2.91 Payout
Plugging Hypermarcas’ numbers: ROE of 9%, Beta of 1.43 and Payout of 33.5%, we arrive at a
projected P/E of 13.31 and an estimated value per share of R$9.85, implying that the company is
overvalued.
2.4. Conclusion
Since its beginning Hypermarcas has led a positive growth trajectory; 2011 was exceptional bad
year for the company and made management rethink its growth strategy. According to our DCF
valuation the market already priced in too many positive expectations, implying it is overvalued.
Our relative valuation points to different directions, with a multiple below market average and
very close to the market median, while our regression estimates a value per share lower than the
one currently observed.
Overall we believe that the DCF valuation raises some important points: difficulties faced in
2011 are not long behind (company needs to demonstrate a strong organic growth rate with
control of working capital) and even with a positive margin scenario, there is not much equity
value. The multiples comparison shows that a lot of the normalization of results has been priced
by the market. The risk/reward does not look compelling: we recommend SELL Hypermarcas.
Methodology Fair Value per Share (R$)
DCF Valuation 10.88
Median P/E of the Sector 15.58
Average P/E of the Sector 21.39
Sector Regression 15.58
Market Regression 9.85
Current Value per Share (R$) 15.62
Recommendation Sell
3. Karsten
3.1. Company Overview
Karsten is a Brazilian manufacturing company with 130 years of history. It operates in the textile
industry selling bed and bath linens in both internal and external markets. The company, which
sells its products primarily to large retail chains, accommodates different budget levels by
offering different brands:
Recognized as the most innovative brand in Brazil, Karsten
represents the company’s most complete line of products, focused
on mid-income customers.
Casa In represents an excellent cost-benefit relation to low-
income customers, offering the company’s traditional quality
standards by more affordable prices.
Recognized as one of the most premium brands in the bed and
bath sector in Brazil, Trussardi offers high quality products to
high-income customers.
The company’s recent performance has been negatively impacted by two main events. The first
occurred in the second semester of 2008, when the firm posted more than R$ 50 million of
currency-derivatives losses as a result of speculative positions, which should had been used only
to hedge the company’s revenues from exports, betting on the appreciation of the Brazilian
currency against the dollar.
The second negative event happened in 2011, when Karsten decided to build a strategic
inventory of cotton after a sudden spike in the commodity price. The goal was to avoid a
shortage of the raw material if the prices continued to go up. However, the cotton prices quickly
declined after that, leaving the company with more inventory than necessary and resulting in
negative operating margins, since the firm could not pass on the price increase to retailers.
The consequences of these events are reflected in the valuation of the firm, whose capital
structure is currently highly leveraged and whose margins are still returning to normal levels. In
the following pages, based on all public information available about the company, the value of
its equity is calculated using different methodologies, such as discounted cash flow, relative
valuation, and option pricing. The most recent financial statements used in the analyses are from
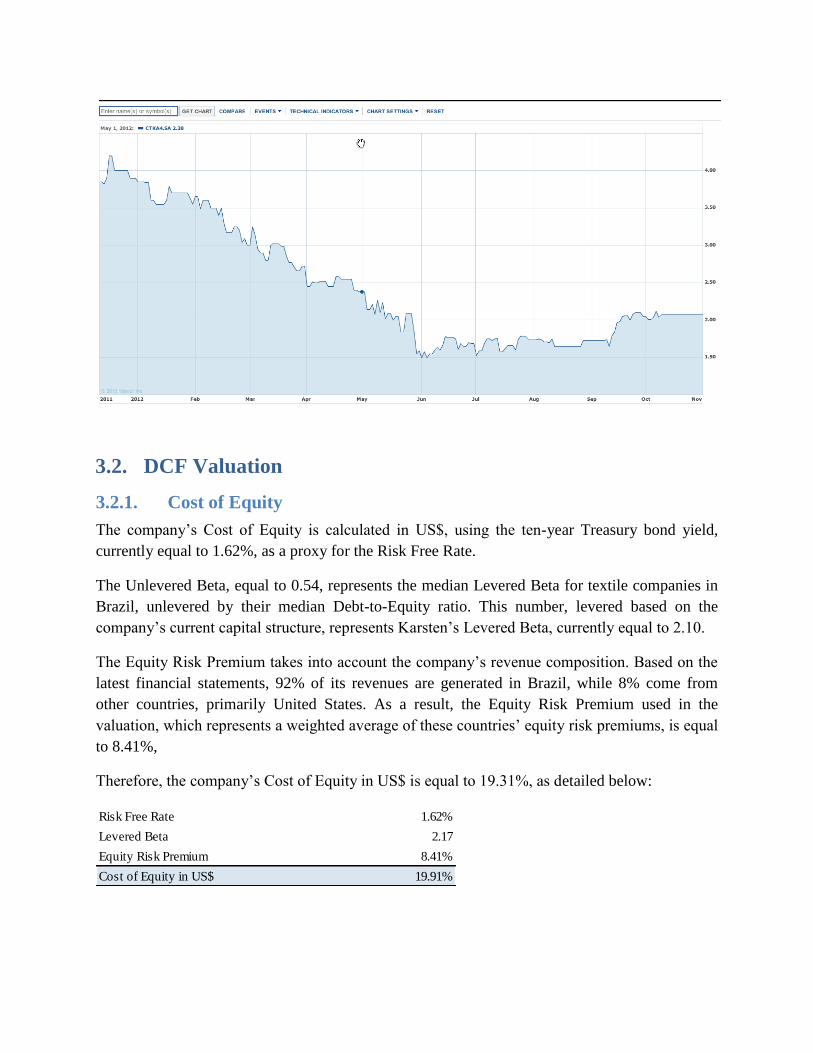
the third quarter of 2012. Below is the LTM performance of the stock:
3.2. DCF Valuation
3.2.1. Cost of Equity
The company’s Cost of Equity is calculated in US$, using the ten-year Treasury bond yield,
currently equal to 1.62%, as a proxy for the Risk Free Rate.
The Unlevered Beta, equal to 0.54, represents the median Levered Beta for textile companies in
Brazil, unlevered by their median Debt-to-Equity ratio. This number, levered based on the
company’s current capital structure, represents Karsten’s Levered Beta, currently equal to 2.10.
The Equity Risk Premium takes into account the company’s revenue composition. Based on the
latest financial statements, 92% of its revenues are generated in Brazil, while 8% come from
other countries, primarily United States. As a result, the Equity Risk Premium used in the
valuation, which represents a weighted average of these countries’ equity risk premiums, is equal
to 8.41%,
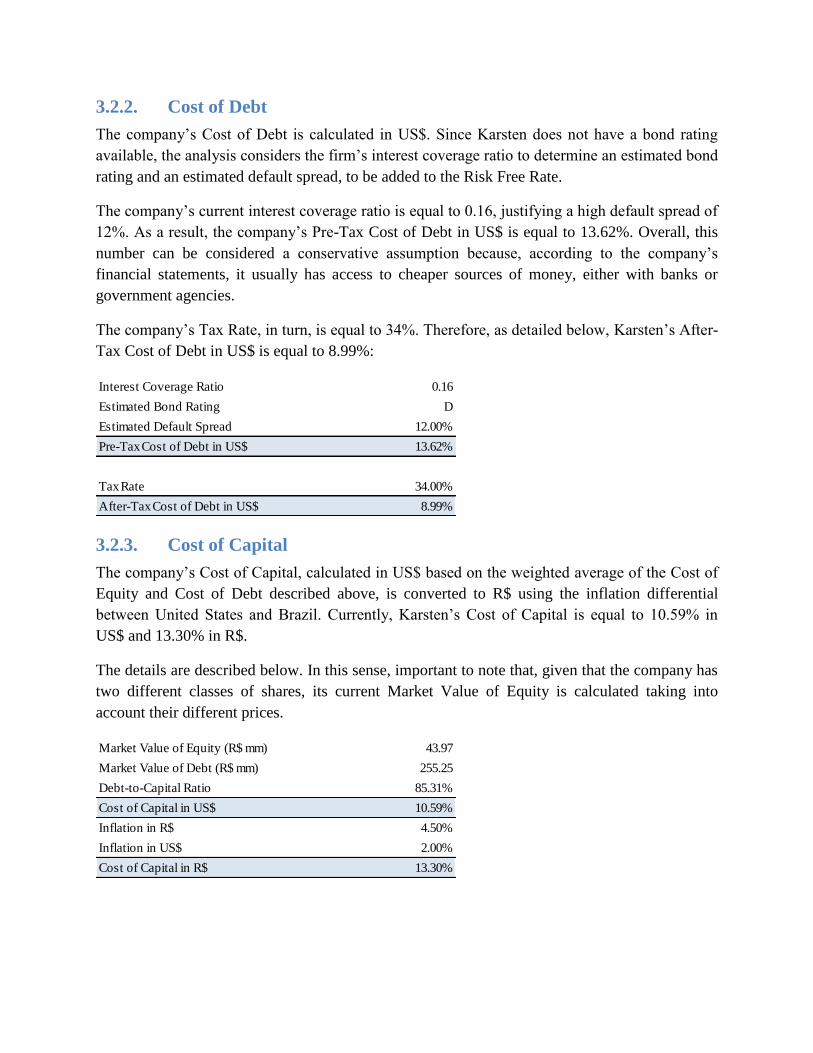
Therefore, the company’s Cost of Equity in US$ is equal to 19.31%, as detailed below:
Risk Free Rate 1.62%
Levered Beta 2.17
Equity Risk Premium 8.41%
Cost of Equity in US$ 19.91%
3.2.2. Cost of Debt
The company’s Cost of Debt is calculated in US$. Since Karsten does not have a bond rating
available, the analysis considers the firm’s interest coverage ratio to determine an estimated bond
rating and an estimated default spread, to be added to the Risk Free Rate.
The company’s current interest coverage ratio is equal to 0.16, justifying a high default spread of
12%. As a result, the company’s Pre-Tax Cost of Debt in US$ is equal to 13.62%. Overall, this
number can be considered a conservative assumption because, according to the company’s
financial statements, it usually has access to cheaper sources of money, either with banks or
government agencies.
The company’s Tax Rate, in turn, is equal to 34%. Therefore, as detailed below, Karsten’s After-
Tax Cost of Debt in US$ is equal to 8.99%:
3.2.3. Cost of Capital
The company’s Cost of Capital, calculated in US$ based on the weighted average of the Cost of
Equity and Cost of Debt described above, is converted to R$ using the inflation differential
between United States and Brazil. Currently, Karsten’s Cost of Capital is equal to 10.59% in
US$ and 13.30% in R$.
The details are described below. In this sense, important to note that, given that the company has
two different classes of shares, its current Market Value of Equity is calculated taking into
account their different prices.
Interest Coverage Ratio 0.16
Estimated Bond Rating D
Estimated Default Spread 12.00%
Pre-Tax Cost of Debt in US$ 13.62%
Tax Rate 34.00%
After-Tax Cost of Debt in US$ 8.99%
Market Value of Equity (R$ mm) 43.97
Market Value of Debt (R$ mm) 255.25
Debt-to-Capital Ratio 85.31%
Cost of Capital in US$ 10.59%
Inflation in R$ 4.50%
Inflation in US$ 2.00%
Cost of Capital in R$ 13.30%
3.2.4. Model
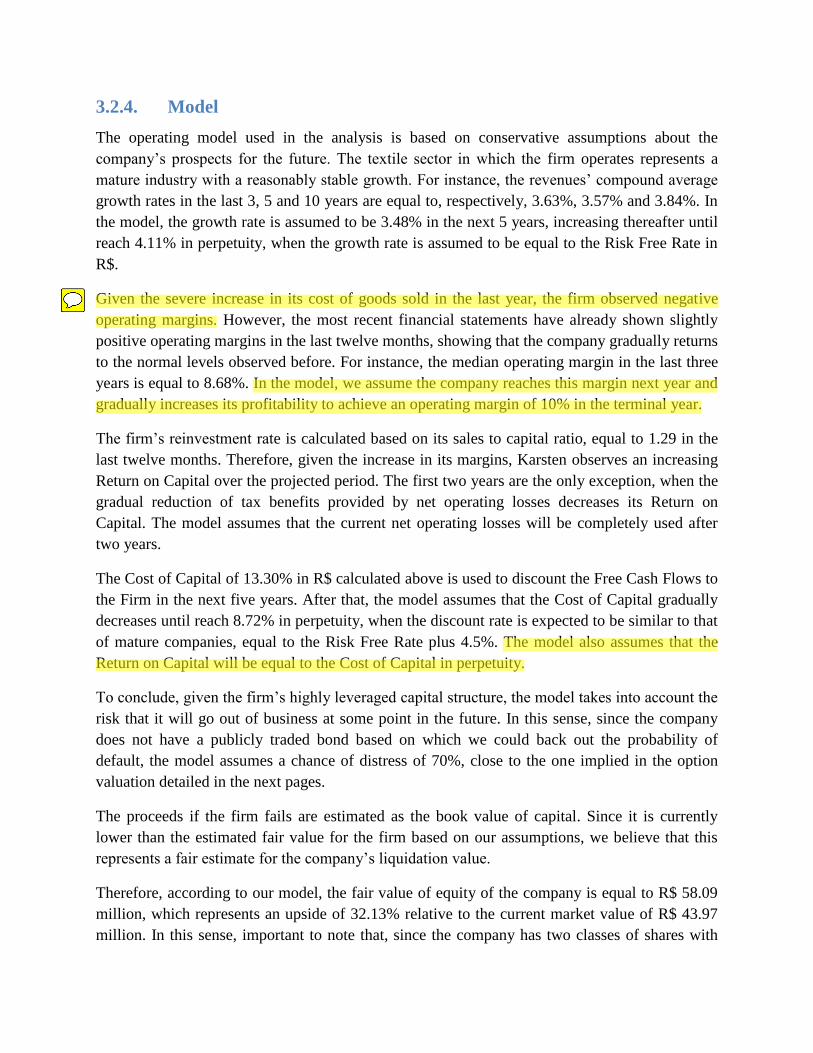
The operating model used in the analysis is based on conservative assumptions about the
company’s prospects for the future. The textile sector in which the firm operates represents a
mature industry with a reasonably stable growth. For instance, the revenues’ compound average
growth rates in the last 3, 5 and 10 years are equal to, respectively, 3.63%, 3.57% and 3.84%. In
the model, the growth rate is assumed to be 3.48% in the next 5 years, increasing thereafter until
reach 4.11% in perpetuity, when the growth rate is assumed to be equal to the Risk Free Rate in
R$.
Given the severe increase in its cost of goods sold in the last year, the firm observed negative
operating margins. However, the most recent financial statements have already shown slightly
positive operating margins in the last twelve months, showing that the company gradually returns
to the normal levels observed before. For instance, the median operating margin in the last three
years is equal to 8.68%. In the model, we assume the company reaches this margin next year and
gradually increases its profitability to achieve an operating margin of 10% in the terminal year.
The firm’s reinvestment rate is calculated based on its sales to capital ratio, equal to 1.29 in the
last twelve months. Therefore, given the increase in its margins, Karsten observes an increasing
Return on Capital over the projected period. The first two years are the only exception, when the
gradual reduction of tax benefits provided by net operating losses decreases its Return on
Capital. The model assumes that the current net operating losses will be completely used after
two years.
The Cost of Capital of 13.30% in R$ calculated above is used to discount the Free Cash Flows to
the Firm in the next five years. After that, the model assumes that the Cost of Capital gradually
decreases until reach 8.72% in perpetuity, when the discount rate is expected to be similar to that
of mature companies, equal to the Risk Free Rate plus 4.5%. The model also assumes that the
Return on Capital will be equal to the Cost of Capital in perpetuity.
To conclude, given the firm’s highly leveraged capital structure, the model takes into account the
risk that it will go out of business at some point in the future. In this sense, since the company
does not have a publicly traded bond based on which we could back out the probability of
default, the model assumes a chance of distress of 70%, close to the one implied in the option
valuation detailed in the next pages.
The proceeds if the firm fails are estimated as the book value of capital. Since it is currently
lower than the estimated fair value for the firm based on our assumptions, we believe that this
represents a fair estimate for the company’s liquidation value.
Therefore, according to our model, the fair value of equity of the company is equal to R$ 58.09
million, which represents an upside of 32.13% relative to the current market value of R$ 43.97
million. In this sense, important to note that, since the company has two classes of shares with
aswath1
Highlight
aswath1
Highlight
aswath1
Sticky Note
If it has strong brand name, why was it not able to push this through as price increases?
aswath1
Highlight
different liquidity and trading at different prices, this analysis will focus on the total market value
of equity rather than on an estimated value per share.
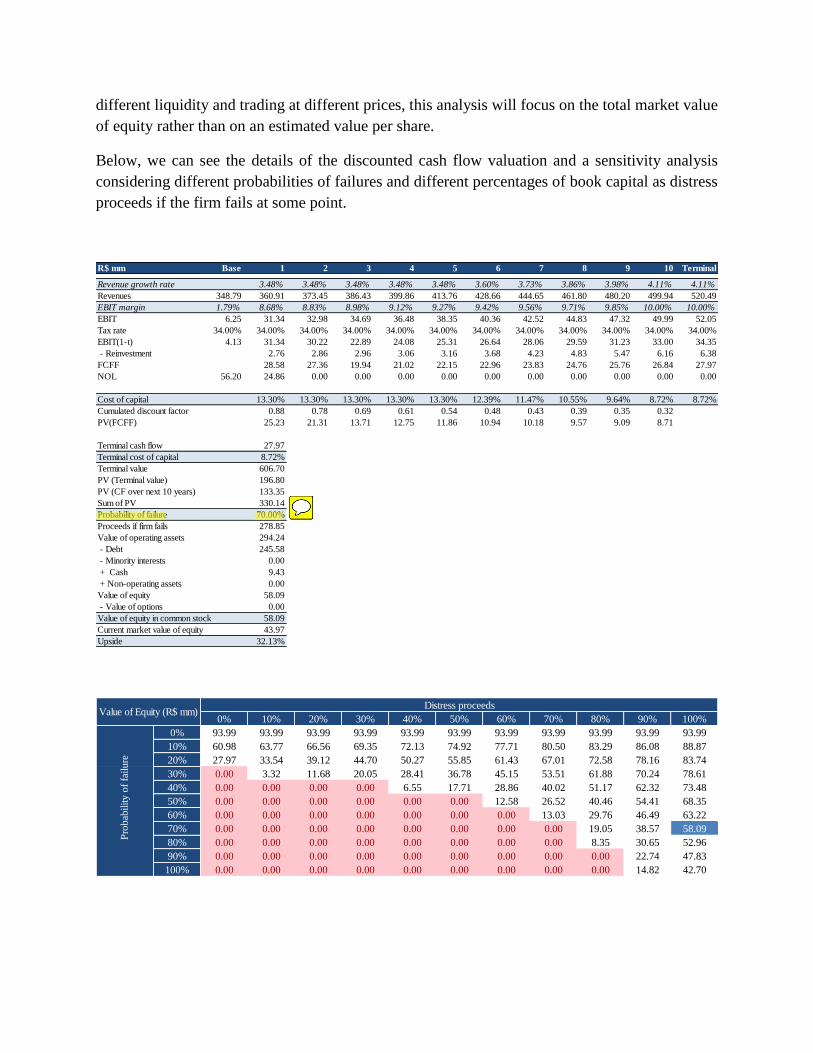
Below, we can see the details of the discounted cash flow valuation and a sensitivity analysis
considering different probabilities of failures and different percentages of book capital as distress
proceeds if the firm fails at some point.
R$ mm Base 1 2 3 4 5 6 7 8 9 10 Terminal
Revenue growth rate 3.48% 3.48% 3.48% 3.48% 3.48% 3.60% 3.73% 3.86% 3.98% 4.11% 4.11%
Revenues 348.79 360.91 373.45 386.43 399.86 413.76 428.66 444.65 461.80 480.20 499.94 520.49
EBIT margin 1.79% 8.68% 8.83% 8.98% 9.12% 9.27% 9.42% 9.56% 9.71% 9.85% 10.00% 10.00%
EBIT 6.25 31.34 32.98 34.69 36.48 38.35 40.36 42.52 44.83 47.32 49.99 52.05
Tax rate 34.00% 34.00% 34.00% 34.00% 34.00% 34.00% 34.00% 34.00% 34.00% 34.00% 34.00% 34.00%
EBIT(1-t) 4.13 31.34 30.22 22.89 24.08 25.31 26.64 28.06 29.59 31.23 33.00 34.35
- Reinvestment 2.76 2.86 2.96 3.06 3.16 3.68 4.23 4.83 5.47 6.16 6.38
FCFF 28.58 27.36 19.94 21.02 22.15 22.96 23.83 24.76 25.76 26.84 27.97
NOL 56.20 24.86 0.00 0.00 0.00 0.00 0.00 0.00 0.00 0.00 0.00 0.00
Cost of capital 13.30% 13.30% 13.30% 13.30% 13.30% 12.39% 11.47% 10.55% 9.64% 8.72% 8.72%
Cumulated discount factor 0.88 0.78 0.69 0.61 0.54 0.48 0.43 0.39 0.35 0.32
PV(FCFF) 25.23 21.31 13.71 12.75 11.86 10.94 10.18 9.57 9.09 8.71
Terminal cash flow 27.97
Terminal cost of capital 8.72%
Terminal value 606.70
PV (Terminal value) 196.80
PV (CF over next 10 years) 133.35
Sum of PV 330.14
Probability of failure 70.00%
Proceeds if firm fails 278.85
Value of operating assets 294.24
- Debt 245.58
- Minority interests 0.00
+ Cash 9.43
+ Non-operating assets 0.00
Value of equity 58.09
- Value of options 0.00
Value of equity in common stock 58.09
Current market value of equity 43.97
Upside 32.13%
0% 10% 20% 30% 40% 50% 60% 70% 80% 90% 100%
0% 93.99 93.99 93.99 93.99 93.99 93.99 93.99 93.99 93.99 93.99 93.99
10% 60.98 63.77 66.56 69.35 72.13 74.92 77.71 80.50 83.29 86.08 88.87
20% 27.97 33.54 39.12 44.70 50.27 55.85 61.43 67.01 72.58 78.16 83.74
30% 0.00 3.32 11.68 20.05 28.41 36.78 45.15 53.51 61.88 70.24 78.61
40% 0.00 0.00 0.00 0.00 6.55 17.71 28.86 40.02 51.17 62.32 73.48
50% 0.00 0.00 0.00 0.00 0.00 0.00 12.58 26.52 40.46 54.41 68.35
60% 0.00 0.00 0.00 0.00 0.00 0.00 0.00 13.03 29.76 46.49 63.22
70% 0.00 0.00 0.00 0.00 0.00 0.00 0.00 0.00 19.05 38.57 58.09
80% 0.00 0.00 0.00 0.00 0.00 0.00 0.00 0.00 8.35 30.65 52.96
90% 0.00 0.00 0.00 0.00 0.00 0.00 0.00 0.00 0.00 22.74 47.83
100% 0.00 0.00 0.00 0.00 0.00 0.00 0.00 0.00 0.00 14.82 42.70
Distress proceeds
Pro
bab
ility o
f fa
ilure
Value of Equity (R$ mm)
aswath1
Highlight
aswath1
Sticky Note
Pretty high probability of failure but you don't see to bear much of a cost if you fail (the failure proceeds are only 20% lower than your going concern PV)
3.3. Relative Valuation
3.3.1. Multiple
We opted to analyze Karsten based on a PBV ratio. We believe that it is the most appropriate
multiple for the company because Karsten is operating in an industry with a reasonably stable
growth. Also, since the firm currently presents a capital structure with 85% of debt, multiples
based on enterprise value are less effective to reflect the value of the equity in the company.
Nowadays, there are only a few public companies in Brazil operating in the textile sector. As a
result, given the current dynamics of this industry, with significant competition among
companies from different countries, we created a sample with textile companies from emerging
markets, focusing specifically on those operating in the bed and bath segment.
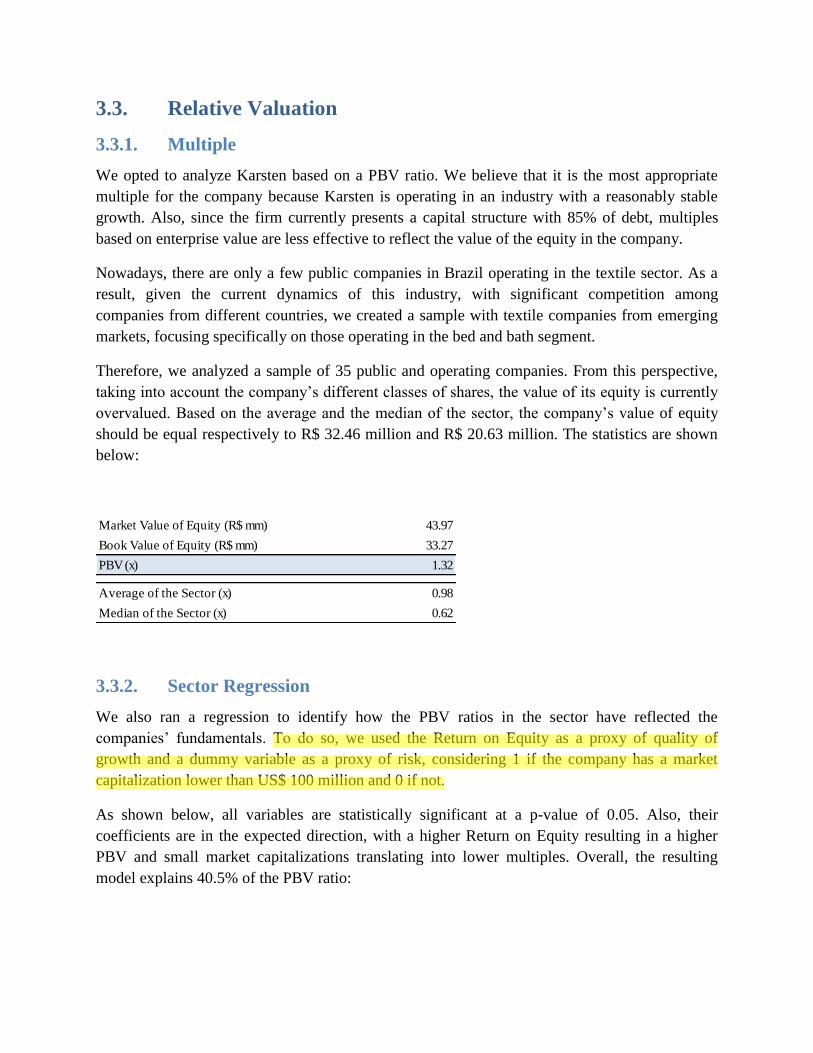
Therefore, we analyzed a sample of 35 public and operating companies. From this perspective,
taking into account the company’s different classes of shares, the value of its equity is currently
overvalued. Based on the average and the median of the sector, the company’s value of equity
should be equal respectively to R$ 32.46 million and R$ 20.63 million. The statistics are shown
below:
3.3.2. Sector Regression
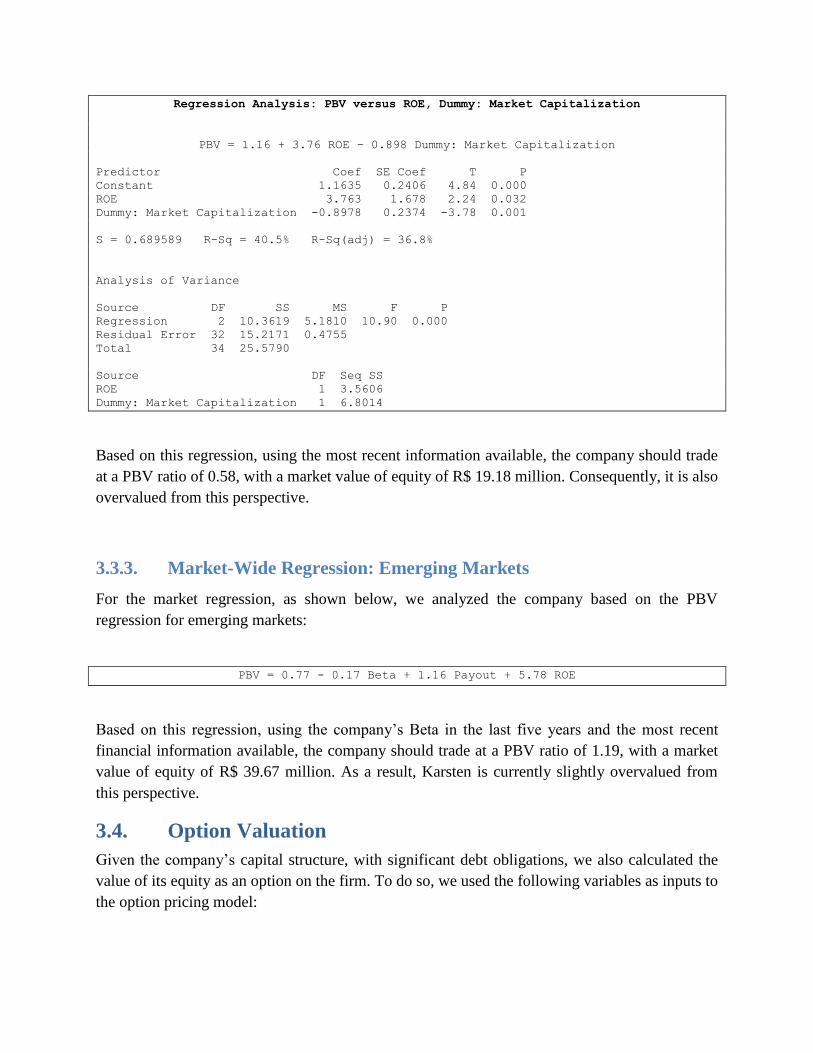
We also ran a regression to identify how the PBV ratios in the sector have reflected the
companies’ fundamentals. To do so, we used the Return on Equity as a proxy of quality of
growth and a dummy variable as a proxy of risk, considering 1 if the company has a market
capitalization lower than US$ 100 million and 0 if not.
As shown below, all variables are statistically significant at a p-value of 0.05. Also, their
coefficients are in the expected direction, with a higher Return on Equity resulting in a higher
PBV and small market capitalizations translating into lower multiples. Overall, the resulting
model explains 40.5% of the PBV ratio:
Market Value of Equity (R$ mm) 43.97
Book Value of Equity (R$ mm) 33.27
PBV (x) 1.32
Average of the Sector (x) 0.98
Median of the Sector (x) 0.62
aswath1
Highlight
Regression Analysis: PBV versus ROE, Dummy: Market Capitalization
PBV = 1.16 + 3.76 ROE - 0.898 Dummy: Market Capitalization
Predictor Coef SE Coef T P
Constant 1.1635 0.2406 4.84 0.000
ROE 3.763 1.678 2.24 0.032
Dummy: Market Capitalization -0.8978 0.2374 -3.78 0.001
S = 0.689589 R-Sq = 40.5% R-Sq(adj) = 36.8%
Analysis of Variance
Source DF SS MS F P
Regression 2 10.3619 5.1810 10.90 0.000
Residual Error 32 15.2171 0.4755
Total 34 25.5790
Source DF Seq SS
ROE 1 3.5606
Dummy: Market Capitalization 1 6.8014
Based on this regression, using the most recent information available, the company should trade
at a PBV ratio of 0.58, with a market value of equity of R$ 19.18 million. Consequently, it is also
overvalued from this perspective.
3.3.3. Market-Wide Regression: Emerging Markets
For the market regression, as shown below, we analyzed the company based on the PBV
regression for emerging markets:
PBV = 0.77 - 0.17 Beta + 1.16 Payout + 5.78 ROE
Based on this regression, using the company’s Beta in the last five years and the most recent
financial information available, the company should trade at a PBV ratio of 1.19, with a market
value of equity of R$ 39.67 million. As a result, Karsten is currently slightly overvalued from
this perspective.
3.4. Option Valuation
Given the company’s capital structure, with significant debt obligations, we also calculated the
value of its equity as an option on the firm. To do so, we used the following variables as inputs to
the option pricing model:
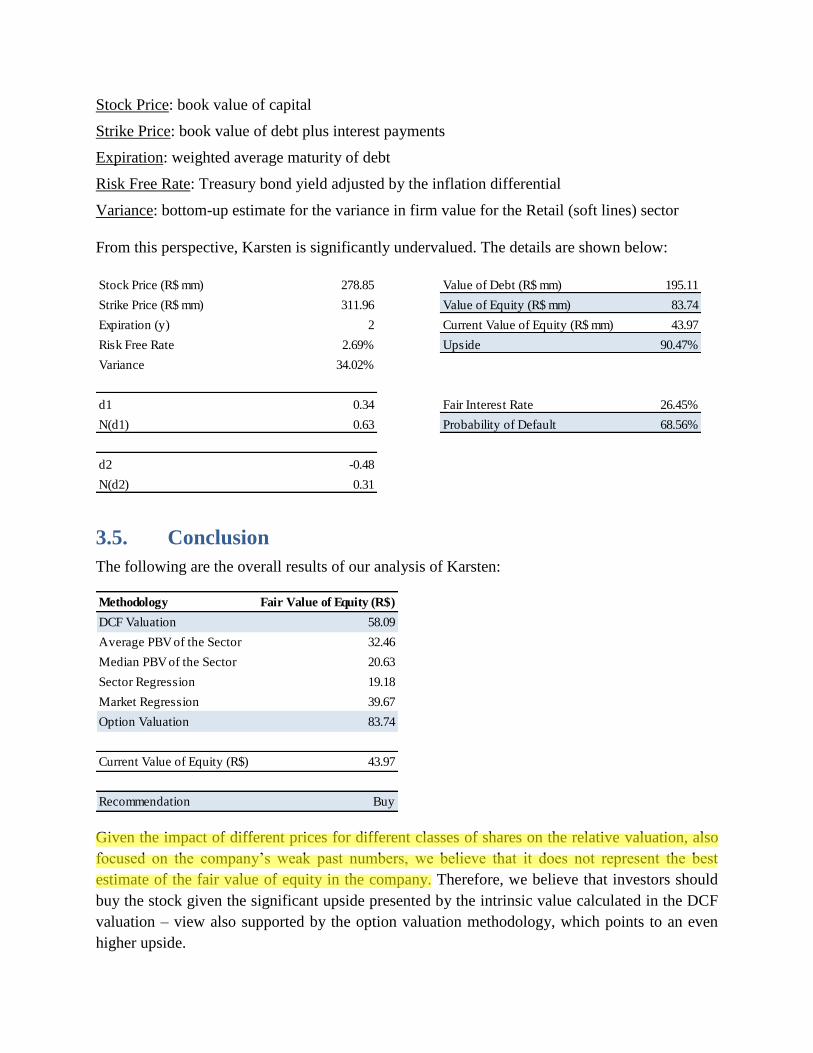
Stock Price: book value of capital
Strike Price: book value of debt plus interest payments
Expiration: weighted average maturity of debt
Risk Free Rate: Treasury bond yield adjusted by the inflation differential
Variance: bottom-up estimate for the variance in firm value for the Retail (soft lines) sector
From this perspective, Karsten is significantly undervalued. The details are shown below:
3.5. Conclusion
The following are the overall results of our analysis of Karsten:
Given the impact of different prices for different classes of shares on the relative valuation, also
focused on the company’s weak past numbers, we believe that it does not represent the best
estimate of the fair value of equity in the company. Therefore, we believe that investors should
buy the stock given the significant upside presented by the intrinsic value calculated in the DCF
valuation – view also supported by the option valuation methodology, which points to an even
higher upside.
Stock Price (R$ mm) 278.85 Value of Debt (R$ mm) 195.11
Strike Price (R$ mm) 311.96 Value of Equity (R$ mm) 83.74
Expiration (y) 2 Current Value of Equity (R$ mm) 43.97
Risk Free Rate 2.69% Upside 90.47%
Variance 34.02%
d1 0.34 Fair Interest Rate 26.45%
N(d1) 0.63 Probability of Default 68.56%
d2 -0.48
N(d2) 0.31
Methodology Fair Value of Equity (R$)
DCF Valuation 58.09
Average PBV of the Sector 32.46
Median PBV of the Sector 20.63
Sector Regression 19.18
Market Regression 39.67
Option Valuation 83.74
Current Value of Equity (R$) 43.97
Recommendation Buy
aswath1
Highlight
4. LinkedIn
4.1. Company Overview
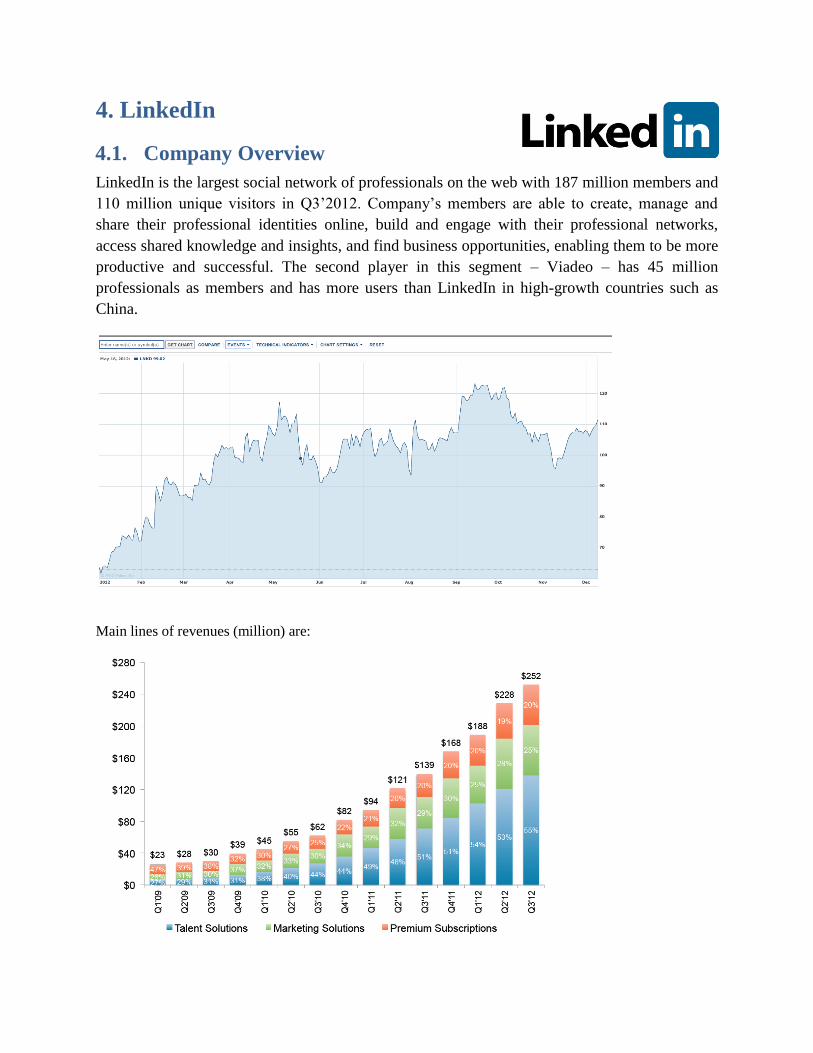
LinkedIn is the largest social network of professionals on the web with 187 million members and
110 million unique visitors in Q3’2012. Company’s members are able to create, manage and
share their professional identities online, build and engage with their professional networks,
access shared knowledge and insights, and find business opportunities, enabling them to be more
productive and successful. The second player in this segment – Viadeo – has 45 million
professionals as members and has more users than LinkedIn in high-growth countries such as
China.
Main lines of revenues (million) are:
Talent Solutions – Revenue is derived primarily from the sale of LinkedIn Corporate Solutions
and LinkedIn Jobs products. In this segment it competes with established online recruiting
companies, such as Monster, CareerBuilder, and Indeed.com, talent management companies and
larger companies that are focusing on talent management and human resources services, such as
Oracle (through its acquisition of Taleo), SAP (through its acquisition of SuccessFactors) and
IBM (through its acquisition of Kenexa), and traditional recruiting firms. Additionally, other
companies, including newcomers to the recruiting industry, may partner with Internet companies,
including social networking companies, to provide services that compete with LinkedIn’s
solutions, either on their own or as third party applications, such as BranchOut that partnered
with FaceBook.
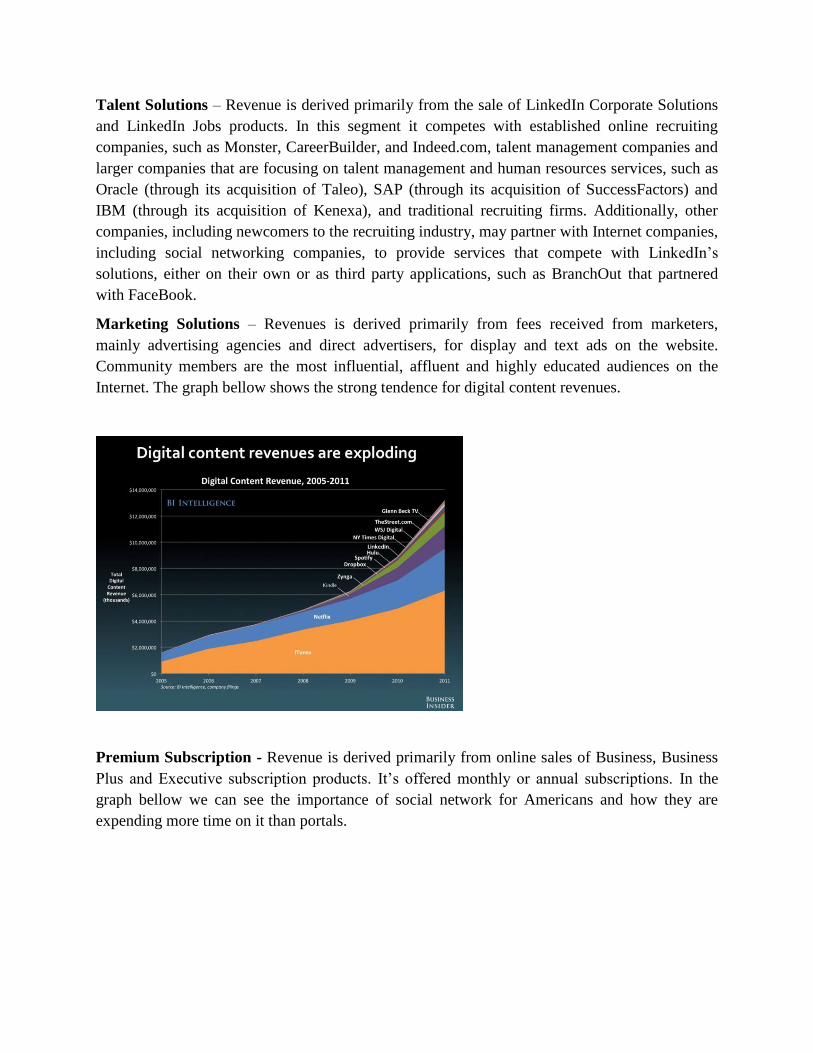
Marketing Solutions – Revenues is derived primarily from fees received from marketers,
mainly advertising agencies and direct advertisers, for display and text ads on the website.
Community members are the most influential, affluent and highly educated audiences on the
Internet. The graph bellow shows the strong tendence for digital content revenues.
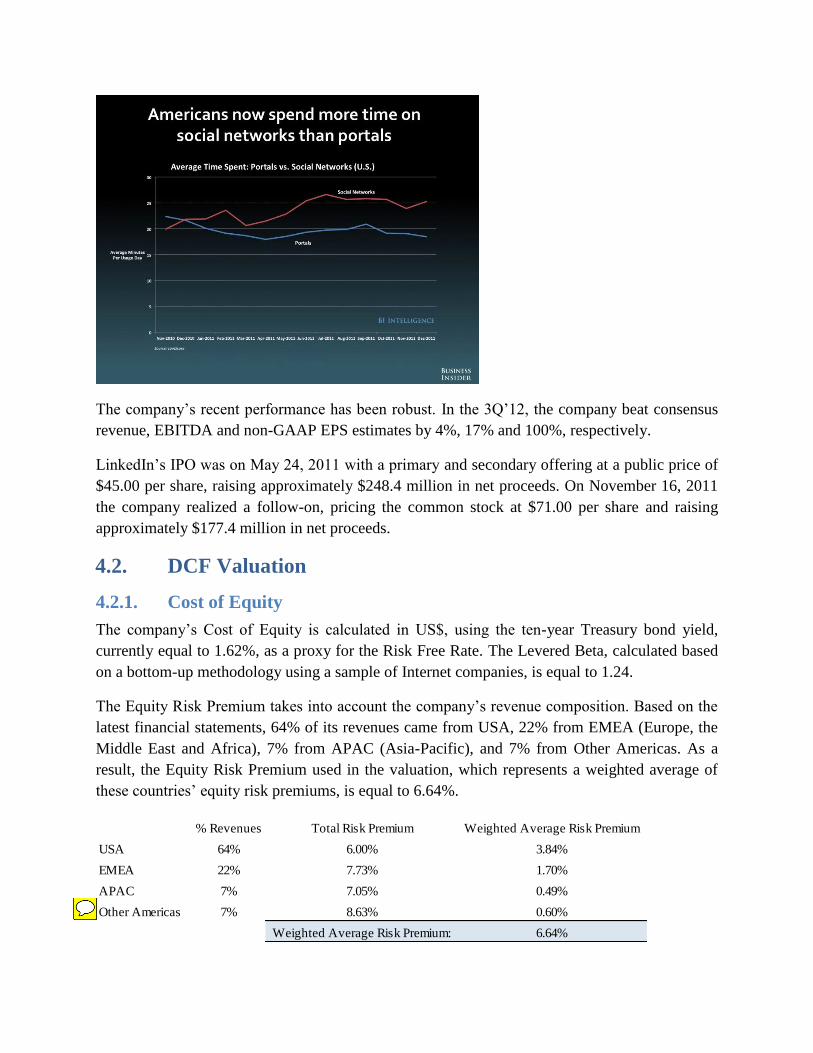
Premium Subscription - Revenue is derived primarily from online sales of Business, Business
Plus and Executive subscription products. It’s offered monthly or annual subscriptions. In the
graph bellow we can see the importance of social network for Americans and how they are
expending more time on it than portals.
The company’s recent performance has been robust. In the 3Q’12, the company beat consensus
revenue, EBITDA and non-GAAP EPS estimates by 4%, 17% and 100%, respectively.
LinkedIn’s IPO was on May 24, 2011 with a primary and secondary offering at a public price of
$45.00 per share, raising approximately $248.4 million in net proceeds. On November 16, 2011
the company realized a follow-on, pricing the common stock at $71.00 per share and raising
approximately $177.4 million in net proceeds.
4.2. DCF Valuation
4.2.1. Cost of Equity
The company’s Cost of Equity is calculated in US$, using the ten-year Treasury bond yield,
currently equal to 1.62%, as a proxy for the Risk Free Rate. The Levered Beta, calculated based
on a bottom-up methodology using a sample of Internet companies, is equal to 1.24.
The Equity Risk Premium takes into account the company’s revenue composition. Based on the
latest financial statements, 64% of its revenues came from USA, 22% from EMEA (Europe, the
Middle East and Africa), 7% from APAC (Asia-Pacific), and 7% from Other Americas. As a
result, the Equity Risk Premium used in the valuation, which represents a weighted average of
these countries’ equity risk premiums, is equal to 6.64%.
% Revenues Total Risk Premium Weighted Average Risk Premium
USA 64% 6.00% 3.84%
EMEA 22% 7.73% 1.70%
APAC 7% 7.05% 0.49%
Other Americas 7% 8.63% 0.60%
Weighted Average Risk Premium: 6.64%
aswath1
Sticky Note
Well done!

Therefore, the company’s Cost of Equity in US$ is equal to 9.85%, as detailed below:
4.2.2. Cost of Debt
Although currently the company has no debt, the average Market D/E for the Internet segment is
2.71% and for Human Resources segment is 10.31%. Considering that 55% of LinkedIn revenue
comes from Talent Solutions and that 50% of that revenue is achieved using methods similar to
the ones from the Human Resources segment, we will apply the following Weighted Average to
estimate future D/E:
(1) 55%*50%=28%
Cost of Debt is estimated to be 7.12% considering that the company would have a Bond Rating
B+. The company’s Tax Rate is equal to 37.5%.
4.2.3. Cost of Capital
The company’s Cost of Capital will consider operating leases as debt. Therefore, the initial Debt
Ratio is 2.88%. We will consider that in 10 years it will increase to 4.80%, as detailed above.
Risk Free Rate 1.62%
Levered Beta 1.24
Equity Risk Premium 6.64%
Cost of Equity in US$ 9.85%
Market D/E % Weighted Average D/E
Internet 2.71% 73% 1.96%
Human Resources 10.31% 28% (1) 2.84%
4.80%
Interest Coverage Ratio 2.6
Estimated Bond Rating B+
Estimated Default Spread 5.50%
Pre-Tax Cost of Debt in US$ 7.12%
Tax Rate 37.50%
After-Tax Cost of Debt in US$ 4.5%
Market Value of Equity (US$ B) 11.41
Market Value of Debt (US$ B) 0.34
Debt-to-Capital Ratio 2.88%
Cost of Capital in US$ 9.69%
4.2.4. Model
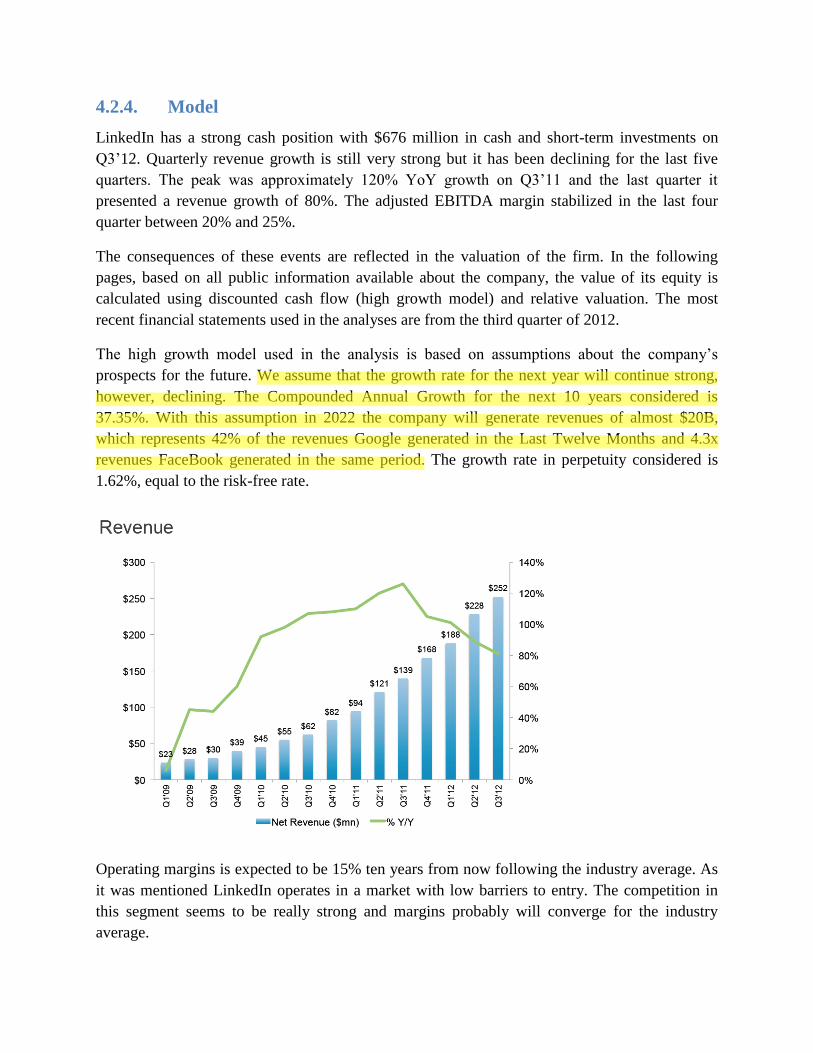
LinkedIn has a strong cash position with $676 million in cash and short-term investments on
Q3’12. Quarterly revenue growth is still very strong but it has been declining for the last five
quarters. The peak was approximately 120% YoY growth on Q3’11 and the last quarter it
presented a revenue growth of 80%. The adjusted EBITDA margin stabilized in the last four
quarter between 20% and 25%.
The consequences of these events are reflected in the valuation of the firm. In the following
pages, based on all public information available about the company, the value of its equity is
calculated using discounted cash flow (high growth model) and relative valuation. The most
recent financial statements used in the analyses are from the third quarter of 2012.
The high growth model used in the analysis is based on assumptions about the company’s
prospects for the future. We assume that the growth rate for the next year will continue strong,
however, declining. The Compounded Annual Growth for the next 10 years considered is
37.35%. With this assumption in 2022 the company will generate revenues of almost $20B,
which represents 42% of the revenues Google generated in the Last Twelve Months and 4.3x
revenues FaceBook generated in the same period. The growth rate in perpetuity considered is
1.62%, equal to the risk-free rate.
Operating margins is expected to be 15% ten years from now following the industry average. As
it was mentioned LinkedIn operates in a market with low barriers to entry. The competition in
this segment seems to be really strong and margins probably will converge for the industry
average.
aswath1
Highlight
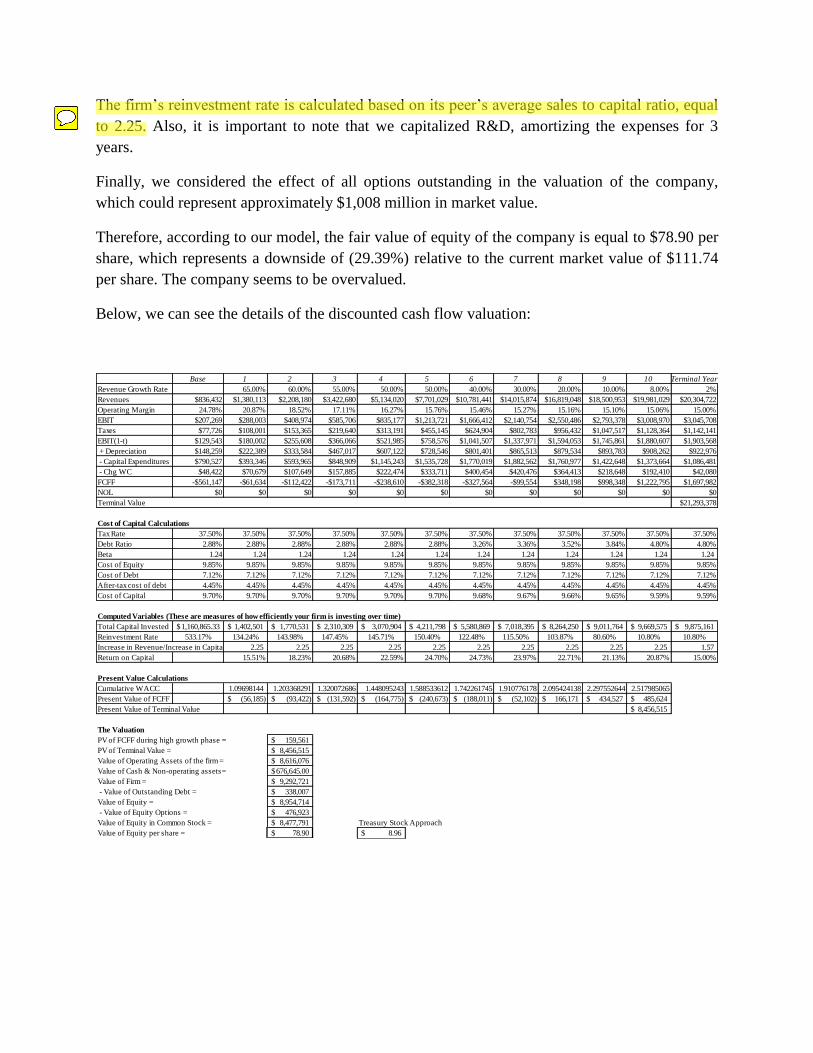
The firm’s reinvestment rate is calculated based on its peer’s average sales to capital ratio, equal
to 2.25. Also, it is important to note that we capitalized R&D, amortizing the expenses for 3
years.
Finally, we considered the effect of all options outstanding in the valuation of the company,
which could represent approximately $1,008 million in market value.
Therefore, according to our model, the fair value of equity of the company is equal to $78.90 per
share, which represents a downside of (29.39%) relative to the current market value of $111.74
per share. The company seems to be overvalued.
Below, we can see the details of the discounted cash flow valuation:
Base 1 2 3 4 5 6 7 8 9 10 Terminal Year
Revenue Growth Rate 65.00% 60.00% 55.00% 50.00% 50.00% 40.00% 30.00% 20.00% 10.00% 8.00% 2%
Revenues $836,432 $1,380,113 $2,208,180 $3,422,680 $5,134,020 $7,701,029 $10,781,441 $14,015,874 $16,819,048 $18,500,953 $19,981,029 $20,304,722
Operating Margin 24.78% 20.87% 18.52% 17.11% 16.27% 15.76% 15.46% 15.27% 15.16% 15.10% 15.06% 15.00%
EBIT $207,269 $288,003 $408,974 $585,706 $835,177 $1,213,721 $1,666,412 $2,140,754 $2,550,486 $2,793,378 $3,008,970 $3,045,708
Taxes $77,726 $108,001 $153,365 $219,640 $313,191 $455,145 $624,904 $802,783 $956,432 $1,047,517 $1,128,364 $1,142,141
EBIT(1-t) $129,543 $180,002 $255,608 $366,066 $521,985 $758,576 $1,041,507 $1,337,971 $1,594,053 $1,745,861 $1,880,607 $1,903,568
+ Depreciation $148,259 $222,389 $333,584 $467,017 $607,122 $728,546 $801,401 $865,513 $879,534 $893,783 $908,262 $922,976
- Capital Expenditures $790,527 $393,346 $593,965 $848,909 $1,145,243 $1,535,728 $1,770,019 $1,882,562 $1,760,977 $1,422,648 $1,373,664 $1,086,481
- Chg WC $48,422 $70,679 $107,649 $157,885 $222,474 $333,711 $400,454 $420,476 $364,413 $218,648 $192,410 $42,080
FCFF -$561,147 -$61,634 -$112,422 -$173,711 -$238,610 -$382,318 -$327,564 -$99,554 $348,198 $998,348 $1,222,795 $1,697,982
NOL $0 $0 $0 $0 $0 $0 $0 $0 $0 $0 $0 $0
Terminal Value $21,293,378
Cost of Capital Calculations
Tax Rate 37.50% 37.50% 37.50% 37.50% 37.50% 37.50% 37.50% 37.50% 37.50% 37.50% 37.50% 37.50%
Debt Ratio 2.88% 2.88% 2.88% 2.88% 2.88% 2.88% 3.26% 3.36% 3.52% 3.84% 4.80% 4.80%
Beta 1.24 1.24 1.24 1.24 1.24 1.24 1.24 1.24 1.24 1.24 1.24 1.24
Cost of Equity 9.85% 9.85% 9.85% 9.85% 9.85% 9.85% 9.85% 9.85% 9.85% 9.85% 9.85% 9.85%
Cost of Debt 7.12% 7.12% 7.12% 7.12% 7.12% 7.12% 7.12% 7.12% 7.12% 7.12% 7.12% 7.12%
After-tax cost of debt 4.45% 4.45% 4.45% 4.45% 4.45% 4.45% 4.45% 4.45% 4.45% 4.45% 4.45% 4.45%
Cost of Capital 9.70% 9.70% 9.70% 9.70% 9.70% 9.70% 9.68% 9.67% 9.66% 9.65% 9.59% 9.59%
Computed Variables (These are measures of how efficiently your firm is investing over time)
Total Capital Invested 1,160,865.33$ 1,402,501$ 1,770,531$ 2,310,309$ 3,070,904$ 4,211,798$ 5,580,869$ 7,018,395$ 8,264,250$ 9,011,764$ 9,669,575$ 9,875,161$
Reinvestment Rate 533.17% 134.24% 143.98% 147.45% 145.71% 150.40% 122.48% 115.50% 103.87% 80.60% 10.80% 10.80%
Increase in Revenue/Increase in Capital 2.25 2.25 2.25 2.25 2.25 2.25 2.25 2.25 2.25 2.25 1.57
Return on Capital 15.51% 18.23% 20.68% 22.59% 24.70% 24.73% 23.97% 22.71% 21.13% 20.87% 15.00%
Present Value Calculations
Cumulative WACC 1.09698144 1.203368291 1.320072686 1.448095243 1.588533612 1.742261745 1.910776178 2.095424138 2.297552644 2.517985065
Present Value of FCFF (56,185)$ (93,422)$ (131,592)$ (164,775)$ (240,673)$ (188,011)$ (52,102)$ 166,171$ 434,527$ 485,624$
Present Value of Terminal Value 8,456,515$
The Valuation
PV of FCFF during high growth phase = 159,561$
PV of Terminal Value = 8,456,515$
Value of Operating Assets of the firm = 8,616,076$
Value of Cash & Non-operating assets= 676,645.00$
Value of Firm = 9,292,721$
- Value of Outstanding Debt = 338,007$
Value of Equity = 8,954,714$
- Value of Equity Options = 476,923$
Value of Equity in Common Stock = 8,477,791$ Treasury Stock Approach
Value of Equity per share = 78.90$ 8.96$
aswath1
Highlight
aswath1
Sticky Note
You may want to add that this leads to a ROC of 20.87% in year 10, which is a defensible number
4.3. Relative Valuation
4.3.1. Multiple
We opted to analyze LinkedIn based on an Enterprise Value / Revenue ratio. We believe that it is
the most appropriate multiple for the company because many companies in the Internet segments
sometimes still have negative margins in order to achieve higher growth. Also, revenues are
always available for every company. To do so, we considered 73 Internet public companies as
comparable firms for LinkedIn.
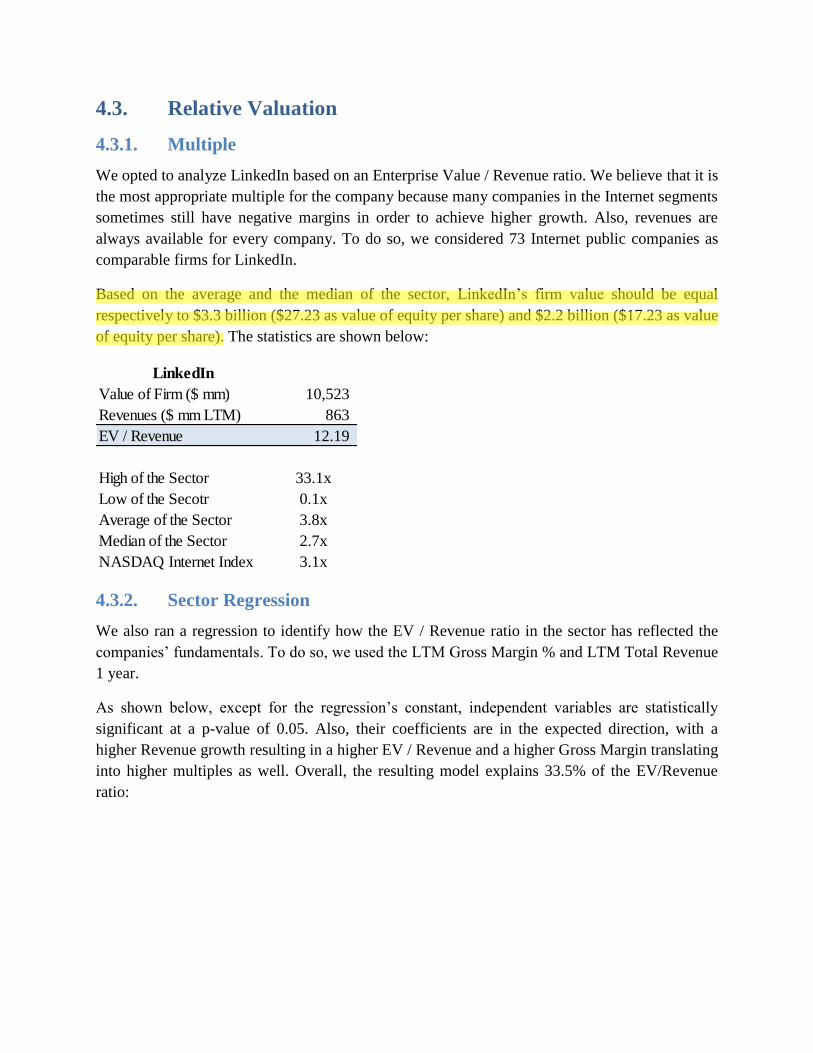
Based on the average and the median of the sector, LinkedIn’s firm value should be equal
respectively to $3.3 billion ($27.23 as value of equity per share) and $2.2 billion ($17.23 as value
of equity per share). The statistics are shown below:
4.3.2. Sector Regression
We also ran a regression to identify how the EV / Revenue ratio in the sector has reflected the
companies’ fundamentals. To do so, we used the LTM Gross Margin % and LTM Total Revenue
1 year.
As shown below, except for the regression’s constant, independent variables are statistically
significant at a p-value of 0.05. Also, their coefficients are in the expected direction, with a
higher Revenue growth resulting in a higher EV / Revenue and a higher Gross Margin translating
into higher multiples as well. Overall, the resulting model explains 33.5% of the EV/Revenue
ratio:
Value of Firm ($ mm) 10,523
Revenues ($ mm LTM) 863
EV / Revenue 12.19
High of the Sector 33.1x
Low of the Secotr 0.1x
Average of the Sector 3.8x
Median of the Sector 2.7x
NASDAQ Internet Index 3.1x
aswath1
Highlight

Based on this regression, using the most recent information available, the company should trade
at an EV / Revenue of 7.39, with a firm value of $6.38 billion and a value of equity per share
considering the outstanding options of $54.40. Consequently, it is also undervalued from this
perspective.
4.3.3. Market-Wide Regression: United States
For the market regression, as shown below, we analyzed the company based on the EV / Sales
regression for USA:
EV / Sales = 0.43 + 7.12 g + 7.69 Operating Margin – 0.4 DC – 1.87 Tax Rate
Based on this regression the company should trade at an EV / Sales ratio of 7.88, with a firm
value of $6.8 billion and a value of equity per share of $58.03. As a result, LinkedIn is currently
overvalued from this perspective as well.
4.4. Conclusion
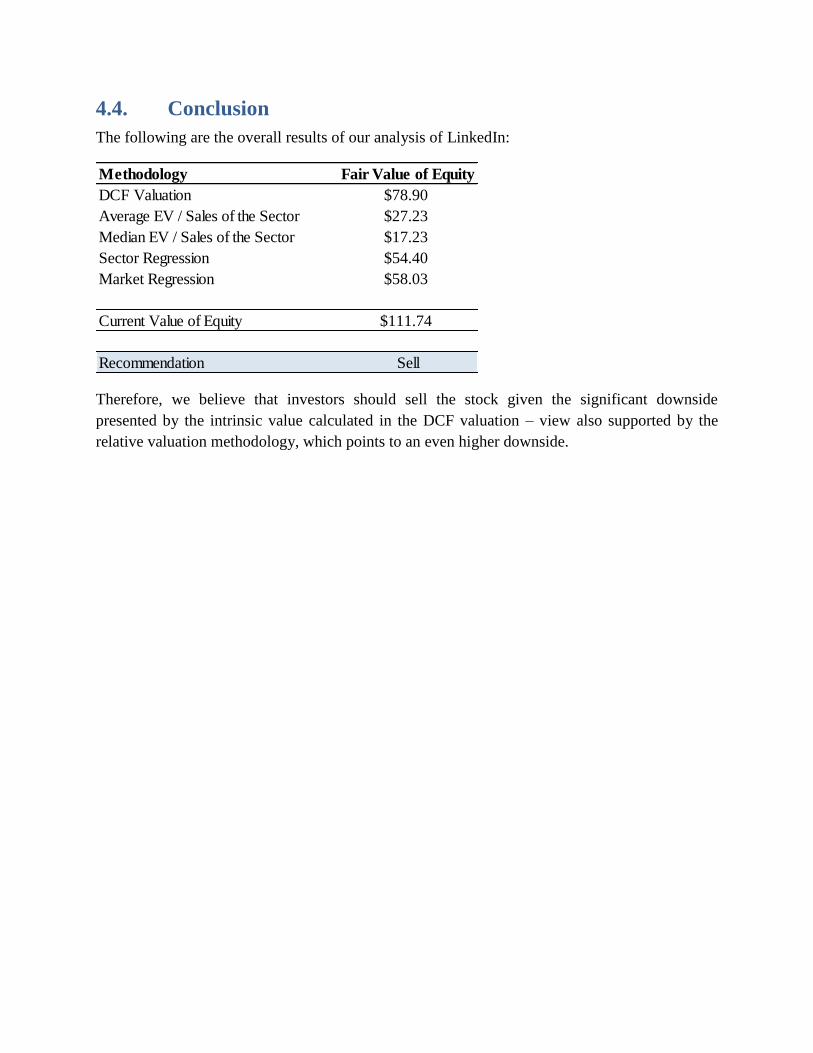
The following are the overall results of our analysis of LinkedIn:
Therefore, we believe that investors should sell the stock given the significant downside
presented by the intrinsic value calculated in the DCF valuation – view also supported by the
relative valuation methodology, which points to an even higher downside.
Methodology Fair Value of Equity
DCF Valuation $78.90
Average EV / Sales of the Sector $27.23
Median EV / Sales of the Sector $17.23
Sector Regression $54.40
Market Regression $58.03
Current Value of Equity $111.74
Recommendation Sell
5. Tesoro
5.1. Company Overview
Tesoro Corporation (NYSE:TSO) is one of the largest independent petroleum refiners and
marketers in the United States. The company has subsidiaries operating through two business
segments: manufacture and sale of transportation fuels. The refining operating segment, which
operates seven refineries in the western United States with a combined crude oil capacity of 665
thousand barrels per day, refines crude oil and other feedstocks into transportation fuels, such as
gasoline and gasoline blendstocks, jet fuel and diesel fuel, as well as other products, including
heavy fuel oils, liquefied petroleum gas, petroleum coke and asphalt. The retail operating
segment sells transportation fuels and convenience products in 18 states through a network of
1,175 retail stations, primarily under the Tesoro, Shell, and USA GasolineTM brands.
Recently, the company acquired a BP integrated Southern California refining and marketing
business. It is still waiting regulatory approval, which is expected to close by mid-2013. This
new acquisition has installed capacity to produce 266 thousand barrel per day and has fully
integrated retail marketing network of about 800 dealer operated sites.
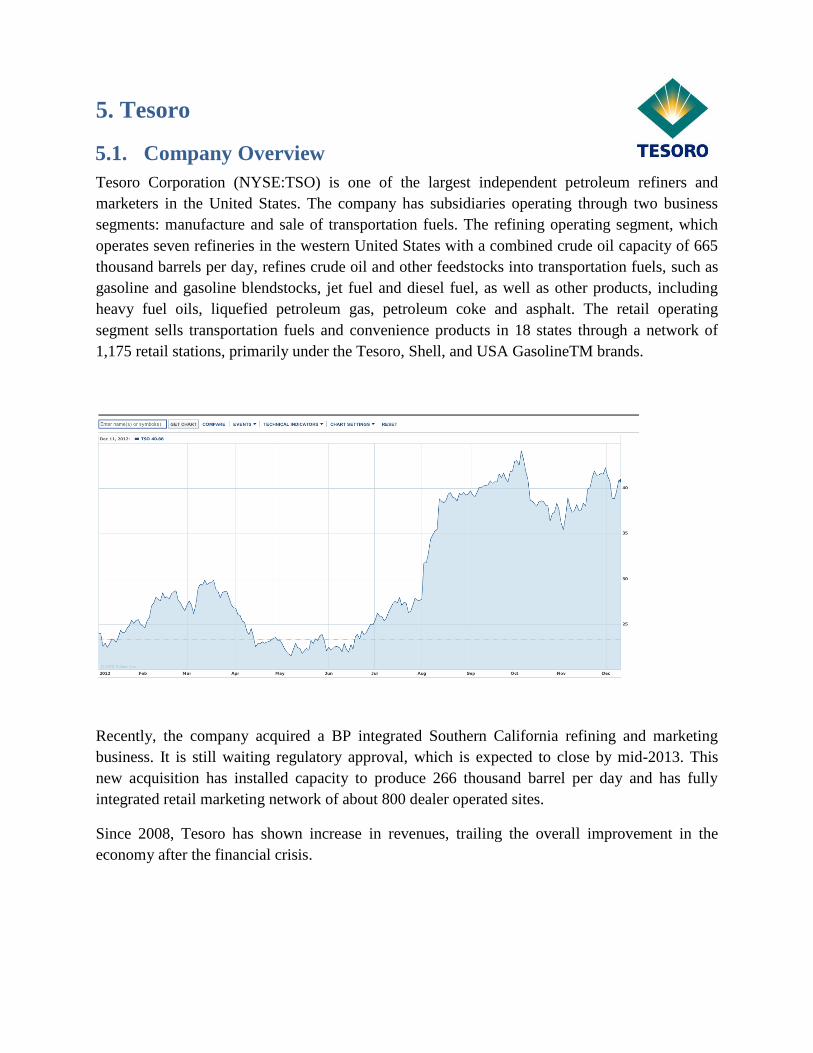
Since 2008, Tesoro has shown increase in revenues, trailing the overall improvement in the
economy after the financial crisis.
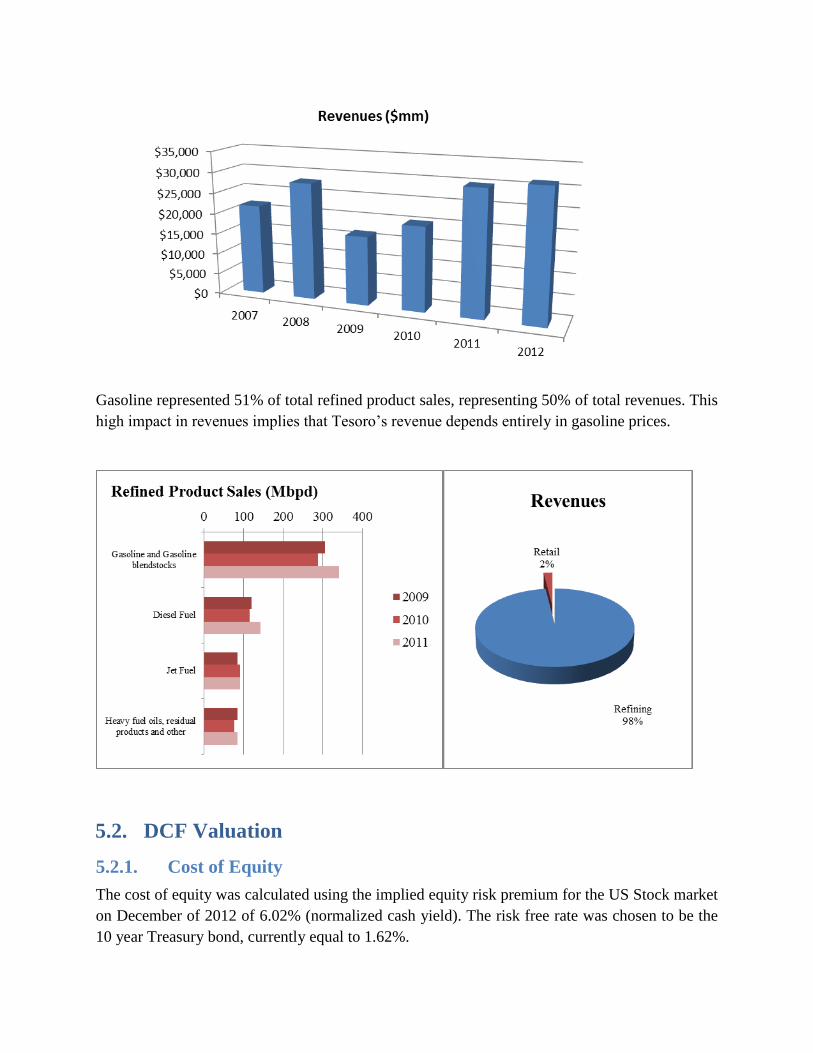
Gasoline represented 51% of total refined product sales, representing 50% of total revenues. This
high impact in revenues implies that Tesoro’s revenue depends entirely in gasoline prices.
5.2. DCF Valuation
5.2.1. Cost of Equity
The cost of equity was calculated using the implied equity risk premium for the US Stock market
on December of 2012 of 6.02% (normalized cash yield). The risk free rate was chosen to be the
10 year Treasury bond, currently equal to 1.62%.
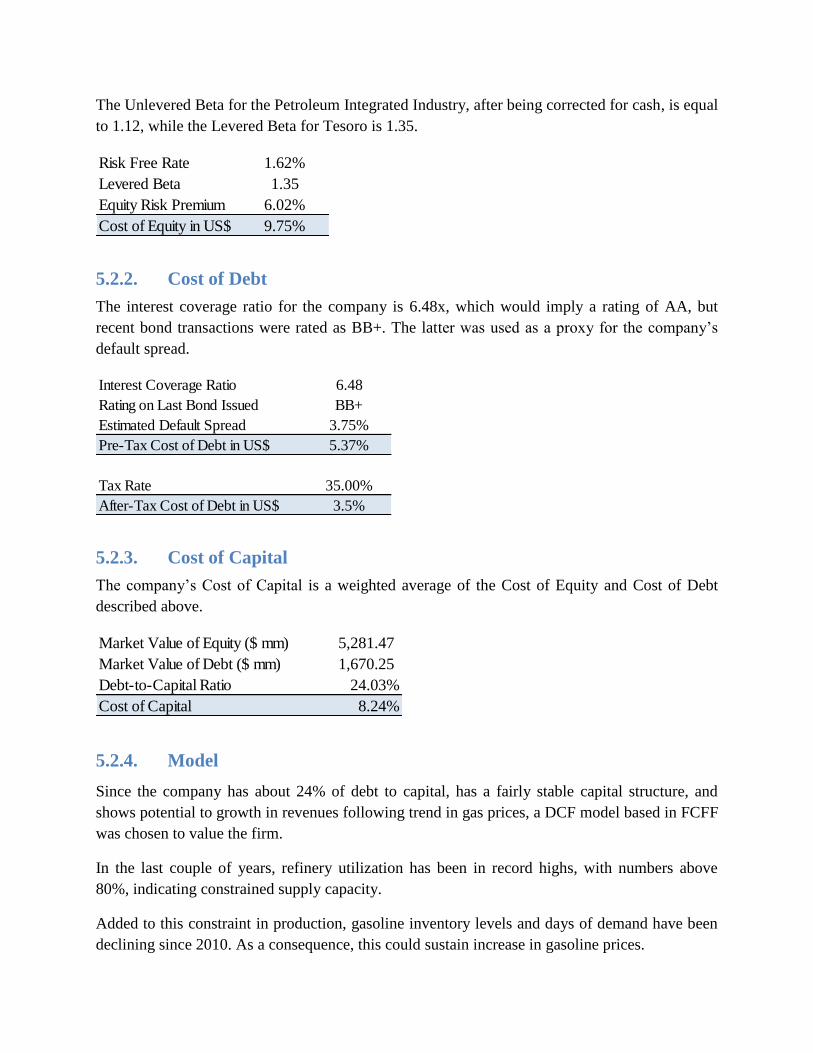
The Unlevered Beta for the Petroleum Integrated Industry, after being corrected for cash, is equal
to 1.12, while the Levered Beta for Tesoro is 1.35.
5.2.2. Cost of Debt
The interest coverage ratio for the company is 6.48x, which would imply a rating of AA, but
recent bond transactions were rated as BB+. The latter was used as a proxy for the company’s
default spread.
5.2.3. Cost of Capital
The company’s Cost of Capital is a weighted average of the Cost of Equity and Cost of Debt
described above.
5.2.4. Model
Since the company has about 24% of debt to capital, has a fairly stable capital structure, and
shows potential to growth in revenues following trend in gas prices, a DCF model based in FCFF
was chosen to value the firm.
In the last couple of years, refinery utilization has been in record highs, with numbers above
80%, indicating constrained supply capacity.
Added to this constraint in production, gasoline inventory levels and days of demand have been
declining since 2010. As a consequence, this could sustain increase in gasoline prices.
Risk Free Rate 1.62%
Levered Beta 1.35
Equity Risk Premium 6.02%
Cost of Equity in US$ 9.75%
Interest Coverage Ratio 6.48
Rating on Last Bond Issued BB+
Estimated Default Spread 3.75%
Pre-Tax Cost of Debt in US$ 5.37%
Tax Rate 35.00%
After-Tax Cost of Debt in US$ 3.5%
Market Value of Equity ($ mm) 5,281.47
Market Value of Debt ($ mm) 1,670.25
Debt-to-Capital Ratio 24.03%
Cost of Capital 8.24%
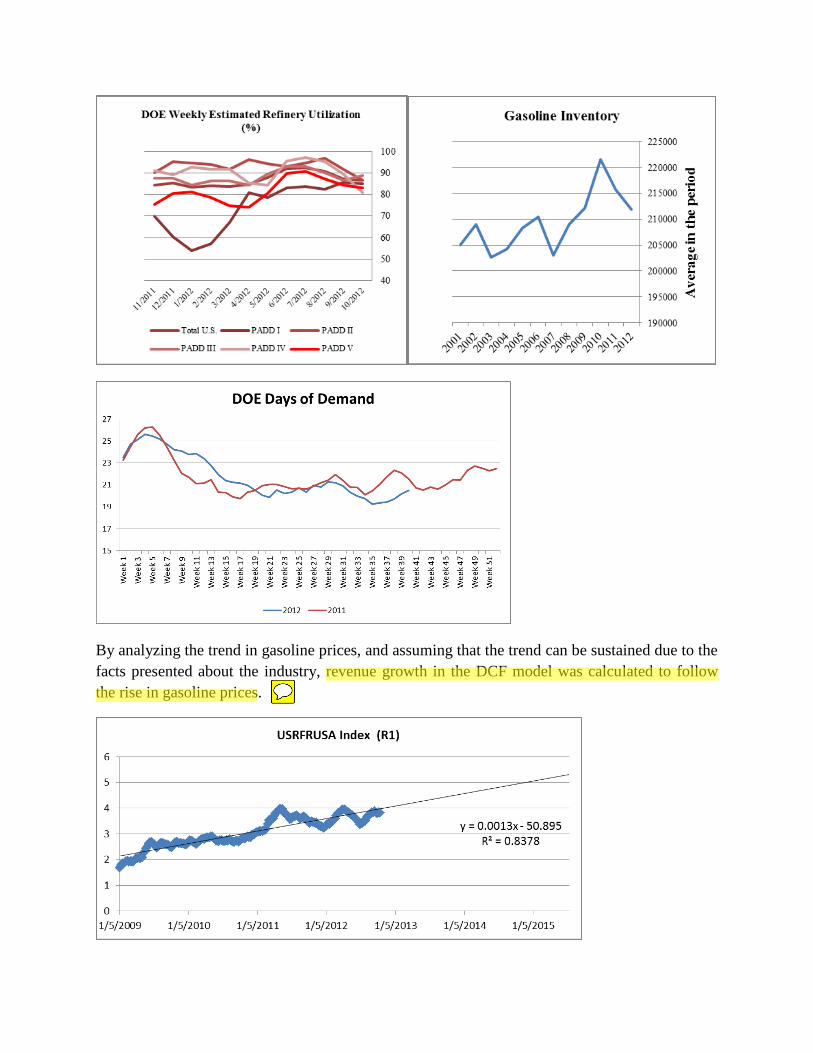
By analyzing the trend in gasoline prices, and assuming that the trend can be sustained due to the
facts presented about the industry, revenue growth in the DCF model was calculated to follow
the rise in gasoline prices.
aswath1
Highlight
aswath1
Sticky Note
Makes sense.
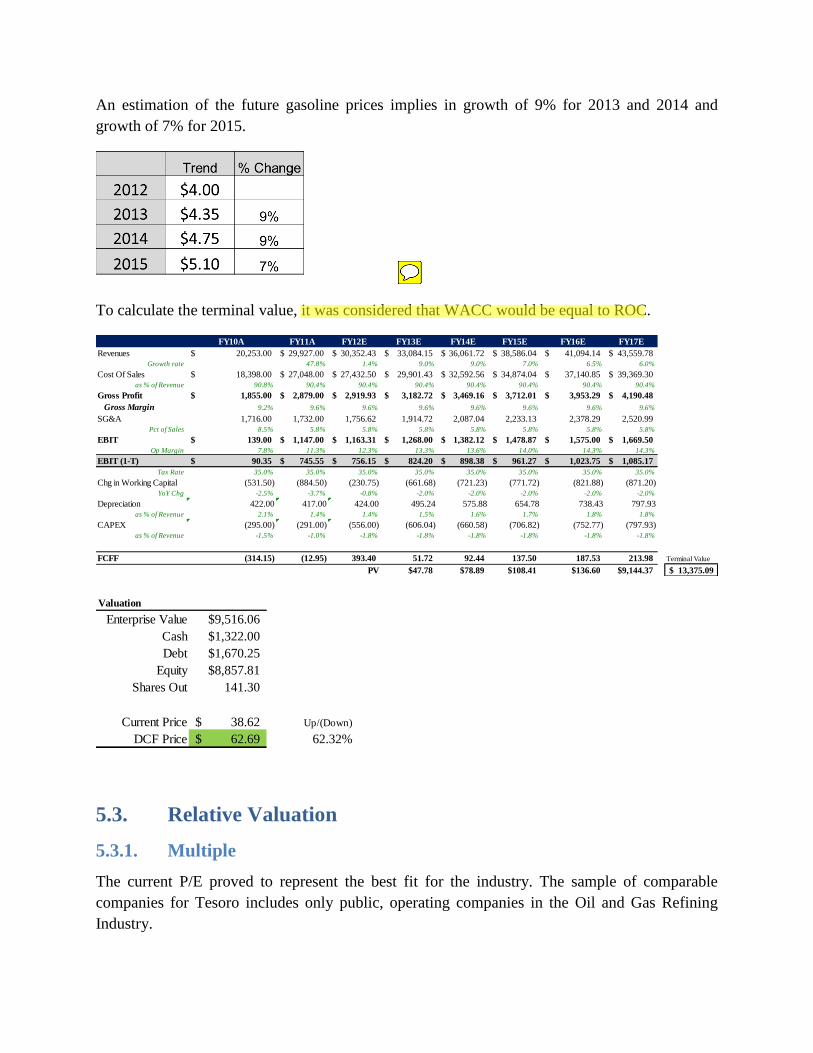
An estimation of the future gasoline prices implies in growth of 9% for 2013 and 2014 and
growth of 7% for 2015.
To calculate the terminal value, it was considered that WACC would be equal to ROC.
5.3. Relative Valuation
5.3.1. Multiple
The current P/E proved to represent the best fit for the industry. The sample of comparable
companies for Tesoro includes only public, operating companies in the Oil and Gas Refining
Industry.
FY10A FY11A FY12E FY13E FY14E FY15E FY16E FY17E
Revenues 20,253.00$ 29,927.00$ 30,352.43$ 33,084.15$ 36,061.72$ 38,586.04$ 41,094.14$ 43,559.78$ Growth rate 47.8% 1.4% 9.0% 9.0% 7.0% 6.5% 6.0%
Cost Of Sales 18,398.00$ 27,048.00$ 27,432.50$ 29,901.43$ 32,592.56$ 34,874.04$ 37,140.85$ 39,369.30$ as % of Revenue 90.8% 90.4% 90.4% 90.4% 90.4% 90.4% 90.4% 90.4%
Gross Profit 1,855.00$ 2,879.00$ 2,919.93$ 3,182.72$ 3,469.16$ 3,712.01$ 3,953.29$ 4,190.48$
Gross Margin 9.2% 9.6% 9.6% 9.6% 9.6% 9.6% 9.6% 9.6%
SG&A 1,716.00 1,732.00 1,756.62 1,914.72 2,087.04 2,233.13 2,378.29 2,520.99 Pct of Sales 8.5% 5.8% 5.8% 5.8% 5.8% 5.8% 5.8% 5.8%
EBIT 139.00$ 1,147.00$ 1,163.31$ 1,268.00$ 1,382.12$ 1,478.87$ 1,575.00$ 1,669.50$
Op Margin 7.8% 11.3% 12.3% 13.3% 13.6% 14.0% 14.3% 14.3%
EBIT (1-T) 90.35$ 745.55$ 756.15$ 824.20$ 898.38$ 961.27$ 1,023.75$ 1,085.17$
Tax Rate 35.0% 35.0% 35.0% 35.0% 35.0% 35.0% 35.0% 35.0%
Chg in Working Capital (531.50) (884.50) (230.75) (661.68) (721.23) (771.72) (821.88) (871.20) YoY Chg -2.5% -3.7% -0.8% -2.0% -2.0% -2.0% -2.0% -2.0%
Depreciation 422.00 417.00 424.00 495.24 575.88 654.78 738.43 797.93as % of Revenue 2.1% 1.4% 1.4% 1.5% 1.6% 1.7% 1.8% 1.8%
CAPEX (295.00) (291.00) (556.00) (606.04) (660.58) (706.82) (752.77) (797.93) as % of Revenue -1.5% -1.0% -1.8% -1.8% -1.8% -1.8% -1.8% -1.8%
1 2 3 4 5
FCFF (314.15) (12.95) 393.40 51.72 92.44 137.50 187.53 213.98 Terminal Value
PV $47.78 $78.89 $108.41 $136.60 $9,144.37 13,375.09$
Valuation
Enterprise Value $9,516.06
Cash $1,322.00
Debt $1,670.25
Equity $8,857.81
Shares Out 141.30
Current Price 38.62$ Up/(Down)
DCF Price 62.69$ 62.32%
aswath1
Highlight
aswath1
Sticky Note
it is actually the reverse, you assume that ROC is equal to WACC, but I am quibbling about terminology
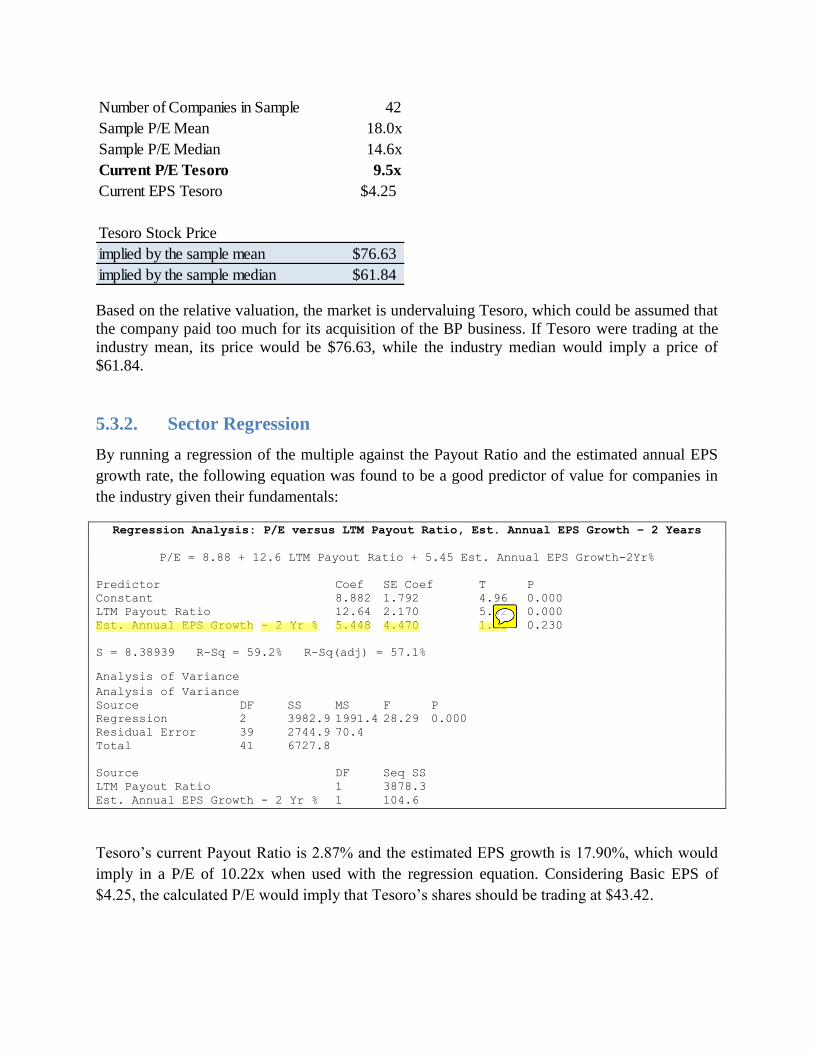
Based on the relative valuation, the market is undervaluing Tesoro, which could be assumed that
the company paid too much for its acquisition of the BP business. If Tesoro were trading at the
industry mean, its price would be $76.63, while the industry median would imply a price of
$61.84.
5.3.2. Sector Regression
By running a regression of the multiple against the Payout Ratio and the estimated annual EPS
growth rate, the following equation was found to be a good predictor of value for companies in
the industry given their fundamentals:
Regression Analysis: P/E versus LTM Payout Ratio, Est. Annual EPS Growth – 2 Years
P/E = 8.88 + 12.6 LTM Payout Ratio + 5.45 Est. Annual EPS Growth-2Yr%
Predictor Coef SE Coef T P
Constant 8.882 1.792 4.96 0.000
LTM Payout Ratio 12.64 2.170 5.82 0.000
Est. Annual EPS Growth - 2 Yr % 5.448 4.470 1.22 0.230
S = 8.38939 R-Sq = 59.2% R-Sq(adj) = 57.1%
Analysis of Variance
Analysis of Variance
Source DF SS MS F P
Regression 2 3982.9 1991.4 28.29 0.000
Residual Error 39 2744.9 70.4
Total 41 6727.8
Source DF Seq SS
LTM Payout Ratio 1 3878.3
Est. Annual EPS Growth - 2 Yr % 1 104.6
Tesoro’s current Payout Ratio is 2.87% and the estimated EPS growth is 17.90%, which would
imply in a P/E of 10.22x when used with the regression equation. Considering Basic EPS of
$4.25, the calculated P/E would imply that Tesoro’s shares should be trading at $43.42.
Number of Companies in Sample 42
Sample P/E Mean 18.0x
Sample P/E Median 14.6x
Current P/E Tesoro 9.5x
Current EPS Tesoro $4.25
Tesoro Stock Price
implied by the sample mean $76.63
implied by the sample median $61.84
aswath1
Highlight
aswath1
Sticky Note
Marginal significance, right?
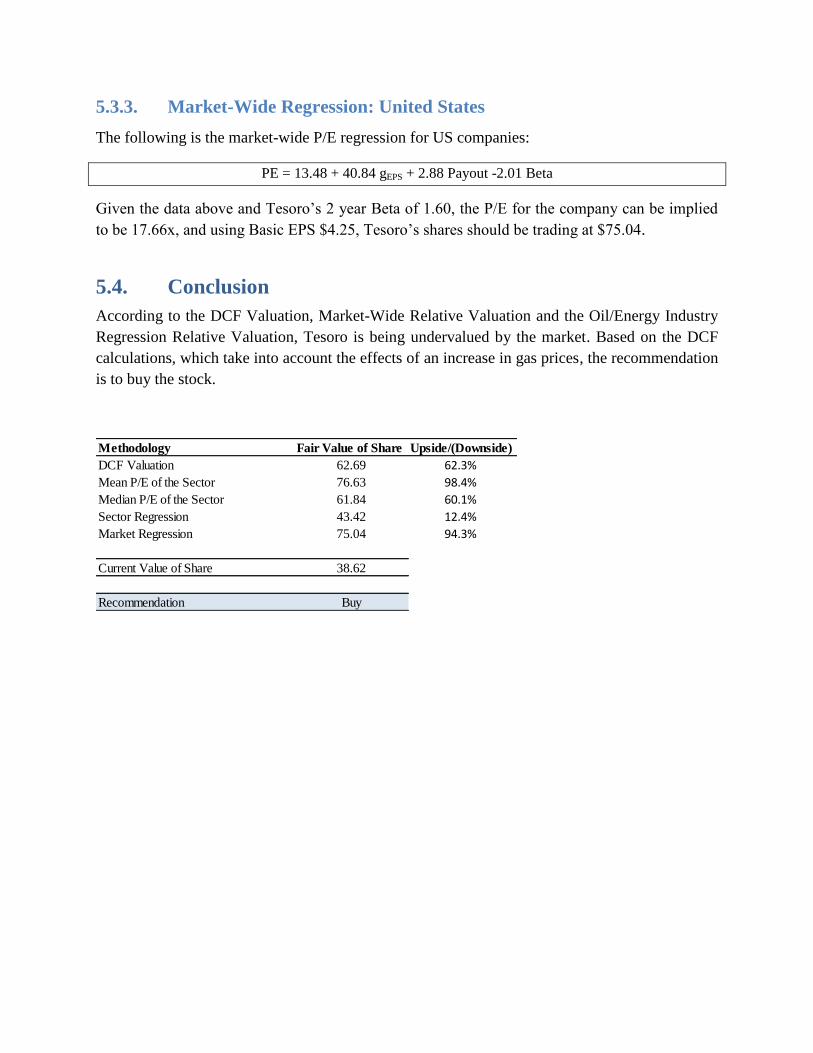
5.3.3. Market-Wide Regression: United States
The following is the market-wide P/E regression for US companies:
PE = 13.48 + 40.84 gEPS + 2.88 Payout -2.01 Beta
Given the data above and Tesoro’s 2 year Beta of 1.60, the P/E for the company can be implied
to be 17.66x, and using Basic EPS $4.25, Tesoro’s shares should be trading at $75.04.
5.4. Conclusion
According to the DCF Valuation, Market-Wide Relative Valuation and the Oil/Energy Industry
Regression Relative Valuation, Tesoro is being undervalued by the market. Based on the DCF
calculations, which take into account the effects of an increase in gas prices, the recommendation
is to buy the stock.
Methodology Fair Value of Share Upside/(Downside)
DCF Valuation 62.69 62.3%
Mean P/E of the Sector 76.63 98.4%
Median P/E of the Sector 61.84 60.1%
Sector Regression 43.42 12.4%
Market Regression 75.04 94.3%
Current Value of Share 38.62
Recommendation Buy
Related Documents