Utility Analysis

Welcome message from author
This document is posted to help you gain knowledge. Please leave a comment to let me know what you think about it! Share it to your friends and learn new things together.
Transcript
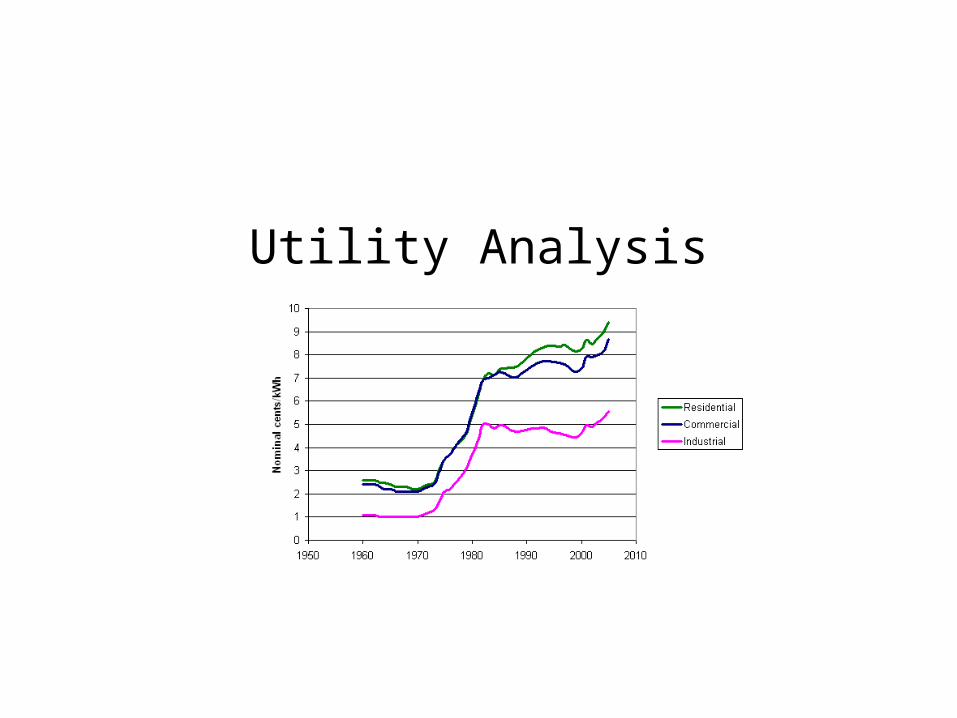
Utility Analysis
Baseline Electricity Analysis
Understanding and documenting current energy use is called developing a baseline. Developing a baseline:– Helps define potential energy savings – Helps focus efforts on the most important areas– Determines accurate avoided energy costs for calculating cost
savings– Helps identify energy saving opportunities– Provides a baseline from which to measure the effectiveness of
energy management activities.
Baseline Electricity Analysis
This section discusses: – How utilities typically structure charges for electricity– How to calculate the avoided cost of electricity– How to use utility billing analysis to help identify cost
saving opportunities
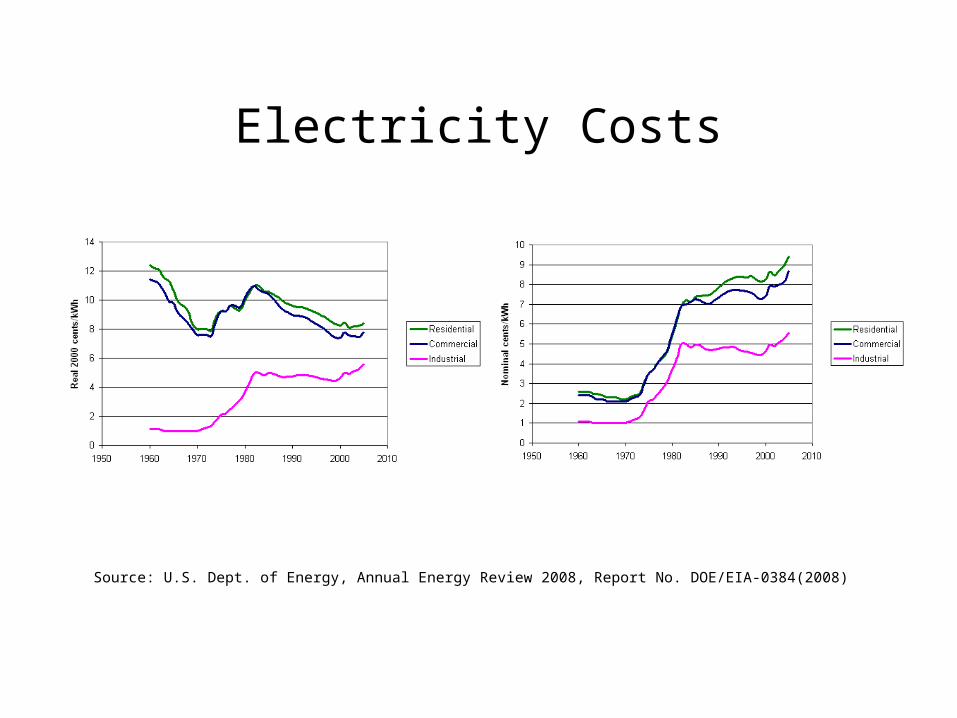
Electricity Costs
Source: U.S. Dept. of Energy, Annual Energy Review 2008, Report No. DOE/EIA-0384(2008)
Electric Rate Structures
With the exception of rate structures that employ real-time pricing, the total cost of electricity in most commercial and industrial rate structures is the sum of four components: – A service charge– An energy charge– A demand charge– A power factor charge
Energy Charge
Fixed Block Structures: the cost of energy depends on how much is purchased. – $0.05 /kWh for the first 10,000 kWh– $0.04 /kWh for the next 100,000 kWh– $0.03 /kW for all remaining kWh
Demand-dependent Block Structures– $0.05 /kWh for first 250 kWh/kW– $0.04 /kWh for next 150 kWh/kW– $0.03 /kWh for all additional kWh
Fuel Cost Adjustments and Taxes: – Because the cost of fuel for a utility may vary over time, utilities
sometimes modify the energy costs in the rate schedule with a “fuel cost adjustment”.
Demand Charge
Demand Period: – Record electricity consumption every 15-minute or 30-minute interval throughout a billing
period. – Thus, near-instantaneous power spikes, such as when motors startup, have little effect on
the peak demand since the duration of a short power spike is small compared to the demand interval. Moreover, longer demand periods generally result in lower peak demand.
On Peak-Off Peak Rates: – ‘billing demand’ is calculated as the greater of:– the actual on-peak demand, or – 50% of the actual off-peak demand.
Seasonal Demand Charge: – the actual demand, or– 75% of the peak monthly demand during the previous 12 months.
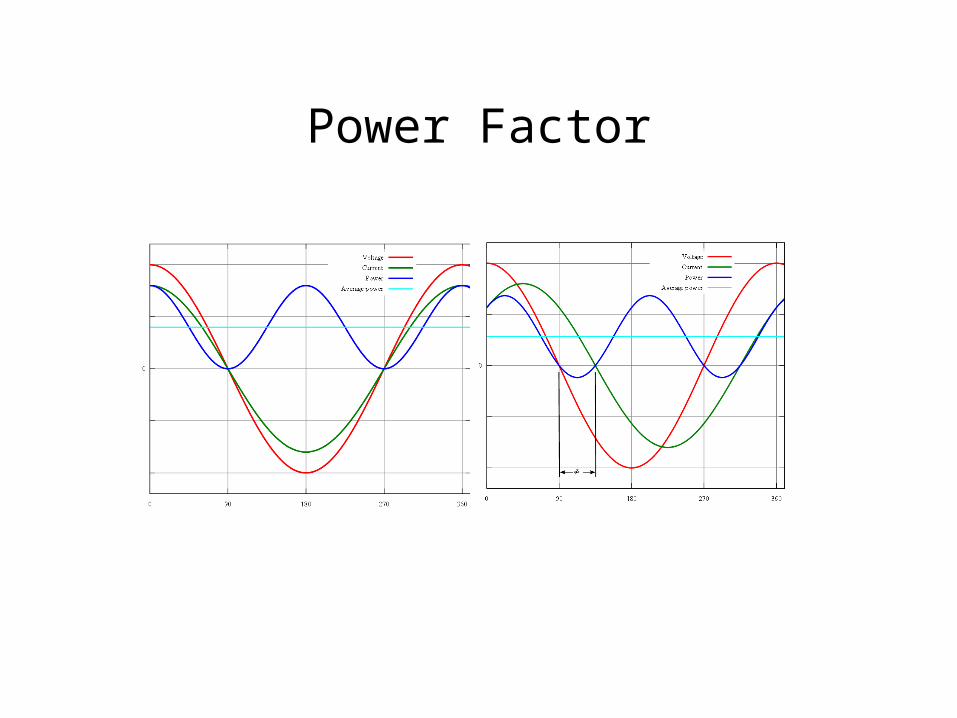
Power Factor
In resistive loads, such as those from electric resistance heating elements, all power supplied to the load is dissipated as heat.
In inductive modes, such as those from motors, some power is used to energize the motor’s coils and create a rotating magnetic field. This power alternately flows to and from the load, and is called reactive power (kVAr). Reactive power is unusable by the load.
Thus, the total power supplied to the load (kVA) must be greater than the power consumed by the load (kW). The ratio of actual power consumed by equipment (kW) to total supplied power (kVA) is called the power factor.
Utilities typically charge for low power factor since the utility must supply enough power to compensate for the reactive power, even though only a portion of the supplied power is actually consumed by the motor.
Power Factor
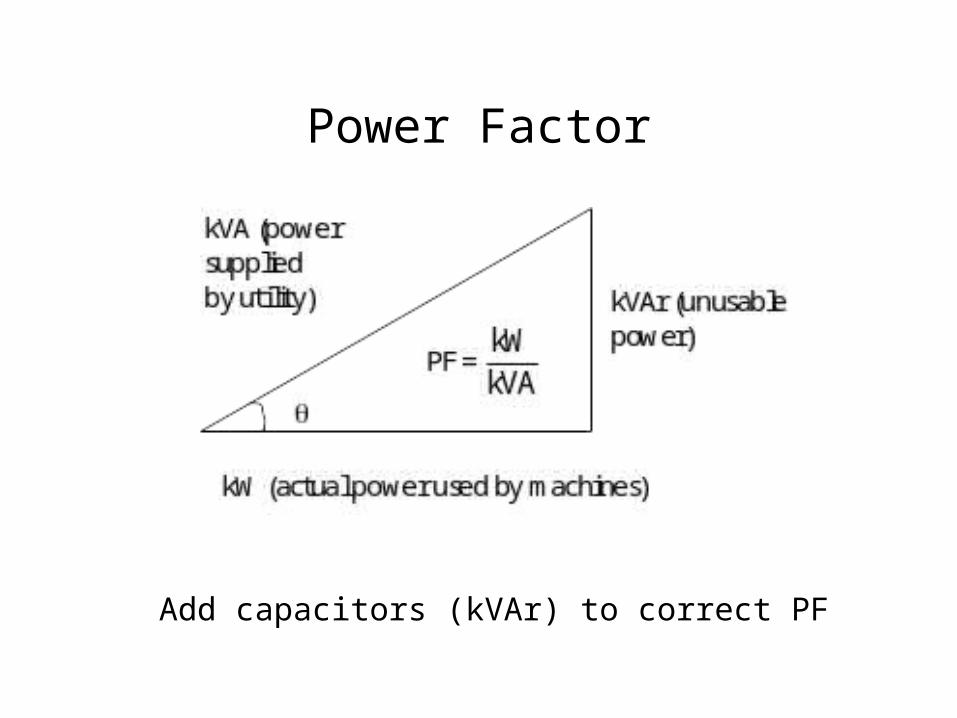
Power Factor
Add capacitors (kVAr) to correct PF
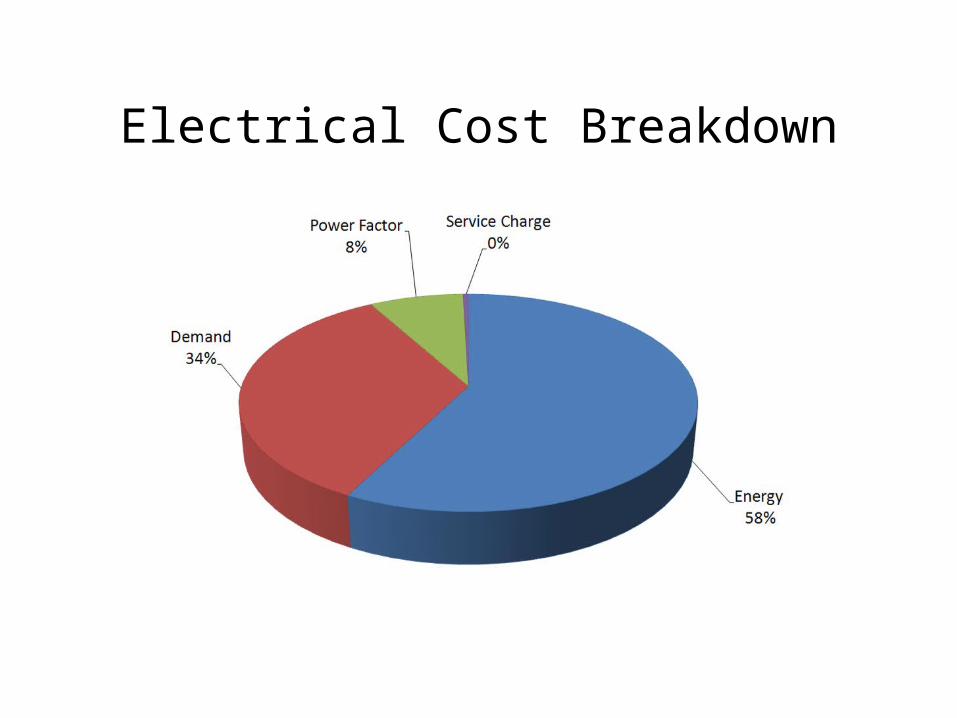
Electrical Cost Breakdown
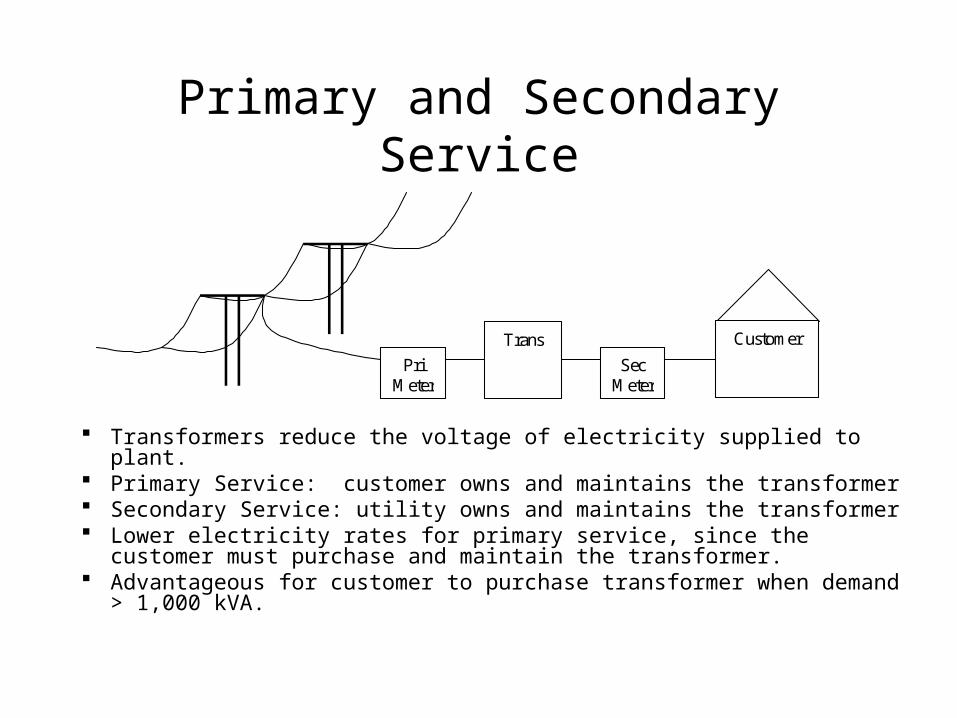
Primary and Secondary Service
Transformers reduce the voltage of electricity supplied to plant. Primary Service: customer owns and maintains the transformer Secondary Service: utility owns and maintains the transformer Lower electricity rates for primary service, since the customer must purchase and
maintain the transformer. Advantageous for customer to purchase transformer when demand > 1,000 kVA.
Pri Meter
Trans
Sec Meter
Customer
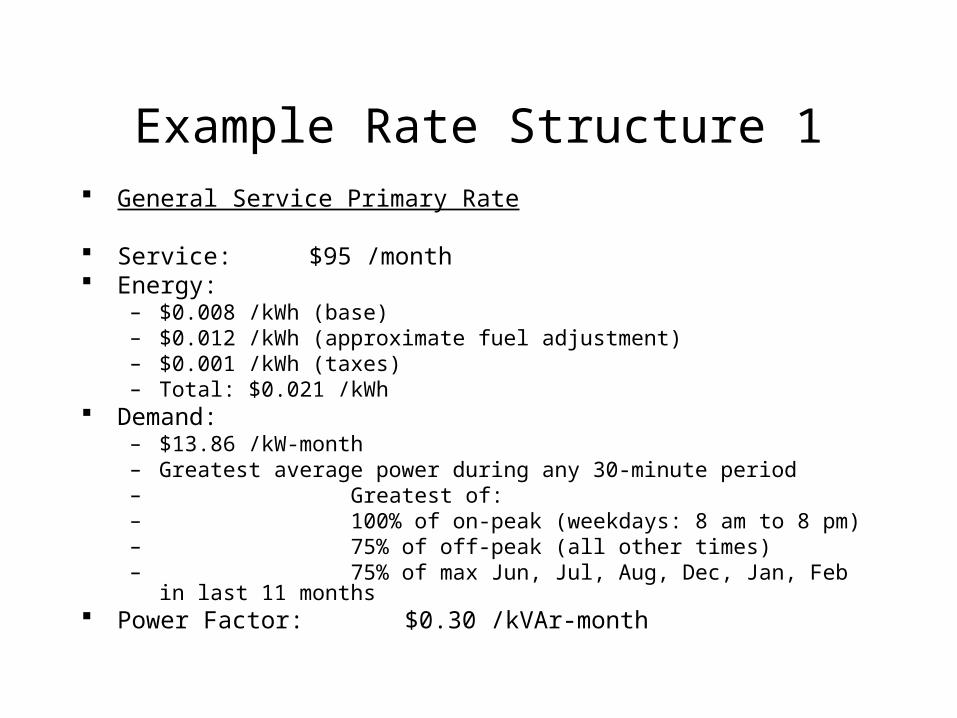
Example Rate Structure 1 General Service Primary Rate
Service: $95 /month Energy:
– $0.008 /kWh (base)– $0.012 /kWh (approximate fuel adjustment)– $0.001 /kWh (taxes)– Total: $0.021 /kWh
Demand: – $13.86 /kW-month– Greatest average power during any 30-minute period– Greatest of:– 100% of on-peak (weekdays: 8 am to 8 pm)– 75% of off-peak (all other times)– 75% of max Jun, Jul, Aug, Dec, Jan, Feb in last 11 months
Power Factor: $0.30 /kVAr-month
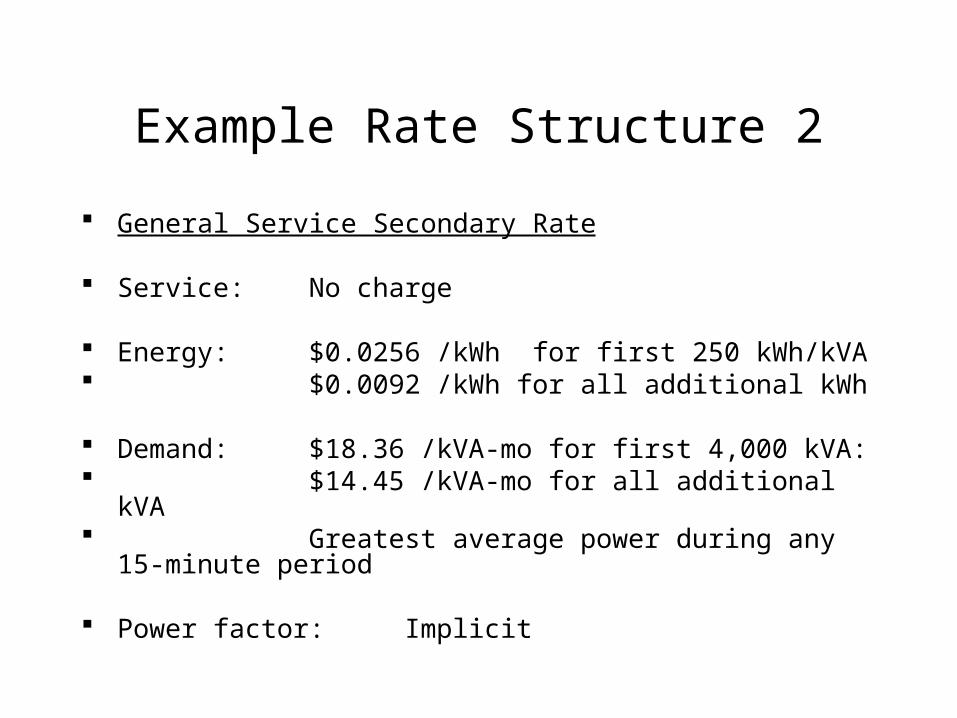
Example Rate Structure 2
General Service Secondary Rate
Service: No charge
Energy: $0.0256 /kWh for first 250 kWh/kVA $0.0092 /kWh for all additional kWh
Demand: $18.36 /kVA-mo for first 4,000 kVA: $14.45 /kVA-mo for all additional kVA Greatest average power during any 15-minute period
Power factor: Implicit
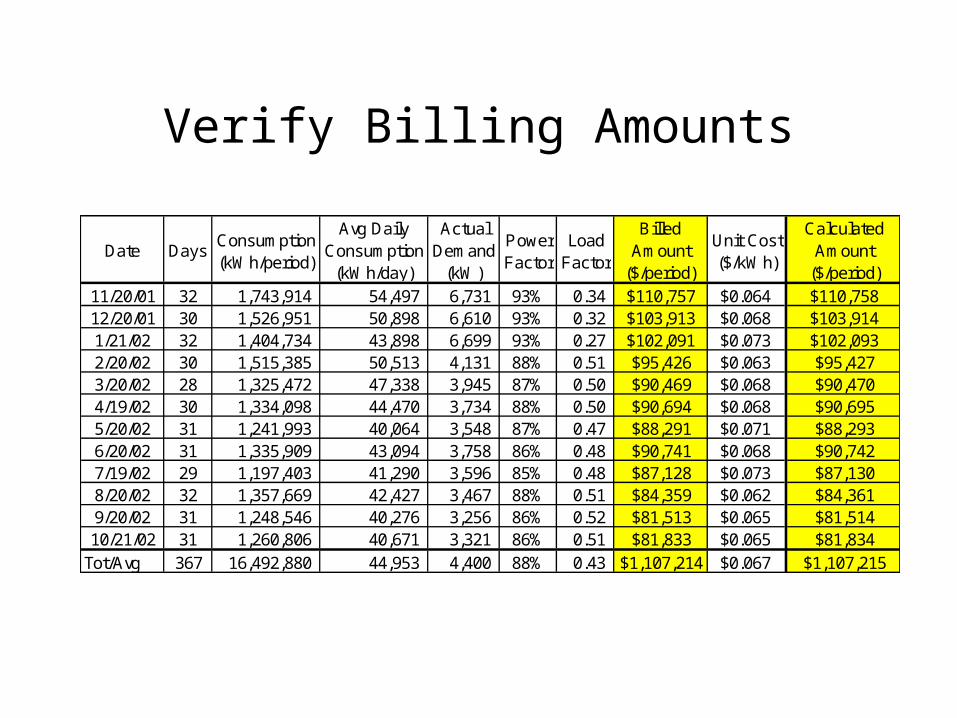
Verify Billing Amounts
Date DaysConsumption (kWh/period)
Avg Daily Consumption
(kWh/day)
Actual Demand
(kW)
Power Factor
Load Factor
Billed Amount
($/period)
Unit Cost ($/kWh)
Calculated Amount
($/period)11/20/01 32 1,743,914 54,497 6,731 93% 0.34 $110,757 $0.064 $110,75812/20/01 30 1,526,951 50,898 6,610 93% 0.32 $103,913 $0.068 $103,9141/21/02 32 1,404,734 43,898 6,699 93% 0.27 $102,091 $0.073 $102,0932/20/02 30 1,515,385 50,513 4,131 88% 0.51 $95,426 $0.063 $95,4273/20/02 28 1,325,472 47,338 3,945 87% 0.50 $90,469 $0.068 $90,4704/19/02 30 1,334,098 44,470 3,734 88% 0.50 $90,694 $0.068 $90,6955/20/02 31 1,241,993 40,064 3,548 87% 0.47 $88,291 $0.071 $88,2936/20/02 31 1,335,909 43,094 3,758 86% 0.48 $90,741 $0.068 $90,7427/19/02 29 1,197,403 41,290 3,596 85% 0.48 $87,128 $0.073 $87,1308/20/02 32 1,357,669 42,427 3,467 88% 0.51 $84,359 $0.062 $84,3619/20/02 31 1,248,546 40,276 3,256 86% 0.52 $81,513 $0.065 $81,51410/21/02 31 1,260,806 40,671 3,321 86% 0.51 $81,833 $0.065 $81,834
Tot/Avg 367 16,492,880 44,953 4,400 88% 0.43 $1,107,214 $0.067 $1,107,215
Avoided Cost of Electricity To calculate cost savings from reducing electricity usage, it is common
practice to multiply the average cost of electricity times the electricity savings. Unfortunately, estimating cost savings using the average cost of electricity
usually inflates the estimated cost savings because the average cost of electricity includes fixed costs such as service charge and because many rate structures employ block structures in which the first block of electricity costs more than subsequent blocks.
In addition, use of the average cost of electricity to estimate cost savings from energy conservation retrofits may lead to even greater errors if the energy conservation retrofit does not affect peak demand.
Thus, the most accurate way to estimate cost savings from reducing electricity usage is to calculate the reduction in demand and energy costs separately based on the average demand and energy use and the rate structure.
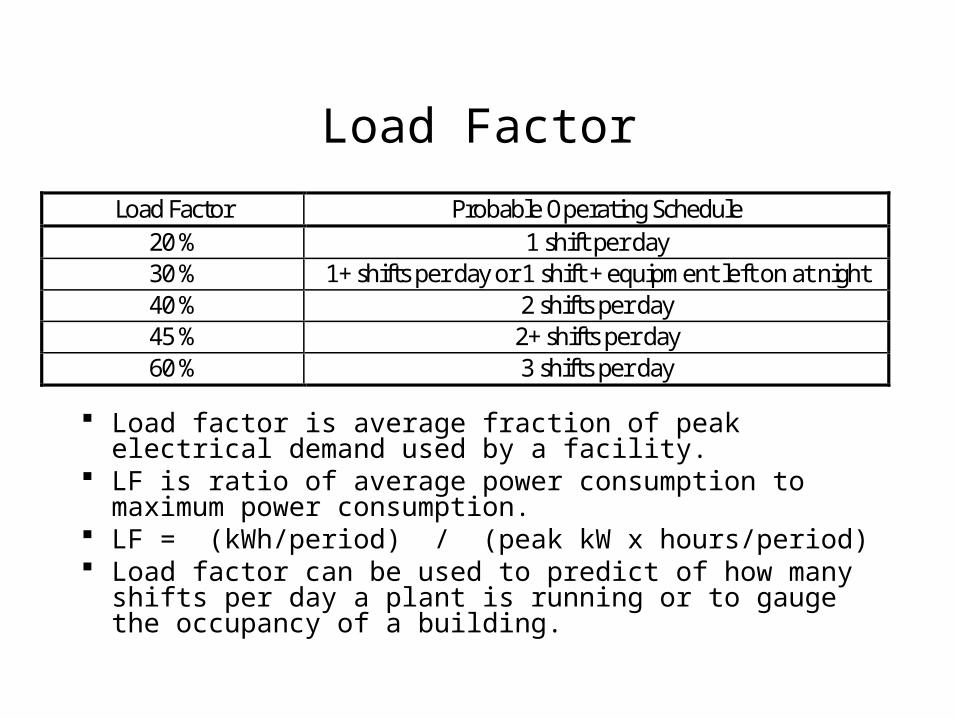
Load Factor
Load factor is average fraction of peak electrical demand used by a facility.
LF is ratio of average power consumption to maximum power consumption.
LF = (kWh/period) / (peak kW x hours/period) Load factor can be used to predict of how many shifts per day a
plant is running or to gauge the occupancy of a building.
Load Factor Probable Operating Schedule 20 % 1 shift per day 30 % 1+ shifts per day or 1 shift + equipment left on at night 40 % 2 shifts per day 45 % 2+ shifts per day 60 % 3 shifts per day
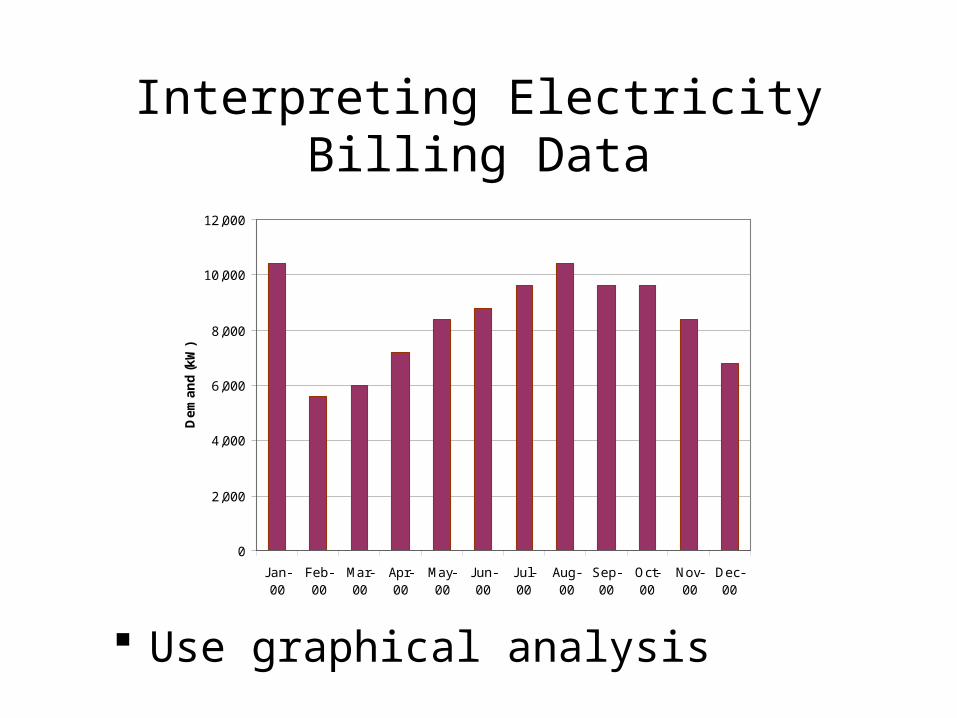
Interpreting Electricity Billing Data
Use graphical analysis
0
2,000
4,000
6,000
8,000
10,000
12,000
Jan-00
Feb-00
Mar-00
Apr-00
May-00
Jun-00
Jul-00
Aug-00
Sep-00
Oct-00
Nov-00
Dec-00
De
ma
nd
(k
W)
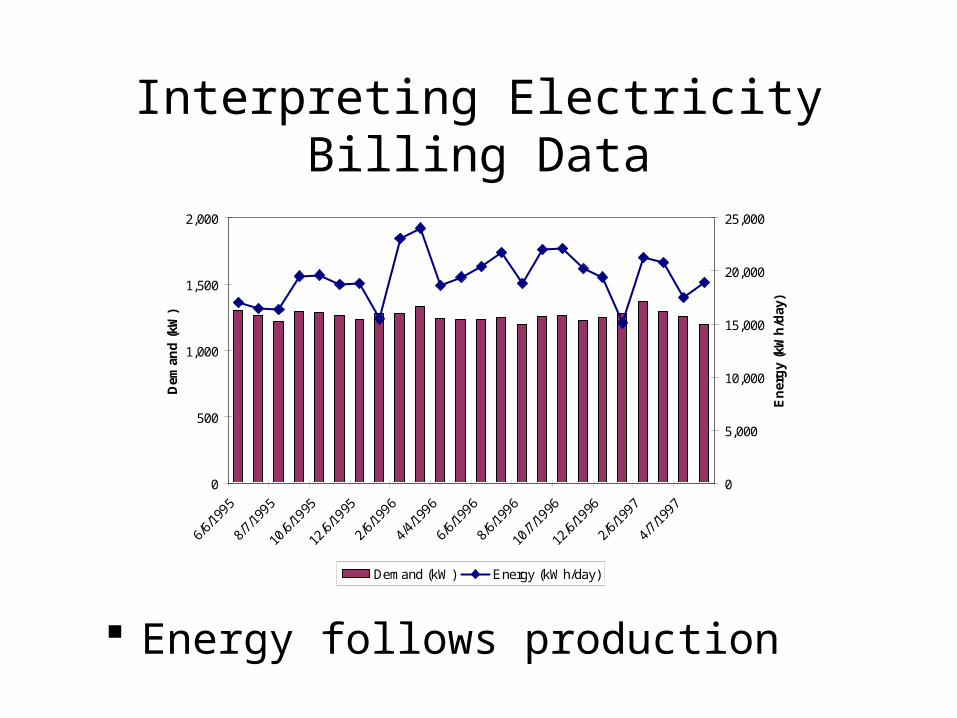
Interpreting Electricity Billing Data
Energy follows production
0
500
1,000
1,500
2,000
Dem
and
(kW
)
0
5,000
10,000
15,000
20,000
25,000
En
erg
y (k
Wh
/day
)
Demand (kW) Energy (kWh/day)
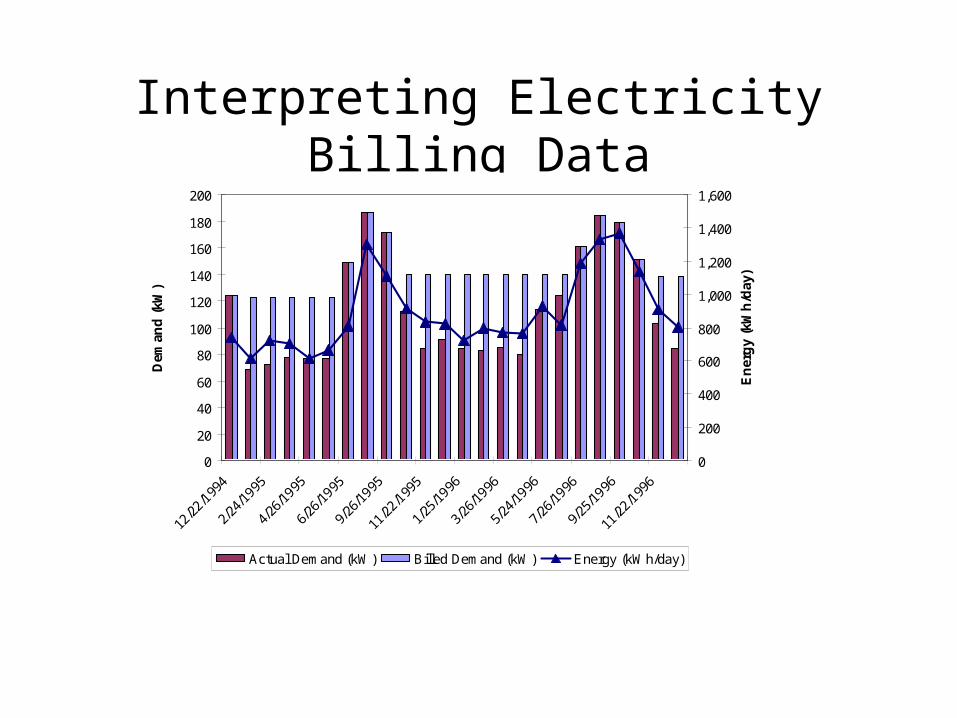
Interpreting Electricity Billing Data
0
20
40
60
80
100
120
140
160
180
200
12/22
/199
4
2/24
/1995
4/26
/1995
6/26
/1995
9/26
/1995
11/22
/199
5
1/25
/1996
3/26
/1996
5/24
/1996
7/26
/1996
9/25
/1996
11/22
/199
6
Dem
and
(kW
)
0
200
400
600
800
1,000
1,200
1,400
1,600
En
erg
y (k
Wh
/day
)
Actual Demand (kW) Billed Demand (kW) Energy (kWh/day)
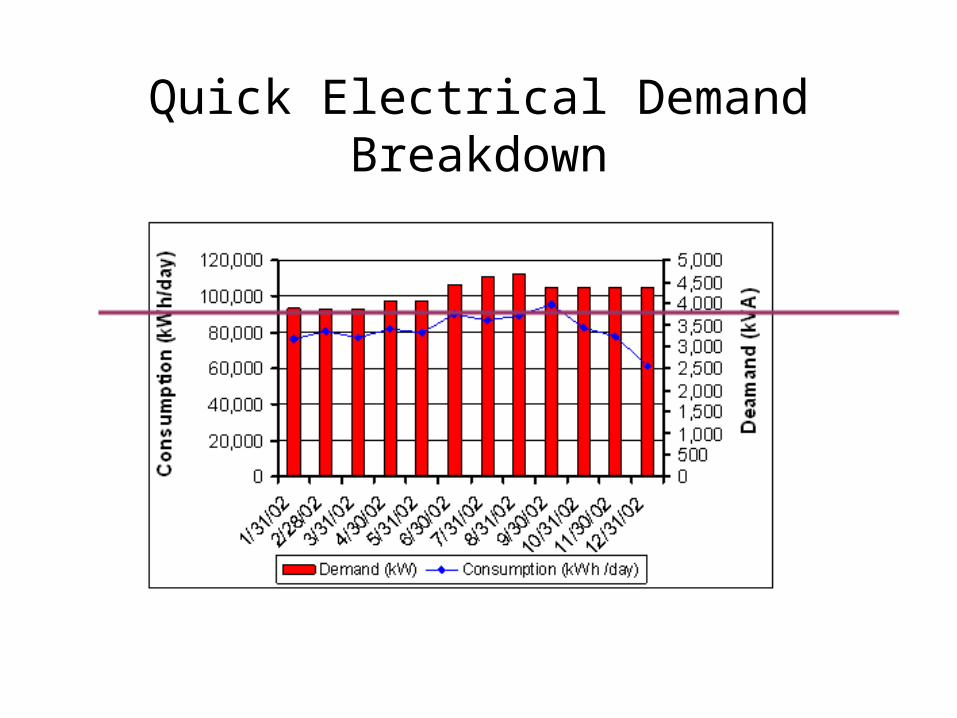
Quick Electrical Demand Breakdown
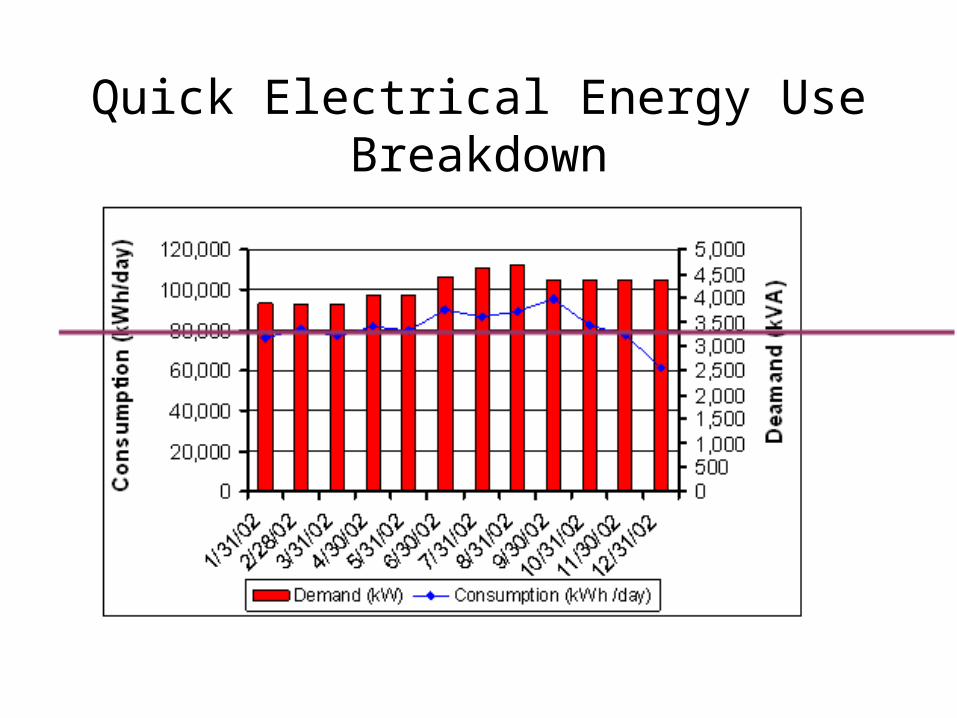
Quick Electrical Energy Use Breakdown
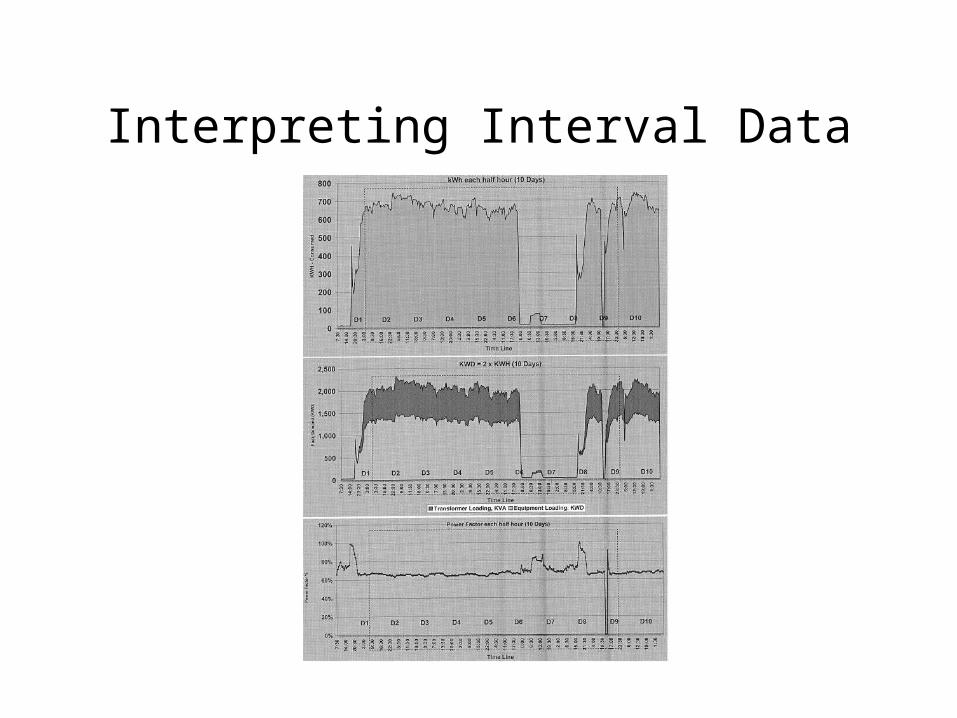
Interpreting Interval Data
Electrical System Cost Saving Opportunities
Rate Structure– Switch to or negotiate electric rate structure with lower overall costs– Enroll in demand response program
Billing Errors– Reconcile billing error with utility
Meter Consolidation– Consolidate electrical meters
Purchasing Transformer– Purchase transformer and switch to primary service
Power Factor Correction– Correct power factor by downsizing over-sized motors– Correct power factor by adding capacitors
Demand Saving Potential– Reschedule operation of electrical equipment to reduce peak demand. – Use control equipment to shed loads to manage peak demand
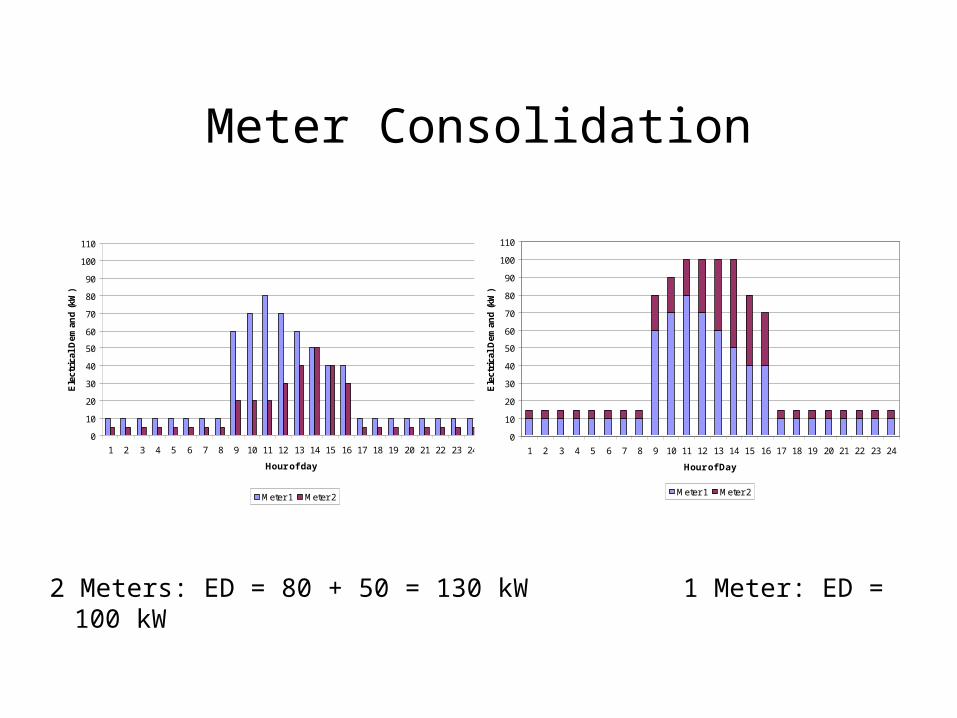
Meter Consolidation
2 Meters: ED = 80 + 50 = 130 kW 1 Meter: ED = 100 kW
0
10
20
30
40
50
60
70
80
90
100
110
1 2 3 4 5 6 7 8 9 10 11 12 13 14 15 16 17 18 19 20 21 22 23 24
Hour of day
Ele
ctri
cal
Dem
and
(kW
)
Meter 1 Meter 2
0
10
20
30
40
50
60
70
80
90
100
110
1 2 3 4 5 6 7 8 9 10 11 12 13 14 15 16 17 18 19 20 21 22 23 24
Hour of Day
Ele
ctri
cal
Dem
and
(kW
)Meter 1 Meter 2
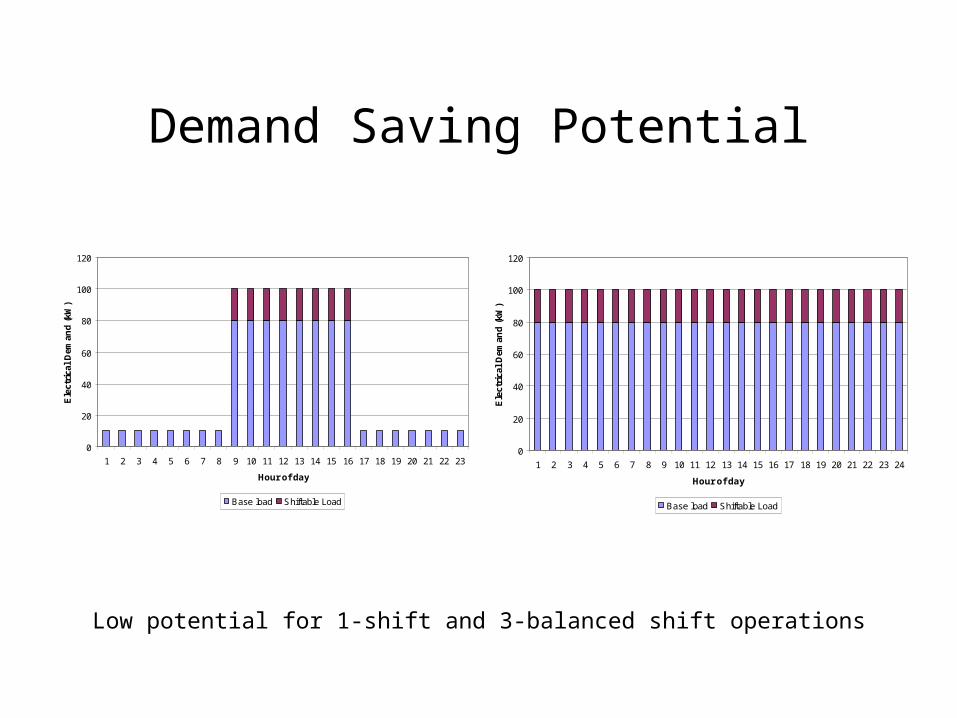
Demand Saving Potential
Low potential for 1-shift and 3-balanced shift operations
0
20
40
60
80
100
120
1 2 3 4 5 6 7 8 9 10 11 12 13 14 15 16 17 18 19 20 21 22 23
Hour of day
Ele
ctri
cal
Dem
and
(kW
)
Base load Shiftable Load
0
20
40
60
80
100
120
1 2 3 4 5 6 7 8 9 10 11 12 13 14 15 16 17 18 19 20 21 22 23 24
Hour of day
Ele
ctri
cal
Dem
and
(kW
)Base load Shiftable Load
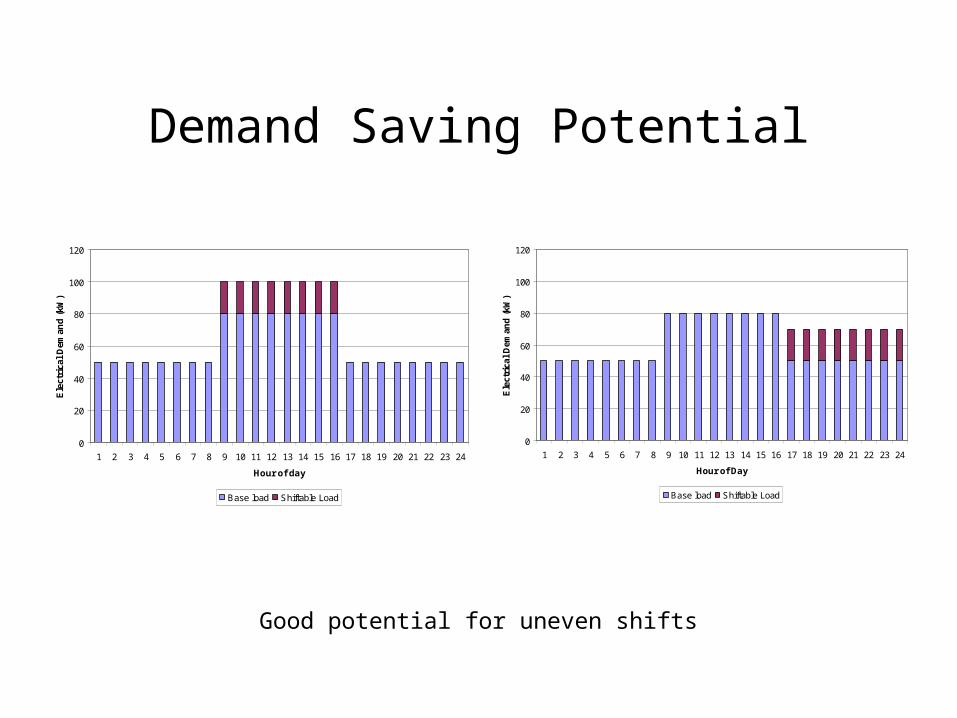
Demand Saving Potential
Good potential for uneven shifts
0
20
40
60
80
100
120
1 2 3 4 5 6 7 8 9 10 11 12 13 14 15 16 17 18 19 20 21 22 23 24
Hour of day
Ele
ctri
cal
Dem
and
(kW
)
Base load Shiftable Load
0
20
40
60
80
100
120
1 2 3 4 5 6 7 8 9 10 11 12 13 14 15 16 17 18 19 20 21 22 23 24
Hour of Day
Ele
ctri
cal
Dem
and
(kW
)Base load Shiftable Load
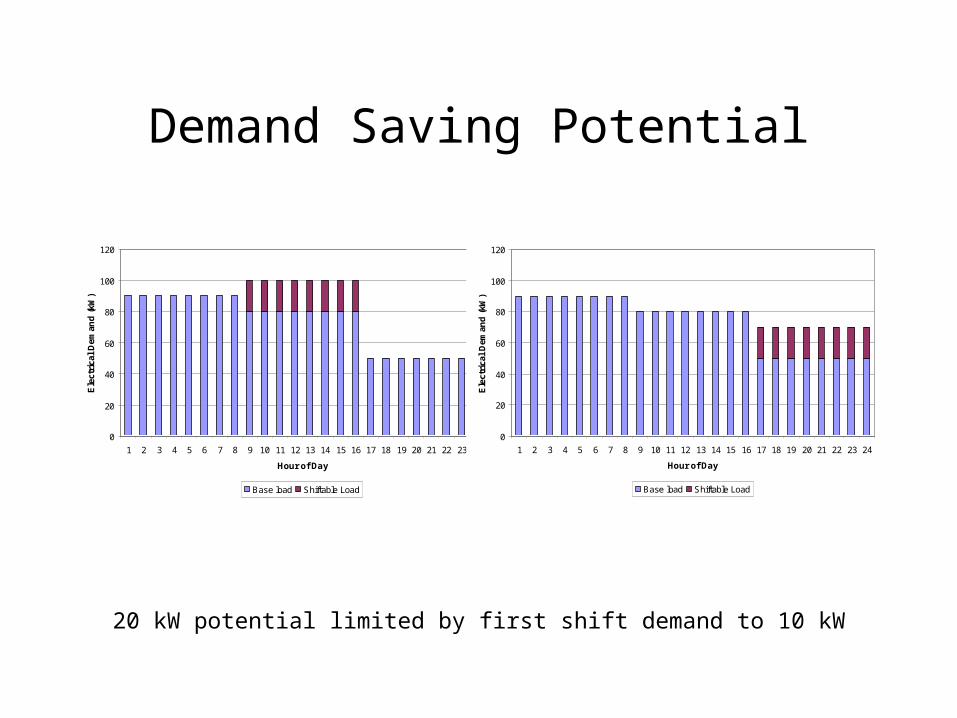
Demand Saving Potential
20 kW potential limited by first shift demand to 10 kW
0
20
40
60
80
100
120
1 2 3 4 5 6 7 8 9 10 11 12 13 14 15 16 17 18 19 20 21 22 23 24
Hour of Day
Ele
ctri
cal
Dem
and
(kW
)
Base load Shiftable Load
0
20
40
60
80
100
120
1 2 3 4 5 6 7 8 9 10 11 12 13 14 15 16 17 18 19 20 21 22 23 24
Hour of Day
Ele
ctri
cal
Dem
and
(kW
)Base load Shiftable Load
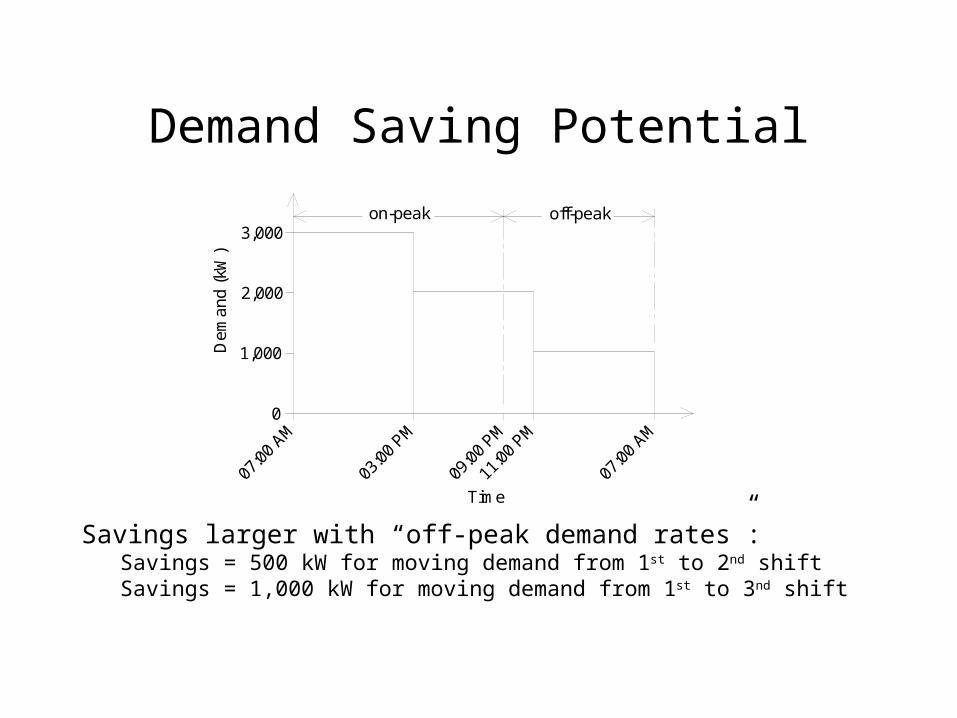
Demand Saving Potential
Savings larger with “off-peak demand rates”: Savings = 500 kW for moving demand from 1st to 2nd shiftSavings = 1,000 kW for moving demand from 1st to 3nd shift
3,000
2,000
1,000
0
on-peak off-peak
Time
Dem
an
d (
kW)
Demand Response Programs
Many utilities and independent companies offer demand response programs
Demand response compensates customers for having ability and willingness to curtail load during critical times on the grid.
Demand response payments ~ $50 /kW-year. No “demand emergencies” in 13-state PJM territory in
last two years. Example: agree to reduce demand by 100 kW and
receive ~ $5,000 per year.
Related Documents