W A T E R S E R V I C E S A S S O C I A T I O N of Australia Urban Water Demand Forecasting and Demand Management: Research Needs Review and Recommendations Occasional Paper No. 9 - November 2003

Welcome message from author
This document is posted to help you gain knowledge. Please leave a comment to let me know what you think about it! Share it to your friends and learn new things together.
Transcript
W A T E R S E R V I C E S A S S O C I A T I O Nof Australia
Urban Water Demand Forecastingand Demand Management:
Research Needs Review and Recommendations
Occasional Paper No. 9 - November 2003
W A T E R S E R V I C E S A S S O C I A T I O Nof Australia
INTERNET HOMEPAGE http://www.wsaa.asn.au
MELBOURNE OFFICE469 LATROBE STREET, MELBOURNE 3000
VICTORIA AUSTRALIATEL: 03 9606 0678. FAX: 03 9606 0376
EMAIL [email protected]
SYDNEY OFFICE286 SUSSEX STREET, SYDNEY, NSWGPO BOX 5420, SYDNEY, NSW, 2001TEL: 02 8206 6719. FAX: 02 8206 6015EMAIL: [email protected]
Prepared by Institute for Sustainable FuturesUniversity of Technology Sydney
for
Water Services Association of Australia
COPYRIGHTThis document is copyrighted. Apart from any use as permitted under the Copyright Act 1968, nopart of this document may be reproduced or transmitted in any form or by any means, electronicallyor mechanical, for any purpose, without the express written permission of the Water Services Asso-ciation of Australia.
© Water Services Association of Australia Inc, 2003 ALL RIGHTS RESERVED
ISBN 1 920760 02 4
DISCLAIMERThis occasional paper is issued by the Water Services Association of Australia Inc. on the understand-ing that:
1. Water Services Association of Australia Inc. and individual contributors are not responsible for theresults of any action taken on the basis of information in this occasional paper, nor for any errorsor omissions.
2. The Water Services Association of Australia Inc and individual contributors disclaim all and anyliability to any person in respect of anything, and the consequences of anything, done or omittedto be done by a person in reliance upon the whole or any part of this occasional paper.
3. The occasional paper does not purport to be a comprehensive statement and analysis of itssubjective matter, and if further expert advice is required, the services of a competent professionalshould be sought.
W A T E R S E R V I C E S A S S O C I A T I O Nof Australia
Urban Water Demand Forecastingand Demand Management:
Research Needs Review and Recommendations
Occasional Paper No. 9 - November 2003
Authors:
Stuart White, Jim Robinson, Dana Cordell, Meenakshi Jha and Geoff Milne
Institute for Sustainable FuturesUniversity of Technology Sydney
4
WATER SERVICES ASSOCIATION OF AUSTRALIA - OCCASIONAL PAPER NO. 9 - URBAN WATER DEMAND FORECASTING & DEMAND MANAGEMENT
Contents
Summary and Recommendations ............................................................................................................. 6Summary ........................................................................................................................................................6Recommendations ..........................................................................................................................................7
1. Continue detailed research on priority areas ......................................................................................................72. Research Forum Series ......................................................................................................................................73. Ongoing collaboration between WSAA and WSAA members ........................................................................... 84. Continuation of WSAA CD/database of Demand Management Studies ............................................................8
1 Introduction ......................................................................................................................................... 91.1 Project Background ..................................................................................................................................91.2 Objectives and Scope ................................................................................................................................91.3 Outputs ....................................................................................................................................................9
2 Urban Water Demand: History and Context ....................................................................................... 102.1 History of Urban Water Demand Forecasting and Demand Management ............................................. 10
3 Study Methodology ............................................................................................................................ 123.1 Introduction .......................................................................................................................................... 123.2 Templates .............................................................................................................................................. 14
3.2.1 Template A: Factors Influencing Water Demand ........................................................................................143.2.2 Template B: ...............................................................................................................................................14
3.3 Selection Criteria for Short-listed Studies .............................................................................................. 143.4 Hyperlinked CD .................................................................................................................................... 14
4. Water Demand & Demand Management Initiatives ........................................................................... 154.1 Introduction .......................................................................................................................................... 15
4.1.1 Factors influencing water demand ..............................................................................................................154.1.2 Demand management ................................................................................................................................164.1.3 Demand forecasting ...................................................................................................................................18
4.2 Water Using Practices ............................................................................................................................ 194.2.1 Pricing .......................................................................................................................................................204.2.2 Regulation .................................................................................................................................................204.2.3 Restrictions ...............................................................................................................................................201.2.4 Income levels .............................................................................................................................................204.2.5 Socio-cultural factors .................................................................................................................................214.2.6 Knowledge and awareness .........................................................................................................................214.2.7 Technical innovation ..................................................................................................................................214.2.8 Development of a water service framework ................................................................................................21
4.3 Water Using Equipment ........................................................................................................................ 224.4 Demographics and Land Use................................................................................................................. 224.5 Climate .................................................................................................................................................. 234.6 Water Supply System ............................................................................................................................. 234.7 Source Substitution ............................................................................................................................... 23
5
WATER SERVICES ASSOCIATION OF AUSTRALIA - OCCASIONAL PAPER NO. 9 - URBAN WATER DEMAND FORECASTING & DEMAND MANAGEMENT
ContentsContinued
5. Significant Studies ............................................................................................................................. 245.1 Study 1: Water Pricing Impacts Study ................................................................................................... 245.2 Study 2: Customer Value Studies and Customer Preferences on Water Resource Issues ......................... 245.3 Study 3: Perth Pilot Toilet and Shower Water Use Study ....................................................................... 255.4 Study 4: Melbourne End Use and Water Consumption Influences Study .............................................. 265.5 Study 5: Domestic Water Use Study...................................................................................................... 275.6 Study 6: Average Residential Consumption Variability .......................................................................... 285.7 Study 7: Water Demand Management Strategy for Alice Springs .......................................................... 295.8 Study 8: Integration of Rain Tanks: Impact on Water Supply Headworks ............................................. 295.9 Study 9: Wise Water Management: A Demand Management Manual for Water Utilities ....................... 305.10 Study 10: Residential and Non-residential Water Pricing Communications ......................................... 305.11 Study 11: Water Conservation Partnership Program (WCPP) ............................................................. 315.12 Study 12: Kalgoorlie–Boulder Water Use Efficiency Study and Evaluation ......................................... 315.13 Study 13: Sydney Water Least Cost Planning Study ............................................................................ 315.14 Study 14: Demand Management, Water Efficiency and Reuse in the Hunter Water ............................ 325.15 Study 15: Edmondson Park ................................................................................................................. 335.16 Study 16: Pimpama–Coomera Integrated Water Master Plan .............................................................. 345.17 Study 17: Recommendations for Developing a Framework for Assessing Sustainability of Urban Water .Systems ....................................................................................................................................................... 345.18 Study 18: Sustainable Urban Water Futures ........................................................................................ 355.19 Study 19: Infrastructure Charges Project ............................................................................................. 355.20 Study20: Customer Research Unit Program........................................................................................ 365.21 Study 21: ARCWIS research ............................................................................................................... 36
6 Findings and Conclusions .................................................................................................................. 376.1 Introduction .......................................................................................................................................... 376.2 Research Gaps ....................................................................................................................................... 37
6.2.1 Limitations ................................................................................................................................................376.2.2 General findings ........................................................................................................................................386.2.3 Data and Knowledge Gaps ........................................................................................................................38
6.3 Best Practice Characteristics ................................................................................................................... 416.3.1 Water Usage Practices ................................................................................................................................416.3.2 Water using equipment .............................................................................................................................426.3.3 Demographics and land use .......................................................................................................................426.3.4 Climate ......................................................................................................................................................426.3.5 Source Substitution ...................................................................................................................................426.3.6 Water Supply System ................................................................................................................................42
6.4 Relevance of studies to other areas ........................................................................................................ 426.5 Priority research areas ............................................................................................................................ 43
6.6 Recommendations ........................................................................................................................... 456.6.1 Continued detailed research on priority areas ..................................................................................... 456.6.2 Research Forum Series ....................................................................................................................... 466.6.3 Ongoing collaboration between WSAA and WSAA members ............................................................ 466.6.4 Continuation of WSAA CD/database of Demand Management Studies ............................................. 47
Bibliography ......................................................................................................................................... 48Appendix A: Glossary ............................................................................................................................ 53Appendix B: Templates A and B ............................................................................................................ 55
Additional Appendices: ............................................................................................................................... 56
6
WATER SERVICES ASSOCIATION OF AUSTRALIA - OCCASIONAL PAPER NO. 9 - URBAN WATER DEMAND FORECASTING & DEMAND MANAGEMENT
Summary and Recommendations
Summary
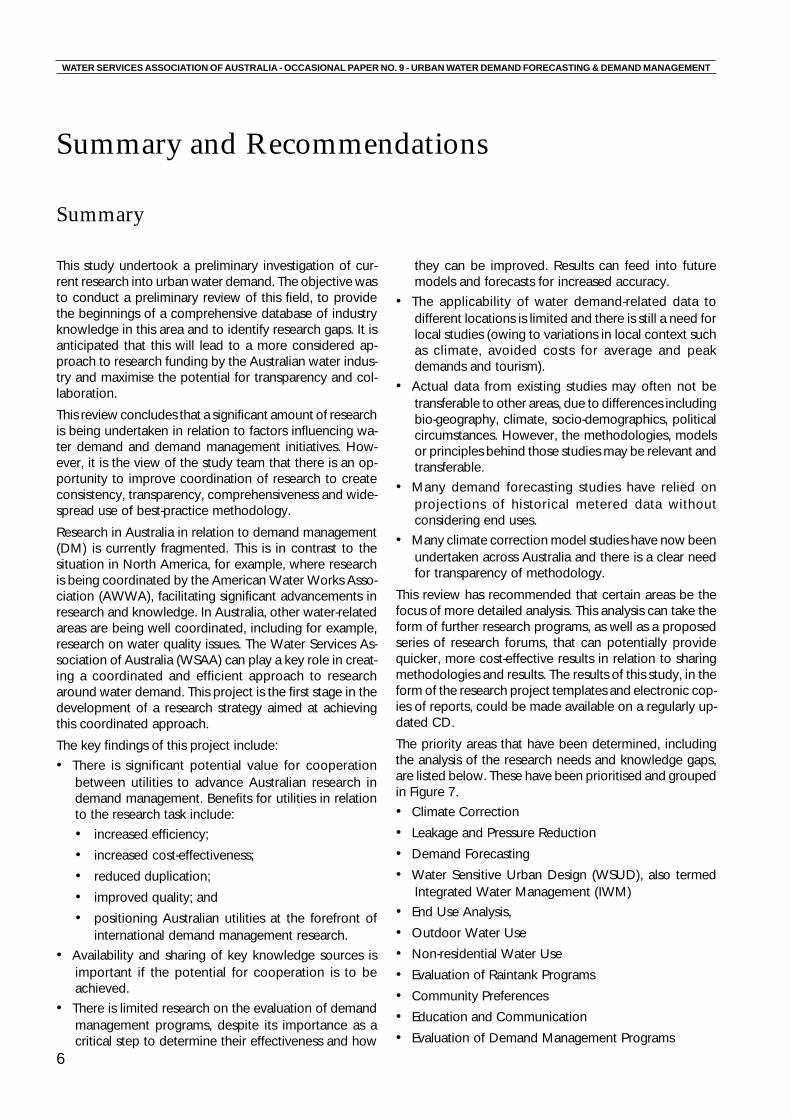
This study undertook a preliminary investigation of cur-rent research into urban water demand. The objective wasto conduct a preliminary review of this field, to providethe beginnings of a comprehensive database of industryknowledge in this area and to identify research gaps. It isanticipated that this will lead to a more considered ap-proach to research funding by the Australian water indus-try and maximise the potential for transparency and col-laboration.
This review concludes that a significant amount of researchis being undertaken in relation to factors influencing wa-ter demand and demand management initiatives. How-ever, it is the view of the study team that there is an op-portunity to improve coordination of research to createconsistency, transparency, comprehensiveness and wide-spread use of best-practice methodology.
Research in Australia in relation to demand management(DM) is currently fragmented. This is in contrast to thesituation in North America, for example, where researchis being coordinated by the American Water Works Asso-ciation (AWWA), facilitating significant advancements inresearch and knowledge. In Australia, other water-relatedareas are being well coordinated, including for example,research on water quality issues. The Water Services As-sociation of Australia (WSAA) can play a key role in creat-ing a coordinated and efficient approach to researcharound water demand. This project is the first stage in thedevelopment of a research strategy aimed at achievingthis coordinated approach.
The key findings of this project include:
• There is significant potential value for cooperationbetween utilities to advance Australian research indemand management. Benefits for utilities in relationto the research task include:
• increased efficiency;
• increased cost-effectiveness;
• reduced duplication;
• improved quality; and
• positioning Australian utilities at the forefront ofinternational demand management research.
• Availability and sharing of key knowledge sources isimportant if the potential for cooperation is to beachieved.
• There is limited research on the evaluation of demandmanagement programs, despite its importance as acritical step to determine their effectiveness and how
they can be improved. Results can feed into futuremodels and forecasts for increased accuracy.
• The applicability of water demand-related data todifferent locations is limited and there is still a need forlocal studies (owing to variations in local context suchas climate, avoided costs for average and peakdemands and tourism).
• Actual data from existing studies may often not betransferable to other areas, due to differences includingbio-geography, climate, socio-demographics, politicalcircumstances. However, the methodologies, modelsor principles behind those studies may be relevant andtransferable.
• Many demand forecasting studies have relied onprojections of historical metered data withoutconsidering end uses.
• Many climate correction model studies have now beenundertaken across Australia and there is a clear needfor transparency of methodology.
This review has recommended that certain areas be thefocus of more detailed analysis. This analysis can take theform of further research programs, as well as a proposedseries of research forums, that can potentially providequicker, more cost-effective results in relation to sharingmethodologies and results. The results of this study, in theform of the research project templates and electronic cop-ies of reports, could be made available on a regularly up-dated CD.
The priority areas that have been determined, includingthe analysis of the research needs and knowledge gaps,are listed below. These have been prioritised and groupedin Figure 7.
• Climate Correction
• Leakage and Pressure Reduction
• Demand Forecasting
• Water Sensitive Urban Design (WSUD), also termedIntegrated Water Management (IWM)
• End Use Analysis,
• Outdoor Water Use
• Non-residential Water Use
• Evaluation of Raintank Programs
• Community Preferences
• Education and Communication
• Evaluation of Demand Management Programs
7
WATER SERVICES ASSOCIATION OF AUSTRALIA - OCCASIONAL PAPER NO. 9 - URBAN WATER DEMAND FORECASTING & DEMAND MANAGEMENT
Recommendations
1. Continue detailed research on priorityareasFurther research on priority areas identified from the gapanalysis could involve:
• Literature reviews;
• International best-practice comparisons and
• Structured interviews with key experts.
Following the breadth of this first stage, this would enabledepth of research to be achieved to screen for the priorityresearch areas. This research could be undertaken in col-laboration with various WSAA members. Such studiescould include:
• Development of residential stock studies to collect dataon water using equipment, water usage practices,residential lot sizes;
• Collection of data on trends in multi-residentialhousehold water demand including influencing factorssuch as water using equipment;
• Collection of data on trends in non-residential waterdemand in different industry sectors, including keyinfluencing variables (water using equipment, waterusing practices, employment levels, economic activity);
• Further investigation of issues and options for individualunit metering on multi-residential dwellings;
• Evaluation of non-residential programs that have beenimplemented by various water utilities and publicationof results from such evaluations for sharing amongstwater utilities.
• Determining the influence of rainwater tanks on wateruse behaviour and total water demand. Understandingthe perceptions of the community about rainwatertanks and the motivating factors behind their willingnessto pay for rainwater tanks will provide valuableinformation to water utilities, enabling more informedprioritising of DM programs. This could also providewater utilities with an insight into the community’swillingness to pay, which could in turn be used toimprove the participation rate of demand managementprograms that are more cost effective than rainwatertanks.
• A collaborative research project focusing on sustainablesolutions for the three types of development(greenfield, backlog areas and infill) on a range of scales,
will prove valuable as it will help with the developmentof a consistent approach to water management in newdevelopments across all utilities. It will also provide animpetus to the development of a consistent set ofregulations and standards for decentralised systems,which are often part of the sustainable solution for suchdevelopments.
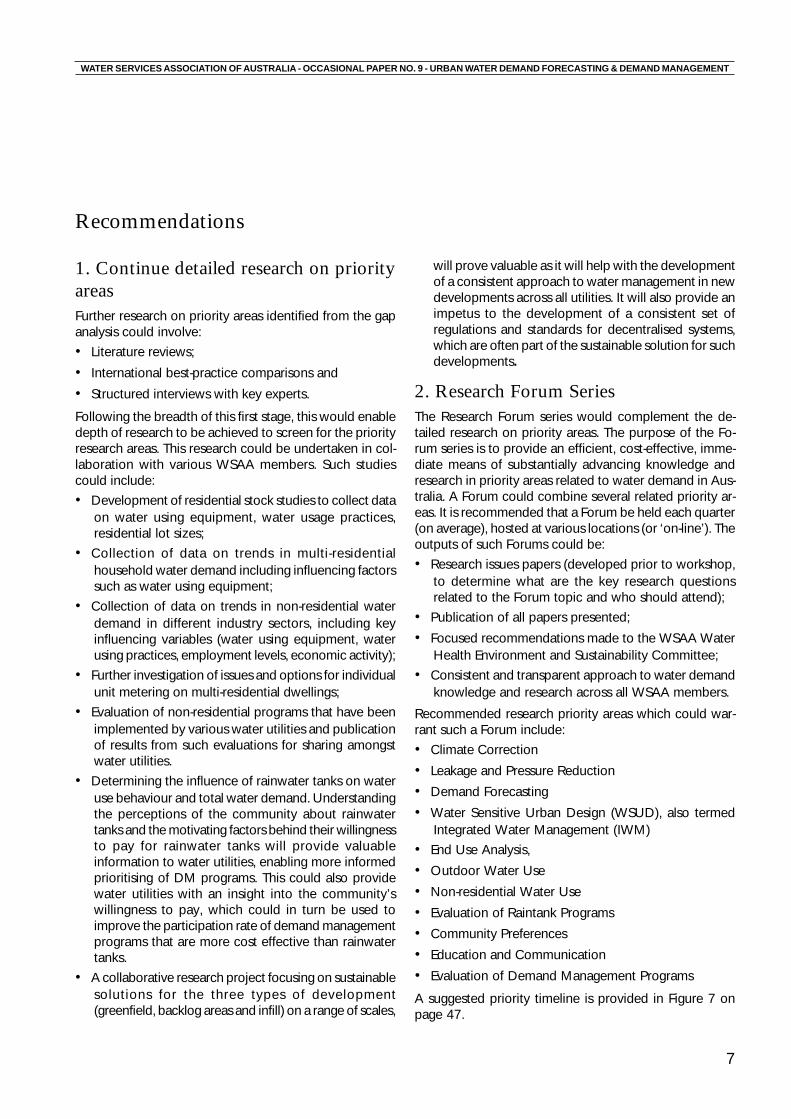
2. Research Forum SeriesThe Research Forum series would complement the de-tailed research on priority areas. The purpose of the Fo-rum series is to provide an efficient, cost-effective, imme-diate means of substantially advancing knowledge andresearch in priority areas related to water demand in Aus-tralia. A Forum could combine several related priority ar-eas. It is recommended that a Forum be held each quarter(on average), hosted at various locations (or ‘on-line’). Theoutputs of such Forums could be:
• Research issues papers (developed prior to workshop,to determine what are the key research questionsrelated to the Forum topic and who should attend);
• Publication of all papers presented;
• Focused recommendations made to the WSAA WaterHealth Environment and Sustainability Committee;
• Consistent and transparent approach to water demandknowledge and research across all WSAA members.
Recommended research priority areas which could war-rant such a Forum include:
• Climate Correction
• Leakage and Pressure Reduction
• Demand Forecasting
• Water Sensitive Urban Design (WSUD), also termedIntegrated Water Management (IWM)
• End Use Analysis,
• Outdoor Water Use
• Non-residential Water Use
• Evaluation of Raintank Programs
• Community Preferences
• Education and Communication
• Evaluation of Demand Management Programs
A suggested priority timeline is provided in Figure 7 onpage 47.
8
WATER SERVICES ASSOCIATION OF AUSTRALIA - OCCASIONAL PAPER NO. 9 - URBAN WATER DEMAND FORECASTING & DEMAND MANAGEMENT
RecommendationsContinued
3. Ongoing collaboration betweenWSAA and WSAA membersIt is recommended that WSAA coordinate the ongoingcollaboration of research on water demand. It is recom-mended that a framework or process be developed toensure such collaboration continues. This may work withinthe existing structure of the WSAA Water Health Environ-ment and Sustainability Committee. For example, over-seeing the recommendations emerging from the ResearchForums (described in 3 above) and updating the proposedCD (or website) as new research becomes available.
4. Continuation of WSAA CD/databaseof Demand Management StudiesThe studies presented in the report provide a partial pic-ture of Australian studies on factors influencing water de-mand. It is therefore recommended that further collationof relevant and significant studies be undertaken to presenta more complete picture. It is recommended that bothWSAA and non-WSAA members be contacted for furtherinformation. This database could be modelled on the NorthAmerican waterwiser.org, a web-based, interactive,searchable database. The database provides informationon demand management programs that are planned, im-plemented and evaluated across various water utilities inthe U.S. and Canada. The database allows the water util-ity to directly enter and update information about a DMprogram by logging in to the database. This database couldalso update the studies discussed in the Water WiseManual, incorporating results from evaluation studies thathave since been undertaken for various DM programs. Inaddition, details of participation rates and costs of imple-mentation of the programs could be included.
9
WATER SERVICES ASSOCIATION OF AUSTRALIA - OCCASIONAL PAPER NO. 9 - URBAN WATER DEMAND FORECASTING & DEMAND MANAGEMENT
1 Introduction
of water supplies. It is important that WSAA members arealert to the significance of these changes and their poten-tial to influence demand for water in Australia’s major cit-ies. Fundamental to this is a database of available reportsto evaluate the effects of these changes and their poten-tial effects on water demand.
An overall objective of this report has been qualitativeassessment, conducted where possible by the study team,of the extant reports in relation to overall validity, accu-racy and transferability of the results of studies of wateruse, as well as associated studies linking water use to thenumerous factors influencing water demand. These meas-urements and studies are essential to identifying emerg-ing trends in the growth of water demand, forecastingdemand and in preparing management initiatives. Mostof the existing current1 robust, comparable and consistentstudies on the factors influencing trends in water demandhave been reviewed.
Project 2 will focus on demand management and watersensitive urban designs, including effectiveness wherepossible, by highlighting significant programs of this kindthat have been undertaken in Australia. This informationis presented as an annotated bibliography on many of thesignificant demand management and water sensitive ur-ban design initiatives.
1.3 OutputsThe outputs of this project are:1. This report, including:
a. Historical context of urban demand managementboth internationally and within Australia.
b. Overview of significant research into factorsinfluencing water demand and demandmanagement initiatives.
c. Best practice characteristics, data gaps andrecommendations.
2. Collation of templates from key WSAA members andother significant contributors to research on demandmanagement in Australia.
3. Contacts and links to relevant key individuals/websites/publications.
4. Bibliography of all significant reports, projects, programsrelated to demand management.
5. Hyperlinked CD containing same content as report ina user-friendly and searchable format.
6. Workshop presentation to WSAA Water HealthEnvironment and Sustainability Committee to launchand explain outputs 1–5.
1 This refers to studies undertaken within the last ten years plusany other prior significant studies.
1.1 Project BackgroundSubstantial social changes in Australia over the past twentyyears have had an impact on the demand for urban wa-ter. These include, changes in demographics, land use,types of water-using appliances and trends toward loweroccupancy households and apartment living, particularlyin inner city areas. At the same time, pressure on urbanwater supplies has increased, owing to declining yield ofsystems and increasing demands for water allocations tothe environment. Therefore, the importance of and inter-est in demand management strategies has increased.
This project is designed to investigate research into fac-tors that influence demand and demand managementprograms that have been undertaken by the Australianwater industry, particularly Water Services Association ofAustralia (WSAA) members.
1.2 Objectives and ScopeThe objectives of this study are to provide support toWSAA in developing a research program that will enablewater service providers to better understand their custom-ers, their demand for water and how that is changing. Thiswill provide valuable information to use in planning andwill enable improved forecasting. It will provide valuableinput to the design of demand management programs.
In terms of scope, the study comprises two related projects:
Project 1: Analysis of factors influencing currentdemand for water and growth of demand inAustralia.This project involves the collation and documentation ofthe most valuable current knowledge and research on themajor factors influencing water demand and provides in-formation on recent changes where possible. Gaps in thedata and further research or initiatives that can best beundertaken at a national level by WSAA have been iden-tified.
Project 2: Review of demand managementinitiatives in Australia including information ontheir effectiveness.This project has involved the collation, preliminary reviewand assessment of demand management and water sen-sitive urban design initiatives. Where available, informa-tion on the effectiveness of these programs has been pro-vided.
Project 1 addresses the significant changes occurring indemographic, social, community attitude, economic andtechnological factors that have the potential to affectgrowth in water demand and consequently the reliability
10
WATER SERVICES ASSOCIATION OF AUSTRALIA - OCCASIONAL PAPER NO. 9 - URBAN WATER DEMAND FORECASTING & DEMAND MANAGEMENT
2 Urban Water Demand: History and Context2.1 History of Urban Water Demand Forecasting and Demand ManagementDemand forecasting became necessary as urbanpopulations dependent on public water supplies grew rap-idly. New demands for water could not always be met. Insome cases, water infrastructure required long lead timesto construct, requiring long planning horizons. In othercases, multiple options for water supply existed and theoptimal choice depended on understanding likely futurerequirements. In either case demand forecasting was ameans to optimise expansion of the water supply system.
Demand management developed in the United States,where it was termed “water conservation” in the mid tolate 1970s as a response to environmental concerns atthe time. It was consistent with the actions taken to re-duce energy use after the OPEC-induced supply reduc-tion of oil and price increases. However, managing de-mand for water was not seen as particularly valuable, aswater was perceived to be inexpensive. As well, reducingdemand was perceived to interfere with people’s right toconsume any amount they wished and could pay for.
Awareness gradually developed that reducing demand forwater was less expensive than adding water supply, oftensignificantly so. Some of the milestones in this processcan be represented in a timeline. The largest body of earlywork was completed in the late 1970s and early 1980s byDuane Bauman and PMCL for the U.S. Army Corps ofEngineers. Bill Maddaus of Brown and Caldwell led a studydone for the Housing and Urban Development Adminis-tration in the1980s, which pioneered the attempt to as-certain quantities of water used by household fixtures andappliances. This work was followed up in the 1990s bythe American Water Works Research Foundation studies,including one on Residential End Uses of Water, conductedby Bill Maddaus, PMCL and John O. Nelson.
Least Cost Planning, which is associated in Australia withthe water industry, was developed for the electricity in-dustry in the U.S. in the 1980s (Mieir et al, 1983) to com-pare energy conservation programs with increased gen-eration as sources of supply. The principles of LCP havebeen transferred to planning other large infrastructure sys-tems including water (Beecher, 1996; Dziegielewski et al,1993) wastewater (Howe and White, 1999) and gas(Greenberg and Harshbarger, 1993) and even to trans-port (Victoria Transport Policy Institute, 2003) ). See Box1 for the principles of LCP.
Early work on demand management in Australia includedan Australian Water Resources Council Project (AWRC72/41) proposed by Peter Dunk of the then State Riversand Water Supply Commission in 1971. It was called “ef-ficiency in domestic, municipal and industrial water use”.In 1972, Monash University worked on the “quantity”aspects of water supply and researchers at the University
of Wollongong looked at water “demand elasticity”.
Practical implementation of demand management strate-gies in Australia started with the introduction of chargesbased on water usage by the (then) Water Authority ofWestern Australia and Hunter Water (NSW) in the early1980s.
Dual flush toilets to conserve water were made compul-sory in Victoria in the mid 1980s and other States followed.
Box 1: Least Cost Planning (LCP) / IntegratedResource Planning (IRP)Least Cost Planning (Beecher, 1995) is a process thatinvolves several steps, including: 1. end-use analysis, 2.demand forecasting, 3. the design and modelling of demand management
programs, 4. estimating water savings achievable from programs, 5. evaluating costs of achieving water savings, 6. estimating conventional supply costs, 7.developing and costing alternative supply options if
applicable, 8. cost benefit analysis of all options, 9. consideration of environmental externalities,10. sensitivity analysis and11. reporting.
Detailed end-use modelling of how a supplied resource(energy or water) is used by customers provides a morerigorous basis for demand forecasting and allows forboth the development and evaluation of demand man-agement programs, in particular, end-use efficiency.More rigorous demand forecasts also provide betterestimates of the future costs of conventional supplyaugmentation. Results are often expressed in presentvalue terms to take account of both capital and oper-ating costs, and in terms of cost per unit supplied (orconserved) to allow direct comparison of demandmanagement measures relative to increased supply.
LCP and ‘Integrated Resource Planning’ are often seenas synonymous. However, although both involve con-sideration of demand management for meeting futureservice needs, IRP provides a broader framework intowhich LCP fits. Over time, an IRP process should seethe iterative re-application of LCP as part of a cycle ofevaluating and assessing options, investing in selectedoptions, assessing conservation results and demandforecasts and re-evaluating options.
11
WATER SERVICES ASSOCIATION OF AUSTRALIA - OCCASIONAL PAPER NO. 9 - URBAN WATER DEMAND FORECASTING & DEMAND MANAGEMENT
Urban Water Demand:History and Context
Continued
Educational programs such as “Don’t be a Wally withWater” commenced in the 1980s.The first Perth water usestudy was carried out in the in the late 1980s and it was amilestone of research at the time.
Since the 1980s, a growing number of urban water utili-ties in Australia have invested significant funds in demandmanagement programs throughout the country. The driv-ers for implementing programs have included: the highcosts of water supply and distribution; rapid populationgrowth (including tourism); licence conditions required bygovernment; the benefits of deferring capital works andthe benefits of downsizing sewage treatment plant up-grades (White, 2001). The measures associated with de-mand management programs vary as shown in Box 2, whilesome evaluation approaches are outlined in Box 3. Al-though it has been true for a long time in many countriesthat reducing demand for water is less expensive thanadding supply, it is in Australia that some of the more se-
rious efforts are now being made to treat demand man-agement as the principal supply option. This has comeabout in part through recent applications of Least CostPlanning techniques in the Australian water industry. Bet-ter methods for cost comparisons, including the use of“levelised cost”. (See Box 4) have been a further refine-ment of LCP methods.
Box 3: Evaluation of DM programsEvaluation of DM programs after implementation allowstheir effectiveness to be assessed and helps in the de-sign of programs. This can be done in a number of waysbut it is important that as far as possible, the methodol-ogy allows for changes in demand to be attributed toparticular actions. This requires researchers to take intoaccount other factors which impact on demand, suchas climate.
One way this is commonly achieved is through the useof participant and control groups. By analysing groupsthat are as similar as possible, except for the participa-tion of one group in the DM Program, it is possible toevaluate what savings resulted from that program. Thedifference in water use between the two groups willindicate the savings due to the program, irrespective ofother factors that may influence water use.
Most importantly, evaluation should be planned duringprogram design and particularly before implementation.There may be steps that need to be taken during theprogram (for example meter identification) to make theevaluation possible.
Box 4: Cost comparisons, levelised costLevelised cost is a means of describing the unit cost ofa demand management option. The present value ofstream of investment, which may vary in time and in-cludes the costs to both the utility and customers, isdivided by the present value of the stream of demandthat is met by the option (in the case of a supply op-tion) or the demand that is reduced in the case of ademand management option. This allows for the factthat this quantity also is often varying in time.
(Fane et al, 2002). This measure of unit cost can beused to compare quite different options (e.g newsources, reuse, leakage reduction, equipment retrofit-ting) on an equal basis, and if the benefits are included,can be used to compare the net unit cost of options.
Box 2: Demand Management TermsDemand management options are a combination of ameasure and an instrument.
Measures increase water efficiency (e.g. AAA ratedshowerheads), source substitution (e.g. rainwater tankinstallation) or combine the two in alternative systemconfigurations (e.g. greywater reuse system), and caninclude influencing behaviour such as watering times.
Instruments are used to assist in achieving the adoptionof a measure. They can be categorised as regulatory,economic or communicative. For example, a residen-tial retrofit option could include the measures of AAArated showerheads, tap aerators and leak reduction withthe economic incentive of a rebate or a discounted visitby a plumber arranged by the water utility. The samewater efficiency measures could be combined with aregulatory instrument in the form of building regulationsmandating the installation of water efficient fixtures orminimum appliance efficiency standards at point of sale.They could also be combined with a communicativemeasure in the form of a brochure advising on savingwater in the home or a demonstration water efficientgarden. The three options differ in their savings and costs.They should be compared under a least cost planning(LCP) framework so that investment in the options withthe least total cost to the community can be made.
Options combine an instrument and a measure.
Programs consist of a selected group of options.
12
WATER SERVICES ASSOCIATION OF AUSTRALIA - OCCASIONAL PAPER NO. 9 - URBAN WATER DEMAND FORECASTING & DEMAND MANAGEMENT
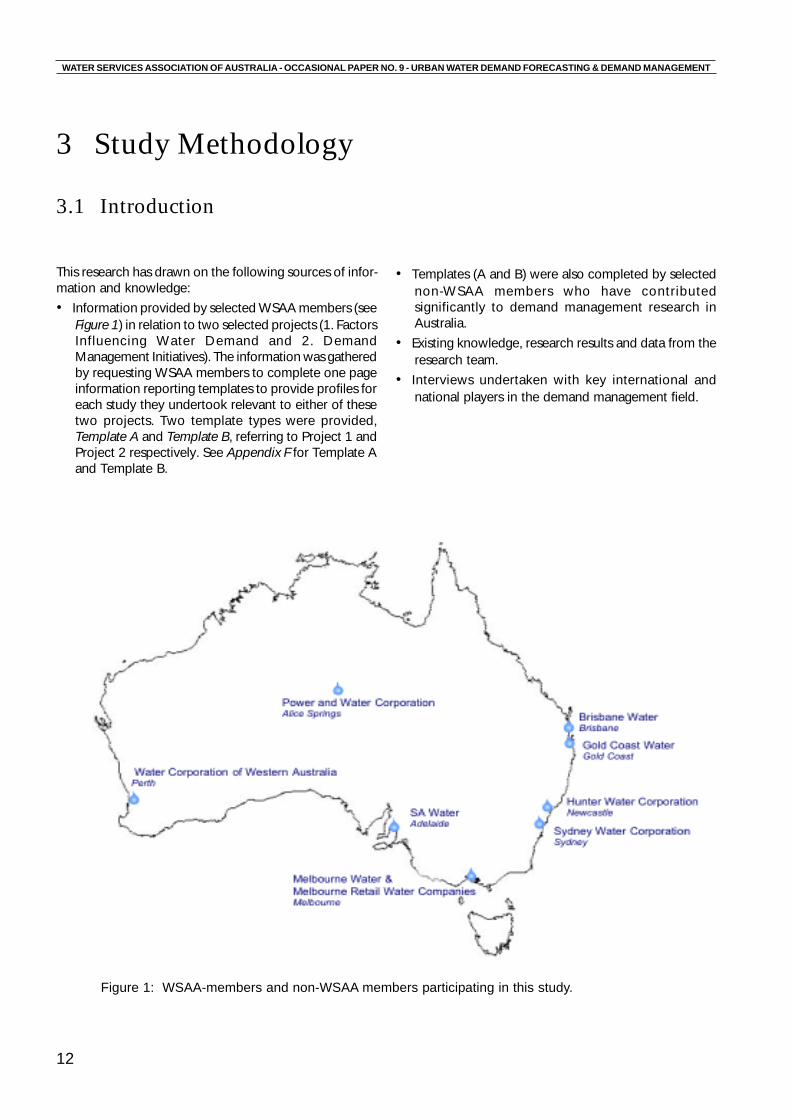
Figure 1: WSAA-members and non-WSAA members participating in this study.
3 Study Methodology
3.1 Introduction
This research has drawn on the following sources of infor-mation and knowledge:
• Information provided by selected WSAA members (seeFigure 1) in relation to two selected projects (1. FactorsInfluencing Water Demand and 2. DemandManagement Initiatives). The information was gatheredby requesting WSAA members to complete one pageinformation reporting templates to provide profiles foreach study they undertook relevant to either of thesetwo projects. Two template types were provided,Template A and Template B, referring to Project 1 andProject 2 respectively. See Appendix F for Template Aand Template B.
• Templates (A and B) were also completed by selectednon-WSAA members who have contributedsignificantly to demand management research inAustralia.
• Existing knowledge, research results and data from theresearch team.
• Interviews undertaken with key international andnational players in the demand management field.
13
WATER SERVICES ASSOCIATION OF AUSTRALIA - OCCASIONAL PAPER NO. 9 - URBAN WATER DEMAND FORECASTING & DEMAND MANAGEMENT
Study MethodologyContinued
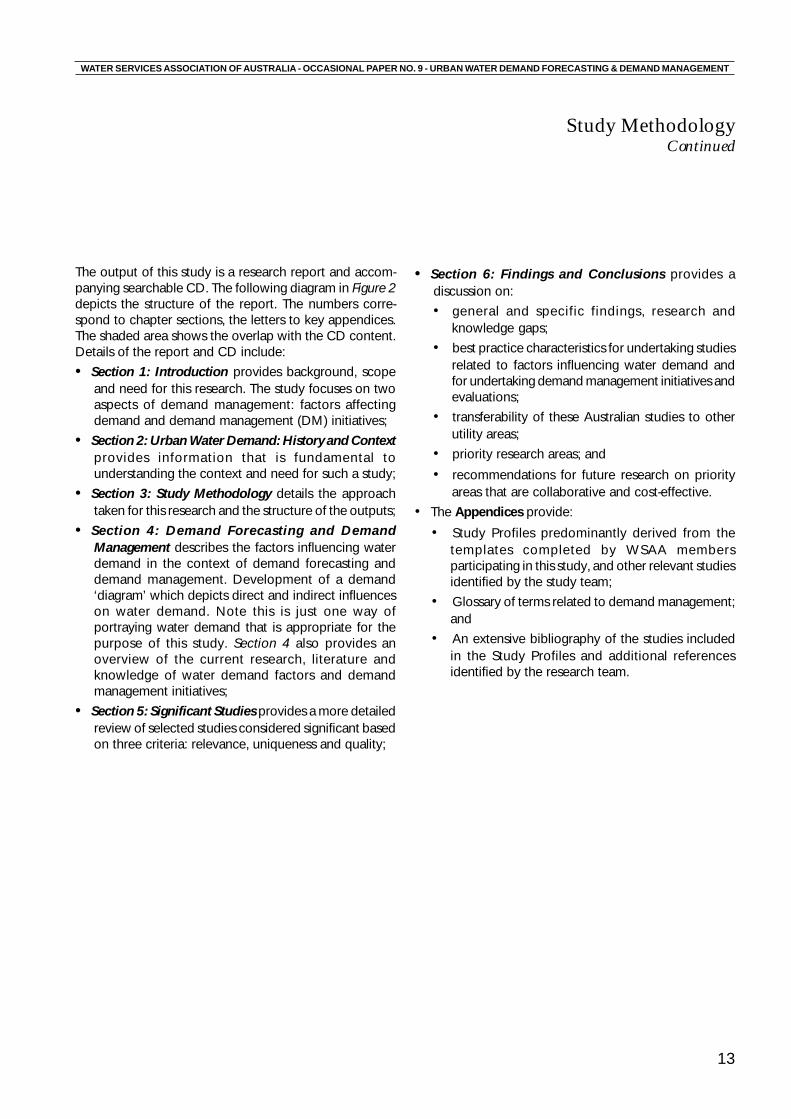
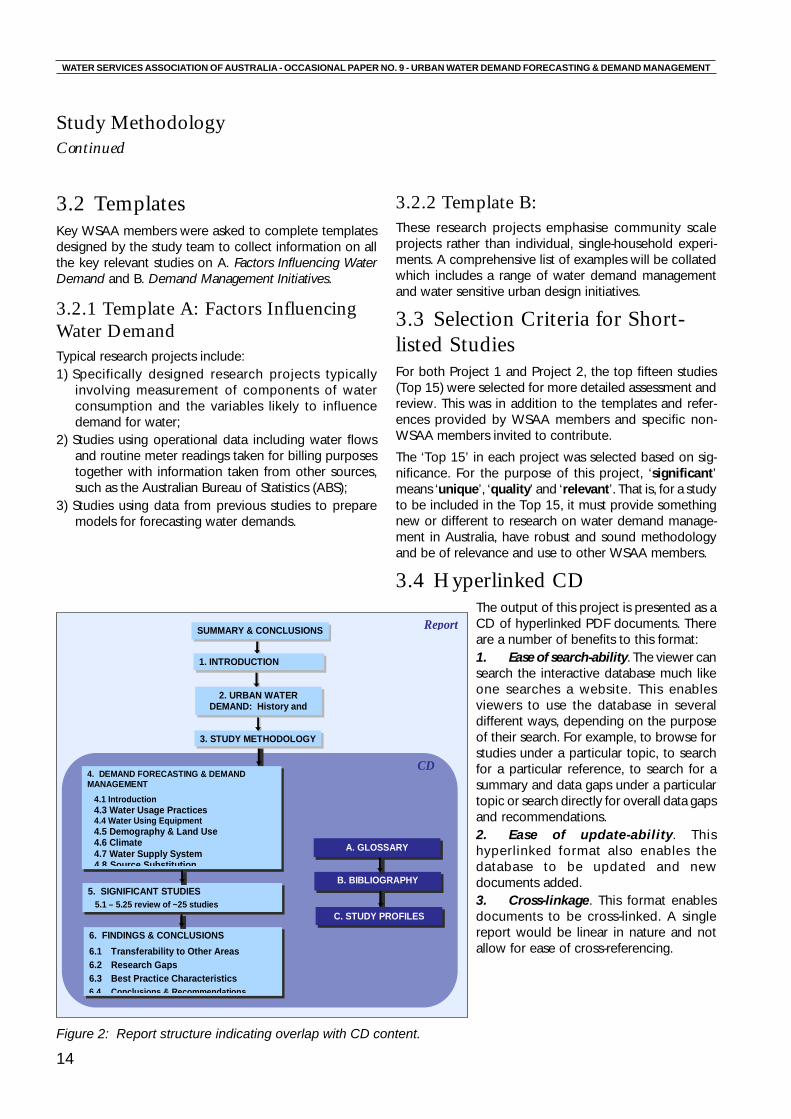
The output of this study is a research report and accom-panying searchable CD. The following diagram in Figure 2depicts the structure of the report. The numbers corre-spond to chapter sections, the letters to key appendices.The shaded area shows the overlap with the CD content.Details of the report and CD include:
• Section 1: Introduction provides background, scopeand need for this research. The study focuses on twoaspects of demand management: factors affectingdemand and demand management (DM) initiatives;
• Section 2: Urban Water Demand: History and Contextprovides information that is fundamental tounderstanding the context and need for such a study;
• Section 3: Study Methodology details the approachtaken for this research and the structure of the outputs;
• Section 4: Demand Forecasting and DemandManagement describes the factors influencing waterdemand in the context of demand forecasting anddemand management. Development of a demand‘diagram’ which depicts direct and indirect influenceson water demand. Note this is just one way ofportraying water demand that is appropriate for thepurpose of this study. Section 4 also provides anoverview of the current research, literature andknowledge of water demand factors and demandmanagement initiatives;
• Section 5: Significant Studies provides a more detailedreview of selected studies considered significant basedon three criteria: relevance, uniqueness and quality;
• Section 6: Findings and Conclusions provides adiscussion on:
• general and specific findings, research andknowledge gaps;
• best practice characteristics for undertaking studiesrelated to factors influencing water demand andfor undertaking demand management initiatives andevaluations;
• transferability of these Australian studies to otherutility areas;
• priority research areas; and
• recommendations for future research on priorityareas that are collaborative and cost-effective.
• The Appendices provide:
• Study Profiles predominantly derived from thetemplates completed by WSAA membersparticipating in this study, and other relevant studiesidentified by the study team;
• Glossary of terms related to demand management;and
• An extensive bibliography of the studies includedin the Study Profiles and additional referencesidentified by the research team.
14
WATER SERVICES ASSOCIATION OF AUSTRALIA - OCCASIONAL PAPER NO. 9 - URBAN WATER DEMAND FORECASTING & DEMAND MANAGEMENT
4. DEMAND FORECASTING & DEMAND MANAGEMENT
4.1 Introduction 4.3 Water Usage Practices 4.4 Water Using Equipment 4.5 Demography & Land Use 4.6 Climate 4.7 Water Supply System 4 8 Source Substitution
Report
CD
3. STUDY METHODOLOGY
2. URBAN WATER DEMAND: History and
SUMMARY & CONCLUSIONS
1. INTRODUCTION
5. SIGNIFICANT STUDIES 5.1 – 5.25 review of ~25 studies
6. FINDINGS & CONCLUSIONS 6.1 Transferability to Other Areas 6.2 Research Gaps 6.3 Best Practice Characteristics 6 4 Conclusions & Recommendations
A. GLOSSARY
B. BIBLIOGRAPHY
C. STUDY PROFILES
Figure 2: Report structure indicating overlap with CD content.
Study MethodologyContinued
3.2 TemplatesKey WSAA members were asked to complete templatesdesigned by the study team to collect information on allthe key relevant studies on A. Factors Influencing WaterDemand and B. Demand Management Initiatives.
3.2.1 Template A: Factors InfluencingWater DemandTypical research projects include:1) Specifically designed research projects typically
involving measurement of components of waterconsumption and the variables likely to influencedemand for water;
2) Studies using operational data including water flowsand routine meter readings taken for billing purposestogether with information taken from other sources,such as the Australian Bureau of Statistics (ABS);
3) Studies using data from previous studies to preparemodels for forecasting water demands.
3.2.2 Template B:These research projects emphasise community scaleprojects rather than individual, single-household experi-ments. A comprehensive list of examples will be collatedwhich includes a range of water demand managementand water sensitive urban design initiatives.
3.3 Selection Criteria for Short-listed StudiesFor both Project 1 and Project 2, the top fifteen studies(Top 15) were selected for more detailed assessment andreview. This was in addition to the templates and refer-ences provided by WSAA members and specific non-WSAA members invited to contribute.
The ‘Top 15’ in each project was selected based on sig-nificance. For the purpose of this project, ‘significant’means ‘unique’, ‘quality’ and ‘relevant’. That is, for a studyto be included in the Top 15, it must provide somethingnew or different to research on water demand manage-ment in Australia, have robust and sound methodologyand be of relevance and use to other WSAA members.
3.4 Hyperlinked CDThe output of this project is presented as aCD of hyperlinked PDF documents. Thereare a number of benefits to this format:1. Ease of search-ability. The viewer cansearch the interactive database much likeone searches a website. This enablesviewers to use the database in severaldifferent ways, depending on the purposeof their search. For example, to browse forstudies under a particular topic, to searchfor a particular reference, to search for asummary and data gaps under a particulartopic or search directly for overall data gapsand recommendations.2. Ease of update-ability . Thishyperlinked format also enables thedatabase to be updated and newdocuments added.3. Cross-linkage. This format enablesdocuments to be cross-linked. A singlereport would be linear in nature and notallow for ease of cross-referencing.
15
WATER SERVICES ASSOCIATION OF AUSTRALIA - OCCASIONAL PAPER NO. 9 - URBAN WATER DEMAND FORECASTING & DEMAND MANAGEMENT
4. Water Demand & Demand Management Initiatives
4.1 IntroductionSection 4.1 describes factors influencing water demand inthe context of demand forecasting and demand manage-ment. The following Sections 4.2 – 4.7 each provide anoverview of the research, literature and current knowledgeon factors which influence water demand. The informa-tion draws on the Study Profiles (completed templates)collated from specific WSAA members, additional profilesof studies identified by the research team and the expertknowledge of the research team. The knowledge gapsidentified by this review could be used by WSAA andWSAA members to focus their research in a collaborativeand efficient way.
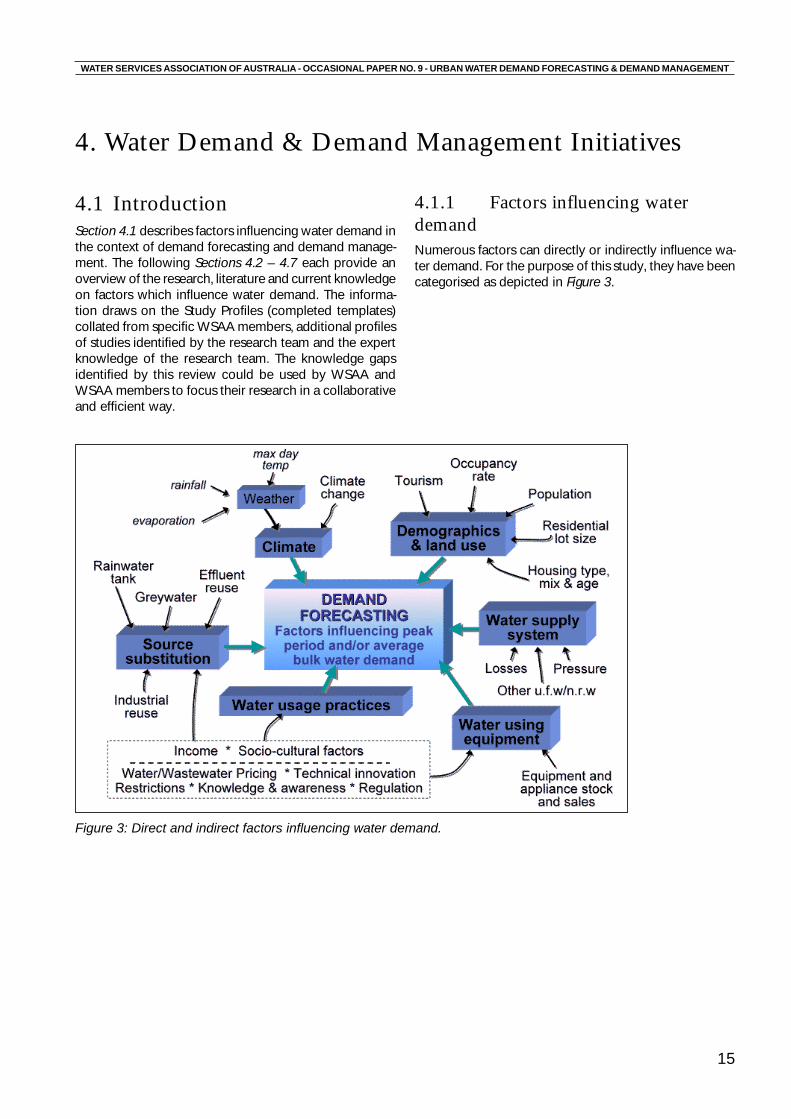
4.1.1 Factors influencing waterdemandNumerous factors can directly or indirectly influence wa-ter demand. For the purpose of this study, they have beencategorised as depicted in Figure 3.
Figure 3: Direct and indirect factors influencing water demand.
16
WATER SERVICES ASSOCIATION OF AUSTRALIA - OCCASIONAL PAPER NO. 9 - URBAN WATER DEMAND FORECASTING & DEMAND MANAGEMENT
Water Demand andDemand Management InitiativesContinued
Some of these factors are direct and perhaps more signifi-cant than others. Both the current level of influence ofthese factors on water demand and the specific trends inthese factors are of great interest in forecasting demandand developing a demand management program. The fac-tors discussed in detail later in this Section include:
• water usage practices (including pricing, regulationrestrictions, income levels, socio-cultural factors,knowledge and awareness, technical innovation andpresence of water service companies);
• water using equipment;
• demographics and land use;
• climate;
• water supply system; and
• source substitution.
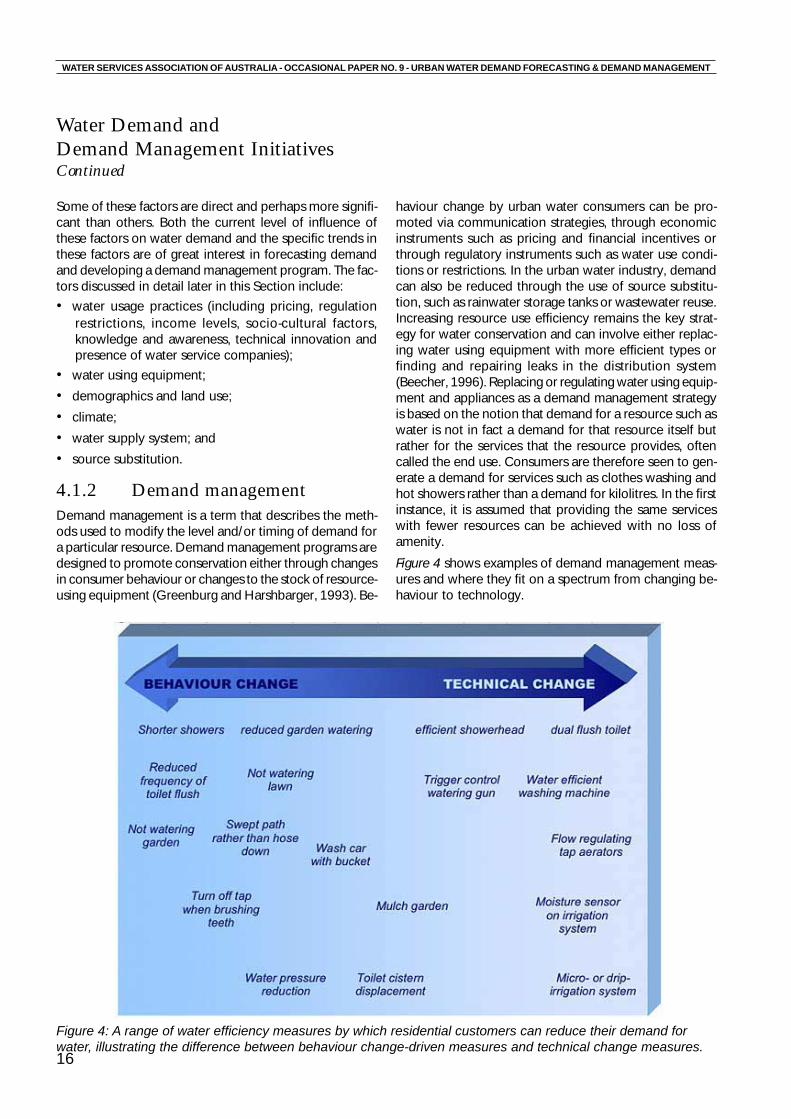
4.1.2 Demand managementDemand management is a term that describes the meth-ods used to modify the level and/or timing of demand fora particular resource. Demand management programs aredesigned to promote conservation either through changesin consumer behaviour or changes to the stock of resource-using equipment (Greenburg and Harshbarger, 1993). Be-
haviour change by urban water consumers can be pro-moted via communication strategies, through economicinstruments such as pricing and financial incentives orthrough regulatory instruments such as water use condi-tions or restrictions. In the urban water industry, demandcan also be reduced through the use of source substitu-tion, such as rainwater storage tanks or wastewater reuse.Increasing resource use efficiency remains the key strat-egy for water conservation and can involve either replac-ing water using equipment with more efficient types orfinding and repairing leaks in the distribution system(Beecher, 1996). Replacing or regulating water using equip-ment and appliances as a demand management strategyis based on the notion that demand for a resource such aswater is not in fact a demand for that resource itself butrather for the services that the resource provides, oftencalled the end use. Consumers are therefore seen to gen-erate a demand for services such as clothes washing andhot showers rather than a demand for kilolitres. In the firstinstance, it is assumed that providing the same serviceswith fewer resources can be achieved with no loss ofamenity.
Figure 4 shows examples of demand management meas-ures and where they fit on a spectrum from changing be-haviour to technology.
Figure 4: A range of water efficiency measures by which residential customers can reduce their demand forwater, illustrating the difference between behaviour change-driven measures and technical change measures.
17
WATER SERVICES ASSOCIATION OF AUSTRALIA - OCCASIONAL PAPER NO. 9 - URBAN WATER DEMAND FORECASTING & DEMAND MANAGEMENT
Water Demand andDemand Management Initiatives
Continued
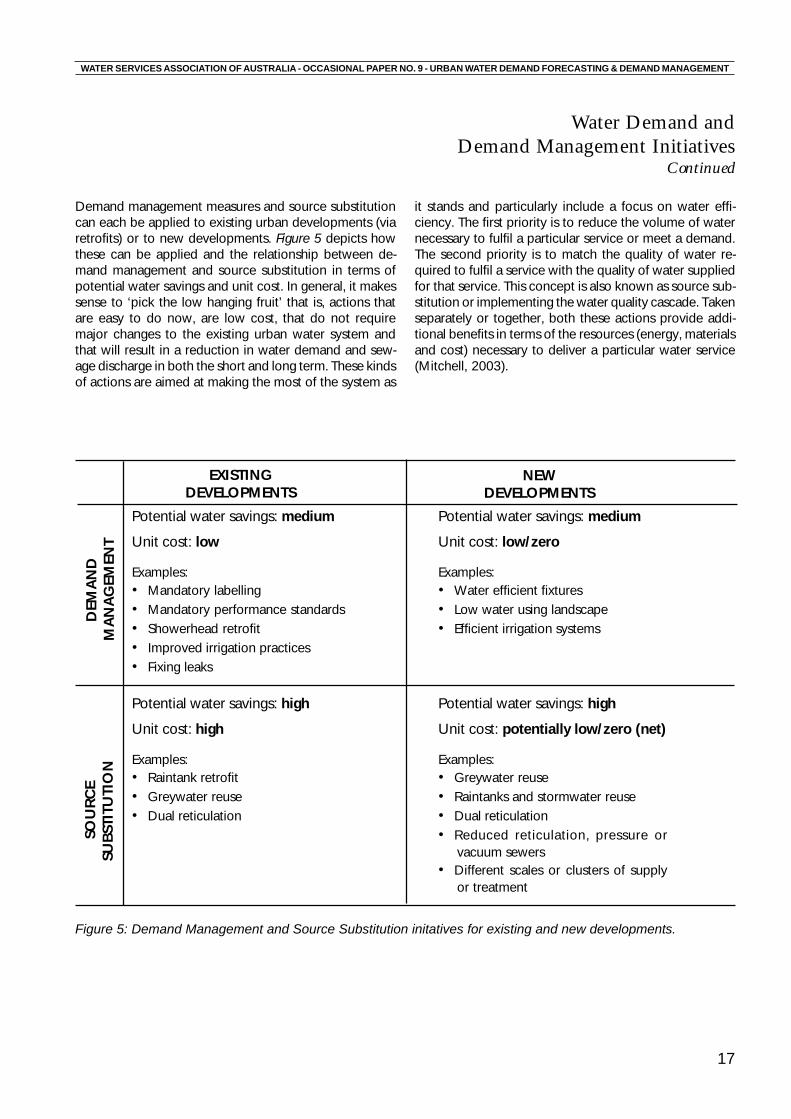
Demand management measures and source substitutioncan each be applied to existing urban developments (viaretrofits) or to new developments. Figure 5 depicts howthese can be applied and the relationship between de-mand management and source substitution in terms ofpotential water savings and unit cost. In general, it makessense to ‘pick the low hanging fruit’ that is, actions thatare easy to do now, are low cost, that do not requiremajor changes to the existing urban water system andthat will result in a reduction in water demand and sew-age discharge in both the short and long term. These kindsof actions are aimed at making the most of the system as
Figure 5: Demand Management and Source Substitution initatives for existing and new developments.
it stands and particularly include a focus on water effi-ciency. The first priority is to reduce the volume of waternecessary to fulfil a particular service or meet a demand.The second priority is to match the quality of water re-quired to fulfil a service with the quality of water suppliedfor that service. This concept is also known as source sub-stitution or implementing the water quality cascade. Takenseparately or together, both these actions provide addi-tional benefits in terms of the resources (energy, materialsand cost) necessary to deliver a particular water service(Mitchell, 2003).
EXISTINGDEVELOPMENTS
NEWDEVELOPMENTS
DEM
AN
DM
AN
AG
EMEN
TSO
UR
CE
SUB
STIT
UTI
ON
Potential water savings: high
Unit cost: potentially low/zero (net)
Examples:• Greywater reuse• Raintanks and stormwater reuse• Dual reticulation• Reduced reticulation, pressure or
vacuum sewers• Different scales or clusters of supply
or treatment
Potential water savings: high
Unit cost: high
Examples:• Raintank retrofit• Greywater reuse• Dual reticulation
Potential water savings: medium
Unit cost: low/zero
Examples:• Water efficient fixtures• Low water using landscape• Efficient irrigation systems
Potential water savings: medium
Unit cost: low
Examples:• Mandatory labelling• Mandatory performance standards• Showerhead retrofit• Improved irrigation practices• Fixing leaks
18
WATER SERVICES ASSOCIATION OF AUSTRALIA - OCCASIONAL PAPER NO. 9 - URBAN WATER DEMAND FORECASTING & DEMAND MANAGEMENT
Water Demand andDemand Management InitiativesContinued
4.1.3 Demand forecastingThis section addresses demand forecasting: why accuratedemand forecasting in important, what influences demandand best practice characteristics for modelling and fore-casting demand.
4.1.3.1 Demand projectionTraditionally, demand forecasting was undertaken by ei-ther extrapolating historic trends of per capita consump-tion or using multiple regression techniques incorporatinga range of variables such as population, income, price ofwater and periods of restrictions. Such models are usefulfor assessing historical demand and for providing a base-line to compare demand after implementation of a de-mand management program. However, what was impor-tant in the past may not be as important in the future,because of changes in behaviour or technology and boththese approaches often result in oversupply. They are lim-ited in their ability to project demand into the future dueto the aggregated nature of the variables.
Approaches based on historical trends have an importantrole but should not be the sole way of forecasting de-mand. If we do not know how much water consumersuse for different purposes and which uses we might beable to influence, it is very hard to design relevant andeffective demand management and efficiency programs.End use analysis allows us to focus on what is important.
4.1.3.2 End use analysisEnd use analysis (EUA) provides a mechanism for under-standing how and where water is used, for choosing themost effective demand management measures and esti-mating the water savings they will yield. End use analysisfocuses on the factors and technologies that affect wateruse, including emerging trends, relying less on historictrends.
End use analysis involves disaggregating demand into the‘services’ for which people use water. This perspective isconsistent with the principle of a utility providing a service(e.g. clean clothes) rather than a commodity (water) andit assumes that providing the same service with less waterprovides the same amenity to the consumer. For exam-ple, end uses for the residential sector can be broadly bro-ken down into indoor and outdoor and further sub-dividedinto specific uses such as toilets, showers, clothes wash-ers, garden watering and so on. EUA keeps the focus onwhat consumers need.
Ideally, the consumption attributable to these end usesshould be modelled on the ownership, technical and us-age characteristics, utilising a stock modelling approach.This is most readily applicable to the residential sectorbecause of the similarity of end uses in houses, whereasin the non-residential sector the diversity of activities canmake it more difficult to apply. End use modelling allowsfor likely future trends in technical efficiency improvementsand household characteristics to be taken into account.
Stock X Usage X Technology = Water use
Demand for each end use is calculated based on theownership of appliances, usage patterns and technologies.
The total demand is the aggregate of the demands for thespecific end uses. It is important that where possible,modelled figures are calibrated or tested against meas-ured results.
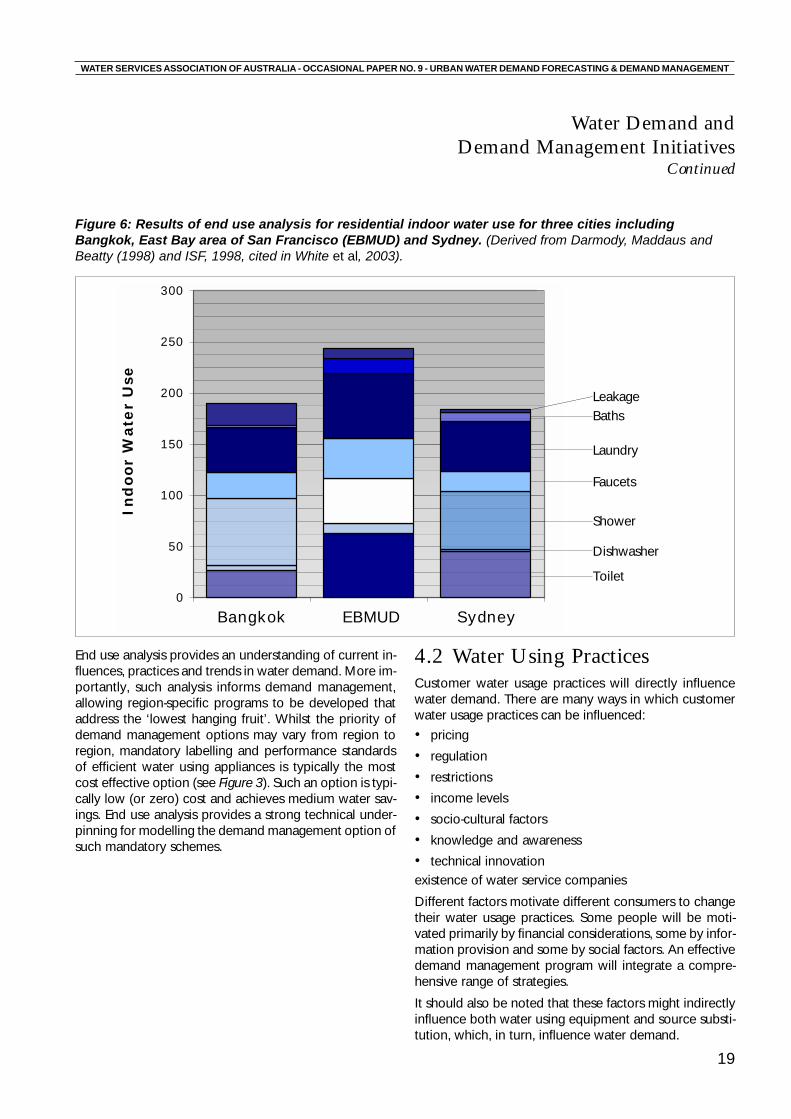
The following diagram, (Figure 6) shows residential indoorwater use disaggregated by end use, for three cities: Bang-kok, Sydney and East Bay of San Francisco (EBMUD). Thedifferences in end use water demand between the regionsillustrates the importance of collecting and analysing re-gion-specific end use data. It is not always appropriate totranspose data from one region to a different study re-gion (that is, to use ‘secondary’ data). The collection ofprimary end use data is considered more accurate thanthe use of secondary data, however, this is only true if ithas been collected using a sound study design and appro-priate data collection technique (Cordell and Robinson,2003).
19
WATER SERVICES ASSOCIATION OF AUSTRALIA - OCCASIONAL PAPER NO. 9 - URBAN WATER DEMAND FORECASTING & DEMAND MANAGEMENT
Water Demand andDemand Management Initiatives
Continued
Figure 6: Results of end use analysis for residential indoor water use for three cities includingBangkok, East Bay area of San Francisco (EBMUD) and Sydney. (Derived from Darmody, Maddaus andBeatty (1998) and ISF, 1998, cited in White et al, 2003).
End use analysis provides an understanding of current in-fluences, practices and trends in water demand. More im-portantly, such analysis informs demand management,allowing region-specific programs to be developed thataddress the ‘lowest hanging fruit’. Whilst the priority ofdemand management options may vary from region toregion, mandatory labelling and performance standardsof efficient water using appliances is typically the mostcost effective option (see Figure 3). Such an option is typi-cally low (or zero) cost and achieves medium water sav-ings. End use analysis provides a strong technical under-pinning for modelling the demand management option ofsuch mandatory schemes.
4.2 Water Using PracticesCustomer water usage practices will directly influencewater demand. There are many ways in which customerwater usage practices can be influenced:
• pricing
• regulation
• restrictions
• income levels
• socio-cultural factors
• knowledge and awareness
• technical innovationexistence of water service companies
Different factors motivate different consumers to changetheir water usage practices. Some people will be moti-vated primarily by financial considerations, some by infor-mation provision and some by social factors. An effectivedemand management program will integrate a compre-hensive range of strategies.
It should also be noted that these factors might indirectlyinfluence both water using equipment and source substi-tution, which, in turn, influence water demand.
0
50
100
150
200
250
300
1 2 3
Ind
oor
Wate
r U
se
Bangkok EBMUD Sydney
Leakage
Laundry
Faucets
Shower
Dishwasher
Toilet
Baths
20
WATER SERVICES ASSOCIATION OF AUSTRALIA - OCCASIONAL PAPER NO. 9 - URBAN WATER DEMAND FORECASTING & DEMAND MANAGEMENT
2 There are estimates of these savings in the U.S., in relation tothe Federal Energy Act (1994), which regulated the efficiency ofa range of water using appliances (see Maddaus and Dickinson,2002). Estimates of the savings from shower head regulation inAustralia have been provided by Day and White (2002).
Water Demand andDemand Management InitiativesContinued
4.2.1 PricingChanges in the pricing structure of water can affect waterconsumption. A sound pricing policy should be cost-re-flective to allocate resources efficiently, while at the sametime generating sufficient revenue. In Australia, policieson water pricing vary from State to State and from utilityto utility. Historically, prices charged by water utilities haverarely been cost-reflective but reforms initiated as part ofthe Council of Australian Governments process havechanged this practice.
Several studies of the effects of pricing on water demandhave been undertaken in Australia (see for example Dandy,1997). Some indicate that whilst outdoor water use ex-hibits a degree of price elasticity, the elasticity of indooruse is typically low or non-existent. Techniques used tomeasure impact of price have varied from the contingentvaluation technique, to the use of quantitative monitoringand evaluation of metered data using climate correctionto remove impacts of the climate variables. See for in-stance, Study 1: Water Pricing Impacts Study (MontgomeryWatson, 1997) (Section 5).
4.2.2 RegulationFor the purpose of this study, regulation and regulatorymeasures include the use of building controls and appli-ance performance standards. Other measures includemandatory water efficiency labelling of appliances, whichcould provide a basis for regulation of the performance ofthese appliances. A voluntary version of this is currently inplace and investigations of a mandatory scheme areunderway. Some local councils, such as Marrickville Coun-cil in Sydney, have introduced development control plansrequiring AAA-rated showers and taps in new dwellingsand major renovations. Few studies in Australia2 have di-rectly measured the impact of such regulation on waterusage patterns and water using equipment, however somerelationships are evident from studies that look at stocksof water efficient appliances in areas in which have regu-lated the use of such appliances. Most notable is the adop-tion rate of dual flush toilets following the regulation oftheir use in many parts of Australia in the early 1990s.Dual flush toilets now represent over 50 per cent of thestock in most cities.
4.2.3 RestrictionsWater restrictions include the use of voluntary or manda-tory regulation of water-using practices by customers. Thisincludes short-term water use restrictions, such as thoseused during drought periods. Most water utilities haveimposed water restrictions as a drought response at sometime. Mandatory restrictions tend to yield more reliablewater savings, although they can be time consuming andcostly to enforce (White et al, 2000). Drought restrictionsusually have a greater influence on outdoor water usethan indoor. Other drought response planning strategiescan include:
• Rationing. Includes short-term water allocations basedon local area, per capita or across the board.
• Pricing. Includes inclining block tariffs, scarcity pricing,seasonal rates and fines.
• Education and Communication. Includes workshops,media advertising, establishing a drought informationcentre and telephone hotline. This strategy is oftenconsidered more acceptable to customers and isconsistent with other demand management programs.However, it may not effectively target all customergroups and predicting water savings can be uncertain,which in turn can make planning problematic in termsof justifying costs.
• Mitigation. Implementing a demand managementstrategy in advance of a drought will reduce the severityof water shortages. Like education and communication,this approach often has a high level of customeracceptability and supports other objectives forimplementing demand management programs.
• Operational improvements. Includes improvements tothe water supply infrastructure, such as reducing mainspressure or implementing a more rapid response toreported leaks.
• Supply-side options. The use of alternative water supplysources during shortage periods, such as groundwater,alternative storage dams or desalination.
4.2.4 Income levelsHousehold income may influence ownership levels ofappliances and fixtures and therefore affect water usagepatterns. For example, during the 1960s the increase inownership of automatic top loading washing machinescorrelated significantly with rising levels of disposablehousehold income, increasing water demand for this enduse as these machines replaced less water intensive wash-ing methods such as handwashing, twin tubs and wringermachines. A current example is the rise in the number ofautomatic reticulated sprinkler systems in some areas.
21
WATER SERVICES ASSOCIATION OF AUSTRALIA - OCCASIONAL PAPER NO. 9 - URBAN WATER DEMAND FORECASTING & DEMAND MANAGEMENT
Water Demand andDemand Management Initiatives
ContinuedHowever, there is no automatic link between increasingincome (longitudinal) and rising water use. Spending onnewer, more efficient appliances may in fact result in areduction in water use as they replace older units. Incomeis usually not considered specifically in end use model-ling, as it is implicit in the forecast change in the stock ofappliances and the efficiency of those appliances. How-ever, in relation to cross-sectional studies addressing in-come and water use, the Perth DWUS (Loh & Coghlan,2003) does indicate a strong relationship between incomelevel and outdoor water use. This result is derived from across-sectional study and cannot be translated into a con-clusion that increasing affluence in the community is nec-essarily linked to increasing water use over time.
4.2.5 Socio-cultural factorsSocio-cultural factors can influence water usage practices,including the willingness to adopt water efficient equip-ment as well as general water using behaviour. An exam-ple of these kinds of studies is provided by work from theAustralian Research Centre for Water in Society (ARCWIS)based at CSIRO Land and Water and customer researchundertaken by Sydney Water Corporation. Another recentset of studies aiming to assess customer perceptions wasthe Customer Value Study (Qualitative and Quantitative)and the Customer Preferences on Water Resource Issues.These studies are described in more detail in Section 5.3Study 2: Customer Value Studies and Customer Prefer-ences on Water Resource Issues (Chong, 2001a; Chong,2001b).
4.2.6 Knowledge and awarenessEducation and communication strategies are often de-signed to influence water demand patterns. These can takevarious forms such as educational materials distributed bywater providers or the use of water efficiency labelling. Itcan be difficult to determine the effectiveness of an edu-cation and awareness strategy because it is often part of alarger program implemented to reduce water demand,such as new pricing structures, a rebate program or droughtrestrictions. Few, if any, studies have been undertaken inAustralia to quantify the effectiveness of such programs.
4.2.7 Technical innovationThis includes innovation by industry to reduce or elimi-nate water use in appliances, fixtures, irrigation and otherwater-using equipment. Examples are AAA-showerheads,dual flush toilets, waterless urinals, cooling tower control-lers and greywater systems. The availability, awareness andperceived acceptability of such technologies will influencecustomer uptake and water usage practices, which will inturn affect water demand. See Study 3: Perth Pilot Toiletand Shower Water Use Study (ISF, 2002).
4.2.8 Development of a waterservice frameworkDemand management provides water utility planners andmanagers with the opportunity to take a water serviceapproach to the business of selling water. This considersmanagement of the demand for water as an issue of ‘howto provide the service for which the water is needed’ ratherthan ‘how much water must be provided’. This approachmay result in business opportunities for selling water tomeet the water service needs of residential and non-resi-dential customers that can be met with less water or wa-ter of a quality lower, equal to or higher than potable mainsquality water. In the past decade, with corporatisation ofwater utilities, the water service approach is beginning tobe more widely adopted. However, to develop strategiesfor meeting the market’s various water service needs,market research is essential. The size of the market forwater service needs will vary from place to place. How-ever, water utilities could benefit from collaborative re-search on the characteristics of the water service needsthat tend to be common within residential and non-resi-dential sectors.
22
WATER SERVICES ASSOCIATION OF AUSTRALIA - OCCASIONAL PAPER NO. 9 - URBAN WATER DEMAND FORECASTING & DEMAND MANAGEMENT
Water Demand andDemand Management InitiativesContinued
4.3 Water Using EquipmentThere have been several substantial studies in Australia todate which look at residential water using equipment andthe stock and sales of appliances. These have been un-dertaken in Melbourne, Perth and Sydney. See Study 4:Melbourne End Use and Water Consumption InfluencesStudy (ISF and CSRIO Urban Water, 2002) and Study 5:Domestic Water Use Study (Water Corporation of W.A.,2003). A national stock study undertaken on energy us-ing equipment, Greening Whitegoods (Energy Efficient Strat-egies, 2001) has detailed and reliable stock data on wash-ing machines and dishwashers in each State.
4.4 Demographics and Land UseThere are numerous demographic and land use factorsthat can influence water use:population;
• occupancy rate of dwellings;
• lot size (including ratio of garden/lawn size to entirelot); and
• age of the building stock;
• industry growth (in terms of land area);
• landscape area, ownership type (public, commercial/industrial, institutional) or function (lawn, garden, field/oval, golf course, etc).
Both the current level of influence on water demand ofthese factors and the specific trends are of interest in fore-casting demand and developing an end use model. Re-search undertaken by ARCWIS (see Syme, 1990) collectedand analysed the relationship between lot size and house-hold water demand. Two recent studies which addressresidential demographic factors and non-residential land-use trends are Study 6: Average Residential ConsumptionVariability (Hunter Water Corporation, 2002) and Study5: Domestic Water Use Study (Water Corporation of W.A.,2003).
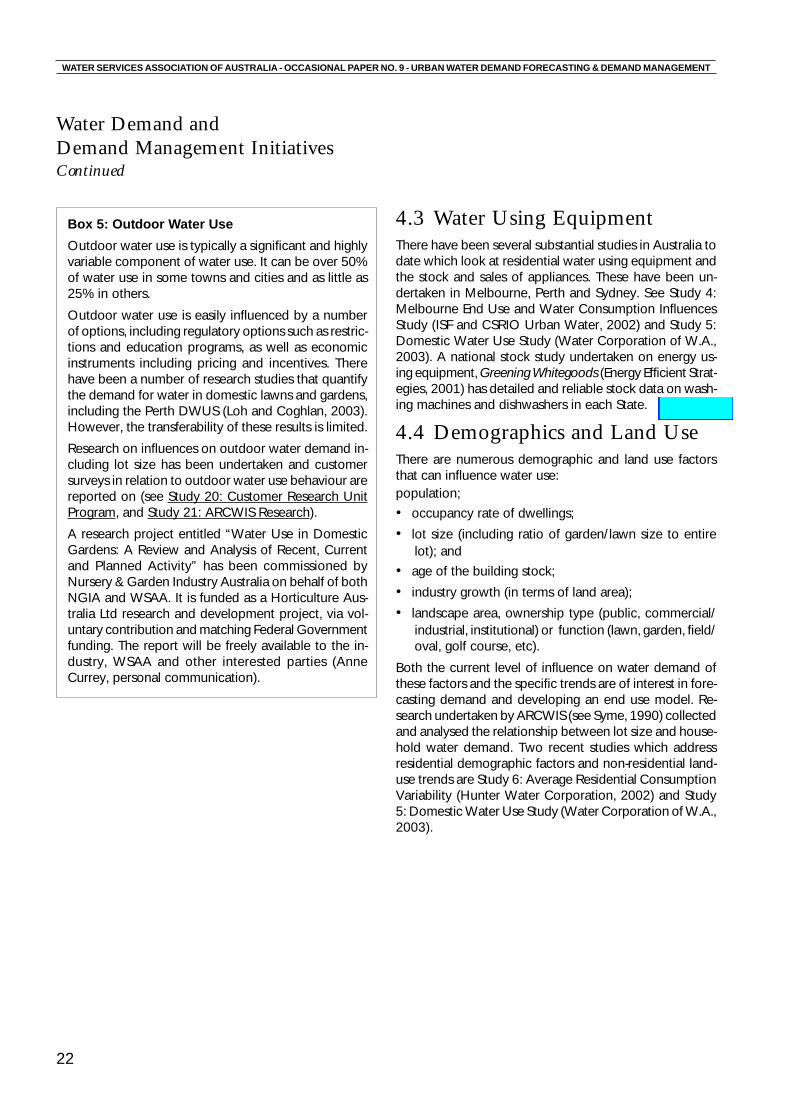
Box 5: Outdoor Water UseOutdoor water use is typically a significant and highlyvariable component of water use. It can be over 50%of water use in some towns and cities and as little as25% in others.
Outdoor water use is easily influenced by a numberof options, including regulatory options such as restric-tions and education programs, as well as economicinstruments including pricing and incentives. Therehave been a number of research studies that quantifythe demand for water in domestic lawns and gardens,including the Perth DWUS (Loh and Coghlan, 2003).However, the transferability of these results is limited.
Research on influences on outdoor water demand in-cluding lot size has been undertaken and customersurveys in relation to outdoor water use behaviour arereported on (see Study 20: Customer Research UnitProgram, and Study 21: ARCWIS Research).
A research project entitled “Water Use in DomesticGardens: A Review and Analysis of Recent, Currentand Planned Activity” has been commissioned byNursery & Garden Industry Australia on behalf of bothNGIA and WSAA. It is funded as a Horticulture Aus-tralia Ltd research and development project, via vol-untary contribution and matching Federal Governmentfunding. The report will be freely available to the in-dustry, WSAA and other interested parties (AnneCurrey, personal communication).
23
WATER SERVICES ASSOCIATION OF AUSTRALIA - OCCASIONAL PAPER NO. 9 - URBAN WATER DEMAND FORECASTING & DEMAND MANAGEMENT
Water Demand andDemand Management Initiatives
Continued
4.5 ClimateClimatic or weather factors can significantly influence ur-ban water demand and should be taken into considera-tion when developing a demand forecasting model. Cli-matic factors can be separated into short-term and long-term factors. Short-term factors include weather factors,such as maximum day temperature, perceived rainfall andperceived evaporation. It is important to note that it is‘perceived’ rainfall and evaporation rates that are signifi-cant, as customers will change their outdoor wateringbehaviour based on their perception of these two factors.Recent innovation has seen the development of control-lers for automatic sprinkler systems, which directly linkactual rainfall and evapotranspiration to outdoor wateruse (see for example Hunt et al, 2001). Longer term cli-mate change is likely to increase annual average tempera-ture, rainfall and evapotranspiration, although this isregionally determined.
Several researchers have developed demand models us-ing multiple regression techniques, which attempt to de-termine the impact of weather-related variables on waterdemand for short-term demand prediction or longer termanalysis of trends. For example, Viswanathan (1991) mod-elled water demand as a function of climate variables forHunter Water to determine the impact of restrictions.Other work has included the development of a model forSydney Water Corporation (SMEC/MW, 1995) and forGold Coast Water (Montgomery Watson, 1998) and forAlice Springs (ISF, in progress).
However, there is very little published on the methodsused in Australia and there is little discussion and com-parison of methodologies by the water industry. See Study7: Water Demand Management Strategy for Alice Springs(ISF, in progress).
4.6 Water Supply SystemThe physical state of the urban water supply system caninfluence bulk water demand because of leakage frompipes. Leakage typically represents more than 50 per centof unaccounted for water.
The extent of leakage will vary from area to area depend-ing on the state of the infrastructure and system design.However, the experience within existing programs, suchas the Sydney Water Demand Management Program, isthat leakage control and pressure reduction can be oneof the most cost-effective and immediately available meth-ods of demand management. There are a number of leak-age control measures that can be used, such as pressurecontrol, routine sounding and district metering (Wide BayWater, 1999).
Significant work on the affects of leakage and leakagemanagement has been undertaken in the internationalarena. The International Water Association (IWA) has de-veloped a methodology for leakage management andsupported an international conference on the issue3. TheInfrastructure Leakage Index (see Lambert and McKenzie,2002) has been proposed as a standard method of defin-ing and benchmarking leakage levels. A number of Aus-tralian utilities such as Wide Bay Water, South East Waterand Hunter Water Corporation have addressed the im-pact of pressure reduction on leakage and overall waterdemand. However, there is little publicly available litera-ture that provides a summary of cost estimates for imple-menting leakage management programs in Australia andthe actual water savings achievable.
4.7 Source SubstitutionSource substitution is the use of other sources of water toreplace or supplement bulk water supply. This includesmeasures such as rainwater harvesting or effluent reusewhere there is an opportunity for substituting sources ofwater for end uses such as irrigation, car washing, toiletflushing and laundry use or with appropriate treatmentfor other end uses where a higher quality is required. Itcan include options that substitute water with non-watersolutions, such as dry toilets, waterless urinals or air forindustrial cleaning processes (Grant, 2002). Many utilitieshave considered the use of rainwater tanks as a substituteto bulk water supply. However, few have undertaken quan-titative analyses of the actual influence rainwater tankscan have on bulk supply and specifically, peak supply. Onestudy that endeavours to do so is Study 8: Integration ofRain Tanks: Impact on Water Supply Headworks (ISF,2003).
3 See the proceedings of the conference “Leakage Management:A Practical Approach ’ held November 2002, at http: //www.leakage2002.com
24
WATER SERVICES ASSOCIATION OF AUSTRALIA - OCCASIONAL PAPER NO. 9 - URBAN WATER DEMAND FORECASTING & DEMAND MANAGEMENT
5. Significant Studies
This section provides a review of selected studies that the study team considers significant.These were chosen from a larger group of studies identified through the information reportingtemplates sent to selected WSAA-members and the study team’s existing knowledge. Thestudies reviewed in this section were chosen on three criteria: relevance, uniqueness andquality.
5.1 Study 1: Water Pricing ImpactsStudyThemes: water usage patterns – pricingThis study was undertaken by Montgomery Watson forGold Coast Water in 1997 with the objective of develop-ing a model to forecast the impact of different water priceson future water demand. This study aimed to enable GoldCoast Water to establish a water pricing structure withgreater confidence.
The study provided a review of pay-for-use pricing in four-teen NSW and Victorian cities and towns, developed apricing impact model for Gold Coast Water and incorpo-rated this model into the previously prepared demandmonitoring and forecasting database. The model was de-veloped to assess the impact of pricing on different watercustomers (including residential single family, residentialstrata/flats, commercial, industrial, public and other). Priceelasticities were estimated for internal and external waterdemand for each of the customer categories.
The review of impacts of price changes in other cities andtowns indicated that there are generally other factors in-fluencing a downturn in water demand, thus making itdifficult to determine the quantitative influence of pricingalone, that is, the price elasticity. Whilst the study under-took an analysis of quantifiable non-price factors, such asincome, housing type and population to eliminate theirinfluence on downturn in water demand, some variableswere difficult to quantify and thus could not be eliminated.Such difficult factors were:
• the level of community education associated with theprice change;
• the existence of drought management strategies; and
• the extent of other demand management initiatives.
This study concluded that when developing an impactmodel for water demand it must be assumed that in addi-tion to price changes, a combination of the above threefactors may also influence the change in water demand.This means that there can be significant uncertainty in pre-dicting the quantitative influence of introducing pay-for-use pricing on water demand. Because of this uncertainty,the study recommended that sensitivity analysis be un-dertaken when forecasting future demand.
Further, the study concluded that the influence on waterdemand of introducing pay-for-use pricing may be less inthe Gold Coast compared to other areas of Australia be-cause of the relatively low level of per capita demand inthe Gold Coast and the downturn in demand during the1990s.
5.2 Study 2: Customer ValueStudies and Customer Preferenceson Water Resource IssuesThemes: water using practices – socio-cultural factorsThis set of three studies was commissioned by MelbourneWater for the Water Resources Strategy Committee forthe Melbourne Area in 2001, to determine customer val-ues in relation to drought management, water restrictionissues and preferences towards water management op-tions being considered by the Victorian Government. Suchwater management options include:
• reducing water demand;
• develop new water sources;
• substitute drinking water; and
• squeezing more from the existing water supply.
The initial phase was an exploratory qualitative study us-ing focus groups in three target audiences (metropolitanhouseholds, control groups in areas of restrictions andbusiness/organisations). The general attitude of the par-ticipants suggested a willingness to conserve water andaccept restrictions. However, there was uncertainty in thecommunity on how to go about this on an individual ba-sis and how to know whether one is having an effect. Thestudy indicated a diversity of views in relation to the mer-its of increasing supply versus reducing demand or a mix-ture of the two strategies.
The second phase included a quantitative survey of a rep-resentative sample (n=601) of the community (by age,gender, ethnicity and geographical location) via telephone.It revealed a high degree of willingness to consider usinggreywater, highly treated sewage water (for external ap-
25
WATER SERVICES ASSOCIATION OF AUSTRALIA - OCCASIONAL PAPER NO. 9 - URBAN WATER DEMAND FORECASTING & DEMAND MANAGEMENT
Significant StudiesContinued
plications and toilet flushing) and rainwater tanks. How-ever, barriers (such as cost, space, odour, health issues,security of supply and local government restrictions) couldreduce this preparedness. Attitudes towards conservingwater appeared to be positive, though respondents wantedto be convinced of both the costs and benefits of theirefforts (i.e. water savings and costs). There was a strongpreference for achieving water conservation through edu-cation programs rather than pricing increases. Middle-agedgroups tended to be amenable to innovative solutions. Ingeneral, of the four management options (as listed above),the option to reduce water demand was most favoured.
The third phase explored customer values through a sur-vey of 1,411 residents in Melbourne and Geelong. AsGeelong has recently experienced water restrictions as aresult of drought, an aim of the study was to assess anydifference in values and attitudes between the Geelongand Melbourne respondents. The key differences foundwere in actual behaviours, not attitudes. The overall re-sults suggest that in general there is strong willingness toconsider conserving water, especially for external uses.There was also a certain degree of understanding or ac-ceptance of more frequent and less severe restrictions,rather than less frequent and more severe. A possible self-selection bias may have occurred in this survey, as thosewho were initially recruited but did not end up complet-ing the full survey tended to be younger, renting property,be non-Australian in origin and living alone.
These studies provide details of current perceptions andattitudes of the community in relation to water use, con-servation and restrictions in the Melbourne area. The out-puts of this study may be relevant to other parts of Aus-tralia with similar socio-demographic and geographic char-acteristics. Certainly, the study methodology could beapplicable throughout Australia. It is important, however,to ensure that using results from such a study for a pur-pose different from which it was intended, may result inless reliable results. For example, the quantitative surveyasked participants to estimate their current shower dura-tion and what, if asked to cut their duration they wouldreduce it to. This information is useful for understandingthe community’s attitudes and perceptions. However,these attitudes may not be reflected in their behaviour.That is, shower durations are likely to be higher than re-spondents claim.
5.3 Study 3: Perth Pilot Toilet andShower Water Use StudyThemes: water using equipment and waterusage practicesThe Pilot Toilet and Shower Water Use Study was con-ducted in 2002 by the Institute for Sustainable Futures,UTS, for the Water Corporation of Western Australia, asan extension of the Domestic Water Use Study DWUS(see Section 5.5). The principal objective was to deter-mine the most likely cause(s) for higher than expectedaverage flush volumes for 6/3 L dual flush toilets. This isimportant, as high flush volumes would suggest muchlower than expected water savings from retrofit programsfor older toilets or because of the normal replacementrate. A secondary objective of this study was to developtechniques for obtaining high quality data on applianceand fixture stocks and associated water use, at minimalcost and while working in cooperation with customers.
The available number of potential households for this pi-lot study was limited and other households could not besubstituted. Thus, it was necessary to develop a strategythat maximised the participation rate of the few availablehouseholds. Participation was maximised by:
• Sending a letter to all desired participant householdsto introduce the study, explain what participation wouldinvolve and provide a consent form as an attachment;
• Following up the letter with a telephone call to furtherexplain the purpose of the study, make appointmentswith those households agreeing to participate and tosurvey a person who was willing to commit thehousehold to participate.
• Undertaking the household visit, which involved a maleand female pair of researchers4. One researcherundertook a technical inspection of the water usingappliances, while the other conducted a face-to-facesurvey on water usage behaviour with a member ofthe household. The purpose of the face-to-face surveywas three-fold: to understand people’s toilet usagepractices to help clarify data previously gathered usinga different data collection technique, to understandpeople’s patterns of use of their dual flush toilet and todetermine how satisfied households were with theoperation of their dual flush toilet. This was to find outthe most likely cause(s) for higher than expectedaverage flush volumes for 6/3 litre dual flush toilets.The technical inspection aimed to identify the stock ofvarious water using appliances and determine actualshower flow rates.
4 Research suggests participants of an in-house survey may beleast threatened and willing to participate when a male-and-fe-male combination conduct the household visits (compared totwo males, two females, a single male or a single female).
26
WATER SERVICES ASSOCIATION OF AUSTRALIA - OCCASIONAL PAPER NO. 9 - URBAN WATER DEMAND FORECASTING & DEMAND MANAGEMENT
Significant StudiesContinued
• Providing rewards to show participants the value thatthe Water Corporation placed on the household’scontribution to the study.
• Sending evaluation forms to all participants to help thestudy team look for opportunities to improve the waythe household visits were conducted and to affirmpositive aspects.
The telephone survey questions were identical to thoseasked in the face-to-face survey. The purpose of askingthese questions over the telephone was to collect datafrom more than one member of the household, to ac-count for variation in individual responses among house-hold members.
The high participation rate and general satisfaction of par-ticipants in the Perth Pilot Study affirmed the importanceof incorporating a good communication strategy in thedata collection to ensure participants were treated withrespect, to maximise their participation and cooperationand to establish or further build customer relationshipswith the organisation.
The technique used is highly applicable to other waterutilities in Australia. That is, the process of collecting high-quality household water-usage data is transferable. Whilstthe pilot study did not have a statistically significant sam-ple size, some of the data resulting from the survey mayalso be relevant to other water utilities, such as data sug-gesting that actual shower flow rates may be much lowerthan the capacity flow rate. It is also important to notethat the actual flow rate appears to vary substantially as apercentage of capacity flow rate, depending on the “A”(or efficiency) rating of the showerhead. The actual flowrate was found to be a much lower percentage of capac-ity flow rates for high water-using showerheads but a muchhigher percentage for water efficient showerheads. Thistype of data is important for predicting water savingsachievable from a retrofit of water efficient technologiesand fixtures.
Another important finding from this study is the value ofcollecting specific water usage data using an appropriatedata collection technique. For example, identifying stocks5
of the various dual flush toilet types in Australia may notbe as simple as a superficial check of the toilet during ahousehold technical visit. An even less accurate methodis asking the householder what type of dual flush toiletthey own. This is because there are currently three typesof dual flush toilets: 11/6 L, 9/4.5 L or 6/3 L and there areno consistent, obvious markings on these toilets to en-able easy identification. These difficulties may be over-come by taking measurements of the volume of waterinside the cistern. Whilst this technique may not be quickand straightforward, it may provide results that are reli-
able. Another option yet to be trialled in Australia is theuse of the T5 Flushmeter6 to obtain instantaneous data onactual toilet flush volumes (claimed to be accurate to thenearest 0.1 L).
5.4 Study 4: Melbourne End Useand Water Consumption InfluencesStudyThemes: water using equipmentThis data collection study was undertaken by CSIRO Ur-ban Water and the Institute for Sustainable Futures, UTS,on behalf of the Water Resource Strategy Committee forthe Melbourne Area in 2002. The main objectives wereto understand how and when water is used within thecommunity and the factors influencing water consump-tion. The intention was to provide a summary of best cur-rent knowledge of end uses of water within Melbourneand collate existing knowledge about the major influenceson end uses of water, including penetration levels of wa-ter efficient fixtures and appliances. Data were sought thatcould provide inputs to an appropriate water end-usemodel for Melbourne.
It involved collating primary demographic data and sec-ondary end use data on water efficient technologies. Aqualitative assessment of the relevance, reliability and sen-sitivity of available data for modelling Melbourne’s waterconsumption was undertaken. This allowed identificationof:
• data which is appropriate for a Melbourne end usemodel;
• gaps in appropriate data and knowledge, (such asownership of various dual flush toilets types); and
• recommendations for further data collection.
This objective influenced the type and extent of data col-lected: for example, data were collected on actual wateruse of the different water efficient shower and toilet types,rather than theoretical or ‘design’ water use data. Further,the study focused on collecting reliable data for end usesthat are significant to an end-use study, such as showersand toilets (which can each make up 30 per cent of in-
5 For the purpose of this paper, ‘stocks’ refer to the quantity orpercentage of specific water efficient fixtures.6 See http: //www.t5flushmeter.com/ for further details on T5Flushmeter.
27
WATER SERVICES ASSOCIATION OF AUSTRALIA - OCCASIONAL PAPER NO. 9 - URBAN WATER DEMAND FORECASTING & DEMAND MANAGEMENT
Significant StudiesContinued
door water consumption), compared to dishwashers(which make up approximately 1 per cent of indoor wateruse).
The residential end use data collected in this study is rel-evant to other Australian water utilities to the extent thatthey have similar relevant characteristics to Melbourne.Relevant characteristics may include climate, socio-demographics and other factors. Regardless of the actualdata, the framework for collecting and assessing second-ary data is applicable to all water utilities.
A unique aspect of this study is perhaps its use of existingdata from one region for use in a water end-use study inanother region, prior to any further primary data collec-tion. A popular belief in the U.S. (and Australian) waterconservation community is that primary data should al-ways be collected specifically for the study region. It isthought that transposing data from one region to anotherwill result in inaccurate outcomes because of the distinc-tive characteristics of different cities and regions. Whilecollecting primary data can be preferable, it is often moreexpensive than collating existing data. The Melbourne EndUse and Water Consumption Influences Study collatedexisting end use data from Australia (and a limited amountfrom overseas) and assessed each data set’s integrity andrelevance to a Melbourne water end use model. Recom-mendations for further primary data collection were basedon existing data sets assigned as low relevance and/orlow data quality. This raises the question, does the collec-tion of existing data (where appropriate) reduce the costof collecting all primary data? If so, to what extent? It islikely that regardless of the quality of existing data, stockstudies (of water using appliances and fixtures) would stillneed be undertaken as this is a site-specific parameter andwill differ from area to area.
This study also concluded that while the collection of fur-ther specific residential data is needed to contribute to anend use model for Melbourne, non-residential data gapsare best addressed through methods other than develop-ing an end use model. Such methods could include sur-veying an industry sample to determine interest in site-by-site audits or determine best practice water use in eachindustry category.
5.5 Study 5: Domestic Water UseStudyThemes: water using equipmentThe Domestic Water Use Study (DWUS), undertaken byWater Corporation of Western Australia in Perth 1998–2001, has become perhaps the largest residential end usedata collection in Australia. The DWUS collected data onhousehold water usage and identified patterns and trendsin water use. It provided a snapshot of how water is usedin the average Perth household and flow data on selectedhouseholds. It is anticipated that a demand forecastingmodel and a water use efficiency program might be de-veloped from this.
Using data loggers attached to water meters, data hasbeen gathered on water use in about 125 single-familyresidences, stratified by income, over eighteen months.The study also involved an analysis of trends in water useover the past fifteen years and determination of savingsfor various water efficient devices.
Although this end use database is the largest in Australia,trying to use it for purposes for which it was not originallyintended is difficult.
The DWUS was designed to identify patterns and trendsin water use behaviour,, and data was collected using asurvey with only two categories of water using appliances:‘efficient’ and ‘standard’ (for showers). This is sufficientfor understanding general trends, however, if water andcost savings for the different appliances are to be ana-lysed, further information is required about them. The rea-son for this is that the word “efficient” is unclear in a tech-nical sense. In Australia at that time, efficient showerheadscould be A-rated (12–15L/min), AA-rated (9–12L/min) orAAA-rated (<9L/min). Categorising the showers as ‘effi-cient’ or ‘standard’ may be straightforward and useful fortrend development but may not provide all the informa-tion needed to calculate savings. Knowing the end goalof the data collection is important.
The same issue applies for dual flush toilets. Currently inAustralia, these can be 11/6L, 9/4.5L or 6/3L. In the fu-ture, 4/3L and other efficient toilets may become avail-able. If quantitative data is required on savings achievedby replacing all higher water using toilets with 6/3L toi-lets, the level of detail of toilet type and actual flush vol-umes is required.
In the DWUS study, data to identify dual flush toilet stockswere initially collected via a face-to-face survey but nophysical inspection of the toilets was made. Towards theend of the study, the data was cross-checked via an ex-amination of the flow trace data emerging from the data
28
WATER SERVICES ASSOCIATION OF AUSTRALIA - OCCASIONAL PAPER NO. 9 - URBAN WATER DEMAND FORECASTING & DEMAND MANAGEMENT
Significant StudiesContinued
loggers and by an in-house technical survey. The in-housetechnical survey involved researchers entering the houseand examining the toilets to increase the level of accuracyin identification (this was undertaken as part of the PerthPilot Toilet and Shower Water Use Study, see Section 4.3.8for further detail). The toilet identifications from the in-house survey technique and review of data logger out-puts were reasonably consistent, while they differed con-siderably from those initially estimated by participantsduring the DWUS telephone survey. However, becausetoilet flush volumes can be different from those obtainedin a laboratory setting, collection of data using in-housesurveys can produce better identification than the use ofdata loggers alone. Based on this Perth pilot study, identi-fication techniques have been further improved.
Key findings of this study included:
• Average total household water use was 369 L/person/day. The components were: bath and shower (14%),washing machine (11%), toilet (9%), tap 7%, other (1%)and outdoor (58%);
• Water use in toilets has decreased substantially since1981–82 because of increasing ownership of dual flushtoilets, however, this has been offset by increased wateruse by the washing machines component (due toincrease ownership in automatic washing machines);
• Increased ownership of automatic reticulated irrigationsystems has resulted in increased outdoor water use;
• · Higher income households tended to have higheroutdoor water use (note this is a cross-sectional studyand cannot be translated into a conclusion thatincreasing affluence in the community is necessarilylinked to increasing water use over time); and
• No significant relationship between lawn area andoutdoor usage exists.
The indoor water use data is generally applicable to otherwater utilities in Australia. The outdoor data may be lessapplicable to other areas owing to climatic and demo-graphic factors. However, the data is only applicable toother studies to the extent to which the original study wasinitially undertaken. For example, accurate data on watersavings may not be applicable to another study, as thiswas not the original intention of the DWUS and the avail-able data may not be appropriate for the specific need.
5.6 Study 6: Average ResidentialConsumption VariabilityThemes: demographics and land useThis study was undertaken by Hunter Water Corporationin 2001–02 partly to review average residential consump-tion and to determine the variability of consumption bysocio-demographics such as affluence, property age, to-pography and size. Peak demands are designed based onaverage demand by applying peaking factors. The investi-gation analysed the annual metered consumption of allresidential properties within the Hunter Water Corpora-tion area of supply (180,000 properties) at a collector’sdistrict level. A review of Hunter Water’s customer data-base indicated newer houses have a substantially higheraverage water consumption compared with older houses.However, this has not appeared to offset the overall aver-age, owing to the decreasing annual water consumptionby older houses.
In addition to property age, other factors which appearedto affect average consumption included: geographical area,topography, property size, customer affluence and hous-ing type.
The principal conclusion was that there is considerablevariability in annual consumption (also maximum consump-tion) for different collector’s districts. The analysis high-lighted a variation in average consumption from 150kL/year to 410kL/year for varying sites. In addition, the analy-sis identified that younger properties (<15 years old) hada higher consumption than older properties (40–50%),which could indicate a culture change in consumption.
Following this study, it was recommended that residentialdiurnal patterns, peaking factors, extreme day (and week)demand and average annual consumption for multi-resi-dential houses be revised for the Hunter Water customerarea because of changes in consumption identified.
29
WATER SERVICES ASSOCIATION OF AUSTRALIA - OCCASIONAL PAPER NO. 9 - URBAN WATER DEMAND FORECASTING & DEMAND MANAGEMENT
Significant StudiesContinued
5.7 Study 7: Water DemandManagement Strategy for AliceSpringsThemes: water using equipment, water usagepractices, climate, demographics and landuse.The Institute for Sustainable Futures, UTS, developed aclimate correction model as part of a demand analysisand demand management study in Alice Springs. The aridclimate in Alice Springs presented significant challengesfor the client, the Northern Territory Power and WaterCorporation, in reducing demand in summer periods,where the peaking factor (peak day demand to averageday demand) has consistently averaged approximately 1.6.The climate correction model was used in this project spe-cifically to look for historical instances in which local ac-tivities may have had an impact on water demand, i.e.changes in demand that were not the result of climate. Infuture, the model will be able to be used to measure theimpact of the Alice Springs Urban Water ManagementStrategy.
The following data from the period July 1981 to June 1981was obtained:
• climatic: rainfall, pan evaporation and maximum dailytemperature;
• demand: daily reservoir-corrected bulk water demand;and
• demographics: population (interpolated to provide dailyvalues).
Manipulation converted the daily data to monthly data,including:
• degree days: the monthly sum of the daily maximumtemperatures;
• ·evaporation: using a crop factor to convert panevaporation;
• soil moisture deficit: combining daily rainfall andevaporation data in a daily model, summed monthlyto represent the fluctuations in soil moisture due to itsfinite capacity to hold water; and
• monthly average demand per capita.
A multiple regression analysis was used to define the de-mand equation. Interestingly in this case, the moisturedeficit was found to have a far greater influence on de-mand than temperature. The model was calibrated on a24-month period and tested and verified for significanceat the 95 per cent confidence level.
Importantly the model is useful now to monitor the im-pact of future programs. The researchers have taken onthe responsibility to address this and hand the model overin a form and with sufficient information to ensure thatthe utility is able to use the model ‘in house’. This abilityto broadly understand the anticipated response of demandto climate will allow utilities to better measure the impactof their programs and to evaluate their successes.
5.8 Study 8: Integration of RainTanks: Impact on Water SupplyHeadworksThemes: source substitutionIn 2003, Rous Water, a bulk water supplier on the northcoast of NSW, commissioned the Institute for SustainableFutures, UTS,, to undertake a study of the potential forintegration of rainwater tanks thereby reducing the needfor water supply headworks. The aim of the study was toanalyse and evaluate the potential for a major installationof rainwater tanks, acting as a reliable water supply sourcesupplementing the supply storages that service the Rousregion. This study built on a previous study of rainwatertanks undertaken as part of the Rous Demand Manage-ment Strategy (White, 1997), which investigated the po-tential for rainwater tanks to be a supplementary supplysource and as a sole supply for new buildings.
Using the least cost approach and using the ‘unit capacitycost’ (expressed as $ per ML/a water saved or yield pro-vided) as the basis, other DM options, source substitutionand supply-side options were compared with rainwatertank options. Three rainwater tank options were devel-oped from various demand scenarios obtained by con-necting the rainwater tank to toilet flushing only, outdooruse only and to toilet flushing, outdoor and to laundryuse. Secure yield provided by each option was also usedas a criterion in evaluating and comparing the options.
In addition, the study estimated a rainwater tank rebatescheme that the utility could offer to customers for thethree rainwater tank options. The rebates for each of thethree options were estimated based on a planned capitalinvestment of supply augmentation, which will be deferred(by the option) in proportion to the secure yield it willprovide.
In the cost-benefit analysis of the rainwater tank options,an attempt has been made to quantify the benefits thatare accrued by avoided stormwater infrastructure costsas well as to internalise the externality of greenhouse gasemission.
30
WATER SERVICES ASSOCIATION OF AUSTRALIA - OCCASIONAL PAPER NO. 9 - URBAN WATER DEMAND FORECASTING & DEMAND MANAGEMENT
Significant StudiesContinued
The investigation of the relationship between rainwatertanks and the behaviour of supply headworks shows thatthe widespread use of the largest modelled capacity rain-water tanks (10,000 litres) have the potential to increasethe security of supply by up to 24 per cent. This providesa new way of accounting for the benefits of rainwatertanks as an alternative supply and highlighting the needfor implementing and promoting any rainwater tank pro-gram on a scale larger than household level to derivemaximum benefit on the supply-side as well as on thestormwater-side.
5.9 Study 9: Wise WaterManagement: A DemandManagement Manual for WaterUtilitiesThemes: water using equipment, water usagepractices, water supply system and sourcesubstitutionThis demand management manual (White 1998) was pub-lished in November 1998 by the Water Services Associa-tion of Australia and NSW Department of Land and Wa-ter Conservation. The Manual has three parts. Part A pro-vides an overview of demand management. It also includesan introduction to planning for demand management. Thissection includes the economic evaluation processes thatcan be used for comparing various demand managementoptions in the planning process. Part B discusses demandmanagement measures related primarily to actions thatare designed to be implemented by the water utility, suchas pricing reform, metering, non-revenue water (includingleakage reduction and repair), utility water use and reuseof water. Part C discusses demand management meas-ures at the customer end. One chapter also discusses theimportance of community-based strategies in the contextof demand management and outlines the elements of asuccessful communication strategy.
The Manual is a reference for information about water-using technology and the potential for improved efficiency.Various incentives and retrofitting programs are listed inthe Manual with examples of implementation.
The Manual describes a number of demand managementprograms. However, it does not provide significant detailson the evaluation methodologies of the demand manage-ment programs that are highlighted as case studies or ofclimate correction methods, end use analysis or forecast-ing techniques. Other manuals and guidelines produced
since this one was published provide details on a numberof aspects covered in this manual. For example, Vickers(2000) provides a comprehensive coverage of the field ofwater efficiency in North America and PMCL (2001) pro-vides details of methods for assessing the cost effective-ness of demand management measures.
5.10 Study 10: Residential andNon-residential Water PricingCommunicationsThemes: water usage practices – knowledge& awareness and pricing.The study titled “Water Pricing Communication Plan” wasconducted by Gold Coast Water (GCW) in June 2002 aspart of short-term communication strategies developedwith the specific aim of communicating the new pricingstructure that was announced as a drought response meas-ure.
The study has costed communication strategies targetedat specific categories of water customers including seniorcitizens, concerned residents, ratepayers and pool own-ers. The strategies aim to create awareness in the commu-nity regarding the two-part pricing structure introducedby GCW and to encourage customers to locate and readtheir water meters and to increase awareness of waterissues. The strategies employed were wide ranging andused different media outlets, including information bro-chures for general distribution, a campaign involving a‘meet your water meter’ competition, held in collabora-tion with a local radio station, presentation kits and dis-plays targeted for specific customers, local newspapersand local television and periodical council rate notices.
Strategies and their respective costs targeting non-residen-tial water customers are also described and proposed inthe document.
31
WATER SERVICES ASSOCIATION OF AUSTRALIA - OCCASIONAL PAPER NO. 9 - URBAN WATER DEMAND FORECASTING & DEMAND MANAGEMENT
Significant StudiesContinued
5.11 Study 11: Water ConservationPartnership Program (WCPP)Themes: water usage practicesThis study is essentially a literature review compiled forthe Water Conservation Partnership Program by the Ur-ban Water Resources Centre, University of South Australiain January 2001. The review focuses on studies of waterconservation and water substitution technologies and prac-tices for domestic users and local government. The re-view discusses issues specific to sustainable water man-agement namely:
• water conservation practices and technology;
• roof runoff storage and use;
• greywater and reclaimed water; and
• aquifer storage recovery.
The key factors that were reviewed for each of the issuesincluded technological, public health and economic fac-tors, as they influence the applicability and feasibility ofthe adoption of such technologies. The review also in-cludes references that discuss and provide evidence ofvarious kinds of benefits associated with above-mentionedaspects of sustainable water management.
Regulations in South Australia also have been reviewedwith a view to identify the barriers and opportunities thatexist for rainwater tanks, aquifer storage and recharge,greywater and reclaimed water reuse.
The study provides ample references for water efficiencyand rainwater tanks. The review of the regulatory environ-ment is pertinent for S.A.
5.12 Study 12: Kalgoorlie–BoulderWater Use Efficiency Study andEvaluationThemes: water using equipmentThe objective of this study was to investigate the poten-tial to reduce water demand by increasing water use effi-ciency and, to implement actions based on the study. Anemphasis was placed on cost effective, permanent andsimple options.
Water use restrictions had been in place over the previ-ous two summers and surveys had shown that the com-munity in general supports them as a means of conserv-ing water. However, it is clear that restrictions do not per-
manently reduce the demand for water and restrictionson watering times often merely shift the peak of wateruse, rather than reducing the overall demand.
The project process involved extensive community,stakeholder and trade-ally consultation, the developmentof a demand model including climate correction, a 200household residential and selected commercial customersurvey, identification and analysis of efficiency options,cost benefit analysis and program design. The study wascompleted in December 1994 by Preferred Options (Asia-Pacific) Pty Ltd and in February 1995, the W.A. Ministerfor Water Resources announced a major retrofitting, in-centive, auditing and communications program resultingfrom the study. The $3.5m, one year program had anumber of components: free retrofits of water using equip-ment within residential premises (including toilets), freeaudits and advice on outdoor water use including vouch-ers for purchasing mulch and drought resistant plants, freewater audits to commercial and industrial customers andan extensive education campaign. The second study, un-dertaken by the Institute for Sustainable Futures, UTS,, forthe Water Corporation of W.A. in 2001, involved evaluat-ing the savings and cost effectiveness of the program us-ing both statistical comparison of participant and com-parison groups and climate correction of demand. Thisstudy showed that the indoor residential retrofit programsaved water in accordance with the estimates, while theoutdoor efficiency program was less effective. This wasattributed to the limited follow-up and compliance moni-toring. The climate correction model developed as part ofthis study indicated that demand for water was reducedfollowing the program by approximately 1–2 ML/day, froma base of approximately 30ML/day.
5.13 Study 13: Sydney Water LeastCost Planning StudyThemes: water using equipment, water usagepractices, climate, demographics & land useThis study was undertaken by the Institute for SustainableFutures, UTS,, for Sydney Water Corporation (SWC). Thework was completed in several phases and involved thedevelopment of a detailed end use model for the Sydneywater supply region.
The main objective of the study was to develop and de-sign demand management programs that would enableSWC to achieve the demand reduction targets set in itsoperating licence. The study involved development of anend use model for the residential sector and the develop-
32
WATER SERVICES ASSOCIATION OF AUSTRALIA - OCCASIONAL PAPER NO. 9 - URBAN WATER DEMAND FORECASTING & DEMAND MANAGEMENT
Significant StudiesContinued
ment of a Least Cost Planning (LCP) model to evaluateand compare a range of demand management programs.
In the Phase One Study, the water savings from the de-mand management programs for the residential sectorhave been estimated based on existing knowledge for thissector, using ABS data, the Perth 1985 Domestic WaterUse Study and other minor studies. Subsequent revisionsof the least cost planning model (Phases Two and Three)benefited from evaluative research that had been under-taken in the intervening period, which monitored and as-sessed savings from implementation of programs, includ-ing the retrofit program.
In the case of the non-residential sector, the breakdownof water consumption was limited to its disaggregationinto industrial, commercial and institutional sectors. Be-cause of a gap in the knowledge in terms of end-use break-down of non-residential water use and savings from de-mand management programs designed for the non-resi-dential sector, water savings were based on assumptionsof percentage reduction in water consumption made foreach sector.
The non-residential sector forms a significant proportion(approximately 25 per cent) of the total water consump-tion for SWC. In general, DM programs for the non-resi-dential sector have the potential to provide more savingsper customer. However, a number of unknowns remain:
• end-use break-down within different sub-categories ofnon-residential water consumption;
• water savings that can be expected from demandmanagement programs for a variety of industry types
• typical costs of implementing demand managementprograms in the non-residential sector
• methods of ensuring effective implementation ofdemand management measures in the non-residentialsector
These gaps mean there is less confidence in the potentialsavings to be achieved through investment in demandmanagement programs targeting the non-residential sec-tor, despite the significant opportunities that exist in thissector.
5.14 Study 14: DemandManagement, Water Efficiency andReuse in the Hunter WaterThemes: water using equipment, water usagepractices, source substitutionThe Integrated Water Resources Plan published by HunterWater in 2002, provides details of the demand manage-ment and water conservation initiatives taken by HunterWater Corporation and outcomes to date. It also providesan outline of the programs that Hunter Water has devel-oped as part of its integrated water resource plan. Thedemand management and supply development optionshave been compared on an equal basis consistent withleast cost planning principles.
The key components of the demand management pro-grams include:
• residential retrofit schemes targeted at the low incomegroup customers residing in the DOH properties andthe pensioners;
• integration of the showerhead program with a mediabased community awareness campaign;
• community awareness strategy focusing on demandmanagement and its integration with broadergovernment, environmental and water conservationinitiatives;
• pilot programs targeting outdoor water use;
• water audits for non-residential customers;
• indoor-outdoor consumption monitoring to measure theimpact of demand management at local and regionallevel;
• amending planning legislation to implement waterefficiency in new developments;
• leakage management options;
• development of an aggressive water recycling marketingstrategy;
• further research into water use patterns, rainwater tanksand water efficient devices; and
• maintenance of a strong water conservation pricingsignal.
On the supply side, the plan proposes that no new watersources will be developed within the next ten years. Theonly investment to be made on the supply side is aimedat improving the efficiency of current storages. It involvesconstruction of a new low-level spillway to more effec-tively manage stormwater run-off during floods and pro-viding additional storage in the dam.
33
WATER SERVICES ASSOCIATION OF AUSTRALIA - OCCASIONAL PAPER NO. 9 - URBAN WATER DEMAND FORECASTING & DEMAND MANAGEMENT
Significant StudiesContinued
5.15 Study 15: Edmondson ParkThemes: source substitution, water-usingequipmentTwo reports, Greenfield Manual–Version 1: New Ap-proaches to Water Services and Edmondson Park Feasibil-ity Report were prepared in July 2002 for Sydney WaterCorporation by researchers from CSIRO Urban Water andthe Institute for Sustainable Futures, UTS. The main objec-tive was to develop a generic methodology that couldidentify and evaluate alternative approaches to servicingGreenfield sites, in keeping with the principles of sustain-able water management. The study used a real-life casestudy of a Greenfield site at Edmondson Park, a new ur-ban release area in Sydney’s southwest.
A generic methodology is documented in the GreenfieldManual and the specifics of the methodology are cov-ered in the Feasibility Report. The methodology in theManual and the Edmondson Park solutions were devel-oped following a series of discussions and consultationswith key decision makers in the SWC representing poten-tial Manual users, in a series of workshops conducted andfacilitated by the team of researchers. External workshopswere conducted with key stakeholders including the Envi-ronmental Protection Authority, Department of Land andWater Conservation, Landcom (the developer of the site)and the Department of Defence.
The studies focus on the technical options and solutionsneeded to service the water, wastewater and stormwatermanagement needs of the development site and identifypotential barriers and constraints likely to occur duringthe development process.
Five major categories of option were identified and evalu-ated for the case study site at Edmondson Park, based onthe level and scale of infrastructure options consideredfor water, wastewater and stormwater services. The op-tions considered for evaluation were: Option 1: Base Case– Business as Usual, Option 2: Regional Level Options,Option 3: Regional/Estate Level Options, Option 4: Es-tate/Neighbourhood Level Options: and Option 5: Allot-ment Level Options. In all, the full range of options wasconsidered, from fully centralised (involving water supplypipeline for water, sewer pipe for sewage and stormwaterpits and pipes), to fully decentralised options (involvingcomposting toilets for reducing water demand and sew-age volume, rainwater tanks for self-supply of water andstormwater collection and using landscapes and pervioussurfaces for minimizing stormwater flows and increasinggroundwater recharge).
The options were evaluated and ranked using four assess-ment components: sustainability rating, water balance,costing calculations and barriers and incentives.
The sustainability rating was based on the capacity or ex-tent to which the options achieved the following objec-tives:
• minimising of resource use
• minimising waste and by-products and maximisingresource potential
• maintaining ecological function
• fostering awareness of and engagement with the watercycle
• contributing to amenity
• satisfying utility
• minimising whole of life cost to the community
The water balance and costing calculations quantified thescheme water demand, the volume of sewage andstormwater flow that ended in the infrastructure or dis-posal points external to the site. Annualised costs wereestimated to quantify the costs of the options.
The incentives and barriers associated with each optionprovided an indication of the feasibility of each and op-portunities they provided to create synergies with thepower and resources of the stakeholder agencies in amanner that would facilitate provision of sustainable wa-ter services to Greenfield development sites.
The methodology and framework developed in these stud-ies are applicable to any urban water utility on the vergeof planning water and wastewater services for a Greenfielddevelopment site.
The costing calculations used in the study pertain to thecost of the infrastructure associated with each option. Thecost calculations do not account for operation and main-tenance costs of the options. Externalities associated witheach option have also not been accounted for in the cal-culations.
34
WATER SERVICES ASSOCIATION OF AUSTRALIA - OCCASIONAL PAPER NO. 9 - URBAN WATER DEMAND FORECASTING & DEMAND MANAGEMENT
Significant StudiesContinued
5.16 Study 16: Pimpama–Coomera Integrated Water MasterPlanThemes: source substitution, water usingequipmentThis study was conducted in November 2002 for GoldCoast Water by GHD Pty Ltd. The objectives of the studywere to quantify the need for water cycle infrastructure,to develop opportunities and strategies for an integratedurban water management approach and to prepare a pre-liminary economic analysis for the strategy options.
The strategic options were assessed against a set of evalu-ation criteria defined to take into account triple bottomline elements. The approach determined a weighting foreach major criterion and scored the options against eachof the evaluation criteria. A ‘value for money’ score wasdetermined by dividing the weighted score by the life-cy-cle cost.
The options for reducing scheme water demand included:mandatory use of water efficient devices, dual reticula-tion to use recycled effluent for outdoor use, rainwatertanks to supply laundry, toilet and hot water service, tighterasset creation controls and better system.
The water and wastewater reduction estimates from theoptions related to water efficiency and efficient wastewatersystems were made based on assumptions relating topercentage reduction from the options.
The costing of the options was undertaken from the per-spective of the water utility. The benefits associated withthe options were not quantified. In addition, the externali-ties associated with the options were not accounted for.
However further major work is continuing on this projectto address issues identified in the November 2002 report,including a recent papers addressing externalities and riskassessment.
5.17 Study 17: Recommendationsfor Developing a Framework forAssessing Sustainability of UrbanWater SystemsThemes: source substitution, water usingequipmentRecommendations for Developing a Framework for Assess-ing Sustainability of Urban Water Systems was published inMay 2002 by researchers in CSIRO Urban Water, for Syd-ney Water Corporation.
The study is a review of methods that can be used toassess the sustainability of urban water systems. Multi-cri-teria analysis was used as the basis for design and devel-opment of a framework for assessing sustainability withinthe context of Sydney Water Corporation. The study iden-tifies a set of indicators suitable for sustainability assess-ment. The monitoring strategies corresponding to each ofthe indicators were recommended.
The framework recommended in this report could be use-ful as a reporting tool. However, implementation of a sus-tainable urban water system would require a different kindof framework. The Greenfield Manual and Edmondson ParkFeasibility Study are an attempt to develop such a frame-work for urban water systems designed and implementedwithin a specific type of urban development.
35
WATER SERVICES ASSOCIATION OF AUSTRALIA - OCCASIONAL PAPER NO. 9 - URBAN WATER DEMAND FORECASTING & DEMAND MANAGEMENT
Significant StudiesContinued
5.18 Study 18: Sustainable UrbanWater FuturesThemes: source substitutionThe study was conducted in November 2001, for SouthEast Water Ltd by the Institute for Sustainable Futures,UTS. The objectives of the study were:
• to study the water balance of three distinct types ofurban development, namely backlog, Greenfield andinfill, within the South East Water Ltd service area;
• to identify various sustainable water managementscenarios applicable to each of the three types of urbandevelopments, backlog, Greenfield and infill;
• to undertake a cost-benefit analysis of the scenarios foreach development type and to rank them in the orderof their present value cost; and
• to identify any barriers (in the form of inconsistenciesor gaps in current regulatory frameworks) toimplementing these sustainable water managementsystems.
Options for water and wastewater systems were devel-oped for each of the three types of urban development.The options were developed in keeping with the princi-ples of sustainable water management systems. The studydid not include options for stormwater systems within thedevelopment.
The cost-benefit analysis included the cost of the infra-structure to the utility, developer and the residents andthe benefits to the utility, which were quantified from thesavings accrued from the avoided costs of servicing lowervolumes of water and wastewater and from any deferralof investment in future supply-augmentation works.
The study is useful in terms of determining various waterand wastewater system options for each of the three typesof development common to all urban regions. It also pro-vides an indication of relative ranking of options for eachtype of development. However, as the study is focusedon options at the allotment level, the costs and evaluationof the options may not be applicable on a larger scalesuch as regional scale or estate scale.
The review of regulatory barriers in the study used a frame-work developed by a Victorian utility. However, the barri-ers identified are applicable in States that do not yet haveregulations that address the decentralised and on-site re-use systems.
5.19 Study 19: InfrastructureCharges ProjectThemes: demographics & land useThis report details the structure, inputs and outputs of anInfrastructure Demand Model (IDM) developed for GoldCoast Water. The IDM is an interactive user-friendly pro-gram designed to convert planning information into infra-structure demands. This in turn allows planning and de-signing for water and sewerage infrastructure specificallyfor the next ten years.
Various scenarios can be run through the model. The in-put data required includes:
• development type (within each of residential, business,industrial, community purpose, open space, other,special/introduced). Units are in dwellings/ha or ET/ha;
• yield factor 1: percentage of developable land within aspecific lot. This is used to account for future roads,floodplain areas etc;
• yield factor 2: percentage of likely development overmaximum development;
• historical information;
• existing information;
• projected override values (option to override standardgrowth projection);
• water billing consumption data (per lot) in kL/annum;and
• projected growth in households and commercialindustrial (in ET/hhlds or ET/employees).
The limitations of such a model include the reliability andconsistency of the input data. For example, the datasourced for ‘Tourist Residential Development Type’ in-cludes both residential and non-residential, without differ-entiating between the two.
There are very few such planning tools in the public do-main that project water demand for the non-residentialsector. This model is broadly applicable to other Austral-ian urban areas where similar input data sets are avail-able. The report recommends that future users take intoconsideration several issues, such as inclusion and main-tenance of all data sources and associated assumptions,that meter readings per individual lots are not always fea-sible and might distort results if this not accounted for.Other issues and recommendations are discussed in thereport.
36
WATER SERVICES ASSOCIATION OF AUSTRALIA - OCCASIONAL PAPER NO. 9 - URBAN WATER DEMAND FORECASTING & DEMAND MANAGEMENT
Significant StudiesContinued
5.20 Study20: Customer ResearchUnit ProgramThemes: water usage practices – socio-cultural factors, restrictions, regulation,income “In a Nutshell”, was prepared in 2002 by Sydney WaterCorporation and summarises “key discoveries ‘nutted out’in the ten-year history of Sydney Water’s Customer Re-search Unit”. ‘Nutshells’ are documents prepared by theCustomer Research Unit that distil the key communityviews on all aspects of water. For the purpose of this study,Section 5.20 will refer predominantly to nutshells relatedto water demand.
The views of customers presented in “In a Nutshell,” arebroadly relevant to other WSAA members that are urbanwater utilities of significant size. The information in thedocuments from which this report is collated, were col-lected via regular customer surveys over a period of tenyears. This comprehensive report covers community viewsin relation to pricing changes, drought restrictions andwater conservation at large.
“Water Conservation: Synthesis of Sydney Water’s cus-tomer research 1995–2003" is another significant reportby Sydney Water’s Customer Research Unit that distilskey findings from eleven community research projectsrelated to water conservation. The information gatheredfor these studies was collected predominantly via tel-ephone surveys of randomly selected customers, withsome deliberative polls and focus groups. This synthesisprovides a comprehensive summary of community viewson water use behaviour, water saving devices, rainwatertanks, recycled water, water restrictions and regulations,provision of sustainable services and communication andinformation. The document intends to aid water utilities inunderstanding such views on water conservation and iden-tifying gaps in sufficient knowledge about communityviews.
5.21 Study 21: ARCWIS researchThemes: demographics and land use, waterusing equipment, water usage practices –socio-cultural factors, restrictions,regulation, incomeOver the past few decades, the social research branch ofCSIRO, Australian Research Centre for Water in Society(ARCWIS), has undertaken extensive social research re-lated to customers’ water use. This work has primarily beenled by Dr Geoff Syme and Blair Nancarrow. More specifi-cally, Syme and Nancarrow has produced publications on:
• review and evaluation of educational residential waterconservation campaigns;
• assessing customer attitudes and preferences in relationto level of service, water restriction policies andalternative sources;
• priorities for social change in achieving urban waterconservation; and
• relationship between residential lot size and water use.
According to this literature, there is a current lack of qual-ity evaluations on the effectiveness of information cam-paigns related to water conservation. Those that do existare predominantly focused on short-term measures, suchas drought restrictions. The literature also indicates thatperceived outcomes depend heavily on the methodologyof the evaluation.
This research is in general applicable to all urban waterutilities. It provides an understanding of how communica-tion and education programs can and have influencedcustomers’ knowledge, awareness, attitudes and behav-iours and recognises the differences between these fourattributes.
37
WATER SERVICES ASSOCIATION OF AUSTRALIA - OCCASIONAL PAPER NO. 9 - URBAN WATER DEMAND FORECASTING & DEMAND MANAGEMENT
6 Findings and Conclusions
6.1 IntroductionFollowing the investigation of current Australian (and se-lected international) research on demand management,priority research areas have been identified and recom-mendations made.
Section 6 addresses:
• research gaps (general and specific findings andknowledge gaps);
• best practice characteristics for undertaking studiesrelated to factors influencing water demand and forundertaking demand management initiatives andevaluations;
• transferability of Australian studies to other utility areas;
• priority research areas; and
• recommendations for future research on priority areas,that is collaborative and cost-effective.
The outputs of this project are formatted in a user-friendly,interactive way to allow for searching under themes or bystudies and have been designed in such a way as to allowfor additions and updates to be made. This should facili-tate further collaboration between members of the waterindustry in Australia and further coherent research on un-derstanding water demand than has often been the case.
6.2 Research GapsResearch gaps can include gaps in data, knowledge andmanagement of research.
This section discusses:
• limitations of this study
• general findings; and
• data and knowledge gaps identified by both WSAAmembers and the ISF study team.
6.2.1 LimitationsThis project aimed to provide a picture of recent researchundertaken in Australia on understanding water demand.Whilst much of this research is presented in this docu-ment, it should be acknowledged that it is not a completeset of research studies. This is owing to a number of fac-tors, including:
• not all WSAA members were invited to participate inthe study. Some of these water utilities may haveundertaken studies relevant to this project;
• only a limited number of non-WSAA membersparticipated in this study. Some significant researchstudies on understanding water demand have beenundertaken by non-WSAA members, such as CSIRO.Some of these have been captured but not all.
• some knowledge within water utilities is difficult toaccess because of its existing format (e.g. assumptionsin models, anecdotal information, unpublished ongoingprograms). Whilst the templates were designed tocapture some of this information, time constraints andthe scope of the project itself did not allow all thisinformation to be extracted.
38
WATER SERVICES ASSOCIATION OF AUSTRALIA - OCCASIONAL PAPER NO. 9 - URBAN WATER DEMAND FORECASTING & DEMAND MANAGEMENT
7 This column indicates who identified the knowledge gaps.The Study Team refers to the ISF study team working onthis project on behalf of WSAA.
Findings and ConclusionsContinued
6.2.2 General findingsThis section summarises key findings in relation to theoverall research.
In general, a large amount of research is being undertakenin relation to factors influencing water demand and de-mand management initiatives. However, there is notenough coordination of the research to allow consistency,transparency, comprehensiveness and best-practice meth-odology.
The research in relation to demand management is cur-rently highly fragmented. In the U.S., this type of researchis being coordinated by AWWA in an effective and effi-cient manner that has allowed for significant advancementsin research and knowledge. In Australia, other water-re-lated areas are being well coordinated, such as water qual-ity. WSAA can play a key role in creating a coordinatedand efficient approach to research relating to water de-mand.The key findings are:• There is significant potential value for utility cooperation
to advance Australian research in demandmanagement. Benefits for utilities could include:
• increased efficiency;
• increased cost-effectiveness;
• reduced duplication;
• improved quality; and
• positioning Australian utilities at the forefront ofinternational demand management research.
• Availability and sharing of key knowledge sources isimportant if the potential for cooperation is to beachieved.
• Evaluation of programs is a critical step in determiningtheir effectiveness and how they can be improved.Results can feed into future models/forecasts forincreased accuracy.
• Applicability of data to different locations is limited andthere is still a need for local studies (due to variationsin local context such as climate, avoided costs foraverage and peak demands, tourism).
• Actual data resulting from existing studies may oftennot be transferable to other areas, because ofdifferences in biogeography, climate, socio-demographics, political climate etc. However, themethodologies, models or certain principles behindthose studies may be relevant and transferable.
• Many demand forecasting studies have relied onprojections of historical metered data, withoutconsidering end uses.
• Many climate correction model studies have now beenundertaken and there is a clear need for transparencyof methodology.
6.2.3 Data and Knowledge GapsThis section discusses data gaps related to research onfactors influencing trends in water demand in Australia.This information has been compiled from several sources:
• existing studies undertaken by WSAA members (viathose completed template received from the WSAAmembers);
• data gaps identified by some WSAA members intemplates and
• the research team’s expert knowledge of the state ofdemand management research in Australia.
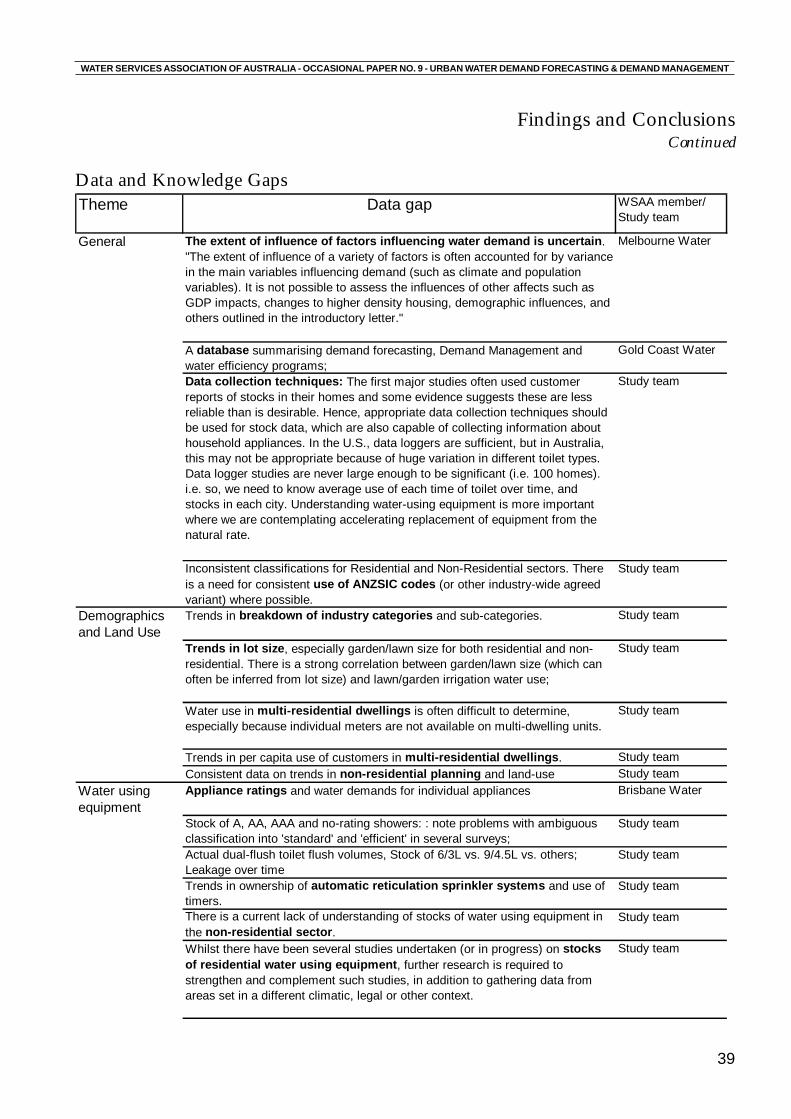
39
WATER SERVICES ASSOCIATION OF AUSTRALIA - OCCASIONAL PAPER NO. 9 - URBAN WATER DEMAND FORECASTING & DEMAND MANAGEMENT
Theme Data gap WSAA member/ Study team
General The extent of influence of factors influencing water demand is uncertain. "The extent of influence of a variety of factors is often accounted for by variance in the main variables influencing demand (such as climate and population variables). It is not possible to assess the influences of other affects such as GDP impacts, changes to higher density housing, demographic influences, and others outlined in the introductory letter."
Melbourne Water
A database summarising demand forecasting, Demand Management and water efficiency programs;
Gold Coast Water
Data collection techniques: The first major studies often used customer reports of stocks in their homes and some evidence suggests these are less reliable than is desirable. Hence, appropriate data collection techniques should be used for stock data, which are also capable of collecting information about household appliances. In the U.S., data loggers are sufficient, but in Australia, this may not be appropriate because of huge variation in different toilet types. Data logger studies are never large enough to be significant (i.e. 100 homes). i.e. so, we need to know average use of each time of toilet over time, and stocks in each city. Understanding water-using equipment is more important where we are contemplating accelerating replacement of equipment from the natural rate.
Study team
Inconsistent classifications for Residential and Non-Residential sectors. There is a need for consistent use of ANZSIC codes (or other industry-wide agreed variant) where possible.
Study team
Demographics and Land Use
Trends in breakdown of industry categories and sub-categories. Study team
Trends in lot size, especially garden/lawn size for both residential and non-residential. There is a strong correlation between garden/lawn size (which can often be inferred from lot size) and lawn/garden irrigation water use;
Study team
Water use in multi-residential dwellings is often difficult to determine, especially because individual meters are not available on multi-dwelling units.
Study team
Trends in per capita use of customers in multi-residential dwellings. Study teamConsistent data on trends in non-residential planning and land-use Study team
Water using equipment
Appliance ratings and water demands for individual appliances Brisbane Water
Stock of A, AA, AAA and no-rating showers: : note problems with ambiguous classification into 'standard' and 'efficient' in several surveys;
Study team
Actual dual-flush toilet flush volumes, Stock of 6/3L vs. 9/4.5L vs. others; Leakage over time
Study team
Trends in ownership of automatic reticulation sprinkler systems and use of timers.
Study team
There is a current lack of understanding of stocks of water using equipment in the non-residential sector.
Study team
Whilst there have been several studies undertaken (or in progress) on stocks of residential water using equipment, further research is required to strengthen and complement such studies, in addition to gathering data from areas set in a different climatic, legal or other context.
Study team
Data and Knowledge Gaps
Findings and ConclusionsContinued
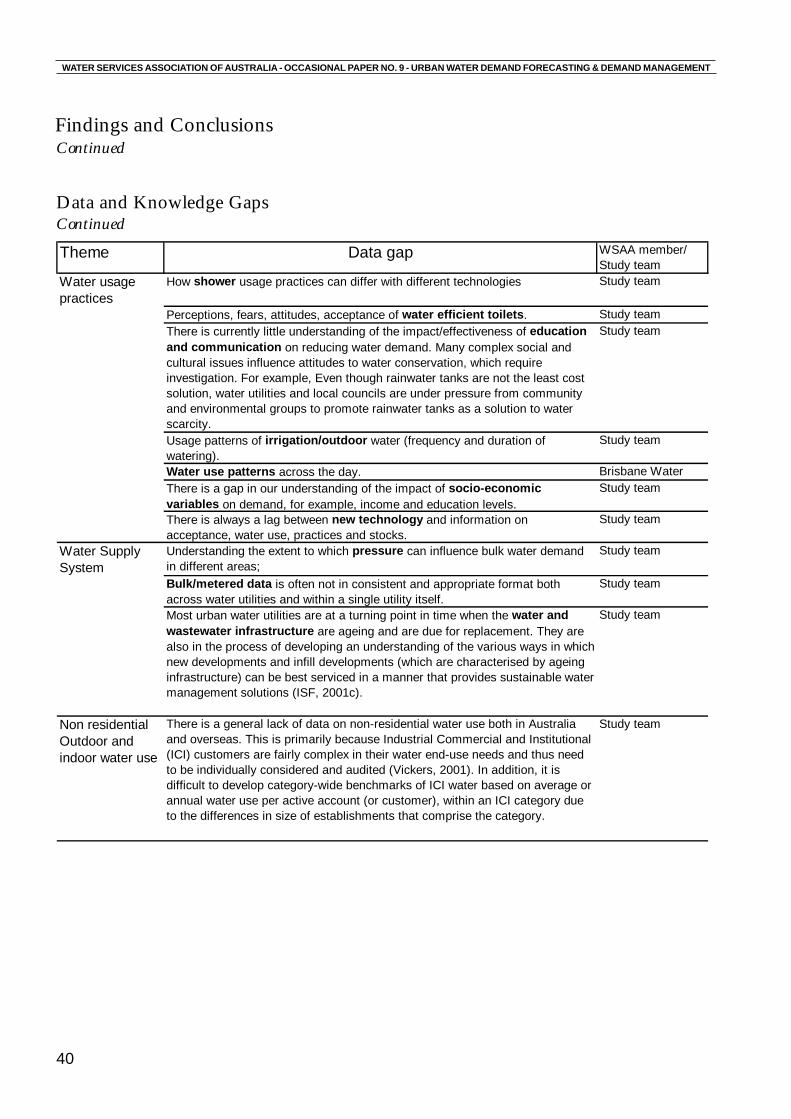
40
WATER SERVICES ASSOCIATION OF AUSTRALIA - OCCASIONAL PAPER NO. 9 - URBAN WATER DEMAND FORECASTING & DEMAND MANAGEMENT
Theme Data gap WSAA member/ Study team
Water usage practices
How shower usage practices can differ with different technologies Study team
Perceptions, fears, attitudes, acceptance of water efficient toilets. Study teamThere is currently little understanding of the impact/effectiveness of education and communication on reducing water demand. Many complex social and cultural issues influence attitudes to water conservation, which require investigation. For example, Even though rainwater tanks are not the least cost solution, water utilities and local councils are under pressure from community and environmental groups to promote rainwater tanks as a solution to water scarcity.
Study team
Usage patterns of irrigation/outdoor water (frequency and duration of watering).
Study team
Water use patterns across the day. Brisbane WaterThere is a gap in our understanding of the impact of socio-economic variables on demand, for example, income and education levels.
Study team
There is always a lag between new technology and information on acceptance, water use, practices and stocks.
Study team
Water Supply System
Understanding the extent to which pressure can influence bulk water demand in different areas;
Study team
Bulk/metered data is often not in consistent and appropriate format both across water utilities and within a single utility itself.
Study team
Most urban water utilities are at a turning point in time when the water and wastewater infrastructure are ageing and are due for replacement. They are also in the process of developing an understanding of the various ways in which new developments and infill developments (which are characterised by ageing infrastructure) can be best serviced in a manner that provides sustainable water management solutions (ISF, 2001c).
Study team
Non residential Outdoor and indoor water use
There is a general lack of data on non-residential water use both in Australia and overseas. This is primarily because Industrial Commercial and Institutional (ICI) customers are fairly complex in their water end-use needs and thus need to be individually considered and audited (Vickers, 2001). In addition, it is difficult to develop category-wide benchmarks of ICI water based on average or annual water use per active account (or customer), within an ICI category due to the differences in size of establishments that comprise the category.
Study team
Findings and ConclusionsContinued
Data and Knowledge GapsContinued
41
WATER SERVICES ASSOCIATION OF AUSTRALIA - OCCASIONAL PAPER NO. 9 - URBAN WATER DEMAND FORECASTING & DEMAND MANAGEMENT
Findings and ConclusionsContinued
6.3 Best Practice CharacteristicsBest practice characteristics are described in this sectionfor different types of studies related to 1. Factors influenc-ing water demand; and 2. Demand management initiatives.Best practice characteristics related to 1. and 2. are pro-vided for each of:
• water usage practices
• water using equipment
• demographics and land use
• climate
• source substitution
• water supply system.
6.3.1 Water Usage PracticesBest practice characteristics for studies on factors influ-encing water usage practices include:
• Pricing: Use climate correction to remove climaterelated variables and allow price elasticity to bedetermined;
• Knowledge and awareness:
• ensure representative and deliberative processesare used for public involvement;
• exploratory research using informal, open-endedface-to-face interviews, which allows participants toexpress their needs and concerns in their own words(compared to say choosing from a list of ‘answers’)may improve the accuracy of the responses;
• it is important to acknowledge that awareness oreven attitudes of the community to water use donot necessarily reflect behaviour (Morehead, 1989),that is, translate into action. There may be anincreased awareness of water conservation as aresult of a campaign, which may emerge from followup interviews and surveys but this may not result inactual reduction of water use;
• be clear about the objectives of the education andawareness program and evaluate it against theseoriginal objectives. Is the objective related toincreasing awareness? Attitude changes?Behavioural change?
Best practice characteristics for undertaking demand man-agement programs that change water usage practices in-clude:
• Pricing: Two-part inclining block price tariff is one ofthe most common ways of encouraging waterefficiency amongst customers. In response to the recentdrought a similar pricing structure is being implementedin the residential sector by some water utilities inAustralia.
• Pricing as a demand management measure is found tobe more effective in regions where outdoor water useforms a relatively large fraction of total water use, asthe demand for outdoor water is more elastic than thedemand for indoor water. The elasticity of the demandalso depends upon whether the measure is being takenas a short-term or emergency response to droughtevent or as a long-term demand management strategy.
Pricing policy should be aimed at:
• implementing water prices that reflect the cost ofproducing and supplying water;
• encouraging water saving practices and behaviourfrom both residential and non-residential customers;and
• Any changes in pricing structure should beaccompanied by other demand managementinitiatives. This is particularly important when pricingis being employed as a long-term demandmanagement strategy.
• Regulation. Regulation can play an important role incontributing to water demand management. Regulationcould be targeted either at water usage practice or atwater using equipment. The objective of suchregulation is to promote and encourage water efficientpractice or equipment.The most effective way of influencing installation ofwater efficient fixtures and devices in the newdevelopments is to incorporate clauses relating to waterefficient fixtures in the development controls of localcouncils.The availability of water efficient fixtures in the marketcan be influenced by implementing mandatory waterefficiency performance standards for water usingfixtures and appliances and mandatory water efficiencylabelling. Such regulation exists in the U.S.
• Restrictions. Climate correction of demand projectionhas been used by some water utilities for predictingthe water savings that can be expected from droughtrestrictions. There is opportunity for water utilities tocollaborate in relation to their experience and findingsfrom such restrictions to improve the understandingand predictability of water savings from droughtrestrictions.
42
WATER SERVICES ASSOCIATION OF AUSTRALIA - OCCASIONAL PAPER NO. 9 - URBAN WATER DEMAND FORECASTING & DEMAND MANAGEMENT
Findings and ConclusionsContinued
• Knowledge and awareness . An education andcommunication strategy can influence knowledge andawareness. Such a strategy should be seen as an integralpart of any demand management initiative.
6.3.2 Water using equipmentBest practice characteristics for undertaking a stock studyon water using equipment and appliances include:
• gather specific stock data and water-use data for eachtechnology using appropriate data collectiontechniques such as data loggers, technical in-house/building studies, surveys (e.g. face-to-face, telephone,diaries) and secondary data.
• consider opportunities for value adding to a datacollection exercise, as data collection can be tediousand expensive. For example, while gathering data,perform retrofits as well, as much of the cost of a retrofitis getting access to household. The technologiesthemselves and the additional labour costs forinstallation once inside the house are often very small.
• obtain time series information where possible.
• use end use analysis, including stock models.
Best practice characteristics for undertaking demand man-agement programs that relate to water using equipmentinclude:
• Least Cost Planning principles;
• use of regulatory requirements for all new andrenovated buildings to have water efficient appliances/fixtures (see Regulation);
6.3.3 Demographics and land useBest practice characteristics for undertaking a study onhow demographic factors influence water demand include:Collecting data on:
• number of households (or population) by dwelling type(e.g. single- or multi-dwelling);
• average household occupancy by dwelling type;
• density of multi-residential dwellings (i.e. units/lot);
• tenure type within dwelling type;
• lot size (including proportion of lawn/garden area);
• (other factors: dwelling age, household income);
• non-residential land use trends.
• Collect time series for all data sets that vary over time,including future projections where available.
6.3.4 ClimateBest practice characteristics for undertaking a study onhow climatic factors influence water demand include:
• the use of daily reservoir corrected demand, expressedin per capita or per connection terms;
• transparent methodology, including description of thedemand equations and the tests for significance, aswell as the variables tested and rejected.
6.3.5 Source SubstitutionBest practice characteristics for undertaking a study onhow source substitution can influence water demand in-clude:
• evaluation of the savings and the costs and benefitsusing transparent methods;
• use of whole-of-society life cycle costs.
6.3.6 Water Supply SystemBest practice characteristics for undertaking a study onhow factors relating to the water supply system influencewater demand include:
• for meter replacement programs, it is recommendedthat old meters be measured following theirreplacement to determine the effectiveness andusefulness of meter replacement.
• studies of leakage and other components ofunaccounted for water should use the currently agreedinternational framework and terminology.
6.4 Relevance of studies to otherareasAn objective of this overall research is to make informedrecommendations with respect to opportunities for col-laboration between WSAA members for further research.One way this can occur is through sharing methodologiesand results from existing studies. This section addressesthe general relevance or transferability of studies to otherwater utilities.
In general, the methodologies and models used in studiesare transferable from one urban area to another. How-ever, it is important to note that only best practice meth-odologies should be considered for use by other waterutilities. Transferability of results and recommendationsemerging from studies can range from relatively transfer-able to not at all. A popular belief in the U.S. (and Austral-ian) water conservation community is that primary datashould always be collected specifically for the study re-gion. It is often thought that transposing data from one
43
WATER SERVICES ASSOCIATION OF AUSTRALIA - OCCASIONAL PAPER NO. 9 - URBAN WATER DEMAND FORECASTING & DEMAND MANAGEMENT
Findings and ConclusionsContinued
region to another will result in inaccurate outcomes ow-ing to dissimilar characteristics of different cities and re-gions. While collecting primary data can be more accu-rate, it is often more expensive than collating existing data.Some factors to consider when assessing the transferabil-ity of data from one area are:
• reliability of the original data (including the studymethodology);
• applicability of the data to the water utility of concern(considering study region, study period, socio-demographics and climate); and
• sensitivity to variance of the original data when usedby another water utility in a specific study or analysis.
In order for some data types emerging from studies onwater usage practices to be applicable to other areas ofAustralia, other relevant variables would need to be rela-tively consistent. For example, a study in say, ‘Area 1’,which determined the elasticity of price changes on a par-ticular community, may only be applicable in ‘Area 2’ ifcertain variables or factors in ‘Area 2’ are relatively con-sistent with ‘Area 1’. Such factors in this case may include:
• owner occupant status;
• single-residential versus multi-residential;
• household occupancy;
• geographical distinction; and
• income levels and other socio-economic variables (suchas pensioner status).
Stocks of indoor water using technologies in a particulararea are often more transferable compared to those ofoutdoor technologies. Outdoor water using technologiesdepend more on local climatic and geographic character-istics. For example, evaporative air conditioners have sig-nificantly higher penetration rates in areas where evapo-ration rates are high, such as Western Australia, NorthernTerritory and some parts of Victoria. The prevalence ofwater efficient technologies and equipment in an area mayalso be affected by regulations or guidelines pertaining tothat region.
Information about stocks of water using equipment canonly be transferred in situations where other external fac-tors are similar. Some such factors may include climate,regulation, presence of water service companies, socio-economics and demographics.
Demographic, land use and climatic/geographic data aredifficult to apply to other areas, although the methodolo-gies are often transferable.
Factors of system losses, pressure, unaccounted for wa-ter, are typically relevant to all water utilities, however,
the extent will usually vary from utility to utility. The methodof determining this extent may be transferable from oneutility to another, as leakage management options are,while the quantitative results (costs and water savings) areusually system dependent.
Methods for assessing the extent of influence of sourcesubstitution on the bulk water supply are generally appli-cable to all urban areas in Australia, however, actual inputdata and resulting data may vary from region to regionowing to such factors as rainfall, local regulations, landarea, industry type and growth.
6.5 Priority research areasSections 6.1–6.4 identified research gaps, discussed find-ings and provided best-practice characteristics for under-taking research in this field. Section 6.5 draws togetherthe key areas in relation to water demand that requirefurther research. Some of these priority research areas canbe undertaken independently (potentially simultaneously),as they typically will involve a discrete group of special-ists. While other priority areas may need to be performedconsecutively as they may involve similar key personnel.
Priority area needs:
• Climate Correction. It would be useful for utilities tohave a consistent and transparent approach tocorrecting demand forecasting for climate. For example,consistent, historical and regularly updated reservoir-corrected bulk metered data preferably for each supplyzone, would assist in forecasting.
• Leakage and Pressure Reduction. In many instances,leakage management is the most cost effective demandmanagement option for water utilities to save the mostwater from the system. Widely understood knowledgeof savings achievable and techniques for leakagemanagement, similar to the IWA framework, wouldassist utilities.
• Demand Forecasting. Currently there is a range ofmodels used by water utilities. There are advantagesin each water utility developing one demand-forecasting model internally, to ensure consistencywithin the utility. It is also desirable to ensure allsignificant factors that influence water demand areincluded in such a model.
• Water Sensitive Urban Design (WSUD) (also referredto as Integrated Water Management or Total WaterCycle Management) encourages the integration ofwater services (such as water, wastewater andstormwater), which are traditionally managed inisolation. Of particular interest is the application of IWMto new infill and Greenfield sites. A significant number
44
WATER SERVICES ASSOCIATION OF AUSTRALIA - OCCASIONAL PAPER NO. 9 - URBAN WATER DEMAND FORECASTING & DEMAND MANAGEMENT
Findings and ConclusionsContinued
of recent studies commissioned by WSAA members(including case studies in relation to Edmondson Parkin Sydney and Pimpama-Coomera on the Gold-Coast)have demonstrated that for servicing new areas thereare potential water resource and economic savings inthese strategies. However, there is a need for a moreconsistent understanding (including assumptions,methods, terminology, costing etc) of the approachesused in these studies.
• End Use Analysis. Options (both demand and supply-side) can be compared using a least cost planningframework. This will enable the most cost effectiveoption to reduce water demand to be determined. Forexample, regulating minimum performance standardsfor water using appliances and equipment is often themost cost-effective demand management option,however, this would only emerge from undertakingend-use analysis to forecast demand.
• Outdoor Water Use. A significant proportion of urbanwater demand is outdoor water use. There are a limitednumber of research studies that assist in characterisingoutdoor water demand and the impact of programsdesigned to reduce demand for water in this importantgroup of end uses. However, there is currently aresearch project being undertaken, commissioned bythe Nursery and Garden Industry of Australia (NGIA)on behalf of the NGIA and WSAA (A. Currey, pers.comm.) and the results of this project will be widelyavailable and should be integrated into any futureresearch related to outdoor water used. Furtherresearch needs to be undertaken on both characterisingoutdoor water use and evaluating the effectiveness ofdemand management programs targeting outdoorwater use.
• Non-residential Water Use. The non-residential sectorcan vary between water utilities. However, it is often asignificant proportion (10–40%) of water demand.Significant savings per customer can potentially beachieved in the non-residential sector. Both water useand appropriate implementation of demandmanagement in this sector is poorly characterised.
• Rainwater Tank evaluation. Rainwater tank programsare often raised by the community as a preferred waterconservation measure and an increasing amount ofutility funds are being invested in rainwater tankprograms, especially rebate programs. There is a needto evaluate the impact of such programs and to ensurethat they are designed to maximise their effectiveness.Research questions that should be addressed include:what are the actual water savings that are achieved bythe program? What end uses are best supplied by rainwater (indoor and outdoor)? What is the magnitude of
other potential benefits (including those related tostormwater retention)?
• Community Preferences. There have been numerousstudies to date which address community preferenceson water use and restrictions (Syme et al, 1983, 1986,1990, 2000; Roseth, 2003; Newton Wayman Chong& Associates, 2001a, 2001b, 2001c). However, agreater level of engagement of the community, throughmore deliberative and representative participatorydecision-making processes (Carson and Gelber 2001)is required in a range of areas related to thedevelopment of demand management strategies, thereliability of water supply, water pricing and theappropriate balance between demand and supply-sideoptions.
• Education and Communication. Education andcommunication should be an integral part of anydemand management initiative. Further research isrequired to increase understanding of how education,communication and awareness campaigns caninfluence water demand and which approaches aremost effective and acceptable. Evaluations of varioustypes of education and awareness programs can beundertaken to understand their effectiveness andimpact on behavioural and attitudinal change.
• Evaluation of demand management programs. Thereis limited experience in Australia of measuring theeffectiveness of demand management programs.Following implementation of a demand managementinitiative, evaluation (monitoring and assessment)should always be undertaken at an appropriate time.
45
WATER SERVICES ASSOCIATION OF AUSTRALIA - OCCASIONAL PAPER NO. 9 - URBAN WATER DEMAND FORECASTING & DEMAND MANAGEMENT
6.6 Recommendations
This section outlines the recommendations made by thestudy team that address the research gaps identified inSection 6.2 Research Gaps. The recommendations havebeen developed with the following objectives in mind:
• potential opportunities for collaboration betweenWSAA members;
• addressing overdue and fast-moving research topics;
• this research is extensive in breadth. It enabled ascreening of the research to date on factors influencingwater demand and demand management initiatives andpriorities for next steps to be determined. Thus, thenext stage should enable depth of research.
The recommendations on further research to address keyresearch gaps identified in this research are a suite of ac-tions summarised as follows:
6.6.1 Continued detailed researchon priority areasFurther research on priority areas identified from the gapanalysis could involve:
• Literature reviews;
• International best-practice comparisons; and
• Structured interviews with key experts.
This would enable depth of research to be achieved, fol-lowing the breadth of this first stage to screen for the pri-ority research areas. This research could be undertaken incollaboration with various WSAA members. Such studiescould include:
• Development of residential stock studies to collect dataon water using equipment, water usage practices,residential lot sizes;
• Collection of information on multi-residential householdwater demand trends;
• Collection of non-residential trends in industry sectors;
• Further developing programs for individual metering onmulti-residential dwellings;
• Evaluation of the non-residential programs that havebeen implemented by various water utilities and resultsfrom such evaluations be published for sharing amongstthe water utilities.
• Determining the influence of rainwater tanks on wateruse behaviour and total water demand; Understandingthe perceptions of the community about the role ofrainwater tanks as a water conservation measure andthe motivating factors behind their willingness to payfor rainwater tanks will provide valuable informationto water utilities enabling more informed prioritising ofDM programs. This could also provide water utilitieswith an insight into the community’s willingness to pay,which could in turn be used for improving theparticipation rate of demand management programsthat are more cost effective than rainwater tanks .
• A collaborative research project focusing on sustainablesolutions for the three types of development(Greenfield, Backlog areas and Infill) on a range ofscales will prove valuable, as it will help with thedevelopment of a consistent approach to watermanagement across all utilities in different States. Itwill also provide an impetus to the development of aconsistent set of regulations and standards fordecentralised systems, which are often part of thesustainable solution for such developments.
46
WATER SERVICES ASSOCIATION OF AUSTRALIA - OCCASIONAL PAPER NO. 9 - URBAN WATER DEMAND FORECASTING & DEMAND MANAGEMENT
RecommendationsContinued
6.6.2 Research Forum SeriesThe Research Forum series would complement the
detailed research on priority areas. The purpose of theForums is to provide an efficient, cost-effective, immedi-ate means of substantially advancing knowledge and re-search in priority areas related to water demand in Aus-tralia. A Forum could combine several related priority ar-eas. It is recommended that a Forum be held each quarter(on average), hosted at various locations (or ‘online’). Theoutputs of such Forums could be:
• research issues papers (developed prior to workshop,to determine what are the key research questionsrelated to the Forum topic and who should attend);
• publication of all papers presented;
• focused recommendations made to the WSAA WaterHealth Environment and Sustainability Committee;
• consistent and transparent approach to water de-mand knowledge and research across all WSAA members.Recommended research priority areas which could war-rant such a Forum include:
• Climate Correction
• Leakage and Pressure Reduction
• Demand Forecasting
• Integrated Water Resource Planning
• End Use Analysis
• Outdoor Water Use
• Non-residential Water Use
• Community Preferences
• Education and Communication
• Evaluation of programsSuggested priority timeline is provided in Figure 7.
6.6.3 Ongoing collaborationbetween WSAA and WSAAmembers
It is recommended that WSAA coordinate the on-going collaboration of research on water demand. It isrecommended that a framework or process be developedto ensure the continuation of such collaboration. This maywork within the existing structure of the Research Com-mittee. For example, overseeing the recommendationsemerging from the Research Forums (described in 3 above)and updating the proposed CD (or website) as new re-search becomes available.
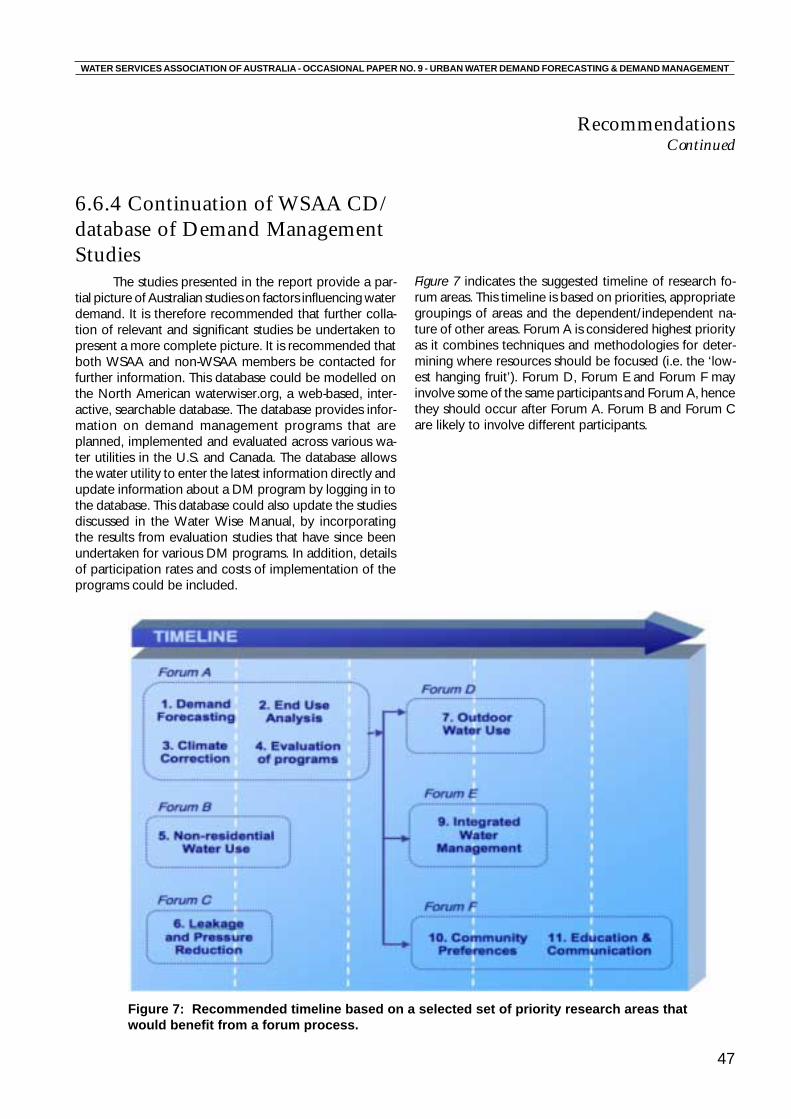
47
WATER SERVICES ASSOCIATION OF AUSTRALIA - OCCASIONAL PAPER NO. 9 - URBAN WATER DEMAND FORECASTING & DEMAND MANAGEMENT
Figure 7: Recommended timeline based on a selected set of priority research areas thatwould benefit from a forum process.
RecommendationsContinued
6.6.4 Continuation of WSAA CD/database of Demand ManagementStudies
The studies presented in the report provide a par-tial picture of Australian studies on factors influencing waterdemand. It is therefore recommended that further colla-tion of relevant and significant studies be undertaken topresent a more complete picture. It is recommended thatboth WSAA and non-WSAA members be contacted forfurther information. This database could be modelled onthe North American waterwiser.org, a web-based, inter-active, searchable database. The database provides infor-mation on demand management programs that areplanned, implemented and evaluated across various wa-ter utilities in the U.S. and Canada. The database allowsthe water utility to enter the latest information directly andupdate information about a DM program by logging in tothe database. This database could also update the studiesdiscussed in the Water Wise Manual, by incorporatingthe results from evaluation studies that have since beenundertaken for various DM programs. In addition, detailsof participation rates and costs of implementation of theprograms could be included.
Figure 7 indicates the suggested timeline of research fo-rum areas. This timeline is based on priorities, appropriategroupings of areas and the dependent/independent na-ture of other areas. Forum A is considered highest priorityas it combines techniques and methodologies for deter-mining where resources should be focused (i.e. the ‘low-est hanging fruit’). Forum D, Forum E and Forum F mayinvolve some of the same participants and Forum A, hencethey should occur after Forum A. Forum B and Forum Care likely to involve different participants.
48
WATER SERVICES ASSOCIATION OF AUSTRALIA - OCCASIONAL PAPER NO. 9 - URBAN WATER DEMAND FORECASTING & DEMAND MANAGEMENT
BibliographyAWWA Research Foundation (1999), Residential EndUses of Water, AWWARF, Denver.
AWWA Research Foundation (2000), Commercialand Institutional End Uses of Water, AWWARF,Denver.
Beecher, J. A. (1995), Integrated Resource PlanningFundamentals, AWWA Journal, AWWA, June 1995,p34-48.
Brisbane Water (2000), Rainfall Projections, BrisbaneWater, Brisbane.
Brisbane Water (n.d-a), Demand Management andRainwater Tanks, Brisbane Water, Brisbane.
Brisbane Water (n.d-b), Water Conservation -Community/Industry and Commercial Program,Brisbane Water, Brisbane.
Brisbane Water (n.d-c), Water Conservation - SchoolsEducation Program, Brisbane Water, Brisbane.
Brisbane Water (n.d-d), Water Demand Projections,Brisbane Water, Brisbane.
Cordell, D. and Robinson, J (2003) Collectingresidential end use data from primary sources: do’sand don’ts. Proceedings of Efficient 2003, TheSecond International Water Association Conference onWater Efficiency, April 2 - 4, 2003, Tenerife, Spain.
CSIRO Urban Water (2001), Review of SydneyWater’s Climate Corrected Demand Model, SydneyWater Corporation, Melbourne.
CSIRO Urban Water (2002), Perth Domestic Water-Use Study; Household Appliance Ownership andCommunity Attitudinal Analysis 1999-2000,Australian Research Centre for Water in Society,CSIRO Land and Water,
Darmody, J, Maddaus, W and Beatty, R (1998), Wateruse surveys improve the effectiveness of demandmanagement, Proceedings of the 11th IWSA-ASPACRegional Conference, Integrating the Urban WaterCycle, Sydney, 1-5 November 1998.
Day, D. & White, S. (2002), Minimum PerformanceStandards for Showerheads in Australia - the Benefitsand the Barriers’ Proceedings of the InternationalWater Association Congress, Melbourne, April 2002.
Dickinson, M. & Maddaus, W. (2002), Benefits of theUnited States Nationwide Plumbing EfficiencyStandard’ Proceedings of the International WaterAssociation Congress, Melbourne, April 2002.
Dziegielewski, B. (2002), Statistical Methods forEvaluating the Impacts of Water ConservationMeasures, Planning, Evaluation and ResearchCommittee, AWWA Water Conservation Division, LasVegas, Nevada.
Energy Efficient Strategies (2001), GreeningWhitegoods: A Report into the Energy EfficiencyTrends of Major Household Appliances in Australiafrom 1993 -1999, National Appliance and EquipmentEnergy Efficiency Program, The National Applianceand Equipment Energy Efficiency Committee,Australian Greenhouse Office, Canberra.
Fane S. J. M. White S. (2001), Sustainable UrbanWater Futures, Retail Water Companies for the WaterResources Strategy Committee for the MelbourneArea and the Institute for Sustainable Futures,University of Technology, Sydney, Melbourne.
Fane S. R. J. White S. (2002), The Use of LevelisedCost in Comparing Supply and Demand SideOptions, Institute for Sustainable Futures, Universityof Technology, Sydney, Sydney, NSW.
Gold Coast Water (1997-2003), Consumption BasedWater Pricing for Residential and Non-ResidentialCustomers, prepared for Gold Coast Water, Gold Coast.
Gold Coast Water (2002a), Infrastructure ChangesReport - Infrastructure Demand Model Report, GoldCoast Water,
Gold Coast Water (2002b), Non-Residential WaterSaving Incentive Scheme, Gold Coast Water(Consumer Services),
Gold Coast Water (2002c), Pimpama-CoomeraIntegrated Water Master Plan - Agenda Item, GoldCoast Water,
49
WATER SERVICES ASSOCIATION OF AUSTRALIA - OCCASIONAL PAPER NO. 9 - URBAN WATER DEMAND FORECASTING & DEMAND MANAGEMENT
BibliographyContinued
Gold Coast Water (2002d), Recycled WaterManagement Strategy, Gold Coast Water (TreatmentServices), Gold Coast.
Gold Coast Water (2002e), Residential and Non-Residential Water Pricing Communications, GoldCoast Water (Consumer Services), Gold Coast.
Gold Coast Water (2002f), Residential Water SavingIncentive Scheme, Gold Coast Water,
Gold Coast Water (2002g), Water Consumption in theTourism Industry, Gold Coast Water (Retail Services),
Gold Coast Water (2002h), Water Futures DiscussionPaper, Gold Coast Water,
Hunt Theodore, L. D., Berg Joe, Wiedmann John, AshTom, Pagano David, Marian Michael, Bamezai Anil,(2001), Residential Weather-Based IrrigationScheduling: Evidence from the Irvine “ETController” Study, Irvine Ranch Water District,
Hunter Water Corporation (2001), Design DemandReview, Hunter Water Corporation,
Hunter Water Corporation (2001-2002), AverageResidential Consumption Variability, Hunter WaterCorporation, Newcastle.
Hunter Water Corporation (2002a), DemandManagement Initiative: Demand Management, WaterEfficiency and Reuse in the Lower Hunter Region ofNSW, Hunter Water Corporation,
Hunter Water Corporation (2002b), ResidentialConsumption Cultural Impact, Hunter WaterCorporation, Newcastle.
Hunter Water Corporation (2002-2004), ResidentialPeak Demand and Pressure Management, HunterWater Corporation,
Institute for Sustainable Futures (1998), Towards aSustainable Water Future: the Sydney Water LeastCost Planning Study, research report prepared forSydney Water Corporation, November.
Institute for Sustainable Futures (1998), Least CostPlanning Study - Phase One Report, Sydney WaterCorporation, Sydney.
Institute for Sustainable Futures (2001), SustainableUrban Water Futures, South East Water, for the RetailWater Companies for the Water Resource StrategyCommittee for the Melbourne Area, Melbourne.
Institute for Sustainable Futures (2000), Evaluation ofShellharbour Residential Retrofit Program, SydneyWater Corporation, Sydney.
Institute for Sustainable Futures (2001a), Evaluationof the Demand Reduction for the “Every DropCounts” Residential Retrofit Program, Sydney Water,26, Sydney.
Institute for Sustainable Futures (2002), A Pilot Toiletand Shower Water Use Study: A follow-up to thePerth Domestic Water Use Study. Prepared for WaterCorporation of Western Australia and Yarra ValleyWater. ISF, UTS, Sydney.
Institute for Sustainable Futures (2002), TheKalgoorlie-Boulder Water Efficiency Program:Evaluation and Next Steps, Water Corporation ofWestern Australia, Kalgoorlie.
Institute for Sustainable Futures and CSIRO UrbanWater (2001), Melbourne End Use and WaterConsumption Influences Study, the Retail WaterCompanies for the Water Resource StrategyCommittee for the Melbourne Area, Melbourne.
Lawson, H. W. (1984), Streaky Bay Water UsageSurvey Program: Stage I Report, South AustraliaWater & Engineering and Water Supply Department,Adelaide.
Loh, M. and Coghlan, P. (2003), Domestic Water UseStudy: In Perth, Western Australia 1998-2001, WaterCorporation of Western Australia, Perth.
Lovell H. W. S. Young E. (2000), Sydney WaterDrought Response Planning, Institute for SustainableFutures, Sydney Water Corporation, Sydney.
Maheepala, S. A. Booker N. and Syme G. (2002),Recommendations for Developing a Framework forAssessing Sustainability of Urban Water Systems,CSIRO Urban Water,
50
WATER SERVICES ASSOCIATION OF AUSTRALIA - OCCASIONAL PAPER NO. 9 - URBAN WATER DEMAND FORECASTING & DEMAND MANAGEMENT
BibliographyContinued
Mann, T. K. (1984), Streaky Bay Water Usage SurveyProgram: Evaluation of the Summer 1983/84Campaign, South Australia Water & Engineering andWater Supply Department, Adelaide.
Metropolitan Water Authority (1985), Domestic WaterUse in Perth, Western Australia: Working Papers, Vol3. Chapter 37, Socio-Economic, Attitudinal andBehavioural Influences on Scheme Water Use inPerth 1981-82, Metropolitan Water Authority: Perth.
Mitchell, C. and White, S. (2003), Sustainable UrbanWater Service Systems, paper prepared for OzWaterConference, 8th-11th April 2003, Perth.
Montgomery Watson (1998a), Master Water andWastewater Network Modelling and OptimisationStudy - Bulk Water Production Modelling,Preliminary Report, Gold Coast Water,
Montgomery Watson (1998b), Master Water andWastewater Network Modelling and OptimisationStudy - Water Pricing Impacts Study for Gold CoastCity Council, Preliminary Report, Gold Coast CityCouncil, Gold Coast.
Montgomery Watson (1998c), Master Water andWastewater Network Modelling and OptimisationStudy - Water Supply Standards of Service for GoldCoast Water, Gold Coast Water,
Montgomery Watson (1999), Southport WestReservoir Zone Leakage Study - Stage 1 PreliminaryLeakage Assessment for Gold Coast Water, GoldCoast Water,
Morehead, A. and Penman, R. (1989), FederalGovernment Information Campaigns: A CriticalReview, Communication Research Institute ofAustralia,
Nancarrow Blair E. Kaercher, J. and Po Murni.,(2002), Community Attitudes to Water Restrictions,Policies and Alternative Sources; a LongitudinalAnalysis 1988-2002, Australian Research Centre forWater in Society, CSIRO Land and Water,
Newton Wayman Chong & Associates (2001a),Customer Preferences on Water Resource Issues - aResearch Report, the Water Resource StrategyCommittee for the Melbourne Area, 26, Melbourne.
Newton Wayman Chong & Associates (2001b),Customer Value Study - Quantitative Research Stage -a Research Report, System Security Standards StudyGroup, 70, Melbourne.
Newton Wayman Chong & Associates (2001c),Customers Value Study - a Research Report onQualitative Stage, System Security Standards StudyGroup, 72, Melbourne.
NSW EPA (2000), Who Cares About theEnvironment? NSW Environment ProtectionAuthority, Sydney.
NSW EPA (2001), What We Need Is . . . A CommunityEducation Project, NSW Environmental ProtectionAuthority, Sydney.
Penman, R. (2000), Design for Good Living: ACommuncations Plan to Meet the Information Needsof Clients, Designers and Builders, Institute forSustainable Futures, Sydney.
Po Murni, Syme. G. and Nancarrow Blair E., (2002),The Development of a Methodology for AssessingCustomer Preferences for Levels of Service:Continuity of Supply, CSIRO Urban Water Program,
PriceWaterhouseCoopers and CSIRO Urban Water(2002), Impact of Price Structure on Demand forServices, Sydney Water Corporation, Sydney.
Roseth, N. (2003), Water Conservation: Synthesis ofSydney Water’s customer research 1995-2003,Customer Research Unit, Sydney Water Corporation,Sydney.
Sherriff, S. (1995), Water Conservation - Benefits toCouncil and Community, Gold Coast Water, GoldCoast.
Smith, M. & Hoey, P. (1983), Proposal for a WaterConservation Programme for Streaky Bay, S.A.Water, Engineering and Water Supply Department,Adelaide.
51
WATER SERVICES ASSOCIATION OF AUSTRALIA - OCCASIONAL PAPER NO. 9 - URBAN WATER DEMAND FORECASTING & DEMAND MANAGEMENT
BibliographyContinued
South Australia Water (1978), Metropolitan AdelaideWater Resource Study Summary, Recommendationsand Study Details, S.A. Water, Adelaide.
South Australia Water (1983-84), Streaky Bay WaterUsage Survey Program, Engineering and WaterSupply Department, Adelaide.
South Australia Water (2001/2a), Review of DemandManagement/Water Conservation Initiatives EyrePeninsula, South Australia Water, Streaky Bay.
South Australia Water (2001/2b), Water ConservationPartnership Program (WCPP), S.A. WaterCorporation
Department for Environment and Heritage,Department for Water Land Biodiversity andConservation, Local Government Association,Catchment Water Management Board, Planning S.A.,River Murray Urban Users Committee, CSIRO,Adelaide.
South Australia Water (2003-5), Mawson LakesReclaimed Water Scheme, S.A. Water, Adelaide.
South Australia Water (2003-2005), Water ProofingAdelaide Study, South Australia Water, Adelaide.
South Australia Water, Sinclair Knight Merz andDepartment of Civil Engineering University ofAdelaide (1998-2001), Water Demand and ReservoirInflow Forecasting Models for Sa Water’s WaterSupply Headworks, S.A. Water, Adelaide.
Staddon Consulting Services (1992), Urban WaterConservation - Quantitative Research Volume 1:Findings and Implications, Water ResourceCommission, 40, Brisbane.
Sydney Water Corporation (1999+-a), Every DropCounts - Residential Indoor Retrofits, Sydney WaterCorporation, Sydney.
Sydney Water Corporation (1999+-b), Every DropCounts - Residential Outdoor Program, Sydney WaterCorporation, Sydney.
Sydney Water Corporation (1999+-c), RecyclingProgram, Sydney Water Corporation, Sydney.
Sydney Water Corporation (2001/02a), ActiveLeakage Program, Sydney Water Corporation,Sydney.
Sydney Water Corporation (2001/02b), Every DropCounts Business Program, Sydney WaterCorporation, Sydney.
Sydney Water Corporation (2002a), In a Nutshell: ACollection of the Key Discoveries “Nutted out” in theTen-Year History of Sydney Water’s CustomerResearch Unit, Sydney Water Corporation, Sydney.
Sydney Water Corporation (2002b), WaterConservation and Recycling Implementation Report,Sydney Water Corporation, Sydney.
Sydney Water Corporation (2002/03), Every DropCounts - Residential Program 2002/03, Sydney WaterCorporation, Sydney.
Sydney Water Corporation (2002/03+), Every DropCounts - Outdoor Foundation and LandscapeAssessment Program, Sydney Water Corporation,Sydney.
Syme G, Salerian S. (1983), Can Household AttitudesPredict Water Consumption? The Institution ofEngineers, Australia, Presented at the Hydrology andWater Resources Symposium, Hobart.
Syme. G. Thomas J. & Gosselink Y. (1983),Household Responses to Changes in the Price ofWater in Perth, Western Australia, The Institution ofEngineers, Australia, Presented at the Hydrology andWater Resources Symposium, Hobart.
Syme G. Nancarrow B. (n.d), Priorities for SocialChange for Achieving Metropolitan WaterConservation, Australian Research Centre for Water inSociety, CSIRO Land and Water, University of SouthAustralia, Adelaide.
Syme, G. and Seligman, C. (1987), The Planning andEvaluation of Public Information Campaigns toEncourage Water Conservation. In Proceedings of theNational Workshop on Urban Demand Management,AWRC Conference Series No. 14, April-1 May 1986,Perth Cultural Centre, Australia, pp 601-656, Perth.
52
WATER SERVICES ASSOCIATION OF AUSTRALIA - OCCASIONAL PAPER NO. 9 - URBAN WATER DEMAND FORECASTING & DEMAND MANAGEMENT
BibliographyContinued
Syme, G., Oborn, V, Sumner, N. & Bradshaw, B.(1990), Chipping Off the Block: Opportunities forSmall Lot Size to Promote Efficient Domestic WaterUse, CSIRO Division of Water Resources and WaterAuthority of Western Australia, Perth.
Syme G., S., Nancarrow B., E., Seligman C., (2000),The Evaluation of Information Campaigns toPromote Voluntary Household Water Conservation in,Evaluation Review, Volume 24, No 6, SagePublications, Inc., 539-578,
Urban Water Research Association of Australia(1989), Leakage Management - Assessing the Effectof Pressure Reduction on Losses from WaterDistribution Systems, Hunter Water Corporation,Newcastle.
Victoria Transport Policy Institute 2003, Least CostTransportation Planning: Creating an UnbiasedFramework For Transport Planning, [Online]available at: http://www.vtpi.org/tdm/tdm21.htm(Accessed 19/8/03).
Viswanathan, M. (1991), Effects of Controls on WaterConsumption; Research Report No. 31, Urban WaterResearch Association of Australia for the HunterWater Board, NSW, Newcastle.
Waldron T. (n.d), Not All Water Losses Are ThisObvious: The CEOs and Councillors’ Guide to WaterSystem Management, Wide Bay Water, Hervey Bay,Queensland.
Water and Rivers Commission (2002), Draft - StateWater Conservation Strategy for Western Australia,Office of Water Regulation, Government of WesternAustralia, 58, Perth.
Water Loss Analysis (1984-85), Final Report for theHunter District Water Board - Comparative ZoneMeasurement, Hunter District Water Board,Newcastle.
Water Resources Strategy Committee for theMelbourne Area (2001), Discussion Starter: Stage 1in Developing a Water Resources Strategy for theGreater Melbourne Area, Victorian Government, 80,Melbourne.
Water Resources Strategy Committee for theMelbourne Area (2002a), 21st Century Melbourne: AWatersmart City - Final Report - Summary, VictorianGovernment, 20, Melbourne.
Water Resources Strategy Committee for theMelbourne Area (2002b), Strategy Directions ReportStage 2 in Developing a Water Resources Strategy forthe Greater Melbourne Area, Melbourne Water, 132,Melbourne.
White, S. (1994), Blueprint for a Water-Efficient City:Report of the Kalgoorlie-Boulder Water UseEfficiency Study, Water Authority of WesternAustralia, Perth.
White, S. (1998), Wise Water Management: ADemand Management Manual for Water Utilities,Water Services Association of Australia ResearchReport #86, November 1998, Sydney.
White, S., Reidy, C. and Milne, G. (2003), End UseAnalysis: Issues and Lessons. Proceedings ofEfficient 2003, The Second International WaterAssociation Conference on Water Efficiency, April 2 -4, 2003, Tenerife, Spain.
Yann Campbell Hoare Wheeler (1992), Elasticity ofDemand for Domestic Water in Melbourne - aQuantitative Research Study, Melbourne Water,Melbourne.
Zhou, S. L., & McMahon, T.A. (1997), Report onDemand Forecasting Model for Metropolitan Area ofMelbourne, Melbourne Water and University ofMelbourne, Melbourne.
Zhou, S. L., McMahon, T.A., & Wang, Q.J. (1997),Frequency Analysis of Daily Water Consumption forMetropolitan Area of Melbourne, Melbourne Waterand University of Melbourne, Melbourne.
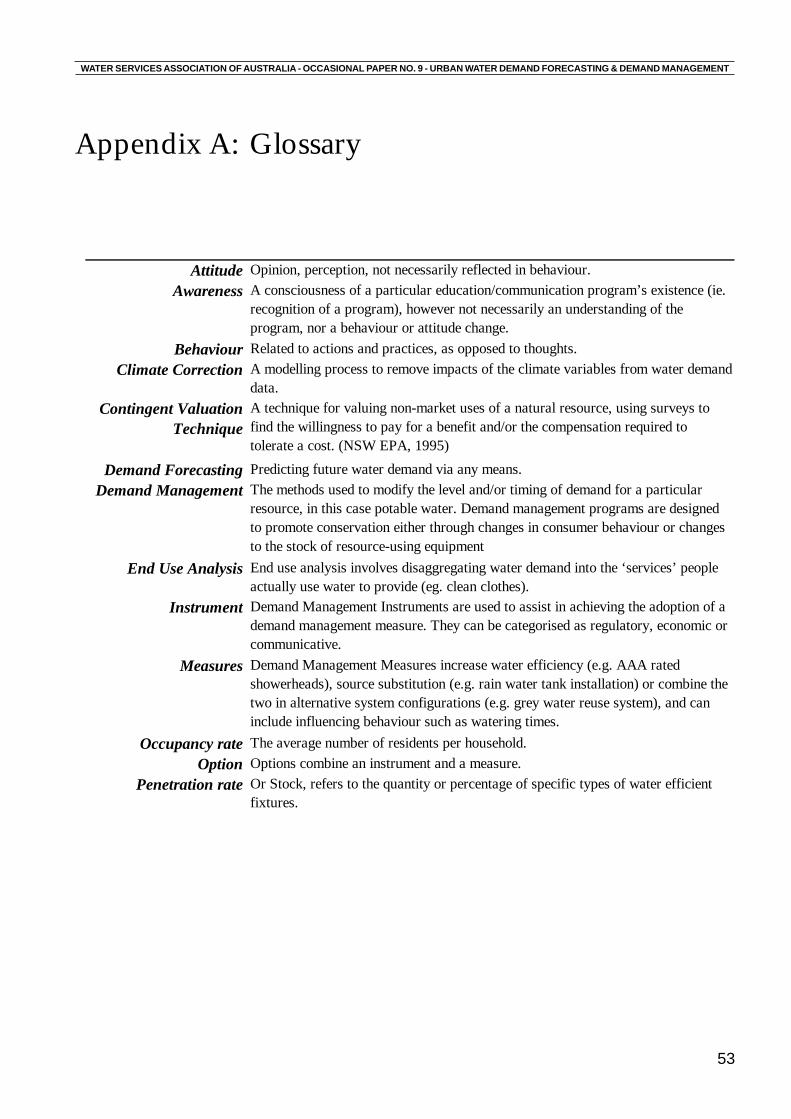
53
WATER SERVICES ASSOCIATION OF AUSTRALIA - OCCASIONAL PAPER NO. 9 - URBAN WATER DEMAND FORECASTING & DEMAND MANAGEMENT
Attitude Opinion, perception, not necessarily reflected in behaviour.Awareness A consciousness of a particular education/communication program’s existence (ie.
recognition of a program), however not necessarily an understanding of the program, nor a behaviour or attitude change.
Behaviour Related to actions and practices, as opposed to thoughts.Climate Correction A modelling process to remove impacts of the climate variables from water demand
data.Contingent Valuation
TechniqueA technique for valuing non-market uses of a natural resource, using surveys to find the willingness to pay for a benefit and/or the compensation required to tolerate a cost. (NSW EPA, 1995)
Demand Forecasting Predicting future water demand via any means.Demand Management The methods used to modify the level and/or timing of demand for a particular
resource, in this case potable water. Demand management programs are designed to promote conservation either through changes in consumer behaviour or changes to the stock of resource-using equipment
End Use Analysis End use analysis involves disaggregating water demand into the ‘services’ people actually use water to provide (eg. clean clothes).
Instrument Demand Management Instruments are used to assist in achieving the adoption of a demand management measure. They can be categorised as regulatory, economic or communicative.
Measures Demand Management Measures increase water efficiency (e.g. AAA rated showerheads), source substitution (e.g. rain water tank installation) or combine the two in alternative system configurations (e.g. grey water reuse system), and can include influencing behaviour such as watering times.
Occupancy rate The average number of residents per household. Option Options combine an instrument and a measure.
Penetration rate Or Stock, refers to the quantity or percentage of specific types of water efficient fixtures.
Appendix A: Glossary
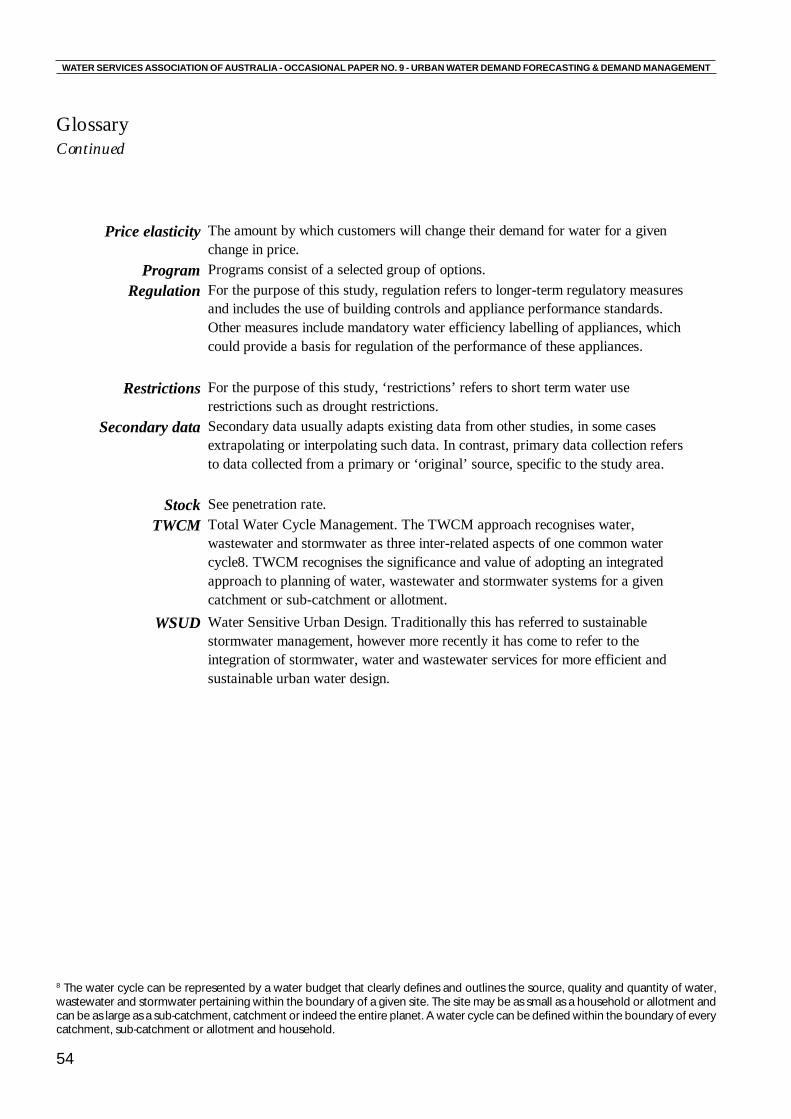
54
WATER SERVICES ASSOCIATION OF AUSTRALIA - OCCASIONAL PAPER NO. 9 - URBAN WATER DEMAND FORECASTING & DEMAND MANAGEMENT
8 The water cycle can be represented by a water budget that clearly defines and outlines the source, quality and quantity of water,wastewater and stormwater pertaining within the boundary of a given site. The site may be as small as a household or allotment andcan be as large as a sub-catchment, catchment or indeed the entire planet. A water cycle can be defined within the boundary of everycatchment, sub-catchment or allotment and household.
GlossaryContinued
Price elasticity The amount by which customers will change their demand for water for a given change in price.
Program Programs consist of a selected group of options.Regulation For the purpose of this study, regulation refers to longer-term regulatory measures
and includes the use of building controls and appliance performance standards. Other measures include mandatory water efficiency labelling of appliances, which could provide a basis for regulation of the performance of these appliances.
Restrictions For the purpose of this study, ‘restrictions’ refers to short term water use restrictions such as drought restrictions.
Secondary data Secondary data usually adapts existing data from other studies, in some cases extrapolating or interpolating such data. In contrast, primary data collection refers to data collected from a primary or ‘original’ source, specific to the study area.
Stock See penetration rate.TWCM Total Water Cycle Management. The TWCM approach recognises water,
wastewater and stormwater as three inter-related aspects of one common water cycle8. TWCM recognises the significance and value of adopting an integrated approach to planning of water, wastewater and stormwater systems for a given catchment or sub-catchment or allotment.
WSUD Water Sensitive Urban Design. Traditionally this has referred to sustainable stormwater management, however more recently it has come to refer to the integration of stormwater, water and wastewater services for more efficient and sustainable urban water design.
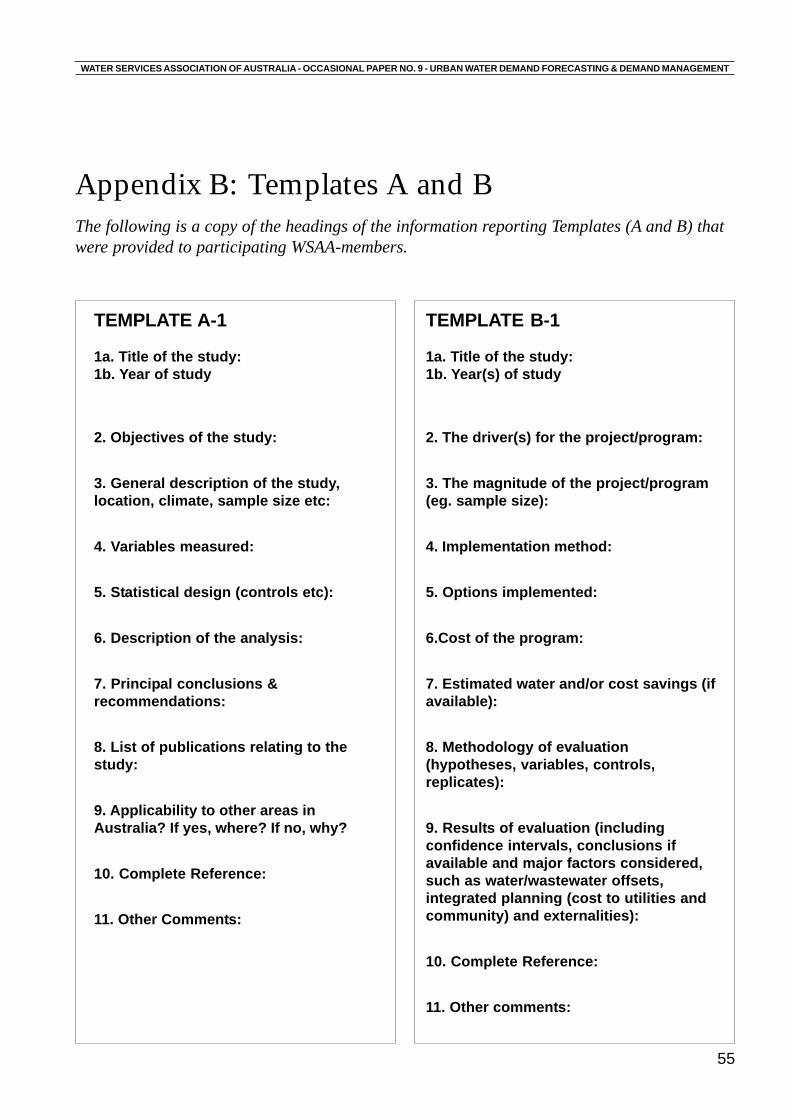
55
WATER SERVICES ASSOCIATION OF AUSTRALIA - OCCASIONAL PAPER NO. 9 - URBAN WATER DEMAND FORECASTING & DEMAND MANAGEMENT
Appendix B: Templates A and B
TEMPLATE A-1
1a. Title of the study:1b. Year of study
2. Objectives of the study:
3. General description of the study,location, climate, sample size etc:
4. Variables measured:
5. Statistical design (controls etc):
6. Description of the analysis:
7. Principal conclusions &recommendations:
8. List of publications relating to thestudy:
9. Applicability to other areas inAustralia? If yes, where? If no, why?
10. Complete Reference:
11. Other Comments:
TEMPLATE B-1
1a. Title of the study:1b. Year(s) of study
2. The driver(s) for the project/program:
3. The magnitude of the project/program(eg. sample size):
4. Implementation method:
5. Options implemented:
6.Cost of the program:
7. Estimated water and/or cost savings (ifavailable):
8. Methodology of evaluation(hypotheses, variables, controls,replicates):
9. Results of evaluation (includingconfidence intervals, conclusions ifavailable and major factors considered,such as water/wastewater offsets,integrated planning (cost to utilities andcommunity) and externalities):
10. Complete Reference:
11. Other comments:
The following is a copy of the headings of the information reporting Templates (A and B) thatwere provided to participating WSAA-members.

W A T E R S E R V I C E S A S S O C I A T I O Nof Australia
INTERNET HOMEPAGE http://www.wsaa.asn.au
MELBOURNE OFFICE469 LATROBE STREET, MELBOURNE 3000
VICTORIA AUSTRALIATEL: 03 9606 0678. FAX: 03 9606 0376
EMAIL [email protected]
SYDNEY OFFICE286 SUSSEX STREET, SYDNEY, NSWGPO BOX 5420, SYDNEY, NSW, 2001TEL: 02 8206 6719. FAX: 02 8206 6015EMAIL: [email protected]
Additional Appendices:Completed templates by participating Member and non-memberorganisations and other supporting documentation to this paper areavailable in pdf format. For a copy please email [email protected].
Related Documents