Building Blocks of Dynamic Systems 1 Understanding the Building Blocks of Dynamic Systems Matthew A. Cronin School of Management George Mason University School of Management Enterprise Hall Fairfax, VA 22030 Phone: 703-993-1783 Cleotilde Gonzalez Dynamic Decision Making Laboratory Social and Decision Sciences Department Carnegie Mellon University 5000 Forbes Avenue Pittsburgh, PA 15217 Phone: 412-268-6242 Short title: Building blocks of dynamic systems Keywords: stocks, flows, building blocks

Welcome message from author
This document is posted to help you gain knowledge. Please leave a comment to let me know what you think about it! Share it to your friends and learn new things together.
Transcript

Building Blocks of Dynamic Systems 1
Understanding the Building Blocks of Dynamic Systems
Matthew A. Cronin
School of Management
George Mason University
School of Management
Enterprise Hall
Fairfax, VA 22030
Phone: 703-993-1783
Cleotilde Gonzalez
Dynamic Decision Making Laboratory
Social and Decision Sciences Department
Carnegie Mellon University
5000 Forbes Avenue
Pittsburgh, PA 15217
Phone: 412-268-6242
Short title: Building blocks of dynamic systems
Keywords: stocks, flows, building blocks

Building Blocks of Dynamic Systems 2
Biography of authors
Matthew A. Cronin is an Assistant Professor of Management at George Mason University. His research seeks to understand how collaboration can help produce creative ideas, and what it takes to bring these ideas to fruition. His research is cognitive (focusing on the mechanics of problem re-representation) and interpersonal (focusing on how people’s interpersonal dynamics help or hinder idea acceptance). Understanding how creativity originates is important for organizations because creativity is a source of innovation and competitive advantage (e.g., inventions) as well as increased efficiency and learning (e.g., clever improvements).
Cleotilde Gonzalez is an Assistant Professor of Information Systems and Decision Sciences in the Department of Social and Decision Sciences at Carnegie Mellon University. Her research focuses on cognitive aspects of decision making in dynamic environments. She uses behavioral, computational and brain imaging approaches to understand how people make decisions in dynamic, complex environments. She is the founder and director of the Dynamic Decision Making Laboratory at Carnegie Mellon (www.cmu.edu/ddmlab) that currently holds several post-doctoral fellows, researchers and programmers.

Building Blocks of Dynamic Systems 3
Abstract
We report three empirical studies intended to understand why individuals misperceive the
relationships between stocks and flows. We tested whether familiarity with the problem type,
motivation to solve the problem, or the graphical presentation of the problem affected
participants’ understanding of stock and flow relationships. We conclude that the misperceptions
of stocks and flows are a pervasive and important problem in human reasoning. Neither the
domain familiarity nor increased motivation helped individuals improve their perception of stock
and flow relationships; but it seems that the graphical representation directs attention to flows
and not stocks, setting the stage for subsequent mistakes. Individuals attend to the most salient
points of a graph rather than comprehending the overall accumulation over time. Future research
needs to investigate several aspects of the problem representations, such as the use of physical or
textual rather than graphical representations.

Building Blocks of Dynamic Systems 4
Introduction
Accurate perception of system dynamics is important for understanding problems that
concern all of us, such as global warming (Sterman & Sweeney, 2002) and overexploitation or
extinction of natural resources (Moxnes, 2003). Unfortunately, there is rather pessimistic
evidence regarding people’s ability to perceive system dynamics correctly, which implies that
the actions and policies created to deal with dynamic systems (for example, the level of pollution
in the atmosphere) may be misguided.
According to Sterman and colleagues (Sterman, 2002; Sweeney & Sterman, 2000) our
problems with the perception of system dynamics come down to a poor understanding of the
most basic principles or building blocks of dynamic systems, including stocks and flows as well
as time delays. Sweeney and Sterman (2000) investigated individuals’ understanding of the
relationships between stocks and flows by asking them to draw the quantity in the stock and how
it varies over time given the rates of flow into and out of the stock. They presented MIT graduate
students with a bathtub and asked them to sketch the path for the quantity of water in the bathtub
over time, given the patterns for the inflow and outflow of water. Despite the apparent simplicity
of this task they found that only 36% of the students answered correctly.
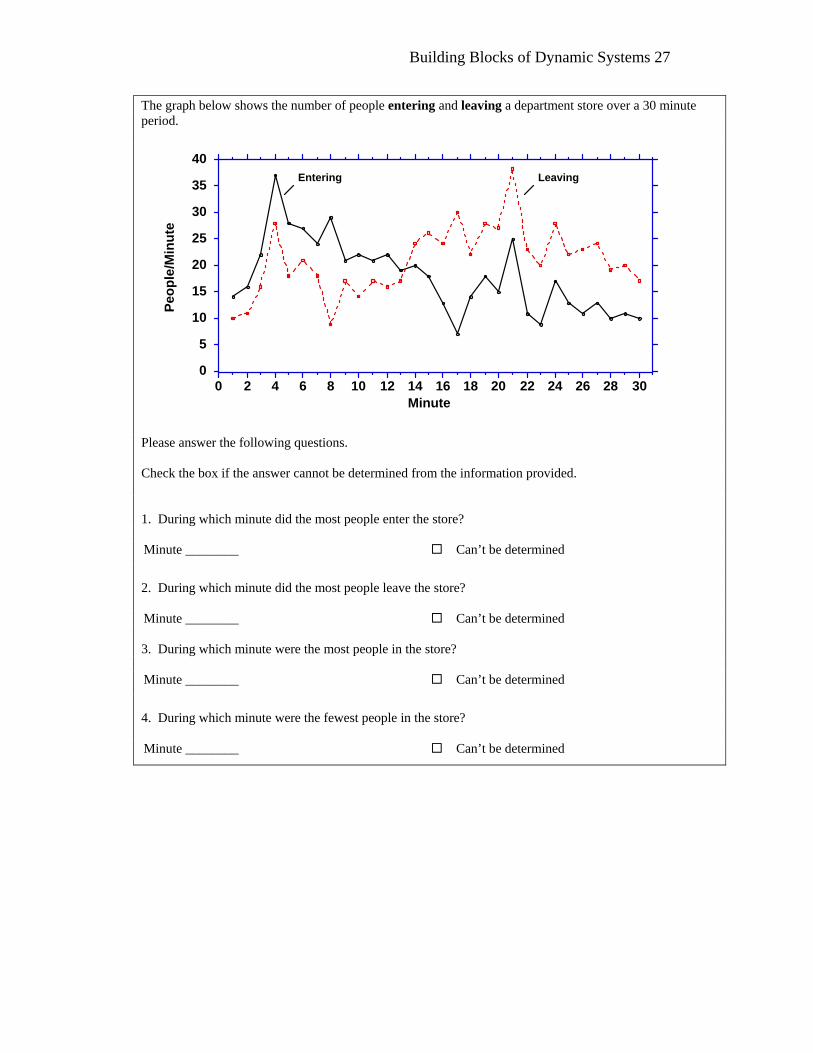
In follow up research Sterman (2002) developed another task (see Figure 1). This task
presented individuals with a graph showing the rate at which people enter and leave a department
store. Individuals were asked four questions. The first two questions tested whether individuals
could determine the difference between lines indicating the number entering and leaving the
store (whether they could read the graph). The last two questions tested their understanding of
the stock level given the flows. To determine when there is the most and the least people in the
store students need to understand that the number of people in the store accumulates with the

Building Blocks of Dynamic Systems 5
flow of people entering minus the flow of people leaving the store. In Figure 1, the most people
are in the store at the point where the two curves cross. Although 94% of students answered the
first two questions correctly, only 42% answered the last two questions correctly. Again, this
study involved highly educated MIT graduate students.
---------------------------
Insert Figure 1
---------------------------
We were intrigued by the results in Sterman and colleagues’ studies, and we embarked on
a set of studies aimed at understanding why people misunderstand the relationship between
stocks and flows. Our purpose was to look deeper into what cognitive functions explain the
problems people have diagnosing stock and flow systems. We tested whether the familiarity of
the dynamic system (experiment 1), cognitive effort (experiment 1), computational difficulty
(experiment 2), and graphical features (experiment 3) were responsible for the difficulty people
have interpreting dynamic systems. Each of these issues has been shown to affect the
performance on problem solving tasks. Familiarity with a domain tends to lead people to
construct better mental models of that system (Charness, 1991; Chi, Feltovich, & Glaser, 1981);
inducing people to think hard about a problem has also been shown to increase the quality of
thinking about the problem (Petty & Caccioppo, 1986); computational complexity may
overwhelm limited cognitive capacity (Simon, 1979); and finally, people can be misled by the
graphical representation of a problem (Budescu, Weinberg, & Wallsten, 1988; Paich & Sterman,
1993; Pala & Vennix, 2005).
While each of these explanations seems plausible, we found that it was the graphical
representation that seemed to be the source of difficulty for participants. At the same time, the

Building Blocks of Dynamic Systems 6
lack of effect of familiarity, effort, and computational difficulty also provide clues into how
people understand the nature of dynamic systems, and the nature of the thinking errors that cause
their misperception.
Experiment 1
One reason it may be difficult for people to properly analyze stock and flow systems is
that the cover story (people entering and leaving a store) suggests an incorrect mental model of
the system, and this leads people to incorrect conclusions. One of the first steps in solving a
problem is creating a problem representation. The representation is “a cognitive structure that
corresponds to a given problem… constructed by the solver on the basis of domain-related
knowledge and its organization” (Chi et al., 1981, p. 131). The representation one creates is
based on the initial perception of what the problem is. Rettinger and Hastie (2001) asked
participants to decide in essentially the same probabilistic outcomes, but under a different cover
story, including a straight gamble, a stock picking task, a grade, or a parking ticket. In these
experiments, the alternate cover stories elicited distinct representations, in turn leading people to
perceive the nature of the probabilistic outcome differently, and also changing the decision rules
that were used. The cover story can also make certain relationships among parts of the problem
easier to perceive. Kotovsky, Hayes and Simon (1985) showed how isomorphs of the Tower of
Hanoi problem (i.e., problems with identical move and goal structures) were easier or harder to
solve based on the attributes of the cover story. Some versions of the problem were easier for
participants to keep track of and manipulate because the metal representation of the moves was
consistent with people’s intuitive knowledge, hence these were easier it was to solve.
It is possible that Sterman’s (2002) task (Figure 1) suggested a representation that did not
contain all the components of the system. That is, the rise and fall of people in a store is

Building Blocks of Dynamic Systems 7
generally of small concern to people as they visit stores, and so we argue that this representation
was not conducive to highlighting the stock part of that system. We therefore conceived a
representation where the stock part of the dynamic system was more salient, a bank account.
Note that Sterman and Sweeny (2000) used a company cash flow in one of their experiments, but
we wanted to use a simpler version of this problem in an even more familiar and personally
relevant context. A bank account is something that everyone will have experience with, because
management of one's money is a critical function in people's lives. By giving people a dynamic
system where the cover story is both intuitively familiar and where the stock was as salient as the
flow, we expected people to be better able to answer questions about the behavior of the dynamic
system because the mental representation created should include the stock and its relation to the
flows (money going into and out of the account).
H1. People will be better at interpreting graphs of dynamic systems when the system represented is commonly understood in terms of stocks and flows.
Even with the right mental model of the problem, people can make errors if they put little
effort into their thinking. Much work has been done on the effect of effort on information
processing (Cacioppo & Petty, 1989; Chaiken, Leiberman, & Eagly, 1989). The primary finding
in this work is that the effort that goes into thinking can actually change the character of thought
(Epstien, Pacini, Denes-Raj, & Heier, 1996). In the stock and flow task, effort is needed because
in order to deduce the level of the stock, people must apply rules and knowledge to the graph.
One who wanted to use “brute force” to calculate the net flow at each minute and then sum
would take effort. Yet even discerning the net flow pattern may take time for people to either
search their memory for the appropriate rules of calculus, or to explore the relationships between
the flow lines and area between them long enough to see the pattern. At the same time, the graph
Building Blocks of Dynamic Systems 8
has enough salient features (the flow peaks and the large net flow differences) so that using
superficial cues may seem to provide answers, and if people were not thinking much about the
problem, these would seem to suffice. The conclusion is that if one does not think very hard
about stock and flow problems, it is easy for them to get the wrong answer.
It is possible that participants in previous studies used little effort to think about the
problem because the problem lacked any personal relevance or they were not prompted to think
hard about it. In most persuasion research, telling a participant that their answers will be
scrutinized for some self-relevant purpose induces effortful processing (Petty, Tormala,
Hawkins, & Wegener, 2001). We therefore wondered if it would be possible to improve people’s
performance by increasing the effort they spent thinking about the problem. By doing this, we
expect people to be less drawn to particular obvious features of the graph, and to spend more
time discerning the relationship between the lines (and hence uncovering the stock).
H2. Increased thinking effort will improve performance in understanding dynamic systems
Methods
Eighty-one students from a private North American university were recruited via
advertisements to participate in an experiment for $5. Participants ranged in age from 18-35
years old, were predominantly undergraduates, and approximately half were female. People were
randomly assigned to one condition in a 2 (cover story: familiar, unfamiliar) x 2 (thinking effort:
low and high) experimental design. All participants were able to complete the task in less than 10
minutes.

Building Blocks of Dynamic Systems 9
Materials and Procedure
In all cases, participants were given a graph with instructions describing the graph and
asked to answer four questions (the four questions presented in Figure 1). Students were given
either a familiar (checking account) or an unfamiliar (store) cover story.
The description of the graph and the wording of the questions varied depending on the
cover story, but the graph was identical to the original Sterman’s graph (Figure 1). The familiar
cover story described money being put into and taken out of a checking account over 30 days,
the unfamiliar cover story described people going in and out of a store over 30 minutes. Along
with the graph, participants were given the four questions to answer (counterbalanced in their
order of presentation). These asked: 1) when the most people [dollars] were in the store [bank
account], 2) when the fewest people [dollars] were in the store [bank account], 3) when the most
people [dollars] went in to the store [bank account], 4) when the most people [dollars] came out
of the store [bank account]. For each question, participants could answer either the particular
minute or “cannot be determined”.
In the high effort condition students were told that their answers would be personally
inspected by the researchers and used to gauge the university students’ performance to those of
other highly ranked schools. Conveying that participant’s answers will be examined and used is a
common technique in the literature on persuasion to induce effortful processing (for a review see
Petty & Wegener, 1998). Individuals in the low effort condition were not given this information.
Results and Discussion
Responses to each of the questions were coded as right or wrong. Table 1a shows the
percentage of correct responses for each of the conditions. To compare the effect of cover story
and effort level on each response (when did most enter (enter), when did most leave (leave),
Building Blocks of Dynamic Systems 10
when was most full (full), when was most empty (empty), we used a model building approach
with contrast coded logistic regressions (Judd & McClelland, 1989) . Two testes were performed,
one with and one without an interaction term. Table 1b displays these equations. Neither the
main effects nor interaction affected the rate of success on any question.
--------------------------------------------
Insert Tables 1a and 1b
--------------------------------------------
Similar to Sterman’s (2002) findings, in this experiment neither effort nor the
representation suggested by the cover story had any effect on the correct perception of stocks and
flows. The fact that putting more effort into thinking had no effect made us wonder about the
effectiveness of this manipulation. However, this manipulation has been widely (and effectively)
used in persuasion research (Cacioppo & Petty, 1989; Cacioppo, Petty, & Stoltenberg, 1985;
Petty & Cacioppo, 1996), so there is no a priori reason to assume that it would have failed in our
experiment. As for the cover story, it appeared to have no effect whatsoever.
The results of the first experiment did not support our second hypothesis but did suggest
a refinement of our first hypothesis – that people make mistakes because they construct an
inappropriate representation of the problem. We initially thought unfamiliarity with the domain
was the explanation, but it may be the visual depiction that contributes to the inappropriate
representation of the problem. In the next experiment, we tested whether the visual form of the
graph would affect the answers people gave.
Experiment 2
In the previous experiment, we conjectured that the story was what caused people to
misinterpret the problem, and that this was the primary source of difficulty for interpreting the

Building Blocks of Dynamic Systems 11
stock questions. In this experiment, we examined the effect of the graphical representation of the
problem. In particular, we test whether the salient features of the graph, as well as the complexity
of the graph, affect how people interpret the stock and flow system.
A common explanation for the difficulty with stock and flow problems is cognitive
capacity – the more calculations one has to hold in working memory, the higher the likelihood of
error. If this is true, then simplifying the graph should improve participant performance. In the
previous experiment, the graph had 30 time periods with noisy flows, so there are many ways to
simplify the graph. The first is to reduce the variation in the inflow and outflow. By making the
rate of accumulation/ depletion constant, it may make it easier for participants to discover the
pattern of accumulation/ depletion. On the other hand, in previous experiment, figuring out the
answer by mathematical calculation is tedious given that it would involve 30 arithmetical
problems. Thus if one made the number of people entering/leaving smaller, and had fewer time
periods, “doing the math” would be easier. This could lead to less error for those who chose to
do the math in their head, and may make participants more willing to do the manual calculations
to get the correct answers to the stock questions.
H3. Participants will be more likely to discover the correct answers when there are fewer points on the graph.
While the numerical complexity of the graph may overtax working memory, it may also
be that the look of the graph can be misleading. Here, the mistakes do not come from capacity,
but from answers that seem correct but are not. In looking at the actual answers given in the prior
experiment, almost all of the wrong answers for when the store was most full/empty was either
the peaks in the individual lines (points 4 and 21 in the original graph, see Figure 1) or the largest
differences between flow lines (points 8 and 17 in the original graphs). Visually, these points are
the most distinctive and seem to be plausible answers to the questions about the stock (e.g., to

Building Blocks of Dynamic Systems 12
think the most people are in the store when there is the greatest difference between those who
have entered and those who have left is correct for that point in time). Therefore, we thought
removing the easy but wrong answers in a graph may spur people to be more reflective about
their answers. Thus we gave individuals either a graph with a distractor point (a peak) or without
one. Without a salient highest point, we expect people will not have an easy answer to
mindlessly write down for the question about the fullness of the stock.
H4. Participants will be less successful interpreting the graph if it includes a distractor point.
Methods
Seventy-one students from a private North American university were recruited via
advertisements to participate in an experiment for $5. Participant age, level of education, and
gender were similar to those in experiment 1, as they were drawn using the same method from
the same university. People who had already participated in Experiment 1 were not allowed to
participate in the present one. People were randomly assigned two graphs to analyze. Each graph
came from a cell in a 2 (easy/ hard) x 2 (no distractor/ distractor) condition.
Materials and Procedure
Participants were given two graphs of a dynamic system with instructions describing the
graph, and asked to answer the four questions in Figure 1. The questions were identical to those
in experiment 1, but we always used the store as the cover story. The graphs were presented
serially, and the order of presentation was counterbalanced. All participants were able to
complete the task in less than 10 minutes.
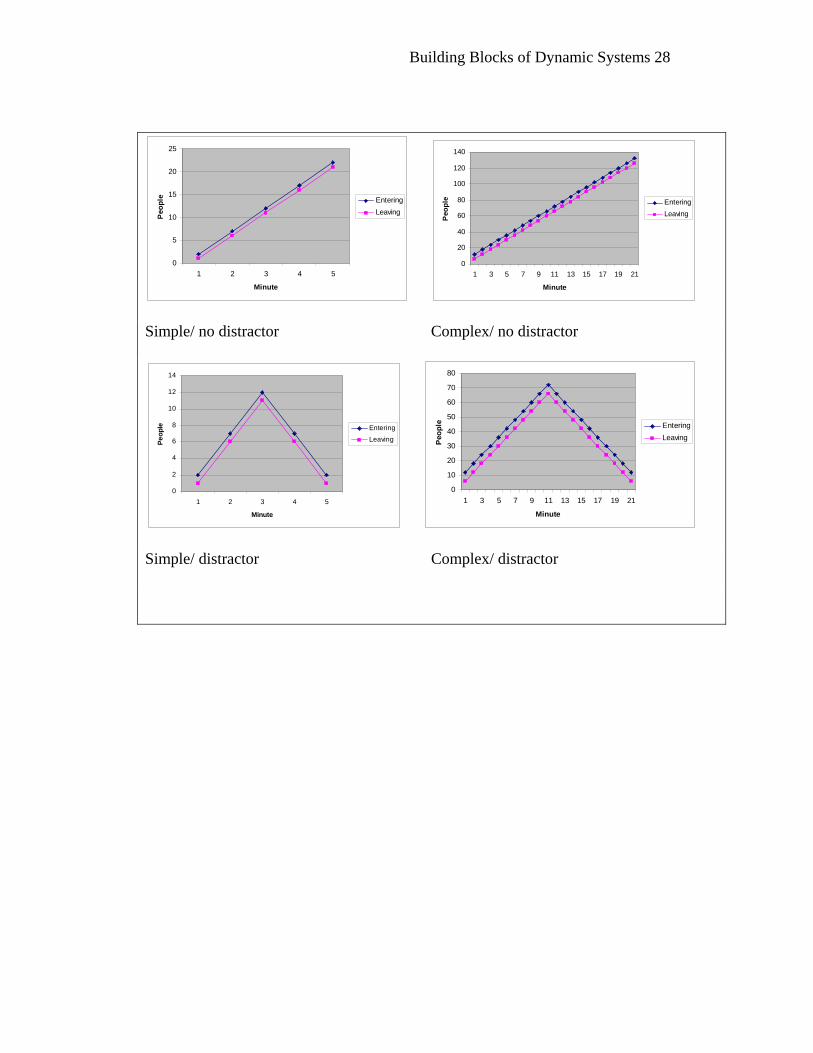
The simple graphs had 5 points and represented a 5 minute time period. The complex
graphs had 21 points and represented a 21 minute time period. Despite the difference in scale, the
shape of the graphs was identical between the complex and simple conditions. We used two

Building Blocks of Dynamic Systems 13
simple graph shapes (see Figure 2): two parallel lines that increased monotonically over the time
period, two parallel lines that increased in the first half and then decreased in the second half.
------------------------ Insert Figure 2
------------------------
Results and Discussion
The success rates for each condition are summarized in Table 2a. To compare the effect
of simplicity and having a distractor point on each response, we again used a model building
approach with contrast coded logistic regressions (Judd & McClelland, 1989). Table 2b displays
these equations. Neither the main effects nor interaction affected the rate of success on any
question.
----------------------
Insert Tables 2a and 2b.
----------------------
Once again, the rates of success are similar to the original Sterman’s task, and for the
most part, no differences were found among conditions. However, an interesting finding is that
in experiment 1, about 11% of the participants answered “cannot be determined” on the “stock”
questions (questions 3 and 4). In this experiment, the rate jumped to 56% when the lines were
parallel. We think this is the most significant finding of the present experiment.
This experiment showed that the look of the graphs has an effect on how people answer
the questions, but it was not in the way hypothesized. What we failed to anticipate was that the
highest point for the inflow or outflow (minute 3/11 in the apex condition or minute 5/21 in the
line condition – see Figure 2), meant choosing the same point for when the stock was most
empty and most full. This means that participants would have been logically inconsistent to
Building Blocks of Dynamic Systems 14
answer the questions as we thought they would. This is also different from the Experiment 1
graph, where two different time points gave themselves as likely answers to the questions about
the stock (i.e., points 4 or 8 for most full, points 21 or 17 for most empty).
The logical inconsistency resulting from having the same point as the time when the
stock is most and least full, we believe, is what led people to answer “cannot be determined” at
almost five times the normal rate. What was also surprising was that even with five points and
even with two parallel lines, people did not correctly comprehend what was happening to the
stock. Both of these findings led us to conclude that the graphical representation of the stock and
flow is a strongly dominant effect on the interpretation of the dynamic system. In the final
experiment, we try to corroborate this theory by predicting the kinds of mistakes people will
make when answering questions about the stock in both the original Sterman’s (2000) graph, as
well as a simple graph modified from Experiment 2.
Experiment 3
The results of the first two experiments suggest the visual depiction is a key factor in the
answers given. In addition to the effect on “cannot be determined” answers described above, it
seems that people also have other systematic aspects of their mistakes. Anecdotally, when people
analyze the Sterman graph incorrectly, they seem to choose one of 3 alternate points for when
the stock is most full/empty: the peak for the inflow (most full) or outflow (most empty), the
place with the biggest momentary net flow difference (the gap), or “cannot be determined.” This
pattern is somewhat consistent with the “pattern matching” explanation given in (Booth-Sweeny
& Sterman, 2006). Choosing “cannot be determined” is not really matching the pattern, while
choosing the peak would imply “highest point = most full”, and choosing the gap is a bit more
sophisticated because it implies some attention to inflow vs. outflow at a moment of time.

Building Blocks of Dynamic Systems 15
We argue that pattern matching is a too general explanation for how people answer these
questions. People make some calculations about the stock, but these are often incorrectly
constructed. Also, we believe that people ignore the accumulation of the stock from previous
time periods. We suggest that people’s tendency to ignore information not explicitly given
(Fischhoff & Downs, 1997; Ross & Creyer, 1992) is responsible for this mistake. Therefore,
people will look at the difference between the inflow and outflow when thinking about the stock
(that information is given in the graph), but they will ignore current accumulation in the stock.
This implies people will answer in a way that is consistent with the instantaneous relationship
between the flows and the stock.
H5. Participants who incorrectly answer the questions about the level of the stock are likely to pick the point based on the momentary difference in net flow. We also argue that although people’s understanding of the stock is diminished as they
ignore the accumulation/depletion of the stock, people are nonetheless aware that a stock can not
be most full and most empty at the same time. We therefore suggest that when a graph does not
have unique points for the maximum and minimum net flow, it will prompt people to increase
the amount of “cannot be determined” answers. This should also corroborate that people are
focusing on the momentary net flow, as one must ignore accumulation/ depletion to compare
across points with equal net flow.
H6. When there are more than two points where the maximum/ minimum net flow are different, the amount of “cannot be determined” answers will be increased.
Methods
Thirty-six undergraduate students from a large North American public university
participated as part of a class exercise in a senior level management course. Students ranged in
age from 21 to 45 years old, approximately one half were female.

Building Blocks of Dynamic Systems 16
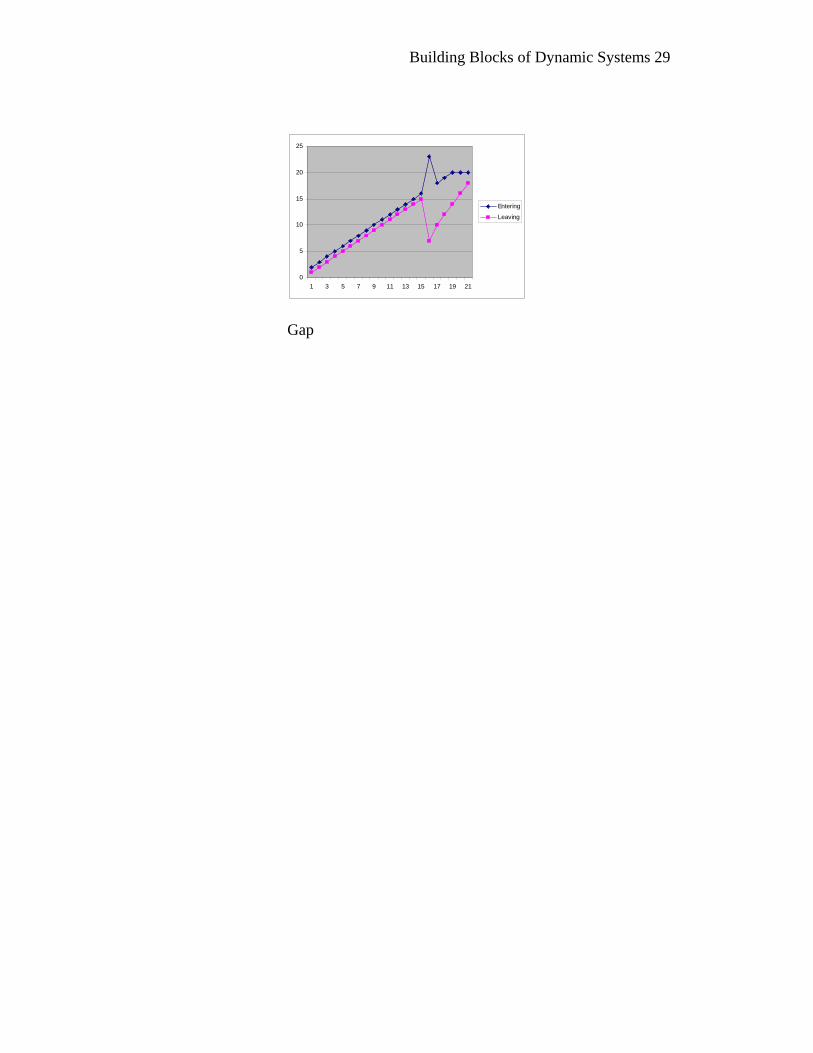
Materials and Procedure
Participants received two graphs about which they answered the same questions as in
experiments 1 and 2. The first graph was the original graph (Figure 1). Participants then received
the gap graph (see Figure 3), where there is a single point where the gap between inflow and
outflow is largest, and multiple points where the net flow was smallest.
-------------------------------
Insert Figure 3
-------------------------------
Results and Discussion
In hypothesis 5 we predicted that participants who incorrectly answered questions about
the level of the stock would be systematic in their mistakes. That is, they would pick the point in
time based on the momentary difference between inflow and outflow. To test this, we looked at
how participants answered each Q3 and Q4. We coded their answers based on the visual
description of the point chosen.
We looked at the subset of participants who did not correctly answer the stock related
questions (Q3 and Q4). We coded their answers on Q3/Q4 dichotomously: 1 if they picked the
point(s) of greatest/ least net difference, and 0 if they picked anything else (which was either
“cannot be determined” or the peak for the corresponding flow line). In this coding scheme a
success (i.e., 1) indicated consistency with our hypothesis 5.
We compared whether the rate for picking this point was higher than 33% using a
binomial test. This is odds of picking the “net difference” point randomly from among the three
choices. When answering when the most people were in the store, participants selected the time
showing the largest positive net flow 25 of the 30 time, and this was significant (p < .001).For

Building Blocks of Dynamic Systems 17
the question asking when the fewest people were in the store, 16 of 31 people picked the time
showing the largest negative net flow, and this was this was significant also (p= .04).
To test whether multiple points of equal net flow led to an increase in “cannot be
determined” (CBD) answers (hypothesis 6), we compared Q4 to Q3 on the single gap graph.
There were multiple points of minimum net flow, but only one point of maximum net flow.
Interestingly, the rates of CBD answers were not significantly different between Q3 and Q4
(12/23 vs.13/23 respectively, p = 1 using Fisher’s Exact Test).
Curiously the overall rate of CBD answers for the gap graph was high (12 of 23 people
put CBD for both Q3 and Q4), so we compared this rate to the rates of CBD answers found in
experiments 1 and 2 using a binomial test with the expected rates of CBD answers from each
prior study (11% and 56% respectively). We found that the CBD rate for the gap graph was
significantly different from the rate in study 1 with the Sterman graph (p < .001) but not from the
rate is study 2 with the parallel line graphs (p = .87).
The results of experiment 3 support our hypothesis that people focus on the differences
between the flows at a single point in time (H5). We believe that it is the preference for given
information (Fischhoff, Slovic, & Lichtenstein, 1978; Klein, 1999) which is at the heart of this
matter. Yet the results for H6 merit further attention. More than one point where the net flow is
maximum/minimum appears to make people more likely to erroneously assume that the stock’s
most/least full point cannot be determined (H6). But answering CBD when there were multiple
points of smallest net difference between inflow and outflow tended to increase the “cannot be
determined” answers for questions about when the stock is most full (which was a single point).
Logically, people should perceive this difference as indicating the point where the stock is most
full (as they did in the original Sterman graph), and only put CBD for when the stock is most

Building Blocks of Dynamic Systems 18
empty. These inconsistencies may suggest that information on outflows is somehow harder to
integrate than information on inflows. It may also suggest that people want to answer questions
about the stock as a pair (e.g., CBD for one means CBD for the other), so that the answers are
not independent..
General discussion and future research
In summary, we believe that our results suggest some ways in which graphs of dynamic
systems are understood and what this implies for teaching system dynamics. The clearest finding
is that the visual representation of the dynamic system is the critical source of difficulty for
understanding the relationship between flows and the stock. In particular, the graphical depiction
used as the baseline for this research seems to direct attention to some things (e.g., flows) and not
others (e.g., stocks) in a particular way, and these problems set the stage for subsequent mistakes.
Our findings also suggest that people do have some understanding about the dynamics of
a stock. The pattern of mistakes suggest people understand a stock is related to net flow, as
Booth-Sweeny and Sterman (2000, 2006) found, but also that they understand it cannot be most
full and empty at the same time. It would appear that the trouble comes from how people adapt
their understanding to the given graph. Namely that they look for single points where net flow is
maximum or minimum, and they forget about any accumulation or depletion from before that
point.
Others (Moxnes, 1998; Sterman, 1989) have explained people’s pattern of response to
stock and flow systems as the result of using a pattern matching heuristic. We wonder if this is
the only explanation. Looking at the actual answers given for the stock question, they were
usually salient points on the graph (e.g., the smallest or biggest gap, the highest or lowest point,
etc.). Yet these points are not considered in isolation. Our results suggest that people are doing
Building Blocks of Dynamic Systems 19
some calculations about the net flow, as evidenced by people’s answers in experiment 3. If
people were only matching patterns, we would expect to see a less consistent distribution of
answers to the stock questions.
Our results also qualify the notion of the “static” mental models Moxnes (1998) theorized
as responsible for people’s errors on stock and flow problems. Moxnes argued that people have
mental models where the relationship between the components in a dynamic system are seen as
fixed; in other words, people think “more X = less Y” (static) rather than “the relationship of X
to Y depends on the level of X” (dynamic). In our results, we observed a different kind of
“static” mental model, in particular one that does not include change over time (i.e., Stock = In –
Out, rather than New Stock = In – Out + Current Stock). Future research should seek to
determine if really think of the relationships in their mental model as constant or simply that they
have incorrectly specified a rule for how the systems interrelate (i.e., they are aware that
components are dependent on each other, but have failed to correctly “write the equation”).
We think that it is also important to reinforce that our experiments found no indication
that the graphs were too complicated, or that numerical difficulty was the source of the problem.
First, two straight parallel lines with five data points each, which could have been solved
mechanically by doing second-grade level subtraction and addition, still showed a very low
(37%) success rate for questions on the level of the stock. Second, the simplest graph (two
parallel lines with five points) showed a statistically equal rate of success on the questions as the
original Sterman graph, which had peaks, troughs, crossovers, and 30 points. If capacity played a
role, these rates should have been different. This is important because cognitive capacity is often
one of the first alternative explanations people have upon reading this research.

Building Blocks of Dynamic Systems 20
Taken together we would suggest that poor understanding of dynamic systems evidenced
by people predicting the behavior of a stock is in part a function of mental encoding of the
problem. In these cases, the visual stimulus seemed to have the most salience in term of the (mis)
encoding of the dynamic system. While we believe domain familiarity, cognitive effort, and
computational complexity can safely be ruled out, there are many other potential mechanisms
that we think deserve explanation based on our results.
The first would be to discover how people are actually encoding stock and flow
problems. A more detailed analysis of people’s thinking patterns, potentially using protocol
analysis (Ericsson & Simon, 1993), may be helpful. Alternately, one could use different kinds of
physical materials and allow people to explore the stock and flow relationships using these (see
Zuckerman & Resnick, 2003). One would need to focus on the initial construction of the mental
representation (Hayes & Simon, 1974) to see which relations between problem components were
correct or incorrect. At the same time, people may hold incorrect beliefs about the relationship of
stocks to flows, as was found using the systems thinking inventory (Booth-Sweeny & Sterman,
2000). Again, these prior beliefs could be tested to see if they interfere with subsequent problem
encoding and solving.
The idea that people have incorrect beliefs about the relationship between stocks and
flows may explain why people are not able to overcome their initial misperceptions.
Alternatively, research on insight (Sternberg & Davidson, 1995) has shown how people can get
stuck in their original (incorrect) problem representations. Thus, people’s continued
misperception may be less a matter of incorrect knowledge and more a matter of incorrect
problem representation.

Building Blocks of Dynamic Systems 21
Finally, it may just be that the time dependent nature of these problems is what causes the
difficulty; a common theme in much system dynamics research (Sterman, 2002). Yet how time
dependency creates difficulty in these problems is still a question with at least two possible
answers. One is that most people have difficulty thinking forward more than one move or cycle.
Ho, Camerer, and Weigelt (1998) showed this using problems where the more “turns ahead” one
can think through, the better a person’s answer is and the more they get rewarded. They find that
the modal response is for people to think ahead one move. Alternately, people also have a hard
time reconciling flows over time. A common classroom problem is the “horse trading problem”,
which says “Bill buys a horse from you at $100 then sells it back to you at $110, then Bill buys
the same horse back from you at $120 and sells it back to you at $130. How much money did
Bill make or lose?” People often get this problem wrong because they miscalculate the flow,
despite it being a simple problem. Breaking down what it is about time dependency that causes
people difficulty assessing flows may help in systems dynamics education.
Speaking to the larger problem of how to teach system dynamics, it may be that
correcting people’s encoding of stock and flow problems, readjusting their current beliefs about
these problems, and overcoming the inherent difficulties in understanding the nature of stocks
and flows all require different methods. Only more research will tell. In the meantime, our results
suggest that in all research it will be important to partial out the perceptual difficulties related to
the interpretation of graphs from the inherent difficulties understanding stocks, flows, and time
delays. Our results say that in understanding system dynamics, a picture may not be worth 1000
words.

Building Blocks of Dynamic Systems 22
References
Booth-Sweeny, L., & Sterman, J. D. (2000). Bathtub Dynamics: Initial Results of a Systems Thinking Inventory. System Dynamics Review, 16, 249-294.
Booth-Sweeny, L., & Sterman, J. D. (2006). Adults' Mental Models of Climate Change Violate Conservation of Matter. Under review at Climatic Change.
Budescu, D. V., Weinberg, S., & Wallsten, T. S. (1988). Decisions based on numerically and verbally expressed uncertainties. Journal of Experimental Psychology: Human Perception & Performance, 14(2), 281-294 URL http //www.apa.org/journals/xh html.
Cacioppo, J. T., & Petty, R. E. (1989). The Elaboration Likelihood Model: The role of affect and affect-laden information processing in persuasion. In P. Cafferata & A. M. Tybout (Eds.), Cognitive and affective responses to advertising (pp. 69-89). Lexington, MA, England: Lexington Books/D. C. Heath and Com.
Cacioppo, J. T., Petty, R. E., & Stoltenberg, C. D. (1985). Processes of social influence: The Elaboration Likelihood model of persuasion. In P. C. Kendall (Ed.), Advances in cognitive-behavioral research and therapy (Vol. 4, pp. 215-274). San Diego, CA, US: Academic Press.
Chaiken, S., Leiberman, A., & Eagly, A. H. (1989). Heuristic and systematic processing within and beyond the persuasion context. In J. S. Uleman & J. A. Bargh (Eds.), Unintended Thought (pp. pp. 212 - 252). New York: Guliford Press.
Charness, N. (1991). Expertise in chess: The balance between knowledge and search. In Toward a general theory of expertise: Prospects and limits (pp. 39-63). New York, NY, US: Cambridge University Press; New York.
Chi, M. T. H., Feltovich, P. J., & Glaser, R. (1981). Categorization and representation of physics problems by experts and novices. Cognitive Science, 5, 121-152.
Epstien, S., Pacini, R., Denes-Raj, V., & Heier, H. (1996). Individual differences in Intuitive-Experiential and Analytical-Rational thinking styles. Journal of Personality and Social Psychology, 71, 390 – 405.
Ericsson, K. A., & Simon, H. A. (1993). Protocol analysis: Verbal reports as data (rev. ed.). Cambridge, MA, USA: Mit Press.
Fischhoff, B., & Downs, J. (1997). Accentuate the relevant. Psychological Science, 8(3), 154-158.
Fischhoff, B., Slovic, P., & Lichtenstein, S. (1978). Fault trees: Sensitivity of estimated failure probabilities to problem representation. Journal of Experimental Psychology: Human Perception & Performance, 4(2), 330-344.
Hayes, J. R., & Simon, H. A. (1974). Understanding written problem instructions. In L. W. Gregg (Ed.), Knowledge and Cognition (pp. 167-200). Hillsdale, NJ: Lawrence Erlbaum.
Ho, T.-H., Camerer, C. F., & Weigelt, K. (1998). Iterated dominance and iterated best response in experimental 'p-beauty contests'. American Economic Review, 88(4), 947-969.
Judd, C. M., & McClelland, G. H. (1989). Data Analysis: A Model Comparison Approach. Orlando, FL: Harcourt Brace Jovanovich.

Building Blocks of Dynamic Systems 23
Klein, W. M. P. (1999). Justifying optimistic predictions with minimally diagnostic information under conditions of outcome dependency. Basic & Applied Social Psychology, 21(3), 177-188.
Kotovsky, K., Hayes, J. R., & Simon, H. A. (1985). Why are some problems hard? Evidence from Tower of Hanoi. Cognitive Psychology, 17(2), 248-294.
Moxnes, E. (1998). Overexploitation of renewable resources: The role of misperceptions. Journal of Economic Behavior & Organization, 37, 107-127.
Moxnes, E. (2003). Misperceptions of basic dynamics: the case of renewable resource management. System Dynamics Review, 20, 139-162.
Paich, M., & Sterman, J. D. (1993). Boom, bust, and failures to learn in experimental markets. Management Science, 39(12), 1439-1458.
Pala, O., & Vennix, J. A. M. (2005). Effect of system dynamics education on systems thinking inventory task performance. System Dynamics Review, 21, 147-172.
Petty, R. E., & Caccioppo, J. T. (1986). The elaboration likelihood model of persuasion. In Advances in Experimental Social Psychology (Vol. 19, pp. 123-205). New York: Academic Press.
Petty, R. E., & Cacioppo, J. T. (1996). Attitudes and persuasion: Classic and contemporary approaches. Boulder, CO, US: Westview Press.
Petty, R. E., Tormala, Z. L., Hawkins, C., & Wegener, D. T. (2001). Motivation to think and order effects in persuasion: The moderating role of chunking. Personality and Social Psychology Bulletin, 27(3), 332-344.
Petty, R. E., & Wegener, D. T. (1998). Attitude change: multiple roles for persuasion variables. In G. Gilbert, S. T. Fiske & L. R. (Eds.), The Handbook of Social Psychology, 4th ed. (pp. 323 - 390). New York: Oxford.
Rettinger, D. A., & Hastie, R. (2001). Content effects on decision making. Organizational Behavior & Human Decision Processes, 85, 336-359.
Ross, W. T., & Creyer, E. H. (1992). Making inferences about missing information: The effects of existing information. Journal of Consumer Research, 19(1), 14-25.
Simon, H. A. (1979). Models of Thought. New Haven, CT: Yale University Press. Sterman, J. D. (1989). Modeling managerial behavior: Misperceptions of feedback in a dynamic
decision making experiment. Management Science, 35(3), 321-339. Sterman, J. D. (2002). All models are wrong: reflections on becoming a systems scientist. System
Dynamics Review, 18, 501-531. Sterman, J. D., & Sweeney, L. B. (2002). Cloudy skies: assessing public understanding of global
warming. Systems Dynamics Review, 18, 207-240. Sternberg, R. E., & Davidson, J. E. (1995). The Nature of Insight. Cambridge, MA: MIT Press. Sweeney, L. B., & Sterman, J. D. (2000). Bathtub dynamics: initial results of a systems thinking
inventory. System Dynamics Review, 16, 249-286. Zuckerman, O., & Resnick, M. (2003). System Blocks: A Physical Interface for System
Dynamics Learning. Presented at the International System Dynamics Conference, New York, NY.

Building Blocks of Dynamic Systems 24
Table 1a
Percentage responding correctly to each question between conditions in Experiment 1.
Questions Cover Motivation Enter Leave Full Empty Store Low 93% 93% 41% 33% High 89% 89% 33% 33% Bank Low 100% 100% 32% 29% High 93% 100% 43% 43%
Table 1b
Logistic regressions for cover story and motivation predicting success on each question Enter Leave Full Empty
Main
effect Interaction Main
effect InteractionMain
effect Interaction Main
effect InteractionCover -1.48 -0.48 -18.83 -19.12 0.15 -0.40 0.02 -0.40Motivation 1.11 18.63 0.44 0.00 -0.13 -0.45 -0.35 -0.60C x M -18.19 0.44 0.77 0.60 Chi-sq 2.705 4.122 5.125 5.125 0.166 0.720 0.481 0.814Df 2 3 2 3 2 3 2 3p = 0.259 0.249 0.077 0.163 0.920 0.869 0.786 0.846
Note. Standardized Betas are given. None of the effects for cover, motivation, or their interaction are ever significant at p < .05.

Building Blocks of Dynamic Systems 25
Table 2
Percentage responding correctly to each question between conditions of Experiment 2.
Questions Shape Complexity Enter Leave Full Empty line Easy 97% 97% 37% 37% Hard 89% 89% 36% 42% Triangle Easy 89% 86% 36% 36% Hard 97% 100% 23% 31%
Table 1b
Logistic regressions for shape and complexity predicting success on each question Enter Leave Full Empty
Main
effect Interaction Main
effect InteractionMain
effect Interaction Main
effect InteractionShape 0.00 -1.44 -0.43 -19.37 0.32 0.64 0.00 0.21Complexity 0.00 -1.44 -0.00 -19.12 0.32 0.64 0.24 0.44S x C 2.89 20.82 -0.60 -0.39 Chi-sq 0.000 3.948 0.433 9.134 1.620 2.313 0.486 0.812Df 2 3 2 3 2 3 2 3p = 1.000 0.260 0.805 0.0281 0.445 0.510 0.784 0.847
Note. Standardized Betas are given. None of the effects for shape, complexity, and their interaction are ever significant at p < .05.
1 The equation is significant due to the constant (not shown) which is significant a p = .006

Building Blocks of Dynamic Systems 26
Figures.
Figure 1. Original graph found in Sterman (2002).
Figure 2. Graphs used in each of the four conditions.
Figure 3. Gap graph.
Building Blocks of Dynamic Systems 27
The graph below shows the number of people entering and leaving a department store over a 30 minute period.
0
5
10
15
20
25
30
35
40
0 2 4 6 8 10 12 14 16 18 20 22 24 26 28 30
Peop
le/M
inut
e
Minute
Entering Leaving
Please answer the following questions.
Check the box if the answer cannot be determined from the information provided.
1. During which minute did the most people enter the store? Minute ________ Can’t be determined
2. During which minute did the most people leave the store? Minute ________ Can’t be determined 3. During which minute were the most people in the store? Minute ________ Can’t be determined
4. During which minute were the fewest people in the store? Minute ________ Can’t be determined
Building Blocks of Dynamic Systems 28
0
5
10
15
20
25
1 2 3 4 5
Minute
Peo
ple Entering
Leaving
0
20
40
60
80
100
120
140
1 3 5 7 9 11 13 15 17 19 21
Minute
Peo
ple Entering
Leaving
Simple/ no distractor Complex/ no distractor
0
2
4
6
8
10
12
14
1 2 3 4 5
Minute
Peop
le Entering
Leaving
0
10
20
30
40
50
60
70
80
1 3 5 7 9 11 13 15 17 19 21
Minute
Peop
le EnteringLeaving
Simple/ distractor Complex/ distractor
Building Blocks of Dynamic Systems 29
0
5
10
15
20
25
1 3 5 7 9 11 13 15 17 19 21
Entering
Leaving
Gap
Related Documents