3 “Earth provides enough to satisfy every man’s needs, but not every man’s greed.” ― Mahatma Gandhi UDAIPUR DISTRICT ENVIRONMENT PLAN Submitted by: District Collector and District Magistrate DUNGARPUR Source: https://www.wallpapertip.com/wdown/ihTmbwm_city-palace-udaipur-image/

Welcome message from author
This document is posted to help you gain knowledge. Please leave a comment to let me know what you think about it! Share it to your friends and learn new things together.
Transcript
3
“Earth provides enough to satisfy every man’s needs, but not every man’s greed.”
― Mahatma Gandhi
UDAIPUR DISTRICT
ENVIRONMENT PLAN
Submitted by:
District Collector and District
Magistrate
DUNGARPUR
Source: https://www.wallpapertip.com/wdown/ihTmbwm_city-palace-udaipur-image/
2
Sh. Chetan Deora, IAS
Collector and District Magistrate, Udaipur
Balaji Kari, IFS
DCF Udaipur (North)
Cum Member Secretary, Zila Paryavaran Samiti
Sh. Ashok Kumar
Additional District Magistrate, City, Udaipur
Sh. O P Bunkar
Additional District Magistrate, Grameen, Udaipur
Dr. Bhanwar Vishvendra Raj Singh,
Assistant Professor, MLSU, Udaipur
(Knowledge Partner)
Mohanlal Sukhadia University, Udaipur
Source: https://keystoneacademic res.cloudinary.com/image/upload/q_auto, f_auto, w_372,
c_limit/element/16/16594_Environment_Research_Innovation.JPG
3
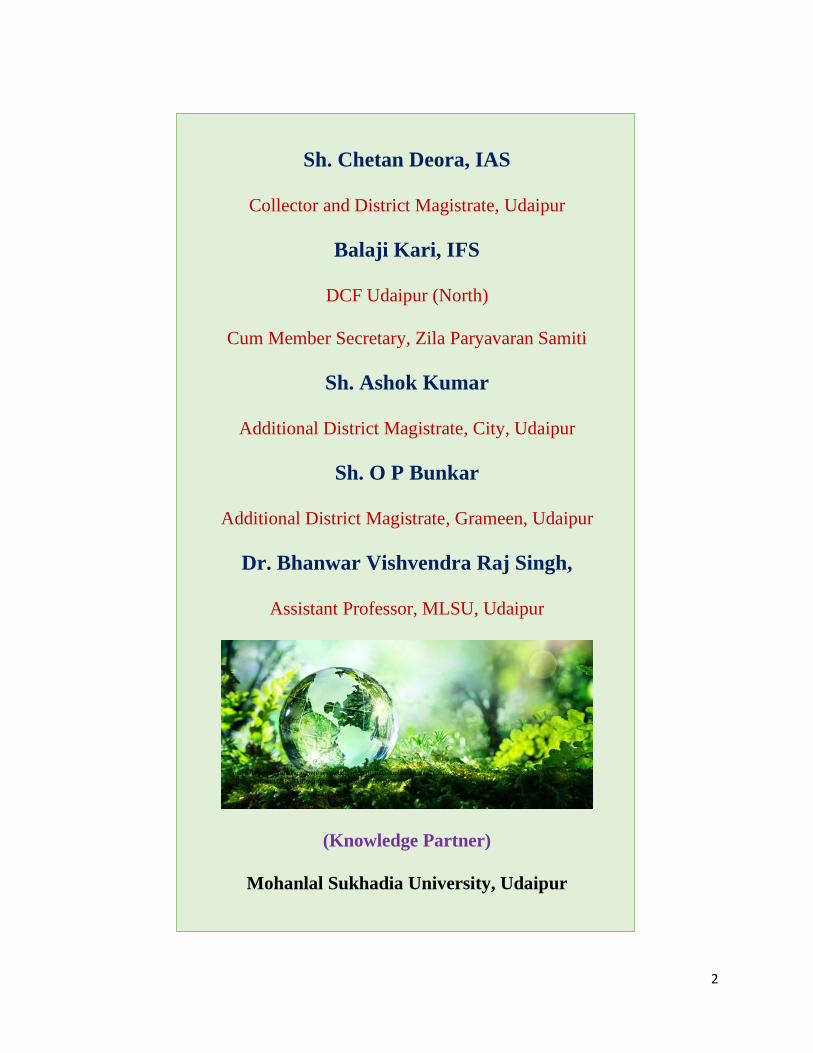
LIST OF CONTENT
Sr. No. CHAPTER NAME PAGE NO.
1. FOREWORD 4
2. DISTRICT UDAIPUR AT A GLANCE 6
3. CAUSES OF POLLUTION IN RESPECT TO UDAIPUR 14
4. OUTCOMES OF INVENTORIES 23
5. SOLID WASTE MANAGEMENT PLAN 23
6. PLASTIC WASTE MANAGEMENT PLAN 42
7. C & D WASTE MANAGEMENT PLAN 51
8. BIOMEDICAL WASTE MANAGEMENT PLAN 56
9. HAZARDOUS WASTE MANAGEMENT PLAN 61
10. E-WASTE MANAGEMENT PLAN 65
11. WATER QUALITY MANAGEMENT PLAN 67
12. DOMESTIC SEWAGE MANAGEMENT PLAN 73
13. INDUSTRIAL WASTE MANAGEMENT PLAN 80
14. AIR QUALITY MANAGEMENT PLAN 84
15. MINING ACTIVITY MANAGEMENT PLAN 115
16. SOIL & AGRICULTURE LAND MANAGEMENT 116
17. NOISE POLLUTION MANAGEMENT PLAN 131
18. FOREST CONSERVATION PRACTICES 133
19. MITIGATION EFFORTS TO REDUCE ENVIRONMENTAL
POLLUTION 147
4
FOREWORD
Hon’ble National Green Tribunal in O.A. No. -360/2018, dated 26/09/2019 ordered
regarding constitution of District Committee (as a part of District Planning Committee under Article
243 ZD) under Articles 243 G, 243 W, 243 ZD read with Schedules 11 and 12 and Rule 15 of the
Solid Waste Management Rules, 2016.
In the above said order, it is stated that among others
“Chief Secretaries may personally monitor compliance of environmental norms (including
BMW Rules) with the District Magistrate once every month. The District Magistrates may conduct
such monitoring twice every month. We find it necessary to add that in view of Constitutional
provisions under Articles 243 G, 243 W, 243 ZD read with Schedules 11 and 12 and Rule 15 of the
Solid Waste Management Rules, 2016 it is necessary to have a District Environment Plan to be
operated by a District committee (as a part of District Planning Committee under Article 243 ZD)”
In this regard, Environment & Forest Department, Govt of Rajasthan vide dated 04th December
2019 instructed the Divisional Commissioners to prepare District Environmental Plans by
constituting District Environment Committee (as per GoR vide letter no. 88 dated 17.09.2020) with
representatives from concerned departments under chairmanship of the District Collector.
As per the directions, District Committee in respect of UDAIPUR district was formed to evolve and
execute District Environmental Plan in the UDAIPUR District. District Environment Committee,
Udaipur at minutes of meeting dated 16.12.2020.
A meeting of the District Committee to evolve the District Environmental Plan in respect of
UDAIPUR District was held on 16.12.2020
This plan has been prepared in line with the model District Environment Plan (DEP) of CPCB and
covers 7 thematic areas by capturing 64 action areas through about 220 data points which are
essential part of this plan.
5
Source: - https://www.udaipurblog.com/wp-content/uploads/2019/07/udaipur-city-palace-148132813635-
orijgp.jpg
6
1. DISTRICT UDAIPUR AT A GLANCE
1.1. GENERAL
Udaipur, the 'City of Lakes' was founded in 1599 by Maharana Udai Singh. The city hailed as the
'Venice of the East' set amidst the Aravali hills of South Rajasthan, is one of the most romantic
destinations in India. Udaipur has a profusion of marble palaces, lakes, temples, cenotaphs and
rugged hills. It's also proud of its heritage as a centre for the performing arts, painting and crafts.
Famous historical personalities like Maharana Pratap, Rani Padmini and Meera Bai, the poetess
and devotee of Lord Krishna hail from here. The enchanting marble palaces and scenic beauty
makes it a most fantastic place for leisure.
1.2. LOCATION
Udaipur city lies between 24028’49’’ and 24042’56’’ N longitude and 73036’51’’ and 73049’46’’
E latitudes at a general elevation of about 598 meters above mean sea level in the Mewar region
of Rajasthan. It is located in the southern region of Rajasthan and is close to Gujarat. The total
geographical area of the city is 37 Sq. Km. the Udaipur district covers 14, 62,105 Hectares area
with 28% of forest area. The total population of the city as per census 2011 city is 4, 51,735
including 2, 34,681 male & 2, 17,054 females with literacy of 90.66. It is expected to cross 8.0
Lac by 2022.
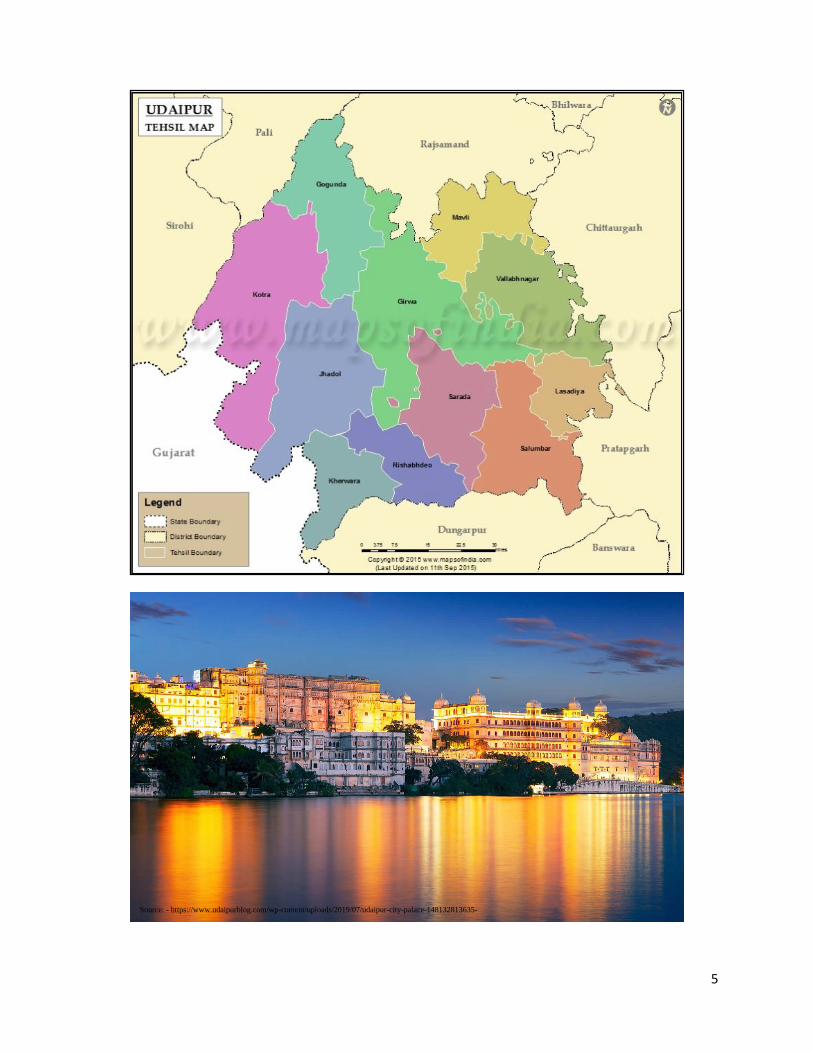
1.3. BOUNDARIES
It is bounded on the north by Rajasamand and Pali district, on the south by Dungarpur and
Banswara, on the east by Bhilwara and Chittorgarh and on the west by Pali and Sirohi districts and
Sabarkantha district (Gujarat). The district covers an area of 13618 sq. km.
1.4. PHYSIOGRAPHY
The district is surrounded by Aravalli ranges from North to East. The North part of the district
consists generally of elevated plateaus while the eastern part has vast stretches of fertile plains.
The southern part is covered with rocks, hills and dense forest. There are two important passages
in the Aravalli range viz. Desuri Nal and Sadri which serve as a link between Udaipur and Jodhpur
district.
1.5. DEMOGRAPHY
7
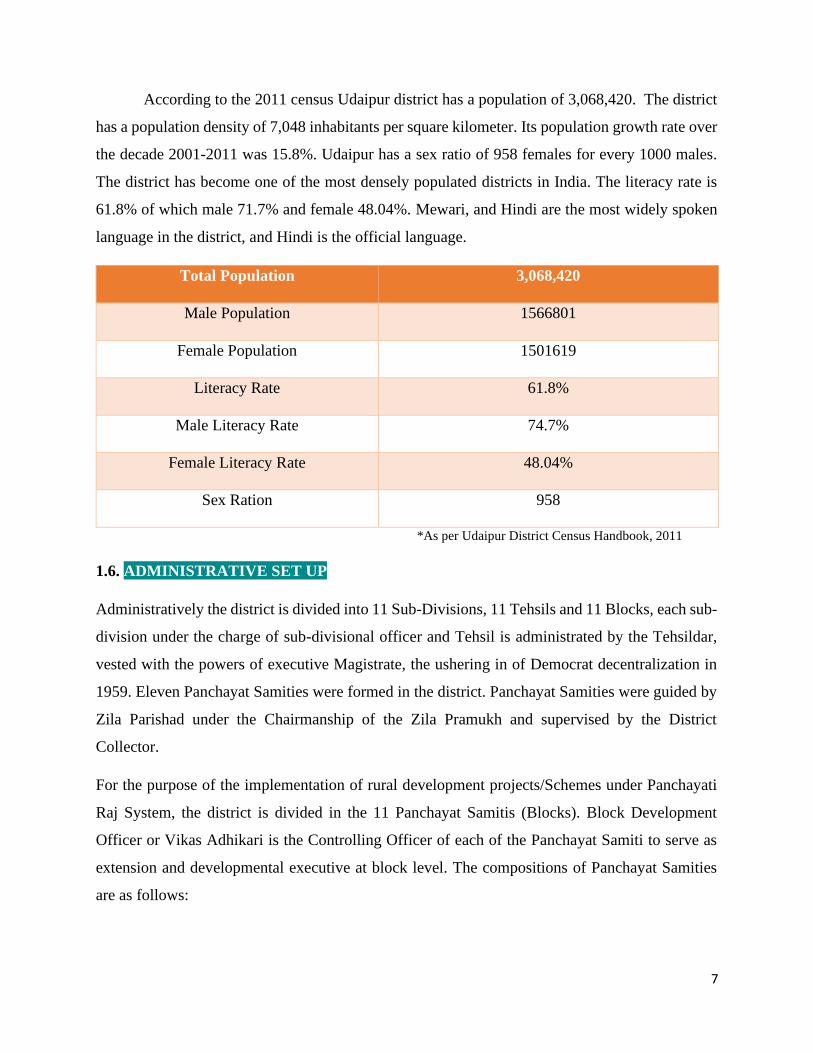
According to the 2011 census Udaipur district has a population of 3,068,420. The district
has a population density of 7,048 inhabitants per square kilometer. Its population growth rate over
the decade 2001-2011 was 15.8%. Udaipur has a sex ratio of 958 females for every 1000 males.
The district has become one of the most densely populated districts in India. The literacy rate is
61.8% of which male 71.7% and female 48.04%. Mewari, and Hindi are the most widely spoken
language in the district, and Hindi is the official language.
Total Population 3,068,420
Male Population 1566801
Female Population 1501619
Literacy Rate 61.8%
Male Literacy Rate 74.7%
Female Literacy Rate 48.04%
Sex Ration 958
*As per Udaipur District Census Handbook, 2011
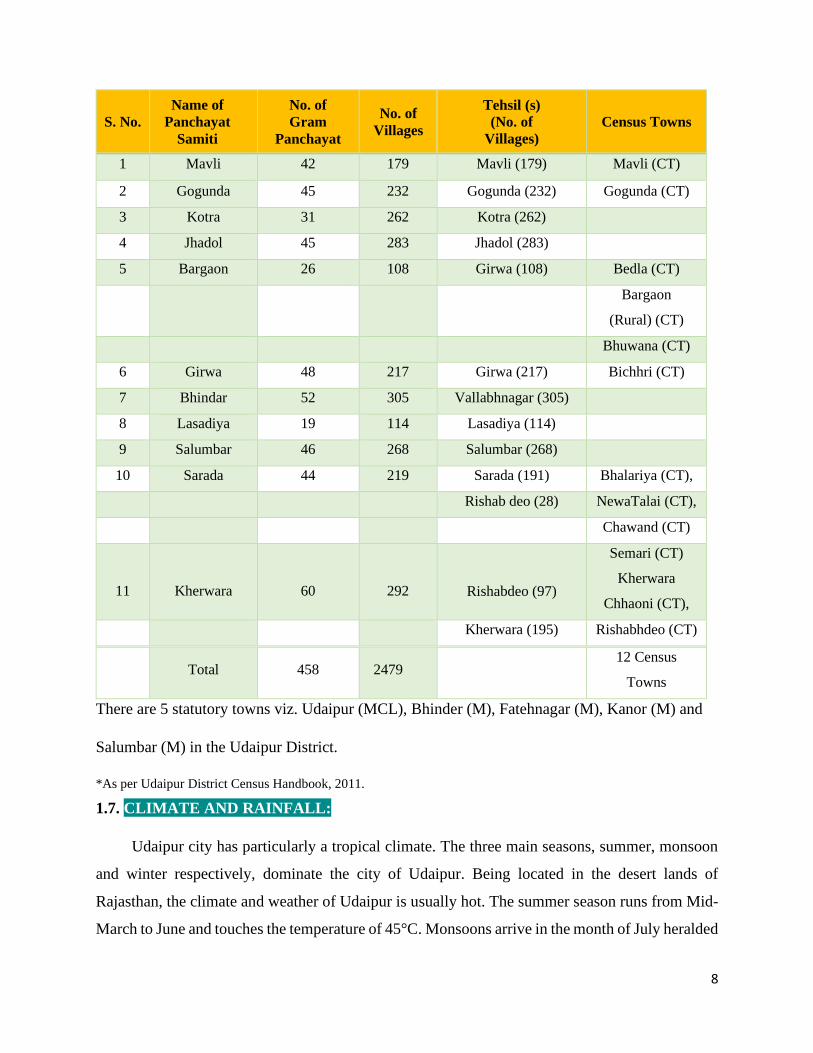
1.6. ADMINISTRATIVE SET UP
Administratively the district is divided into 11 Sub-Divisions, 11 Tehsils and 11 Blocks, each sub-
division under the charge of sub-divisional officer and Tehsil is administrated by the Tehsildar,
vested with the powers of executive Magistrate, the ushering in of Democrat decentralization in
1959. Eleven Panchayat Samities were formed in the district. Panchayat Samities were guided by
Zila Parishad under the Chairmanship of the Zila Pramukh and supervised by the District
Collector.
For the purpose of the implementation of rural development projects/Schemes under Panchayati
Raj System, the district is divided in the 11 Panchayat Samitis (Blocks). Block Development
Officer or Vikas Adhikari is the Controlling Officer of each of the Panchayat Samiti to serve as
extension and developmental executive at block level. The compositions of Panchayat Samities
are as follows:
8
S. No.
Name of
Panchayat
Samiti
No. of
Gram
Panchayat
No. of
Villages
Tehsil (s)
(No. of
Villages)
Census Towns
1 Mavli 42 179 Mavli (179) Mavli (CT)
2 Gogunda 45 232 Gogunda (232) Gogunda (CT)
3 Kotra 31 262 Kotra (262)
4 Jhadol 45 283 Jhadol (283)
5 Bargaon 26 108 Girwa (108) Bedla (CT)
Bargaon
(Rural) (CT)
Bhuwana (CT)
6 Girwa 48 217 Girwa (217) Bichhri (CT)
7 Bhindar 52 305 Vallabhnagar (305)
8 Lasadiya 19 114 Lasadiya (114)
9 Salumbar 46 268 Salumbar (268)
10 Sarada 44 219 Sarada (191) Bhalariya (CT),
Rishab deo (28) NewaTalai (CT),
Chawand (CT)
11
Kherwara
60
292
Rishabdeo (97)
Semari (CT)
Kherwara
Chhaoni (CT),
Kherwara (195) Rishabhdeo (CT)
Total 458 2479 12 Census
Towns
There are 5 statutory towns viz. Udaipur (MCL), Bhinder (M), Fatehnagar (M), Kanor (M) and
Salumbar (M) in the Udaipur District.
*As per Udaipur District Census Handbook, 2011.
1.7. CLIMATE AND RAINFALL:
Udaipur city has particularly a tropical climate. The three main seasons, summer, monsoon
and winter respectively, dominate the city of Udaipur. Being located in the desert lands of
Rajasthan, the climate and weather of Udaipur is usually hot. The summer season runs from Mid-
March to June and touches the temperature of 45°C. Monsoons arrive in the month of July heralded
9
by dust and thunderstorms. The city annually receives around 637 mm of rainfall. This scanty
amount of rainfall makes Udaipur more humid. The humidity reaches to the extent of 90 % during
the months of Monsoons. In Udaipur, winters are comparatively cooler than summers but not cold
at all. The winter season prevails from the month of October till the month of March. Humidity,
which prevails during monsoons, diminishes at the arrival of winters. The city observes pleasant
sunny days and enjoyable cool nights. The temperature falls to the level of 11.6°C in the nights.
Tourists arrive in numbers, anytime between mid-September to late March or early April.
1.8. FOREST, FLORA AND FAUNA
Udaipur district’s major portion is covered with rocks & hills which are well stocked
with forests. It covers about 297620 hectares under forests. The forests are valuable source of
income and partly sustain the economy of the district. The tendu, katha, honey, wax, barks and
grasses are economically important.
The forest in the district falls under the tropical dry deciduous. The district has large variety
of flora. The common species found are Babul, Bargad, Dhok, Gugal, Khejri, Pipal,Neem, Salon,
other tree found are Bahera, Hingota, Semal, Timru, Bans, Aak, Anwala,Thor, Karonda etc. The
wild life found in the various areas of the district includes a large variety of animals, birds, and
reptiles. Among the principal ones are panther, tiger, wild boar, sambhar, wolf, jack and stripped
hyaena etc. There are game sanctuaries at Jaisamand and Sajjangarh.
1.9. ENVIRONMENT
Environment is the complex of biotic and abiotic factors that act upon an organism or on
ecological community and ultimately determine its form and survival. Literally, environment
means all that which surrounds us. Biotic components or factors can be described as any living
components that affect other organisms or shape the eco systems. Abiotic factors are non-living
chemical and physical parts of the environment that affect living organisms and the functioning of
the ecosystems.
1.10. CAUSES OF ENVIRONMENTAL DEGRADATION
Major causes of the environmental degradation are modern urbanization, industrialization,
over-population growth, deforestation etc. Environmental pollution refers to the degradation of
10
quality and quantity of natural resources. Various types of human exercises are the fundamental
reasons of environmental degradation. These have prompted condition changes that have turned
out to be hurtful to every single living being. The smoke radiated by the vehicles and processing
plants expands the measure of toxic gases noticeable all around. The waste items, smoke radiated
by vehicles and ventures are the fundamental driver of contamination. Spontaneous urbanization
and industrialization have caused water, air and sound contamination. Urbanization and
industrialization help to expand contamination of the wellsprings of water. So also, the smoke
discharged by vehicles and ventures like Chlorofluorocarbon, nitrogen oxide, carbon monoxide
and other clean particles dirty air. Neediness still remains an issue at the base of a few ecological
issues.
1.11. EFFECTS OF ENVIRONMENTAL DEGRADATION
There are very adverse effects of environmental degradation. These effects can be enumerated as:
1. Water pollution and water scarcity
2. Air pollution
3. Solid and hazardous wastes
4. Soil degradation
5. Deforestation
6. Loss of biodiversity
7. Atmospheric changes
1.12. CURRENT SITUATION OF ENVIRONMENT
Due to over exploitation of the natural resources, the situation of environment is so poor that
could never be imagined by our old generations in previous time. This has led to various types of
pollution i.e., Air, Water Soil and Noise Pollution. Settlements are the main reasons of increasing
pollution which have resulted in various diseases and hampered the quality of life.
1.13. SOLUTIONS FOR ENVIRONMENT PROTECTION:
11
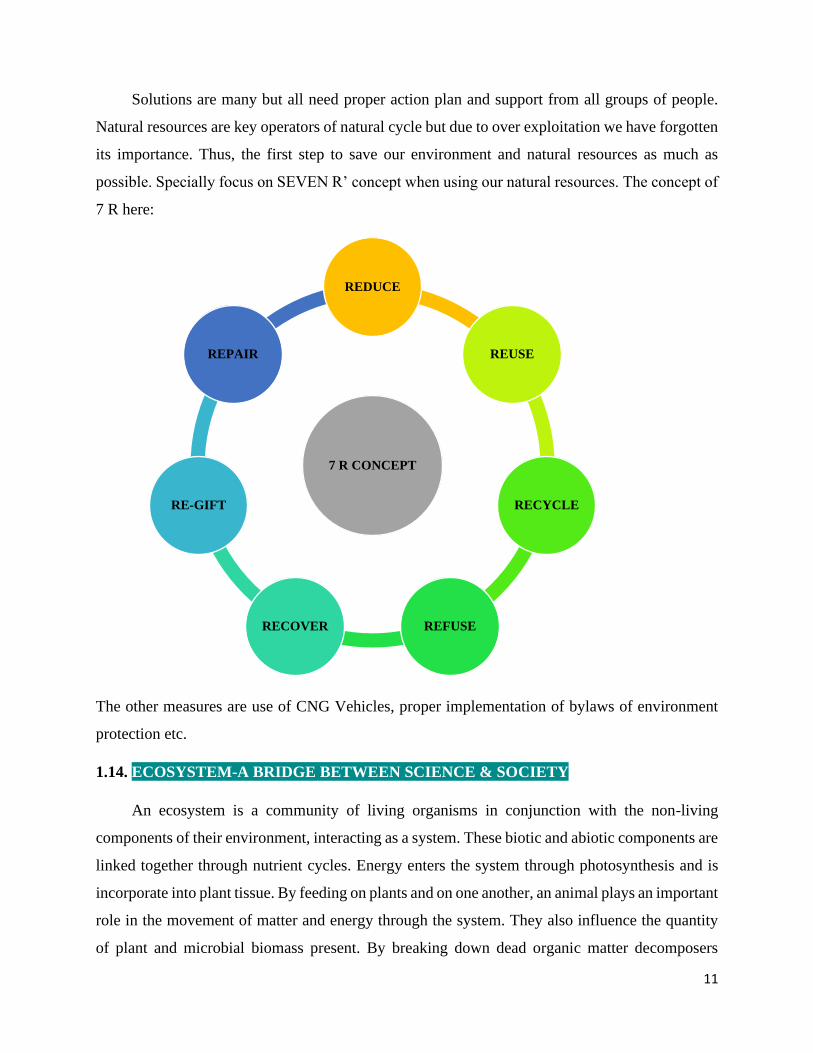
Solutions are many but all need proper action plan and support from all groups of people.
Natural resources are key operators of natural cycle but due to over exploitation we have forgotten
its importance. Thus, the first step to save our environment and natural resources as much as
possible. Specially focus on SEVEN R’ concept when using our natural resources. The concept of
7 R here:
The other measures are use of CNG Vehicles, proper implementation of bylaws of environment
protection etc.
1.14. ECOSYSTEM-A BRIDGE BETWEEN SCIENCE & SOCIETY
An ecosystem is a community of living organisms in conjunction with the non-living
components of their environment, interacting as a system. These biotic and abiotic components are
linked together through nutrient cycles. Energy enters the system through photosynthesis and is
incorporate into plant tissue. By feeding on plants and on one another, an animal plays an important
role in the movement of matter and energy through the system. They also influence the quantity
of plant and microbial biomass present. By breaking down dead organic matter decomposers
7 R CONCEPT
REDUCE
REUSE
RECYCLE
REFUSERECOVER
RE-GIFT
REPAIR
12
release carbon back to the atmosphere and facilitate nutrient cycling by converting nutrient stored
in dead biomass back to a form that can be readily used by plants and other microbes.
Ecosystems are controlled by external and internal factors. External factors such as climate,
soil and topography, control the overall structure of an eco-system but are not themselves
influenced by the eco system Unlike external factors, internal factors are controlled, e.g.,
decomposition, root competition, shading, disturbance, succession, and types of specious present.
Ecosystems are dynamic entities. They are subject to periodic disturbance and are in the
process of recovering from some past disturbance. When perturbation occurs, an eco-system
responds by moving away from its initial state. The tendency of an eco-system to remain close to
its equilibrium state, despite that disturbance is termed its resistance. On the other hand, the speed
with which it returns to its initial stage after disturbance is called its resilience. Time plays a role
in the development of soil from bare rock and the recovery of a community from disturbance.
1.15. POLLUTION
The word “POLLUTION” has been derived from the Latin word “POLLUTIONEM” which
mean defilement. Pollution is an undesirable change in physical, chemical or biological
characteristics of air, water and land. That may or will adversely affect human life and other life
forms. Various types of pollution are caused but mainly the following lead to life threatening and
adverse effects to humans in general.
Air Pollution- it is caused by the occurrence of foreign particles (aerosols or SPM) or gases in the
atmosphere. It is caused by vehicular emission, dust from unpaved roads, burning of agriculture
wastes, burning of fuels release, and release of hazardous gases from industries.
Water Pollution- it is the addition of some substances (Organic, Inorganic, Biological or
Radiological) or factor (Heat, pH) which degrades the quality of water so that it either become
health hazard or unfit for use. It is caused by sewage, dumping of municipal/solid based,
biomedical waste, E-waste, C & D waste etc.
Noise Pollution- Increase in noise level needs to noise pollution. Noise is defined as unpleasant
sound that has an adverse effect on the human. Major causes are the honking of moving vehicles,
DJ at Marriage and loud music at religious places, running of machines at sites, radio, TV etc.
13
Soil Pollution- Soil contamination or soil pollution as part of land degradation is caused by the
presence of Xenobiotic (Human-made) chemicals or other alteration in the natural soil
environments. It is typically caused by industrial activity, agriculture chemicals or improper
disposal of waste.
1.16. ENVIRONMENTAL MANAGEMENT
There are two main approaches for environmental management.
1. Management based on standards.
2. Management based on best practicable means.
The first approach requires statutory provisions for standards for each pollutant for air, water
and noise and soil pollution. In this approach, each polluter could choose a suitable for pollution
control, based on their evaluation for technical feasibility and economic viability.
The second approach is based on best practicable means. In this case the industry is free to
adopt any suitable method which is technically feasible as well as economically viable.
1.17. PP PRINCIPLE (PPP)
The “Polluter Pays Principle” is the common accepted practice that those who produce
pollution should bear the cost of managing it to prevent damage to human health or environment.
This principle underpins most of the regulation of pollution affecting land, water and air.
14
2. CAUSES OF POLLUTION IN RESPECT TO UDAIPUR
Udaipur city falls under Non-Attainment Cities. The City is prone to various environmental issues.
The Key Issues and Concerns are:
1. Increasing air pollution majorly due to increased vehicular movements and traffic, cutting
of roads, construction activities, burning of fuels etc.
2. Polluted water bodies: lakes and river
3. Ground water pollution due to Industrial activities, septic tanks, leakage, and overflow of
sewerage pipelines.
4. The city faces high risk of fire accidents in the core city area due to congestion and narrow
roads, restricting the movement of firefighting services.
5. The city is prone to natural disasters like drought.
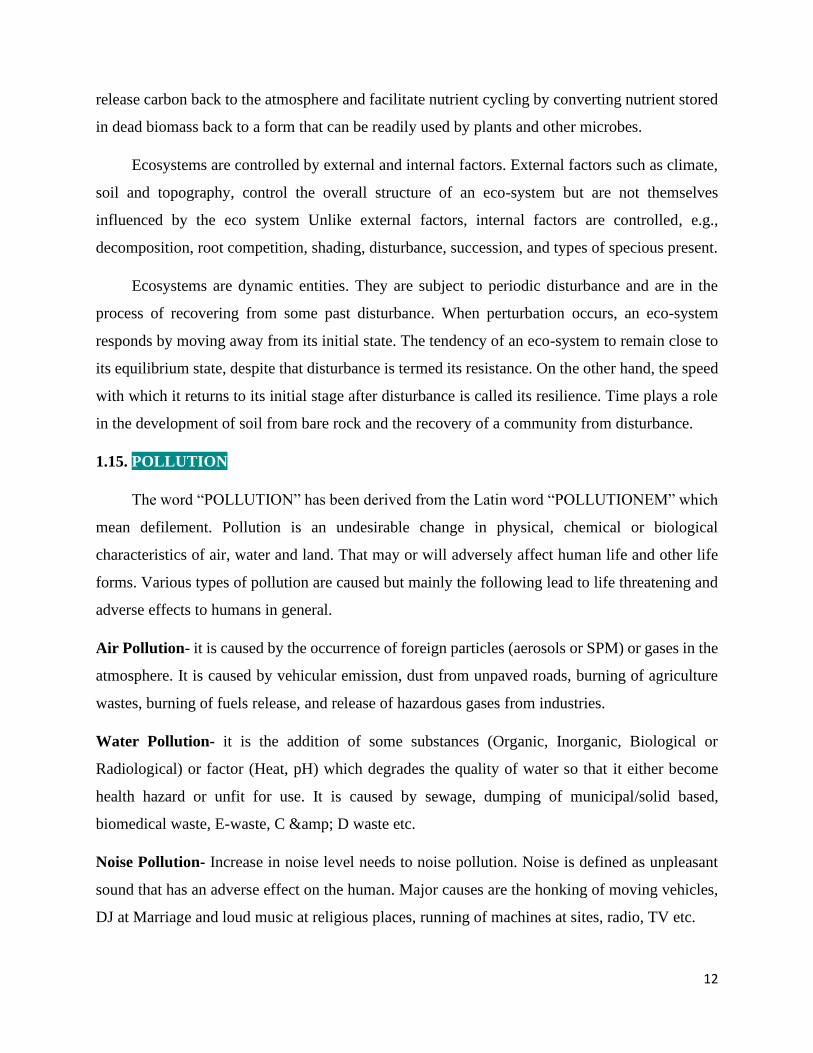
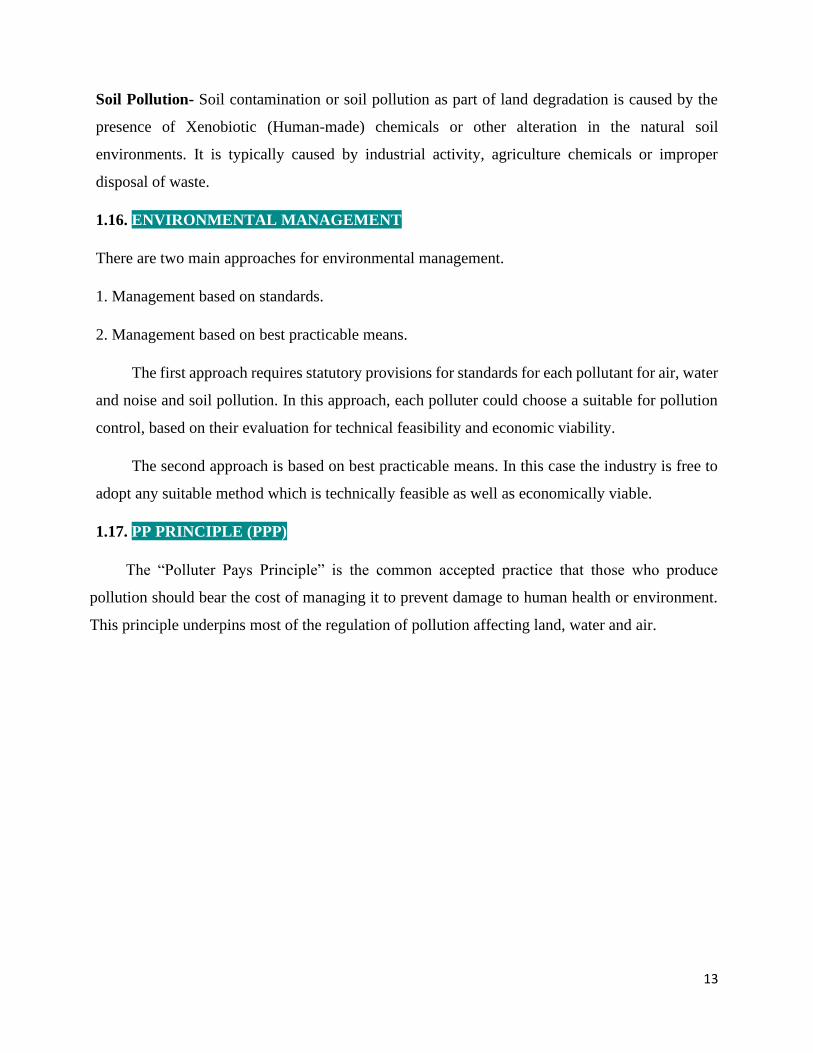
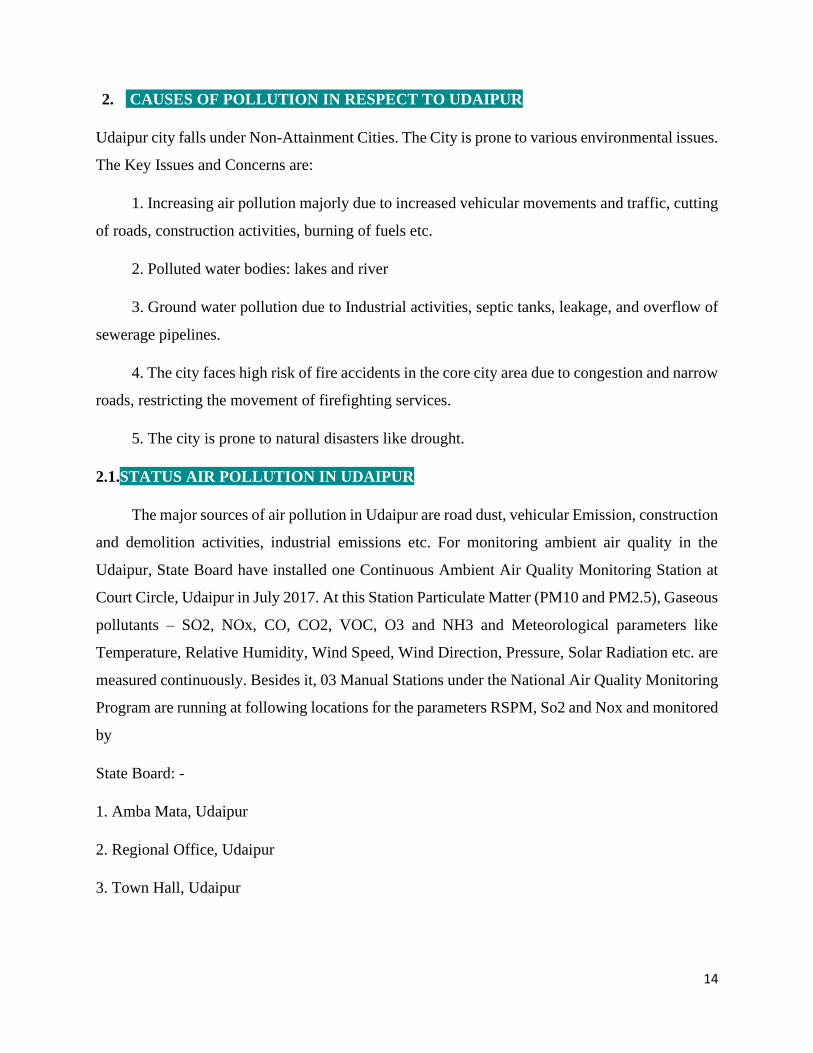
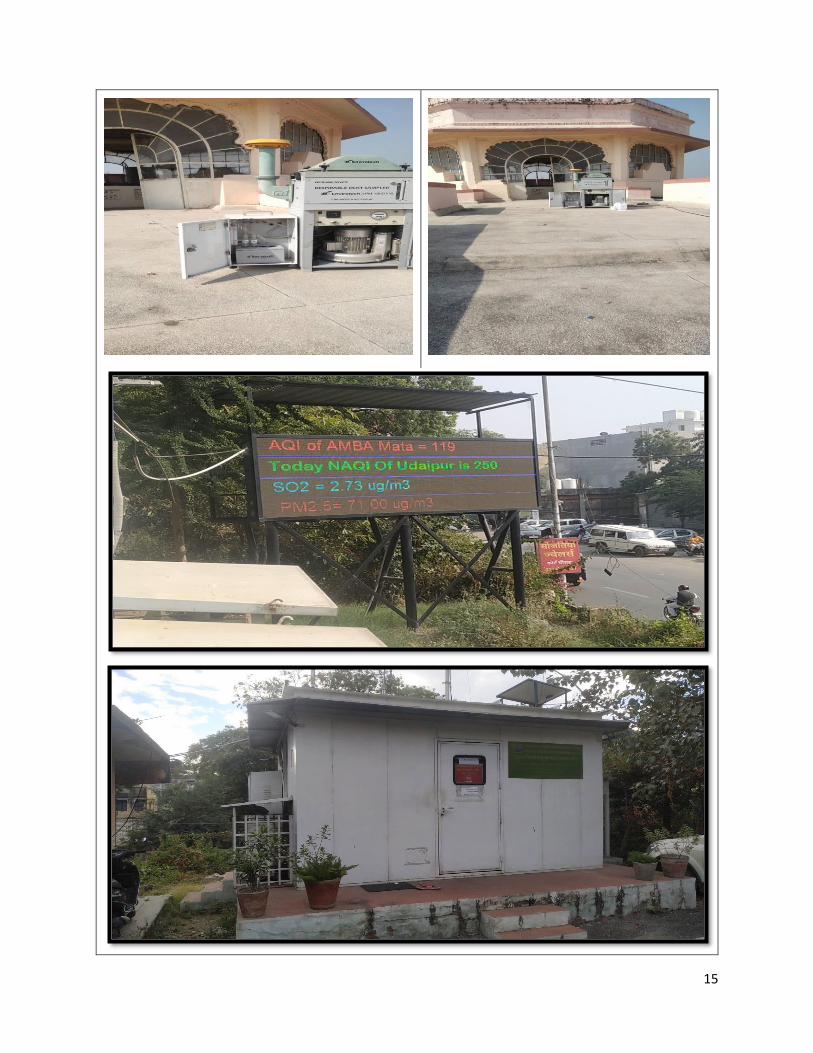
2.1.STATUS AIR POLLUTION IN UDAIPUR
The major sources of air pollution in Udaipur are road dust, vehicular Emission, construction
and demolition activities, industrial emissions etc. For monitoring ambient air quality in the
Udaipur, State Board have installed one Continuous Ambient Air Quality Monitoring Station at
Court Circle, Udaipur in July 2017. At this Station Particulate Matter (PM10 and PM2.5), Gaseous
pollutants – SO2, NOx, CO, CO2, VOC, O3 and NH3 and Meteorological parameters like
Temperature, Relative Humidity, Wind Speed, Wind Direction, Pressure, Solar Radiation etc. are
measured continuously. Besides it, 03 Manual Stations under the National Air Quality Monitoring
Program are running at following locations for the parameters RSPM, So2 and Nox and monitored
by
State Board: -
1. Amba Mata, Udaipur
2. Regional Office, Udaipur
3. Town Hall, Udaipur
15
16
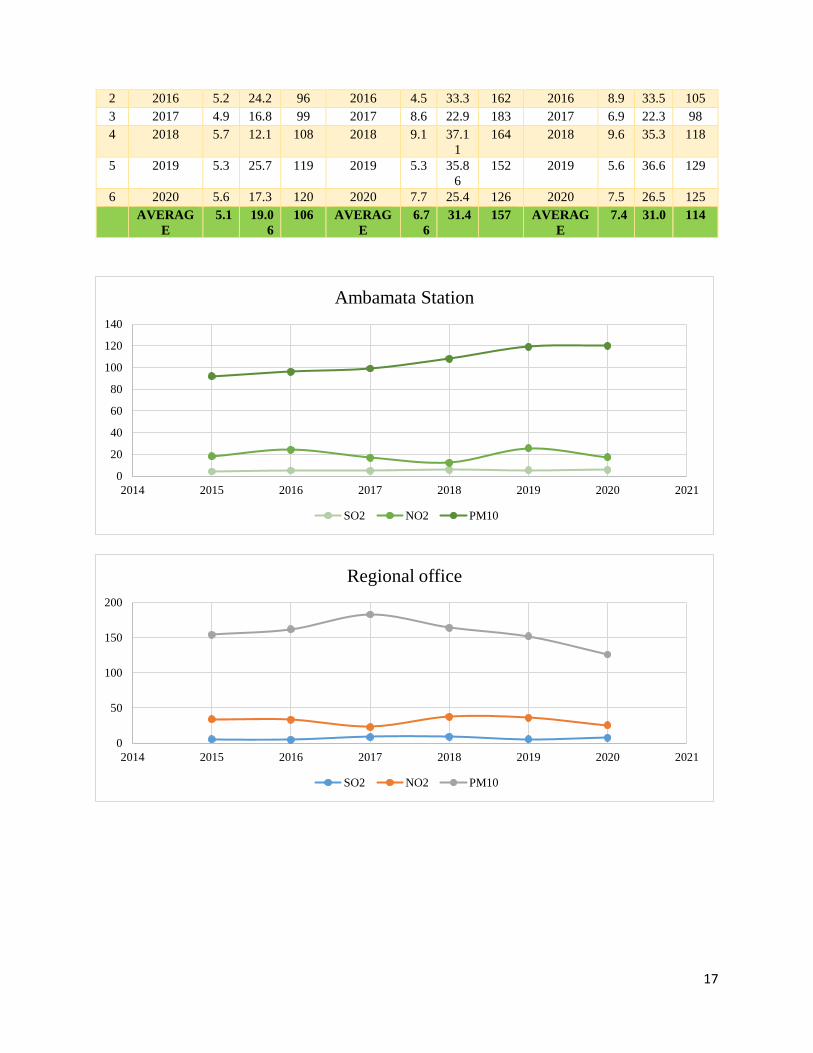
Rajasthan lies in the arid and semi-arid agro-climatic zone of the country and hence presence of
dust due to dry climatic conditions coupled with strong hot air movement is common. Presence of
Particulate Matter in the atmosphere goes particularly high during summer months and during
winters when the phenomenon of thermal inversion occurs. As per the available data, level of
gaseous pollutants like SO2 and NO2 are well within the prescribed limit of 80 µg/M3.
Due to the dry conditions prevailing over a major part of the year, levels of PM10 are found
to be in excess of the prescribed limit of 100 µg/M3.
Total no. of vehicles registered as on March, 2017 in Udaipur District with Transport Department
is 814490 (Truck: 32623, Bus 6270, Car: 73491, Taxi: 9237, Jeep: 203705, Three-Wheeler: 8057,
Two-Wheeler: 632370, Tractor: 18295, Trailers: 5117, Tempo (Pass): 3291, Tempo (Goods): 3201
and others: 2167).
In April 2018, the environment ministry released a draft of the National Clean Air Programme
(NCAP). Its main goal is “to meet the prescribed annual average ambient air quality standards at all
locations in the country in a stipulated timeframe.” Given the state of air quality in India, any
initiative by the Government of India is a welcome one, especially given the lack of monitoring data
in the research space and the lack of enforcement of existing laws to curb emissions. The current
NCAP draft is essentially a research programme designed to build institutional and technical
capacity of central and the state pollution boards. The timeline of all proposals concludes in less
than two years from the start. There is also no mention of a time-bound ambient air quality target to
achieve or how. A review of the draft is presented here.
In 2019, full program proposal was released and this includes 122 non-attainment cities, who are
required to submit an action plan to reduce their respective air pollution levels in 2024 by at least
20%. Udaipur is one of them.
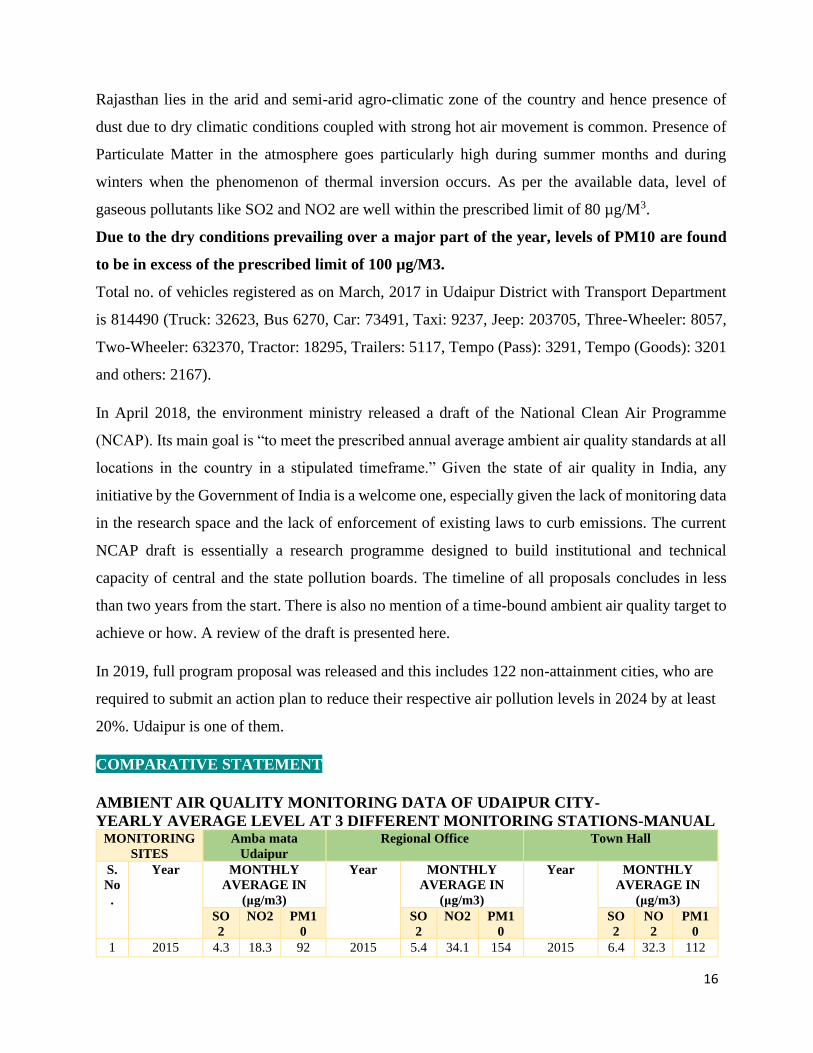
COMPARATIVE STATEMENT
AMBIENT AIR QUALITY MONITORING DATA OF UDAIPUR CITY-
YEARLY AVERAGE LEVEL AT 3 DIFFERENT MONITORING STATIONS-MANUAL MONITORING
SITES
Amba mata
Udaipur
Regional Office Town Hall
S.
No
.
Year MONTHLY
AVERAGE IN
(μg/m3)
Year MONTHLY
AVERAGE IN
(μg/m3)
Year MONTHLY
AVERAGE IN
(μg/m3)
SO
2
NO2 PM1
0
SO
2
NO2 PM1
0
SO
2
NO
2
PM1
0
1 2015 4.3 18.3 92 2015 5.4 34.1 154 2015 6.4 32.3 112
17
2 2016 5.2 24.2 96 2016 4.5 33.3 162 2016 8.9 33.5 105
3 2017 4.9 16.8 99 2017 8.6 22.9 183 2017 6.9 22.3 98
4 2018 5.7 12.1 108 2018 9.1 37.1
1
164 2018 9.6 35.3 118
5 2019 5.3 25.7 119 2019 5.3 35.8
6
152 2019 5.6 36.6 129
6 2020 5.6 17.3 120 2020 7.7 25.4 126 2020 7.5 26.5 125
AVERAG
E
5.1 19.0
6
106 AVERAG
E
6.7
6
31.4 157 AVERAG
E
7.4 31.0 114
0
20
40
60
80
100
120
140
2014 2015 2016 2017 2018 2019 2020 2021
Ambamata Station
SO2 NO2 PM10
0
50
100
150
200
2014 2015 2016 2017 2018 2019 2020 2021
Regional office
SO2 NO2 PM10
18
2.2. WATER ENVIRONMENT
Water supply of Udaipur depends upon surface and underground water sources of water such as
lakes, step wells, tube wells, wells etc. These sources of water supply obtain water during the rainy
season. Udaipur has numerous lakes in its vicinity that are Pichhola, Fateh Sagar, Udai Sagar,
Goverdhan Sagar, Bari and Jaisamand lakes. These lakes along with step wells, tube wells have
been Udaipur’s major sources of drinking water. The biggest attractions of these lakes are the
gardens and monuments built amidst these lakes. However, the lack of rain in the last few years
has prevented the natural overflow and with a lot of filth being thrown in, there have been serious
effects on the lake ecosystem.
2.2.1. LAKE WATER QUALITY
Udaipur is dependent on its lake system, which is directly, or indirectly the life source of the city
in terms of surface water resources, tourism, and the ecosystem at large. Most of the tourists come
to the city primarily because of the placid beauty of the lakes. The lakes attract an increasing
number of young adventurous tourists’ especially foreign tourists’ who provide foreign exchange,
thus strengthening the local economy. The Udaipur lake system comprises Lake Pichola, Rang
Sagar, Swaroop Sagar, Fateh Sagar, Badi, Madar and Udai Sagar. All the lakes of Udaipur form a
chain in the saucer shaped Udaipur valley.
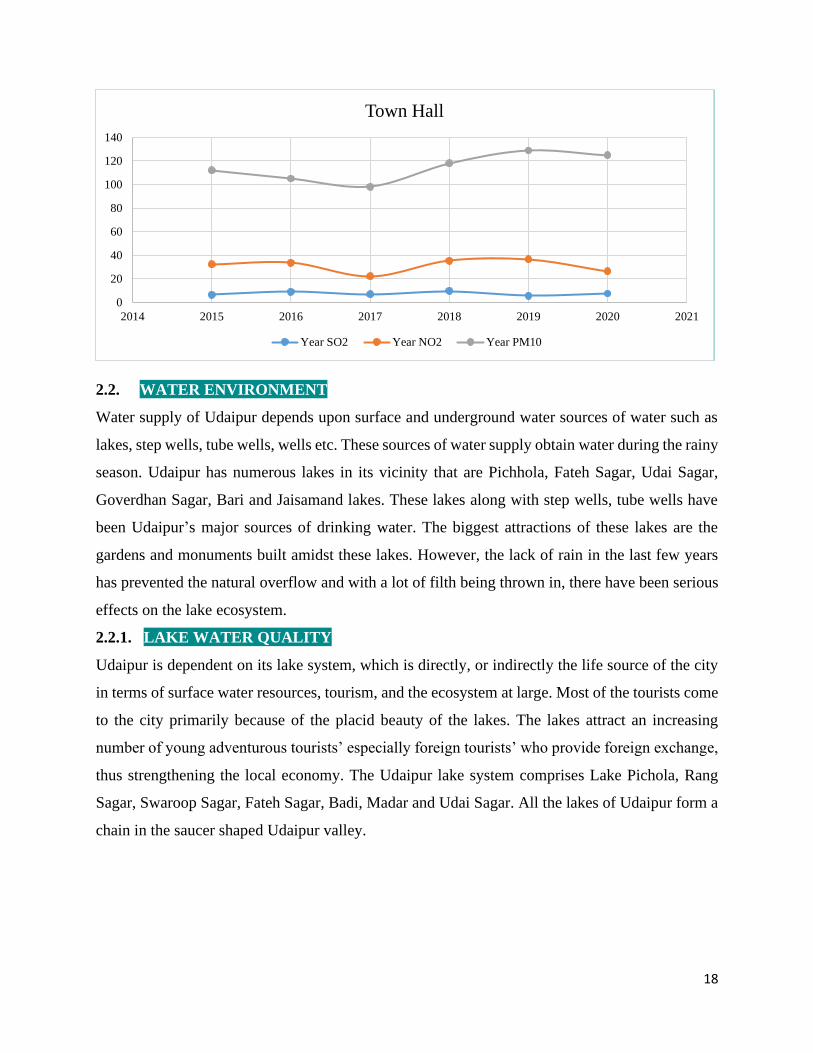
0
20
40
60
80
100
120
140
2014 2015 2016 2017 2018 2019 2020 2021
Town Hall
Year SO2 Year NO2 Year PM10
19
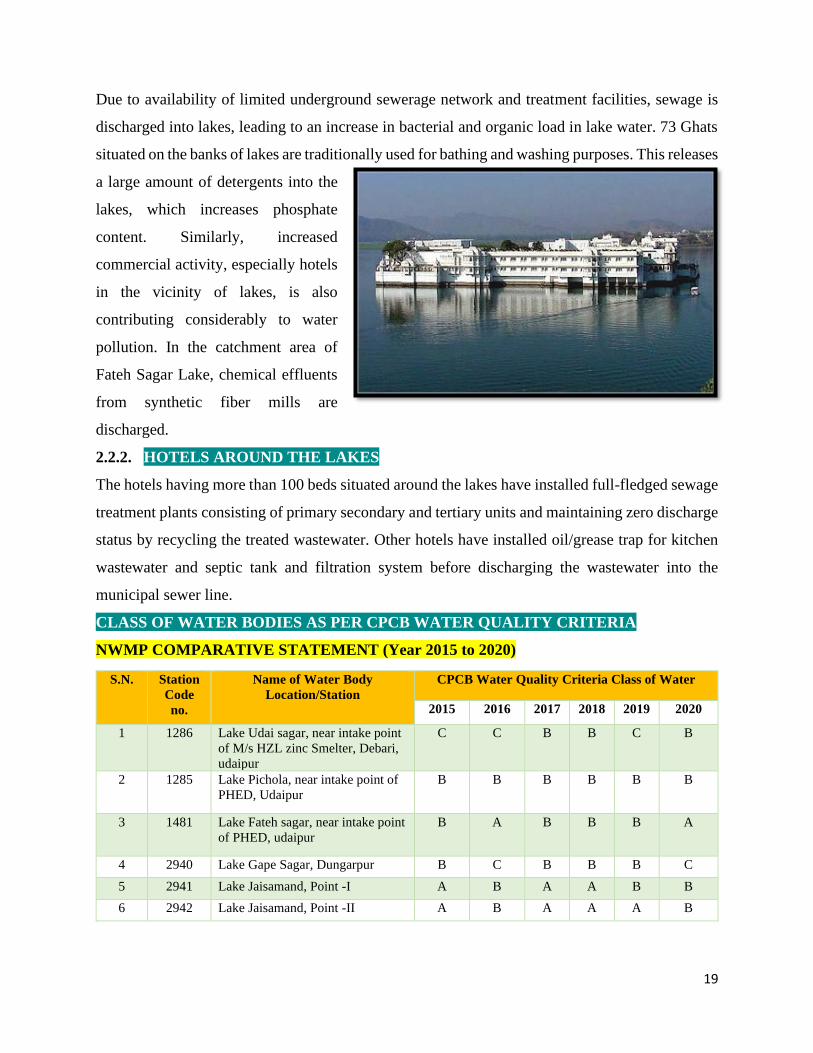
Due to availability of limited underground sewerage network and treatment facilities, sewage is
discharged into lakes, leading to an increase in bacterial and organic load in lake water. 73 Ghats
situated on the banks of lakes are traditionally used for bathing and washing purposes. This releases
a large amount of detergents into the
lakes, which increases phosphate
content. Similarly, increased
commercial activity, especially hotels
in the vicinity of lakes, is also
contributing considerably to water
pollution. In the catchment area of
Fateh Sagar Lake, chemical effluents
from synthetic fiber mills are
discharged.
2.2.2. HOTELS AROUND THE LAKES
The hotels having more than 100 beds situated around the lakes have installed full-fledged sewage
treatment plants consisting of primary secondary and tertiary units and maintaining zero discharge
status by recycling the treated wastewater. Other hotels have installed oil/grease trap for kitchen
wastewater and septic tank and filtration system before discharging the wastewater into the
municipal sewer line.
CLASS OF WATER BODIES AS PER CPCB WATER QUALITY CRITERIA
NWMP COMPARATIVE STATEMENT (Year 2015 to 2020)
S.N. Station
Code
no.
Name of Water Body
Location/Station
CPCB Water Quality Criteria Class of Water
2015 2016 2017 2018 2019 2020
1 1286 Lake Udai sagar, near intake point
of M/s HZL zinc Smelter, Debari,
udaipur
C C B B C B
2 1285 Lake Pichola, near intake point of
PHED, Udaipur
B B B B B B
3 1481 Lake Fateh sagar, near intake point
of PHED, udaipur
B A B B B A
4 2940 Lake Gape Sagar, Dungarpur B C B B B C
5 2941 Lake Jaisamand, Point -I A B A A B B
6 2942 Lake Jaisamand, Point -II A B A A A B
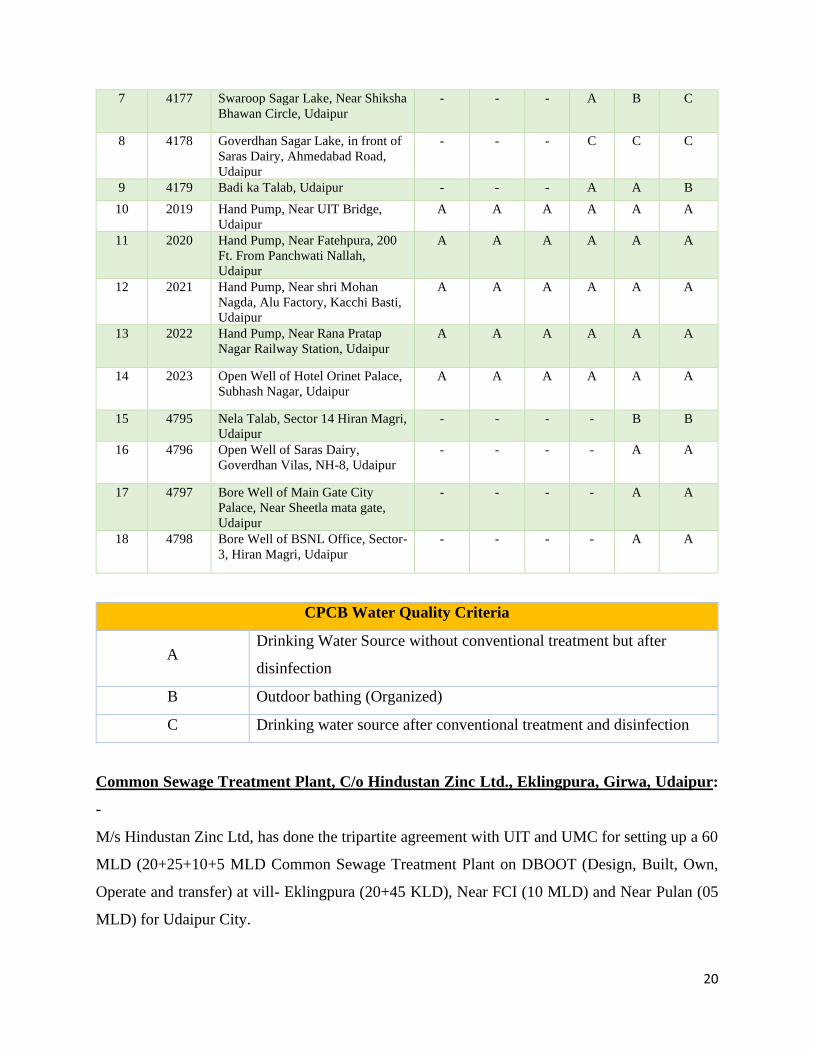
20
7 4177 Swaroop Sagar Lake, Near Shiksha
Bhawan Circle, Udaipur
- - - A B C
8 4178 Goverdhan Sagar Lake, in front of
Saras Dairy, Ahmedabad Road,
Udaipur
- - - C C C
9 4179 Badi ka Talab, Udaipur - - - A A B
10 2019 Hand Pump, Near UIT Bridge,
Udaipur
A A A A A A
11 2020 Hand Pump, Near Fatehpura, 200
Ft. From Panchwati Nallah,
Udaipur
A A A A A A
12 2021 Hand Pump, Near shri Mohan
Nagda, Alu Factory, Kacchi Basti,
Udaipur
A A A A A A
13 2022 Hand Pump, Near Rana Pratap
Nagar Railway Station, Udaipur
A A A A A A
14 2023 Open Well of Hotel Orinet Palace,
Subhash Nagar, Udaipur
A A A A A A
15 4795 Nela Talab, Sector 14 Hiran Magri,
Udaipur
- - - - B B
16 4796 Open Well of Saras Dairy,
Goverdhan Vilas, NH-8, Udaipur
- - - - A A
17 4797 Bore Well of Main Gate City
Palace, Near Sheetla mata gate,
Udaipur
- - - - A A
18 4798 Bore Well of BSNL Office, Sector-
3, Hiran Magri, Udaipur
- - - - A A
CPCB Water Quality Criteria
A Drinking Water Source without conventional treatment but after
disinfection
B Outdoor bathing (Organized)
C Drinking water source after conventional treatment and disinfection
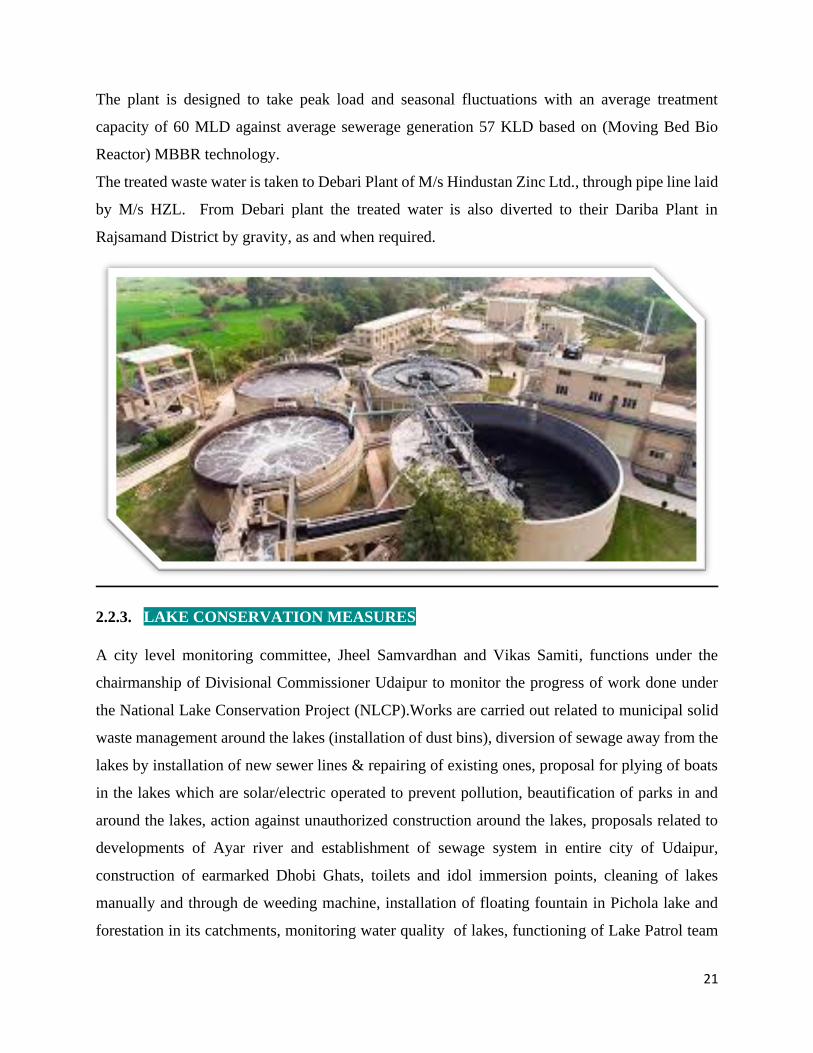
Common Sewage Treatment Plant, C/o Hindustan Zinc Ltd., Eklingpura, Girwa, Udaipur:
-
M/s Hindustan Zinc Ltd, has done the tripartite agreement with UIT and UMC for setting up a 60
MLD (20+25+10+5 MLD Common Sewage Treatment Plant on DBOOT (Design, Built, Own,
Operate and transfer) at vill- Eklingpura (20+45 KLD), Near FCI (10 MLD) and Near Pulan (05
MLD) for Udaipur City.
21
The plant is designed to take peak load and seasonal fluctuations with an average treatment
capacity of 60 MLD against average sewerage generation 57 KLD based on (Moving Bed Bio
Reactor) MBBR technology.
The treated waste water is taken to Debari Plant of M/s Hindustan Zinc Ltd., through pipe line laid
by M/s HZL. From Debari plant the treated water is also diverted to their Dariba Plant in
Rajsamand District by gravity, as and when required.
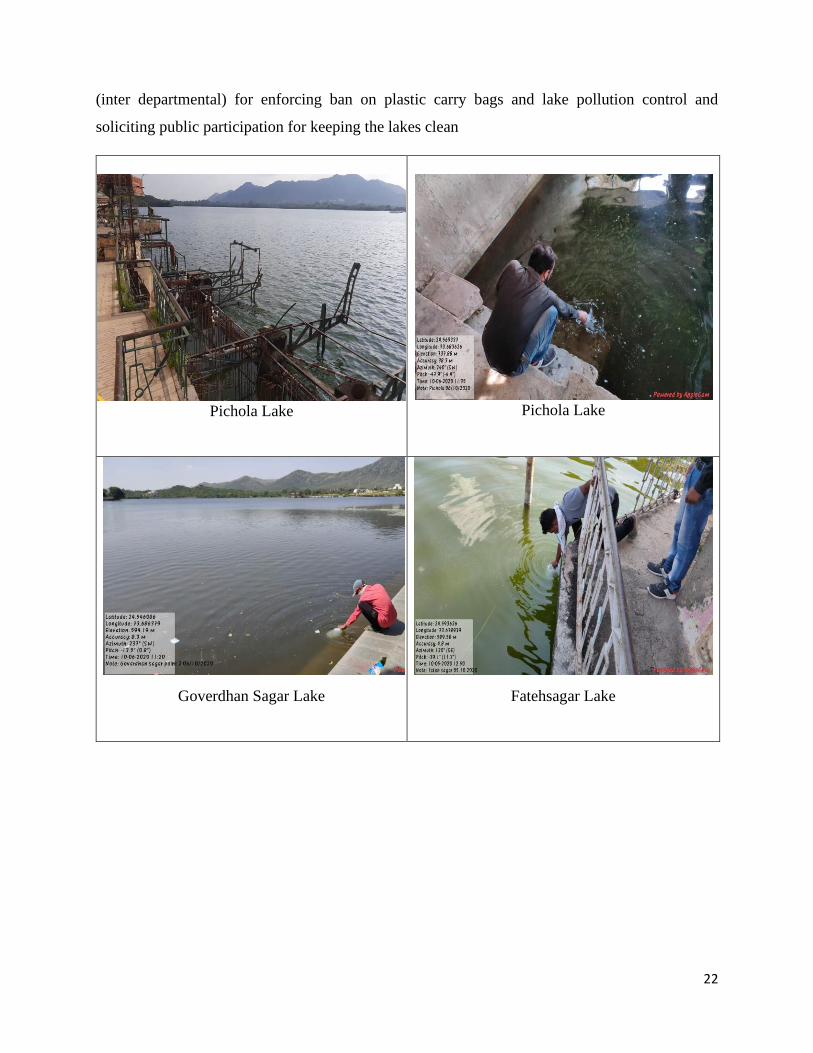
2.2.3. LAKE CONSERVATION MEASURES
A city level monitoring committee, Jheel Samvardhan and Vikas Samiti, functions under the
chairmanship of Divisional Commissioner Udaipur to monitor the progress of work done under
the National Lake Conservation Project (NLCP).Works are carried out related to municipal solid
waste management around the lakes (installation of dust bins), diversion of sewage away from the
lakes by installation of new sewer lines & repairing of existing ones, proposal for plying of boats
in the lakes which are solar/electric operated to prevent pollution, beautification of parks in and
around the lakes, action against unauthorized construction around the lakes, proposals related to
developments of Ayar river and establishment of sewage system in entire city of Udaipur,
construction of earmarked Dhobi Ghats, toilets and idol immersion points, cleaning of lakes
manually and through de weeding machine, installation of floating fountain in Pichola lake and
forestation in its catchments, monitoring water quality of lakes, functioning of Lake Patrol team
22
(inter departmental) for enforcing ban on plastic carry bags and lake pollution control and
soliciting public participation for keeping the lakes clean
Pichola Lake
Pichola Lake
Goverdhan Sagar Lake Fatehsagar Lake
23
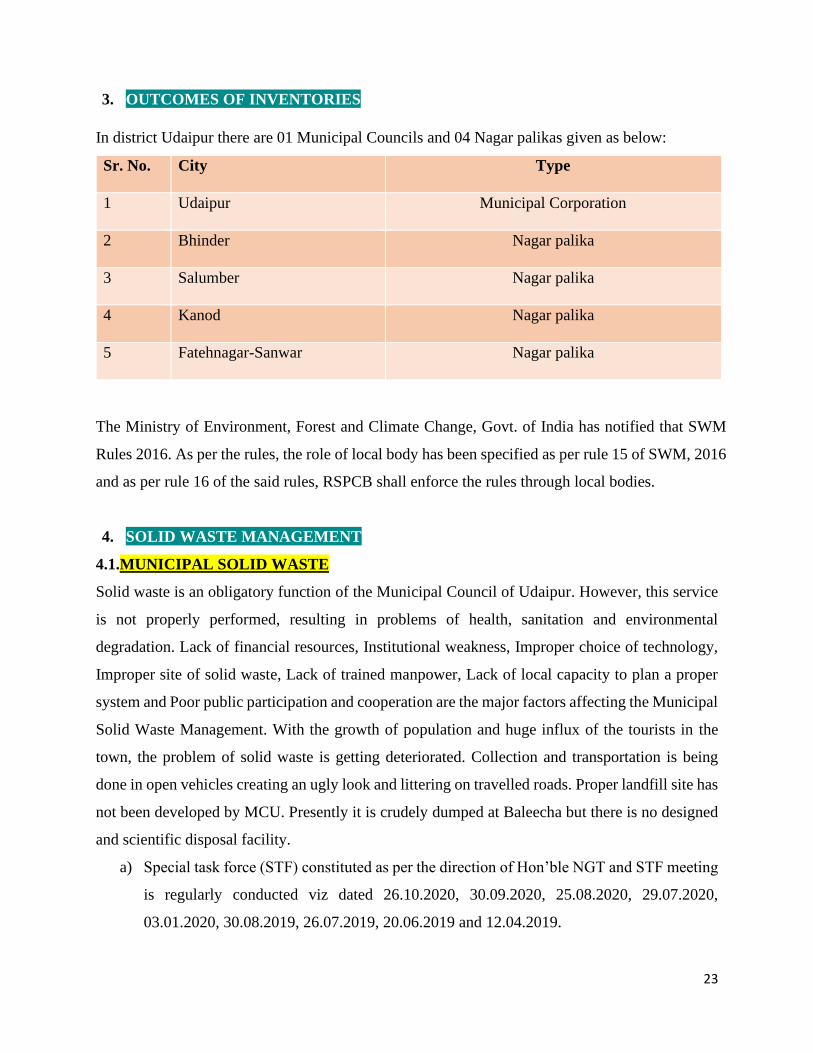
3. OUTCOMES OF INVENTORIES
In district Udaipur there are 01 Municipal Councils and 04 Nagar palikas given as below:
Sr. No. City Type
1 Udaipur Municipal Corporation
2 Bhinder Nagar palika
3 Salumber Nagar palika
4 Kanod Nagar palika
5 Fatehnagar-Sanwar Nagar palika
The Ministry of Environment, Forest and Climate Change, Govt. of India has notified that SWM
Rules 2016. As per the rules, the role of local body has been specified as per rule 15 of SWM, 2016
and as per rule 16 of the said rules, RSPCB shall enforce the rules through local bodies.
4. SOLID WASTE MANAGEMENT
4.1.MUNICIPAL SOLID WASTE
Solid waste is an obligatory function of the Municipal Council of Udaipur. However, this service
is not properly performed, resulting in problems of health, sanitation and environmental
degradation. Lack of financial resources, Institutional weakness, Improper choice of technology,
Improper site of solid waste, Lack of trained manpower, Lack of local capacity to plan a proper
system and Poor public participation and cooperation are the major factors affecting the Municipal
Solid Waste Management. With the growth of population and huge influx of the tourists in the
town, the problem of solid waste is getting deteriorated. Collection and transportation is being
done in open vehicles creating an ugly look and littering on travelled roads. Proper landfill site has
not been developed by MCU. Presently it is crudely dumped at Baleecha but there is no designed
and scientific disposal facility.
a) Special task force (STF) constituted as per the direction of Hon’ble NGT and STF meeting
is regularly conducted viz dated 26.10.2020, 30.09.2020, 25.08.2020, 29.07.2020,
03.01.2020, 30.08.2019, 26.07.2019, 20.06.2019 and 12.04.2019.
24
b) MCU identified 2 dumping sites at Tithardi village and Balicha village for setting up solid
waste processing facilities as per census 2011, population of Udaipur city was 451,100.
Current population of the city is 5 lakh (Approx.) and households under jurisdiction are
1.27 lakh (Approx.).
c) 100% Door to Door collection/transportation 100% Door to Door collection and
transportation- MCU has 115 auto tippers for door-to-door waste collection in all 70 wards.
All vehicles are being monitored by a GPS system.
d) 100% source segregation is being done in 62 wards (90 % of total wards) of MCU
e) 30 TPD MRF plant at Tithardi is functional.
f) 60 TPD wet waste composting plant at Tithardi is operational.
g) 50 TPD MRF plant is under construction.
h) 20 TPD biomethanation plant at BALICHA is operational.
i) Annual report of all ULB’s has been received and compiled and sent to H.O. RPCB.
The following Action areas has positive outcomes for ULB’s
Sr. No. Action Areas Outcome
1 Segregation of Waste PARTLY
2 Door to Door Collection 100%
3 COMPOSTING OF WET WASTE 100 %
4 RDF (REFUSE DERIVED FUEL) INITIATED
The following action areas have to be improved or they have to be included in the future action
plans:
Sr. No. Action Areas Outcome
1. MECHANICAL ROAD SWEEPING INITIATED
2. BIO-METHANATION INITIATED
3. USE OF SANITARY LANDFILLS INITIATED
4. LINKAGE WITH RECYCLERS INITIATED
5. AUTHORIZATION OF WASTE PICKERS NOT INITIATED
6. ISSUANCE OF ID CAR NOT INITIATED
25
4.2. SWM IN RURAL AREAS
The rural areas in District Udaipur can be divided into two parts:
Part A: Rural Areas without Industries
Part B: Rural Areas with Industries/Tourism units and mining activities.
In rural areas generally the waste material is Kitchen Waste, Agriculture Waste, Horticulture
Waste and domestic animal dung.
All these materials are being used for making manure by the farmers.
There is industrialization in Udaipur district and rural areas mainly having tourism units and
mining activities there is a problem of Solid Waste Management. As the areas are scattered there
is no mechanism finalized by the local bodies for their segregation and disposal in a scientific way.
This area needs improvement.
LANDFILL CAPPING AT TITARDI (MSW)
26
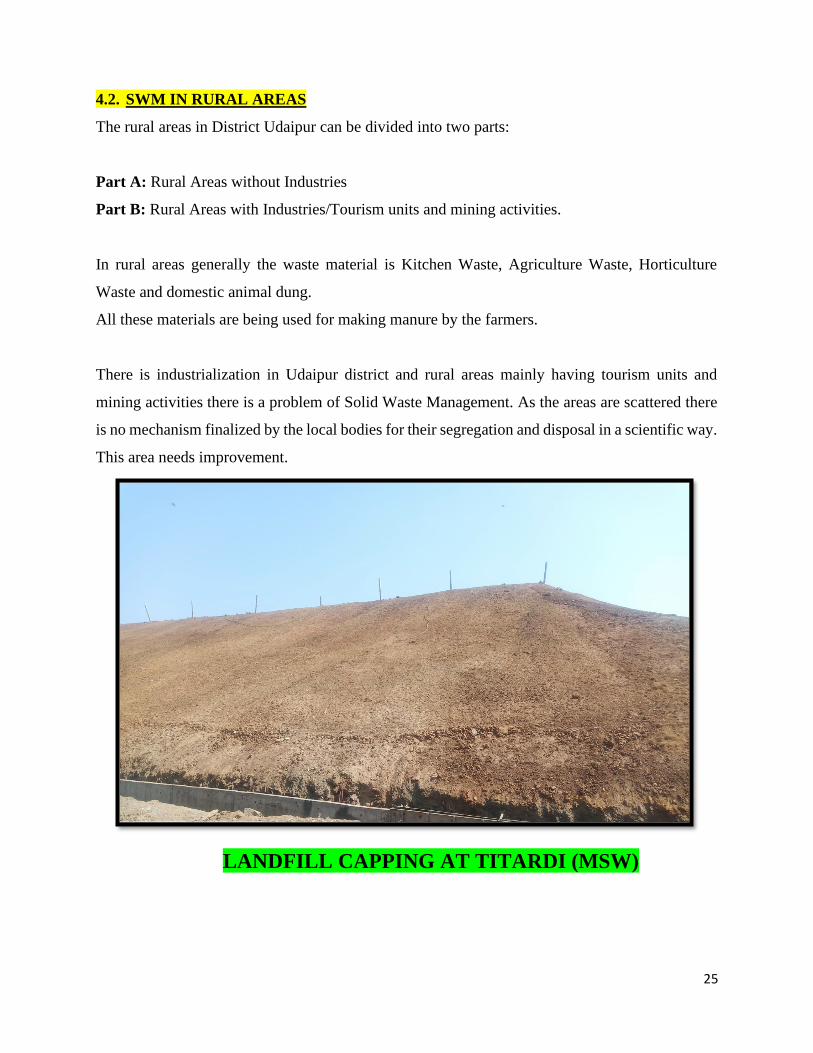
MRF
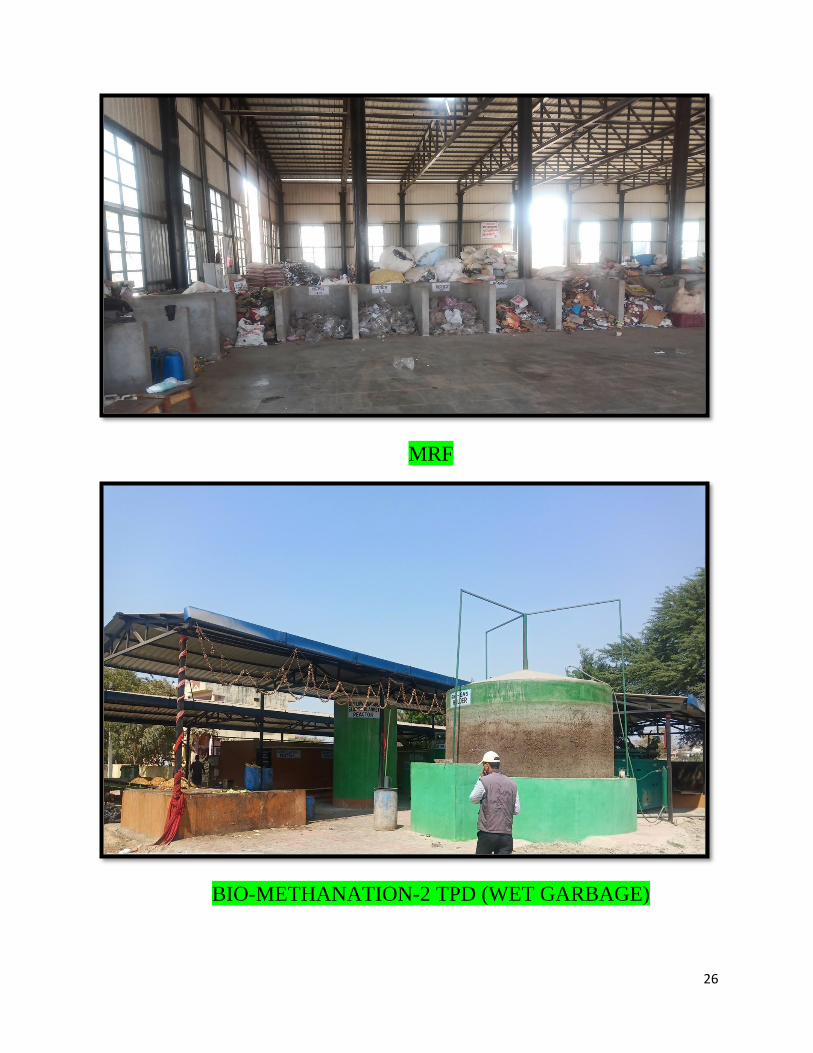
BIO-METHANATION-2 TPD (WET GARBAGE)
27
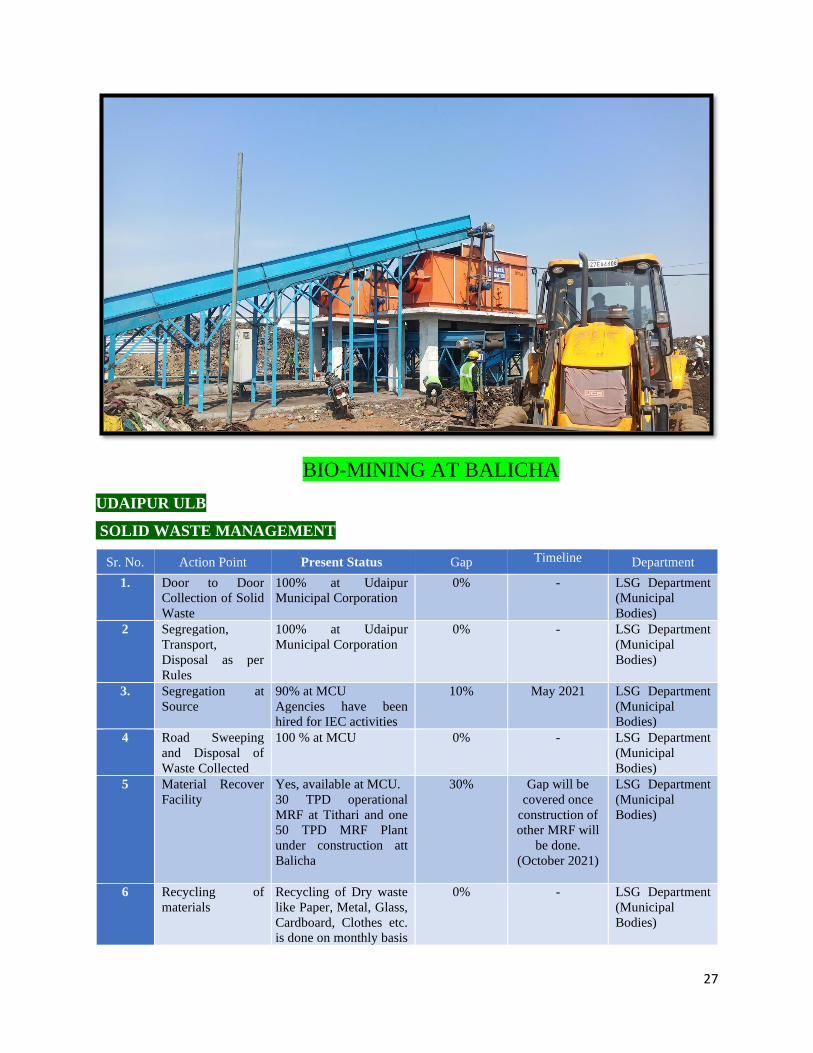
BIO-MINING AT BALICHA
UDAIPUR ULB
SOLID WASTE MANAGEMENT
Sr. No. Action Point Present Status Gap Timeline Department
1. Door to Door
Collection of Solid
Waste
100% at Udaipur
Municipal Corporation
0% - LSG Department
(Municipal
Bodies)
2 Segregation,
Transport,
Disposal as per
Rules
100% at Udaipur
Municipal Corporation
0% - LSG Department
(Municipal
Bodies)
3. Segregation at
Source
90% at MCU
Agencies have been
hired for IEC activities
10% May 2021 LSG Department
(Municipal
Bodies)
4 Road Sweeping
and Disposal of
Waste Collected
100 % at MCU 0% - LSG Department
(Municipal
Bodies)
5 Material Recover
Facility
Yes, available at MCU.
30 TPD operational
MRF at Tithari and one
50 TPD MRF Plant
under construction att
Balicha
30% Gap will be
covered once
construction of
other MRF will
be done.
(October 2021)
LSG Department
(Municipal
Bodies)
6 Recycling of
materials
Recycling of Dry waste
like Paper, Metal, Glass,
Cardboard, Clothes etc.
is done on monthly basis
0% - LSG Department
(Municipal
Bodies)
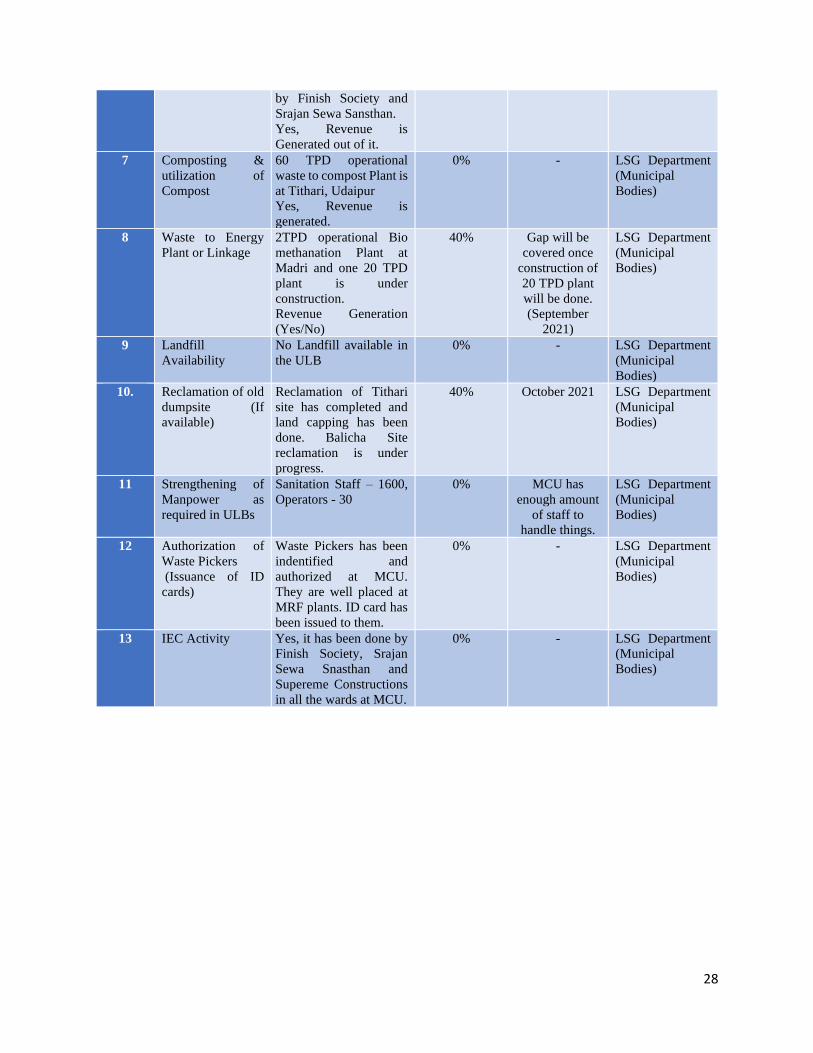
28
by Finish Society and
Srajan Sewa Sansthan.
Yes, Revenue is
Generated out of it.
7 Composting &
utilization of
Compost
60 TPD operational
waste to compost Plant is
at Tithari, Udaipur
Yes, Revenue is
generated.
0% - LSG Department
(Municipal
Bodies)
8 Waste to Energy
Plant or Linkage
2TPD operational Bio
methanation Plant at
Madri and one 20 TPD
plant is under
construction.
Revenue Generation
(Yes/No)
40% Gap will be
covered once
construction of
20 TPD plant
will be done.
(September
2021)
LSG Department
(Municipal
Bodies)
9 Landfill
Availability
No Landfill available in
the ULB
0% - LSG Department
(Municipal
Bodies)
10. Reclamation of old
dumpsite (If
available)
Reclamation of Tithari
site has completed and
land capping has been
done. Balicha Site
reclamation is under
progress.
40% October 2021 LSG Department
(Municipal
Bodies)
11 Strengthening of
Manpower as
required in ULBs
Sanitation Staff – 1600,
Operators - 30
0% MCU has
enough amount
of staff to
handle things.
LSG Department
(Municipal
Bodies)
12 Authorization of
Waste Pickers
(Issuance of ID
cards)
Waste Pickers has been
indentified and
authorized at MCU.
They are well placed at
MRF plants. ID card has
been issued to them.
0% - LSG Department
(Municipal
Bodies)
13 IEC Activity Yes, it has been done by
Finish Society, Srajan
Sewa Snasthan and
Supereme Constructions
in all the wards at MCU.
0% - LSG Department
(Municipal
Bodies)
29
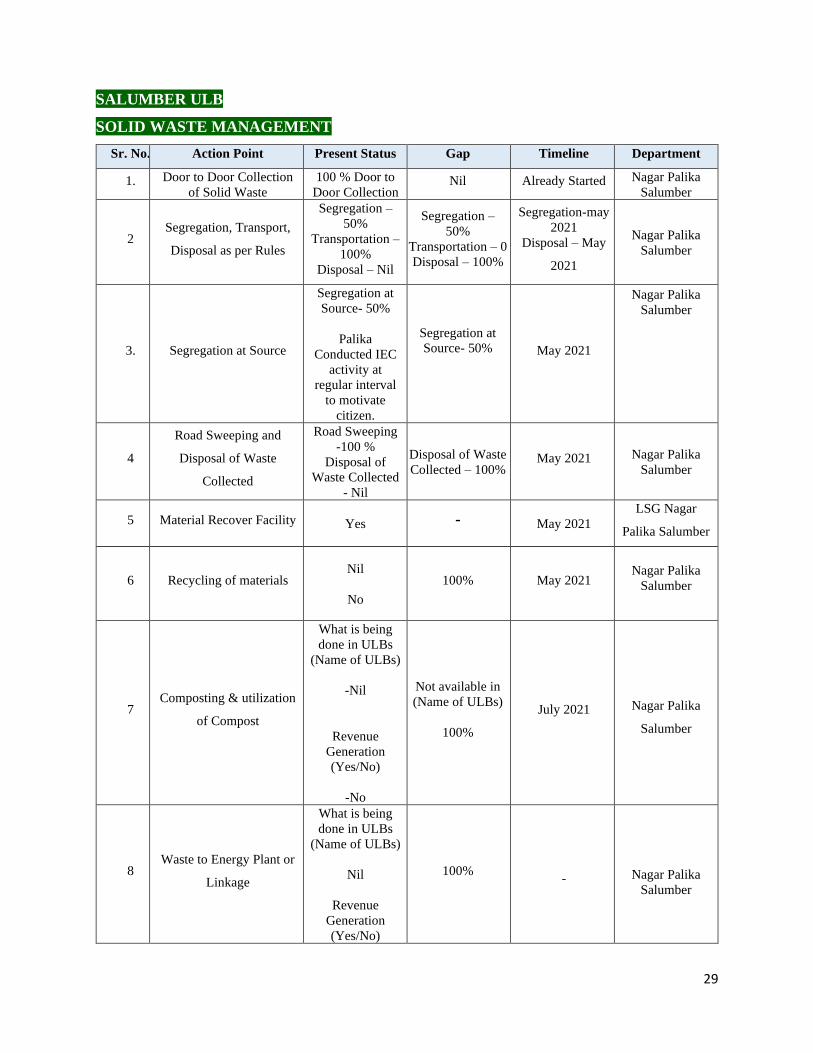
SALUMBER ULB
SOLID WASTE MANAGEMENT
Sr. No. Action Point Present Status Gap Timeline Department
1. Door to Door Collection
of Solid Waste 100 % Door to
Door Collection Nil Already Started Nagar Palika
Salumber
2 Segregation, Transport,
Disposal as per Rules
Segregation –
50%
Transportation –
100%
Disposal – Nil
Segregation –
50%
Transportation – 0
Disposal – 100%
Segregation-may
2021
Disposal – May
2021
Nagar Palika
Salumber
3. Segregation at Source
Segregation at
Source- 50%
Palika
Conducted IEC
activity at
regular interval
to motivate
citizen.
Segregation at
Source- 50%
May 2021
Nagar Palika
Salumber
4
Road Sweeping and
Disposal of Waste
Collected
Road Sweeping
-100 %
Disposal of
Waste Collected
- Nil
Disposal of Waste
Collected – 100% May 2021 Nagar Palika
Salumber
5 Material Recover Facility Yes - May 2021 LSG Nagar
Palika Salumber
6 Recycling of materials Nil
No
100% May 2021
Nagar Palika
Salumber
7 Composting & utilization
of Compost
What is being
done in ULBs
(Name of ULBs)
-Nil
Revenue
Generation
(Yes/No)
-No
Not available in
(Name of ULBs)
100%
July 2021
Nagar Palika
Salumber
8 Waste to Energy Plant or
Linkage
What is being
done in ULBs
(Name of ULBs)
Nil
Revenue
Generation
(Yes/No)
100%
-
Nagar Palika
Salumber
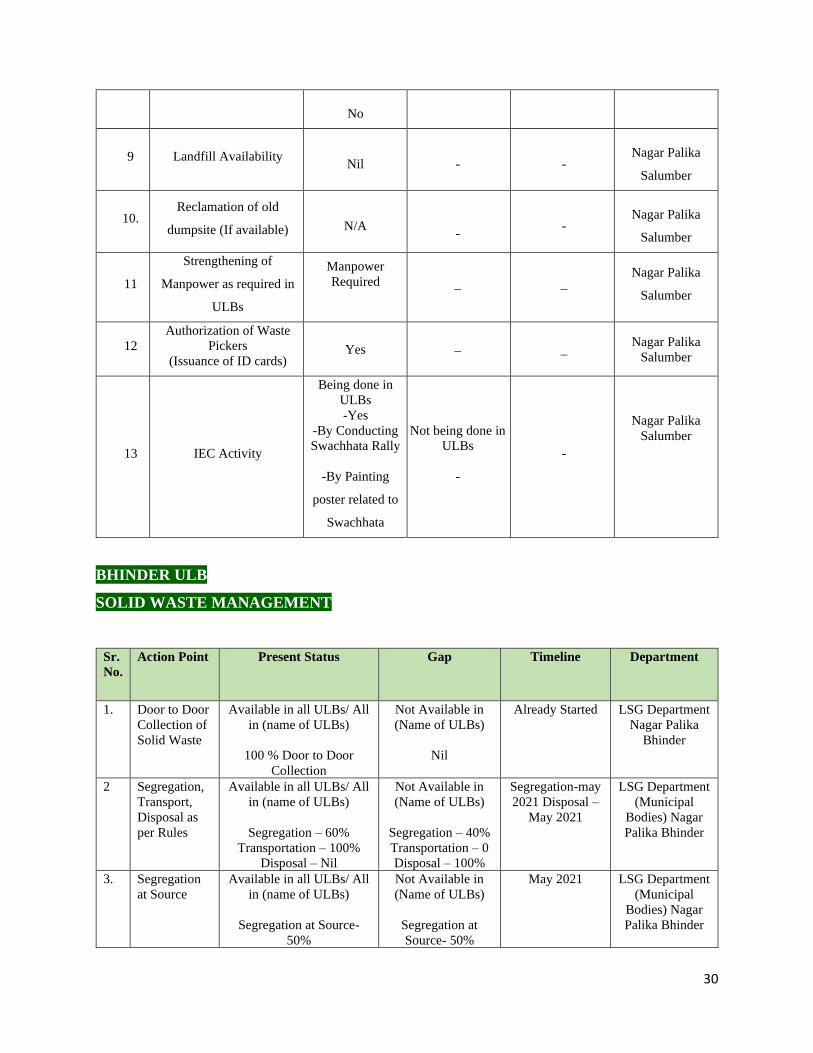
30
No
9 Landfill Availability
Nil
-
-
Nagar Palika
Salumber
10. Reclamation of old
dumpsite (If available)
N/A
-
-
Nagar Palika
Salumber
11
Strengthening of
Manpower as required in
ULBs
Manpower
Required
_ _
Nagar Palika
Salumber
12 Authorization of Waste
Pickers
(Issuance of ID cards) Yes _ _
Nagar Palika
Salumber
13 IEC Activity
Being done in
ULBs
-Yes
-By Conducting
Swachhata Rally
-By Painting
poster related to
Swachhata
Not being done in
ULBs
-
-
Nagar Palika
Salumber
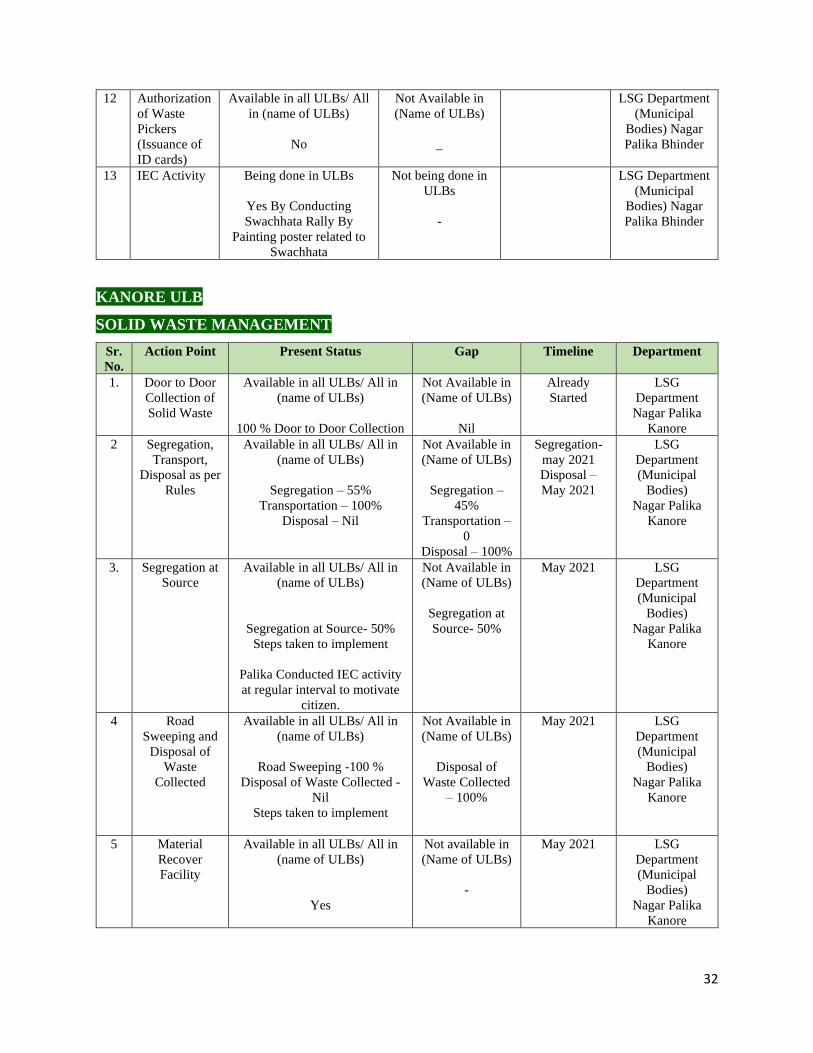
BHINDER ULB
SOLID WASTE MANAGEMENT
Sr.
No.
Action Point Present Status Gap Timeline Department
1. Door to Door
Collection of
Solid Waste
Available in all ULBs/ All
in (name of ULBs)
100 % Door to Door
Collection
Not Available in
(Name of ULBs)
Nil
Already Started LSG Department
Nagar Palika
Bhinder
2 Segregation,
Transport,
Disposal as
per Rules
Available in all ULBs/ All
in (name of ULBs)
Segregation – 60%
Transportation – 100%
Disposal – Nil
Not Available in
(Name of ULBs)
Segregation – 40%
Transportation – 0
Disposal – 100%
Segregation-may
2021 Disposal –
May 2021
LSG Department
(Municipal
Bodies) Nagar
Palika Bhinder
3. Segregation
at Source
Available in all ULBs/ All
in (name of ULBs)
Segregation at Source-
50%
Not Available in
(Name of ULBs)
Segregation at
Source- 50%
May 2021 LSG Department
(Municipal
Bodies) Nagar
Palika Bhinder
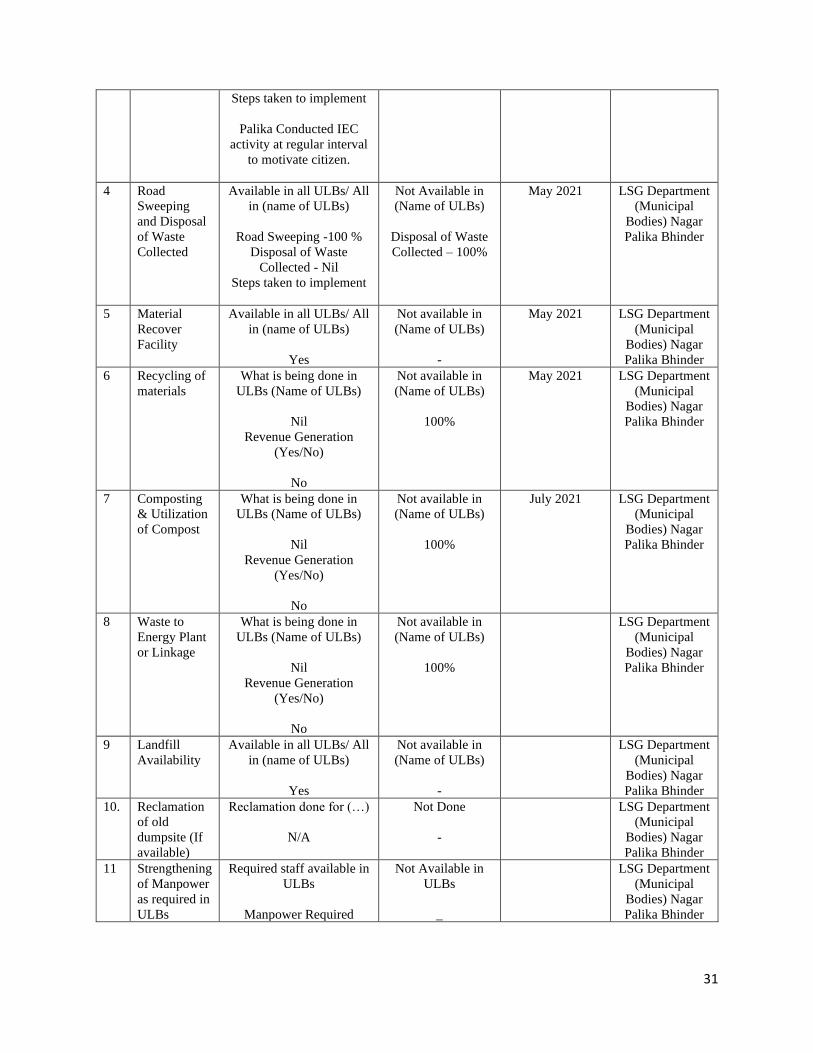
31
Steps taken to implement
Palika Conducted IEC
activity at regular interval
to motivate citizen.
4 Road
Sweeping
and Disposal
of Waste
Collected
Available in all ULBs/ All
in (name of ULBs)
Road Sweeping -100 %
Disposal of Waste
Collected - Nil
Steps taken to implement
Not Available in
(Name of ULBs)
Disposal of Waste
Collected – 100%
May 2021 LSG Department
(Municipal
Bodies) Nagar
Palika Bhinder
5 Material
Recover
Facility
Available in all ULBs/ All
in (name of ULBs)
Yes
Not available in
(Name of ULBs)
-
May 2021 LSG Department
(Municipal
Bodies) Nagar
Palika Bhinder
6 Recycling of
materials
What is being done in
ULBs (Name of ULBs)
Nil
Revenue Generation
(Yes/No)
No
Not available in
(Name of ULBs)
100%
May 2021 LSG Department
(Municipal
Bodies) Nagar
Palika Bhinder
7 Composting
& Utilization
of Compost
What is being done in
ULBs (Name of ULBs)
Nil
Revenue Generation
(Yes/No)
No
Not available in
(Name of ULBs)
100%
July 2021 LSG Department
(Municipal
Bodies) Nagar
Palika Bhinder
8 Waste to
Energy Plant
or Linkage
What is being done in
ULBs (Name of ULBs)
Nil
Revenue Generation
(Yes/No)
No
Not available in
(Name of ULBs)
100%
LSG Department
(Municipal
Bodies) Nagar
Palika Bhinder
9 Landfill
Availability
Available in all ULBs/ All
in (name of ULBs)
Yes
Not available in
(Name of ULBs)
-
LSG Department
(Municipal
Bodies) Nagar
Palika Bhinder
10. Reclamation
of old
dumpsite (If
available)
Reclamation done for (…)
N/A
Not Done
-
LSG Department
(Municipal
Bodies) Nagar
Palika Bhinder
11 Strengthening
of Manpower
as required in
ULBs
Required staff available in
ULBs
Manpower Required
Not Available in
ULBs
_
LSG Department
(Municipal
Bodies) Nagar
Palika Bhinder
32
12 Authorization
of Waste
Pickers
(Issuance of
ID cards)
Available in all ULBs/ All
in (name of ULBs)
No
Not Available in
(Name of ULBs)
_
LSG Department
(Municipal
Bodies) Nagar
Palika Bhinder
13 IEC Activity Being done in ULBs
Yes By Conducting
Swachhata Rally By
Painting poster related to
Swachhata
Not being done in
ULBs
-
LSG Department
(Municipal
Bodies) Nagar
Palika Bhinder
KANORE ULB
SOLID WASTE MANAGEMENT
Sr.
No.
Action Point Present Status Gap Timeline Department
1. Door to Door
Collection of
Solid Waste
Available in all ULBs/ All in
(name of ULBs)
100 % Door to Door Collection
Not Available in
(Name of ULBs)
Nil
Already
Started
LSG
Department
Nagar Palika
Kanore
2 Segregation,
Transport,
Disposal as per
Rules
Available in all ULBs/ All in
(name of ULBs)
Segregation – 55%
Transportation – 100%
Disposal – Nil
Not Available in
(Name of ULBs)
Segregation –
45%
Transportation –
0
Disposal – 100%
Segregation-
may 2021
Disposal –
May 2021
LSG
Department
(Municipal
Bodies)
Nagar Palika
Kanore
3. Segregation at
Source
Available in all ULBs/ All in
(name of ULBs)
Segregation at Source- 50%
Steps taken to implement
Palika Conducted IEC activity
at regular interval to motivate
citizen.
Not Available in
(Name of ULBs)
Segregation at
Source- 50%
May 2021 LSG
Department
(Municipal
Bodies)
Nagar Palika
Kanore
4 Road
Sweeping and
Disposal of
Waste
Collected
Available in all ULBs/ All in
(name of ULBs)
Road Sweeping -100 %
Disposal of Waste Collected -
Nil
Steps taken to implement
Not Available in
(Name of ULBs)
Disposal of
Waste Collected
– 100%
May 2021 LSG
Department
(Municipal
Bodies)
Nagar Palika
Kanore
5 Material
Recover
Facility
Available in all ULBs/ All in
(name of ULBs)
Yes
Not available in
(Name of ULBs)
-
May 2021 LSG
Department
(Municipal
Bodies)
Nagar Palika
Kanore
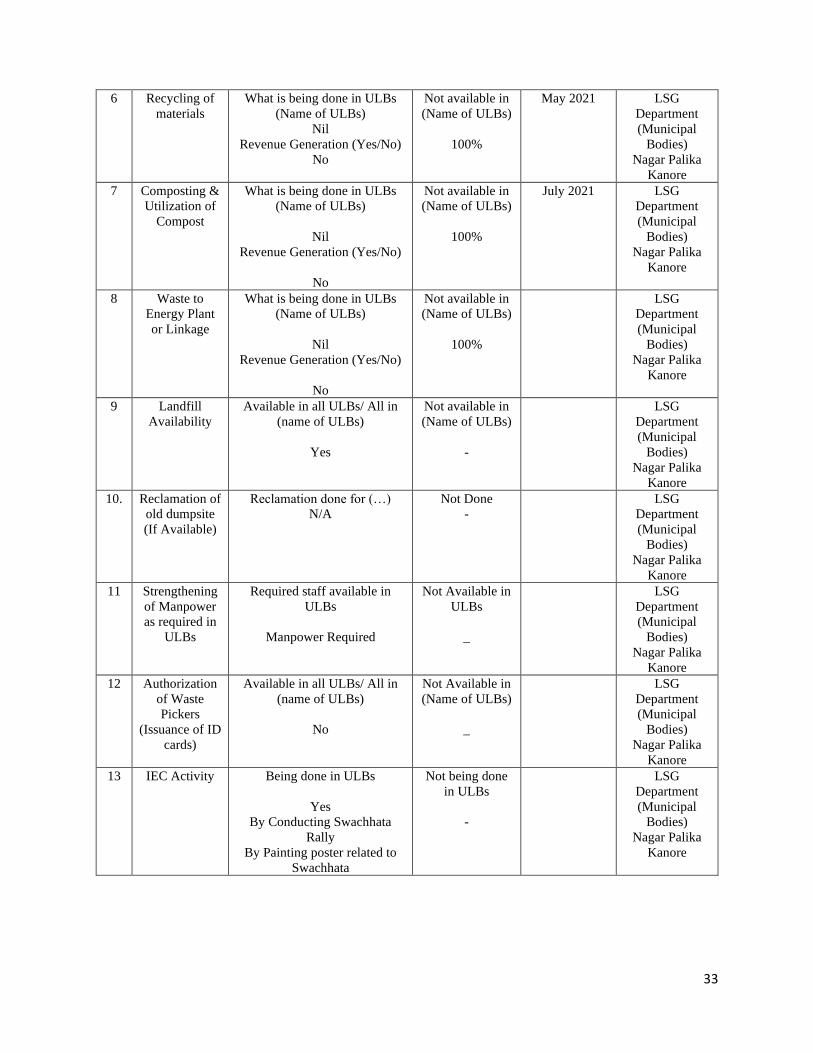
33
6 Recycling of
materials
What is being done in ULBs
(Name of ULBs)
Nil
Revenue Generation (Yes/No)
No
Not available in
(Name of ULBs)
100%
May 2021 LSG
Department
(Municipal
Bodies)
Nagar Palika
Kanore
7 Composting &
Utilization of
Compost
What is being done in ULBs
(Name of ULBs)
Nil
Revenue Generation (Yes/No)
No
Not available in
(Name of ULBs)
100%
July 2021 LSG
Department
(Municipal
Bodies)
Nagar Palika
Kanore
8 Waste to
Energy Plant
or Linkage
What is being done in ULBs
(Name of ULBs)
Nil
Revenue Generation (Yes/No)
No
Not available in
(Name of ULBs)
100%
LSG
Department
(Municipal
Bodies)
Nagar Palika
Kanore
9 Landfill
Availability
Available in all ULBs/ All in
(name of ULBs)
Yes
Not available in
(Name of ULBs)
-
LSG
Department
(Municipal
Bodies)
Nagar Palika
Kanore
10. Reclamation of
old dumpsite
(If Available)
Reclamation done for (…)
N/A
Not Done
-
LSG
Department
(Municipal
Bodies)
Nagar Palika
Kanore
11 Strengthening
of Manpower
as required in
ULBs
Required staff available in
ULBs
Manpower Required
Not Available in
ULBs
_
LSG
Department
(Municipal
Bodies)
Nagar Palika
Kanore
12 Authorization
of Waste
Pickers
(Issuance of ID
cards)
Available in all ULBs/ All in
(name of ULBs)
No
Not Available in
(Name of ULBs)
_
LSG
Department
(Municipal
Bodies)
Nagar Palika
Kanore
13 IEC Activity Being done in ULBs
Yes
By Conducting Swachhata
Rally
By Painting poster related to
Swachhata
Not being done
in ULBs
-
LSG
Department
(Municipal
Bodies)
Nagar Palika
Kanore
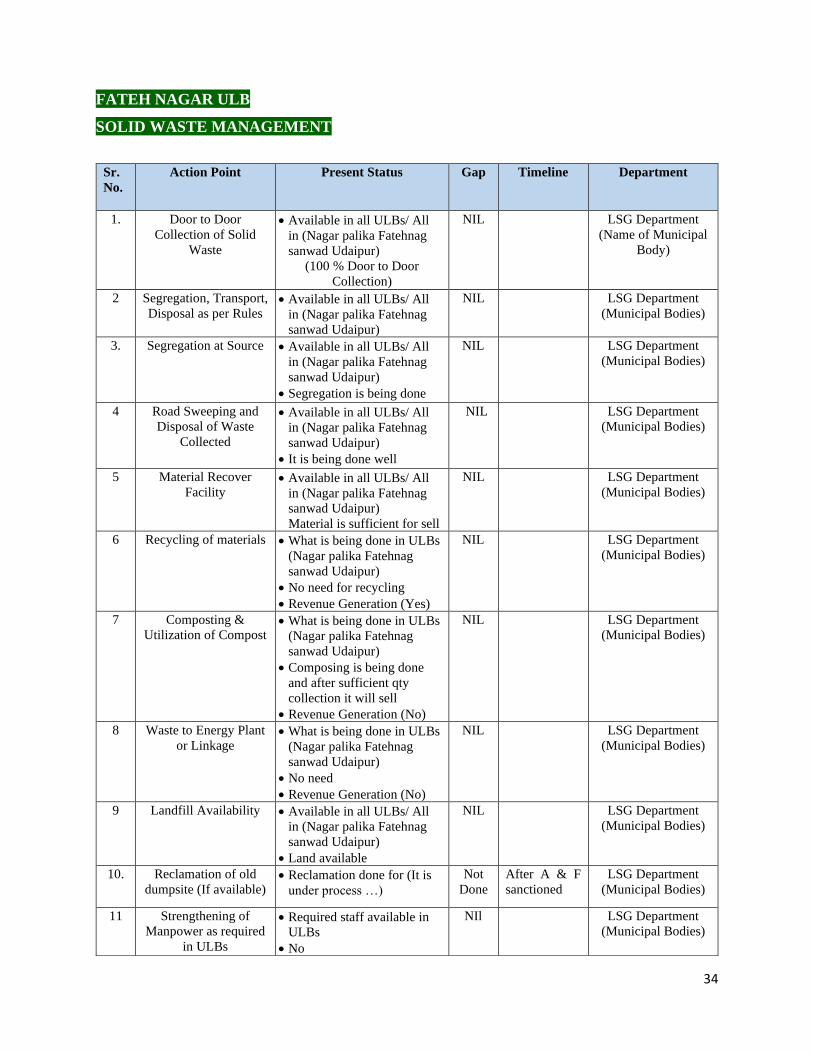
34
FATEH NAGAR ULB
SOLID WASTE MANAGEMENT
Sr.
No.
Action Point Present Status Gap Timeline Department
1. Door to Door
Collection of Solid
Waste
• Available in all ULBs/ All
in (Nagar palika Fatehnag
sanwad Udaipur)
(100 % Door to Door
Collection)
NIL LSG Department
(Name of Municipal
Body)
2 Segregation, Transport,
Disposal as per Rules • Available in all ULBs/ All
in (Nagar palika Fatehnag
sanwad Udaipur)
NIL LSG Department
(Municipal Bodies)
3. Segregation at Source • Available in all ULBs/ All
in (Nagar palika Fatehnag
sanwad Udaipur)
• Segregation is being done
NIL LSG Department
(Municipal Bodies)
4 Road Sweeping and
Disposal of Waste
Collected
• Available in all ULBs/ All
in (Nagar palika Fatehnag
sanwad Udaipur)
• It is being done well
NIL LSG Department
(Municipal Bodies)
5 Material Recover
Facility • Available in all ULBs/ All
in (Nagar palika Fatehnag
sanwad Udaipur)
Material is sufficient for sell
NIL LSG Department
(Municipal Bodies)
6 Recycling of materials • What is being done in ULBs
(Nagar palika Fatehnag
sanwad Udaipur)
• No need for recycling
• Revenue Generation (Yes)
NIL LSG Department
(Municipal Bodies)
7 Composting &
Utilization of Compost • What is being done in ULBs
(Nagar palika Fatehnag
sanwad Udaipur)
• Composing is being done
and after sufficient qty
collection it will sell
• Revenue Generation (No)
NIL LSG Department
(Municipal Bodies)
8 Waste to Energy Plant
or Linkage • What is being done in ULBs
(Nagar palika Fatehnag
sanwad Udaipur)
• No need
• Revenue Generation (No)
NIL LSG Department
(Municipal Bodies)
9 Landfill Availability • Available in all ULBs/ All
in (Nagar palika Fatehnag
sanwad Udaipur)
• Land available
NIL LSG Department
(Municipal Bodies)
10. Reclamation of old
dumpsite (If available) • Reclamation done for (It is
under process …)
Not
Done
After A & F
sanctioned
LSG Department
(Municipal Bodies)
11 Strengthening of
Manpower as required
in ULBs
• Required staff available in
ULBs
• No
NIl LSG Department
(Municipal Bodies)

35
Solid Waste Management Plan (for each ULB)
Sr.
No.
Action
Areas
Details of
Data
Require
ment
Units
of
Measur
able
Outco
me
Please
enter
Measu
rable
Outco
me for
District
ULB1 ULB2 ULB3 ULB4 ULB5
Name of
Urban
Local
Body
(ULB)
[name
of
ULB]
Udaipur
Fatehn
agar
Sanwa
d
Salumb
er
Bhind
er Kanore
No of
ULBs in
the
District
5
Populatio
n
[Nos as
per
2011
census]
4.51
lacks 22788 16426 17878 14650
SW
1
Report on
inventory
of total
solid
waste
Generatio
n
SW
1a
Total
solid
waste
Generatio
n
[in
MT/Da
y] or
[Not
estimat
ed]
180 2.5 5.5 0.59 4.5
SW
1b
Qty. of
Dry
Waste
segregate
d
[in
MT/Da
y] or
[Collect
ion Not
initiated
]
90 2.5 1.0 0.262 0.06
SW
1c
Qty. of
Wet
Waste
segregate
d
[in
MT/Da
y] or
[Collect
ion Not
81 1 1.5 0.262 0.083
12 Authorization of Waste
Pickers
(Issuance of ID cards)
• Available in all ULBs/ All
in (Nagar palika Fatehnag
sanwad Udaipur)
• ID cards have been issued
NIl LSG Department
(Municipal Bodies)
13 IEC Activity • Being done in ULBs
NIl LSG Department
(Municipal Bodies)
36
initiated
]
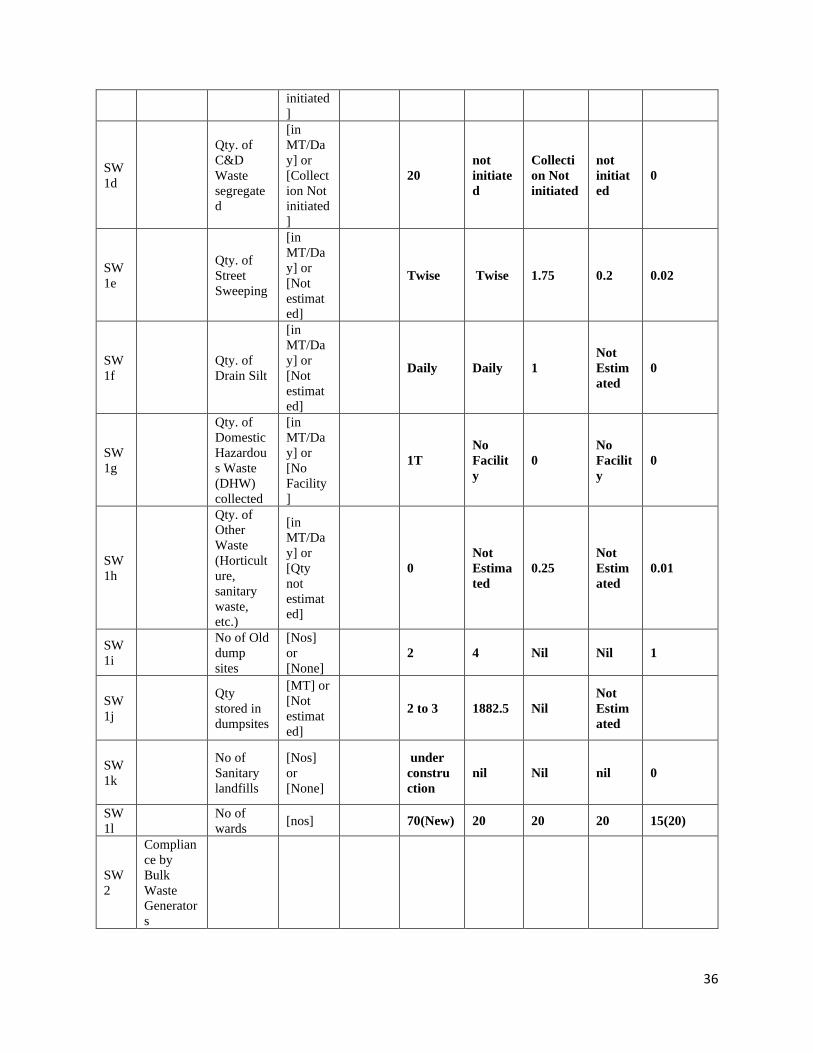
SW
1d
Qty. of
C&D
Waste
segregate
d
[in
MT/Da
y] or
[Collect
ion Not
initiated
]
20
not
initiate
d
Collecti
on Not
initiated
not
initiat
ed
0
SW
1e
Qty. of
Street
Sweeping
[in
MT/Da
y] or
[Not
estimat
ed]
Twise Twise 1.75 0.2 0.02
SW
1f
Qty. of
Drain Silt
[in
MT/Da
y] or
[Not
estimat
ed]
Daily Daily 1
Not
Estim
ated
0
SW
1g
Qty. of
Domestic
Hazardou
s Waste
(DHW)
collected
[in
MT/Da
y] or
[No
Facility
]
1T
No
Facilit
y
0
No
Facilit
y
0
SW
1h
Qty. of
Other
Waste
(Horticult
ure,
sanitary
waste,
etc.)
[in
MT/Da
y] or
[Qty
not
estimat
ed]
0
Not
Estima
ted
0.25
Not
Estim
ated
0.01
SW
1i
No of Old
dump
sites
[Nos]
or
[None]
2 4 Nil Nil 1
SW
1j
Qty
stored in
dumpsites
[MT] or
[Not
estimat
ed]
2 to 3 1882.5 Nil
Not
Estim
ated
SW
1k
No of
Sanitary
landfills
[Nos]
or
[None]
under
constru
ction
nil Nil nil 0
SW
1l
No of
wards [nos] 70(New) 20 20 20 15(20)
SW
2
Complian
ce by
Bulk
Waste
Generator
s
37
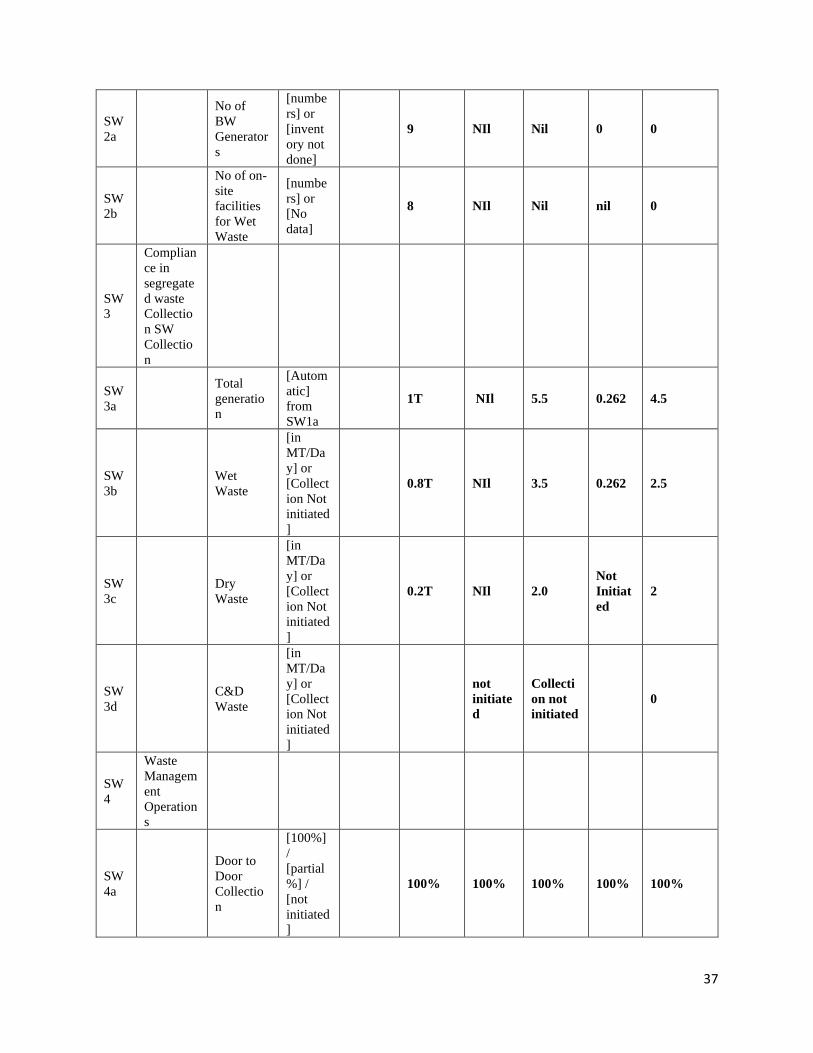
SW
2a
No of
BW
Generator
s
[numbe
rs] or
[invent
ory not
done]
9 NIl Nil 0 0
SW
2b
No of on-
site
facilities
for Wet
Waste
[numbe
rs] or
[No
data]
8 NIl Nil nil 0
SW
3
Complian
ce in
segregate
d waste
Collectio
n SW
Collectio
n
SW
3a
Total
generatio
n
[Autom
atic]
from
SW1a
1T NIl 5.5 0.262 4.5
SW
3b
Wet
Waste
[in
MT/Da
y] or
[Collect
ion Not
initiated
]
0.8T NIl 3.5 0.262 2.5
SW
3c
Dry
Waste
[in
MT/Da
y] or
[Collect
ion Not
initiated
]
0.2T NIl 2.0
Not
Initiat
ed
2
SW
3d
C&D
Waste
[in
MT/Da
y] or
[Collect
ion Not
initiated
]
not
initiate
d
Collecti
on not
initiated
0
SW
4
Waste
Managem
ent
Operation
s
SW
4a
Door to
Door
Collectio
n
[100%]
/
[partial
%] /
[not
initiated
]
100% 100% 100% 100% 100%
38
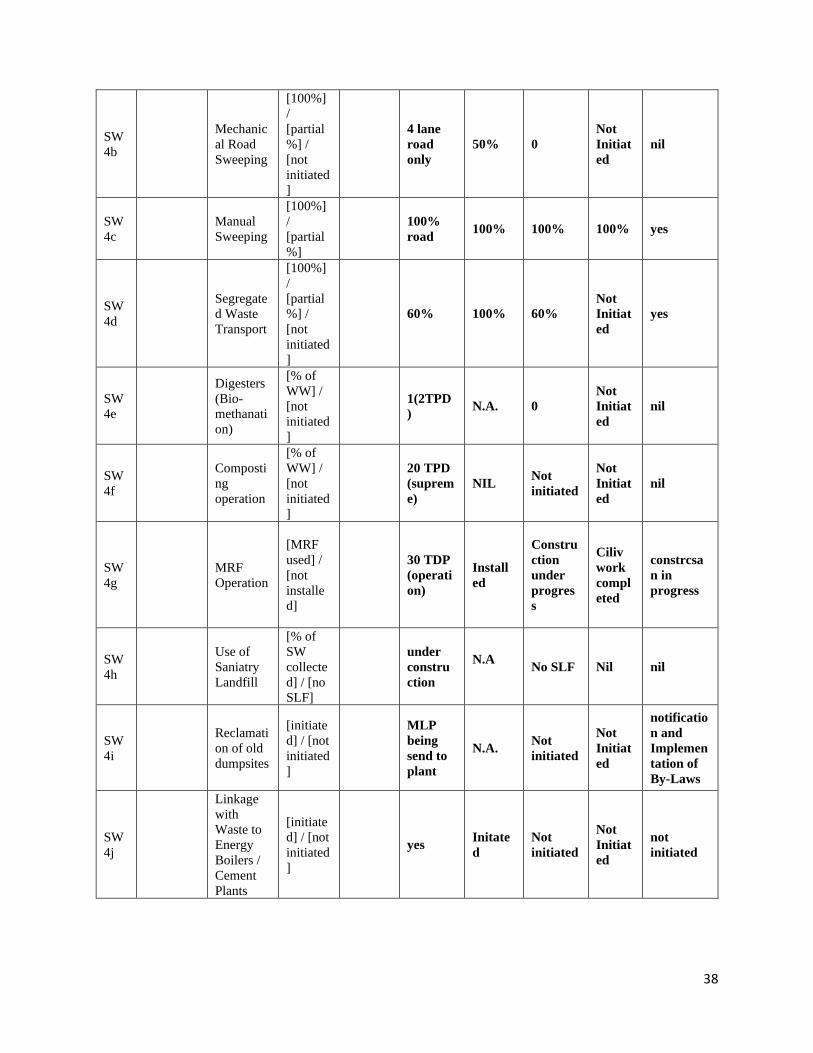
SW
4b
Mechanic
al Road
Sweeping
[100%]
/
[partial
%] /
[not
initiated
]
4 lane
road
only
50% 0
Not
Initiat
ed
nil
SW
4c
Manual
Sweeping
[100%]
/
[partial
%]
100%
road 100% 100% 100% yes
SW
4d
Segregate
d Waste
Transport
[100%]
/
[partial
%] /
[not
initiated
]
60% 100% 60%
Not
Initiat
ed
yes
SW
4e
Digesters
(Bio-
methanati
on)
[% of
WW] /
[not
initiated
]
1(2TPD
) N.A. 0
Not
Initiat
ed
nil
SW
4f
Composti
ng
operation
[% of
WW] /
[not
initiated
]
20 TPD
(suprem
e)
NIL Not
initiated
Not
Initiat
ed
nil
SW
4g
MRF
Operation
[MRF
used] /
[not
installe
d]
30 TDP
(operati
on)
Install
ed
Constru
ction
under
progres
s
Ciliv
work
compl
eted
constrcsa
n in
progress
SW
4h
Use of
Saniatry
Landfill
[% of
SW
collecte
d] / [no
SLF]
under
constru
ction
N.A
No SLF Nil nil
SW
4i
Reclamati
on of old
dumpsites
[initiate
d] / [not
initiated
]
MLP
being
send to
plant
N.A. Not
initiated
Not
Initiat
ed
notificatio
n and
Implemen
tation of
By-Laws
SW
4j
Linkage
with
Waste to
Energy
Boilers /
Cement
Plants
[initiate
d] / [not
initiated
]
yes Initate
d
Not
initiated
Not
Initiat
ed
not
initiated
39
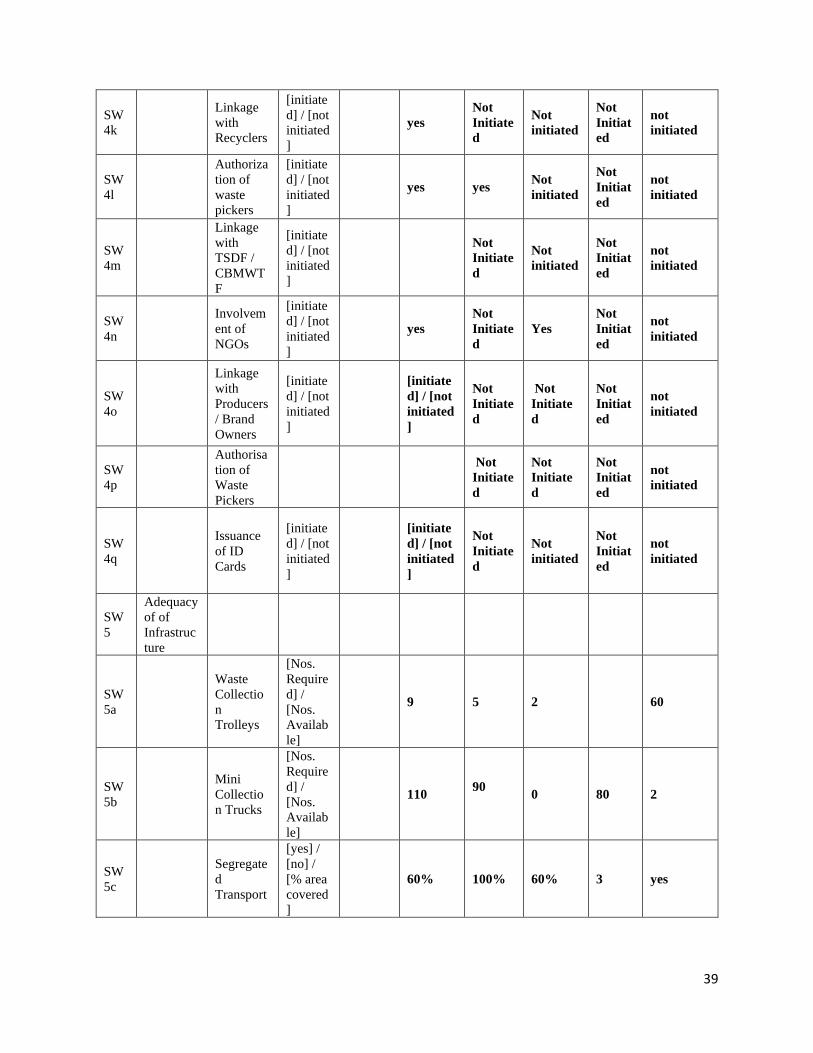
SW
4k
Linkage
with
Recyclers
[initiate
d] / [not
initiated
]
yes
Not
Initiate
d
Not
initiated
Not
Initiat
ed
not
initiated
SW
4l
Authoriza
tion of
waste
pickers
[initiate
d] / [not
initiated
]
yes yes Not
initiated
Not
Initiat
ed
not
initiated
SW
4m
Linkage
with
TSDF /
CBMWT
F
[initiate
d] / [not
initiated
]
Not
Initiate
d
Not
initiated
Not
Initiat
ed
not
initiated
SW
4n
Involvem
ent of
NGOs
[initiate
d] / [not
initiated
]
yes
Not
Initiate
d
Yes
Not
Initiat
ed
not
initiated
SW
4o
Linkage
with
Producers
/ Brand
Owners
[initiate
d] / [not
initiated
]
[initiate
d] / [not
initiated
]
Not
Initiate
d
Not
Initiate
d
Not
Initiat
ed
not
initiated
SW
4p
Authorisa
tion of
Waste
Pickers
Not
Initiate
d
Not
Initiate
d
Not
Initiat
ed
not
initiated
SW
4q
Issuance
of ID
Cards
[initiate
d] / [not
initiated
]
[initiate
d] / [not
initiated
]
Not
Initiate
d
Not
initiated
Not
Initiat
ed
not
initiated
SW
5
Adequacy
of of
Infrastruc
ture
SW
5a
Waste
Collectio
n
Trolleys
[Nos.
Require
d] /
[Nos.
Availab
le]
9 5 2 60
SW
5b
Mini
Collectio
n Trucks
[Nos.
Require
d] /
[Nos.
Availab
le]
110 90
0 80 2
SW
5c
Segregate
d
Transport
[yes] /
[no] /
[% area
covered
]
60% 100% 60% 3 yes
40
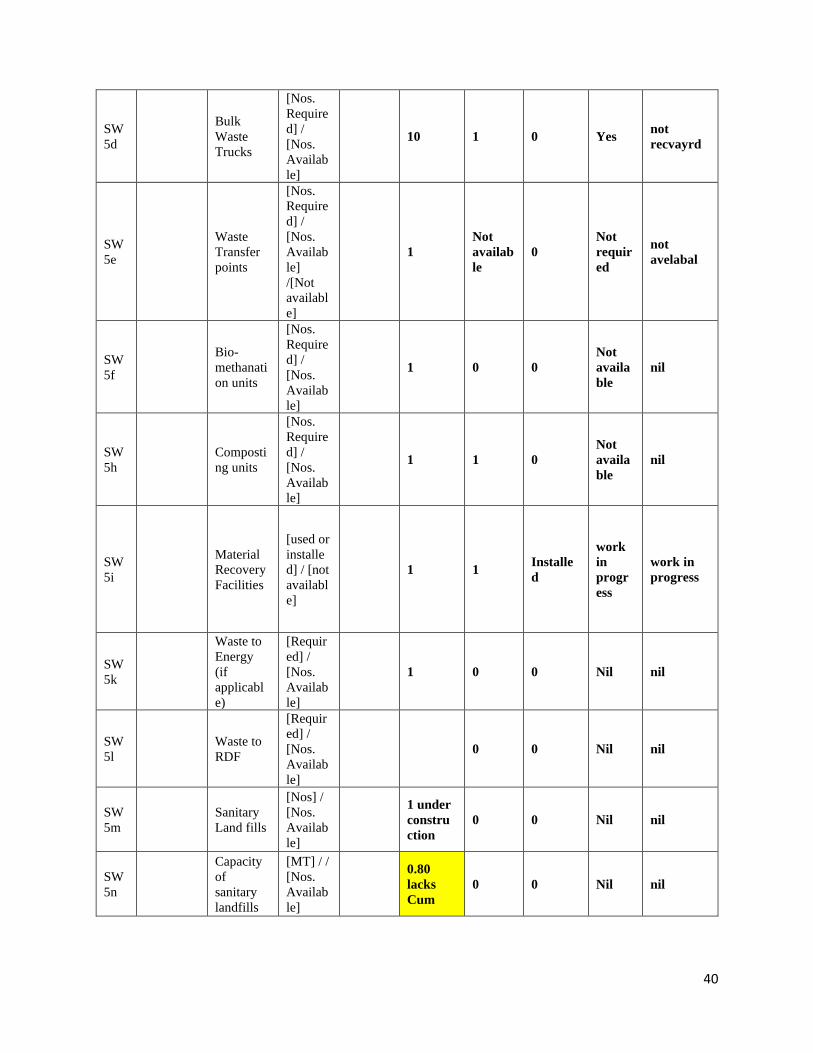
SW
5d
Bulk
Waste
Trucks
[Nos.
Require
d] /
[Nos.
Availab
le]
10 1 0 Yes not
recvayrd
SW
5e
Waste
Transfer
points
[Nos.
Require
d] /
[Nos.
Availab
le]
/[Not
availabl
e]
1
Not
availab
le
0
Not
requir
ed
not
avelabal
SW
5f
Bio-
methanati
on units
[Nos.
Require
d] /
[Nos.
Availab
le]
1 0 0
Not
availa
ble
nil
SW
5h
Composti
ng units
[Nos.
Require
d] /
[Nos.
Availab
le]
1 1 0
Not
availa
ble
nil
SW
5i
Material
Recovery
Facilities
[used or
installe
d] / [not
availabl
e]
1 1 Installe
d
work
in
progr
ess
work in
progress
SW
5k
Waste to
Energy
(if
applicabl
e)
[Requir
ed] /
[Nos.
Availab
le]
1 0 0 Nil nil
SW
5l
Waste to
RDF
[Requir
ed] /
[Nos.
Availab
le]
0 0 Nil nil
SW
5m
Sanitary
Land fills
[Nos] /
[Nos.
Availab
le]
1 under
constru
ction
0 0 Nil nil
SW
5n
Capacity
of
sanitary
landfills
[MT] / /
[Nos.
Availab
le]
0.80
lacks
Cum
0 0 Nil nil
41
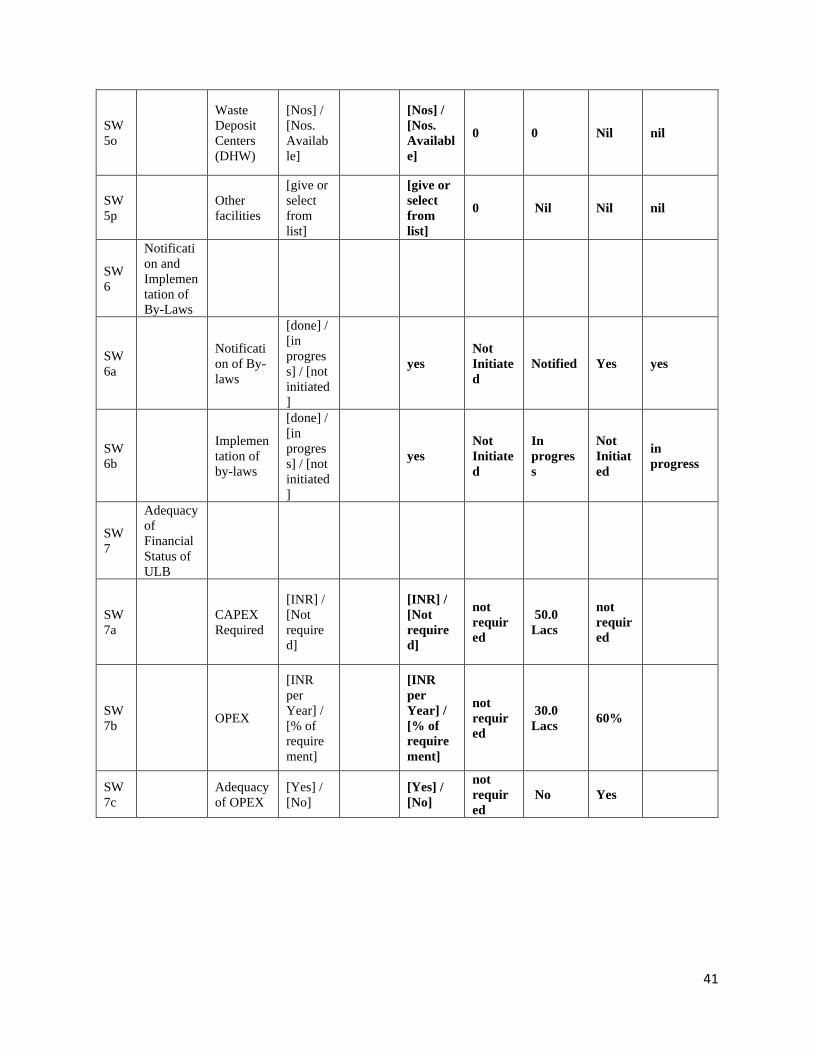
SW
5o
Waste
Deposit
Centers
(DHW)
[Nos] /
[Nos.
Availab
le]
[Nos] /
[Nos.
Availabl
e]
0 0 Nil nil
SW
5p
Other
facilities
[give or
select
from
list]
[give or
select
from
list]
0 Nil Nil nil
SW
6
Notificati
on and
Implemen
tation of
By-Laws
SW
6a
Notificati
on of By-
laws
[done] /
[in
progres
s] / [not
initiated
]
yes
Not
Initiate
d
Notified Yes yes
SW
6b
Implemen
tation of
by-laws
[done] /
[in
progres
s] / [not
initiated
]
yes
Not
Initiate
d
In
progres
s
Not
Initiat
ed
in
progress
SW
7
Adequacy
of
Financial
Status of
ULB
SW
7a
CAPEX
Required
[INR] /
[Not
require
d]
[INR] /
[Not
require
d]
not
requir
ed
50.0
Lacs
not
requir
ed
SW
7b OPEX
[INR
per
Year] /
[% of
require
ment]
[INR
per
Year] /
[% of
require
ment]
not
requir
ed
30.0
Lacs 60%
SW
7c
Adequacy
of OPEX
[Yes] /
[No]
[Yes] /
[No]
not
requir
ed
No Yes
42
5. PLASTIC WASTE MANAGEMENT PLAN (PWM)
5.1.Action for compliance of Ban on polythene carry bags
In reference to the notification dated 21 July 2010, Department of Environment, Rajasthan
regarding a complete ban on use of plastic carry-bags all over the State this office has deputed two
officials in the team’ Lake patrol’ constituted by district administration for carrying out seizures
of polythene carry bags in various areas of Udaipur. 3 tonnes of carry bags have been seized so far
and 9 cases have been filed by this office out which 3 have been decided and penalty have been
imposed on three units of Rs500, Rs 500 and Rs 1000. The Lake Patrol team is also collecting
penalties on each seizure which is deposited at local authority level.
i. Ban of plastic bags implementation is in progress regularly.
ii. Plastic waste management rules, 2016 are adopted.
iii. The MC, Udaipur has given the contract to M/s Nepra Resource Management Pvt Ltd,
Gujarat for disposal of plastic waste. According to rules, 2016 amount of plastic carry
bag given to NEPRA ltd. cement plant is 5.2 tonne.
iv. For the installation of cloth bags vending machines for effective implementation of ban
on plastic carry bags. Eight locations in the municipal area have been identified and
progress for installation is under progress which is under progress at the level of H.O.
v. Plastic bottle crushing machine has been installed by M/s HZL at celebration mall,
Udaipur and 4 machines have been installed under Smart City Project, Udaipur at Fateh
Sagar, Bus stand, Saheliyo ki Bari and Sukhadia Circle. The crushed plastic waste was
taken by the company (the manufacturer of the machine), which is reused to make the
garments. Further detail may be updated by MCU.
vi. Plastic/carry bag sized till date 5400 kg. by lake patrolling team. Further detail may be
updated by MCU.
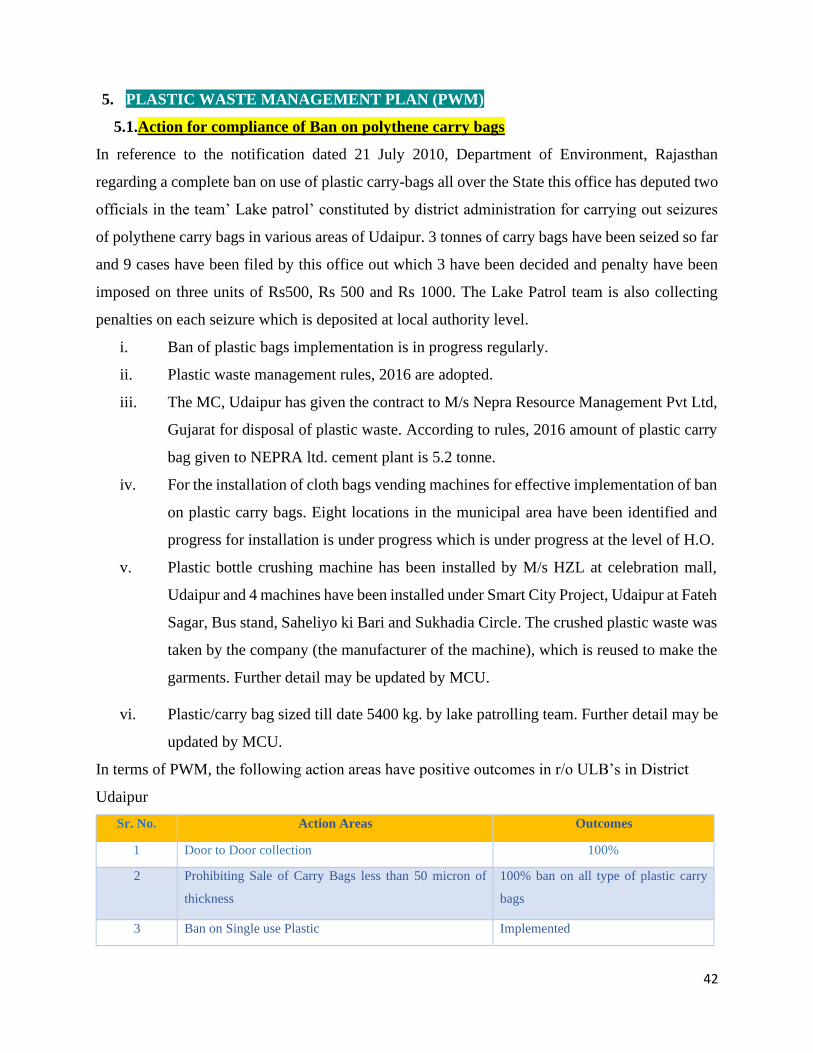
In terms of PWM, the following action areas have positive outcomes in r/o ULB’s in District
Udaipur
Sr. No. Action Areas Outcomes
1 Door to Door collection 100%
2 Prohibiting Sale of Carry Bags less than 50 micron of
thickness
100% ban on all type of plastic carry
bags
3 Ban on Single use Plastic Implemented
43
The following action areas have to be improved or to be included in the action plan for PWM:
Sr. No. Action Areas Outcomes
1 Authorization of PW Pickers initiated in MC, Udaipur
2 Pw collection Centres Initiated in MC, Udaipur
3 Linkage with NGO’s Not Initiated
4 Use of Poly Waste Needs Improvement
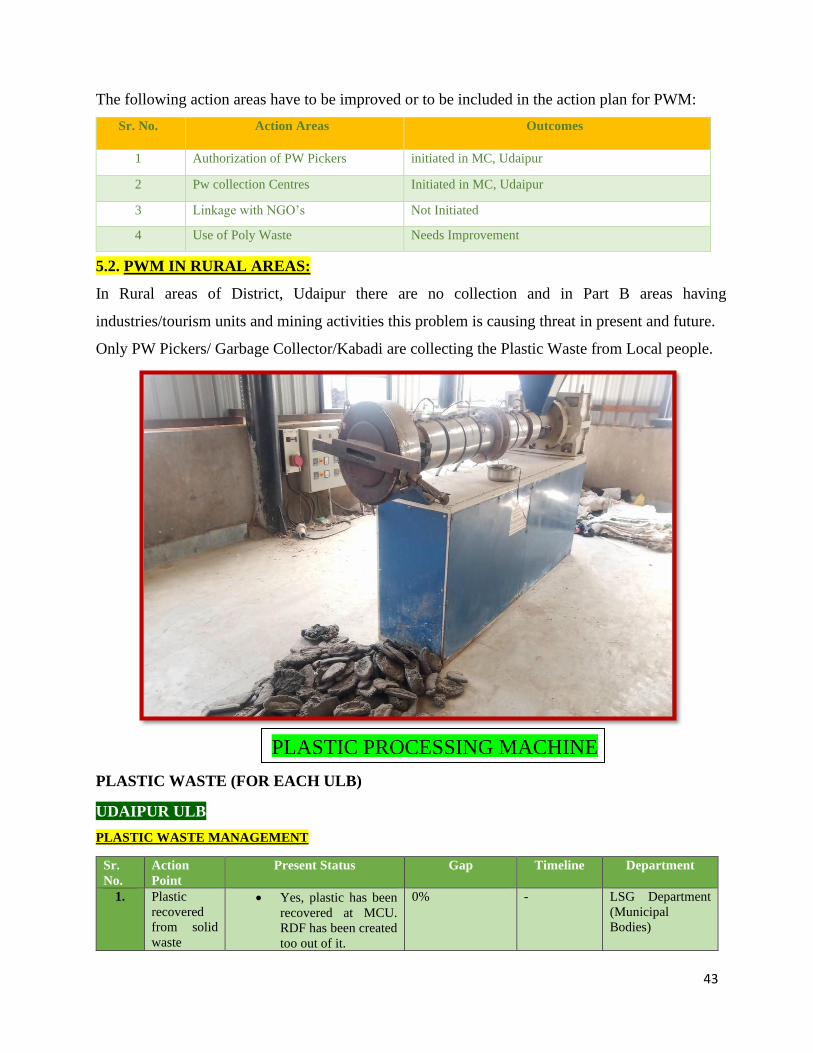
5.2. PWM IN RURAL AREAS:
In Rural areas of District, Udaipur there are no collection and in Part B areas having
industries/tourism units and mining activities this problem is causing threat in present and future.
Only PW Pickers/ Garbage Collector/Kabadi are collecting the Plastic Waste from Local people.
PLASTIC WASTE (FOR EACH ULB)
UDAIPUR ULB
PLASTIC WASTE MANAGEMENT
Sr.
No.
Action
Point
Present Status Gap Timeline Department
1. Plastic
recovered
from solid
waste
• Yes, plastic has been
recovered at MCU.
RDF has been created
too out of it.
0% - LSG Department
(Municipal
Bodies)
PLASTIC PROCESSING MACHINE
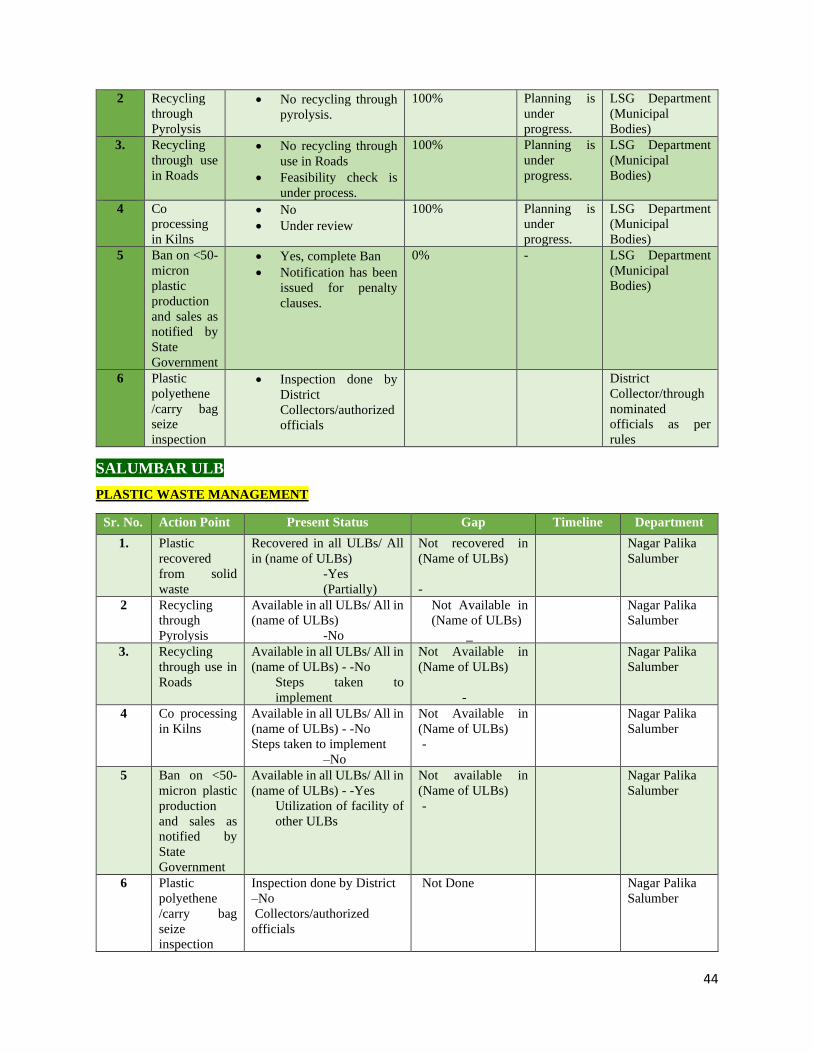
44
2 Recycling
through
Pyrolysis
• No recycling through
pyrolysis.
100% Planning is
under
progress.
LSG Department
(Municipal
Bodies)
3. Recycling
through use
in Roads
• No recycling through
use in Roads
• Feasibility check is
under process.
100% Planning is
under
progress.
LSG Department
(Municipal
Bodies)
4 Co
processing
in Kilns
• No
• Under review
100% Planning is
under
progress.
LSG Department
(Municipal
Bodies)
5 Ban on <50-
micron
plastic
production
and sales as
notified by
State
Government
• Yes, complete Ban
• Notification has been
issued for penalty
clauses.
0% - LSG Department
(Municipal
Bodies)
6 Plastic
polyethene
/carry bag
seize
inspection
• Inspection done by
District
Collectors/authorized
officials
District
Collector/through
nominated
officials as per
rules
SALUMBAR ULB
PLASTIC WASTE MANAGEMENT
Sr. No. Action Point Present Status Gap Timeline Department
1. Plastic
recovered
from solid
waste
Recovered in all ULBs/ All
in (name of ULBs)
-Yes
(Partially)
Not recovered in
(Name of ULBs)
-
Nagar Palika
Salumber
2 Recycling
through
Pyrolysis
Available in all ULBs/ All in
(name of ULBs)
-No
Not Available in
(Name of ULBs)
_
Nagar Palika
Salumber
3. Recycling
through use in
Roads
Available in all ULBs/ All in
(name of ULBs) - -No
Steps taken to
implement
Not Available in
(Name of ULBs)
-
Nagar Palika
Salumber
4 Co processing
in Kilns
Available in all ULBs/ All in
(name of ULBs) - -No
Steps taken to implement
–No
Not Available in
(Name of ULBs)
-
Nagar Palika
Salumber
5 Ban on <50-
micron plastic
production
and sales as
notified by
State
Government
Available in all ULBs/ All in
(name of ULBs) - -Yes
Utilization of facility of
other ULBs
Not available in
(Name of ULBs)
-
Nagar Palika
Salumber
6 Plastic
polyethene
/carry bag
seize
inspection
Inspection done by District
–No
Collectors/authorized
officials
Not Done Nagar Palika
Salumber
45
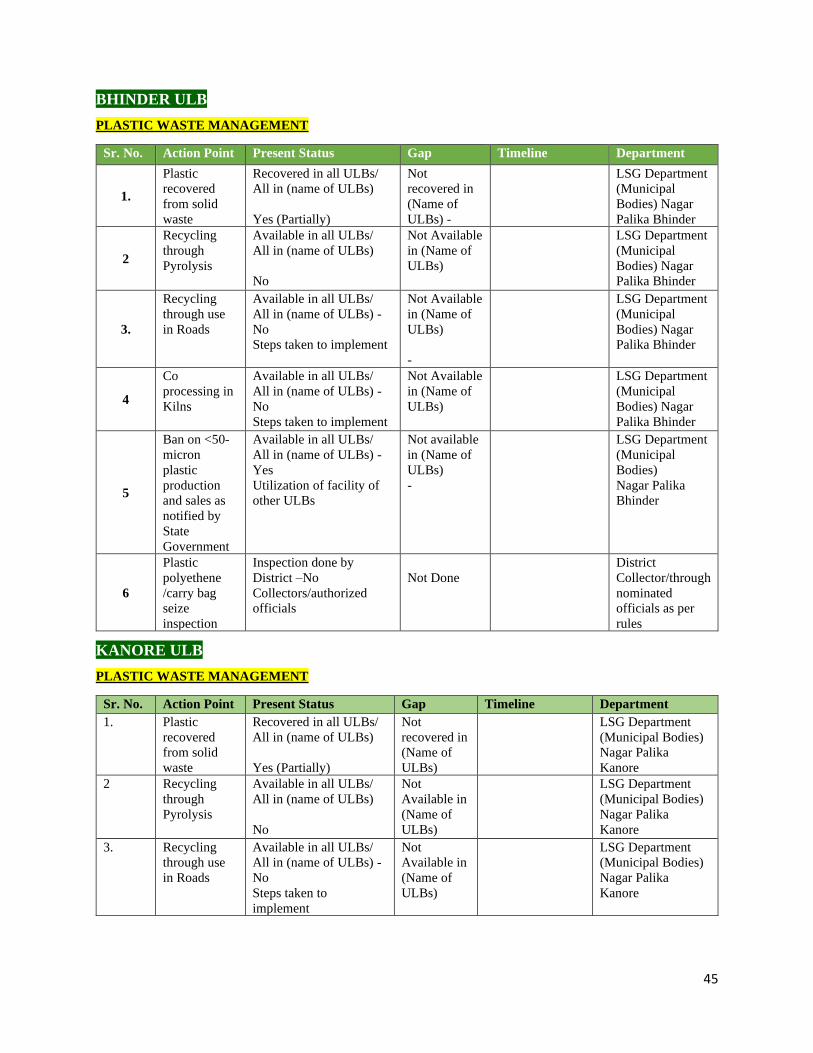
BHINDER ULB
PLASTIC WASTE MANAGEMENT
Sr. No. Action Point Present Status Gap Timeline Department
1.
Plastic
recovered
from solid
waste
Recovered in all ULBs/
All in (name of ULBs)
Yes (Partially)
Not
recovered in
(Name of
ULBs) -
LSG Department
(Municipal
Bodies) Nagar
Palika Bhinder
2
Recycling
through
Pyrolysis
Available in all ULBs/
All in (name of ULBs)
No
Not Available
in (Name of
ULBs)
LSG Department
(Municipal
Bodies) Nagar
Palika Bhinder
3.
Recycling
through use
in Roads
Available in all ULBs/
All in (name of ULBs) -
No
Steps taken to implement
Not Available
in (Name of
ULBs)
-
LSG Department
(Municipal
Bodies) Nagar
Palika Bhinder
4
Co
processing in
Kilns
Available in all ULBs/
All in (name of ULBs) -
No
Steps taken to implement
Not Available
in (Name of
ULBs)
LSG Department
(Municipal
Bodies) Nagar
Palika Bhinder
5
Ban on <50-
micron
plastic
production
and sales as
notified by
State
Government
Available in all ULBs/
All in (name of ULBs) -
Yes
Utilization of facility of
other ULBs
Not available
in (Name of
ULBs)
-
LSG Department
(Municipal
Bodies)
Nagar Palika
Bhinder
6
Plastic
polyethene
/carry bag
seize
inspection
Inspection done by
District –No
Collectors/authorized
officials
Not Done
District
Collector/through
nominated
officials as per
rules
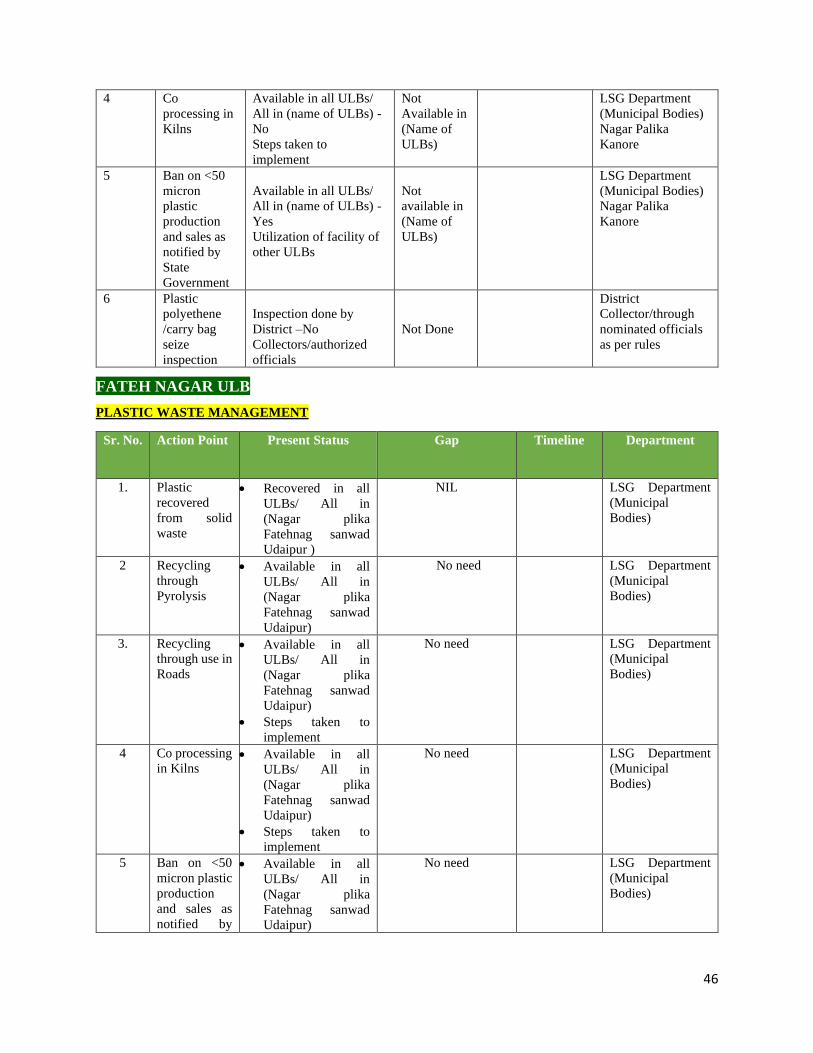
KANORE ULB
PLASTIC WASTE MANAGEMENT
Sr. No. Action Point Present Status Gap Timeline Department
1. Plastic
recovered
from solid
waste
Recovered in all ULBs/
All in (name of ULBs)
Yes (Partially)
Not
recovered in
(Name of
ULBs)
LSG Department
(Municipal Bodies)
Nagar Palika
Kanore
2 Recycling
through
Pyrolysis
Available in all ULBs/
All in (name of ULBs)
No
Not
Available in
(Name of
ULBs)
LSG Department
(Municipal Bodies)
Nagar Palika
Kanore
3. Recycling
through use
in Roads
Available in all ULBs/
All in (name of ULBs) -
No
Steps taken to
implement
Not
Available in
(Name of
ULBs)
LSG Department
(Municipal Bodies)
Nagar Palika
Kanore
46
4 Co
processing in
Kilns
Available in all ULBs/
All in (name of ULBs) -
No
Steps taken to
implement
Not
Available in
(Name of
ULBs)
LSG Department
(Municipal Bodies)
Nagar Palika
Kanore
5 Ban on <50
micron
plastic
production
and sales as
notified by
State
Government
Available in all ULBs/
All in (name of ULBs) -
Yes
Utilization of facility of
other ULBs
Not
available in
(Name of
ULBs)
LSG Department
(Municipal Bodies)
Nagar Palika
Kanore
6 Plastic
polyethene
/carry bag
seize
inspection
Inspection done by
District –No
Collectors/authorized
officials
Not Done
District
Collector/through
nominated officials
as per rules
FATEH NAGAR ULB
PLASTIC WASTE MANAGEMENT
Sr. No. Action Point Present Status Gap Timeline Department
1. Plastic
recovered
from solid
waste
• Recovered in all
ULBs/ All in
(Nagar plika
Fatehnag sanwad
Udaipur )
NIL LSG Department
(Municipal
Bodies)
2 Recycling
through
Pyrolysis
• Available in all
ULBs/ All in
(Nagar plika
Fatehnag sanwad
Udaipur)
No need LSG Department
(Municipal
Bodies)
3. Recycling
through use in
Roads
• Available in all
ULBs/ All in
(Nagar plika
Fatehnag sanwad
Udaipur)
• Steps taken to
implement
No need LSG Department
(Municipal
Bodies)
4 Co processing
in Kilns • Available in all
ULBs/ All in
(Nagar plika
Fatehnag sanwad
Udaipur)
• Steps taken to
implement
No need LSG Department
(Municipal
Bodies)
5 Ban on <50
micron plastic
production
and sales as
notified by
• Available in all
ULBs/ All in
(Nagar plika
Fatehnag sanwad
Udaipur)
No need LSG Department
(Municipal
Bodies)
47
State
Government • Utilization of
facility of other
ULBs
6 Plastic
polyethene
/carry bag
seize
inspection
• Inspection done by
District
Collectors/authoriz
ed officials
District
Collector/through
nominated
officials as per
rules
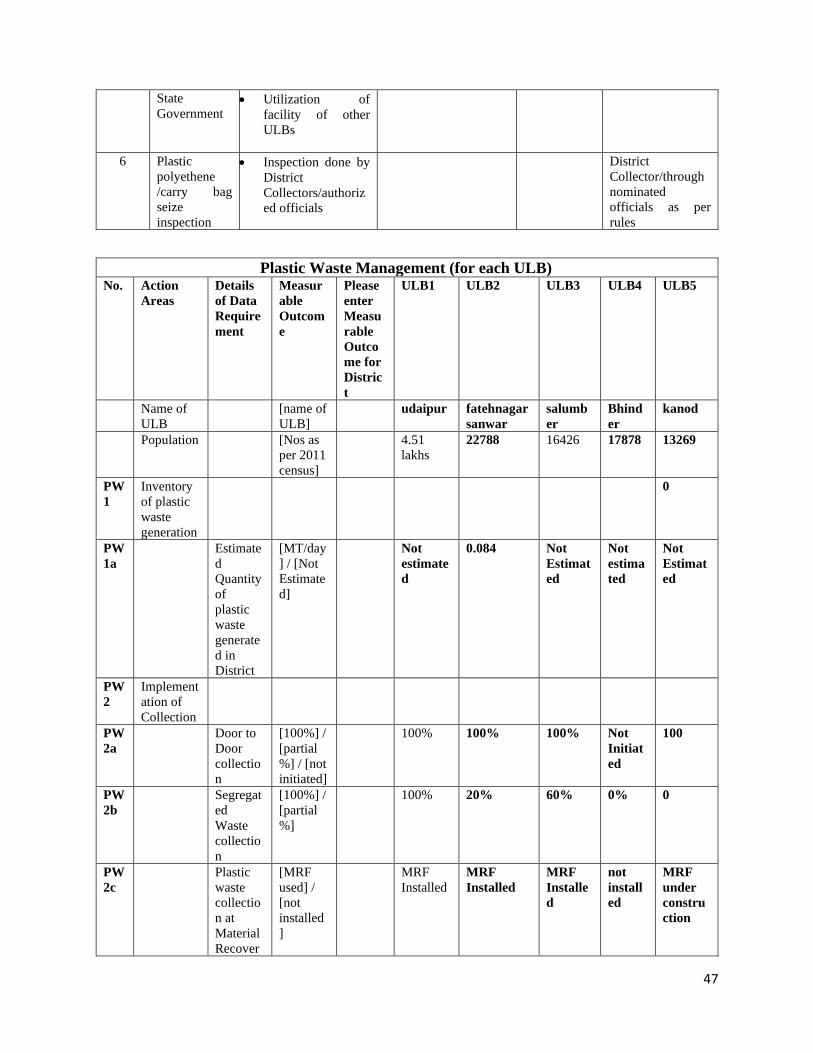
Plastic Waste Management (for each ULB) No. Action
Areas
Details
of Data
Require
ment
Measur
able
Outcom
e
Please
enter
Measu
rable
Outco
me for
Distric
t
ULB1 ULB2 ULB3 ULB4 ULB5
Name of
ULB
[name of
ULB]
udaipur fatehnagar
sanwar
salumb
er
Bhind
er
kanod
Population [Nos as
per 2011
census]
4.51
lakhs
22788 16426 17878 13269
PW
1
Inventory
of plastic
waste
generation
0
PW
1a
Estimate
d
Quantity
of
plastic
waste
generate
d in
District
[MT/day
] / [Not
Estimate
d]
Not
estimate
d
0.084 Not
Estimat
ed
Not
estima
ted
Not
Estimat
ed
PW
2
Implement
ation of
Collection
PW
2a
Door to
Door
collectio
n
[100%] /
[partial
%] / [not
initiated]
100% 100% 100% Not
Initiat
ed
100
PW
2b
Segregat
ed
Waste
collectio
n
[100%] /
[partial
%]
100% 20% 60% 0% 0
PW
2c
Plastic
waste
collectio
n at
Material
Recover
[MRF
used] /
[not
installed
]
MRF
Installed
MRF
Installed
MRF
Installe
d
not
install
ed
MRF
under
constru
ction
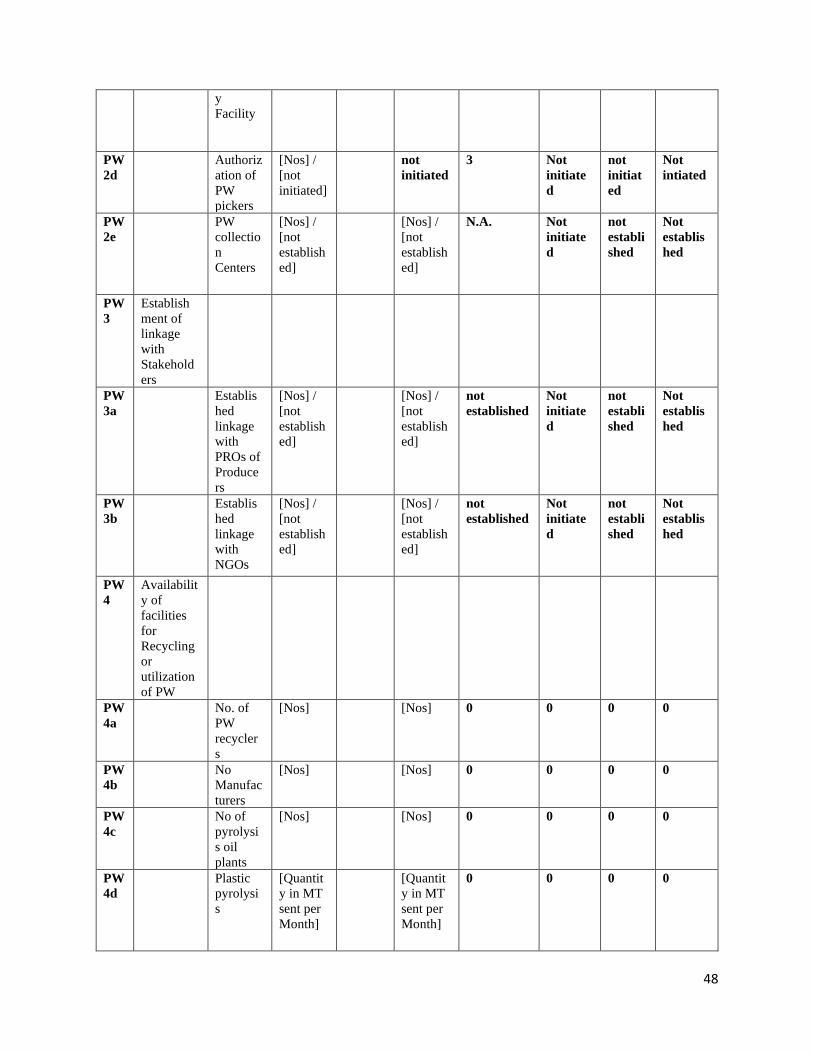
48
y
Facility
PW
2d
Authoriz
ation of
PW
pickers
[Nos] /
[not
initiated]
not
initiated
3 Not
initiate
d
not
initiat
ed
Not
intiated
PW
2e
PW
collectio
n
Centers
[Nos] /
[not
establish
ed]
[Nos] /
[not
establish
ed]
N.A. Not
initiate
d
not
establi
shed
Not
establis
hed
PW
3
Establish
ment of
linkage
with
Stakehold
ers
PW
3a
Establis
hed
linkage
with
PROs of
Produce
rs
[Nos] /
[not
establish
ed]
[Nos] /
[not
establish
ed]
not
established
Not
initiate
d
not
establi
shed
Not
establis
hed
PW
3b
Establis
hed
linkage
with
NGOs
[Nos] /
[not
establish
ed]
[Nos] /
[not
establish
ed]
not
established
Not
initiate
d
not
establi
shed
Not
establis
hed
PW
4
Availabilit
y of
facilities
for
Recycling
or
utilization
of PW
PW
4a
No. of
PW
recycler
s
[Nos] [Nos] 0 0 0 0
PW
4b
No
Manufac
turers
[Nos] [Nos] 0 0 0 0
PW
4c
No of
pyrolysi
s oil
plants
[Nos] [Nos] 0 0 0 0
PW
4d
Plastic
pyrolysi
s
[Quantit
y in MT
sent per
Month]
[Quantit
y in MT
sent per
Month]
0 0 0 0
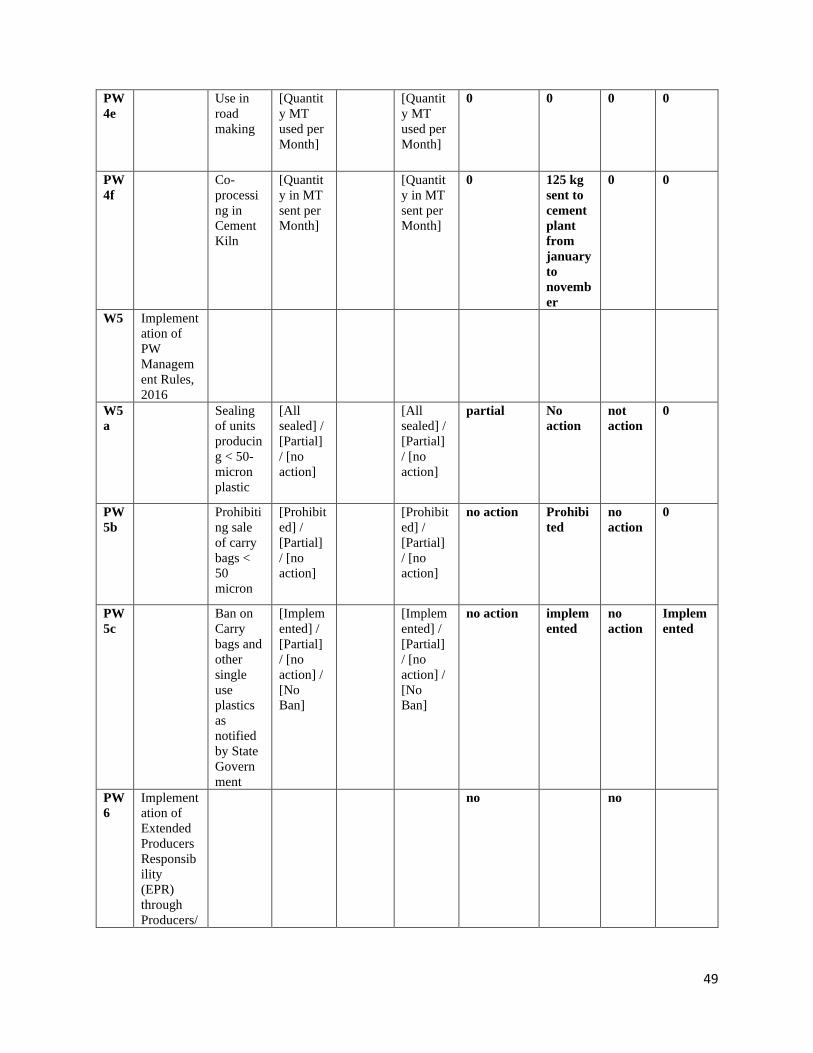
49
PW
4e
Use in
road
making
[Quantit
y MT
used per
Month]
[Quantit
y MT
used per
Month]
0 0 0 0
PW
4f
Co-
processi
ng in
Cement
Kiln
[Quantit
y in MT
sent per
Month]
[Quantit
y in MT
sent per
Month]
0 125 kg
sent to
cement
plant
from
january
to
novemb
er
0 0
W5 Implement
ation of
PW
Managem
ent Rules,
2016
W5
a
Sealing
of units
producin
g < 50-
micron
plastic
[All
sealed] /
[Partial]
/ [no
action]
[All
sealed] /
[Partial]
/ [no
action]
partial No
action
not
action
0
PW
5b
Prohibiti
ng sale
of carry
bags <
50
micron
[Prohibit
ed] /
[Partial]
/ [no
action]
[Prohibit
ed] /
[Partial]
/ [no
action]
no action Prohibi
ted
no
action
0
PW
5c
Ban on
Carry
bags and
other
single
use
plastics
as
notified
by State
Govern
ment
[Implem
ented] /
[Partial]
/ [no
action] /
[No
Ban]
[Implem
ented] /
[Partial]
/ [no
action] /
[No
Ban]
no action implem
ented
no
action
Implem
ented
PW
6
Implement
ation of
Extended
Producers
Responsib
ility
(EPR)
through
Producers/
no no
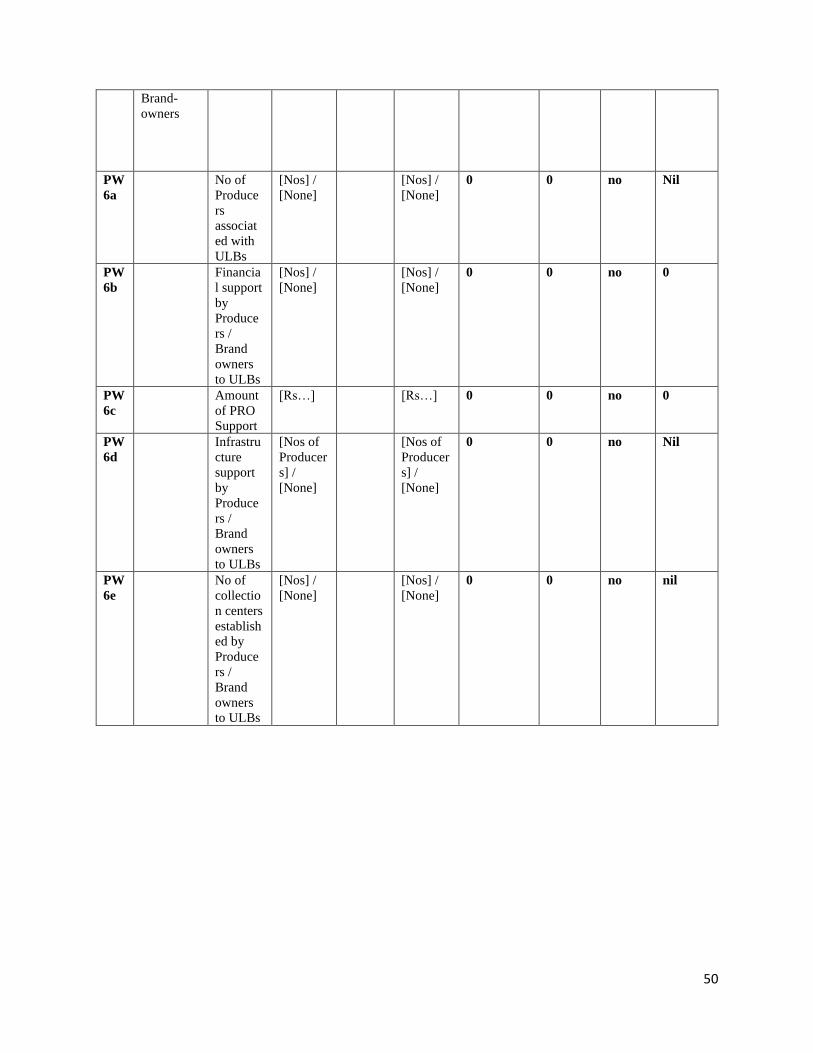
50
Brand-
owners
PW
6a
No of
Produce
rs
associat
ed with
ULBs
[Nos] /
[None]
[Nos] /
[None]
0 0 no Nil
PW
6b
Financia
l support
by
Produce
rs /
Brand
owners
to ULBs
[Nos] /
[None]
[Nos] /
[None]
0 0 no 0
PW
6c
Amount
of PRO
Support
[Rs…] [Rs…] 0 0 no 0
PW
6d
Infrastru
cture
support
by
Produce
rs /
Brand
owners
to ULBs
[Nos of
Producer
s] /
[None]
[Nos of
Producer
s] /
[None]
0 0 no Nil
PW
6e
No of
collectio
n centers
establish
ed by
Produce
rs /
Brand
owners
to ULBs
[Nos] /
[None]
[Nos] /
[None]
0 0 no nil
51
6. C&D (CONSTRUCTION AND DEBRIS) WASTE MANAGEMENT IN R/O ULB’S IN
UDAIPUR DISTRICT:
● Machineries for 50 TPD of C&D waste plant has been commissioned by MCU at Balicha and
started trial run also.
● Land for C&D waste collection centre in the city is identified at Kumharo ka bhatta road.
● MCU notify Service helpline number to collect and transport C&D waste in the city. At present
all C&D waste is being dump at malla talai low line area.
It consists of unwanted material produced directly or incidentally by the construction. It may also
contain hazardous substances. In terms of CDWM, there is positive outcome yet in the following
action areas:
Sr. No. ACTION AREAS OUTCOME
1. Issuance of Permission by ULB’s initiated
2. CD Deposition Points Notifying
3 Establishment of Deposition Points Initiated in MC, Udaipur
4 CD waste Recycling Plant Initiated @50 TPD at Balicha
So the following Action Areas needs improvement: in Nagar Palika’s
Sr. No. ACTION AREAS OUTCOME
1.
2.
6.1. CDWM IN RURAL AREAS:
There is no mechanism for CDWM in Rural Areas of Udaipur district. There is no points specified
for the debris.
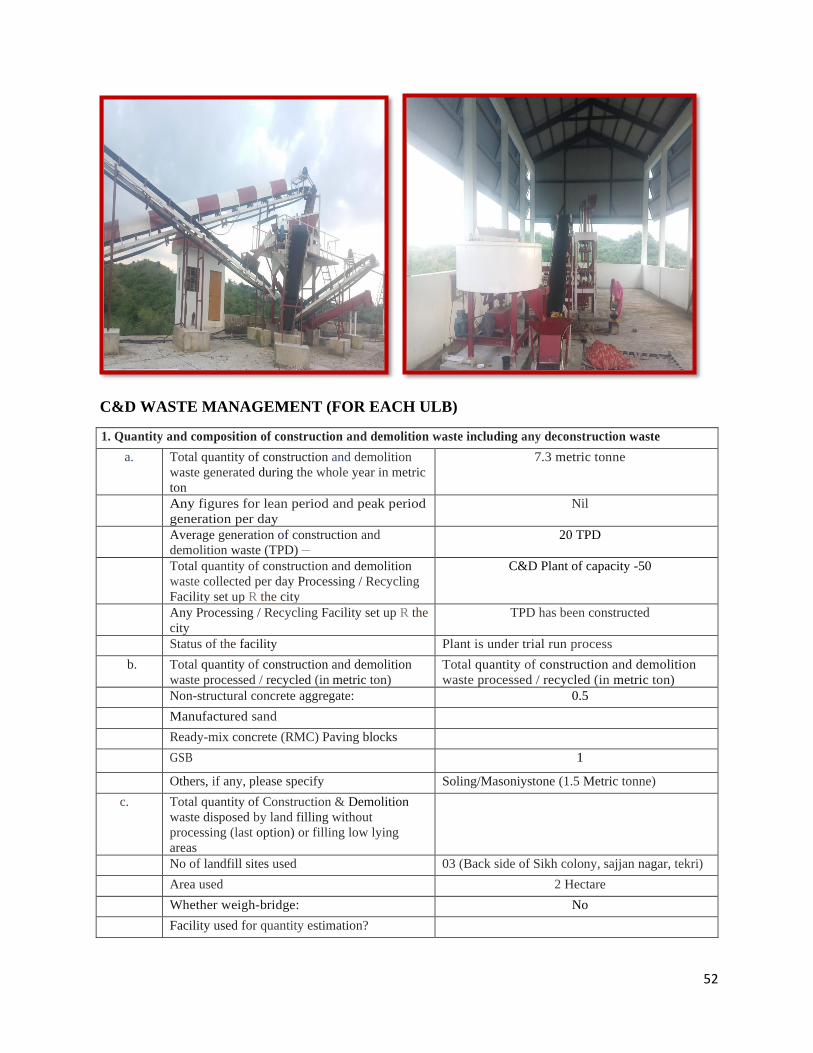
52
C&D WASTE MANAGEMENT (FOR EACH ULB)
1. Quantity and composition of construction and demolition waste including any deconstruction waste
a. Total quantity of construction and demolition
waste generated during the whole year in metric
ton
7.3 metric tonne
Any figures for lean period and peak period
generation per day
Nil
Average generation of construction and
demolition waste (TPD) __
20 TPD
Total quantity of construction and demolition
waste collected per day Processing / Recycling
Facility set up R the city
C&D Plant of capacity -50
Any Processing / Recycling Facility set up R the
city
TPD has been constructed
Status of the facility Plant is under trial run process
b. Total quantity of construction and demolition
waste processed / recycled (in metric ton)
Total quantity of construction and demolition
waste processed / recycled (in metric ton) Non-structural concrete aggregate: 0.5
Manufactured sand
Ready-mix concrete (RMC) Paving blocks
GSB 1
Others, if any, please specify Soling/Masoniystone (1.5 Metric tonne)
c. Total quantity of Construction & Demolition
waste disposed by land filling without
processing (last option) or filling low lying
areas
No of landfill sites used 03 (Back side of Sikh colony, sajjan nagar, tekri)
Area used 2 Hectare
Whether weigh-bridge: No
Facility used for quantity estimation?

53
d
d.
Whether construction and demolition waste
used in sanitary landfill (for solid waste) as
per Schedule:
No (sanitary landfill is under construction
process, Applied for environmental clearance
from State pollution control board, Jaipur)
2. Storage facilities
a. Area or location or plot or societies covered
for collection of Construction and Demolition
waste:
1 No
b. No. of large Projects (including roadways
project) covered
Nil
c. Total quantity of Construction &
Demolition waste disposed by land
filling without processing (last
option) or filling low lying areas
No
d. Storage Bins No
Specification
(Shape & Size)
Existing
Number
Proposed for
Future
(i) Containers or receptacle (Capacity) N/A N/A N/A
(ii) Others, please specify Truck Hydraulic
(6.00 cum)
1 no. 3 no.
e. Whether all storage bins/collection spots Are
attended for daily lifting
yes
f. Whether lifting of Construction & Demolition
Waste from Storage bins is manual or
mechanical
yes
(i) please specify mode and Others, and
equipment used (specify equipment)
Mechanical (J CB)
3. Transportation
Existing Actually Required / Proposed no.
Truck
Truck-Hydraulic Tricycle 1 no.
Tractor-Trailer
Dumper-placers
Tricycle
4. Whether any proposal has been made to improve
Construction and Demolition waste management
practices:
No
5. Have any efforts been made to involve PPP for
processing of Construction & Demolition waste:
No
Processing / recycling Technology (Quantity to
be processed)
Steps taken
Dry Process No
Wet Process No
Others, if any, please specify No
6. What provisions are available to check unauthorized operations of:
Encroachment on river bank or wet bodies: Continuous monitoring is done by revenue
section of nagar nigam udaipur
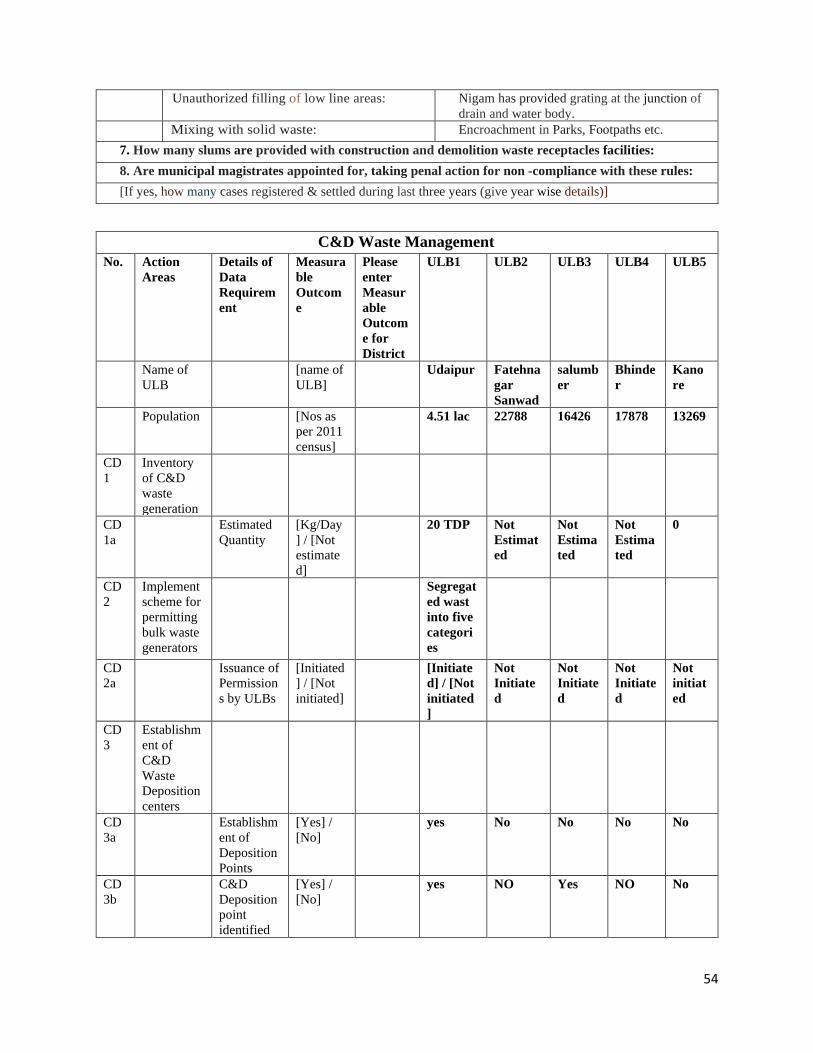
54
Unauthorized filling of low line areas: Nigam has provided grating at the junction of
drain and water body. Mixing with solid waste: Encroachment in Parks, Footpaths etc.
7. How many slums are provided with construction and demolition waste receptacles facilities:
8. Are municipal magistrates appointed for, taking penal action for non -compliance with these rules:
[If yes, how many cases registered & settled during last three years (give year wise details)]
C&D Waste Management
No. Action
Areas
Details of
Data
Requirem
ent
Measura
ble
Outcom
e
Please
enter
Measur
able
Outcom
e for
District
ULB1 ULB2 ULB3 ULB4 ULB5
Name of
ULB
[name of
ULB]
Udaipur Fatehna
gar
Sanwad
salumb
er
Bhinde
r
Kano
re
Population [Nos as
per 2011
census]
4.51 lac 22788 16426 17878 13269
CD
1
Inventory
of C&D
waste
generation
CD
1a
Estimated
Quantity
[Kg/Day
] / [Not
estimate
d]
20 TDP Not
Estimat
ed
Not
Estima
ted
Not
Estima
ted
0
CD
2
Implement
scheme for
permitting
bulk waste
generators
Segregat
ed wast
into five
categori
es
CD
2a
Issuance of
Permission
s by ULBs
[Initiated
] / [Not
initiated]
[Initiate
d] / [Not
initiated
]
Not
Initiate
d
Not
Initiate
d
Not
Initiate
d
Not
initiat
ed
CD
3
Establishm
ent of
C&D
Waste
Deposition
centers
CD
3a
Establishm
ent of
Deposition
Points
[Yes] /
[No]
yes No No No No
CD
3b
C&D
Deposition
point
identified
[Yes] /
[No]
yes NO Yes NO No
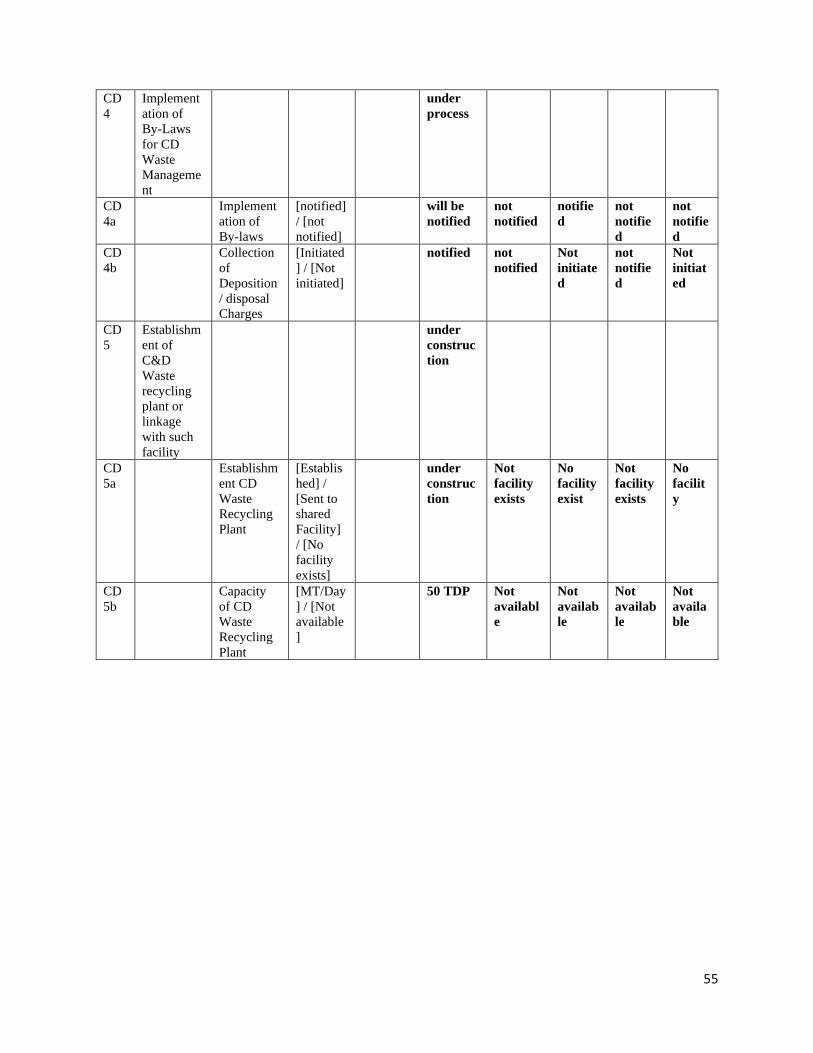
55
CD
4
Implement
ation of
By-Laws
for CD
Waste
Manageme
nt
under
process
CD
4a
Implement
ation of
By-laws
[notified]
/ [not
notified]
will be
notified
not
notified
notifie
d
not
notifie
d
not
notifie
d
CD
4b
Collection
of
Deposition
/ disposal
Charges
[Initiated
] / [Not
initiated]
notified not
notified
Not
initiate
d
not
notifie
d
Not
initiat
ed
CD
5
Establishm
ent of
C&D
Waste
recycling
plant or
linkage
with such
facility
under
construc
tion
CD
5a
Establishm
ent CD
Waste
Recycling
Plant
[Establis
hed] /
[Sent to
shared
Facility]
/ [No
facility
exists]
under
construc
tion
Not
facility
exists
No
facility
exist
Not
facility
exists
No
facilit
y
CD
5b
Capacity
of CD
Waste
Recycling
Plant
[MT/Day
] / [Not
available
]
50 TDP Not
availabl
e
Not
availab
le
Not
availab
le
Not
availa
ble
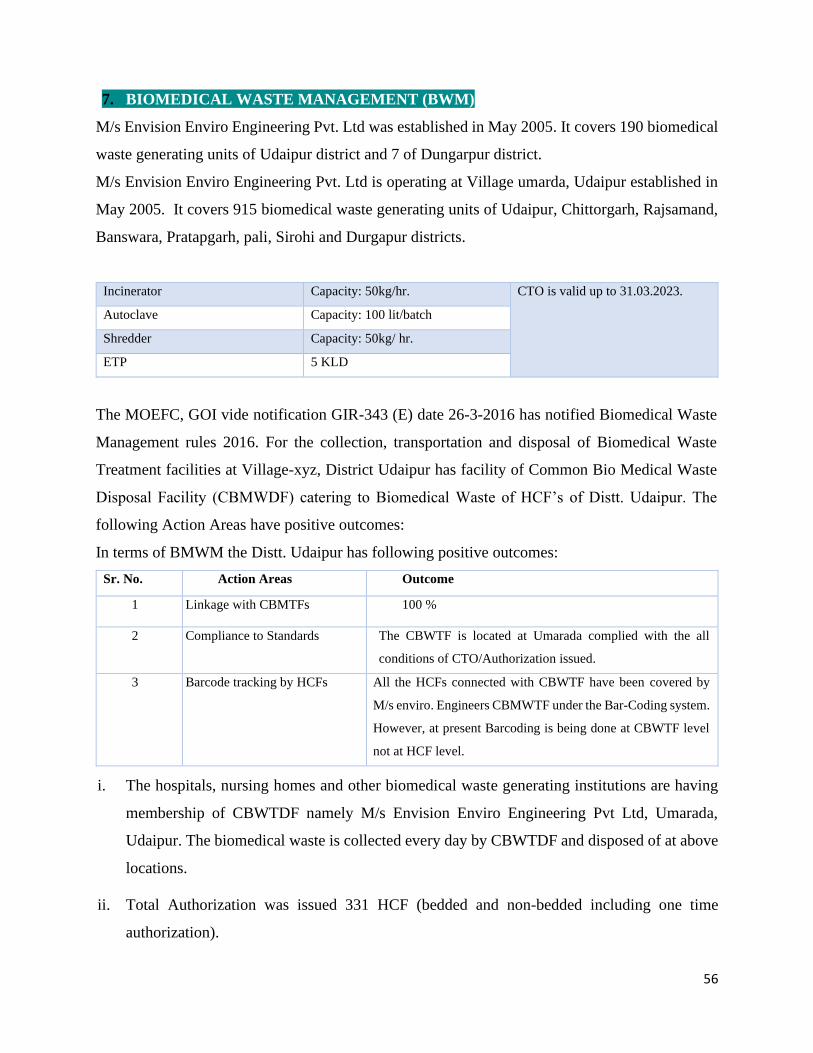
56
7. BIOMEDICAL WASTE MANAGEMENT (BWM)
M/s Envision Enviro Engineering Pvt. Ltd was established in May 2005. It covers 190 biomedical
waste generating units of Udaipur district and 7 of Dungarpur district.
M/s Envision Enviro Engineering Pvt. Ltd is operating at Village umarda, Udaipur established in
May 2005. It covers 915 biomedical waste generating units of Udaipur, Chittorgarh, Rajsamand,
Banswara, Pratapgarh, pali, Sirohi and Durgapur districts.
Incinerator Capacity: 50kg/hr. CTO is valid up to 31.03.2023.
Autoclave Capacity: 100 lit/batch
Shredder Capacity: 50kg/ hr.
ETP 5 KLD
The MOEFC, GOI vide notification GIR-343 (E) date 26-3-2016 has notified Biomedical Waste
Management rules 2016. For the collection, transportation and disposal of Biomedical Waste
Treatment facilities at Village-xyz, District Udaipur has facility of Common Bio Medical Waste
Disposal Facility (CBMWDF) catering to Biomedical Waste of HCF’s of Distt. Udaipur. The
following Action Areas have positive outcomes:
In terms of BMWM the Distt. Udaipur has following positive outcomes:
Sr. No. Action Areas Outcome
1 Linkage with CBMTFs 100 %
2 Compliance to Standards The CBWTF is located at Umarada complied with the all
conditions of CTO/Authorization issued.
3 Barcode tracking by HCFs All the HCFs connected with CBWTF have been covered by
M/s enviro. Engineers CBMWTF under the Bar-Coding system.
However, at present Barcoding is being done at CBWTF level
not at HCF level.
i. The hospitals, nursing homes and other biomedical waste generating institutions are having
membership of CBWTDF namely M/s Envision Enviro Engineering Pvt Ltd, Umarada,
Udaipur. The biomedical waste is collected every day by CBWTDF and disposed of at above
locations.
ii. Total Authorization was issued 331 HCF (bedded and non-bedded including one time
authorization).
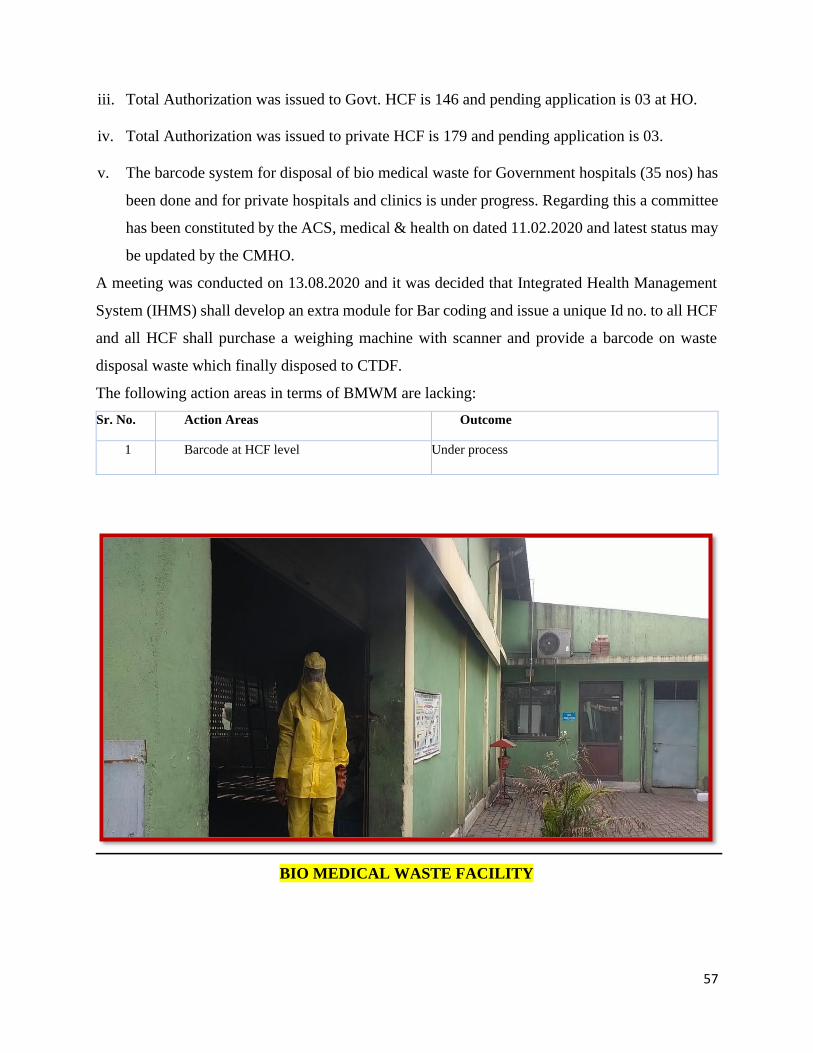
57
iii. Total Authorization was issued to Govt. HCF is 146 and pending application is 03 at HO.
iv. Total Authorization was issued to private HCF is 179 and pending application is 03.
v. The barcode system for disposal of bio medical waste for Government hospitals (35 nos) has
been done and for private hospitals and clinics is under progress. Regarding this a committee
has been constituted by the ACS, medical & health on dated 11.02.2020 and latest status may
be updated by the CMHO.
A meeting was conducted on 13.08.2020 and it was decided that Integrated Health Management
System (IHMS) shall develop an extra module for Bar coding and issue a unique Id no. to all HCF
and all HCF shall purchase a weighing machine with scanner and provide a barcode on waste
disposal waste which finally disposed to CTDF.
The following action areas in terms of BMWM are lacking:
Sr. No. Action Areas Outcome
1 Barcode at HCF level Under process
BIO MEDICAL WASTE FACILITY
58
BIOMEDICAL WASTE MANAGEMENT (FOR EACH ULB)
Sr.
No.
Action Point Present Status Gap Timeline Department
1. Inventorisation
of Medical
facilities
producing Bio-
Medical Waste
All ULBs, Udaipur,
Slumber, Kanore, Bhinder
and Fatehnager
Not identified Medical &
Health
Department
2 Authorization of
such facilities by
SPCB/PCCs
All ULBs, Udaipur,
Slumber, Kanore, Bhinder
and Fatehnager
Total identified
unit is 331, in
which 182 is
private 149
government
Vaid
authorization
form RPCB is
325 out of
reach private
179 and
Government
146
RSPCB
3. Availability of
CBMWTFs or
Linkage
All ULBs, Udaipur,
Slumber, Kanore, Bhinder
and Fatehnager connected
with CBMWTFs
• Not done in
(Name of
ULBs)
Med. & Health
Dpt.
4 Regular
Inspection of
CBMWTFs
Yes • Not done Team decided by
District Collector
5 Regular
Inspection of
HCFs
Yes • Not done Team decided by
District Collector
6 Bar Code
System
RPCB have been provided
are bar codes unit
registration and send to
Jaipur for further processing
Pending Med & Health
Dpt.
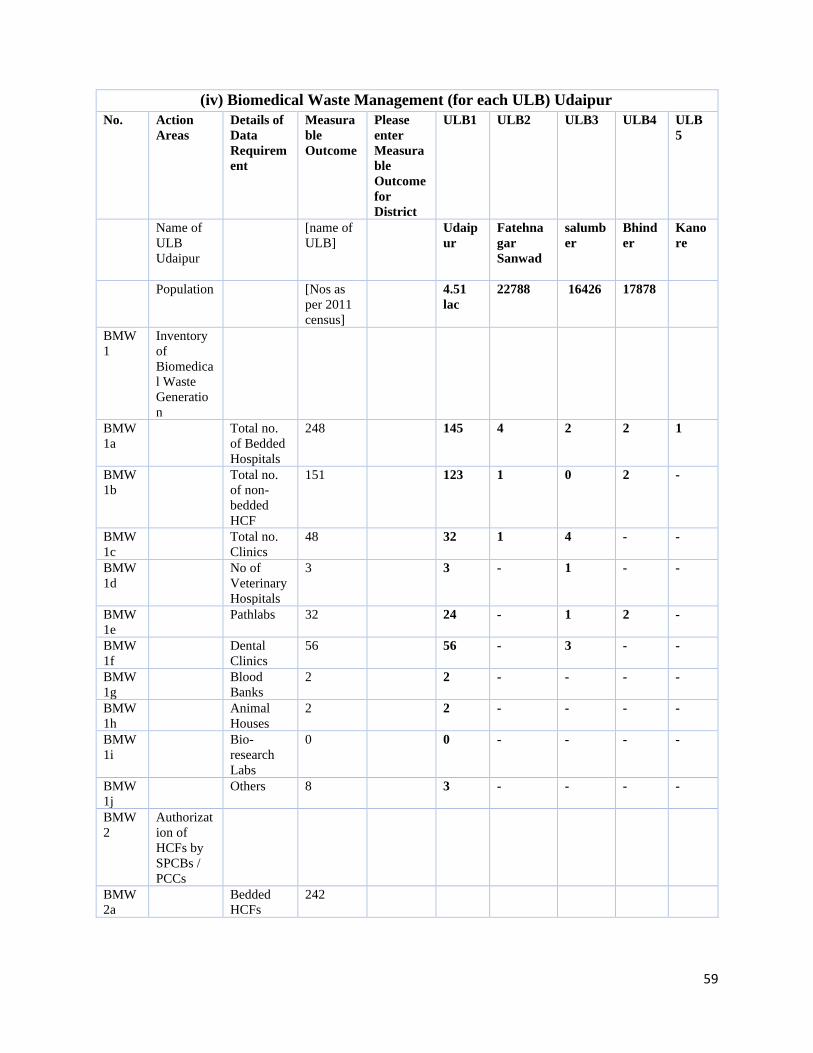
59
(iv) Biomedical Waste Management (for each ULB) Udaipur
No. Action
Areas
Details of
Data
Requirem
ent
Measura
ble
Outcome
Please
enter
Measura
ble
Outcome
for
District
ULB1 ULB2 ULB3 ULB4 ULB
5
Name of
ULB
Udaipur
[name of
ULB]
Udaip
ur
Fatehna
gar
Sanwad
salumb
er
Bhind
er
Kano
re
Population [Nos as
per 2011
census]
4.51
lac
22788 16426 17878
BMW
1
Inventory
of
Biomedica
l Waste
Generatio
n
BMW
1a
Total no.
of Bedded
Hospitals
248 145 4 2 2 1
BMW
1b
Total no.
of non-
bedded
HCF
151 123 1 0 2 -
BMW
1c
Total no.
Clinics
48 32 1 4 - -
BMW
1d
No of
Veterinary
Hospitals
3 3 - 1 - -
BMW
1e
Pathlabs 32 24 - 1 2 -
BMW
1f
Dental
Clinics
56 56 - 3 - -
BMW
1g
Blood
Banks
2 2 - - - -
BMW
1h
Animal
Houses
2 2 - - - -
BMW
1i
Bio-
research
Labs
0 0 - - - -
BMW
1j
Others 8 3 - - - -
BMW
2
Authorizat
ion of
HCFs by
SPCBs /
PCCs
BMW
2a
Bedded
HCFs
242
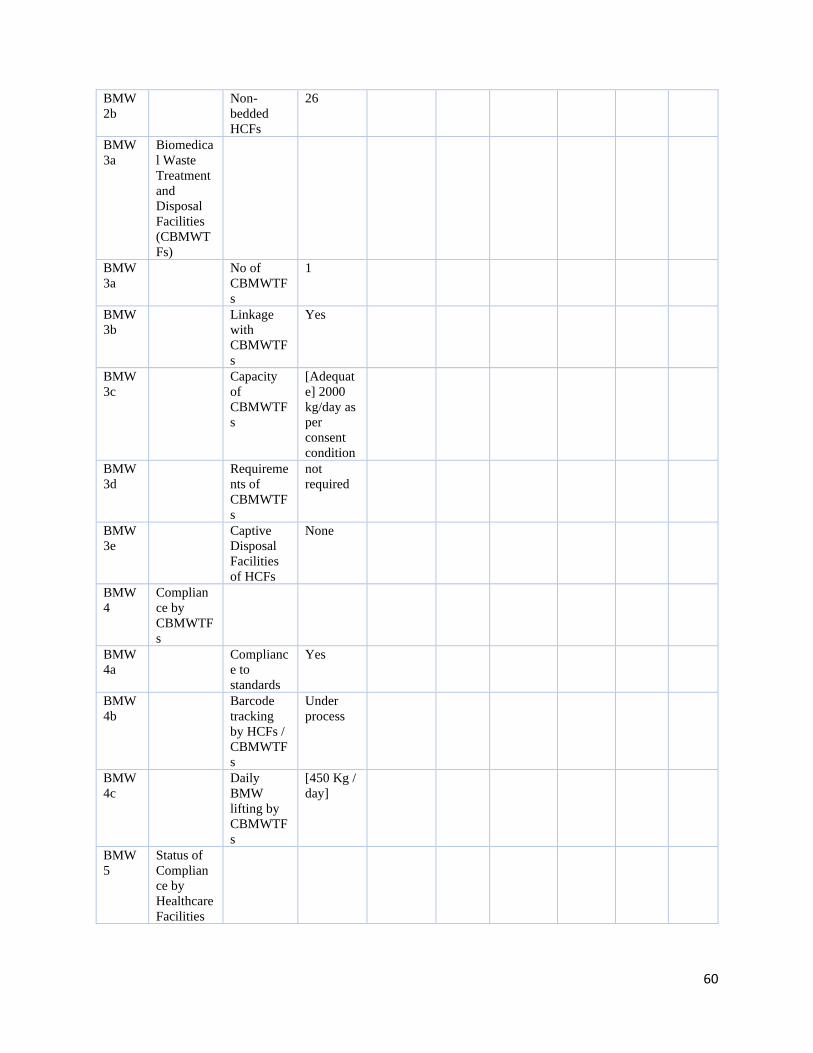
60
BMW
2b
Non-
bedded
HCFs
26
BMW
3a
Biomedica
l Waste
Treatment
and
Disposal
Facilities
(CBMWT
Fs)
BMW
3a
No of
CBMWTF
s
1
BMW
3b
Linkage
with
CBMWTF
s
Yes
BMW
3c
Capacity
of
CBMWTF
s
[Adequat
e] 2000
kg/day as
per
consent
condition
BMW
3d
Requireme
nts of
CBMWTF
s
not
required
BMW
3e
Captive
Disposal
Facilities
of HCFs
None
BMW
4
Complian
ce by
CBMWTF
s
BMW
4a
Complianc
e to
standards
Yes
BMW
4b
Barcode
tracking
by HCFs /
CBMWTF
s
Under
process
BMW
4c
Daily
BMW
lifting by
CBMWTF
s
[450 Kg /
day]
BMW
5
Status of
Complian
ce by
Healthcare
Facilities
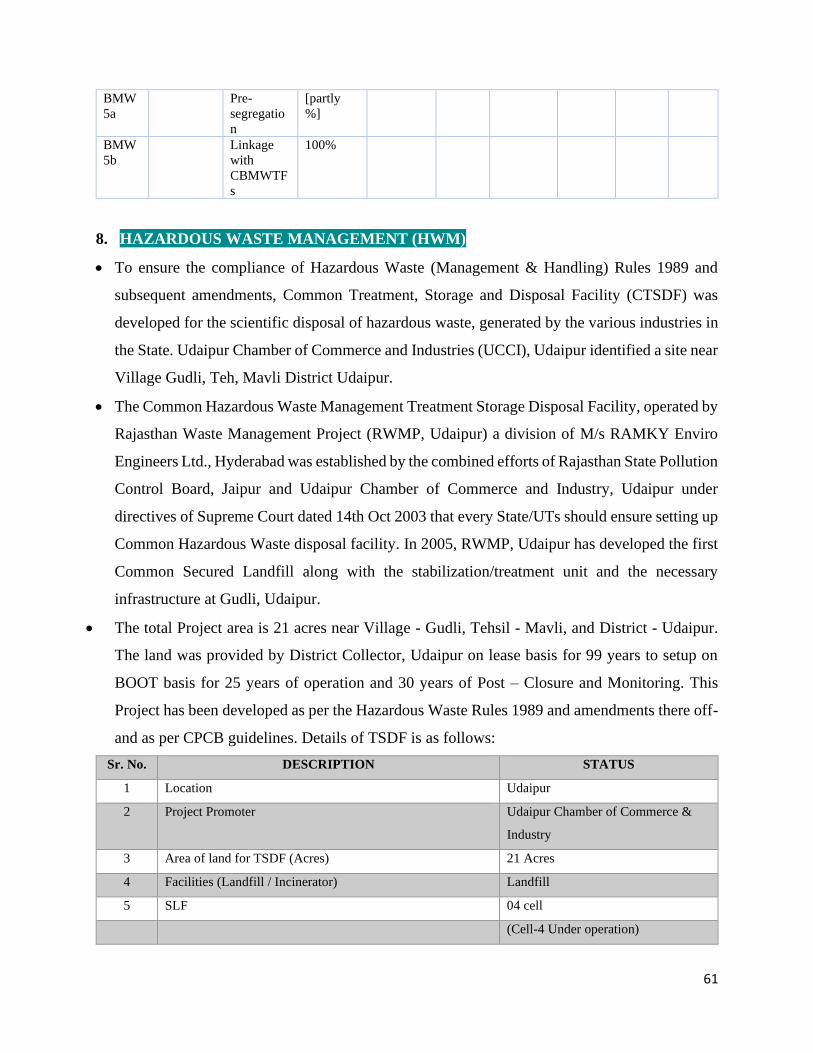
61
BMW
5a
Pre-
segregatio
n
[partly
%]
BMW
5b
Linkage
with
CBMWTF
s
100%
8. HAZARDOUS WASTE MANAGEMENT (HWM)
• To ensure the compliance of Hazardous Waste (Management & Handling) Rules 1989 and
subsequent amendments, Common Treatment, Storage and Disposal Facility (CTSDF) was
developed for the scientific disposal of hazardous waste, generated by the various industries in
the State. Udaipur Chamber of Commerce and Industries (UCCI), Udaipur identified a site near
Village Gudli, Teh, Mavli District Udaipur.
• The Common Hazardous Waste Management Treatment Storage Disposal Facility, operated by
Rajasthan Waste Management Project (RWMP, Udaipur) a division of M/s RAMKY Enviro
Engineers Ltd., Hyderabad was established by the combined efforts of Rajasthan State Pollution
Control Board, Jaipur and Udaipur Chamber of Commerce and Industry, Udaipur under
directives of Supreme Court dated 14th Oct 2003 that every State/UTs should ensure setting up
Common Hazardous Waste disposal facility. In 2005, RWMP, Udaipur has developed the first
Common Secured Landfill along with the stabilization/treatment unit and the necessary
infrastructure at Gudli, Udaipur.
• The total Project area is 21 acres near Village - Gudli, Tehsil - Mavli, and District - Udaipur.
The land was provided by District Collector, Udaipur on lease basis for 99 years to setup on
BOOT basis for 25 years of operation and 30 years of Post – Closure and Monitoring. This
Project has been developed as per the Hazardous Waste Rules 1989 and amendments there off-
and as per CPCB guidelines. Details of TSDF is as follows:
Sr. No. DESCRIPTION STATUS
1 Location Udaipur
2 Project Promoter Udaipur Chamber of Commerce &
Industry
3 Area of land for TSDF (Acres) 21 Acres
4 Facilities (Landfill / Incinerator) Landfill
5 SLF 04 cell
(Cell-4 Under operation)
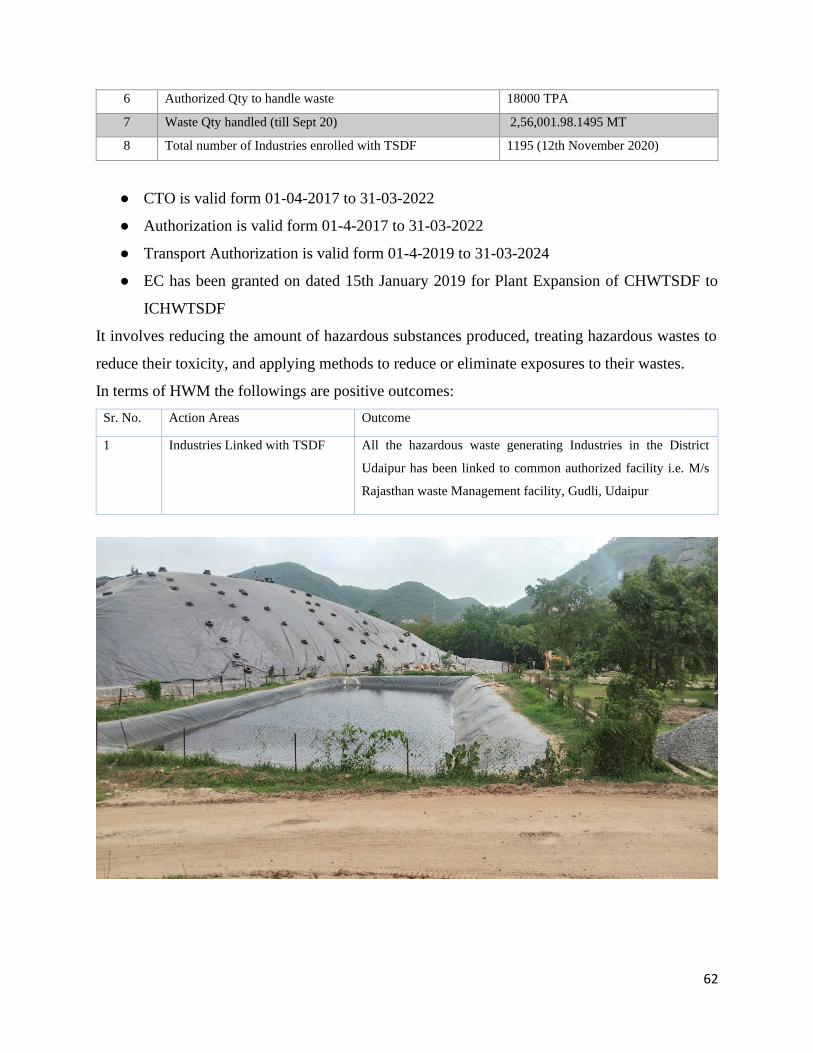
62
6 Authorized Qty to handle waste 18000 TPA
7 Waste Qty handled (till Sept 20) 2,56,001.98.1495 MT
8 Total number of Industries enrolled with TSDF 1195 (12th November 2020)
● CTO is valid form 01-04-2017 to 31-03-2022
● Authorization is valid form 01-4-2017 to 31-03-2022
● Transport Authorization is valid form 01-4-2019 to 31-03-2024
● EC has been granted on dated 15th January 2019 for Plant Expansion of CHWTSDF to
ICHWTSDF
It involves reducing the amount of hazardous substances produced, treating hazardous wastes to
reduce their toxicity, and applying methods to reduce or eliminate exposures to their wastes.
In terms of HWM the followings are positive outcomes:
Sr. No. Action Areas Outcome
1 Industries Linked with TSDF All the hazardous waste generating Industries in the District
Udaipur has been linked to common authorized facility i.e. M/s
Rajasthan waste Management facility, Gudli, Udaipur
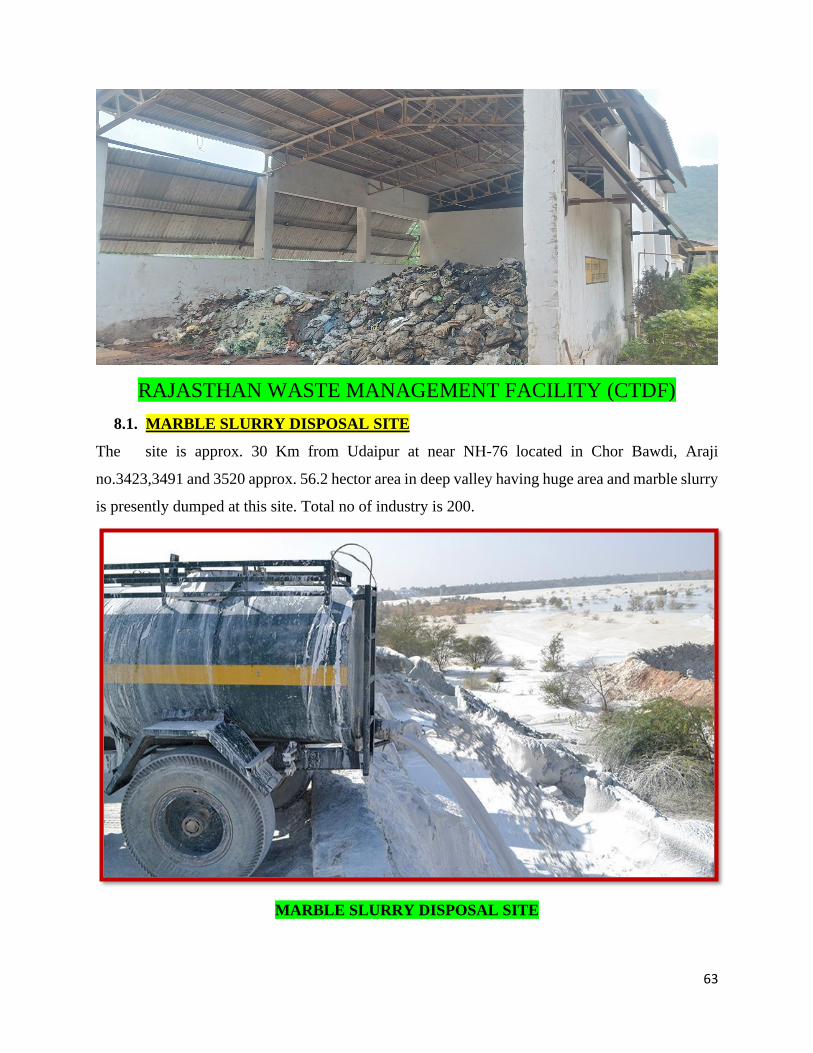
63
RAJASTHAN WASTE MANAGEMENT FACILITY (CTDF)
8.1. MARBLE SLURRY DISPOSAL SITE
The site is approx. 30 Km from Udaipur at near NH-76 located in Chor Bawdi, Araji
no.3423,3491 and 3520 approx. 56.2 hector area in deep valley having huge area and marble slurry
is presently dumped at this site. Total no of industry is 200.
MARBLE SLURRY DISPOSAL SITE
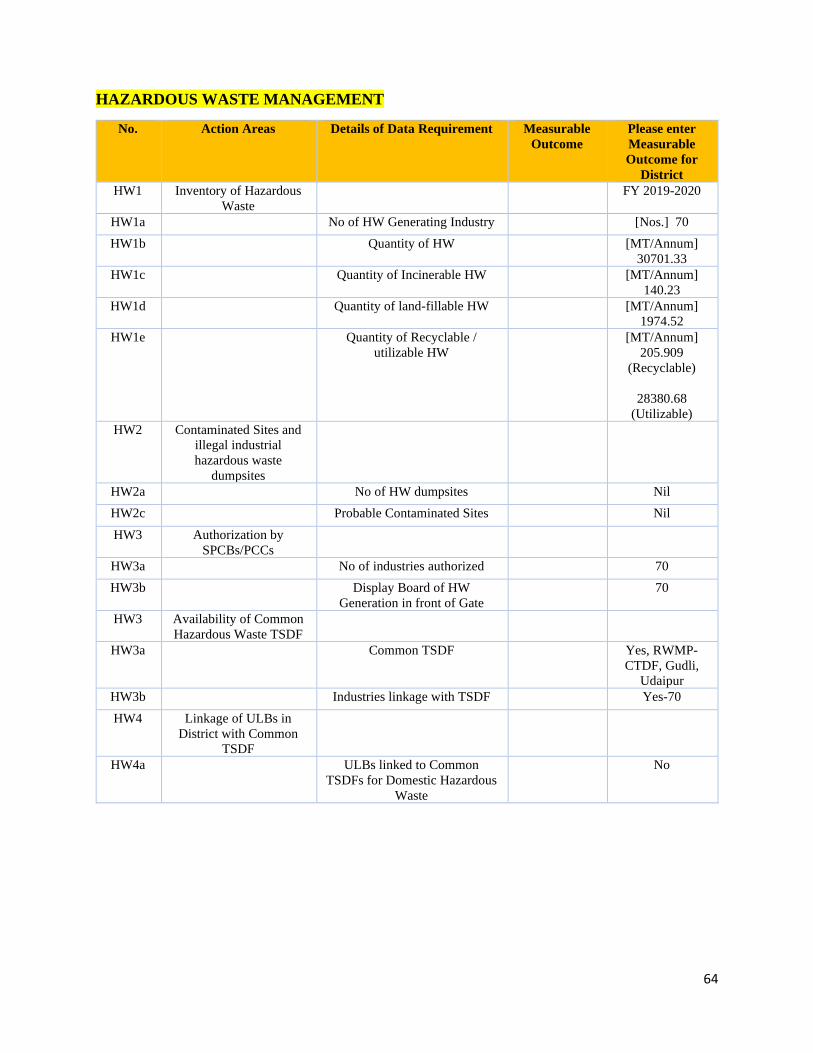
64
HAZARDOUS WASTE MANAGEMENT
No. Action Areas Details of Data Requirement Measurable
Outcome
Please enter
Measurable
Outcome for
District
HW1 Inventory of Hazardous
Waste
FY 2019-2020
HW1a No of HW Generating Industry [Nos.] 70
HW1b Quantity of HW [MT/Annum]
30701.33
HW1c Quantity of Incinerable HW [MT/Annum]
140.23
HW1d Quantity of land-fillable HW [MT/Annum]
1974.52
HW1e Quantity of Recyclable /
utilizable HW
[MT/Annum]
205.909
(Recyclable)
28380.68
(Utilizable)
HW2 Contaminated Sites and
illegal industrial
hazardous waste
dumpsites
HW2a No of HW dumpsites Nil
HW2c Probable Contaminated Sites Nil
HW3 Authorization by
SPCBs/PCCs
HW3a No of industries authorized 70
HW3b Display Board of HW
Generation in front of Gate
70
HW3 Availability of Common
Hazardous Waste TSDF
HW3a Common TSDF Yes, RWMP-
CTDF, Gudli,
Udaipur
HW3b Industries linkage with TSDF Yes-70
HW4 Linkage of ULBs in
District with Common
TSDF
HW4a ULBs linked to Common
TSDFs for Domestic Hazardous
Waste
No
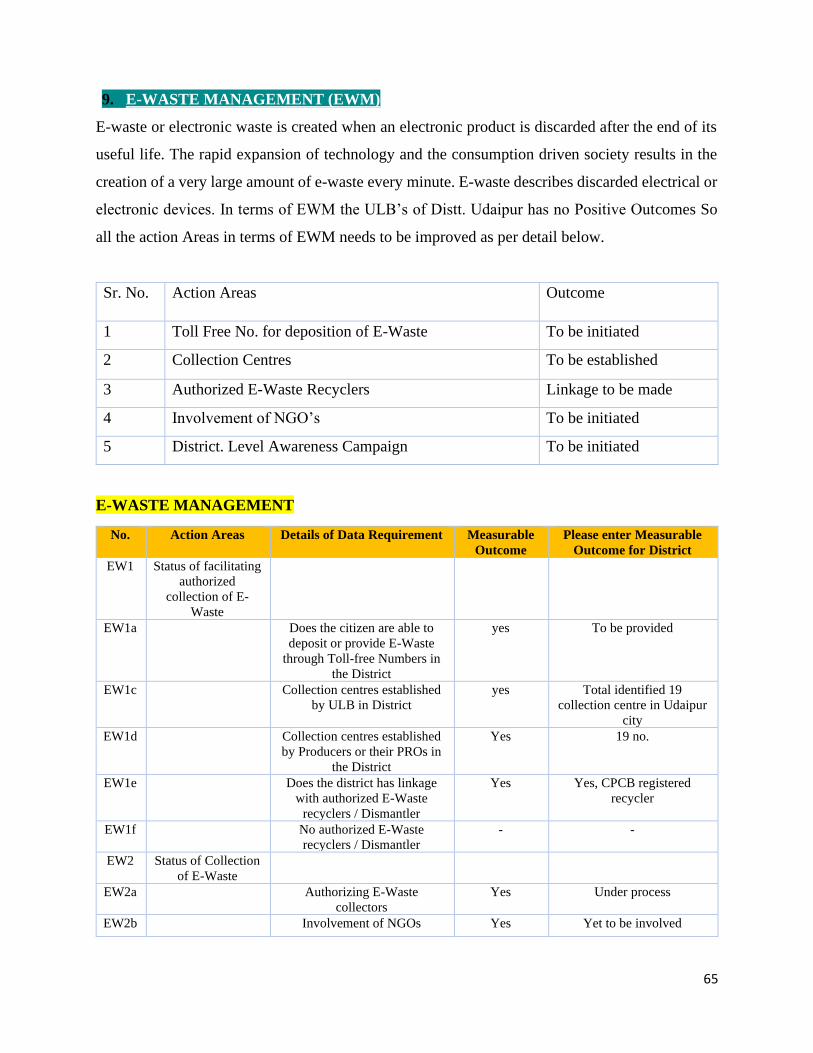
65
9. E-WASTE MANAGEMENT (EWM)
E-waste or electronic waste is created when an electronic product is discarded after the end of its
useful life. The rapid expansion of technology and the consumption driven society results in the
creation of a very large amount of e-waste every minute. E-waste describes discarded electrical or
electronic devices. In terms of EWM the ULB’s of Distt. Udaipur has no Positive Outcomes So
all the action Areas in terms of EWM needs to be improved as per detail below.
Sr. No. Action Areas Outcome
1 Toll Free No. for deposition of E-Waste To be initiated
2 Collection Centres To be established
3 Authorized E-Waste Recyclers Linkage to be made
4 Involvement of NGO’s To be initiated
5 District. Level Awareness Campaign To be initiated
E-WASTE MANAGEMENT
No. Action Areas Details of Data Requirement Measurable
Outcome
Please enter Measurable
Outcome for District
EW1 Status of facilitating
authorized
collection of E-
Waste
EW1a Does the citizen are able to
deposit or provide E-Waste
through Toll-free Numbers in
the District
yes To be provided
EW1c Collection centres established
by ULB in District
yes Total identified 19
collection centre in Udaipur
city
EW1d Collection centres established
by Producers or their PROs in
the District
Yes 19 no.
EW1e Does the district has linkage
with authorized E-Waste
recyclers / Dismantler
Yes Yes, CPCB registered
recycler
EW1f No authorized E-Waste
recyclers / Dismantler
- -
EW2 Status of Collection
of E-Waste
EW2a Authorizing E-Waste
collectors
Yes Under process
EW2b Involvement of NGOs Yes Yet to be involved
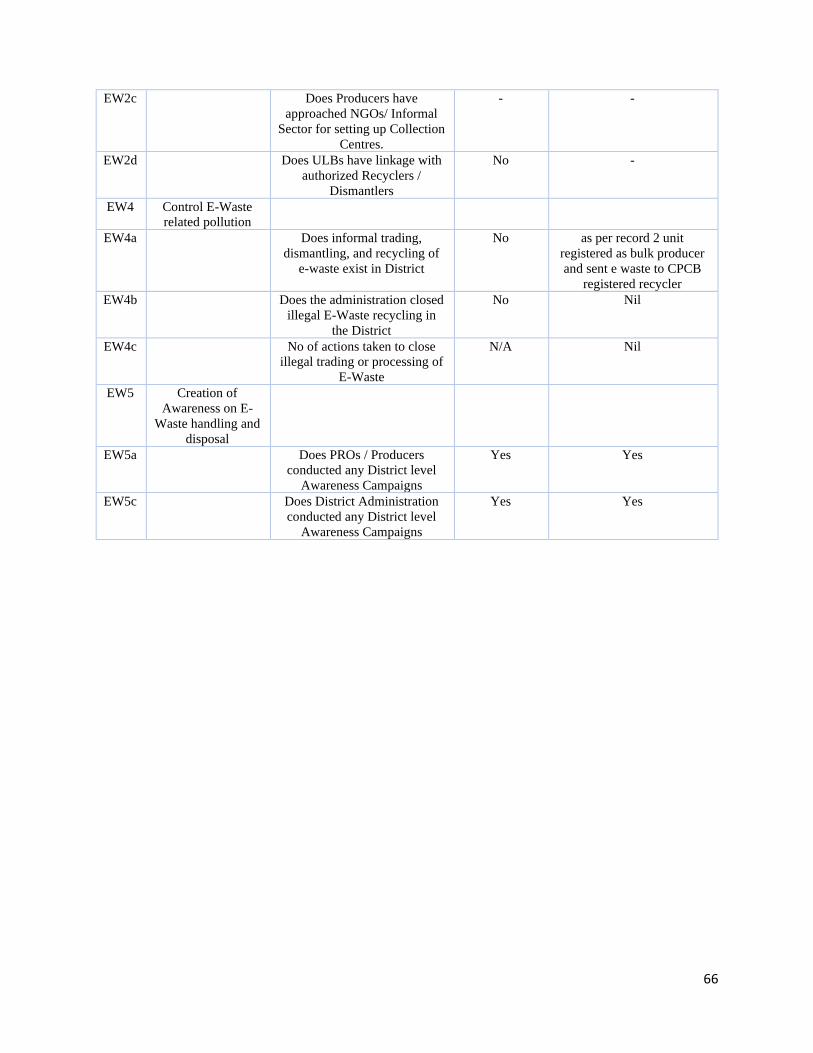
66
EW2c Does Producers have
approached NGOs/ Informal
Sector for setting up Collection
Centres.
- -
EW2d Does ULBs have linkage with
authorized Recyclers /
Dismantlers
No -
EW4 Control E-Waste
related pollution
EW4a Does informal trading,
dismantling, and recycling of
e-waste exist in District
No as per record 2 unit
registered as bulk producer
and sent e waste to CPCB
registered recycler
EW4b Does the administration closed
illegal E-Waste recycling in
the District
No Nil
EW4c No of actions taken to close
illegal trading or processing of
E-Waste
N/A Nil
EW5 Creation of
Awareness on E-
Waste handling and
disposal
EW5a Does PROs / Producers
conducted any District level
Awareness Campaigns
Yes Yes
EW5c Does District Administration
conducted any District level
Awareness Campaigns
Yes Yes
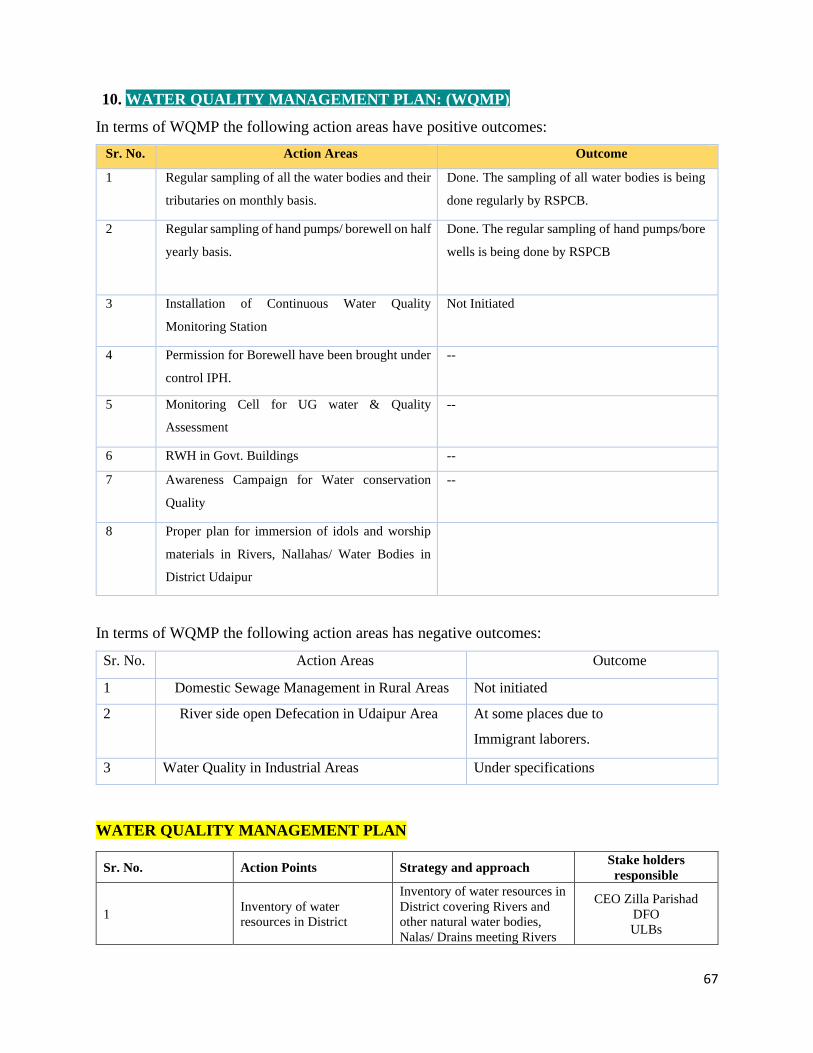
67
10. WATER QUALITY MANAGEMENT PLAN: (WQMP)
In terms of WQMP the following action areas have positive outcomes:
Sr. No. Action Areas Outcome
1 Regular sampling of all the water bodies and their
tributaries on monthly basis.
Done. The sampling of all water bodies is being
done regularly by RSPCB.
2 Regular sampling of hand pumps/ borewell on half
yearly basis.
Done. The regular sampling of hand pumps/bore
wells is being done by RSPCB
3 Installation of Continuous Water Quality
Monitoring Station
Not Initiated
4 Permission for Borewell have been brought under
control IPH.
--
5 Monitoring Cell for UG water & Quality
Assessment
--
6 RWH in Govt. Buildings --
7 Awareness Campaign for Water conservation
Quality
--
8 Proper plan for immersion of idols and worship
materials in Rivers, Nallahas/ Water Bodies in
District Udaipur
In terms of WQMP the following action areas has negative outcomes:
Sr. No. Action Areas Outcome
1 Domestic Sewage Management in Rural Areas Not initiated
2 River side open Defecation in Udaipur Area At some places due to
Immigrant laborers.
3 Water Quality in Industrial Areas Under specifications
WATER QUALITY MANAGEMENT PLAN
Sr. No. Action Points Strategy and approach Stake holders
responsible
1 Inventory of water
resources in District
Inventory of water resources in
District covering Rivers and
other natural water bodies,
Nalas/ Drains meeting Rivers
CEO Zilla Parishad
DFO
ULBs
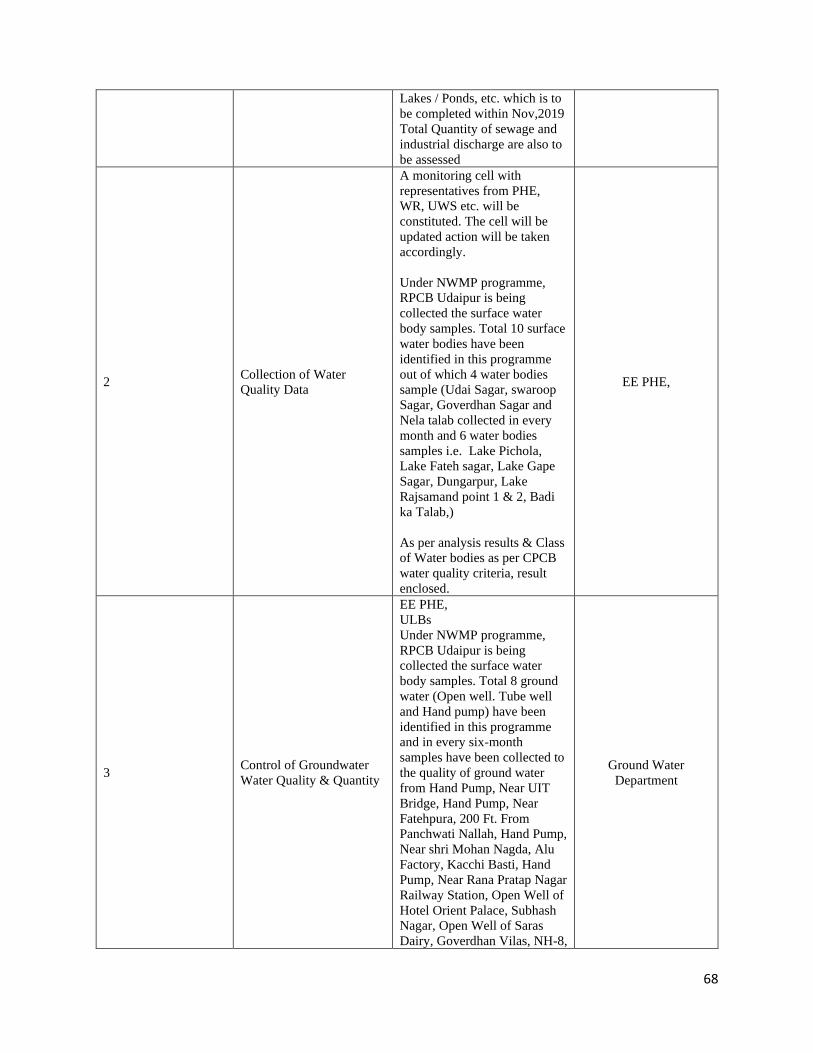
68
Lakes / Ponds, etc. which is to
be completed within Nov,2019
Total Quantity of sewage and
industrial discharge are also to
be assessed
2 Collection of Water
Quality Data
A monitoring cell with
representatives from PHE,
WR, UWS etc. will be
constituted. The cell will be
updated action will be taken
accordingly.
Under NWMP programme,
RPCB Udaipur is being
collected the surface water
body samples. Total 10 surface
water bodies have been
identified in this programme
out of which 4 water bodies
sample (Udai Sagar, swaroop
Sagar, Goverdhan Sagar and
Nela talab collected in every
month and 6 water bodies
samples i.e. Lake Pichola,
Lake Fateh sagar, Lake Gape
Sagar, Dungarpur, Lake
Rajsamand point 1 & 2, Badi
ka Talab,)
As per analysis results & Class
of Water bodies as per CPCB
water quality criteria, result
enclosed.
EE PHE,
3 Control of Groundwater
Water Quality & Quantity
EE PHE,
ULBs
Under NWMP programme,
RPCB Udaipur is being
collected the surface water
body samples. Total 8 ground
water (Open well. Tube well
and Hand pump) have been
identified in this programme
and in every six-month
samples have been collected to
the quality of ground water
from Hand Pump, Near UIT
Bridge, Hand Pump, Near
Fatehpura, 200 Ft. From
Panchwati Nallah, Hand Pump,
Near shri Mohan Nagda, Alu
Factory, Kacchi Basti, Hand
Pump, Near Rana Pratap Nagar
Railway Station, Open Well of
Hotel Orient Palace, Subhash
Nagar, Open Well of Saras
Dairy, Goverdhan Vilas, NH-8,
Ground Water
Department
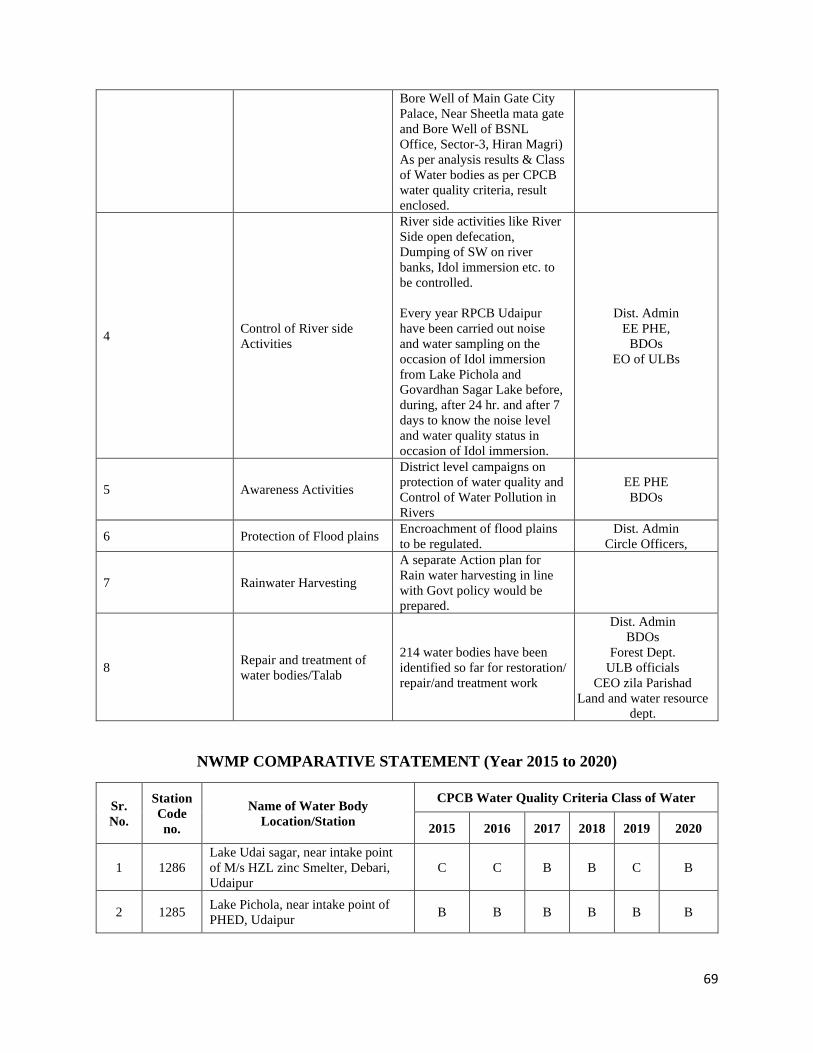
69
Bore Well of Main Gate City
Palace, Near Sheetla mata gate
and Bore Well of BSNL
Office, Sector-3, Hiran Magri)
As per analysis results & Class
of Water bodies as per CPCB
water quality criteria, result
enclosed.
4 Control of River side
Activities
River side activities like River
Side open defecation,
Dumping of SW on river
banks, Idol immersion etc. to
be controlled.
Every year RPCB Udaipur
have been carried out noise
and water sampling on the
occasion of Idol immersion
from Lake Pichola and
Govardhan Sagar Lake before,
during, after 24 hr. and after 7
days to know the noise level
and water quality status in
occasion of Idol immersion.
Dist. Admin
EE PHE,
BDOs
EO of ULBs
5 Awareness Activities
District level campaigns on
protection of water quality and
Control of Water Pollution in
Rivers
EE PHE
BDOs
6 Protection of Flood plains Encroachment of flood plains
to be regulated. Dist. Admin
Circle Officers,
7 Rainwater Harvesting
A separate Action plan for
Rain water harvesting in line
with Govt policy would be
prepared.
8 Repair and treatment of
water bodies/Talab
214 water bodies have been
identified so far for restoration/
repair/and treatment work
Dist. Admin
BDOs
Forest Dept.
ULB officials
CEO zila Parishad
Land and water resource
dept.
NWMP COMPARATIVE STATEMENT (Year 2015 to 2020)
Sr.
No.
Station
Code
no.
Name of Water Body
Location/Station
CPCB Water Quality Criteria Class of Water
2015 2016 2017 2018 2019 2020
1 1286
Lake Udai sagar, near intake point
of M/s HZL zinc Smelter, Debari,
Udaipur
C C B B C B
2 1285 Lake Pichola, near intake point of
PHED, Udaipur B B B B B B
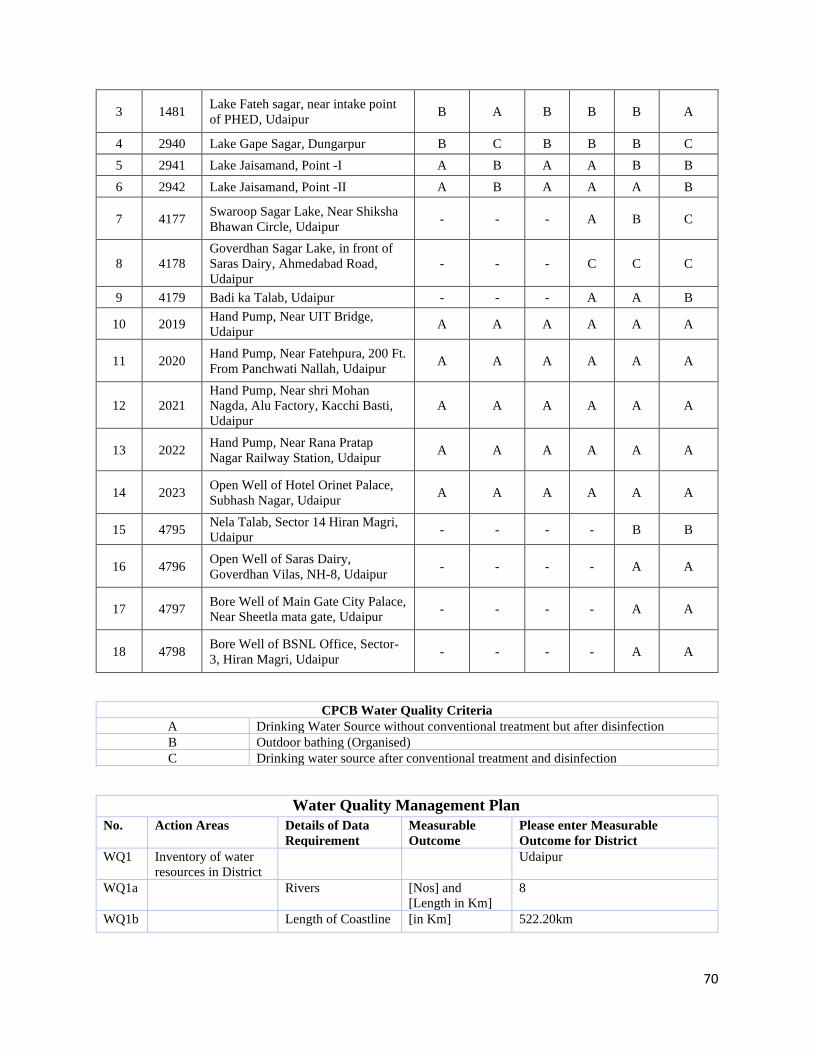
70
3 1481 Lake Fateh sagar, near intake point
of PHED, Udaipur B A B B B A
4 2940 Lake Gape Sagar, Dungarpur B C B B B C
5 2941 Lake Jaisamand, Point -I A B A A B B
6 2942 Lake Jaisamand, Point -II A B A A A B
7 4177 Swaroop Sagar Lake, Near Shiksha
Bhawan Circle, Udaipur - - - A B C
8 4178
Goverdhan Sagar Lake, in front of
Saras Dairy, Ahmedabad Road,
Udaipur
- - - C C C
9 4179 Badi ka Talab, Udaipur - - - A A B
10 2019 Hand Pump, Near UIT Bridge,
Udaipur A A A A A A
11 2020 Hand Pump, Near Fatehpura, 200 Ft.
From Panchwati Nallah, Udaipur A A A A A A
12 2021
Hand Pump, Near shri Mohan
Nagda, Alu Factory, Kacchi Basti,
Udaipur
A A A A A A
13 2022 Hand Pump, Near Rana Pratap
Nagar Railway Station, Udaipur A A A A A A
14 2023 Open Well of Hotel Orinet Palace,
Subhash Nagar, Udaipur A A A A A A
15 4795 Nela Talab, Sector 14 Hiran Magri,
Udaipur - - - - B B
16 4796 Open Well of Saras Dairy,
Goverdhan Vilas, NH-8, Udaipur - - - - A A
17 4797 Bore Well of Main Gate City Palace,
Near Sheetla mata gate, Udaipur - - - - A A
18 4798 Bore Well of BSNL Office, Sector-
3, Hiran Magri, Udaipur - - - - A A
CPCB Water Quality Criteria
A Drinking Water Source without conventional treatment but after disinfection
B Outdoor bathing (Organised)
C Drinking water source after conventional treatment and disinfection
Water Quality Management Plan
No. Action Areas Details of Data
Requirement
Measurable
Outcome
Please enter Measurable
Outcome for District
WQ1 Inventory of water
resources in District
Udaipur
WQ1a Rivers [Nos] and
[Length in Km]
8
WQ1b Length of Coastline [in Km] 522.20km
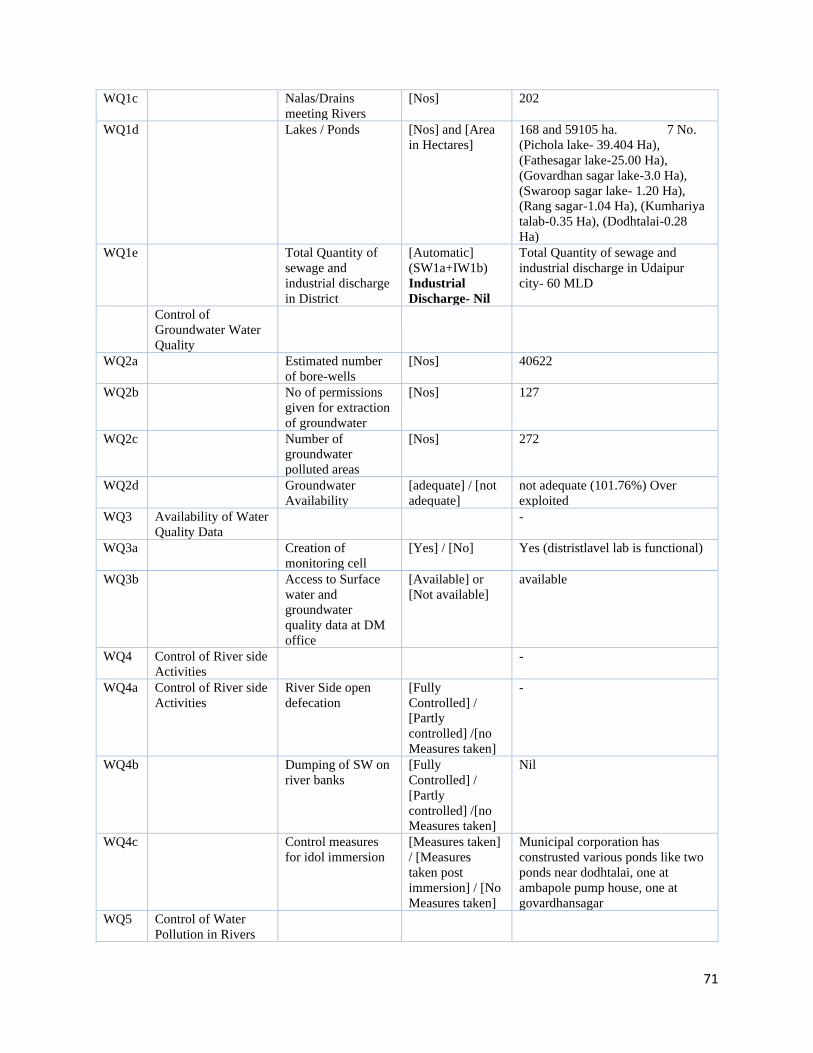
71
WQ1c Nalas/Drains
meeting Rivers
[Nos] 202
WQ1d Lakes / Ponds [Nos] and [Area
in Hectares]
168 and 59105 ha. 7 No.
(Pichola lake- 39.404 Ha),
(Fathesagar lake-25.00 Ha),
(Govardhan sagar lake-3.0 Ha),
(Swaroop sagar lake- 1.20 Ha),
(Rang sagar-1.04 Ha), (Kumhariya
talab-0.35 Ha), (Dodhtalai-0.28
Ha)
WQ1e Total Quantity of
sewage and
industrial discharge
in District
[Automatic]
(SW1a+IW1b)
Industrial
Discharge- Nil
Total Quantity of sewage and
industrial discharge in Udaipur
city- 60 MLD
Control of
Groundwater Water
Quality
WQ2a Estimated number
of bore-wells
[Nos] 40622
WQ2b No of permissions
given for extraction
of groundwater
[Nos] 127
WQ2c Number of
groundwater
polluted areas
[Nos] 272
WQ2d Groundwater
Availability
[adequate] / [not
adequate]
not adequate (101.76%) Over
exploited
WQ3 Availability of Water
Quality Data
-
WQ3a Creation of
monitoring cell
[Yes] / [No] Yes (distristlavel lab is functional)
WQ3b Access to Surface
water and
groundwater
quality data at DM
office
[Available] or
[Not available]
available
WQ4 Control of River side
Activities
-
WQ4a Control of River side
Activities
River Side open
defecation
[Fully
Controlled] /
[Partly
controlled] /[no
Measures taken]
-
WQ4b Dumping of SW on
river banks
[Fully
Controlled] /
[Partly
controlled] /[no
Measures taken]
Nil
WQ4c Control measures
for idol immersion
[Measures taken]
/ [Measures
taken post
immersion] / [No
Measures taken]
Municipal corporation has
construsted various ponds like two
ponds near dodhtalai, one at
ambapole pump house, one at
govardhansagar
WQ5 Control of Water
Pollution in Rivers
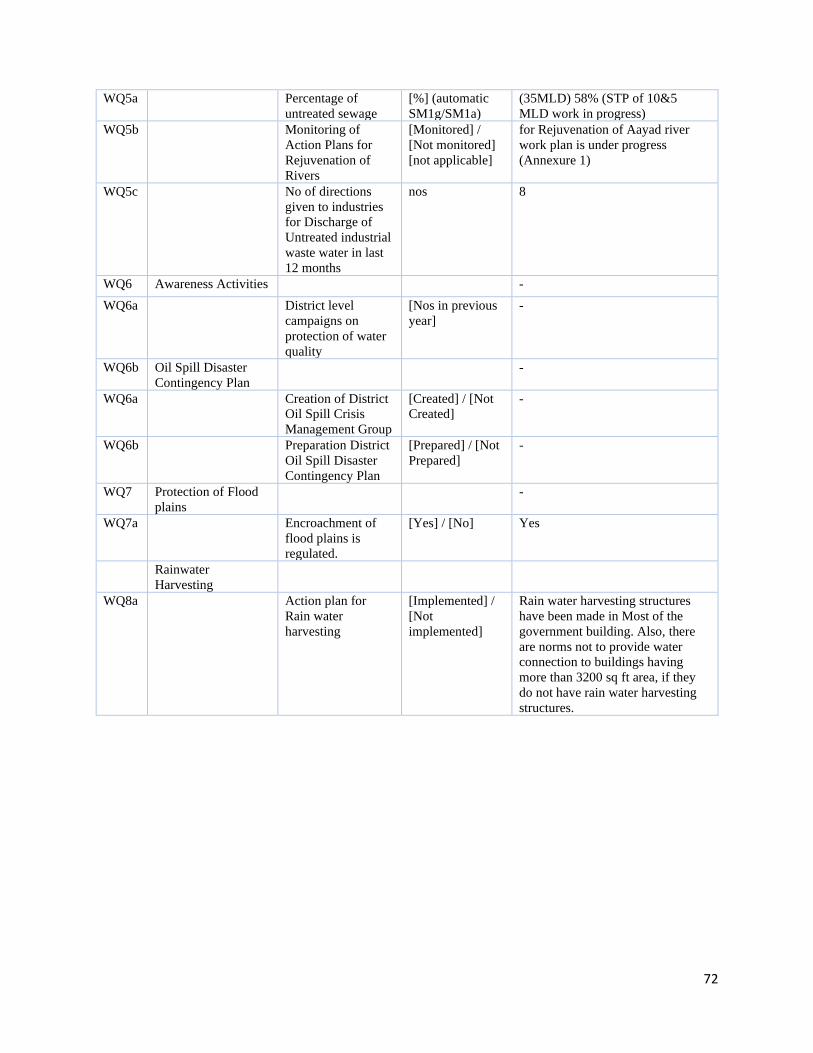
72
WQ5a Percentage of
untreated sewage
[%] (automatic
SM1g/SM1a)
(35MLD) 58% (STP of 10&5
MLD work in progress)
WQ5b Monitoring of
Action Plans for
Rejuvenation of
Rivers
[Monitored] /
[Not monitored]
[not applicable]
for Rejuvenation of Aayad river
work plan is under progress
(Annexure 1)
WQ5c No of directions
given to industries
for Discharge of
Untreated industrial
waste water in last
12 months
nos 8
WQ6 Awareness Activities -
WQ6a District level
campaigns on
protection of water
quality
[Nos in previous
year]
-
WQ6b Oil Spill Disaster
Contingency Plan
-
WQ6a Creation of District
Oil Spill Crisis
Management Group
[Created] / [Not
Created]
-
WQ6b Preparation District
Oil Spill Disaster
Contingency Plan
[Prepared] / [Not
Prepared]
-
WQ7 Protection of Flood
plains
-
WQ7a Encroachment of
flood plains is
regulated.
[Yes] / [No] Yes
Rainwater
Harvesting
WQ8a Action plan for
Rain water
harvesting
[Implemented] /
[Not
implemented]
Rain water harvesting structures
have been made in Most of the
government building. Also, there
are norms not to provide water
connection to buildings having
more than 3200 sq ft area, if they
do not have rain water harvesting
structures.
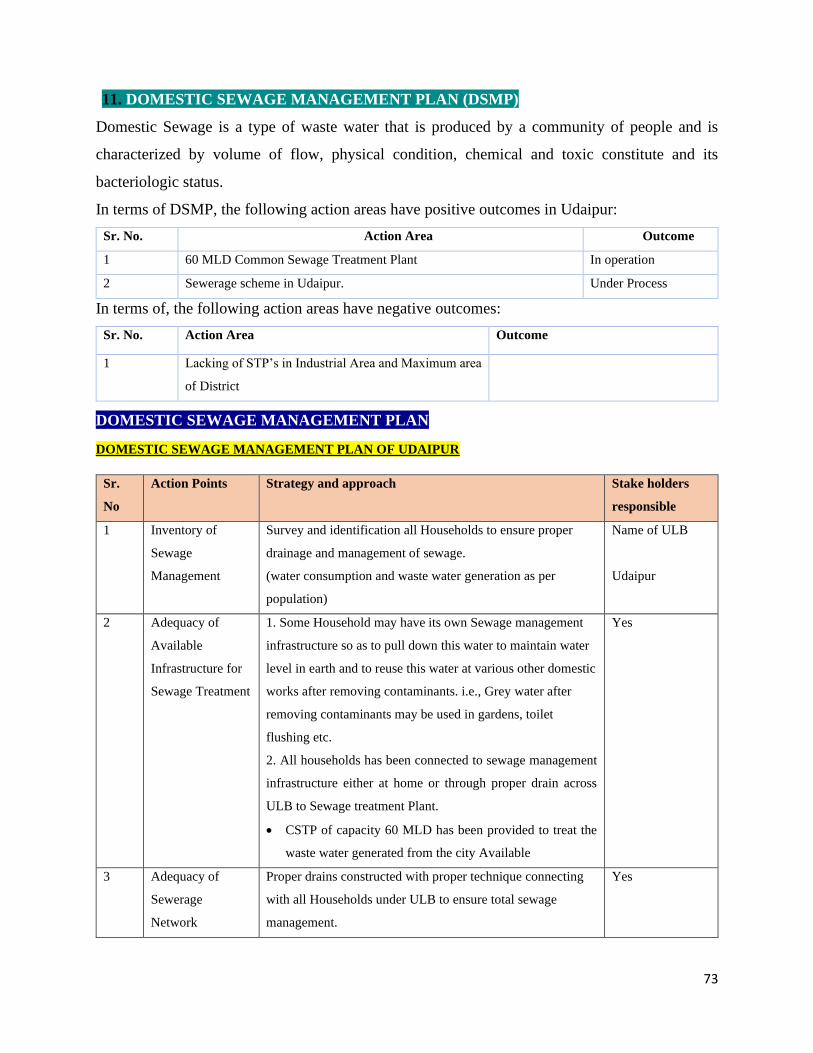
73
11. DOMESTIC SEWAGE MANAGEMENT PLAN (DSMP)
Domestic Sewage is a type of waste water that is produced by a community of people and is
characterized by volume of flow, physical condition, chemical and toxic constitute and its
bacteriologic status.
In terms of DSMP, the following action areas have positive outcomes in Udaipur:
Sr. No. Action Area Outcome
1 60 MLD Common Sewage Treatment Plant In operation
2 Sewerage scheme in Udaipur. Under Process
In terms of, the following action areas have negative outcomes:
Sr. No. Action Area Outcome
1 Lacking of STP’s in Industrial Area and Maximum area
of District
DOMESTIC SEWAGE MANAGEMENT PLAN
DOMESTIC SEWAGE MANAGEMENT PLAN OF UDAIPUR
Sr.
No
Action Points Strategy and approach Stake holders
responsible
1 Inventory of
Sewage
Management
Survey and identification all Households to ensure proper
drainage and management of sewage.
(water consumption and waste water generation as per
population)
Name of ULB
Udaipur
2 Adequacy of
Available
Infrastructure for
Sewage Treatment
1. Some Household may have its own Sewage management
infrastructure so as to pull down this water to maintain water
level in earth and to reuse this water at various other domestic
works after removing contaminants. i.e., Grey water after
removing contaminants may be used in gardens, toilet
flushing etc.
2. All households has been connected to sewage management
infrastructure either at home or through proper drain across
ULB to Sewage treatment Plant.
• CSTP of capacity 60 MLD has been provided to treat the
waste water generated from the city Available
Yes
3 Adequacy of
Sewerage
Network
Proper drains constructed with proper technique connecting
with all Households under ULB to ensure total sewage
management.
Yes
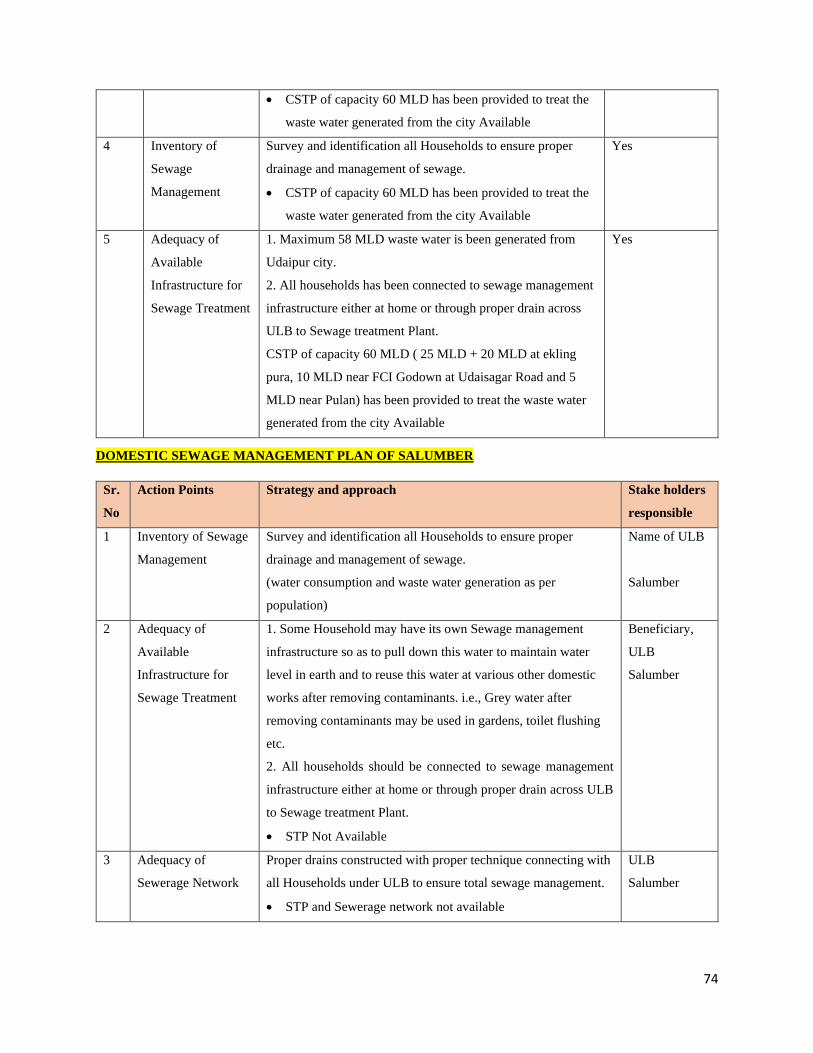
74
• CSTP of capacity 60 MLD has been provided to treat the
waste water generated from the city Available
4 Inventory of
Sewage
Management
Survey and identification all Households to ensure proper
drainage and management of sewage.
• CSTP of capacity 60 MLD has been provided to treat the
waste water generated from the city Available
Yes
5 Adequacy of
Available
Infrastructure for
Sewage Treatment
1. Maximum 58 MLD waste water is been generated from
Udaipur city.
2. All households has been connected to sewage management
infrastructure either at home or through proper drain across
ULB to Sewage treatment Plant.
CSTP of capacity 60 MLD ( 25 MLD + 20 MLD at ekling
pura, 10 MLD near FCI Godown at Udaisagar Road and 5
MLD near Pulan) has been provided to treat the waste water
generated from the city Available
Yes
DOMESTIC SEWAGE MANAGEMENT PLAN OF SALUMBER
Sr.
No
Action Points Strategy and approach Stake holders
responsible
1 Inventory of Sewage
Management
Survey and identification all Households to ensure proper
drainage and management of sewage.
(water consumption and waste water generation as per
population)
Name of ULB
Salumber
2 Adequacy of
Available
Infrastructure for
Sewage Treatment
1. Some Household may have its own Sewage management
infrastructure so as to pull down this water to maintain water
level in earth and to reuse this water at various other domestic
works after removing contaminants. i.e., Grey water after
removing contaminants may be used in gardens, toilet flushing
etc.
2. All households should be connected to sewage management
infrastructure either at home or through proper drain across ULB
to Sewage treatment Plant.
• STP Not Available
Beneficiary,
ULB
Salumber
3 Adequacy of
Sewerage Network
Proper drains constructed with proper technique connecting with
all Households under ULB to ensure total sewage management.
• STP and Sewerage network not available
ULB
Salumber
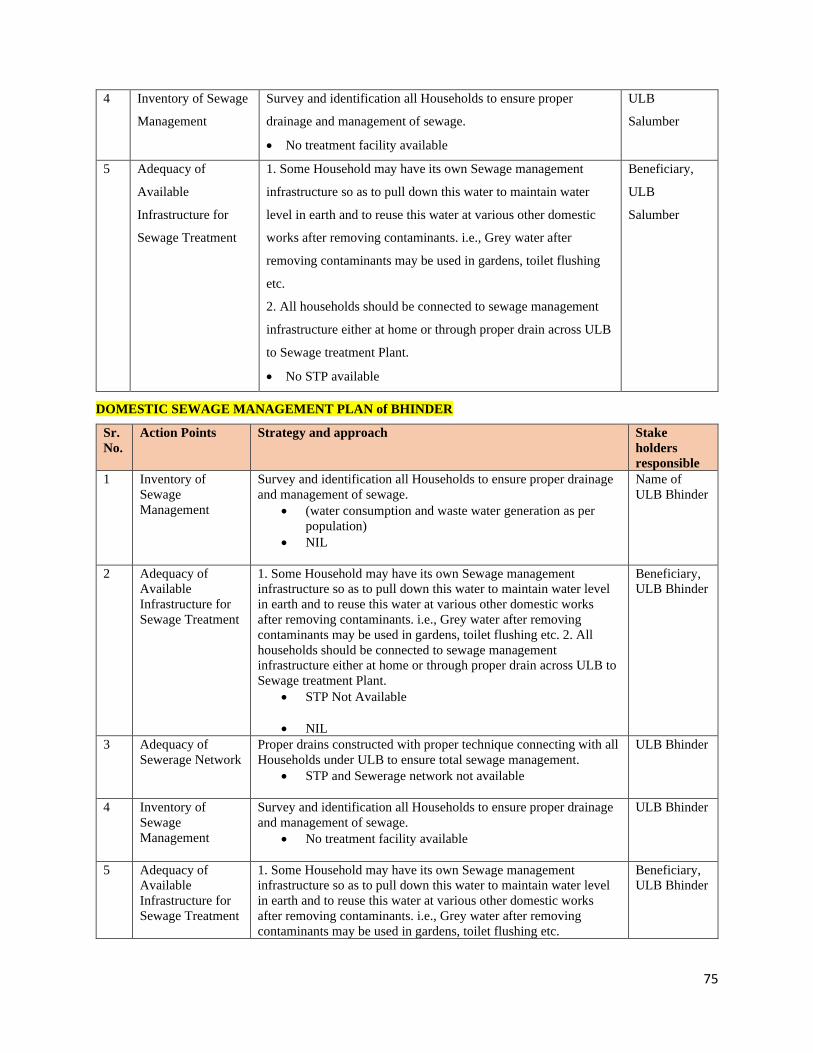
75
4 Inventory of Sewage
Management
Survey and identification all Households to ensure proper
drainage and management of sewage.
• No treatment facility available
ULB
Salumber
5 Adequacy of
Available
Infrastructure for
Sewage Treatment
1. Some Household may have its own Sewage management
infrastructure so as to pull down this water to maintain water
level in earth and to reuse this water at various other domestic
works after removing contaminants. i.e., Grey water after
removing contaminants may be used in gardens, toilet flushing
etc.
2. All households should be connected to sewage management
infrastructure either at home or through proper drain across ULB
to Sewage treatment Plant.
• No STP available
Beneficiary,
ULB
Salumber
DOMESTIC SEWAGE MANAGEMENT PLAN of BHINDER
Sr.
No.
Action Points Strategy and approach Stake
holders
responsible
1 Inventory of
Sewage
Management
Survey and identification all Households to ensure proper drainage
and management of sewage.
• (water consumption and waste water generation as per
population)
• NIL
Name of
ULB Bhinder
2 Adequacy of
Available
Infrastructure for
Sewage Treatment
1. Some Household may have its own Sewage management
infrastructure so as to pull down this water to maintain water level
in earth and to reuse this water at various other domestic works
after removing contaminants. i.e., Grey water after removing
contaminants may be used in gardens, toilet flushing etc. 2. All
households should be connected to sewage management
infrastructure either at home or through proper drain across ULB to
Sewage treatment Plant.
• STP Not Available
• NIL
Beneficiary,
ULB Bhinder
3 Adequacy of
Sewerage Network
Proper drains constructed with proper technique connecting with all
Households under ULB to ensure total sewage management.
• STP and Sewerage network not available
ULB Bhinder
4 Inventory of
Sewage
Management
Survey and identification all Households to ensure proper drainage
and management of sewage.
• No treatment facility available
ULB Bhinder
5 Adequacy of
Available
Infrastructure for
Sewage Treatment
1. Some Household may have its own Sewage management
infrastructure so as to pull down this water to maintain water level
in earth and to reuse this water at various other domestic works
after removing contaminants. i.e., Grey water after removing
contaminants may be used in gardens, toilet flushing etc.
Beneficiary,
ULB Bhinder
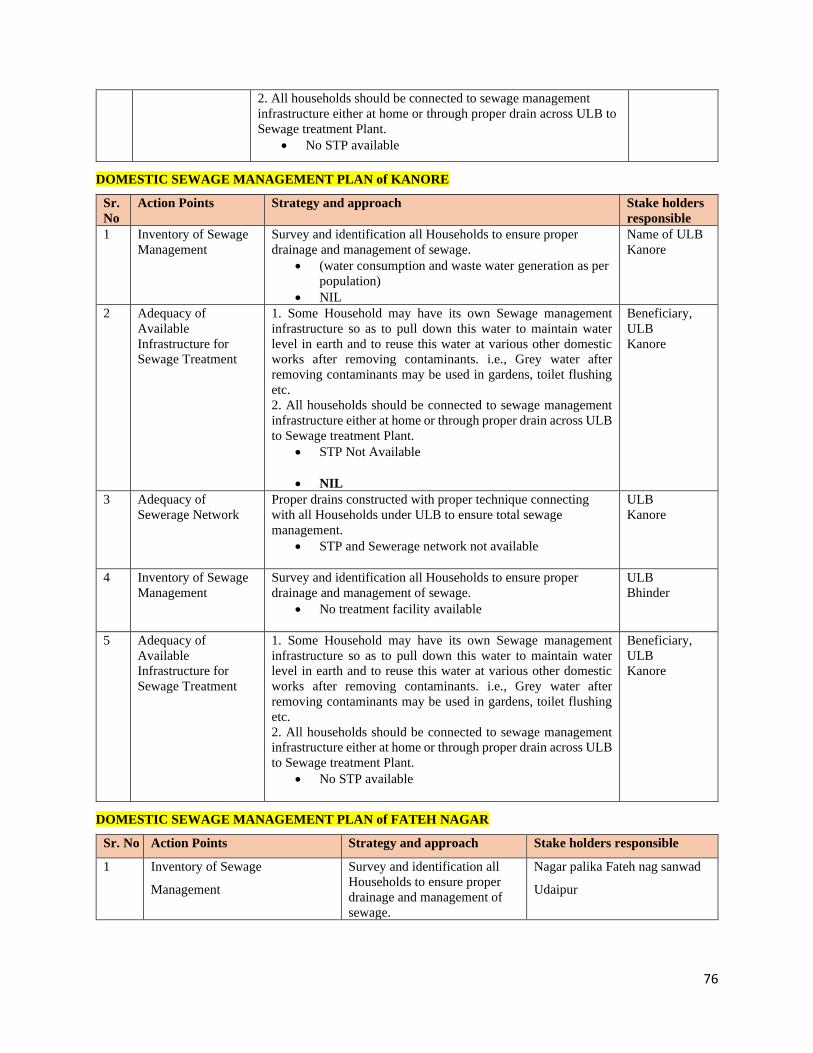
76
2. All households should be connected to sewage management
infrastructure either at home or through proper drain across ULB to
Sewage treatment Plant.
• No STP available
DOMESTIC SEWAGE MANAGEMENT PLAN of KANORE
Sr.
No
Action Points Strategy and approach Stake holders
responsible
1 Inventory of Sewage
Management
Survey and identification all Households to ensure proper
drainage and management of sewage.
• (water consumption and waste water generation as per
population)
• NIL
Name of ULB
Kanore
2 Adequacy of
Available
Infrastructure for
Sewage Treatment
1. Some Household may have its own Sewage management
infrastructure so as to pull down this water to maintain water
level in earth and to reuse this water at various other domestic
works after removing contaminants. i.e., Grey water after
removing contaminants may be used in gardens, toilet flushing
etc.
2. All households should be connected to sewage management
infrastructure either at home or through proper drain across ULB
to Sewage treatment Plant.
• STP Not Available
• NIL
Beneficiary,
ULB
Kanore
3 Adequacy of
Sewerage Network
Proper drains constructed with proper technique connecting
with all Households under ULB to ensure total sewage
management.
• STP and Sewerage network not available
ULB
Kanore
4 Inventory of Sewage
Management
Survey and identification all Households to ensure proper
drainage and management of sewage.
• No treatment facility available
ULB
Bhinder
5 Adequacy of
Available
Infrastructure for
Sewage Treatment
1. Some Household may have its own Sewage management
infrastructure so as to pull down this water to maintain water
level in earth and to reuse this water at various other domestic
works after removing contaminants. i.e., Grey water after
removing contaminants may be used in gardens, toilet flushing
etc.
2. All households should be connected to sewage management
infrastructure either at home or through proper drain across ULB
to Sewage treatment Plant.
• No STP available
Beneficiary,
ULB
Kanore
DOMESTIC SEWAGE MANAGEMENT PLAN of FATEH NAGAR
Sr. No Action Points Strategy and approach Stake holders responsible
1 Inventory of Sewage
Management
Survey and identification all
Households to ensure proper
drainage and management of
sewage.
Nagar palika Fateh nag sanwad
Udaipur
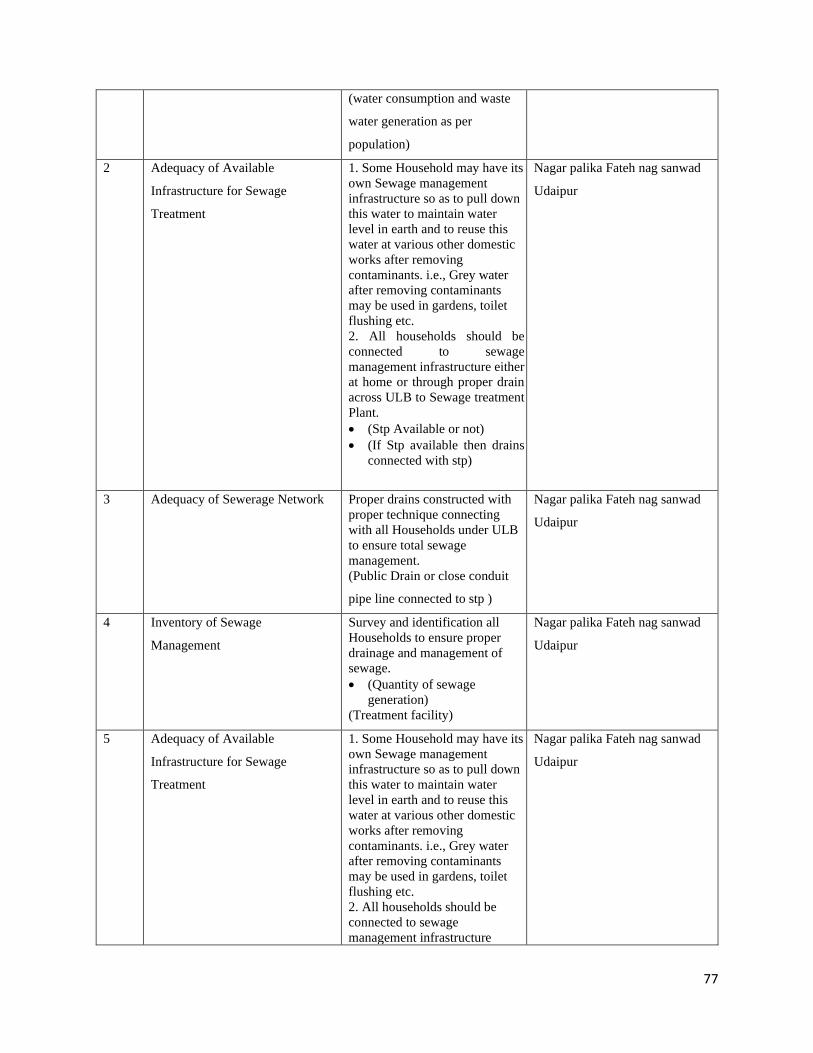
77
(water consumption and waste
water generation as per
population)
2 Adequacy of Available
Infrastructure for Sewage
Treatment
1. Some Household may have its
own Sewage management
infrastructure so as to pull down
this water to maintain water
level in earth and to reuse this
water at various other domestic
works after removing
contaminants. i.e., Grey water
after removing contaminants
may be used in gardens, toilet
flushing etc.
2. All households should be
connected to sewage
management infrastructure either
at home or through proper drain
across ULB to Sewage treatment
Plant.
• (Stp Available or not)
• (If Stp available then drains
connected with stp)
Nagar palika Fateh nag sanwad
Udaipur
3 Adequacy of Sewerage Network Proper drains constructed with
proper technique connecting
with all Households under ULB
to ensure total sewage
management.
(Public Drain or close conduit
pipe line connected to stp )
Nagar palika Fateh nag sanwad
Udaipur
4 Inventory of Sewage
Management
Survey and identification all
Households to ensure proper
drainage and management of
sewage.
• (Quantity of sewage
generation)
(Treatment facility)
Nagar palika Fateh nag sanwad
Udaipur
5 Adequacy of Available
Infrastructure for Sewage
Treatment
1. Some Household may have its
own Sewage management
infrastructure so as to pull down
this water to maintain water
level in earth and to reuse this
water at various other domestic
works after removing
contaminants. i.e., Grey water
after removing contaminants
may be used in gardens, toilet
flushing etc.
2. All households should be
connected to sewage
management infrastructure
Nagar palika Fateh nag sanwad
Udaipur
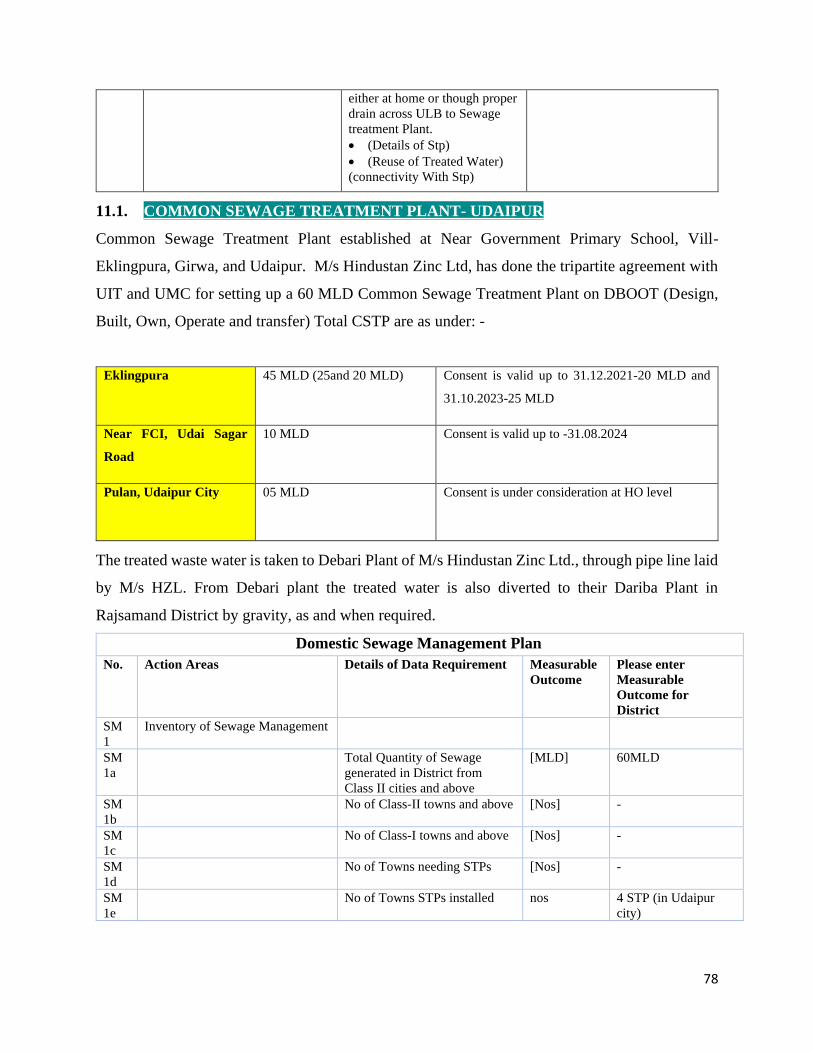
78
either at home or though proper
drain across ULB to Sewage
treatment Plant.
• (Details of Stp)
• (Reuse of Treated Water)
(connectivity With Stp)
11.1. COMMON SEWAGE TREATMENT PLANT- UDAIPUR
Common Sewage Treatment Plant established at Near Government Primary School, Vill-
Eklingpura, Girwa, and Udaipur. M/s Hindustan Zinc Ltd, has done the tripartite agreement with
UIT and UMC for setting up a 60 MLD Common Sewage Treatment Plant on DBOOT (Design,
Built, Own, Operate and transfer) Total CSTP are as under: -
Eklingpura 45 MLD (25and 20 MLD) Consent is valid up to 31.12.2021-20 MLD and
31.10.2023-25 MLD
Near FCI, Udai Sagar
Road
10 MLD Consent is valid up to -31.08.2024
Pulan, Udaipur City 05 MLD Consent is under consideration at HO level
The treated waste water is taken to Debari Plant of M/s Hindustan Zinc Ltd., through pipe line laid
by M/s HZL. From Debari plant the treated water is also diverted to their Dariba Plant in
Rajsamand District by gravity, as and when required.
Domestic Sewage Management Plan
No. Action Areas Details of Data Requirement Measurable
Outcome
Please enter
Measurable
Outcome for
District
SM
1
Inventory of Sewage Management
SM
1a
Total Quantity of Sewage
generated in District from
Class II cities and above
[MLD] 60MLD
SM
1b
No of Class-II towns and above [Nos] -
SM
1c
No of Class-I towns and above [Nos] -
SM
1d
No of Towns needing STPs [Nos] -
SM
1e
No of Towns STPs installed nos 4 STP (in Udaipur
city)
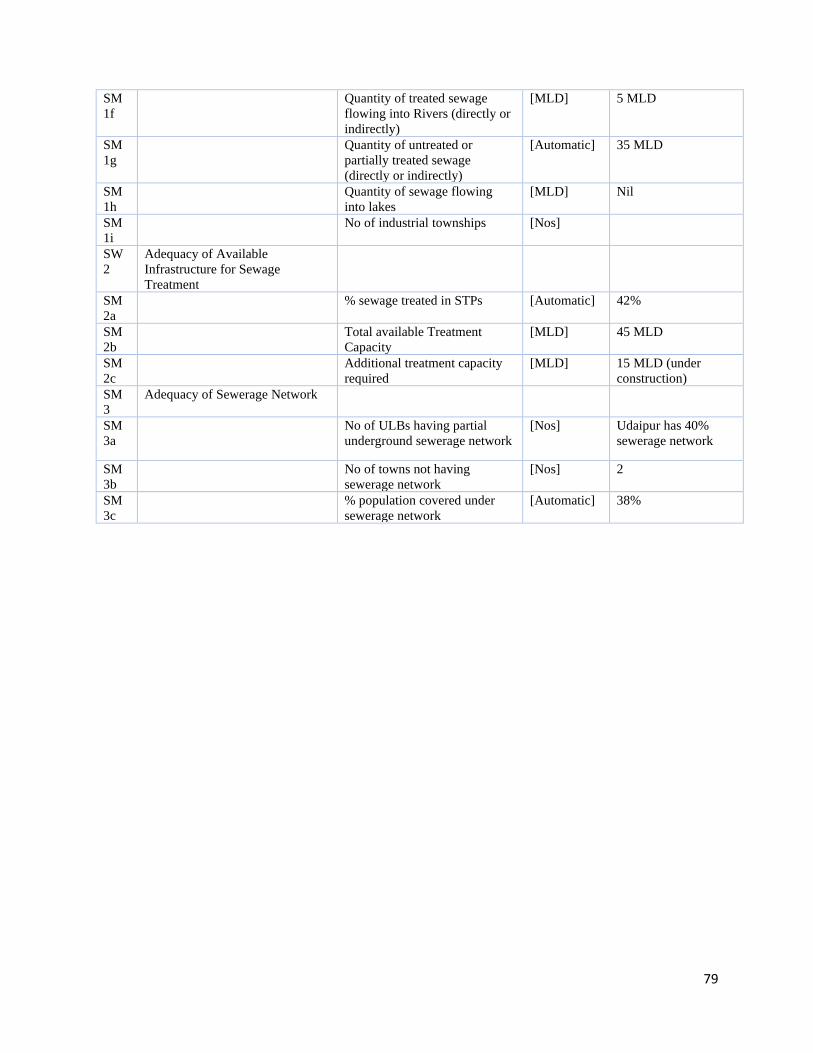
79
SM
1f
Quantity of treated sewage
flowing into Rivers (directly or
indirectly)
[MLD] 5 MLD
SM
1g
Quantity of untreated or
partially treated sewage
(directly or indirectly)
[Automatic] 35 MLD
SM
1h
Quantity of sewage flowing
into lakes
[MLD] Nil
SM
1i
No of industrial townships [Nos]
SW
2
Adequacy of Available
Infrastructure for Sewage
Treatment
SM
2a
% sewage treated in STPs [Automatic] 42%
SM
2b
Total available Treatment
Capacity
[MLD] 45 MLD
SM
2c
Additional treatment capacity
required
[MLD] 15 MLD (under
construction)
SM
3
Adequacy of Sewerage Network
SM
3a
No of ULBs having partial
underground sewerage network
[Nos] Udaipur has 40%
sewerage network
SM
3b
No of towns not having
sewerage network
[Nos] 2
SM
3c
% population covered under
sewerage network
[Automatic] 38%
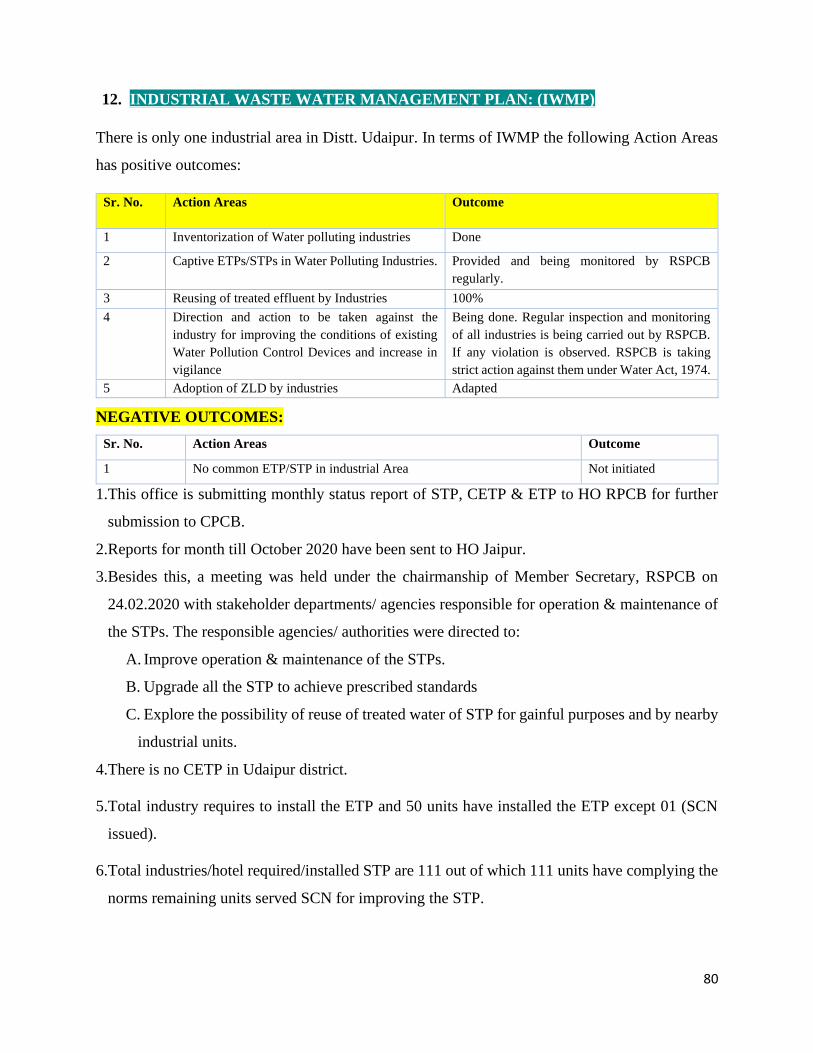
80
12. INDUSTRIAL WASTE WATER MANAGEMENT PLAN: (IWMP)
There is only one industrial area in Distt. Udaipur. In terms of IWMP the following Action Areas
has positive outcomes:
Sr. No. Action Areas Outcome
1 Inventorization of Water polluting industries Done
2 Captive ETPs/STPs in Water Polluting Industries. Provided and being monitored by RSPCB
regularly.
3 Reusing of treated effluent by Industries 100%
4 Direction and action to be taken against the
industry for improving the conditions of existing
Water Pollution Control Devices and increase in
vigilance
Being done. Regular inspection and monitoring
of all industries is being carried out by RSPCB.
If any violation is observed. RSPCB is taking
strict action against them under Water Act, 1974.
5 Adoption of ZLD by industries Adapted
NEGATIVE OUTCOMES:
Sr. No. Action Areas Outcome
1 No common ETP/STP in industrial Area Not initiated
1.This office is submitting monthly status report of STP, CETP & ETP to HO RPCB for further
submission to CPCB.
2.Reports for month till October 2020 have been sent to HO Jaipur.
3.Besides this, a meeting was held under the chairmanship of Member Secretary, RSPCB on
24.02.2020 with stakeholder departments/ agencies responsible for operation & maintenance of
the STPs. The responsible agencies/ authorities were directed to:
A. Improve operation & maintenance of the STPs.
B. Upgrade all the STP to achieve prescribed standards
C. Explore the possibility of reuse of treated water of STP for gainful purposes and by nearby
industrial units.
4.There is no CETP in Udaipur district.
5.Total industry requires to install the ETP and 50 units have installed the ETP except 01 (SCN
issued).
6.Total industries/hotel required/installed STP are 111 out of which 111 units have complying the
norms remaining units served SCN for improving the STP.
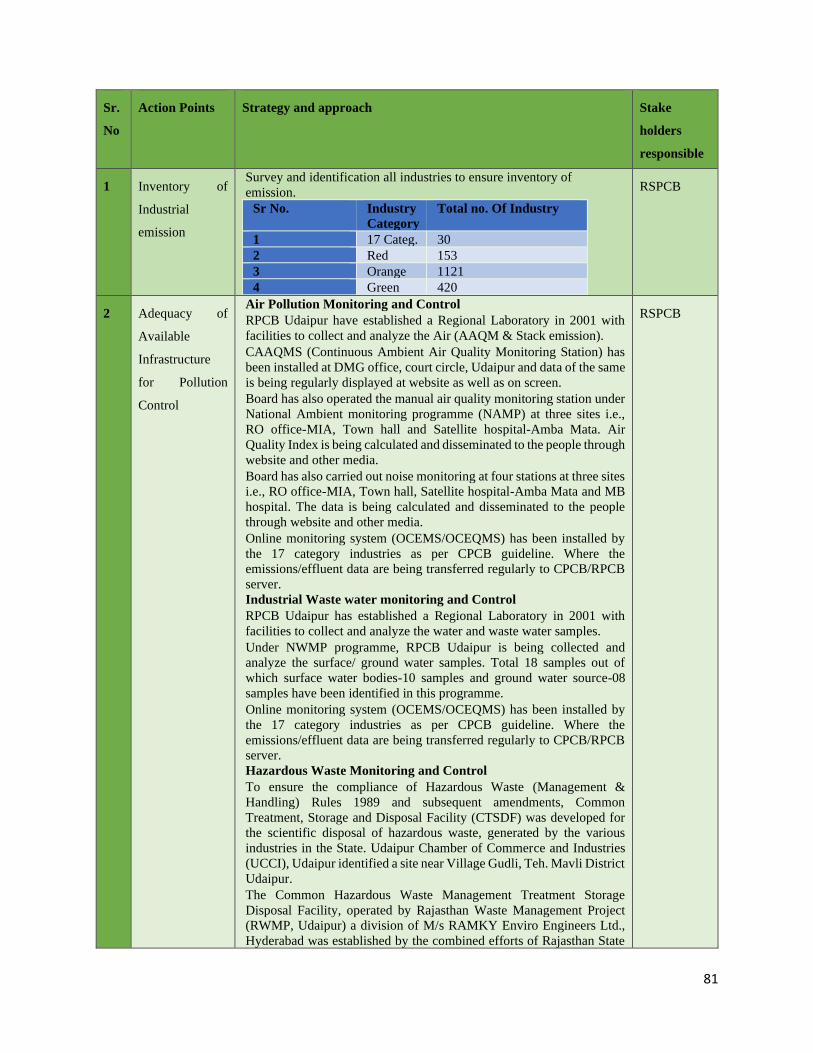
81
Sr.
No
Action Points Strategy and approach Stake
holders
responsible
1 Inventory of
Industrial
emission
Survey and identification all industries to ensure inventory of
emission.
Sr No. Industry
Category
Total no. Of Industry
1 17 Categ. 30
2 Red 153
3 Orange 1121
4 Green 420
RSPCB
2 Adequacy of
Available
Infrastructure
for Pollution
Control
1. Air Pollution Monitoring and Control
• RPCB Udaipur have established a Regional Laboratory in 2001 with
facilities to collect and analyze the Air (AAQM & Stack emission).
• CAAQMS (Continuous Ambient Air Quality Monitoring Station) has
been installed at DMG office, court circle, Udaipur and data of the same
is being regularly displayed at website as well as on screen.
• Board has also operated the manual air quality monitoring station under
National Ambient monitoring programme (NAMP) at three sites i.e.,
RO office-MIA, Town hall and Satellite hospital-Amba Mata. Air
Quality Index is being calculated and disseminated to the people through
website and other media.
• Board has also carried out noise monitoring at four stations at three sites
i.e., RO office-MIA, Town hall, Satellite hospital-Amba Mata and MB
hospital. The data is being calculated and disseminated to the people
through website and other media.
• Online monitoring system (OCEMS/OCEQMS) has been installed by
the 17 category industries as per CPCB guideline. Where the
emissions/effluent data are being transferred regularly to CPCB/RPCB
server.
2. Industrial Waste water monitoring and Control
• RPCB Udaipur has established a Regional Laboratory in 2001 with
facilities to collect and analyze the water and waste water samples.
• Under NWMP programme, RPCB Udaipur is being collected and
analyze the surface/ ground water samples. Total 18 samples out of
which surface water bodies-10 samples and ground water source-08
samples have been identified in this programme.
• Online monitoring system (OCEMS/OCEQMS) has been installed by
the 17 category industries as per CPCB guideline. Where the
emissions/effluent data are being transferred regularly to CPCB/RPCB
server.
3. Hazardous Waste Monitoring and Control
• To ensure the compliance of Hazardous Waste (Management &
Handling) Rules 1989 and subsequent amendments, Common
Treatment, Storage and Disposal Facility (CTSDF) was developed for
the scientific disposal of hazardous waste, generated by the various
industries in the State. Udaipur Chamber of Commerce and Industries
(UCCI), Udaipur identified a site near Village Gudli, Teh. Mavli District
Udaipur.
• The Common Hazardous Waste Management Treatment Storage
Disposal Facility, operated by Rajasthan Waste Management Project
(RWMP, Udaipur) a division of M/s RAMKY Enviro Engineers Ltd.,
Hyderabad was established by the combined efforts of Rajasthan State
RSPCB
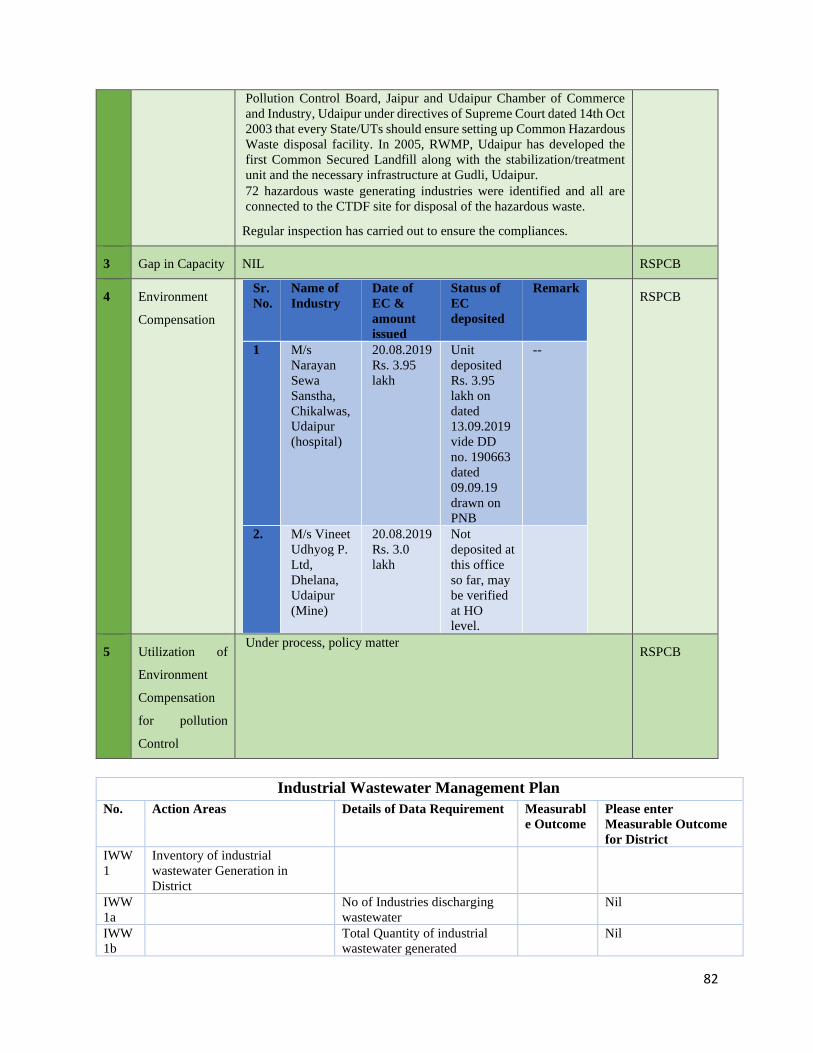
82
Pollution Control Board, Jaipur and Udaipur Chamber of Commerce
and Industry, Udaipur under directives of Supreme Court dated 14th Oct
2003 that every State/UTs should ensure setting up Common Hazardous
Waste disposal facility. In 2005, RWMP, Udaipur has developed the
first Common Secured Landfill along with the stabilization/treatment
unit and the necessary infrastructure at Gudli, Udaipur.
• 72 hazardous waste generating industries were identified and all are
connected to the CTDF site for disposal of the hazardous waste.
Regular inspection has carried out to ensure the compliances.
3 Gap in Capacity NIL RSPCB
4 Environment
Compensation
Sr.
No.
Name of
Industry
Date of
EC &
amount
issued
Status of
EC
deposited
Remark
1 M/s
Narayan
Sewa
Sanstha,
Chikalwas,
Udaipur
(hospital)
20.08.2019
Rs. 3.95
lakh
Unit
deposited
Rs. 3.95
lakh on
dated
13.09.2019
vide DD
no. 190663
dated
09.09.19
drawn on
PNB
--
2. M/s Vineet
Udhyog P.
Ltd,
Dhelana,
Udaipur
(Mine)
20.08.2019
Rs. 3.0
lakh
Not
deposited at
this office
so far, may
be verified
at HO
level.
RSPCB
5 Utilization of
Environment
Compensation
for pollution
Control
Under process, policy matter RSPCB
Industrial Wastewater Management Plan
No. Action Areas Details of Data Requirement Measurabl
e Outcome
Please enter
Measurable Outcome
for District
IWW
1
Inventory of industrial
wastewater Generation in
District
IWW
1a
No of Industries discharging
wastewater
Nil
IWW
1b
Total Quantity of industrial
wastewater generated
Nil
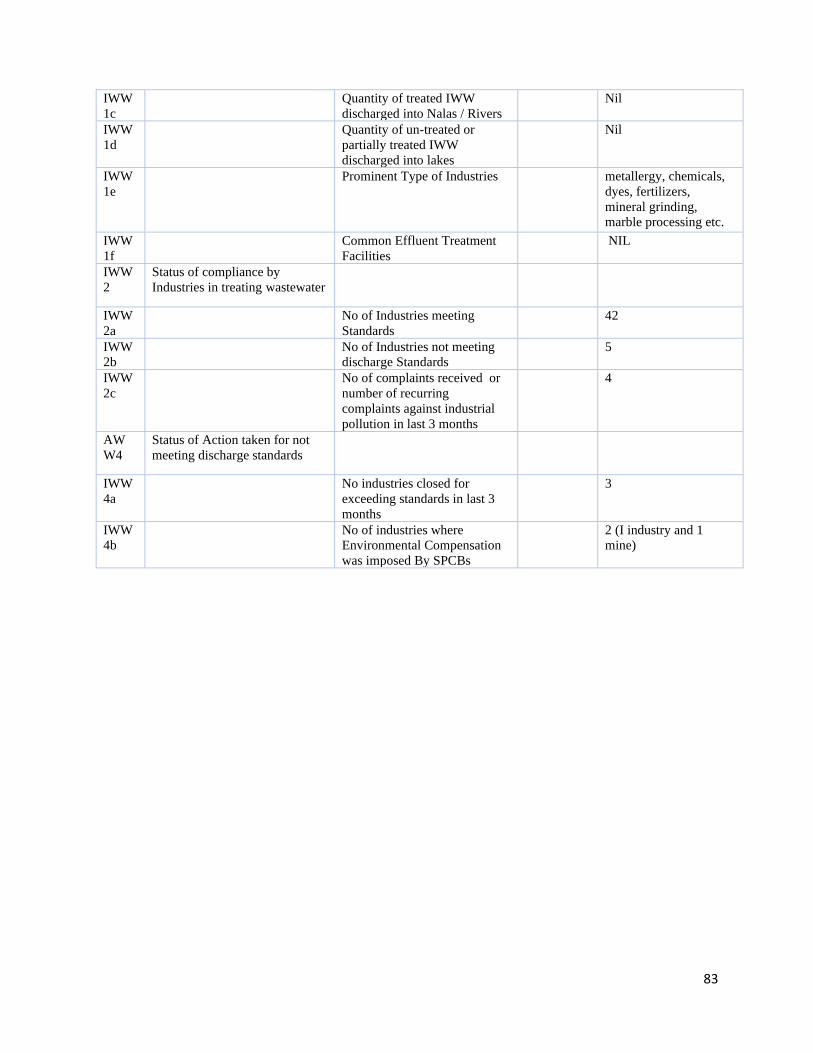
83
IWW
1c
Quantity of treated IWW
discharged into Nalas / Rivers
Nil
IWW
1d
Quantity of un-treated or
partially treated IWW
discharged into lakes
Nil
IWW
1e
Prominent Type of Industries metallergy, chemicals,
dyes, fertilizers,
mineral grinding,
marble processing etc.
IWW
1f
Common Effluent Treatment
Facilities
NIL
IWW
2
Status of compliance by
Industries in treating wastewater
IWW
2a
No of Industries meeting
Standards
42
IWW
2b
No of Industries not meeting
discharge Standards
5
IWW
2c
No of complaints received or
number of recurring
complaints against industrial
pollution in last 3 months
4
AW
W4
Status of Action taken for not
meeting discharge standards
IWW
4a
No industries closed for
exceeding standards in last 3
months
3
IWW
4b
No of industries where
Environmental Compensation
was imposed By SPCBs
2 (I industry and 1
mine)
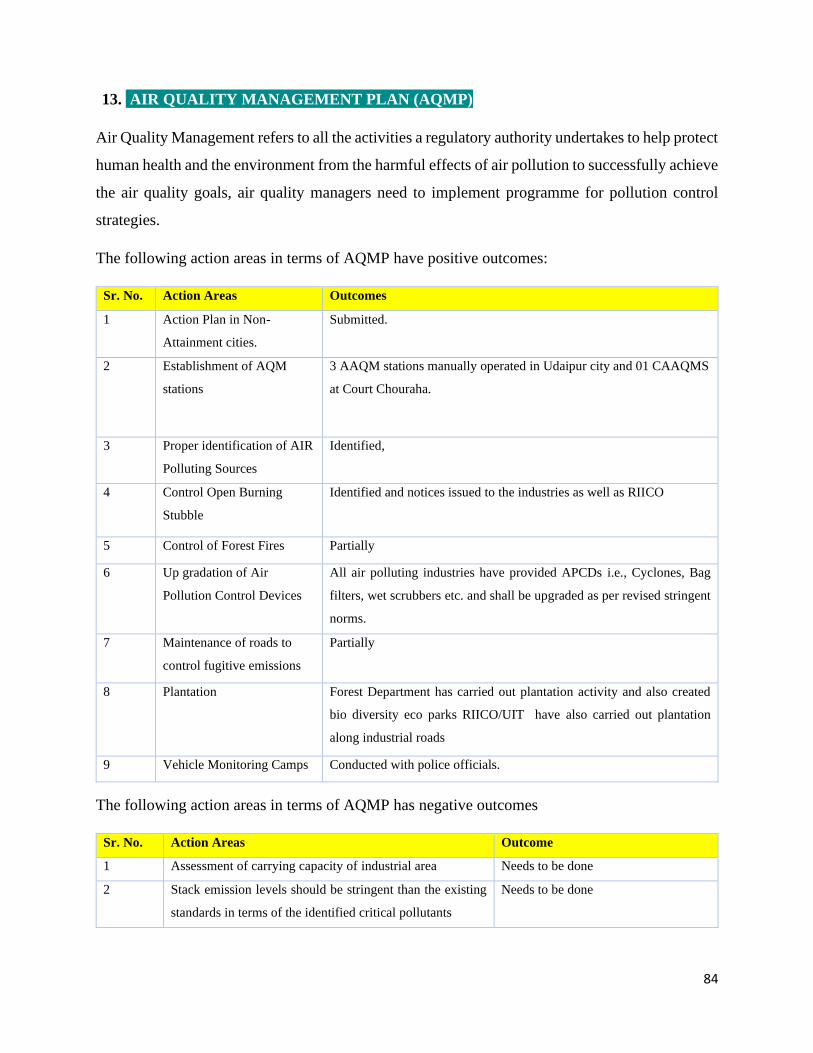
84
13. AIR QUALITY MANAGEMENT PLAN (AQMP)
Air Quality Management refers to all the activities a regulatory authority undertakes to help protect
human health and the environment from the harmful effects of air pollution to successfully achieve
the air quality goals, air quality managers need to implement programme for pollution control
strategies.
The following action areas in terms of AQMP have positive outcomes:
Sr. No. Action Areas Outcomes
1 Action Plan in Non-
Attainment cities.
Submitted.
2 Establishment of AQM
stations
3 AAQM stations manually operated in Udaipur city and 01 CAAQMS
at Court Chouraha.
3 Proper identification of AIR
Polluting Sources
Identified,
4 Control Open Burning
Stubble
Identified and notices issued to the industries as well as RIICO
5 Control of Forest Fires Partially
6 Up gradation of Air
Pollution Control Devices
All air polluting industries have provided APCDs i.e., Cyclones, Bag
filters, wet scrubbers etc. and shall be upgraded as per revised stringent
norms.
7 Maintenance of roads to
control fugitive emissions
Partially
8 Plantation Forest Department has carried out plantation activity and also created
bio diversity eco parks RIICO/UIT have also carried out plantation
along industrial roads
9 Vehicle Monitoring Camps Conducted with police officials.
The following action areas in terms of AQMP has negative outcomes
Sr. No. Action Areas Outcome
1 Assessment of carrying capacity of industrial area Needs to be done
2 Stack emission levels should be stringent than the existing
standards in terms of the identified critical pollutants
Needs to be done
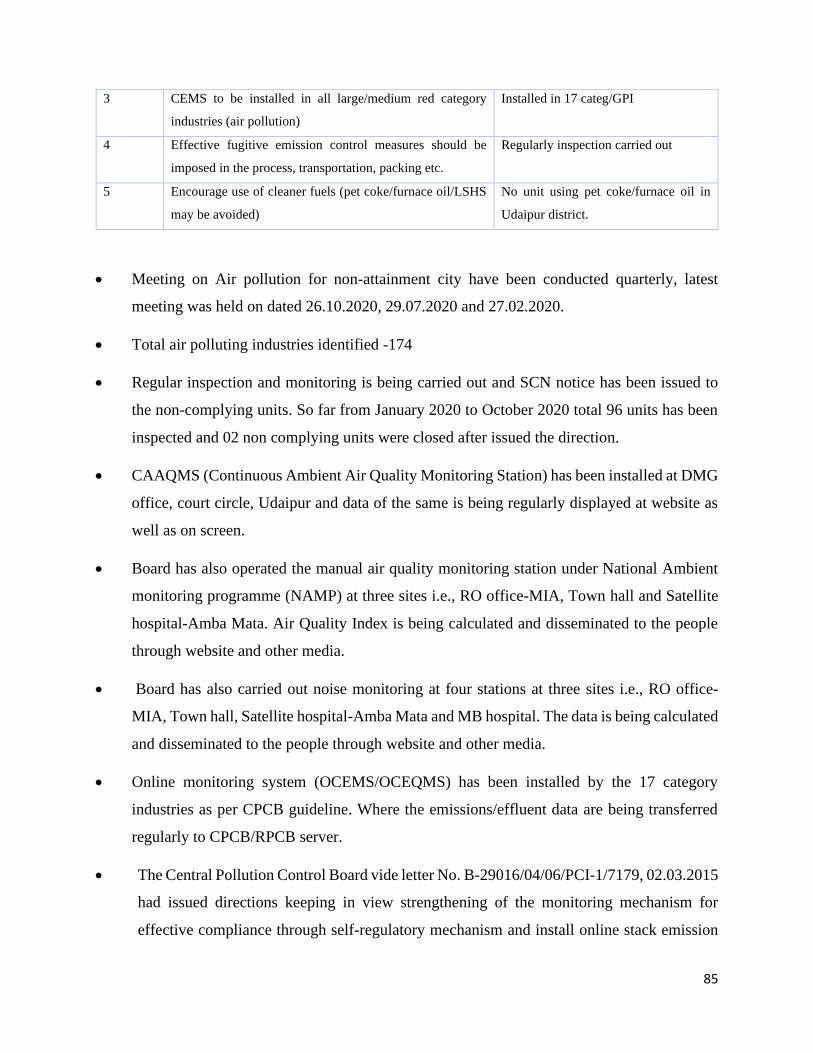
85
3 CEMS to be installed in all large/medium red category
industries (air pollution)
Installed in 17 categ/GPI
4 Effective fugitive emission control measures should be
imposed in the process, transportation, packing etc.
Regularly inspection carried out
5 Encourage use of cleaner fuels (pet coke/furnace oil/LSHS
may be avoided)
No unit using pet coke/furnace oil in
Udaipur district.
• Meeting on Air pollution for non-attainment city have been conducted quarterly, latest
meeting was held on dated 26.10.2020, 29.07.2020 and 27.02.2020.
• Total air polluting industries identified -174
• Regular inspection and monitoring is being carried out and SCN notice has been issued to
the non-complying units. So far from January 2020 to October 2020 total 96 units has been
inspected and 02 non complying units were closed after issued the direction.
• CAAQMS (Continuous Ambient Air Quality Monitoring Station) has been installed at DMG
office, court circle, Udaipur and data of the same is being regularly displayed at website as
well as on screen.
• Board has also operated the manual air quality monitoring station under National Ambient
monitoring programme (NAMP) at three sites i.e., RO office-MIA, Town hall and Satellite
hospital-Amba Mata. Air Quality Index is being calculated and disseminated to the people
through website and other media.
• Board has also carried out noise monitoring at four stations at three sites i.e., RO office-
MIA, Town hall, Satellite hospital-Amba Mata and MB hospital. The data is being calculated
and disseminated to the people through website and other media.
• Online monitoring system (OCEMS/OCEQMS) has been installed by the 17 category
industries as per CPCB guideline. Where the emissions/effluent data are being transferred
regularly to CPCB/RPCB server.
• The Central Pollution Control Board vide letter No. B-29016/04/06/PCI-1/7179, 02.03.2015
had issued directions keeping in view strengthening of the monitoring mechanism for
effective compliance through self-regulatory mechanism and install online stack emission
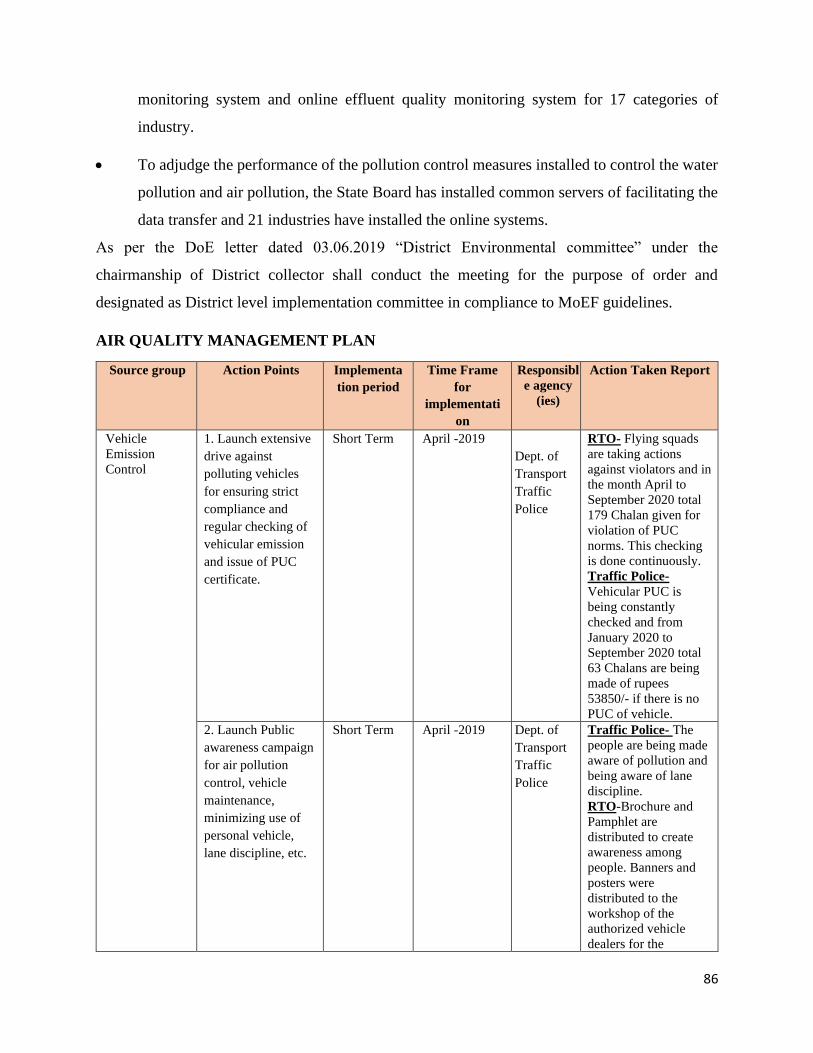
86
monitoring system and online effluent quality monitoring system for 17 categories of
industry.
• To adjudge the performance of the pollution control measures installed to control the water
pollution and air pollution, the State Board has installed common servers of facilitating the
data transfer and 21 industries have installed the online systems.
As per the DoE letter dated 03.06.2019 “District Environmental committee” under the
chairmanship of District collector shall conduct the meeting for the purpose of order and
designated as District level implementation committee in compliance to MoEF guidelines.
AIR QUALITY MANAGEMENT PLAN
Source group Action Points Implementa
tion period
Time Frame
for
implementati
on
Responsibl
e agency
(ies)
Action Taken Report
Vehicle
Emission
Control
1. Launch extensive
drive against
polluting vehicles
for ensuring strict
compliance and
regular checking of
vehicular emission
and issue of PUC
certificate.
Short Term April -2019
Dept. of
Transport
Traffic
Police
RTO- Flying squads
are taking actions
against violators and in
the month April to
September 2020 total
179 Chalan given for
violation of PUC
norms. This checking
is done continuously.
Traffic Police-
Vehicular PUC is
being constantly
checked and from
January 2020 to
September 2020 total
63 Chalans are being
made of rupees
53850/- if there is no
PUC of vehicle.
2. Launch Public
awareness campaign
for air pollution
control, vehicle
maintenance,
minimizing use of
personal vehicle,
lane discipline, etc.
Short Term April -2019 Dept. of
Transport
Traffic
Police
Traffic Police- The
people are being made
aware of pollution and
being aware of lane
discipline.
RTO-Brochure and
Pamphlet are
distributed to create
awareness among
people. Banners and
posters were
distributed to the
workshop of the
authorized vehicle
dealers for the
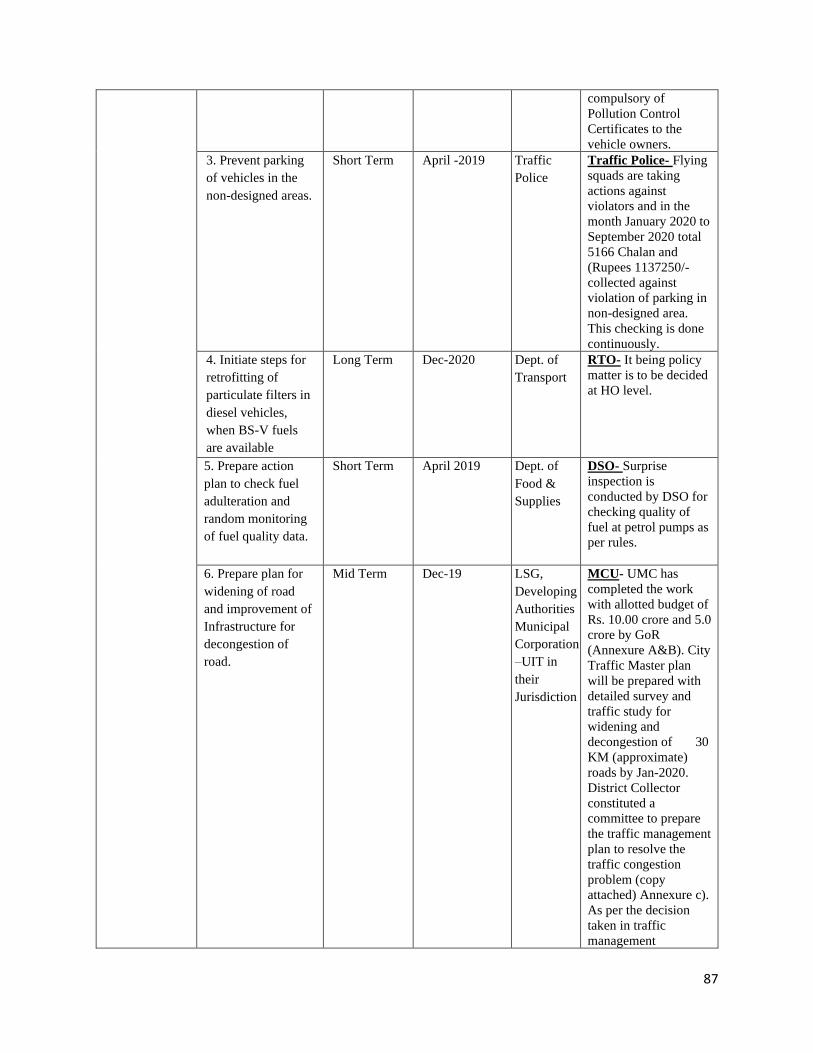
87
compulsory of
Pollution Control
Certificates to the
vehicle owners.
3. Prevent parking
of vehicles in the
non-designed areas.
Short Term April -2019 Traffic
Police
Traffic Police- Flying
squads are taking
actions against
violators and in the
month January 2020 to
September 2020 total
5166 Chalan and
(Rupees 1137250/-
collected against
violation of parking in
non-designed area.
This checking is done
continuously.
4. Initiate steps for
retrofitting of
particulate filters in
diesel vehicles,
when BS-V fuels
are available
Long Term Dec-2020 Dept. of
Transport
RTO- It being policy
matter is to be decided
at HO level.
5. Prepare action
plan to check fuel
adulteration and
random monitoring
of fuel quality data.
Short Term April 2019 Dept. of
Food &
Supplies
DSO- Surprise
inspection is
conducted by DSO for
checking quality of
fuel at petrol pumps as
per rules.
6. Prepare plan for
widening of road
and improvement of
Infrastructure for
decongestion of
road.
Mid Term Dec-19 LSG,
Developing
Authorities
Municipal
Corporation
–UIT in
their
Jurisdiction
MCU- UMC has
completed the work
with allotted budget of
Rs. 10.00 crore and 5.0
crore by GoR
(Annexure A&B). City
Traffic Master plan
will be prepared with
detailed survey and
traffic study for
widening and
decongestion of 30
KM (approximate)
roads by Jan-2020.
District Collector
constituted a
committee to prepare
the traffic management
plan to resolve the
traffic congestion
problem (copy
attached) Annexure c).
As per the decision
taken in traffic
management
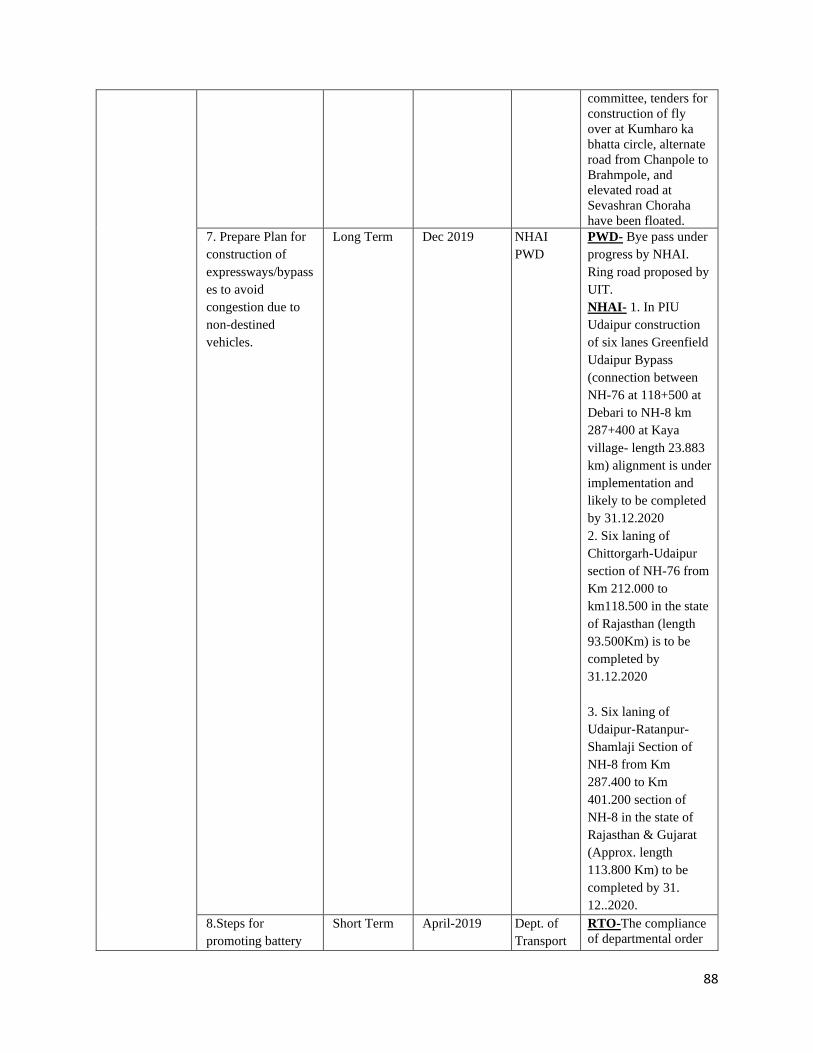
88
committee, tenders for
construction of fly
over at Kumharo ka
bhatta circle, alternate
road from Chanpole to
Brahmpole, and
elevated road at
Sevashran Choraha
have been floated.
7. Prepare Plan for
construction of
expressways/bypass
es to avoid
congestion due to
non-destined
vehicles.
Long Term Dec 2019 NHAI
PWD
PWD- Bye pass under
progress by NHAI.
Ring road proposed by
UIT.
NHAI- 1. In PIU
Udaipur construction
of six lanes Greenfield
Udaipur Bypass
(connection between
NH-76 at 118+500 at
Debari to NH-8 km
287+400 at Kaya
village- length 23.883
km) alignment is under
implementation and
likely to be completed
by 31.12.2020
2. Six laning of
Chittorgarh-Udaipur
section of NH-76 from
Km 212.000 to
km118.500 in the state
of Rajasthan (length
93.500Km) is to be
completed by
31.12.2020
3. Six laning of
Udaipur-Ratanpur-
Shamlaji Section of
NH-8 from Km
287.400 to Km
401.200 section of
NH-8 in the state of
Rajasthan & Gujarat
(Approx. length
113.800 Km) to be
completed by 31.
12..2020.
8.Steps for
promoting battery
Short Term April-2019 Dept. of
Transport
RTO-The compliance
of departmental order
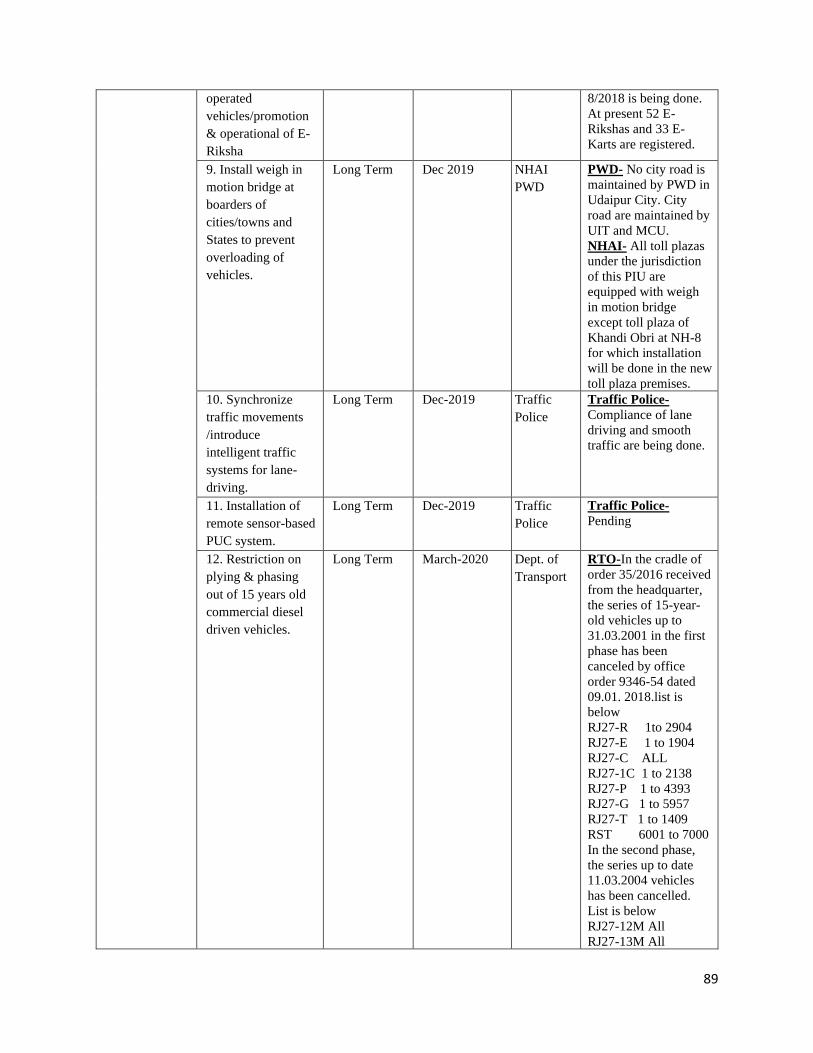
89
operated
vehicles/promotion
& operational of E-
Riksha
8/2018 is being done.
At present 52 E-
Rikshas and 33 E-
Karts are registered.
9. Install weigh in
motion bridge at
boarders of
cities/towns and
States to prevent
overloading of
vehicles.
Long Term Dec 2019 NHAI
PWD
PWD- No city road is
maintained by PWD in
Udaipur City. City
road are maintained by
UIT and MCU.
NHAI- All toll plazas
under the jurisdiction
of this PIU are
equipped with weigh
in motion bridge
except toll plaza of
Khandi Obri at NH-8
for which installation
will be done in the new
toll plaza premises.
10. Synchronize
traffic movements
/introduce
intelligent traffic
systems for lane-
driving.
Long Term Dec-2019 Traffic
Police
Traffic Police-
Compliance of lane
driving and smooth
traffic are being done.
11. Installation of
remote sensor-based
PUC system.
Long Term Dec-2019 Traffic
Police
Traffic Police-
Pending
12. Restriction on
plying & phasing
out of 15 years old
commercial diesel
driven vehicles.
Long Term March-2020 Dept. of
Transport
RTO-In the cradle of
order 35/2016 received
from the headquarter,
the series of 15-year-
old vehicles up to
31.03.2001 in the first
phase has been
canceled by office
order 9346-54 dated
09.01. 2018.list is
below
RJ27-R 1to 2904
RJ27-E 1 to 1904
RJ27-C ALL
RJ27-1C 1 to 2138
RJ27-P 1 to 4393
RJ27-G 1 to 5957
RJ27-T 1 to 1409
RST 6001 to 7000
In the second phase,
the series up to date
11.03.2004 vehicles
has been cancelled.
List is below
RJ27-12M All
RJ27-13M All
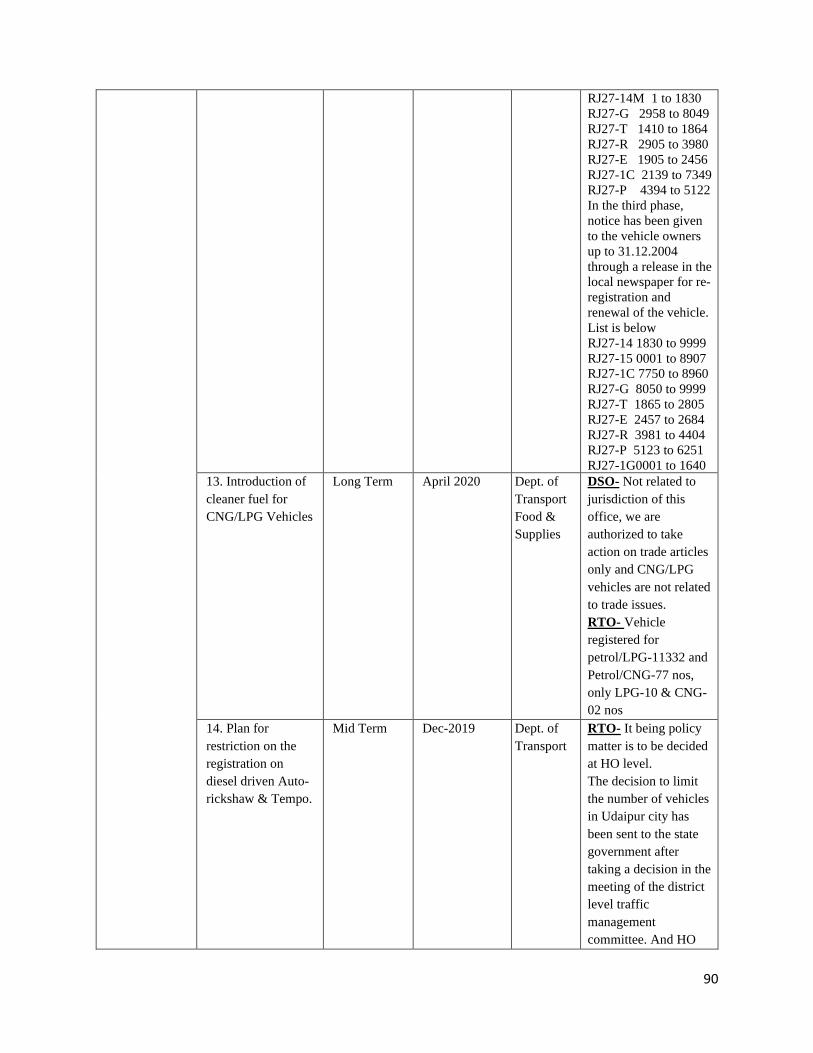
90
RJ27-14M 1 to 1830
RJ27-G 2958 to 8049
RJ27-T 1410 to 1864
RJ27-R 2905 to 3980
RJ27-E 1905 to 2456
RJ27-1C 2139 to 7349
RJ27-P 4394 to 5122
In the third phase,
notice has been given
to the vehicle owners
up to 31.12.2004
through a release in the
local newspaper for re-
registration and
renewal of the vehicle.
List is below
RJ27-14 1830 to 9999
RJ27-15 0001 to 8907
RJ27-1C 7750 to 8960
RJ27-G 8050 to 9999
RJ27-T 1865 to 2805
RJ27-E 2457 to 2684
RJ27-R 3981 to 4404
RJ27-P 5123 to 6251
RJ27-1G0001 to 1640
13. Introduction of
cleaner fuel for
CNG/LPG Vehicles
Long Term April 2020 Dept. of
Transport
Food &
Supplies
DSO- Not related to
jurisdiction of this
office, we are
authorized to take
action on trade articles
only and CNG/LPG
vehicles are not related
to trade issues.
RTO- Vehicle
registered for
petrol/LPG-11332 and
Petrol/CNG-77 nos,
only LPG-10 & CNG-
02 nos
14. Plan for
restriction on the
registration on
diesel driven Auto-
rickshaw & Tempo.
Mid Term Dec-2019 Dept. of
Transport
RTO- It being policy
matter is to be decided
at HO level.
The decision to limit
the number of vehicles
in Udaipur city has
been sent to the state
government after
taking a decision in the
meeting of the district
level traffic
management
committee. And HO
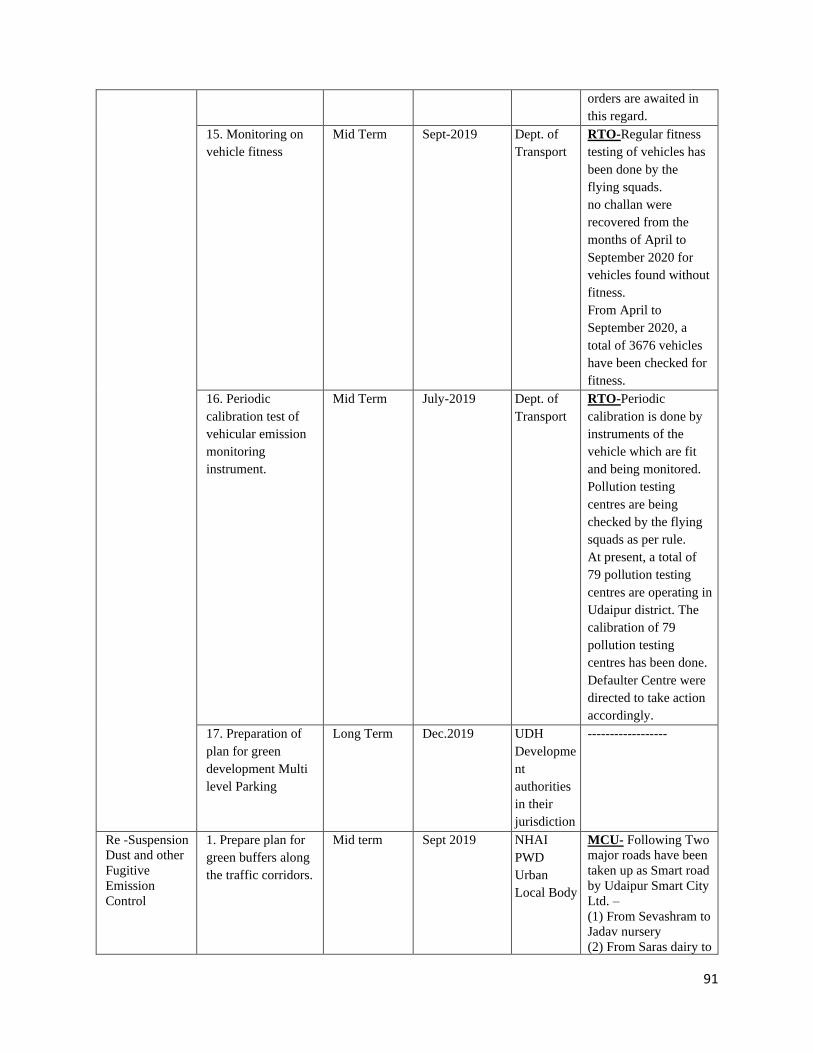
91
orders are awaited in
this regard.
15. Monitoring on
vehicle fitness
Mid Term Sept-2019 Dept. of
Transport
RTO-Regular fitness
testing of vehicles has
been done by the
flying squads.
no challan were
recovered from the
months of April to
September 2020 for
vehicles found without
fitness.
From April to
September 2020, a
total of 3676 vehicles
have been checked for
fitness.
16. Periodic
calibration test of
vehicular emission
monitoring
instrument.
Mid Term July-2019 Dept. of
Transport
RTO-Periodic
calibration is done by
instruments of the
vehicle which are fit
and being monitored.
Pollution testing
centres are being
checked by the flying
squads as per rule.
At present, a total of
79 pollution testing
centres are operating in
Udaipur district. The
calibration of 79
pollution testing
centres has been done.
Defaulter Centre were
directed to take action
accordingly.
17. Preparation of
plan for green
development Multi
level Parking
Long Term Dec.2019 UDH
Developme
nt
authorities
in their
jurisdiction
------------------
Re -Suspension
Dust and other
Fugitive
Emission
Control
1. Prepare plan for
green buffers along
the traffic corridors.
Mid term Sept 2019 NHAI
PWD
Urban
Local Body
MCU- Following Two
major roads have been
taken up as Smart road
by Udaipur Smart City
Ltd. –
(1) From Sevashram to
Jadav nursery
(2) From Saras dairy to
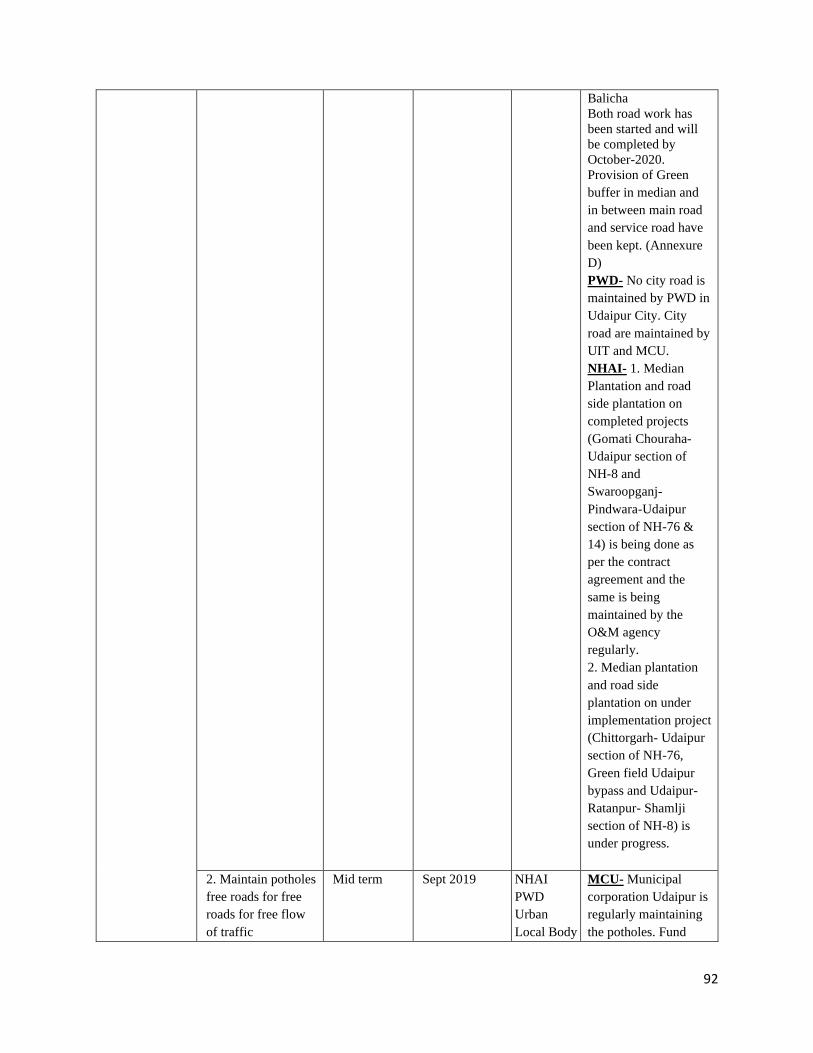
92
Balicha
Both road work has
been started and will
be completed by
October-2020.
Provision of Green
buffer in median and
in between main road
and service road have
been kept. (Annexure
D)
PWD- No city road is
maintained by PWD in
Udaipur City. City
road are maintained by
UIT and MCU.
NHAI- 1. Median
Plantation and road
side plantation on
completed projects
(Gomati Chouraha-
Udaipur section of
NH-8 and
Swaroopganj-
Pindwara-Udaipur
section of NH-76 &
14) is being done as
per the contract
agreement and the
same is being
maintained by the
O&M agency
regularly.
2. Median plantation
and road side
plantation on under
implementation project
(Chittorgarh- Udaipur
section of NH-76,
Green field Udaipur
bypass and Udaipur-
Ratanpur- Shamlji
section of NH-8) is
under progress.
2. Maintain potholes
free roads for free
roads for free flow
of traffic
Mid term Sept 2019 NHAI
PWD
Urban
Local Body
MCU- Municipal
corporation Udaipur is
regularly maintaining
the potholes. Fund
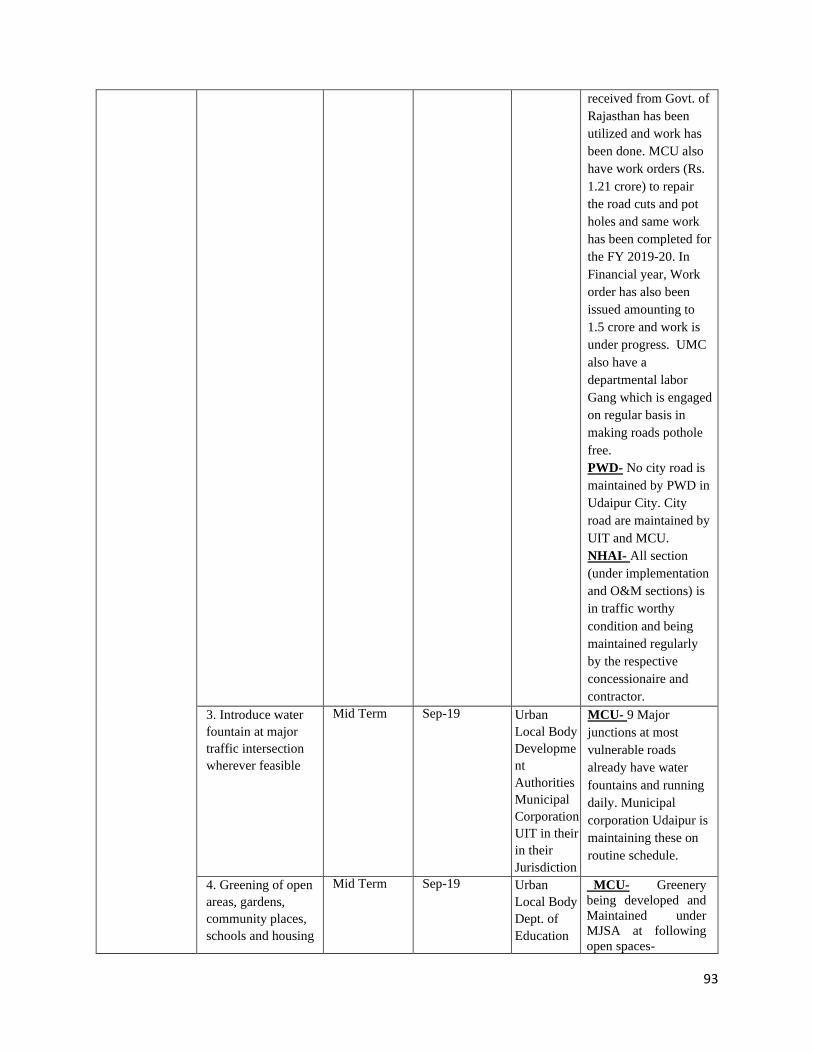
93
received from Govt. of
Rajasthan has been
utilized and work has
been done. MCU also
have work orders (Rs.
1.21 crore) to repair
the road cuts and pot
holes and same work
has been completed for
the FY 2019-20. In
Financial year, Work
order has also been
issued amounting to
1.5 crore and work is
under progress. UMC
also have a
departmental labor
Gang which is engaged
on regular basis in
making roads pothole
free.
PWD- No city road is
maintained by PWD in
Udaipur City. City
road are maintained by
UIT and MCU.
NHAI- All section
(under implementation
and O&M sections) is
in traffic worthy
condition and being
maintained regularly
by the respective
concessionaire and
contractor.
3. Introduce water
fountain at major
traffic intersection
wherever feasible
Mid Term Sep-19 Urban
Local Body
Developme
nt
Authorities
Municipal
Corporation
UIT in their
in their
Jurisdiction
MCU- 9 Major
junctions at most
vulnerable roads
already have water
fountains and running
daily. Municipal
corporation Udaipur is
maintaining these on
routine schedule.
4. Greening of open
areas, gardens,
community places,
schools and housing
Mid Term Sep-19 Urban
Local Body
Dept. of
Education
MCU- Greenery
being developed and
Maintained under
MJSA at following
open spaces-
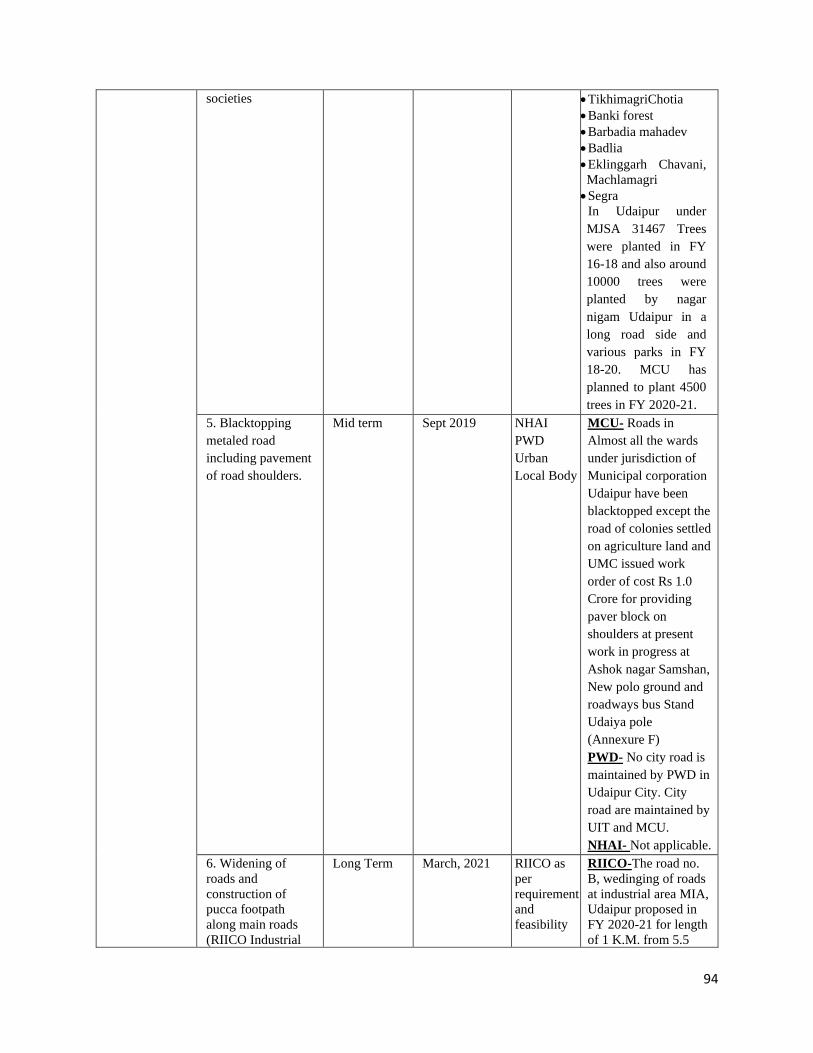
94
societies • TikhimagriChotia
• Banki forest
• Barbadia mahadev
• Badlia
• Eklinggarh Chavani,
Machlamagri
• Segra
In Udaipur under
MJSA 31467 Trees
were planted in FY
16-18 and also around
10000 trees were
planted by nagar
nigam Udaipur in a
long road side and
various parks in FY
18-20. MCU has
planned to plant 4500
trees in FY 2020-21.
5. Blacktopping
metaled road
including pavement
of road shoulders.
Mid term Sept 2019 NHAI
PWD
Urban
Local Body
MCU- Roads in
Almost all the wards
under jurisdiction of
Municipal corporation
Udaipur have been
blacktopped except the
road of colonies settled
on agriculture land and
UMC issued work
order of cost Rs 1.0
Crore for providing
paver block on
shoulders at present
work in progress at
Ashok nagar Samshan,
New polo ground and
roadways bus Stand
Udaiya pole
(Annexure F)
PWD- No city road is
maintained by PWD in
Udaipur City. City
road are maintained by
UIT and MCU.
NHAI- Not applicable.
6. Widening of
roads and
construction of
pucca footpath
along main roads
(RIICO Industrial
Long Term March, 2021 RIICO as
per
requirement
and
feasibility
RIICO-The road no.
B, wedinging of roads
at industrial area MIA,
Udaipur proposed in
FY 2020-21 for length
of 1 K.M. from 5.5
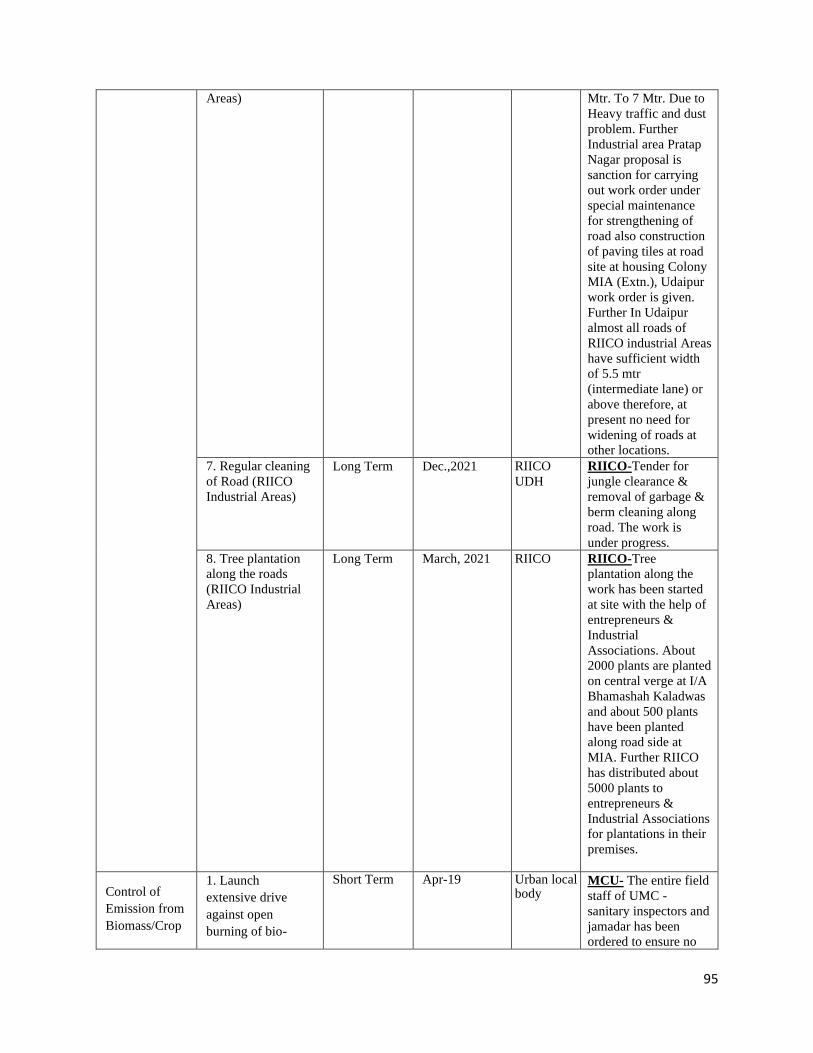
95
Areas) Mtr. To 7 Mtr. Due to
Heavy traffic and dust
problem. Further
Industrial area Pratap
Nagar proposal is
sanction for carrying
out work order under
special maintenance
for strengthening of
road also construction
of paving tiles at road
site at housing Colony
MIA (Extn.), Udaipur
work order is given.
Further In Udaipur
almost all roads of
RIICO industrial Areas
have sufficient width
of 5.5 mtr
(intermediate lane) or
above therefore, at
present no need for
widening of roads at
other locations.
7. Regular cleaning
of Road (RIICO
Industrial Areas)
Long Term Dec.,2021 RIICO
UDH
RIICO-Tender for
jungle clearance &
removal of garbage &
berm cleaning along
road. The work is
under progress.
8. Tree plantation
along the roads
(RIICO Industrial
Areas)
Long Term March, 2021 RIICO RIICO-Tree
plantation along the
work has been started
at site with the help of
entrepreneurs &
Industrial
Associations. About
2000 plants are planted
on central verge at I/A
Bhamashah Kaladwas
and about 500 plants
have been planted
along road side at
MIA. Further RIICO
has distributed about
5000 plants to
entrepreneurs &
Industrial Associations
for plantations in their
premises.
Control of
Emission from
Biomass/Crop
1. Launch
extensive drive
against open
burning of bio-
Short Term Apr-19 Urban local body
MCU- The entire field
staff of UMC -
sanitary inspectors and
jamadar has been
ordered to ensure no
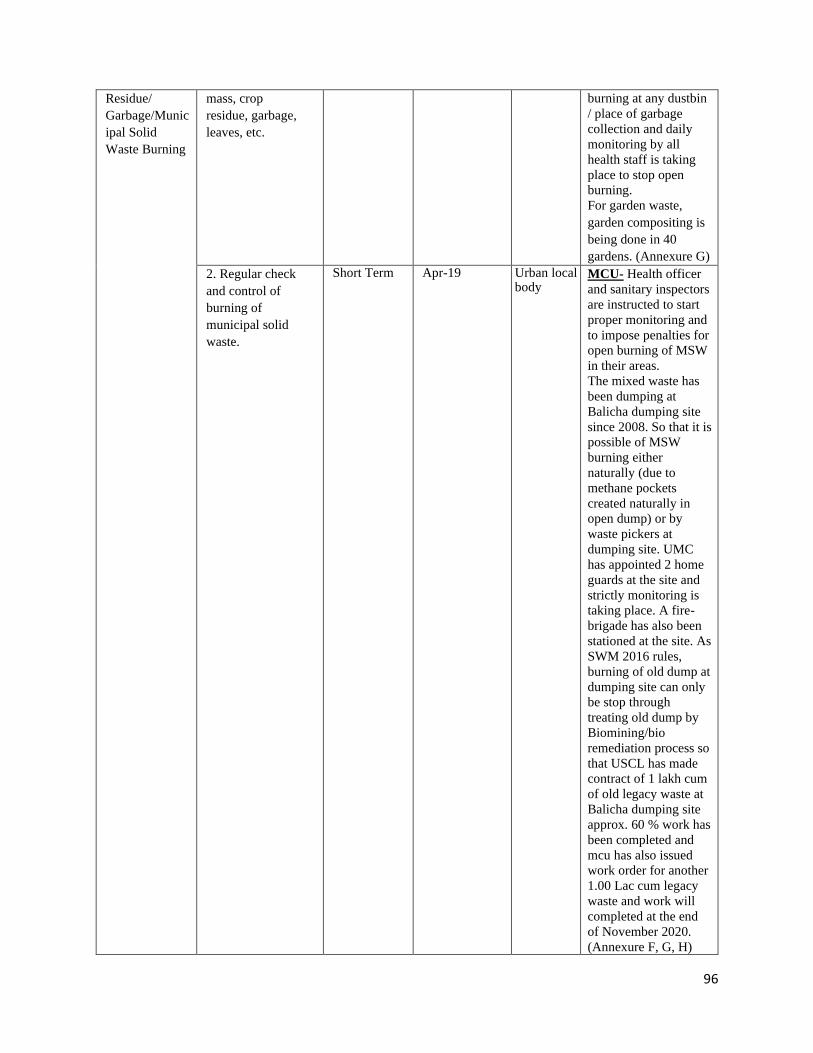
96
Residue/
Garbage/Munic
ipal Solid
Waste Burning
mass, crop
residue, garbage,
leaves, etc.
burning at any dustbin
/ place of garbage
collection and daily
monitoring by all
health staff is taking
place to stop open
burning.
For garden waste,
garden compositing is
being done in 40
gardens. (Annexure G)
2. Regular check
and control of
burning of
municipal solid
waste.
Short Term Apr-19 Urban local body
MCU- Health officer
and sanitary inspectors
are instructed to start
proper monitoring and
to impose penalties for
open burning of MSW
in their areas.
The mixed waste has
been dumping at
Balicha dumping site
since 2008. So that it is
possible of MSW
burning either
naturally (due to
methane pockets
created naturally in
open dump) or by
waste pickers at
dumping site. UMC
has appointed 2 home
guards at the site and
strictly monitoring is
taking place. A fire-
brigade has also been
stationed at the site. As
SWM 2016 rules,
burning of old dump at
dumping site can only
be stop through
treating old dump by
Biomining/bio
remediation process so
that USCL has made
contract of 1 lakh cum
of old legacy waste at
Balicha dumping site
approx. 60 % work has
been completed and
mcu has also issued
work order for another
1.00 Lac cum legacy
waste and work will
completed at the end
of November 2020.
(Annexure F, G, H)
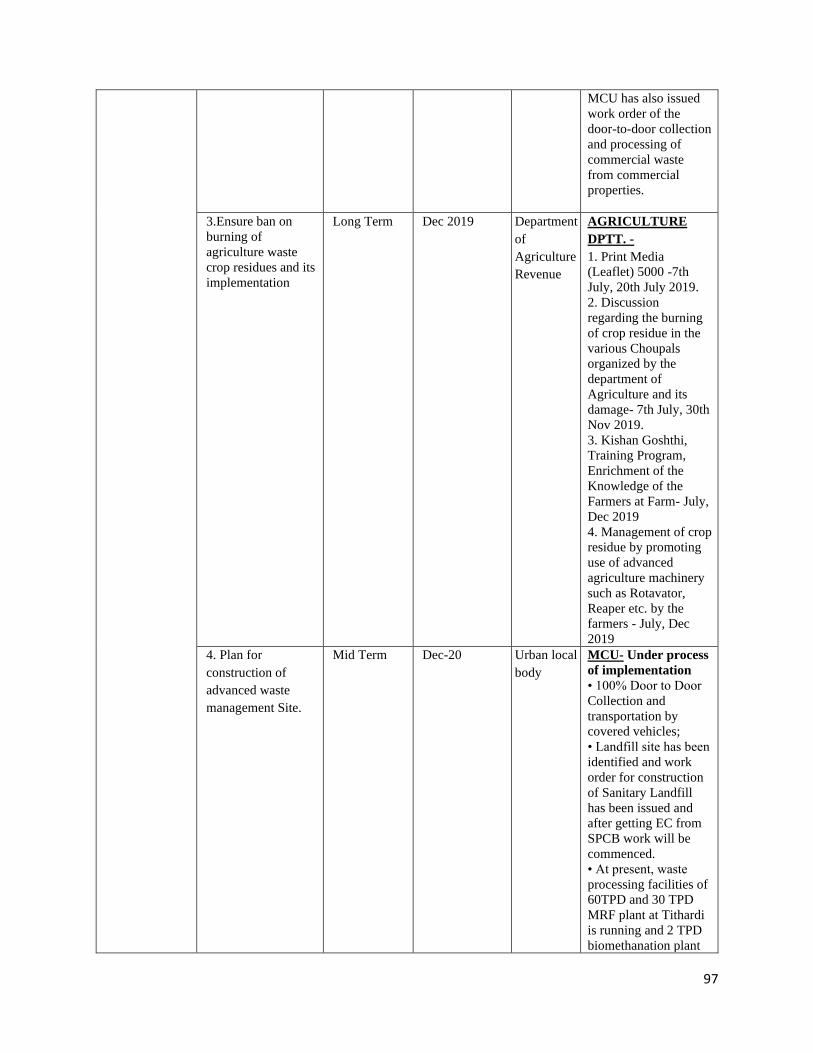
97
MCU has also issued
work order of the
door-to-door collection
and processing of
commercial waste
from commercial
properties.
3.Ensure ban on
burning of
agriculture waste
crop residues and its
implementation
Long Term Dec 2019 Department
of
Agriculture
Revenue
AGRICULTURE
DPTT. -
1. Print Media
(Leaflet) 5000 -7th
July, 20th July 2019.
2. Discussion
regarding the burning
of crop residue in the
various Choupals
organized by the
department of
Agriculture and its
damage- 7th July, 30th
Nov 2019.
3. Kishan Goshthi,
Training Program,
Enrichment of the
Knowledge of the
Farmers at Farm- July,
Dec 2019
4. Management of crop
residue by promoting
use of advanced
agriculture machinery
such as Rotavator,
Reaper etc. by the
farmers - July, Dec
2019
4. Plan for
construction of
advanced waste
management Site.
Mid Term Dec-20 Urban local
body
MCU- Under process
of implementation
• 100% Door to Door
Collection and
transportation by
covered vehicles;
• Landfill site has been
identified and work
order for construction
of Sanitary Landfill
has been issued and
after getting EC from
SPCB work will be
commenced.
• At present, waste
processing facilities of
60TPD and 30 TPD
MRF plant at Tithardi
is running and 2 TPD
biomethanation plant
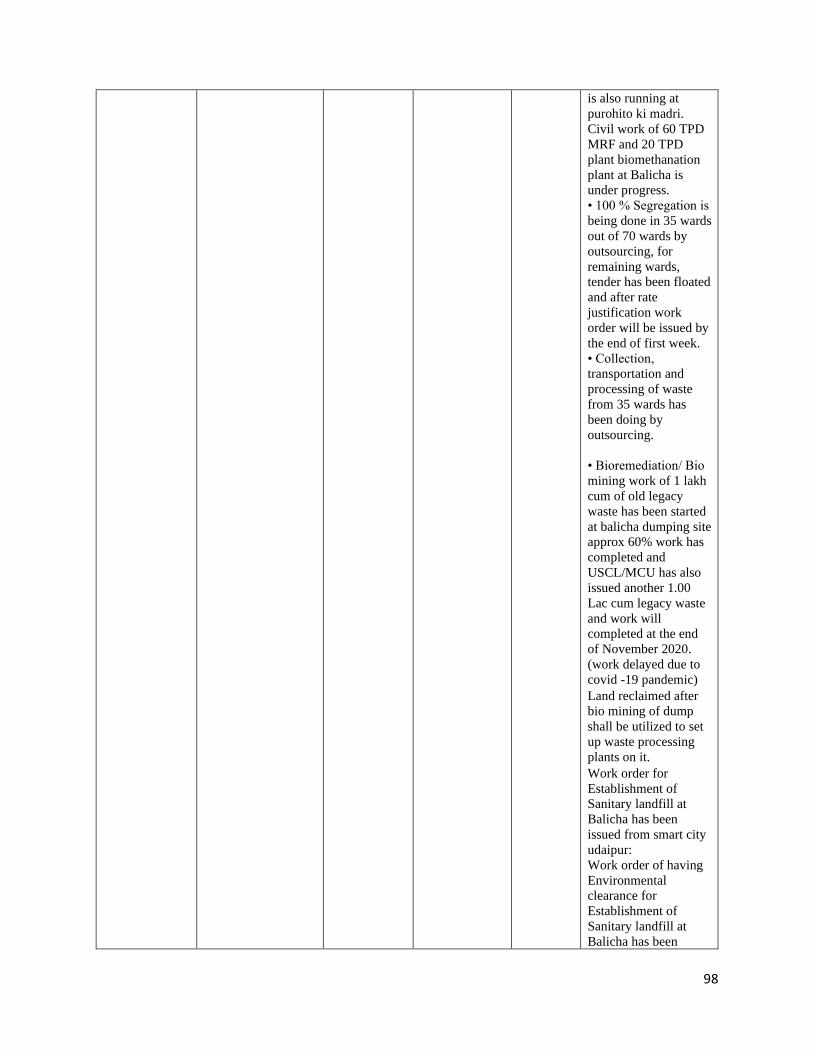
98
is also running at
purohito ki madri.
Civil work of 60 TPD
MRF and 20 TPD
plant biomethanation
plant at Balicha is
under progress.
• 100 % Segregation is
being done in 35 wards
out of 70 wards by
outsourcing, for
remaining wards,
tender has been floated
and after rate
justification work
order will be issued by
the end of first week.
• Collection,
transportation and
processing of waste
from 35 wards has
been doing by
outsourcing.
• Bioremediation/ Bio
mining work of 1 lakh
cum of old legacy
waste has been started
at balicha dumping site
approx 60% work has
completed and
USCL/MCU has also
issued another 1.00
Lac cum legacy waste
and work will
completed at the end
of November 2020.
(work delayed due to
covid -19 pandemic)
• Land reclaimed after
bio mining of dump
shall be utilized to set
up waste processing
plants on it.
• Work order for
Establishment of
Sanitary landfill at
Balicha has been
issued from smart city
udaipur:
Work order of having
Environmental
clearance for
Establishment of
Sanitary landfill at
Balicha has been
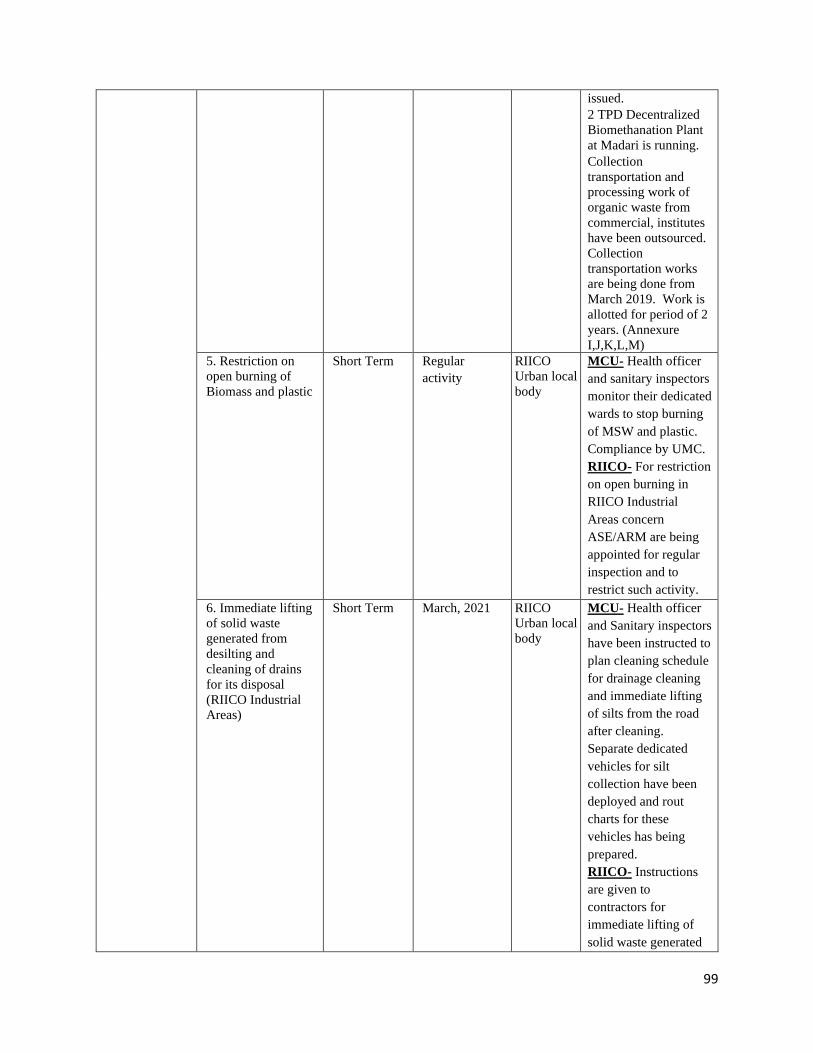
99
issued.
• 2 TPD Decentralized
Biomethanation Plant
at Madari is running.
• Collection
transportation and
processing work of
organic waste from
commercial, institutes
have been outsourced.
Collection
transportation works
are being done from
March 2019. Work is
allotted for period of 2
years. (Annexure
I,J,K,L,M)
5. Restriction on
open burning of
Biomass and plastic
Short Term Regular
activity
RIICO
Urban local
body
MCU- Health officer
and sanitary inspectors
monitor their dedicated
wards to stop burning
of MSW and plastic.
Compliance by UMC.
RIICO- For restriction
on open burning in
RIICO Industrial
Areas concern
ASE/ARM are being
appointed for regular
inspection and to
restrict such activity.
6. Immediate lifting
of solid waste
generated from
desilting and
cleaning of drains
for its disposal
(RIICO Industrial
Areas)
Short Term March, 2021 RIICO
Urban local
body
MCU- Health officer
and Sanitary inspectors
have been instructed to
plan cleaning schedule
for drainage cleaning
and immediate lifting
of silts from the road
after cleaning.
Separate dedicated
vehicles for silt
collection have been
deployed and rout
charts for these
vehicles has being
prepared.
RIICO- Instructions
are given to
contractors for
immediate lifting of
solid waste generated
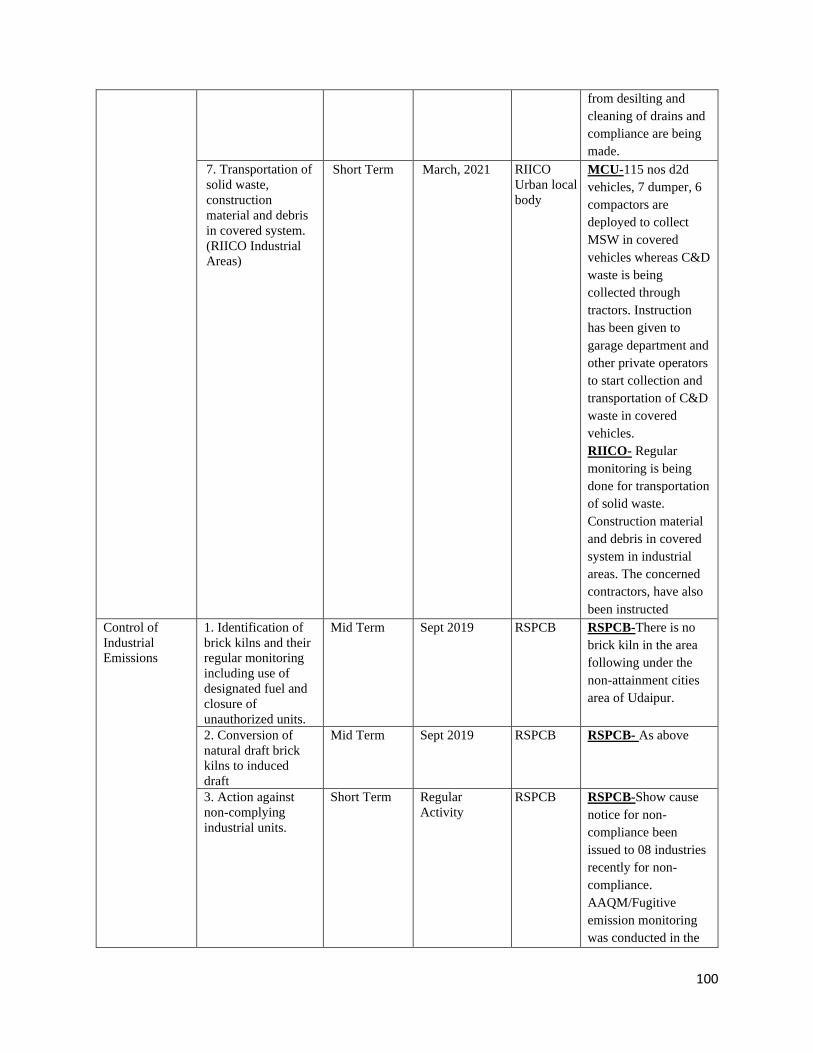
100
from desilting and
cleaning of drains and
compliance are being
made.
7. Transportation of
solid waste,
construction
material and debris
in covered system.
(RIICO Industrial
Areas)
Short Term March, 2021 RIICO
Urban local
body
MCU-115 nos d2d
vehicles, 7 dumper, 6
compactors are
deployed to collect
MSW in covered
vehicles whereas C&D
waste is being
collected through
tractors. Instruction
has been given to
garage department and
other private operators
to start collection and
transportation of C&D
waste in covered
vehicles.
RIICO- Regular
monitoring is being
done for transportation
of solid waste.
Construction material
and debris in covered
system in industrial
areas. The concerned
contractors, have also
been instructed
Control of
Industrial
Emissions
1. Identification of
brick kilns and their
regular monitoring
including use of
designated fuel and
closure of
unauthorized units.
Mid Term Sept 2019 RSPCB RSPCB-There is no
brick kiln in the area
following under the
non-attainment cities
area of Udaipur.
2. Conversion of
natural draft brick
kilns to induced
draft
Mid Term Sept 2019 RSPCB RSPCB- As above
3. Action against
non-complying
industrial units.
Short Term Regular
Activity
RSPCB RSPCB-Show cause
notice for non-
compliance been
issued to 08 industries
recently for non-
compliance.
AAQM/Fugitive
emission monitoring
was conducted in the
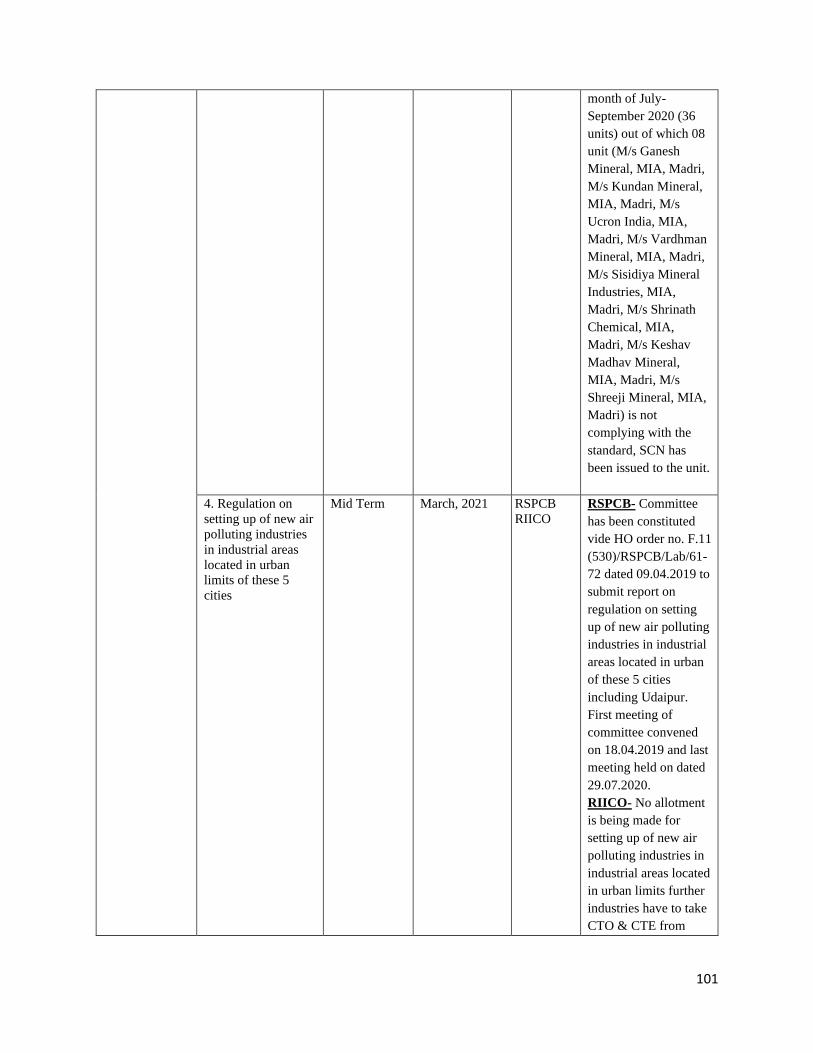
101
month of July-
September 2020 (36
units) out of which 08
unit (M/s Ganesh
Mineral, MIA, Madri,
M/s Kundan Mineral,
MIA, Madri, M/s
Ucron India, MIA,
Madri, M/s Vardhman
Mineral, MIA, Madri,
M/s Sisidiya Mineral
Industries, MIA,
Madri, M/s Shrinath
Chemical, MIA,
Madri, M/s Keshav
Madhav Mineral,
MIA, Madri, M/s
Shreeji Mineral, MIA,
Madri) is not
complying with the
standard, SCN has
been issued to the unit.
4. Regulation on
setting up of new air
polluting industries
in industrial areas
located in urban
limits of these 5
cities
Mid Term March, 2021
RSPCB
RIICO
RSPCB- Committee
has been constituted
vide HO order no. F.11
(530)/RSPCB/Lab/61-
72 dated 09.04.2019 to
submit report on
regulation on setting
up of new air polluting
industries in industrial
areas located in urban
of these 5 cities
including Udaipur.
First meeting of
committee convened
on 18.04.2019 and last
meeting held on dated
29.07.2020.
RIICO- No allotment
is being made for
setting up of new air
polluting industries in
industrial areas located
in urban limits further
industries have to take
CTO & CTE from
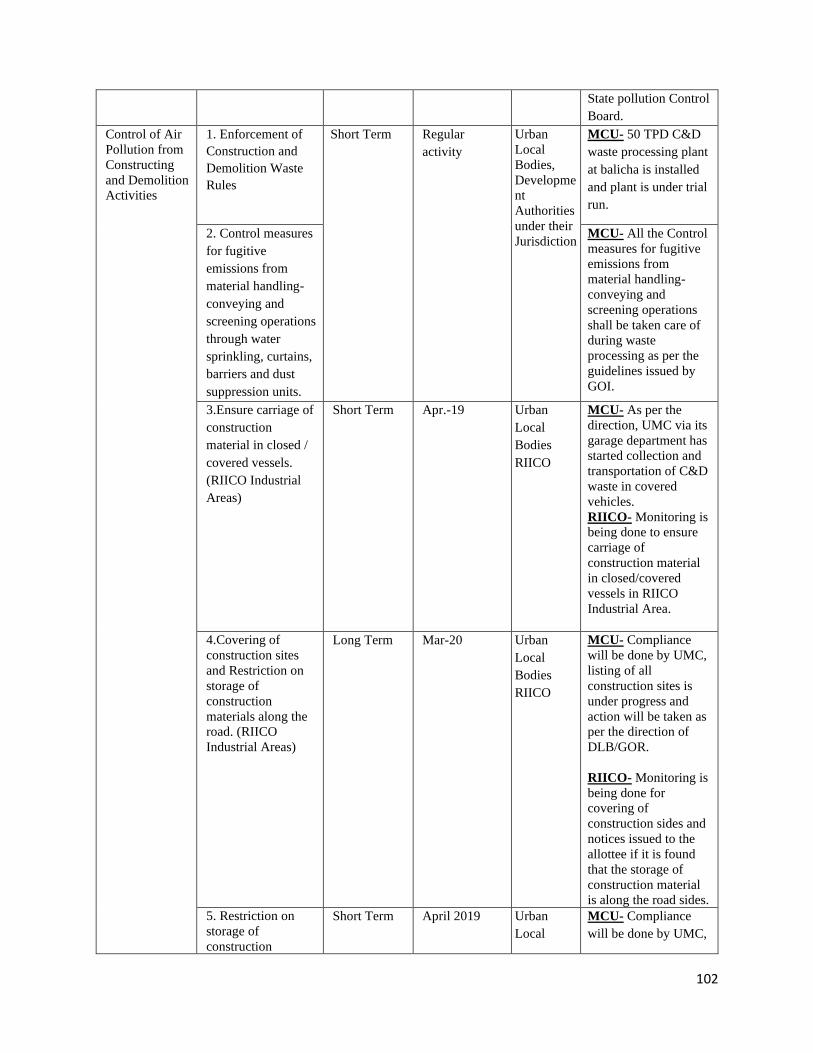
102
State pollution Control
Board.
Control of Air
Pollution from
Constructing
and Demolition
Activities
1. Enforcement of
Construction and
Demolition Waste
Rules
Short Term
Regular
activity
Urban
Local
Bodies,
Developme
nt
Authorities
under their
Jurisdiction
MCU- 50 TPD C&D
waste processing plant
at balicha is installed
and plant is under trial
run.
2. Control measures
for fugitive
emissions from
material handling-
conveying and
screening operations
through water
sprinkling, curtains,
barriers and dust
suppression units.
MCU- All the Control
measures for fugitive
emissions from
material handling-
conveying and
screening operations
shall be taken care of
during waste
processing as per the
guidelines issued by
GOI.
3.Ensure carriage of
construction
material in closed /
covered vessels.
(RIICO Industrial
Areas)
Short Term Apr.-19 Urban
Local
Bodies
RIICO
MCU- As per the
direction, UMC via its
garage department has
started collection and
transportation of C&D
waste in covered
vehicles.
RIICO- Monitoring is
being done to ensure
carriage of
construction material
in closed/covered
vessels in RIICO
Industrial Area.
4.Covering of
construction sites
and Restriction on
storage of
construction
materials along the
road. (RIICO
Industrial Areas)
Long Term Mar-20 Urban
Local
Bodies
RIICO
MCU- Compliance
will be done by UMC,
listing of all
construction sites is
under progress and
action will be taken as
per the direction of
DLB/GOR.
RIICO- Monitoring is
being done for
covering of
construction sides and
notices issued to the
allottee if it is found
that the storage of
construction material
is along the road sides.
5. Restriction on
storage of
construction
Short Term April 2019 Urban
Local
MCU- Compliance
will be done by UMC,
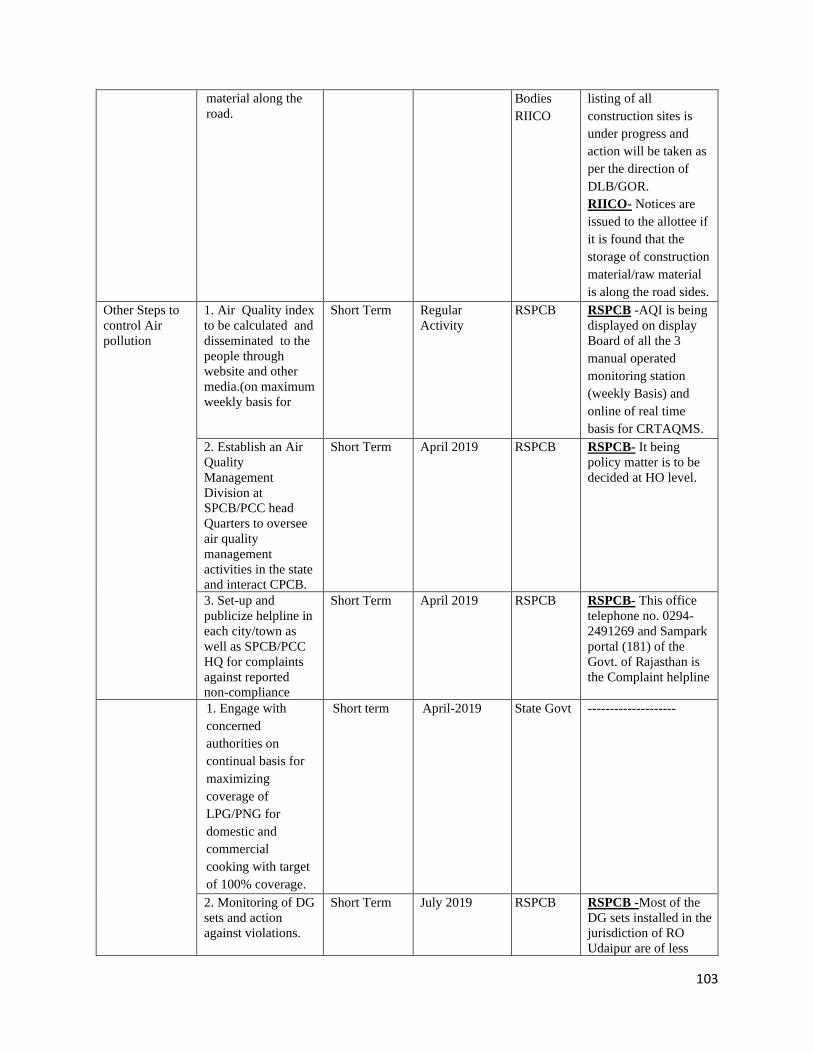
103
material along the
road.
Bodies
RIICO
listing of all
construction sites is
under progress and
action will be taken as
per the direction of
DLB/GOR.
RIICO- Notices are
issued to the allottee if
it is found that the
storage of construction
material/raw material
is along the road sides.
Other Steps to
control Air
pollution
1. Air Quality index
to be calculated and
disseminated to the
people through
website and other
media.(on maximum
weekly basis for
Short Term Regular
Activity
RSPCB RSPCB -AQI is being
displayed on display
Board of all the 3
manual operated
monitoring station
(weekly Basis) and
online of real time
basis for CRTAQMS.
2. Establish an Air
Quality
Management
Division at
SPCB/PCC head
Quarters to oversee
air quality
management
activities in the state
and interact CPCB.
Short Term April 2019 RSPCB RSPCB- It being
policy matter is to be
decided at HO level.
3. Set-up and
publicize helpline in
each city/town as
well as SPCB/PCC
HQ for complaints
against reported
non-compliance
Short Term April 2019 RSPCB RSPCB- This office
telephone no. 0294-
2491269 and Sampark
portal (181) of the
Govt. of Rajasthan is
the Complaint helpline
1. Engage with
concerned
authorities on
continual basis for
maximizing
coverage of
LPG/PNG for
domestic and
commercial
cooking with target
of 100% coverage.
Short term April-2019 State Govt --------------------
2. Monitoring of DG
sets and action
against violations.
Short Term July 2019 RSPCB RSPCB -Most of the
DG sets installed in the
jurisdiction of RO
Udaipur are of less
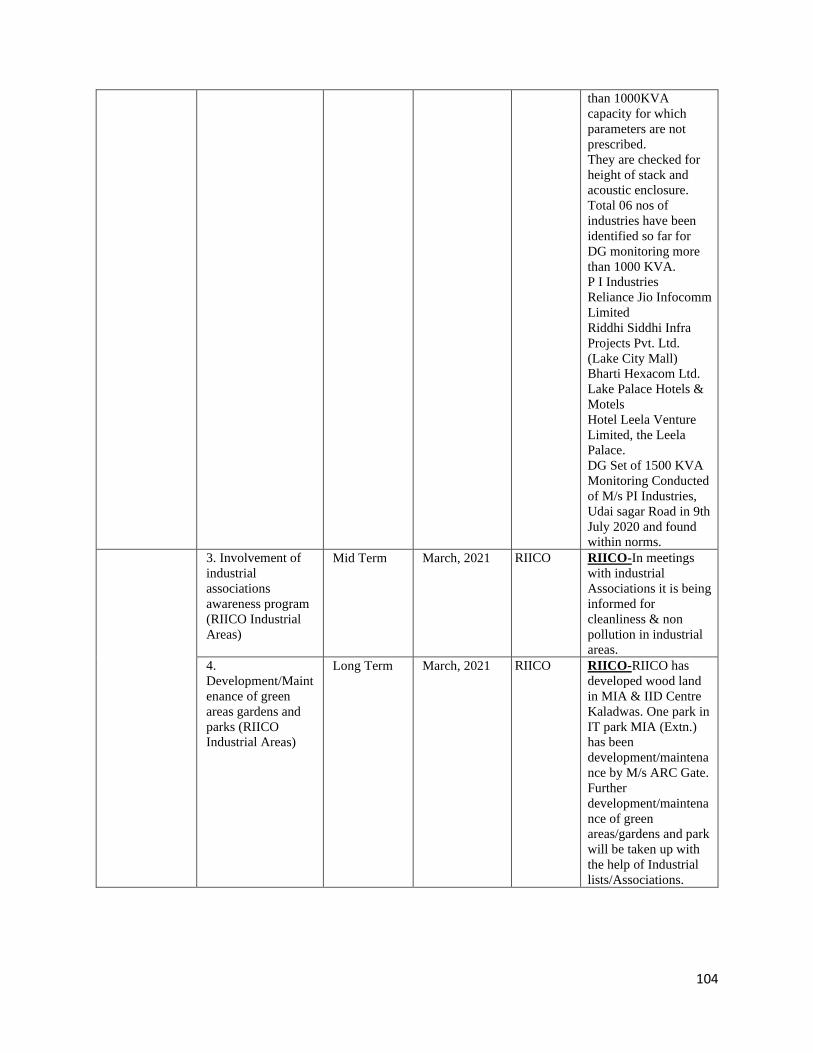
104
than 1000KVA
capacity for which
parameters are not
prescribed.
They are checked for
height of stack and
acoustic enclosure.
Total 06 nos of
industries have been
identified so far for
DG monitoring more
than 1000 KVA.
1. P I Industries
2. Reliance Jio Infocomm
Limited
3. Riddhi Siddhi Infra
Projects Pvt. Ltd.
(Lake City Mall)
4. Bharti Hexacom Ltd.
5. Lake Palace Hotels &
Motels
6. Hotel Leela Venture
Limited, the Leela
Palace.
DG Set of 1500 KVA
Monitoring Conducted
of M/s PI Industries,
Udai sagar Road in 9th
July 2020 and found
within norms.
3. Involvement of
industrial
associations
awareness program
(RIICO Industrial
Areas)
Mid Term March, 2021 RIICO RIICO-In meetings
with industrial
Associations it is being
informed for
cleanliness & non
pollution in industrial
areas.
4.
Development/Maint
enance of green
areas gardens and
parks (RIICO
Industrial Areas)
Long Term March, 2021 RIICO RIICO-RIICO has
developed wood land
in MIA & IID Centre
Kaladwas. One park in
IT park MIA (Extn.)
has been
development/maintena
nce by M/s ARC Gate.
Further
development/maintena
nce of green
areas/gardens and park
will be taken up with
the help of Industrial
lists/Associations.
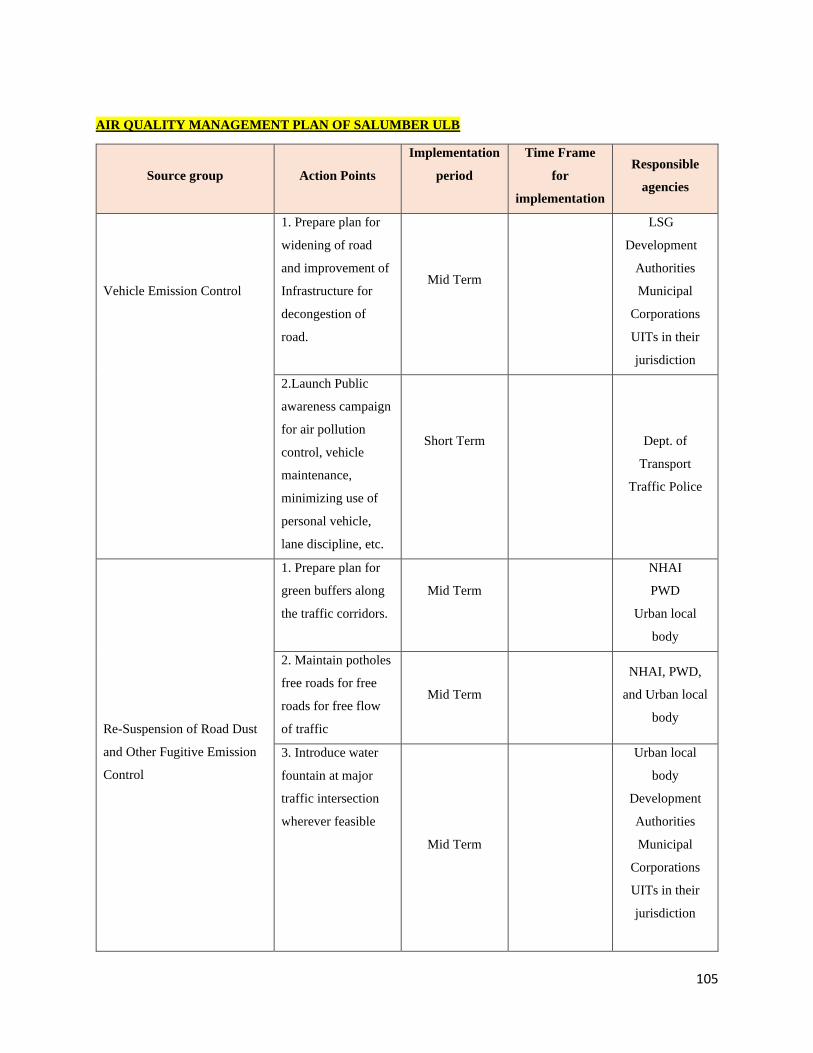
105
AIR QUALITY MANAGEMENT PLAN OF SALUMBER ULB
Source group Action Points
Implementation
period
Time Frame
for
implementation
Responsible
agencies
Vehicle Emission Control
1. Prepare plan for
widening of road
and improvement of
Infrastructure for
decongestion of
road.
Mid Term
LSG
Development
Authorities
Municipal
Corporations
UITs in their
jurisdiction
2.Launch Public
awareness campaign
for air pollution
control, vehicle
maintenance,
minimizing use of
personal vehicle,
lane discipline, etc.
Short Term
Dept. of
Transport
Traffic Police
Re-Suspension of Road Dust
and Other Fugitive Emission
Control
1. Prepare plan for
green buffers along
the traffic corridors.
Mid Term
NHAI
PWD
Urban local
body
2. Maintain potholes
free roads for free
roads for free flow
of traffic
Mid Term
NHAI, PWD,
and Urban local
body
3. Introduce water
fountain at major
traffic intersection
wherever feasible
Mid Term
Urban local
body
Development
Authorities
Municipal
Corporations
UITs in their
jurisdiction
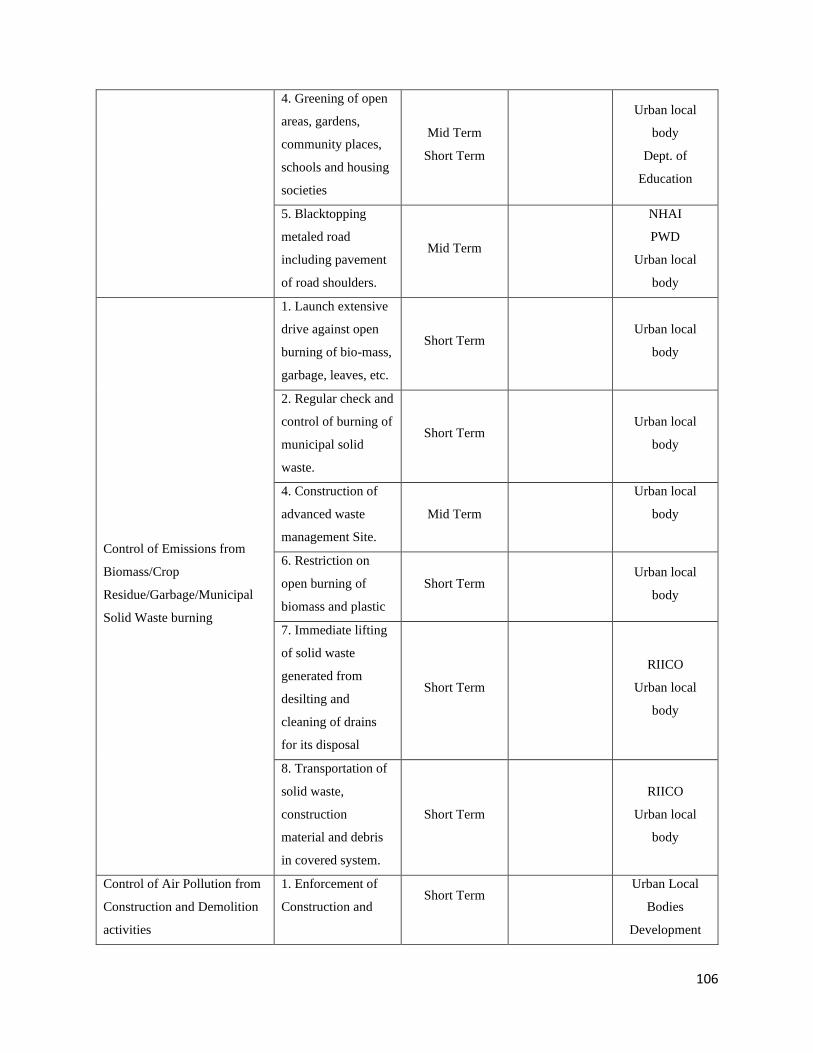
106
4. Greening of open
areas, gardens,
community places,
schools and housing
societies
Mid Term
Short Term
Urban local
body
Dept. of
Education
5. Blacktopping
metaled road
including pavement
of road shoulders.
Mid Term
NHAI
PWD
Urban local
body
Control of Emissions from
Biomass/Crop
Residue/Garbage/Municipal
Solid Waste burning
1. Launch extensive
drive against open
burning of bio-mass,
garbage, leaves, etc.
Short Term Urban local
body
2. Regular check and
control of burning of
municipal solid
waste.
Short Term
Urban local
body
4. Construction of
advanced waste
management Site.
Mid Term
Urban local
body
6. Restriction on
open burning of
biomass and plastic
Short Term Urban local
body
7. Immediate lifting
of solid waste
generated from
desilting and
cleaning of drains
for its disposal
Short Term
RIICO
Urban local
body
8. Transportation of
solid waste,
construction
material and debris
in covered system.
Short Term
RIICO
Urban local
body
Control of Air Pollution from
Construction and Demolition
activities
1. Enforcement of
Construction and Short Term
Urban Local
Bodies
Development
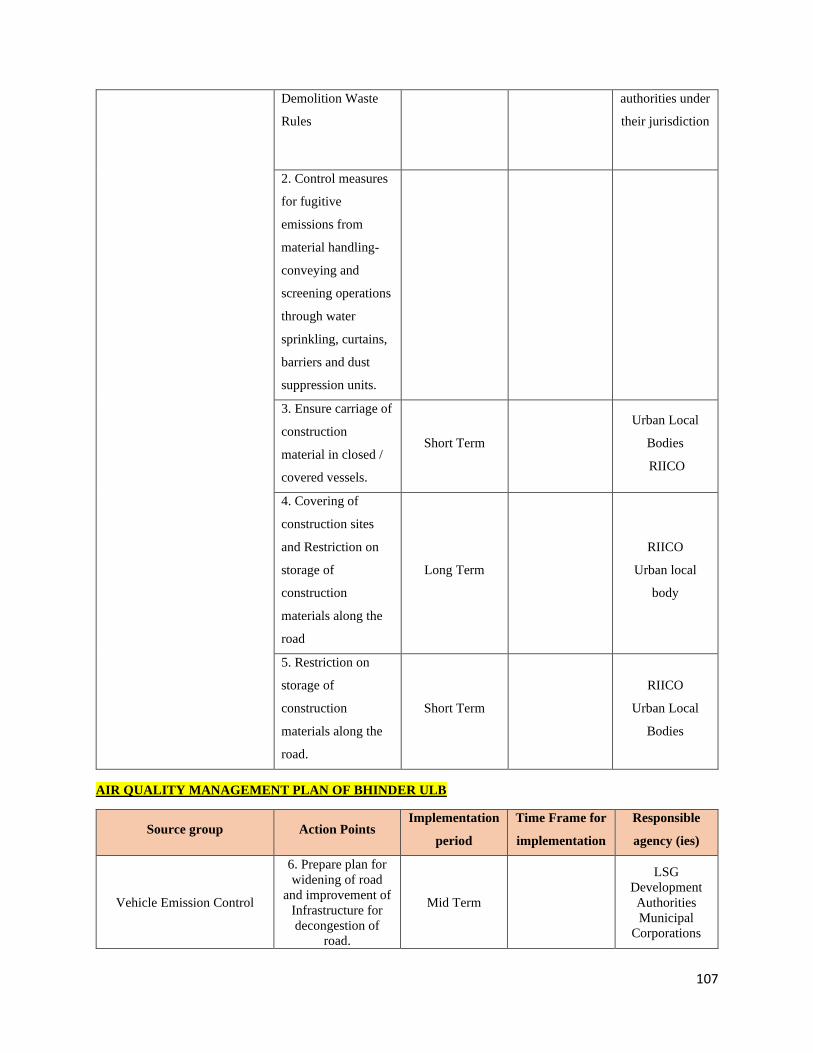
107
Demolition Waste
Rules
authorities under
their jurisdiction
2. Control measures
for fugitive
emissions from
material handling-
conveying and
screening operations
through water
sprinkling, curtains,
barriers and dust
suppression units.
3. Ensure carriage of
construction
material in closed /
covered vessels.
Short Term
Urban Local
Bodies
RIICO
4. Covering of
construction sites
and Restriction on
storage of
construction
materials along the
road
Long Term
RIICO
Urban local
body
5. Restriction on
storage of
construction
materials along the
road.
Short Term
RIICO
Urban Local
Bodies
AIR QUALITY MANAGEMENT PLAN OF BHINDER ULB
Source group Action Points Implementation
period
Time Frame for
implementation
Responsible
agency (ies)
Vehicle Emission Control
6. Prepare plan for
widening of road
and improvement of
Infrastructure for
decongestion of
road.
Mid Term
LSG
Development
Authorities
Municipal
Corporations
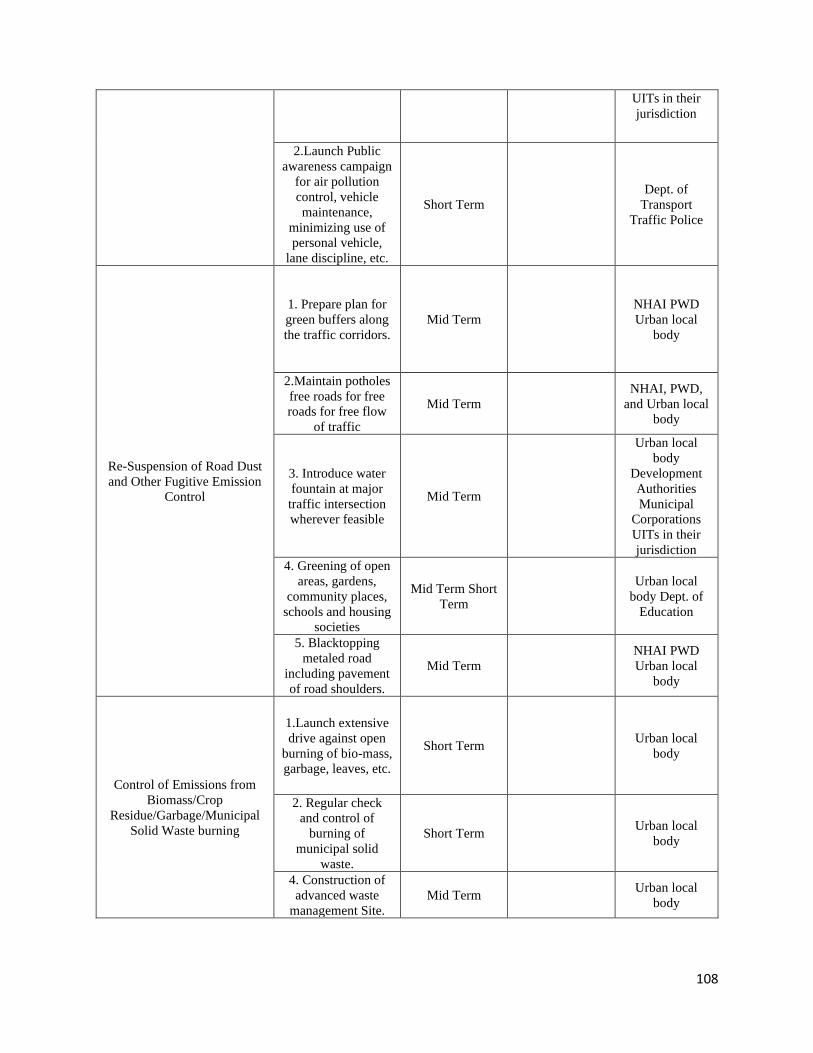
108
UITs in their
jurisdiction
2.Launch Public
awareness campaign
for air pollution
control, vehicle
maintenance,
minimizing use of
personal vehicle,
lane discipline, etc.
Short Term
Dept. of
Transport
Traffic Police
Re-Suspension of Road Dust
and Other Fugitive Emission
Control
1. Prepare plan for
green buffers along
the traffic corridors.
Mid Term
NHAI PWD
Urban local
body
2.Maintain potholes
free roads for free
roads for free flow
of traffic
Mid Term
NHAI, PWD,
and Urban local
body
3. Introduce water
fountain at major
traffic intersection
wherever feasible
Mid Term
Urban local
body
Development
Authorities
Municipal
Corporations
UITs in their
jurisdiction
4. Greening of open
areas, gardens,
community places,
schools and housing
societies
Mid Term Short
Term
Urban local
body Dept. of
Education
5. Blacktopping
metaled road
including pavement
of road shoulders.
Mid Term
NHAI PWD
Urban local
body
Control of Emissions from
Biomass/Crop
Residue/Garbage/Municipal
Solid Waste burning
1.Launch extensive
drive against open
burning of bio-mass,
garbage, leaves, etc.
Short Term Urban local
body
2. Regular check
and control of
burning of
municipal solid
waste.
Short Term Urban local
body
4. Construction of
advanced waste
management Site.
Mid Term Urban local
body
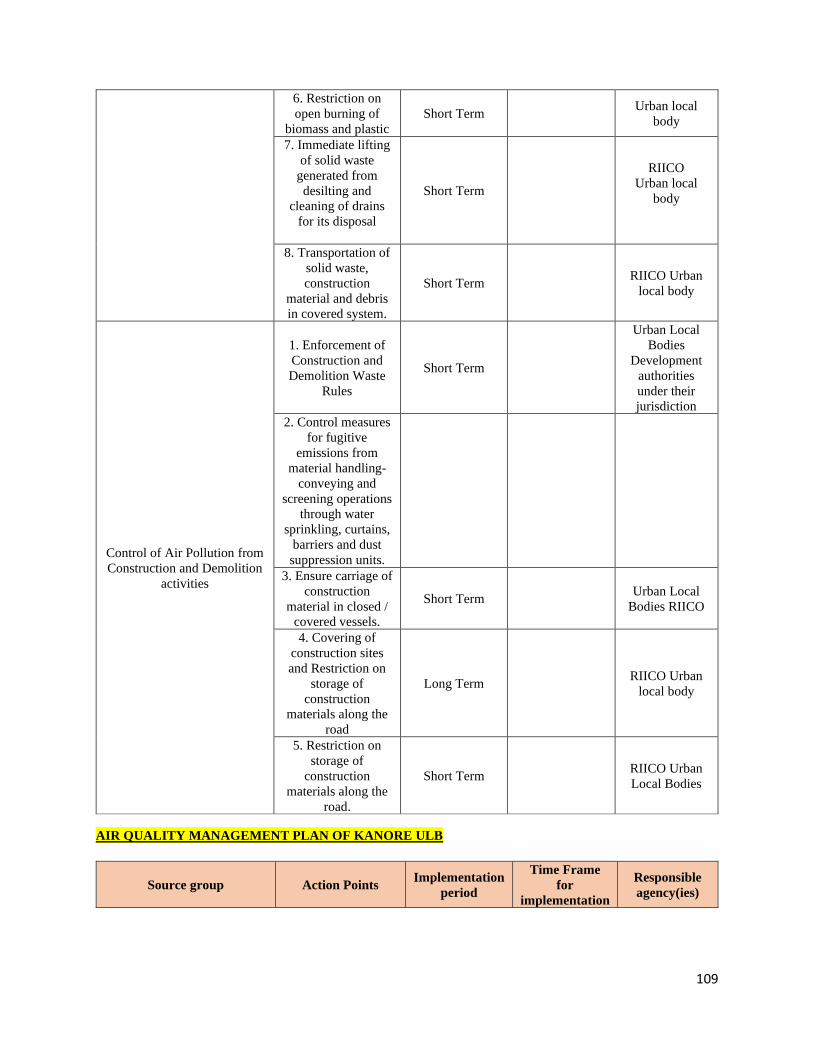
109
6. Restriction on
open burning of
biomass and plastic
Short Term Urban local
body
7. Immediate lifting
of solid waste
generated from
desilting and
cleaning of drains
for its disposal
Short Term
RIICO
Urban local
body
8. Transportation of
solid waste,
construction
material and debris
in covered system.
Short Term RIICO Urban
local body
Control of Air Pollution from
Construction and Demolition
activities
1. Enforcement of
Construction and
Demolition Waste
Rules
Short Term
Urban Local
Bodies
Development
authorities
under their
jurisdiction
2. Control measures
for fugitive
emissions from
material handling-
conveying and
screening operations
through water
sprinkling, curtains,
barriers and dust
suppression units.
3. Ensure carriage of
construction
material in closed /
covered vessels.
Short Term Urban Local
Bodies RIICO
4. Covering of
construction sites
and Restriction on
storage of
construction
materials along the
road
Long Term RIICO Urban
local body
5. Restriction on
storage of
construction
materials along the
road.
Short Term RIICO Urban
Local Bodies
AIR QUALITY MANAGEMENT PLAN OF KANORE ULB
Source group Action Points Implementation
period
Time Frame
for
implementation
Responsible
agency(ies)
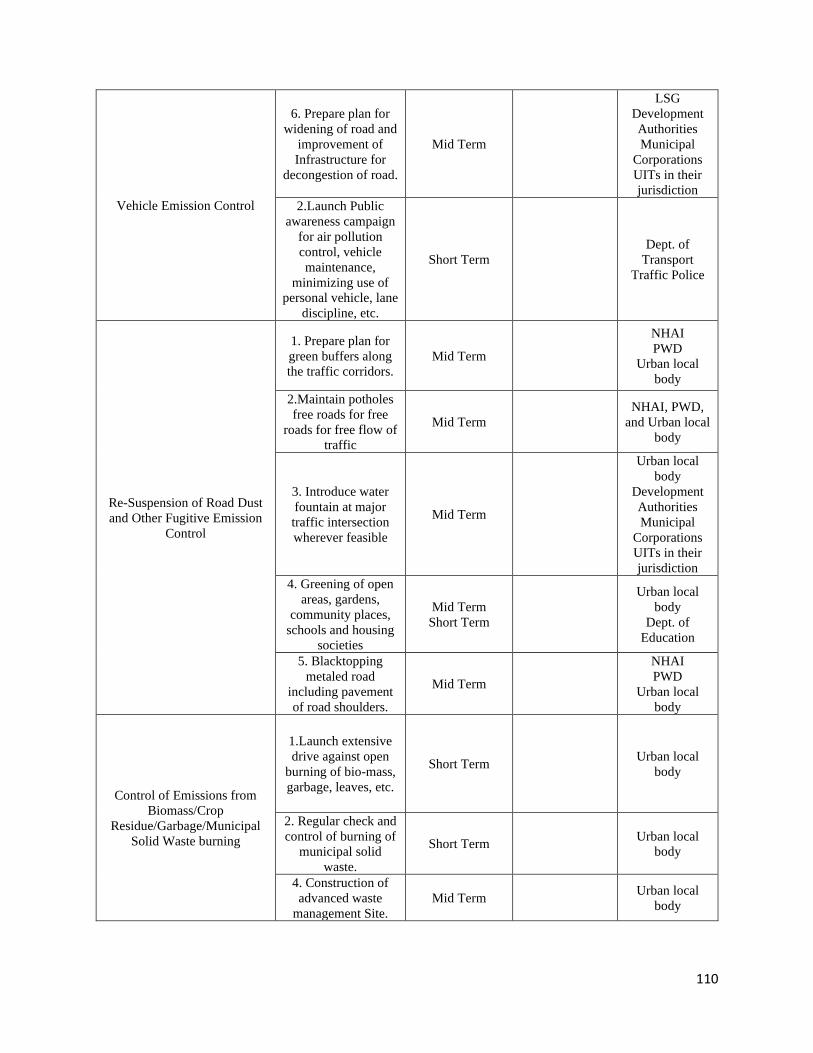
110
Vehicle Emission Control
6. Prepare plan for
widening of road and
improvement of
Infrastructure for
decongestion of road.
Mid Term
LSG
Development
Authorities
Municipal
Corporations
UITs in their
jurisdiction
2.Launch Public
awareness campaign
for air pollution
control, vehicle
maintenance,
minimizing use of
personal vehicle, lane
discipline, etc.
Short Term
Dept. of
Transport
Traffic Police
Re-Suspension of Road Dust
and Other Fugitive Emission
Control
1. Prepare plan for
green buffers along
the traffic corridors.
Mid Term
NHAI
PWD
Urban local
body
2.Maintain potholes
free roads for free
roads for free flow of
traffic
Mid Term
NHAI, PWD,
and Urban local
body
3. Introduce water
fountain at major
traffic intersection
wherever feasible
Mid Term
Urban local
body
Development
Authorities
Municipal
Corporations
UITs in their
jurisdiction
4. Greening of open
areas, gardens,
community places,
schools and housing
societies
Mid Term
Short Term
Urban local
body
Dept. of
Education
5. Blacktopping
metaled road
including pavement
of road shoulders.
Mid Term
NHAI
PWD
Urban local
body
Control of Emissions from
Biomass/Crop
Residue/Garbage/Municipal
Solid Waste burning
1.Launch extensive
drive against open
burning of bio-mass,
garbage, leaves, etc.
Short Term Urban local
body
2. Regular check and
control of burning of
municipal solid
waste.
Short Term Urban local
body
4. Construction of
advanced waste
management Site.
Mid Term Urban local
body
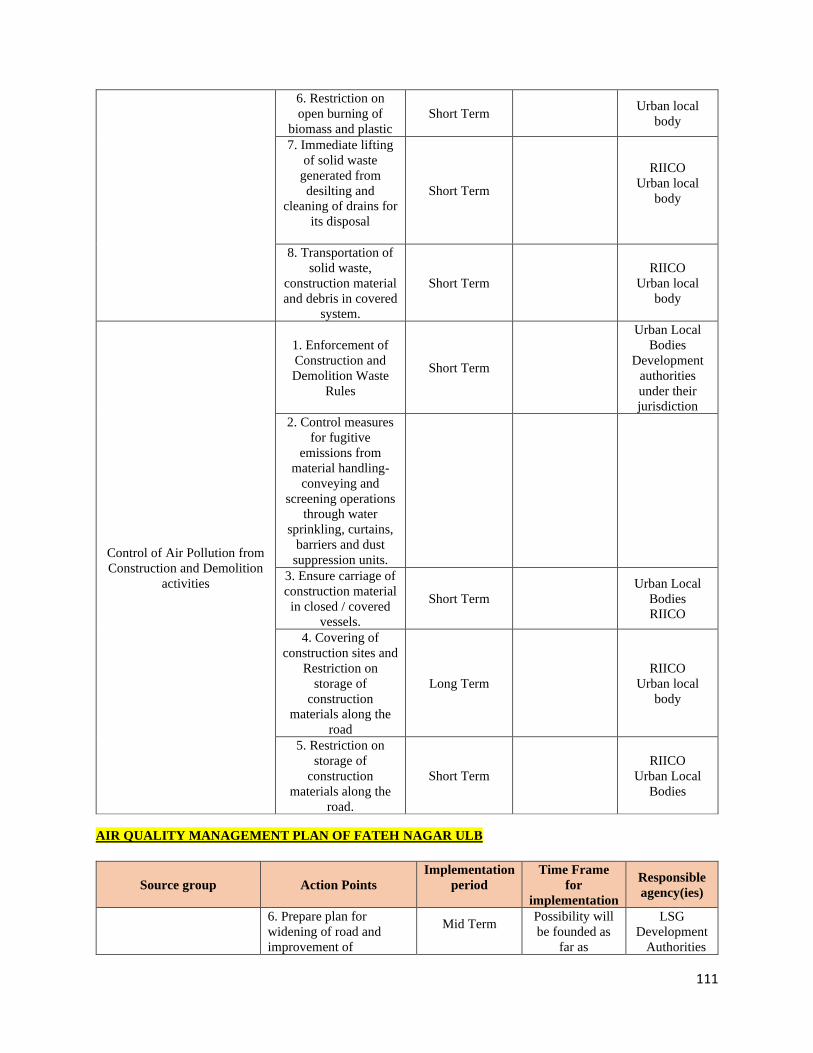
111
6. Restriction on
open burning of
biomass and plastic
Short Term Urban local
body
7. Immediate lifting
of solid waste
generated from
desilting and
cleaning of drains for
its disposal
Short Term
RIICO
Urban local
body
8. Transportation of
solid waste,
construction material
and debris in covered
system.
Short Term
RIICO
Urban local
body
Control of Air Pollution from
Construction and Demolition
activities
1. Enforcement of
Construction and
Demolition Waste
Rules
Short Term
Urban Local
Bodies
Development
authorities
under their
jurisdiction
2. Control measures
for fugitive
emissions from
material handling-
conveying and
screening operations
through water
sprinkling, curtains,
barriers and dust
suppression units.
3. Ensure carriage of
construction material
in closed / covered
vessels.
Short Term
Urban Local
Bodies
RIICO
4. Covering of
construction sites and
Restriction on
storage of
construction
materials along the
road
Long Term
RIICO
Urban local
body
5. Restriction on
storage of
construction
materials along the
road.
Short Term
RIICO
Urban Local
Bodies
AIR QUALITY MANAGEMENT PLAN OF FATEH NAGAR ULB
Source group Action Points
Implementation
period
Time Frame
for
implementation
Responsible
agency(ies)
6. Prepare plan for
widening of road and
improvement of
Mid Term
Possibility will
be founded as
far as
LSG
Development
Authorities
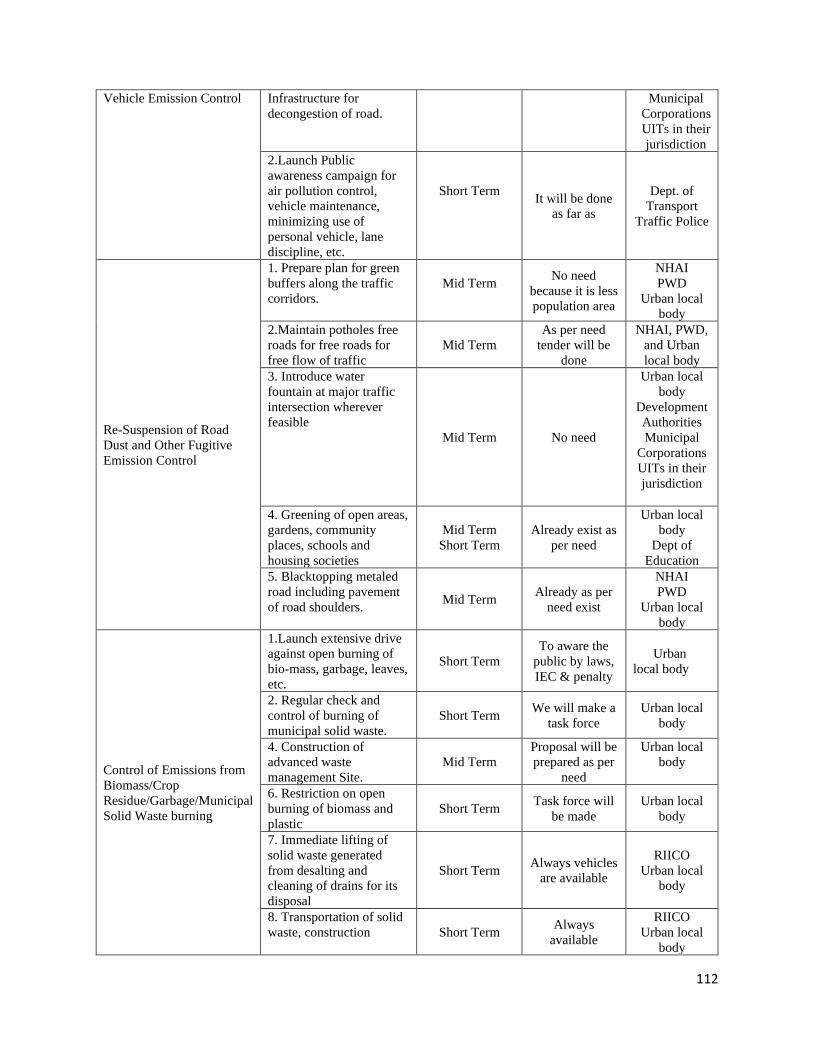
112
Vehicle Emission Control Infrastructure for
decongestion of road.
Municipal
Corporations
UITs in their
jurisdiction
2.Launch Public
awareness campaign for
air pollution control,
vehicle maintenance,
minimizing use of
personal vehicle, lane
discipline, etc.
Short Term
It will be done
as far as
Dept. of
Transport
Traffic Police
Re-Suspension of Road
Dust and Other Fugitive
Emission Control
1. Prepare plan for green
buffers along the traffic
corridors.
Mid Term
No need
because it is less
population area
NHAI
PWD
Urban local
body
2.Maintain potholes free
roads for free roads for
free flow of traffic
Mid Term
As per need
tender will be
done
NHAI, PWD,
and Urban
local body
3. Introduce water
fountain at major traffic
intersection wherever
feasible
Mid Term No need
Urban local
body
Development
Authorities
Municipal
Corporations
UITs in their
jurisdiction
4. Greening of open areas,
gardens, community
places, schools and
housing societies
Mid Term
Short Term
Already exist as
per need
Urban local
body
Dept of
Education
5. Blacktopping metaled
road including pavement
of road shoulders. Mid Term
Already as per
need exist
NHAI
PWD
Urban local
body
Control of Emissions from
Biomass/Crop
Residue/Garbage/Municipal
Solid Waste burning
1.Launch extensive drive
against open burning of
bio-mass, garbage, leaves,
etc.
Short Term
To aware the
public by laws,
IEC & penalty
Urban
local body
2. Regular check and
control of burning of
municipal solid waste.
Short Term
We will make a
task force
Urban local
body
4. Construction of
advanced waste
management Site.
Mid Term
Proposal will be
prepared as per
need
Urban local
body
6. Restriction on open
burning of biomass and
plastic
Short Term Task force will
be made
Urban local
body
7. Immediate lifting of
solid waste generated
from desalting and
cleaning of drains for its
disposal
Short Term Always vehicles
are available
RIICO
Urban local
body
8. Transportation of solid
waste, construction Short Term Always
available
RIICO
Urban local
body
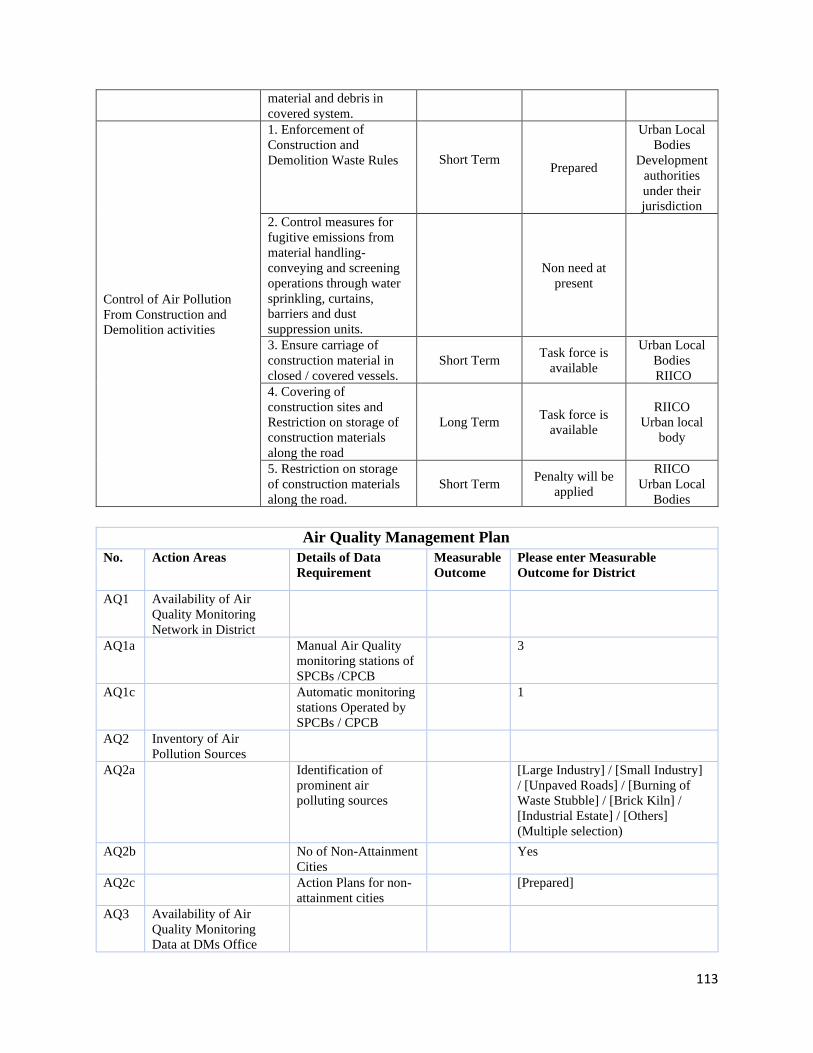
113
material and debris in
covered system.
Control of Air Pollution
From Construction and
Demolition activities
1. Enforcement of
Construction and
Demolition Waste Rules Short Term
Prepared
Urban Local
Bodies
Development
authorities
under their
jurisdiction
2. Control measures for
fugitive emissions from
material handling-
conveying and screening
operations through water
sprinkling, curtains,
barriers and dust
suppression units.
Non need at
present
3. Ensure carriage of
construction material in
closed / covered vessels.
Short Term Task force is
available
Urban Local
Bodies
RIICO
4. Covering of
construction sites and
Restriction on storage of
construction materials
along the road
Long Term Task force is
available
RIICO
Urban local
body
5. Restriction on storage
of construction materials
along the road.
Short Term Penalty will be
applied
RIICO
Urban Local
Bodies
Air Quality Management Plan
No. Action Areas Details of Data
Requirement
Measurable
Outcome
Please enter Measurable
Outcome for District
AQ1 Availability of Air
Quality Monitoring
Network in District
AQ1a Manual Air Quality
monitoring stations of
SPCBs /CPCB
3
AQ1c Automatic monitoring
stations Operated by
SPCBs / CPCB
1
AQ2 Inventory of Air
Pollution Sources
AQ2a Identification of
prominent air
polluting sources
[Large Industry] / [Small Industry]
/ [Unpaved Roads] / [Burning of
Waste Stubble] / [Brick Kiln] /
[Industrial Estate] / [Others]
(Multiple selection)
AQ2b No of Non-Attainment
Cities
Yes
AQ2c Action Plans for non-
attainment cities
[Prepared]
AQ3 Availability of Air
Quality Monitoring
Data at DMs Office
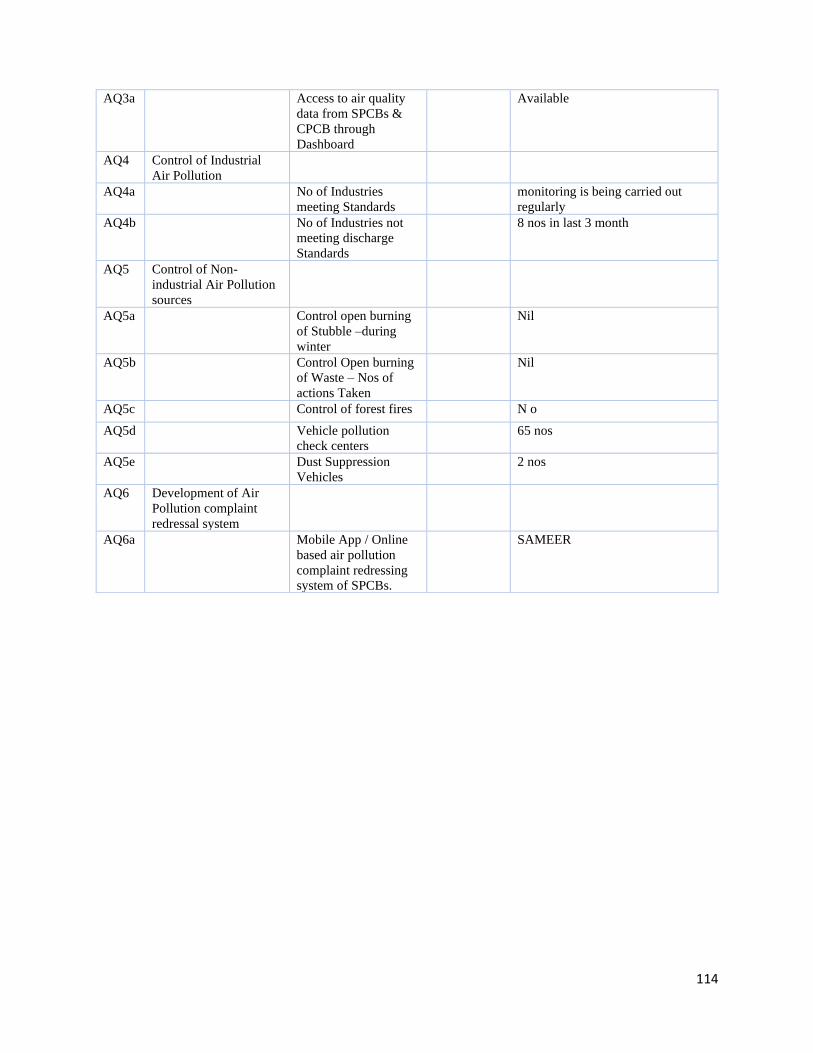
114
AQ3a Access to air quality
data from SPCBs &
CPCB through
Dashboard
Available
AQ4 Control of Industrial
Air Pollution
AQ4a No of Industries
meeting Standards
monitoring is being carried out
regularly
AQ4b No of Industries not
meeting discharge
Standards
8 nos in last 3 month
AQ5 Control of Non-
industrial Air Pollution
sources
AQ5a Control open burning
of Stubble –during
winter
Nil
AQ5b Control Open burning
of Waste – Nos of
actions Taken
Nil
AQ5c Control of forest fires N o
AQ5d Vehicle pollution
check centers
65 nos
AQ5e Dust Suppression
Vehicles
2 nos
AQ6 Development of Air
Pollution complaint
redressal system
AQ6a Mobile App / Online
based air pollution
complaint redressing
system of SPCBs.
SAMEER
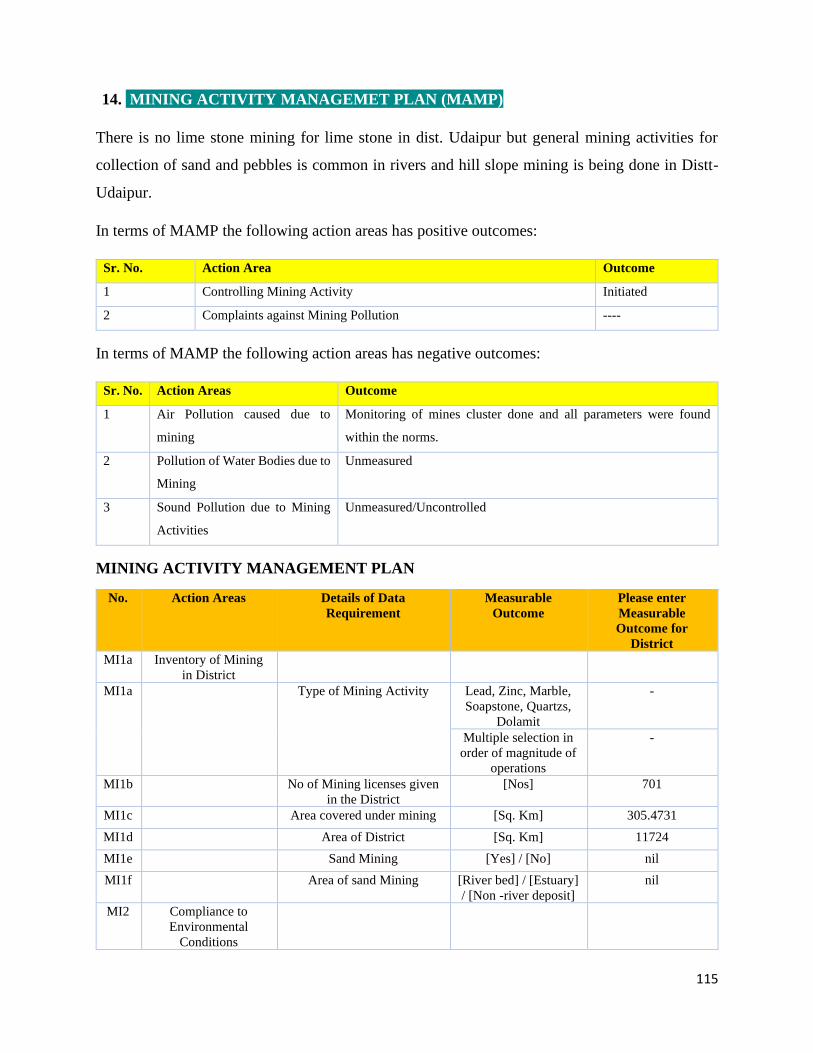
115
14. MINING ACTIVITY MANAGEMET PLAN (MAMP)
There is no lime stone mining for lime stone in dist. Udaipur but general mining activities for
collection of sand and pebbles is common in rivers and hill slope mining is being done in Distt-
Udaipur.
In terms of MAMP the following action areas has positive outcomes:
Sr. No. Action Area Outcome
1 Controlling Mining Activity Initiated
2 Complaints against Mining Pollution ----
In terms of MAMP the following action areas has negative outcomes:
Sr. No. Action Areas Outcome
1 Air Pollution caused due to
mining
Monitoring of mines cluster done and all parameters were found
within the norms.
2 Pollution of Water Bodies due to
Mining
Unmeasured
3 Sound Pollution due to Mining
Activities
Unmeasured/Uncontrolled
MINING ACTIVITY MANAGEMENT PLAN
No. Action Areas Details of Data
Requirement
Measurable
Outcome
Please enter
Measurable
Outcome for
District
MI1a Inventory of Mining
in District
MI1a Type of Mining Activity Lead, Zinc, Marble,
Soapstone, Quartzs,
Dolamit
-
Multiple selection in
order of magnitude of
operations
-
MI1b No of Mining licenses given
in the District
[Nos] 701
MI1c Area covered under mining [Sq. Km] 305.4731
MI1d Area of District [Sq. Km] 11724
MI1e Sand Mining [Yes] / [No] nil
MI1f Area of sand Mining [River bed] / [Estuary]
/ [Non -river deposit]
nil
MI2 Compliance to
Environmental
Conditions
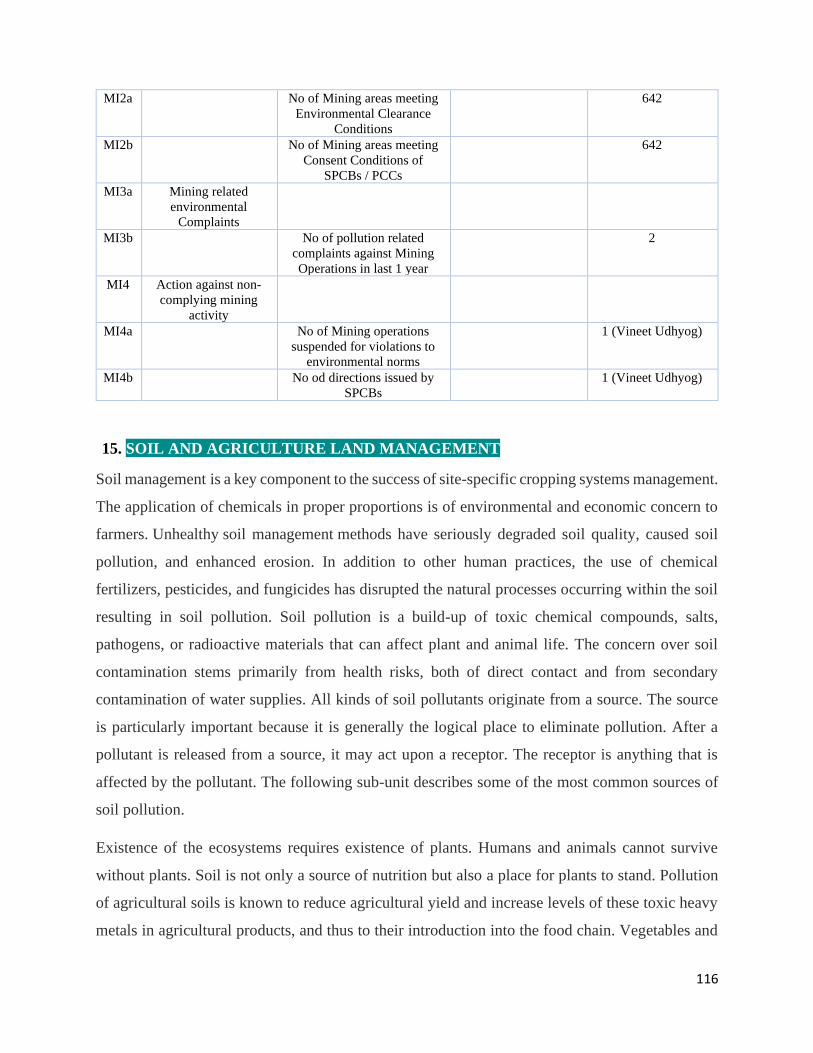
116
MI2a No of Mining areas meeting
Environmental Clearance
Conditions
642
MI2b No of Mining areas meeting
Consent Conditions of
SPCBs / PCCs
642
MI3a Mining related
environmental
Complaints
MI3b No of pollution related
complaints against Mining
Operations in last 1 year
2
MI4 Action against non-
complying mining
activity
MI4a No of Mining operations
suspended for violations to
environmental norms
1 (Vineet Udhyog)
MI4b No od directions issued by
SPCBs
1 (Vineet Udhyog)
15. SOIL AND AGRICULTURE LAND MANAGEMENT
Soil management is a key component to the success of site-specific cropping systems management.
The application of chemicals in proper proportions is of environmental and economic concern to
farmers. Unhealthy soil management methods have seriously degraded soil quality, caused soil
pollution, and enhanced erosion. In addition to other human practices, the use of chemical
fertilizers, pesticides, and fungicides has disrupted the natural processes occurring within the soil
resulting in soil pollution. Soil pollution is a build-up of toxic chemical compounds, salts,
pathogens, or radioactive materials that can affect plant and animal life. The concern over soil
contamination stems primarily from health risks, both of direct contact and from secondary
contamination of water supplies. All kinds of soil pollutants originate from a source. The source
is particularly important because it is generally the logical place to eliminate pollution. After a
pollutant is released from a source, it may act upon a receptor. The receptor is anything that is
affected by the pollutant. The following sub-unit describes some of the most common sources of
soil pollution.
Existence of the ecosystems requires existence of plants. Humans and animals cannot survive
without plants. Soil is not only a source of nutrition but also a place for plants to stand. Pollution
of agricultural soils is known to reduce agricultural yield and increase levels of these toxic heavy
metals in agricultural products, and thus to their introduction into the food chain. Vegetables and
117
crop plants grown in such soils take up these toxic elements and pose health risk to humans and
animals feeding on these plants. The major concern approximately soil pollution is that there are
many sensitive lands uses where people are in direct contact with soils such as residences, parks,
schools and playgrounds. Other contact mechanisms include contamination of drinking water or
inhalation of soil contaminants which have vaporized. There is a very large set of health
consequences from exposure to soil contamination depending on pollutant type, pathway of attack
and vulnerability of the exposed population.
As part of the biosphere, forests are very important for maintaining ecological balance and provide
many environmental benefits. In addition to timber and paper products, forests provide wildlife
habitat, prevent flooding and soil erosion, help provide clean air and water, and contain tremendous
biodiversity. Forests are also an important defense against global climate change. Forests produce
life-giving oxygen and consume carbon dioxide, the compound that is claimed to be the most
responsible for global warming through photosynthesis, thereby reducing the effects of global
warming.
Soil Health Data of Udaipur District:
Major soils of Udaipur district have developed in situ on Aravali metamorphic and alluvium. The
hills and ridges of the district are mainly covered by rock outcrops associated with very shallow
well drained, skeletal soils occurring on steep slopes and are severely eroded. Soils on foot slopes
and pediments are shallow to moderately shallow, well drained, loamy in texture and moderate to
severely eroded. In eastern parts of the district, the soils are alluvium in nature and deep, well
drained, fine textured occurring on gently sloping plains. Salinity and sodicity in patches have
developed in the depression and basin like land forms.
Soil Depth
In Udaipur district the very shallow to shallow soils constitute 19 percent area, moderately shallow
soils to moderately deep 43.9 percent and deep soils 8.9 percent area. The rock out crops covers
an area of 27.5 percent.
Particle size class
Particle size class distribution of Udaipur district shows 45.4 percent fine loam to clay and 8.3
percent coarse loam to loam soils. Skeletal soils constitute 18.2 percent of the area besides 27.5
percent rock outcrops.
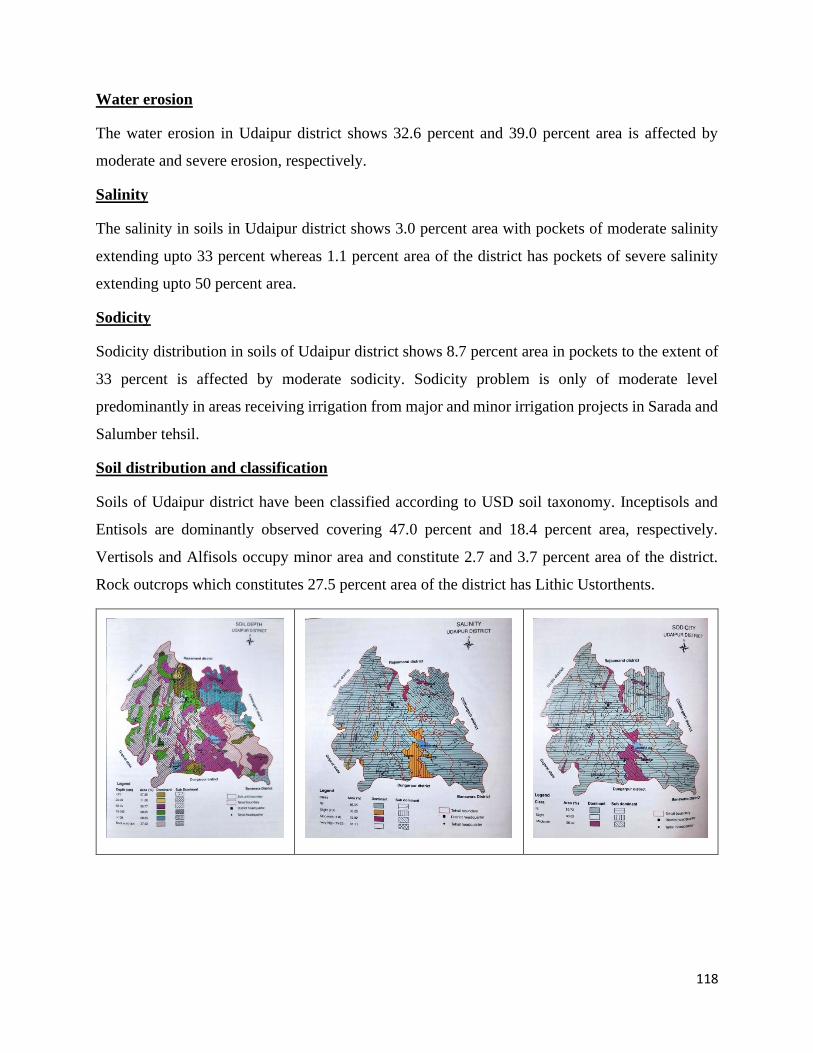
118
Water erosion
The water erosion in Udaipur district shows 32.6 percent and 39.0 percent area is affected by
moderate and severe erosion, respectively.
Salinity
The salinity in soils in Udaipur district shows 3.0 percent area with pockets of moderate salinity
extending upto 33 percent whereas 1.1 percent area of the district has pockets of severe salinity
extending upto 50 percent area.
Sodicity
Sodicity distribution in soils of Udaipur district shows 8.7 percent area in pockets to the extent of
33 percent is affected by moderate sodicity. Sodicity problem is only of moderate level
predominantly in areas receiving irrigation from major and minor irrigation projects in Sarada and
Salumber tehsil.
Soil distribution and classification
Soils of Udaipur district have been classified according to USD soil taxonomy. Inceptisols and
Entisols are dominantly observed covering 47.0 percent and 18.4 percent area, respectively.
Vertisols and Alfisols occupy minor area and constitute 2.7 and 3.7 percent area of the district.
Rock outcrops which constitutes 27.5 percent area of the district has Lithic Ustorthents.
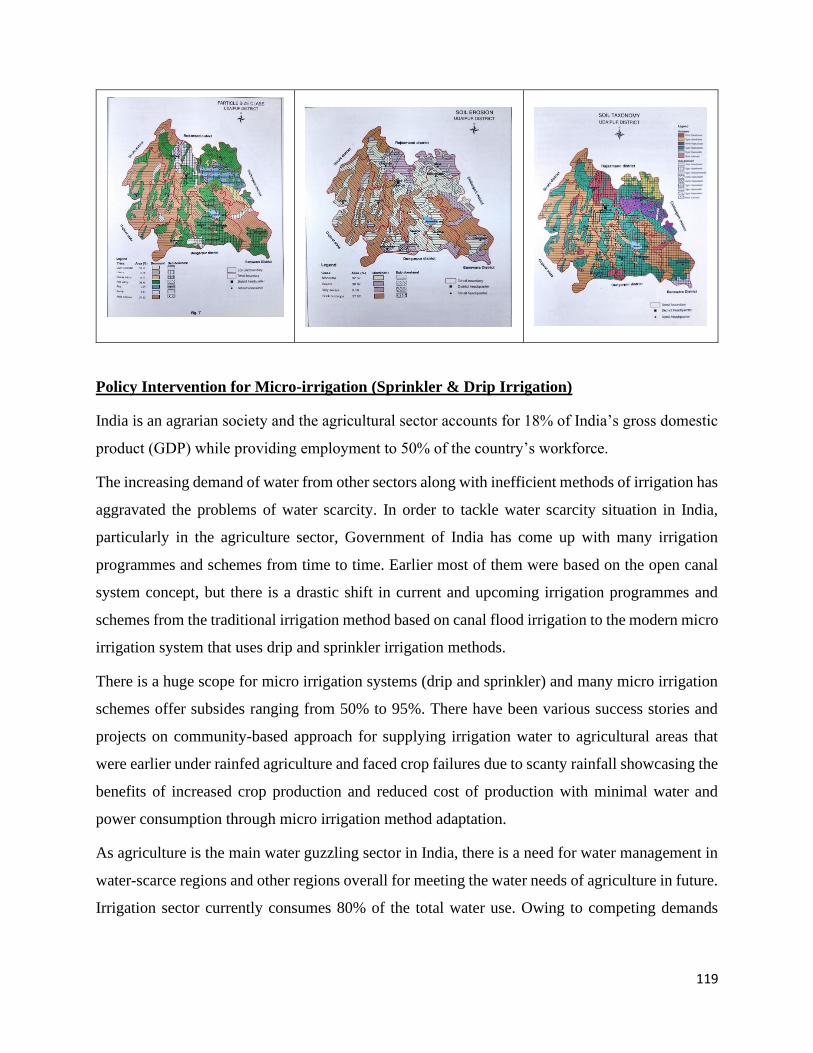
119
Policy Intervention for Micro-irrigation (Sprinkler & Drip Irrigation)
India is an agrarian society and the agricultural sector accounts for 18% of India’s gross domestic
product (GDP) while providing employment to 50% of the country’s workforce.
The increasing demand of water from other sectors along with inefficient methods of irrigation has
aggravated the problems of water scarcity. In order to tackle water scarcity situation in India,
particularly in the agriculture sector, Government of India has come up with many irrigation
programmes and schemes from time to time. Earlier most of them were based on the open canal
system concept, but there is a drastic shift in current and upcoming irrigation programmes and
schemes from the traditional irrigation method based on canal flood irrigation to the modern micro
irrigation system that uses drip and sprinkler irrigation methods.
There is a huge scope for micro irrigation systems (drip and sprinkler) and many micro irrigation
schemes offer subsides ranging from 50% to 95%. There have been various success stories and
projects on community-based approach for supplying irrigation water to agricultural areas that
were earlier under rainfed agriculture and faced crop failures due to scanty rainfall showcasing the
benefits of increased crop production and reduced cost of production with minimal water and
power consumption through micro irrigation method adaptation.
As agriculture is the main water guzzling sector in India, there is a need for water management in
water-scarce regions and other regions overall for meeting the water needs of agriculture in future.
Irrigation sector currently consumes 80% of the total water use. Owing to competing demands
120
from other sectors, it is expected that water consumption in this sector will probably reduce to
about 70% by 2050.
The Goal 4 of National Water Mission, 2008 of India highlights the main objective of NWM,
which is to improve water use efficiency at least by 20% in all sectors, including domestic,
industrial, agricultural and commercial. This objective can be attained by enhancing the efficiency
of the demand side and the supply side in agriculture sector by the use of micro irrigation
techniques.
Micro irrigation ensures conservation and the efficient use of water, minimal wastage of water and
higher productivity of crops with less water consumption by the usage of the drip irrigation method
and the sprinkler irrigation method, respectively. For optimal and efficient use of surface and
groundwater sources for irrigation, micro irrigation method usage is one of the effective ways to
grow more crops with less water.
Micro irrigation includes the usage of drip and sprinkler systems. Micro irrigation could be one of
the solutions to the challenges and issues faced by Indian agriculture. The water use efficiency of
the flood method of irrigation in India is estimated to be only around 40%. This is mainly due to
the significant losses through conveyance, distribution and evaporation, whereas micro irrigation
systems can provide water use efficiency from 80% to 95%. The reason for this difference is
because transmission loss is nominal, while losses through evaporation, run-off and deep
percolation are also reduced significantly by using micro irrigation methods. Efficient water use
results in additional benefits such as an increase in the area coverage under irrigation with the same
amount of water as well as increasing the potential usage of marginal/degraded land using micro
irrigation systems. Listed below are several major reasons for adopting micro irrigation:
*Water use efficiency
* Reduction in energy consumption
* Reduction in fertilizer consumption
* Productivity enhancement of fruits/crops and vegetables
* Irrigation cost saving & Increase in Farmers’ income
In spite of the well-known benefits of modern irrigation methods such as surface or sub-surface
drip and sprinkler irrigation systems, they are not widely adopted on large scale by farmers because
121
of high capital cost, non-reliable sources of water for the system, marginal and scattered
agricultural landholdings, unavailability of subsidy at the required time or the delayed release of
funds for installation of MIS that have already been approved, and the absence of easy financing
mechanisms for farmers. Another hindrance for the poor adoption of these technologies is due to
farmers’ preference for traditional methods of irrigation owing to lack of knowledge of the benefits
of MIS and lack of a dedicated team to support micro irrigation on field for farmers.
In Udaipur district every year sufficient targets are allotted for purchase on subsidy by
farmers, of water saving devices like irrigation pipeline under PMKSY and of sprinklers,
mini sprinklers, micro sprinklers, drip irrigation under National Horticulture Mission
(NHM).
Policy Interventions for Reduction in use of Pesticide
Pesticides play a sensitive role in food systems: they are applied in order to protect crops, but they
can have negative impacts on environment and human health. While global pesticide use has
grown to 3.5 billion kg active ingredients per year, a significant portion of the chemicals applied
has proved to be excessive, uneconomic or unnecessary both in industrialized and developing
countries. For society as a whole it would be desirable to gradually reduce pesticide use to a level
where negative impacts – externalities like health hazards, biodiversity loss or water pollution – at
least do not outweigh the value added in terms of yields or cost savings in production.
Today there is a consensus among a wide range of stakeholders that pesticide use needs to be
gradually reduced to a level that is effectively required to ensure crop production, and that risks of
pesticide application need to be reduced as far as possible. Experience across the world shows that
pesticide use can be reduced considerably without unduly reducing yields or increasing costs of
production. A step-wise reduction of pesticide use is feasible already within the current production
systems and with the knowledge, technologies and alternatives available today.
There is a large body of scientific evidence that the current use of pesticides has unwanted side
effects on human health and environment. These externalities are particularly grave in some
developing countries and emerging economies because of the widespread use of highly hazardous
pesticides, the low level of awareness on risks and the lack of protective equipment. Phasing out
of highly hazardous pesticides is therefore absolutely necessary also in these countries.
122
Farmers do not apply pesticides without reason but in order to ensure productivity, to manage
entrepreneurial risks and to compete in the market in terms of quality and price. Pesticide use is
often cheaper than using alternatives like biocontrol or mechanical pest and weed management.
Traders, retailers and consumers expect cheap and visually perfect products. The amount of
pesticides needed to protect crops depends on the robustness of the farming system. Over the past
decades diversity in farming systems has been greatly reduced in terms of crops and varieties
grown as well as in natural habitats. In order to succeed with pesticide reduction, it is therefore
essential to bring diversity back into agriculture. Farming systems need to be redesigned or
adjusted based on the available knowledge on agro-ecology. Suitable 5 agronomic practices like
crop rotation and the use of resistant varieties are key preventive measures. Breeding strategies are
needed to create robust varieties that facilitate the introduction of agro-ecological farming systems
at large scale. In addition, farmers need to avail of various means to effectively manage pests,
diseases and weeds. Biocontrol, the use of botanical extracts and other organic farming methods
offer promising options and need to be strengthened. More public research is needed in order to
advance the design of better farming systems and the development of alternatives to synthetic
pesticides. Agro-ecology, integrated pest management and the use of alternatives need to be
integrated in vocational education, training and technical advice to farmers. Best practice from
different approaches needs to be identified in order to design more resilient farming systems and
better management practices. As farmers mainly learn from practical experience it is important to
demonstrate alternatives in plot trials and pilot farms and to facilitate the exchange of knowhow.
In addition, it is important that farmers are made aware of the risks associated with pesticide use
and get equipped with feasible measures to reduce these risks. Pesticide reduction is a shared
responsibility of the overall society, including scientists, farmers, consumers, governments and the
private sector. Food brands, processors and retailers take a crucial role in increasing the demand
for low- or no-pesticide products which is an essential driver for pesticide reduction. They can
demand that their suppliers do not use hazardous pesticides and that measures are taken to
gradually reduce pesticide use. They are well placed to promote resistant varieties and to raise
awareness among consumers. An increase in demand for organic products and for products from
integrated production significantly contributes to reduce pesticide use. Increasing the product
range and the sales of organic products is therefore an important contribution to pesticide
reduction. In addition, brands and retailers can convert entire products to compliance with
123
minimum sustainability standards that address pesticide use to some extent. There is a need for
more awareness raising among consumers with regard to what is “good food” - a product that is
safe, healthy, tasty, good for the environment and good for those who produce it, but not
necessarily visually perfect. Fact-based information on pesticide issues and on ways to reduce
pesticide use and risks also needs to be conveyed to scientists, government offices, public health
and consumer organizations, the management of relevant companies, investors etc. so that all
stakeholder pull in the same direction. Governments have a range of policy instruments to find a
responsible balance between enabling judicious pesticide use where needed, and reducing the
adverse health, environmental and agronomic risks. When health and environmental costs are
factored in, pesticide application is only economical at a much lower threshold than what is
commonly practiced. A pesticide tax is therefore a worthwhile tool to internalize and minimize
externalities of pesticide use. However, to be effective, the tax needs to differentiate between levels
of toxicity or hazard. The income generated through the tax should be used to support alternatives.
Pesticide use is already highly regulated by national legislation and international conventions and
policies. The long-term effects of using multiple pesticides, however, need to be better understood,
and transparency in registration processes needs to be improved in order to allow informed
weighing of risks against benefits of pesticides. By revisiting regulations and policies governments
can set a conducive environment for pesticide reduction. The development of national action plans
to reduce pesticide risks is an important opportunity for reducing externalities and for promoting
alternatives. They can enhance enforcement of existing legislation and boost efforts and
innovations. It is important, however, that action plans include binding and measurable reduction
goals as well as milestones to get there.
How to approach pesticide reduction
It is obvious that there is no single or quick solution to reduce pesticide use and the associated
risks. There is a consensus that pesticide reduction requires a set of changes in current production
systems, value chains and in the policy environment. Three factors are required to work together
(see figure below): availability of and know-how on alternatives, increasing demand for low-/no-
pesticide products and conducive legislation and policies.
Joint responsibility
124
Pesticide reduction is a joint responsibility that cannot be burdened on the farmer alone. Pesticide
reduction positively affects public goods and reduces costs currently borne by society. Therefore,
the investment of public funds for pesticide reduction is justified. It also is in the interest of the
private sector as it can result in competitive advantage or offer new business opportunities.
Investments of the private sector in the development and promotion of alternatives is crucial.
Pesticide reduction will only succeed if there is collaboration among different kinds of
stakeholders, particularly of stakeholders along the value chain from producers to consumers.
Addressing trade-offs
When pursuing pesticide reduction, it is important to openly address possible trade-offs. It is most
critical to de-couple pesticide use and long-term yields. Pesticide reduction is not a reasonable
option for a country if it coincides with substantial reduction of yields and increased import from
places where pesticides are used indiscriminately. Pesticide reduction also needs to be compatible
with the need to secure farm incomes and to keep production risks low. There are also possible
trade-offs between pesticide reduction and other objectives like soil conservation (no-till farming
may require herbicide use) and reducing greenhouse gas emissions (mechanical weeding may
require more energy) that need to be openly discussed.
Re-designing farming systems based on agro-ecology
In order to reduce reliance on pesticides it is crucial to get diversity back into crops, farming
systems and landscapes. Farming systems need to be redesigned or adjusted based on the available
knowledge on agro-ecology. Additional research is required to increase the understanding of how
diversity can be used to protect crops. Farmers need to avail of various preventive and curative
means to effectively manage pests, diseases and weeds (including management of resistance).
Agricultural diversity is enhanced when diverse farming systems are co-existing in a region (i.e.
integrated and organic systems).
Advancing alternative crop protection methods There is a broad consensus that more
alternatives are needed that are scalable. Biocontrol options through augmentation of predators,
release of beneficial organisms or application of microbes still offer an important potential that
needs to be used. Botanical extracts and microorganisms show many beneficial impacts and
present a huge opportunity to develop “safer” active ingredients. However, their potential hazards
need to be thoroughly tested in order to avoid unintended consequences. In order to develop,
125
register and commercialize these new products considerable investments are needed. New ways
of funding the development of alternative crop protection methods and new business models for
crop protection services are needed.
In Udaipur district the annual consumption of pesticides in agriculture is very much non-
significant, hence environment pollution here due to these chemicals is not a serious threat
here right now or in future too. Field staff of agriculture department in Udaipur regularly
teaches farmers for consumptive use of chemicals. Also, the department is promoting organic
farming among farmers through various schemes like PKVY and ZBNF.
Policy Interventions for Reduction in use of Chemical Fertilizers:
In the mid-1960s, when projections of global starvation were common, no one questioned the role
of mineral fertilizer (plant nutrients, mainly nitrogen, phosphorus, and potassium from inorganic
sources) in promoting food production in the food-deficit countries. On the contrary, fertilizer use
was an integral part of the technological trinity--improved seed, irrigation, and fertilizer--
responsible for bringing about the Green Revolution that helped many densely populated countries,
including India and China, achieve food self-sufficiency in the short span of 20 to 25 years. In the
early 1990s, however, fertilizer became a target of criticism mainly because of heavy use in the
developed countries, where it was suspected of having an adverse impact on the environment
through nitrate leaching, eutrophication, greenhouse gas emissions, and heavy metal uptakes by
plants. Consequently, fertilizer use per se was mistakenly identified as an enemy of the
environment.
The Need for Fertilizer
Although fertilizer use can contribute to environmental contamination unless managed properly,
it is often an indispensable source of the nutrients required for plant growth and food production.
Unless the nutrients removed are replaced in proper amounts from both organic and inorganic
sources, crop production cannot be sustained: the soil will become degraded. In many developing
countries, especially in Sub-Saharan Africa, nutrient mining has become a serious problem:
nutrient removal exceeds nutrient replenishment by a factor of 3 to 4. Because crop residues are
used for fuel, fodder, and construction material, nutrient supply from organic sources is limited,
and supply from external sources become essential. Even for leguminous crops, which can fix
nitrogen from the atmosphere, phosphorus and potassium must be externally supplied.
126
Environmental and Energy Concerns
Fertilizer use requires judicious management. Improper and excessive use can harm the
environment. High levels of nitrates in drinking water can be harmful to human health, especially
for infants less than six months old. Nitrate leaching has been highly correlated with nitrogen
applications higher than the agronomic maximum. Eutrophication is caused by the deposits of
nitrate and phosphate in lakes, ponds, and other water bodies, leading to excessive growth of algae,
which can result in oxygen depletion and fish mortality. Plants take up cadmium from phosphate
fertilizer derived from cadmium rich phosphate rocks, but how cadmium is transferred from
phosphate fertilizer to food crops and then to human beings is not well established. These
environmental are caused by excessive amounts of nitrate and phosphate in soil or water bodies.
While mineral fertilizer is one possible source of these nutrients, other sources include organic
fertilizer, animal manure, and industrial and urban wastes. High levels of nitrate in the water have
largely been linked to animal manure in many European countries. In the developing countries,
high nitrate levels are also linked to sewage disposal, septic tank drainage, and industrial wastes.
Thus, the issue is one of integrated management of all sources of nutrients in agricultural areas, so
that total nutrient supply is below the agronomic maximum. Prevention of erosion and runoff is
another management strategy that reduces pollution and maintains soil productivity. In the past,
the emphasis has been on increased use of fertilizer; the approach now must shift to educating
farmers to use organic, inorganic, and biological fertilizer optimally. Today, the dominant use of
nitrogen-based fertilizer in developing countries has led to an imbalance of nutrients in soils. To
improve the efficiency of nitrogen fertilizer, use and to minimize adverse environmental effects,
nutrient balance should be improved by promoting the use of phosphate and potash fertilizers.
Moreover, 50 to 60 percent of applied fertilizer nutrients are lost to the atmosphere. Nutrient losses
can be reduced by proper timing, application, and placement of fertilizer products and by
controlling soil erosion and water runoff. Reducing nutrient losses will promote economic
efficiency and protect the environment. Although fertilizer use has increased rapidly in the last
few decades, especially in East Asia, fertilizer use is still too low to cause environmental damage
in many developing countries. In some areas, such as Java in Indonesia, Punjab in India, and the
Delta region in Egypt, where application rates are high, measures to monitor environmental impact
are required to avoid potential damage. Because of low percolation rates, nitrate leaching does not
occur from flooded paddy fields, which account for 60 to 70 percent of nitrogen fertilizer use in
127
the East Asian countries, but nitrate contamination of rivers and lakes caused by nitrogen runoff
from such fields warrants special attention. High applications of nitrogen in irrigated and high-
rainfall areas with light-textured soils and vegetable crops should be managed carefully because
such conditions promote nitrate leaching. The World Health Organization has established that
nitrate levels in the drinking water should not exceed 50 milligrams per litre of water; where levels
are higher, location-specific programs should be introduced.
Fertilizer production, especially nitrogen production, is energy-intensive, and critics argue that
scarce energy resources should not be wasted in producing fertilizer. However, fertilizer accounts
for only a small fraction of global energy use--2 percent in 1990. For every 1 million Btus of
energy used in the fertilizer sector (equivalent to the energy used in driving a car from Washington,
D.C., to New York City), an additional 218 kilograms of grain--enough to provide the minimum
calorie intake for one person per year--could be produced. In 1990 the price of natural gas averaged
about a dollar per million Btus in many energy-exporting countries.
Therefore, converting energy into food security through fertilizer use offers a cost-effective and
humane alternative for use of the world’s energy resources.
Reforming the Fertilizer Sector
Fertilizer production, import, and marketing has in most developing countries been a public sector
function due to underdeveloped private markets, lack of private investment, and concerns about
food security. The fertilizer sector has been characterized by protection, subsidies, and price
controls. Although this has helped develop fertilizer markets, inefficiencies in resource use and
unsustainable fiscal burdens now mandate a change.
In countries where fertilizer use levels are high and the private sector and financial markets are
well developed, markets should be liberalized, subsidies removed, and the sector privatized to
increase efficiency. Policy and organizational reforms are needed to make fertilizer markets more
competitive, including gradual liberalization of trade policies to allow the private sector to compete
in the international market. Proper sequencing and phasing of these reforms may pose a challenge
because the simultaneous introduction of various policy reforms, including devaluation, subsidy
removal, and closure of public sector enterprises, can lead to a drastic reduction in fertilizer use,
as happened in Ghana, Poland, Russia, and Zambia. More research is needed to understand the
dynamics of policy and organizational reforms.
128
Where fertilizer subsidies or crop price support programs have promoted excessive fertilizer use,
the removal of subsidies and support measures will lead to the convergence of economic and
environmental goals by promoting resource use efficiency, reducing fiscal deficits, and minimizing
environmental damage. Although energy consumption is essential for fertilizer production, energy
use efficiency must be improved. While a modern plant uses about 30 million Btus per ton of
ammonia production, fertilizer plants in many developing and reforming countries use 37 to 61
million Btus. Proper operation and maintenance, revamping of plants, and replacement of old
technologies with new energy efficient technologies are essential.
The Policy Environment
The policy challenge over the next few years is to manage environmental problems in high-use
areas, without losing the productivity benefits of fertilizer. In low-use areas the challenge is to
increase fertilizer use in an environmentally sustainable manner. The following measures are
appropriate to create a conducive and stable policy environment for promoting fertilizer use and
supply:
• Macroeconomic stability, especially stability in the exchange rate, is essential for
promoting growth in fertilizer use and supply. Rapid devaluation of domestic currency
reduces both fertilizers use and supply by increasing costs and reducing investor
confidence. Since many developing countries are not self-sufficient in fertilizer supplies,
adequate and timely allocation of foreign exchange for fertilizer imports should receive
high priority.
• Pricing policy should be managed so that it generates adequate incentives for fertilizer
use by small farmers. Any price distortions should be eliminated. Although fertilizer
subsidies should be carefully phased out, a case can be made for a temporary subsidy in
those landlocked and food-deficit countries where markets are distorted, infrastructure is
inadequate, environmental externalities are positive, and poverty is all-pervasive.
• Efficient and appropriate organizations should be created to ensure that fertilizer reaches
the farm on time, in adequate amounts, and at minimal cost. The private sector should
have the primary responsibility for marketing and distribution of fertilizer. The
government should develop and implement appropriate regulatory and quality control
measures for efficient functioning of the fertilizer markets. In those areas where markets
129
are underdeveloped, the government may take the lead in developing markets and
supporting infrastructure.
• Limited availability of funds for farmers to purchase fertilizers is a major constraint on
fertilizer use. The growing participation of the private sector in fertilizer marketing and
distribution mandates that fertilizer dealers also have access to financial resources. Every
effort should be made to ensure adequate funds at reasonable interest rates for both
farmers and fertilizer dealers.
• To encourage capital investment in fertilizer production and imports, the government
should create a market-friendly environment. Fertilizer self-sufficiency per se should not
be a cherished goal. Joint ventures between technology-rich developed countries and
resource-rich developing countries should receive greater attention.
• Adequate research, extension, and educational support should be provided to farmers.
Soil testing and new technologies suitable for targeted application of fertilizer should be
encouraged.
• Environmental monitoring mechanisms should be instituted and corrective measures
should be introduced. The adoption of appropriate practices and technologies should be
encouraged to minimize adverse environmental effects. Fertilizer use will remain an
essential component of future strategies for ensuring food security and protecting the
natural resource base. In fulfilling that role, however, fertilizer use should be approached
differently in the future. Emphasis should be on growth with management rather than on
growth per se, so that the broader goals of food security, agricultural growth, and
environmental protection are not sacrificed.
In Udaipur district chemical fertilizer use in agriculture sector is very much under the
recommendations as per package of practice of crops. Farmers are being trained here to use
fertilizers in their crops as per recommendations issued in Soil Health Cards (SHC). Farmers
are promoted regularly by department of agriculture to apply more of organic matter to
their fields in form of organic manures and green manures. To reduce the fertilizer load, the
farmers are also trained regularly under various schemes like PKVY, ZBNF etc. for
promotion of organic farming, wherein they are taught to apply organic nutrient
supplements to their soils in place of chemical supplements.
130
Policy Intervention in Reduction in Stubble Burning
India, the second largest agro-based economy with year-round crop cultivation, generates a large
amount of agricultural waste, including crop residues. In the absence of adequate sustainable
management practices, crop waste is burned every year in India, causing excessive particulate
matter emissions and air pollution. Crop residue burning has become a major environmental
problem causing health issues as well as contributing to global warming. Composting, biochar
production and mechanization are a few effective sustainable techniques that can help to curtail
the issue while retaining the nutrients present in the crop residue in the soil. The government of
India has attempted to curtail this problem, through numerous measures and campaigns designed
to promote sustainable management methods such as converting crop residue into energy.
However, the alarming rise of air pollution levels caused by crop residue burning in the city of
Delhi and other northern areas in India observed in recent years. The solution to crop residue
burning lies in the effective implementation of sustainable management practices with
Government interventions and policies.
In Udaipur district Stubble Burning is no problem at all. As land holding size here is mostly
small and marginal, so very small quantity of crop residues are generated during every
season which in turn is utilized as animal fodder. With increasing population pressure and
increased fodder demand, Udaipur will not face problem of stubble burning in future too.
Side by side Department of Agriculture Extension functionaries too regularly teaching
farmers about the ill effects of Stubble burning.
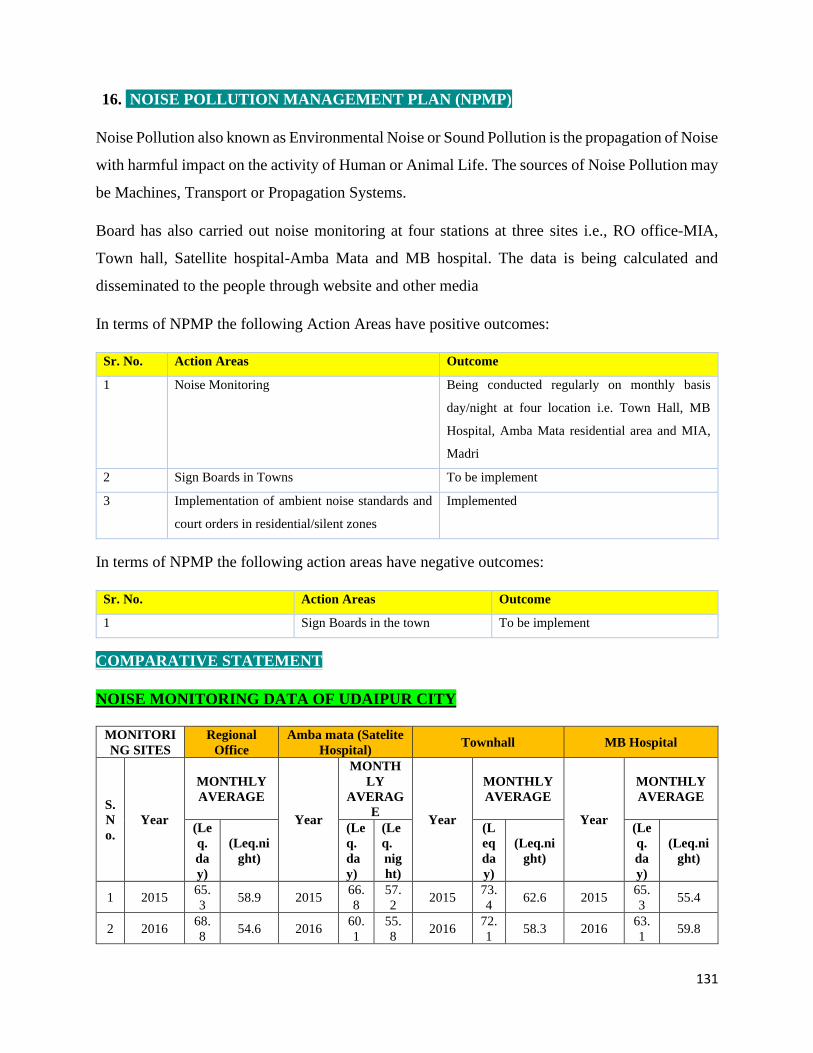
131
16. NOISE POLLUTION MANAGEMENT PLAN (NPMP)
Noise Pollution also known as Environmental Noise or Sound Pollution is the propagation of Noise
with harmful impact on the activity of Human or Animal Life. The sources of Noise Pollution may
be Machines, Transport or Propagation Systems.
Board has also carried out noise monitoring at four stations at three sites i.e., RO office-MIA,
Town hall, Satellite hospital-Amba Mata and MB hospital. The data is being calculated and
disseminated to the people through website and other media
In terms of NPMP the following Action Areas have positive outcomes:
Sr. No. Action Areas Outcome
1 Noise Monitoring Being conducted regularly on monthly basis
day/night at four location i.e. Town Hall, MB
Hospital, Amba Mata residential area and MIA,
Madri
2 Sign Boards in Towns To be implement
3 Implementation of ambient noise standards and
court orders in residential/silent zones
Implemented
In terms of NPMP the following action areas have negative outcomes:
Sr. No. Action Areas Outcome
1 Sign Boards in the town To be implement
COMPARATIVE STATEMENT
NOISE MONITORING DATA OF UDAIPUR CITY
MONITORI
NG SITES
Regional
Office
Amba mata (Satelite
Hospital) Townhall MB Hospital
S.
N
o.
Year
MONTHLY
AVERAGE
Year
MONTH
LY
AVERAG
E Year
MONTHLY
AVERAGE
Year
MONTHLY
AVERAGE
(Le
q.
da
y)
(Leq.ni
ght)
(Le
q.
da
y)
(Le
q.
nig
ht)
(L
eq
da
y)
(Leq.ni
ght)
(Le
q.
da
y)
(Leq.ni
ght)
1 2015 65.
3 58.9 2015
66.
8
57.
2 2015
73.
4 62.6 2015
65.
3 55.4
2 2016 68.
8 54.6 2016
60.
1
55.
8 2016
72.
1 58.3 2016
63.
1 59.8
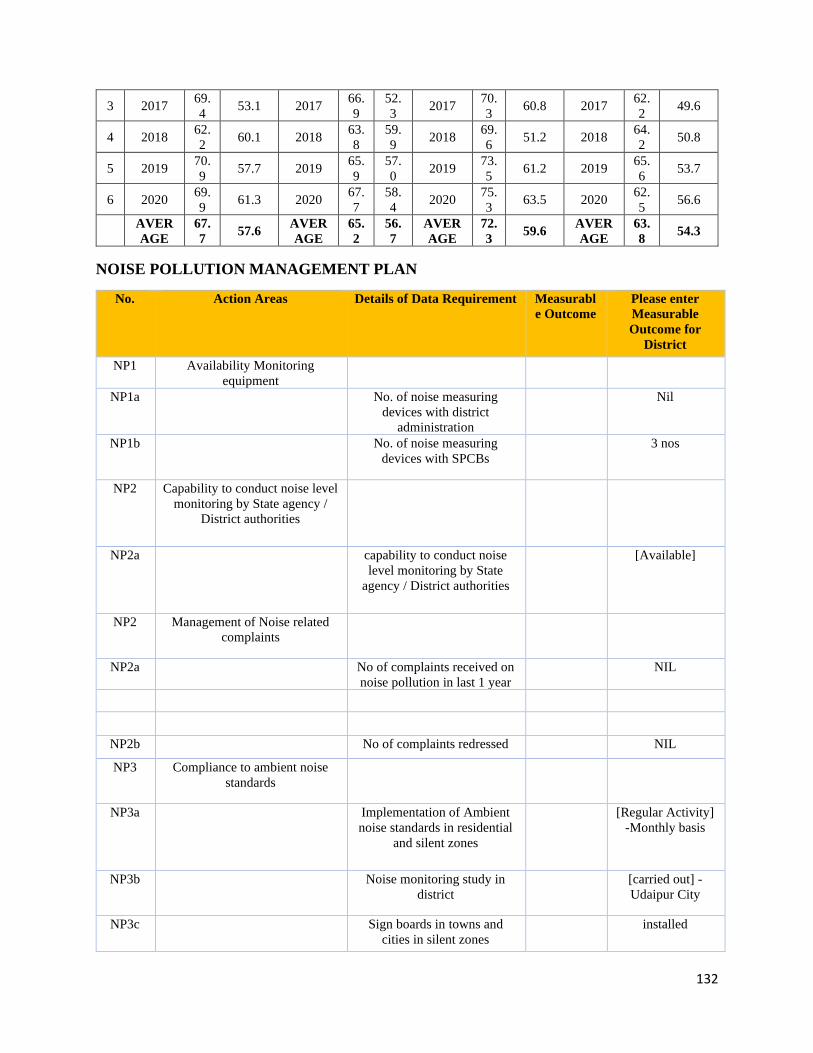
132
3 2017 69.
4 53.1 2017
66.
9
52.
3 2017
70.
3 60.8 2017
62.
2 49.6
4 2018 62.
2 60.1 2018
63.
8
59.
9 2018
69.
6 51.2 2018
64.
2 50.8
5 2019 70.
9 57.7 2019
65.
9
57.
0 2019
73.
5 61.2 2019
65.
6 53.7
6 2020 69.
9 61.3 2020
67.
7
58.
4 2020
75.
3 63.5 2020
62.
5 56.6
AVER
AGE
67.
7 57.6
AVER
AGE
65.
2
56.
7
AVER
AGE
72.
3 59.6
AVER
AGE
63.
8 54.3
NOISE POLLUTION MANAGEMENT PLAN
No. Action Areas Details of Data Requirement Measurabl
e Outcome
Please enter
Measurable
Outcome for
District
NP1 Availability Monitoring
equipment
NP1a No. of noise measuring
devices with district
administration
Nil
NP1b No. of noise measuring
devices with SPCBs
3 nos
NP2 Capability to conduct noise level
monitoring by State agency /
District authorities
NP2a capability to conduct noise
level monitoring by State
agency / District authorities
[Available]
NP2 Management of Noise related
complaints
NP2a No of complaints received on
noise pollution in last 1 year
NIL
NP2b No of complaints redressed NIL
NP3 Compliance to ambient noise
standards
NP3a Implementation of Ambient
noise standards in residential
and silent zones
[Regular Activity]
-Monthly basis
NP3b Noise monitoring study in
district
[carried out] -
Udaipur City
NP3c Sign boards in towns and
cities in silent zones
installed
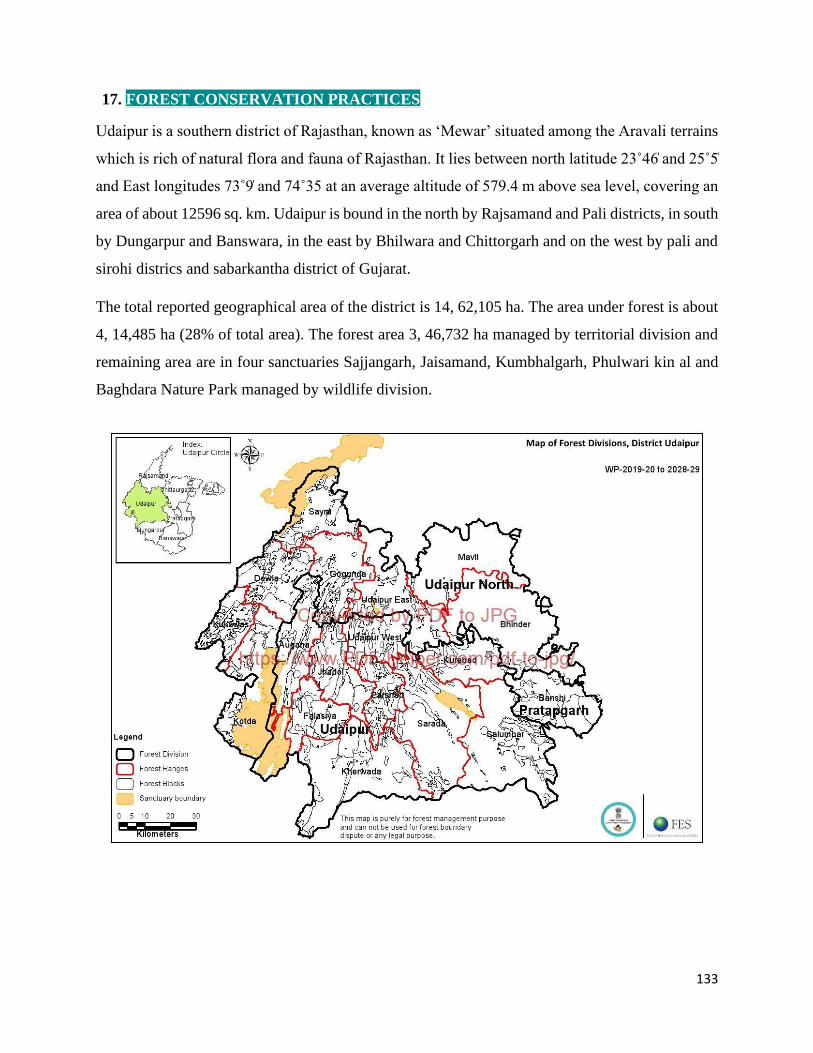
133
17. FOREST CONSERVATION PRACTICES
Udaipur is a southern district of Rajasthan, known as ‘Mewar’ situated among the Aravali terrains
which is rich of natural flora and fauna of Rajasthan. It lies between north latitude 23˚46̍ and 25˚5̍
and East longitudes 73˚9̍ and 74˚35 at an average altitude of 579.4 m above sea level, covering an
area of about 12596 sq. km. Udaipur is bound in the north by Rajsamand and Pali districts, in south
by Dungarpur and Banswara, in the east by Bhilwara and Chittorgarh and on the west by pali and
sirohi districs and sabarkantha district of Gujarat.
The total reported geographical area of the district is 14, 62,105 ha. The area under forest is about
4, 14,485 ha (28% of total area). The forest area 3, 46,732 ha managed by territorial division and
remaining area are in four sanctuaries Sajjangarh, Jaisamand, Kumbhalgarh, Phulwari kin al and
Baghdara Nature Park managed by wildlife division.
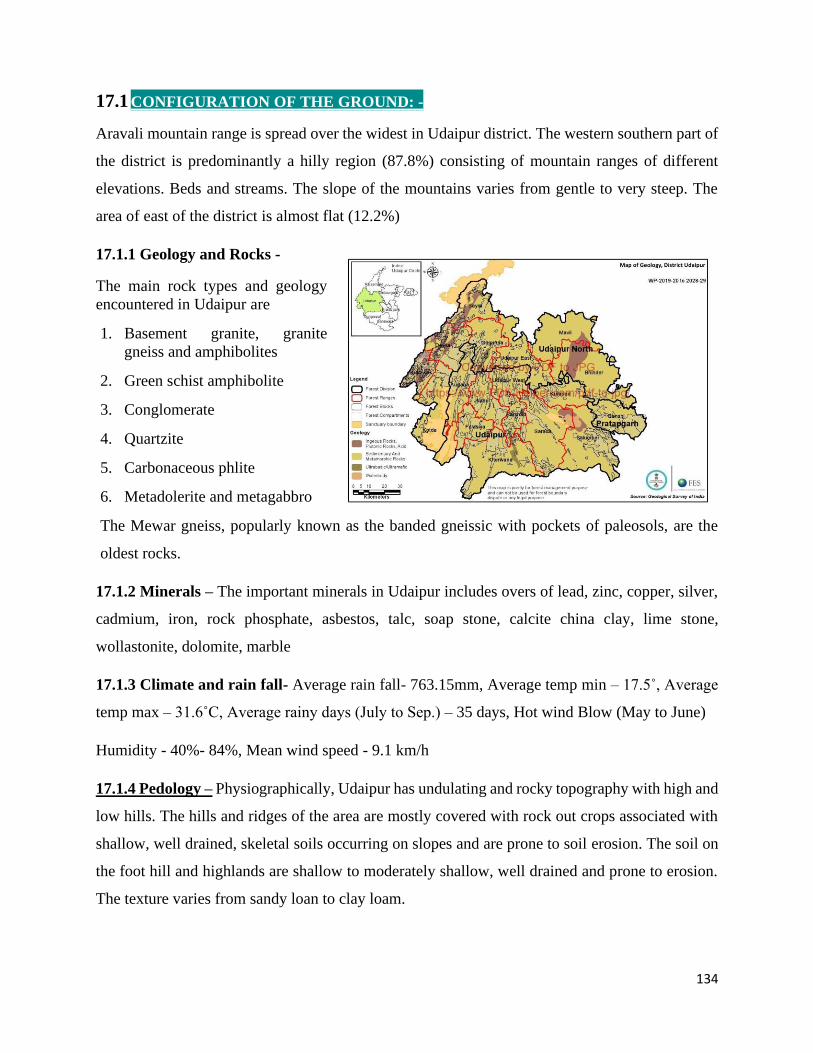
134
17.1 CONFIGURATION OF THE GROUND: -
Aravali mountain range is spread over the widest in Udaipur district. The western southern part of
the district is predominantly a hilly region (87.8%) consisting of mountain ranges of different
elevations. Beds and streams. The slope of the mountains varies from gentle to very steep. The
area of east of the district is almost flat (12.2%)
17.1.1 Geology and Rocks -
The main rock types and geology
encountered in Udaipur are
1. Basement granite, granite
gneiss and amphibolites
2. Green schist amphibolite
3. Conglomerate
4. Quartzite
5. Carbonaceous phlite
6. Metadolerite and metagabbro
The Mewar gneiss, popularly known as the banded gneissic with pockets of paleosols, are the
oldest rocks.
17.1.2 Minerals – The important minerals in Udaipur includes overs of lead, zinc, copper, silver,
cadmium, iron, rock phosphate, asbestos, talc, soap stone, calcite china clay, lime stone,
wollastonite, dolomite, marble
17.1.3 Climate and rain fall- Average rain fall- 763.15mm, Average temp min – 17.5˚, Average
temp max – 31.6˚C, Average rainy days (July to Sep.) – 35 days, Hot wind Blow (May to June)
Humidity - 40%- 84%, Mean wind speed - 9.1 km/h
17.1.4 Pedology – Physiographically, Udaipur has undulating and rocky topography with high and
low hills. The hills and ridges of the area are mostly covered with rock out crops associated with
shallow, well drained, skeletal soils occurring on slopes and are prone to soil erosion. The soil on
the foot hill and highlands are shallow to moderately shallow, well drained and prone to erosion.
The texture varies from sandy loan to clay loam.
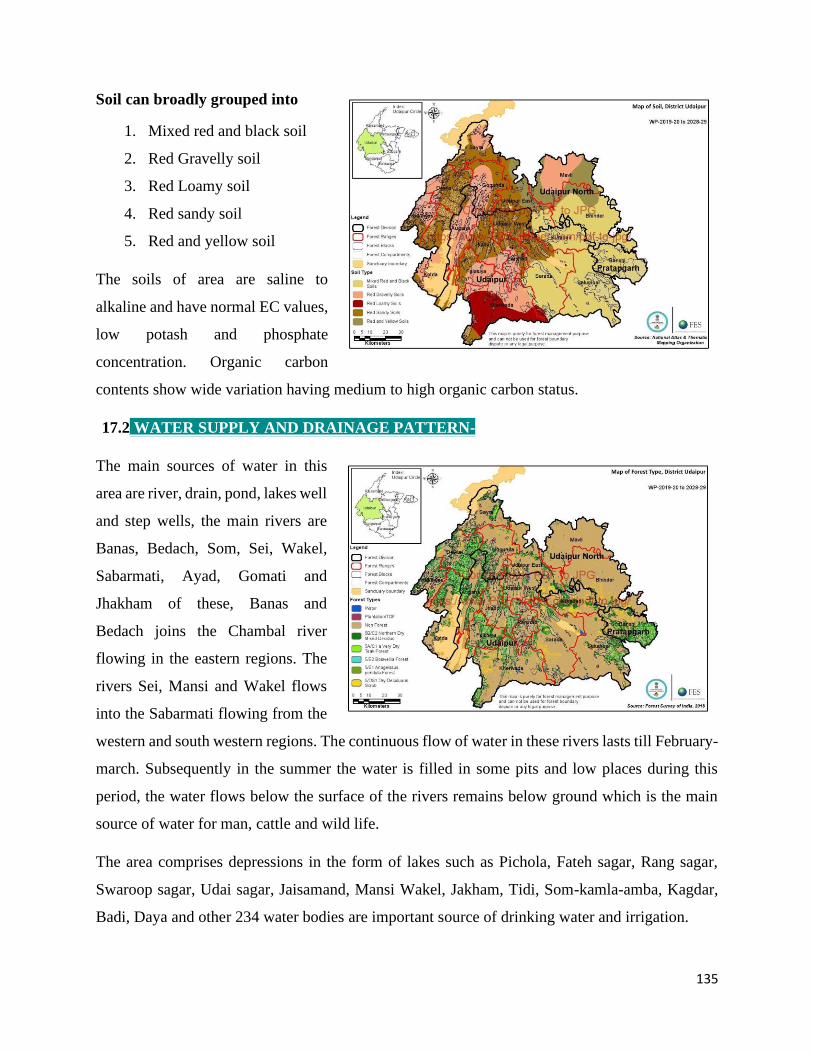
135
Soil can broadly grouped into
1. Mixed red and black soil
2. Red Gravelly soil
3. Red Loamy soil
4. Red sandy soil
5. Red and yellow soil
The soils of area are saline to
alkaline and have normal EC values,
low potash and phosphate
concentration. Organic carbon
contents show wide variation having medium to high organic carbon status.
17.2 WATER SUPPLY AND DRAINAGE PATTERN-
The main sources of water in this
area are river, drain, pond, lakes well
and step wells, the main rivers are
Banas, Bedach, Som, Sei, Wakel,
Sabarmati, Ayad, Gomati and
Jhakham of these, Banas and
Bedach joins the Chambal river
flowing in the eastern regions. The
rivers Sei, Mansi and Wakel flows
into the Sabarmati flowing from the
western and south western regions. The continuous flow of water in these rivers lasts till February-
march. Subsequently in the summer the water is filled in some pits and low places during this
period, the water flows below the surface of the rivers remains below ground which is the main
source of water for man, cattle and wild life.
The area comprises depressions in the form of lakes such as Pichola, Fateh sagar, Rang sagar,
Swaroop sagar, Udai sagar, Jaisamand, Mansi Wakel, Jakham, Tidi, Som-kamla-amba, Kagdar,
Badi, Daya and other 234 water bodies are important source of drinking water and irrigation.

136
The depth of underground water ranges from 5-15 m below land surface.
Forest Types - variation in the structure of forest falling in this region are clearly visible due to
different conditions such as location, nature, soil, water logging pressure, micro environment, hill
slopes’ elevation and changes biotic.
In the hills and rocks As a result, teak forests, Dhok forest and mixed forests are found here. In
terms of scientific management, the following categories of forest are found-
1. Teak forest
2. Mixed forest
3. Salar-godal forest
4. Bamboo forest (mixed)
5. Degraded forest and open area
Forest classification-
According to Champion & Seth classification of forest this region are under “Dry tropical forest
sub division and groups of this classification areas.
1. 5A southern tropical dry deciduous.
C1 Dry teak-bearing forest
C1a very dry teak forest
C1b Dry teak forest
2. 5B Northern tropical dry deciduous forest
C2 northern dry mixed deciduous forest
3. Degraded dry deciduous forest stages
(a) D-S-1 Dry Deciduous forest scrub
(b) D-S-3 Euphorbia scrub
4. Common soil type of dry deciduous forests
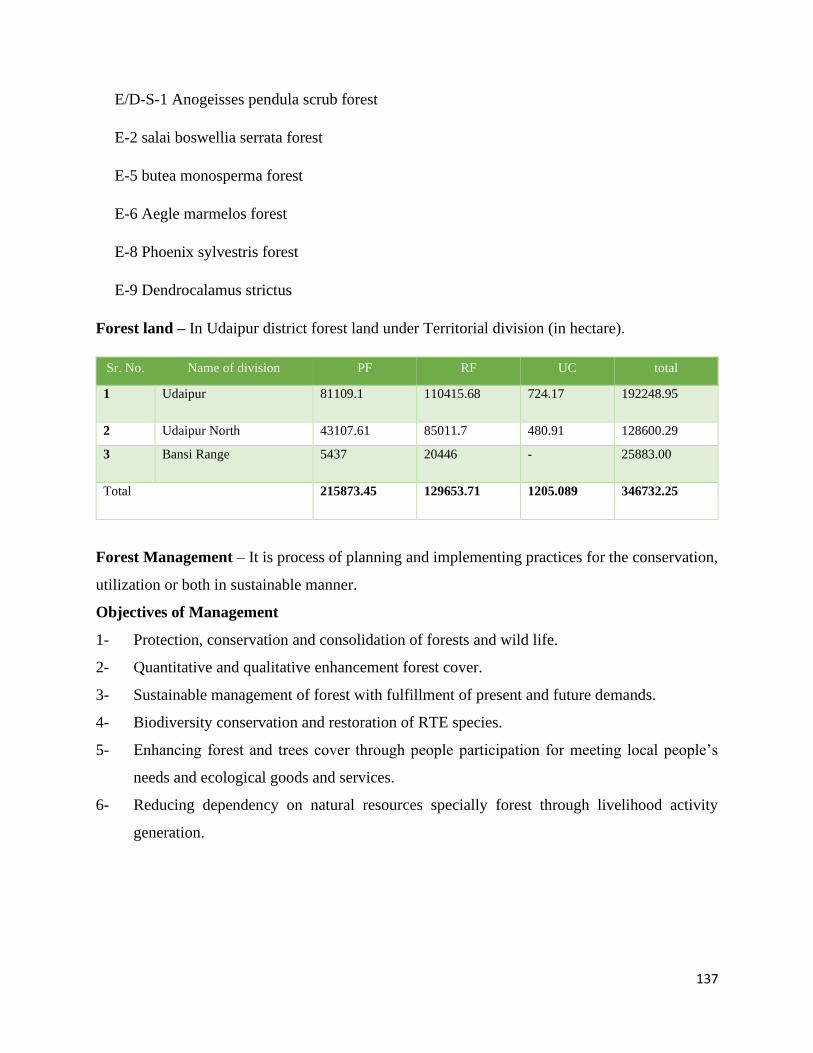
137
E/D-S-1 Anogeisses pendula scrub forest
E-2 salai boswellia serrata forest
E-5 butea monosperma forest
E-6 Aegle marmelos forest
E-8 Phoenix sylvestris forest
E-9 Dendrocalamus strictus
Forest land – In Udaipur district forest land under Territorial division (in hectare).
Sr. No. Name of division PF RF UC total
1 Udaipur 81109.1 110415.68 724.17 192248.95
2 Udaipur North 43107.61 85011.7 480.91 128600.29
3 Bansi Range 5437 20446 - 25883.00
Total 215873.45 129653.71 1205.089 346732.25
Forest Management – It is process of planning and implementing practices for the conservation,
utilization or both in sustainable manner.
Objectives of Management
1- Protection, conservation and consolidation of forests and wild life.
2- Quantitative and qualitative enhancement forest cover.
3- Sustainable management of forest with fulfillment of present and future demands.
4- Biodiversity conservation and restoration of RTE species.
5- Enhancing forest and trees cover through people participation for meeting local people’s
needs and ecological goods and services.
6- Reducing dependency on natural resources specially forest through livelihood activity
generation.
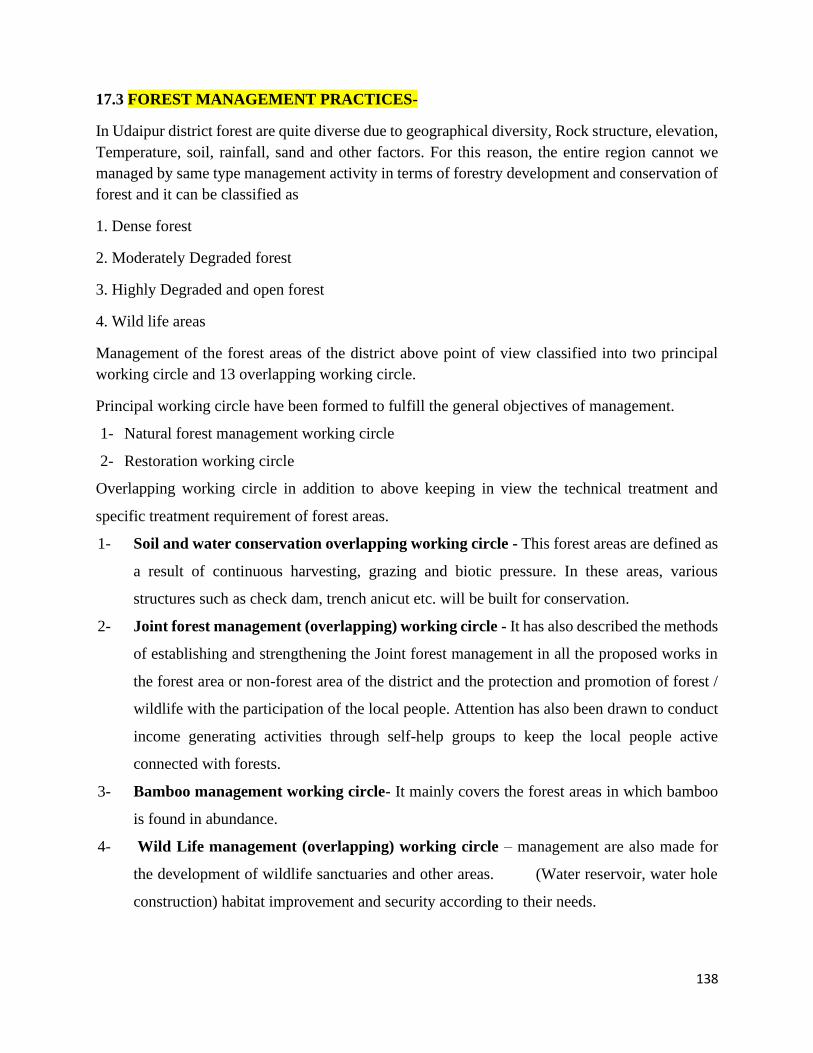
138
17.3 FOREST MANAGEMENT PRACTICES-
In Udaipur district forest are quite diverse due to geographical diversity, Rock structure, elevation,
Temperature, soil, rainfall, sand and other factors. For this reason, the entire region cannot we
managed by same type management activity in terms of forestry development and conservation of
forest and it can be classified as
1. Dense forest
2. Moderately Degraded forest
3. Highly Degraded and open forest
4. Wild life areas
Management of the forest areas of the district above point of view classified into two principal
working circle and 13 overlapping working circle.
Principal working circle have been formed to fulfill the general objectives of management.
1- Natural forest management working circle
2- Restoration working circle
Overlapping working circle in addition to above keeping in view the technical treatment and
specific treatment requirement of forest areas.
1- Soil and water conservation overlapping working circle - This forest areas are defined as
a result of continuous harvesting, grazing and biotic pressure. In these areas, various
structures such as check dam, trench anicut etc. will be built for conservation.
2- Joint forest management (overlapping) working circle - It has also described the methods
of establishing and strengthening the Joint forest management in all the proposed works in
the forest area or non-forest area of the district and the protection and promotion of forest /
wildlife with the participation of the local people. Attention has also been drawn to conduct
income generating activities through self-help groups to keep the local people active
connected with forests.
3- Bamboo management working circle- It mainly covers the forest areas in which bamboo
is found in abundance.
4- Wild Life management (overlapping) working circle – management are also made for
the development of wildlife sanctuaries and other areas. (Water reservoir, water hole
construction) habitat improvement and security according to their needs.
139
5- Non Timber forest produce management working circle – It includes scientific
management, development and sustainable harvesting of MFP.
6- Eco-tourism and Urban forestry management working circle – Identify location for eco-
tourism and emphasizing and motivate the people through eco-tourism, conservation of
forest and wild life, develop green pockets near habitation.
7- Bio-diversity conservation working circle – The measures of protection and promotion of
various species found in district have been prepared and the major species have also been
listed.
8- Grass and grazing management working circle – to meet the demand of grass and grazing
for local people.
9- Tendu working circle – It includes the Tendu forest area.
10- Riparian species working circle – Conservation of vegetation found in the banks of rivers
and streams flowing in the district and moist areas.
11- Invasive species management working circle – In the forest areas of the district, the ill
effects of invasive species as Juli-flora, Lantana, jungli Tulsi etc. are increasing. Measures
have been suggested to control and eradicate invasive species and prevent their adverse
effects on local vegetation.
12- Umbrella species management working circle – Measures of conservation and promotion
of the most useful species found in forest area such as Mango, Mahua, Baheda, Peepal etc.
are given in this working circle. There species have been importance for local people and
wild life.
13- RTE species management working circle – The rare, threatened and endangered species
of the district have been listed. Propagation method and conservation plan have been
proposed.
17.4 THREAT TO FOREST AND FOREST LAND – Major threat to forest are deforestation
and degradation of the forest. Deforestation leads to loss not just of biomass and plant species, but
also of habitats of animals. Deforestation is also said to be a driver of climate change as trees that
normally absorbs Carbon dioxide are no longer there. A region that loses its biodiversity, become
more vulnerable to other environment elements and natural ecological balance disrupted due to
deforestation. The main causes of deforestation and degradation are.
140
1- Forest Fire: - Forest fires poses threat not only to the forest wealth but also to the entire regime
to founa and flora seriously disturbing the biodiversity, ecology and the environment to a
region. Forest fire usually takes place from February to till pre monsoon season. Approximately
40% of the total forest area of the district is forest fire sensitive. In 2018-19, 202 fire incidence
takes place 4532-hectare area was affected by the fire.
Natural and anthropogenic reasons for fire are responsible. The main reason among the human
caused reasons is the following.
1. Non timber forest produce collection- Mahua flower, honey and fruit collection.
2. Growth in grass
3. Customs and Traditions like magra snan
4. Encroachment
5. Electric line
6. Marriage seasons of forest community
7. To take revenge
Types of Fires: -
1. Ground Fire
2. Crown Fire
3. Underground Fire
4. Root Fire
The Ill effects of Fire: -
1. Adverse effects on forest products in environmental services
2. Loss of wild life and there habitat
3. Loss of close carbon in biomass
4. Grass crisis
141
5. Loss of newly planted plants
6. Loss of natural germination
8. Loss of Moistures and productivity of soil
9. Loss of biodiversity and extinctions of plants and animals
10. Change in micro climate of the area with unhealthy living conditions
OBJECTIVE: -
To control, empower communities living near forest area.
To encourage the forest department to assist in fire accidence.
Redaction fire incidents
Suggesting fire control majors
Proposed remedies for fire control
1. Construction and maintenance of fire lines
2. Constriction of fire watch and barracks
3. Arrangement of firefighting equipment, purchase of vehicle, communication equipment’s
4. Provisions of safety equipment of forest personal
5. Public awareness of fire in the local community
6. Target group- farmers, woman group, shepherds, NTFP collectors etc.
7. Media- Radio, T.V. social Media, Meetings, Chopal discussions etc.
8. Empowerment and accountability of forest VFPMC
9. Capacity building of VFPMC
10. Facilities- Fire biters, water bottles, protective cloths, helmet, torch, power blower.
11. Weed Management
12. Development of Strong forest fire detection and alert system
142
13. Training to forest staff and VFPMS member to control forest fire
14. Engage fire watchers in fires sensitive areas
15. Develop fire management and extension programs
16. Introduce well-coordinated and integrated fire management program
FIRE PREVENTION-
1. Don’t leave fire un-attended
2. No fueling in stove, lantern etc. when it is very hot.
3. Don’t thrown burning cigarette.
4. Remove the grasses along road side
5. Allow control grazing
6. Awareness about Forest Fire
CAUSES OF FOREST FIRE
1. Global climate change
2. Droughts
3. Insect out breaks
4. Pollution (Air, Water, Soil and aced rain)
5. Invasive species ( Juli-flora, Lantana, Jungli Tulsi, Puwad, gajar ghass)
6. Over exploitation of forest resources (medicinal plants, foods, fibers etc.)
7. Habitat loss / destruction
8. Disease
9. Illegal wild life trade and hunting
10. Over grazing
11. Natural calamities, Flood, hurricane etc.
12. Soil erosion
13. Encroachment (by Legal and Illegal activity)
14. Loss of eco-system
15. Human - wild animal conflict
143
16. Illegal felling, loping, and open pit mining
17. Biotic pressure on forest
18. Traditional misdeeds ( Magra Jalana, Adda pratha )
19. Lack of public awareness about the forest
20. Mismanagement of forest resources
21. Scattered forest right dwellers
22. Unplanned development works, Road, Dam etc.
23. Unmuted forest land
24. Increasing human population, urban expansion poverty
25. Unplanned waste disposal
26. Loss of biodiversity
27. Rising temperatures
28. Industrial activities and pollution
29. Human behavior
30. Scarcity of food - water in protected area
31. Forest conversion for permanent agriculture and pasture
32. Large road and infrastructure projects
33. Chemical defoliants
34. Small scale mining and associated pollution
35. Over harvesting for fuel wood
36. Fragmentation from small roads
AFFORESTATION ACTIVITY ON FOREST LAND -
Forests play important role in mitigation and adaptation of climate change. Forests sequester and
store more carbon than any other terrestrial ecosystem and are important natural ‘brake’ on climate
change. Carbon sequestration by forests has attracted much interest as a mitigation approach, as it
has been considered as relatively inexpensive means of addressing climate change.
Forests and climate change are intimately intertwined. Forest regulate the climate, rain, ground
water and soil of the earth. Forests are both sources and sinks of carbon. A growing forest captures
carbon from the atmosphere and a mature forest is a store house of carbon.
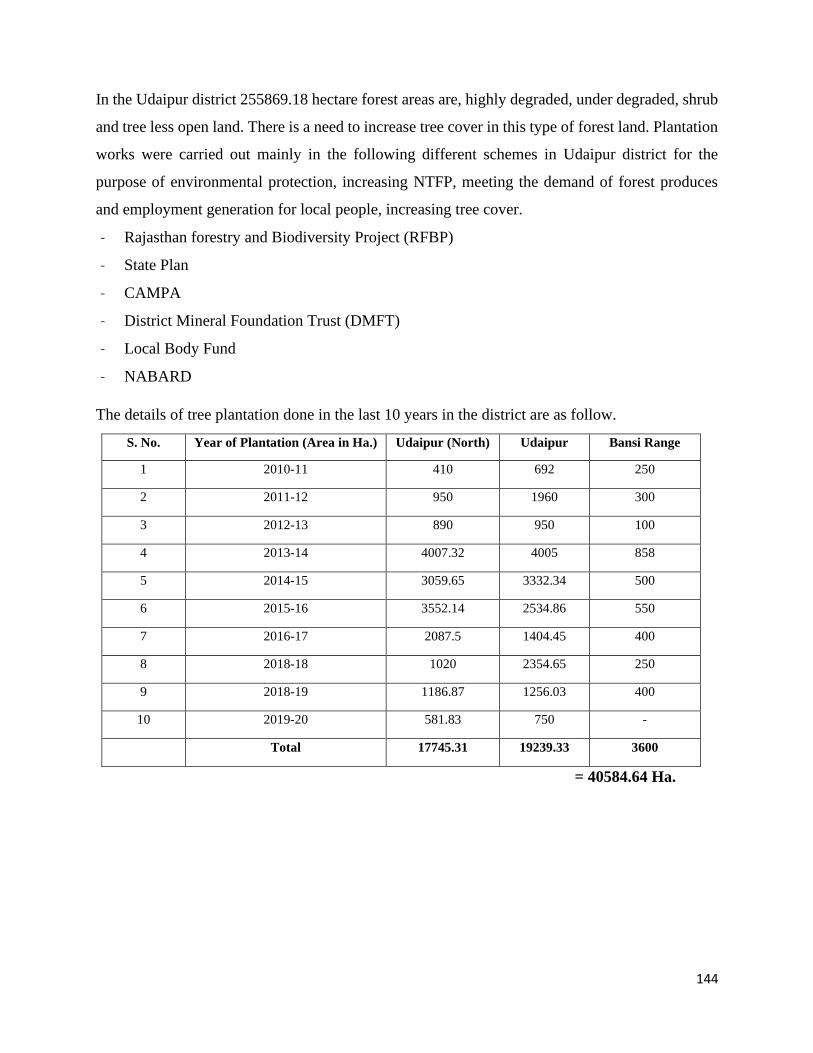
144
In the Udaipur district 255869.18 hectare forest areas are, highly degraded, under degraded, shrub
and tree less open land. There is a need to increase tree cover in this type of forest land. Plantation
works were carried out mainly in the following different schemes in Udaipur district for the
purpose of environmental protection, increasing NTFP, meeting the demand of forest produces
and employment generation for local people, increasing tree cover.
- Rajasthan forestry and Biodiversity Project (RFBP)
- State Plan
- CAMPA
- District Mineral Foundation Trust (DMFT)
- Local Body Fund
- NABARD
The details of tree plantation done in the last 10 years in the district are as follow.
S. No. Year of Plantation (Area in Ha.) Udaipur (North) Udaipur Bansi Range
1 2010-11 410 692 250
2 2011-12 950 1960 300
3 2012-13 890 950 100
4 2013-14 4007.32 4005 858
5 2014-15 3059.65 3332.34 500
6 2015-16 3552.14 2534.86 550
7 2016-17 2087.5 1404.45 400
8 2018-18 1020 2354.65 250
9 2018-19 1186.87 1256.03 400
10 2019-20 581.83 750 -
Total 17745.31 19239.33 3600
= 40584.64 Ha.
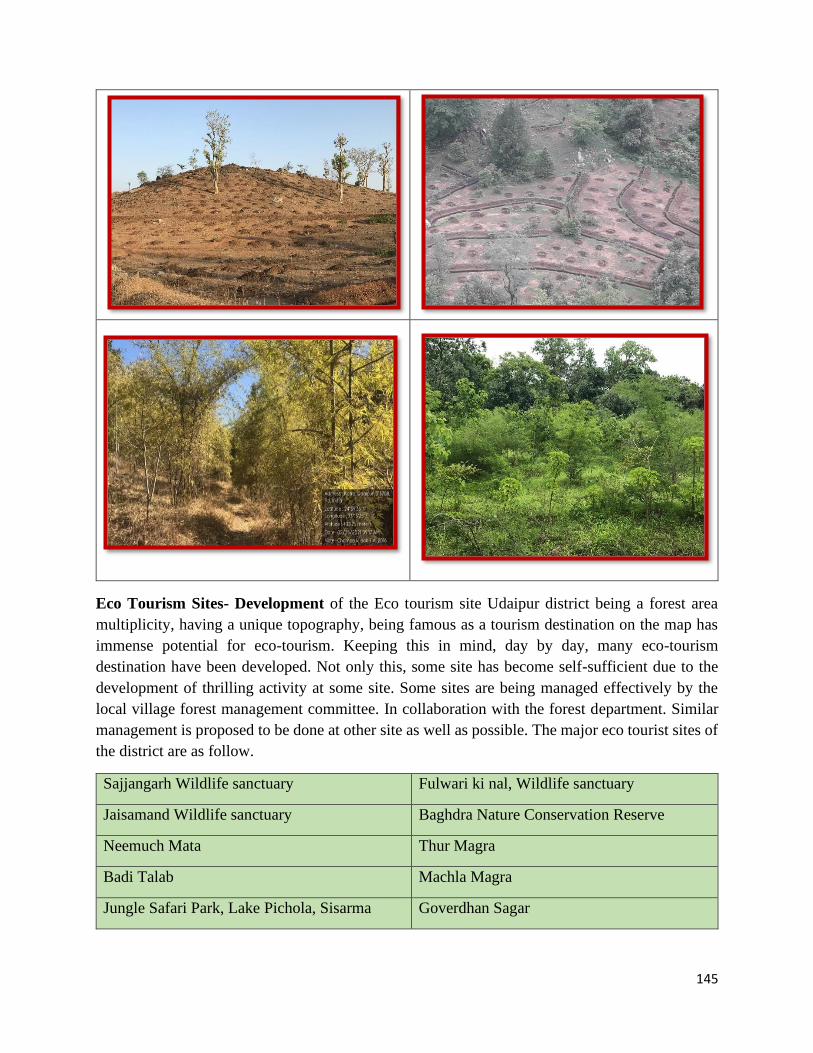
145
Eco Tourism Sites- Development of the Eco tourism site Udaipur district being a forest area
multiplicity, having a unique topography, being famous as a tourism destination on the map has
immense potential for eco-tourism. Keeping this in mind, day by day, many eco-tourism
destination have been developed. Not only this, some site has become self-sufficient due to the
development of thrilling activity at some site. Some sites are being managed effectively by the
local village forest management committee. In collaboration with the forest department. Similar
management is proposed to be done at other site as well as possible. The major eco tourist sites of
the district are as follow.
Sajjangarh Wildlife sanctuary Fulwari ki nal, Wildlife sanctuary
Jaisamand Wildlife sanctuary Baghdra Nature Conservation Reserve
Neemuch Mata Thur Magra
Badi Talab Machla Magra
Jungle Safari Park, Lake Pichola, Sisarma Goverdhan Sagar
146
Van Anusandhan Kendra, Banki Nandeshwer ji
Kevde ki nal Gupteshwar ji
Jhameshwar ji Jhamri dam
Ambika Mata Mandir, Jagat Taneshwar Mahadev
Jawar Mataji Mandir, Jawar Nal Sandol
Kamalnath, Jhadol Ogana dam
Gotemeshwar ji Jarga ji
Eco Tone Park, Badi Talab Mewar Biodiversity Park, Amberi
Mahatma Gandhi Nagar Van Udhyan, Phulon
ki ghati, Chirwa
Pratap Van, Pratap nagar
Biological Park, Sajjangarh Ubeshwar ji
147
MITIGATION EFFORTS TO REDUCE ENVIRONMENTAL POLLUTION BY USING
RELEVANT TO THE DISTRICT
AFFORESTATION –
Promoting tree outside forest
Trees outside forest (TOF) are located on the lands other than forest, including agricultural lands
(e.g., agro- forestry systems, farm forestry industrial plantations, Roadside plantation etc.) built-
up areas such as settlements and infrastructure (e.g., street trees, parks, urban plantation etc.). They
not only contribute nearly on fourth of the total growing stock of the country but also have become
major source of wood in India. TOF has played significant role in combating urban and industrial
pollution. Urban parts and city forest are proven lungs of urban population.
Promoting Social forestry
To raise plantation in degraded and non-forest waste land to provide vegetative cover, improve
land productivity and to meet timber, fuel wood, fodder and other needs of forest fringe villages,
thereby reducing pressure on traditional forest areas.
Promoting Urban Forestry
Urban green spaces are integral component of urban ecosystem, contributing to enhanced
environmental quality, quality of life and sustainable urban development.
- Urban parks, gardens, natural landscapes provide several intangible benefits to urban
population.
- Promoting avenue plantation and green cover in Universities, Colleges, Schools,
Aanganwadis and Townships etc.
- Urban parks can be developed in lines of Smriti van.
Promoting Avenue Plantation
Avenue plantation is important practice of growing tree species along the Road side and Canal
side flowering and semi evergreen plants sps. Can be used in this.
Roadside Plantation
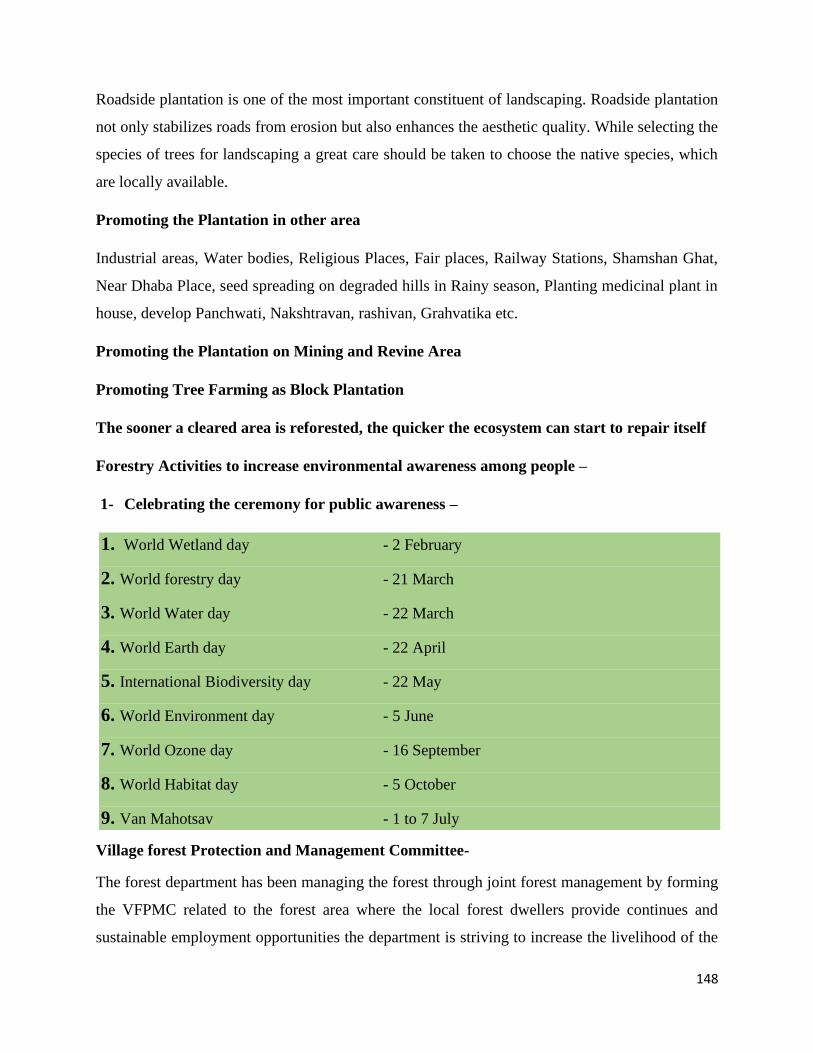
148
Roadside plantation is one of the most important constituent of landscaping. Roadside plantation
not only stabilizes roads from erosion but also enhances the aesthetic quality. While selecting the
species of trees for landscaping a great care should be taken to choose the native species, which
are locally available.
Promoting the Plantation in other area
Industrial areas, Water bodies, Religious Places, Fair places, Railway Stations, Shamshan Ghat,
Near Dhaba Place, seed spreading on degraded hills in Rainy season, Planting medicinal plant in
house, develop Panchwati, Nakshtravan, rashivan, Grahvatika etc.
Promoting the Plantation on Mining and Revine Area
Promoting Tree Farming as Block Plantation
The sooner a cleared area is reforested, the quicker the ecosystem can start to repair itself
Forestry Activities to increase environmental awareness among people –
1- Celebrating the ceremony for public awareness –
1. World Wetland day - 2 February
2. World forestry day - 21 March
3. World Water day - 22 March
4. World Earth day - 22 April
5. International Biodiversity day - 22 May
6. World Environment day - 5 June
7. World Ozone day - 16 September
8. World Habitat day - 5 October
9. Van Mahotsav - 1 to 7 July
Village forest Protection and Management Committee-
The forest department has been managing the forest through joint forest management by forming
the VFPMC related to the forest area where the local forest dwellers provide continues and
sustainable employment opportunities the department is striving to increase the livelihood of the
149
tribal by the enhance there skills capacity development by training. 550 such VFPMCs are
working in District forest areas.
Promoting Ecotourism-
Forest Excursion, Cycling in Forest Area
Propaganda for the conserving environment in village and urban areas
Conserve the environment through social traditions has Kesar Chhanta, Dev Van,
Promoting the Organic Products
Promoting the fuel as gas in rural and the urban area in instead of fuel wood
Promoting the Eco camp and jungle safari of the students
Provide training for local people as nature guide
Developing interpretation centre, view point, walking trail in forest area.
Other Activities –
Udaipur is a city of lakes, ponds and other water bodies. Water bodies are dynamic aquatic system
that support and maintain balance community of diverse species and the functional organization
of all the organism supports a biotic integrity Planktons constitute an important link in the aquatic
food webs, transferring energy from producer to aquatic carnivores.
Algae produce 50% to 70% of atmospheric oxygen and are the base of aquatic food chance for
fish mammals. They occur as endosymbionts in lichens and corals.
Fungi offer eco system services as saprophytes, parasites, symbionts.
Lichens grown stones and rocks or on barks of trees and bushes.
Ferns can serve as indicators of disturbance or forest quality as many species show clear habitat
differentiation with regards to light conditions and humidity so protecting endangered species and
cleaning over lakes.
Allowing the forest eco system to regenerate over time.
Eradicate obnoxious plants Parthenium, lantana, juliflora

150
“Nature is the art of God”
Let us join hands to conserve and flourish it.
"Look deep into nature, and then you will understand
everything better."
– Albert Einstein
https://keystoneacademic-res.cloudinary.com/image/upload/q_auto,f_auto,w_372,c_limit/element/16/16594_Environment_Research_Innovation.JPG
Related Documents