www.parliament.uk/commons-library | intranet.parliament.uk/commons-library | [email protected] | @commonslibrary BRIEFING PAPER Number CBP 8060, 5 July 2019 Turnout at elections By Elise Uberoi Contents: 1. National Parliament Elections 2. European Parliament Elections 3. Devolved Administrations 4. Local Elections 5. Appendix

Welcome message from author
This document is posted to help you gain knowledge. Please leave a comment to let me know what you think about it! Share it to your friends and learn new things together.
Transcript
www.parliament.uk/commons-library | intranet.parliament.uk/commons-library | [email protected] | @commonslibrary
BRIEFING PAPER
Number CBP 8060, 5 July 2019
Turnout at elections By Elise Uberoi
Contents: 1. National Parliament Elections 2. European Parliament
Elections 3. Devolved Administrations 4. Local Elections 5. Appendix
2 Turnout at elections
Contents 1. National Parliament Elections 3 1.1 UK General Elections 3 1.2 UK General Elections: nations and regions 4 1.3 UK General Elections: constituencies 4 1.4 UK General Elections: turnout by age 6 1.5 EU member comparisons 7
2. European Parliament Elections 9 2.1 Turnout across the EU 9 2.2 Turnout in the United Kingdom 9
3. Devolved Administrations 12 3.1 Wales 12 3.2 Scotland 12 3.3 Northern Ireland Assembly 12
4. Local Elections 13 4.1 Turnout in recent local elections, by authority 14 14 4.2 Turnout in recent local elections, by ward in Wales 17 4.3 Turnout in recent local elections, by ward in England 18 4.4 Turnout in recent local elections, by ward in Scotland 21
5. Appendix 22 5.1 Estimated turnout by age at UK General Elections 22
Flag pictures in Table 2 are from Go Squared Ltd (https://www.gosquared.com/)
Cover page image copyright To the polling station by Matt. Licensed under CC BY 2.0 / image cropped.
3 Commons Library Briefing, 5 July 2019
1. National Parliament Elections
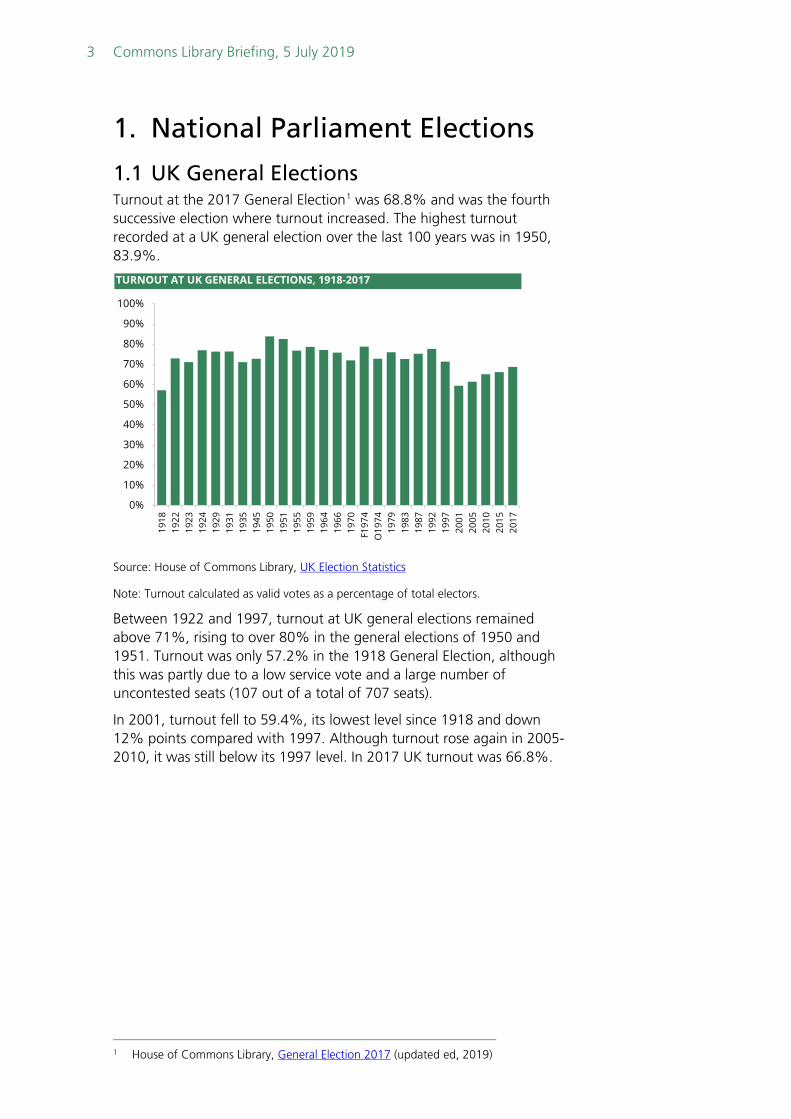
1.1 UK General Elections Turnout at the 2017 General Election1 was 68.8% and was the fourth successive election where turnout increased. The highest turnout recorded at a UK general election over the last 100 years was in 1950, 83.9%.
Source: House of Commons Library, UK Election Statistics
Note: Turnout calculated as valid votes as a percentage of total electors.
Between 1922 and 1997, turnout at UK general elections remained above 71%, rising to over 80% in the general elections of 1950 and 1951. Turnout was only 57.2% in the 1918 General Election, although this was partly due to a low service vote and a large number of uncontested seats (107 out of a total of 707 seats).
In 2001, turnout fell to 59.4%, its lowest level since 1918 and down 12% points compared with 1997. Although turnout rose again in 2005-2010, it was still below its 1997 level. In 2017 UK turnout was 66.8%.
1 House of Commons Library, General Election 2017 (updated ed, 2019)
TURNOUT AT UK GENERAL ELECTIONS, 1918-2017
0%
10%
20%
30%
40%
50%
60%
70%
80%
90%
100%
1918
1922
1923
1924
1929
1931
1935
1945
1950
1951
1955
1959
1964
1966
1970
F197
4O
1974
1979
1983
1987
1992
1997
2001
2005
2010
2015
2017
4 Turnout at elections
1.2 UK General Elections: nations and regions
Source: House of Commons Library, General Election 2017 (updated ed, 2019), House of Commons Library, UK
Election Statistics and Colin Rallings and Michael Thrasher, British Electoral Facts 1832-2012 (2012).
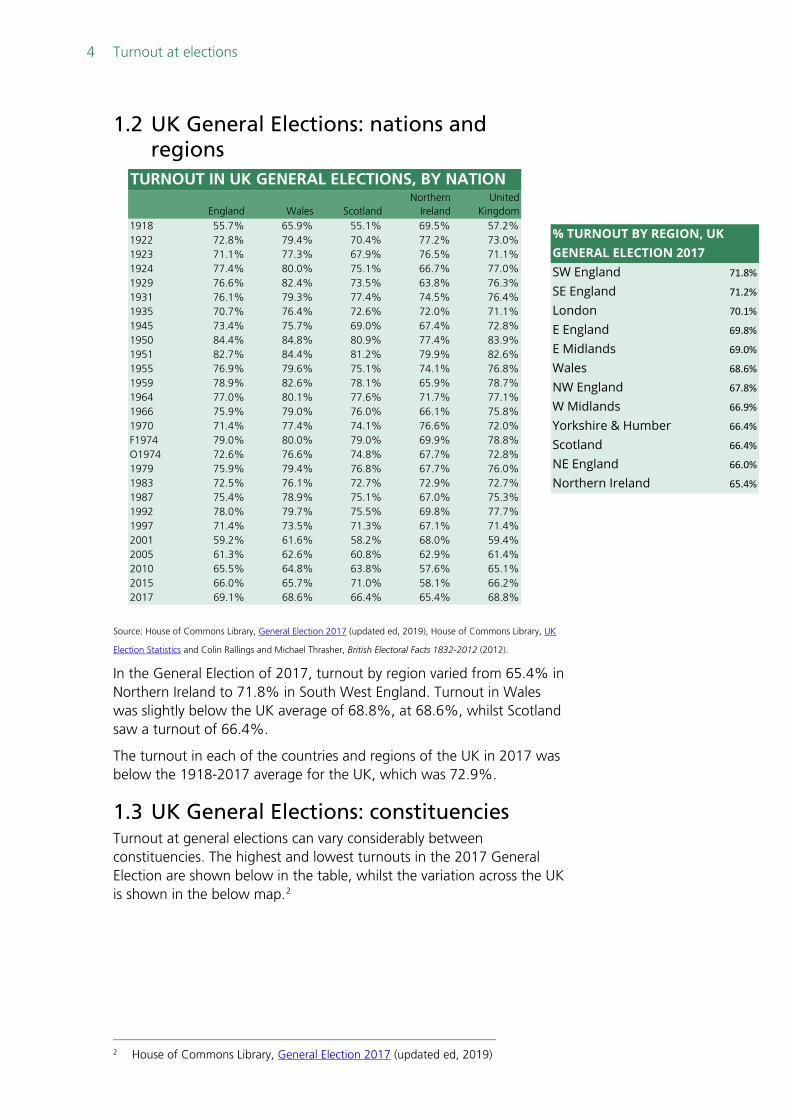
In the General Election of 2017, turnout by region varied from 65.4% in Northern Ireland to 71.8% in South West England. Turnout in Wales was slightly below the UK average of 68.8%, at 68.6%, whilst Scotland saw a turnout of 66.4%.
The turnout in each of the countries and regions of the UK in 2017 was below the 1918-2017 average for the UK, which was 72.9%.
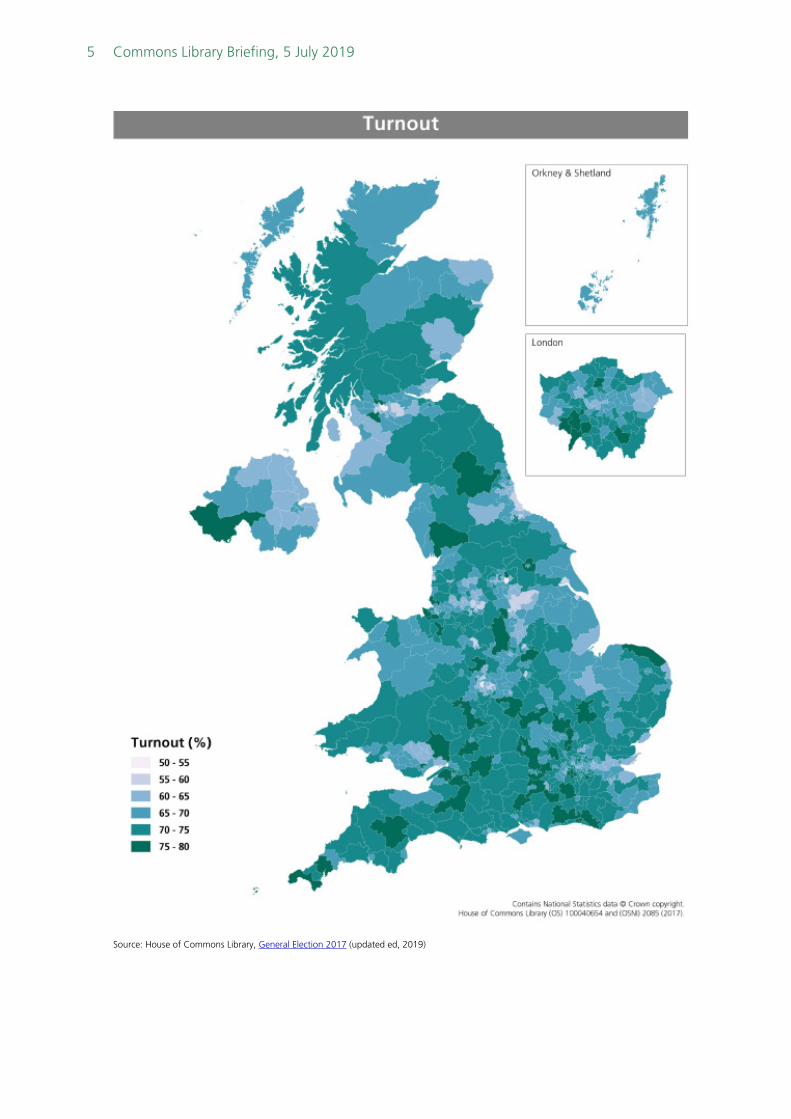
1.3 UK General Elections: constituencies Turnout at general elections can vary considerably between constituencies. The highest and lowest turnouts in the 2017 General Election are shown below in the table, whilst the variation across the UK is shown in the below map.2
2 House of Commons Library, General Election 2017 (updated ed, 2019)
TURNOUT IN UK GENERAL ELECTIONS, BY NATION
England Wales ScotlandNorthern
IrelandUnited
Kingdom1918 55.7% 65.9% 55.1% 69.5% 57.2%1922 72.8% 79.4% 70.4% 77.2% 73.0%1923 71.1% 77.3% 67.9% 76.5% 71.1%1924 77.4% 80.0% 75.1% 66.7% 77.0%1929 76.6% 82.4% 73.5% 63.8% 76.3%1931 76.1% 79.3% 77.4% 74.5% 76.4%1935 70.7% 76.4% 72.6% 72.0% 71.1%1945 73.4% 75.7% 69.0% 67.4% 72.8%1950 84.4% 84.8% 80.9% 77.4% 83.9%1951 82.7% 84.4% 81.2% 79.9% 82.6%1955 76.9% 79.6% 75.1% 74.1% 76.8%1959 78.9% 82.6% 78.1% 65.9% 78.7%1964 77.0% 80.1% 77.6% 71.7% 77.1%1966 75.9% 79.0% 76.0% 66.1% 75.8%1970 71.4% 77.4% 74.1% 76.6% 72.0%F1974 79.0% 80.0% 79.0% 69.9% 78.8%O1974 72.6% 76.6% 74.8% 67.7% 72.8%1979 75.9% 79.4% 76.8% 67.7% 76.0%1983 72.5% 76.1% 72.7% 72.9% 72.7%1987 75.4% 78.9% 75.1% 67.0% 75.3%1992 78.0% 79.7% 75.5% 69.8% 77.7%1997 71.4% 73.5% 71.3% 67.1% 71.4%2001 59.2% 61.6% 58.2% 68.0% 59.4%2005 61.3% 62.6% 60.8% 62.9% 61.4%2010 65.5% 64.8% 63.8% 57.6% 65.1%2015 66.0% 65.7% 71.0% 58.1% 66.2%2017 69.1% 68.6% 66.4% 65.4% 68.8%
SW England 71.8%
SE England 71.2%
London 70.1%
E England 69.8%
E Midlands 69.0%
Wales 68.6%
NW England 67.8%
W Midlands 66.9%
Yorkshire & Humber 66.4%
Scotland 66.4%
NE England 66.0%
Northern Ireland 65.4%
% TURNOUT BY REGION, UK GENERAL ELECTION 2017
5 Commons Library Briefing, 5 July 2019
Source: House of Commons Library, General Election 2017 (updated ed, 2019)
6 Turnout at elections
The highest constituency turnout was Twickenham (79.5%), won by the Liberal Democrats. Twickenham had the 4th highest turnout in the UK in 2015 (77.4%) and the highest in England (the top three spots were taken by Scottish constituencies in 2015). Seven of the top ten featured the Liberal Democrats in first or second place.
Six of the ten constituencies with the smallest turnout were won by Labour, three by the SNP and one by the Conservatives. Glasgow accounted for four of the ten lowest constituency turnouts in the UK.
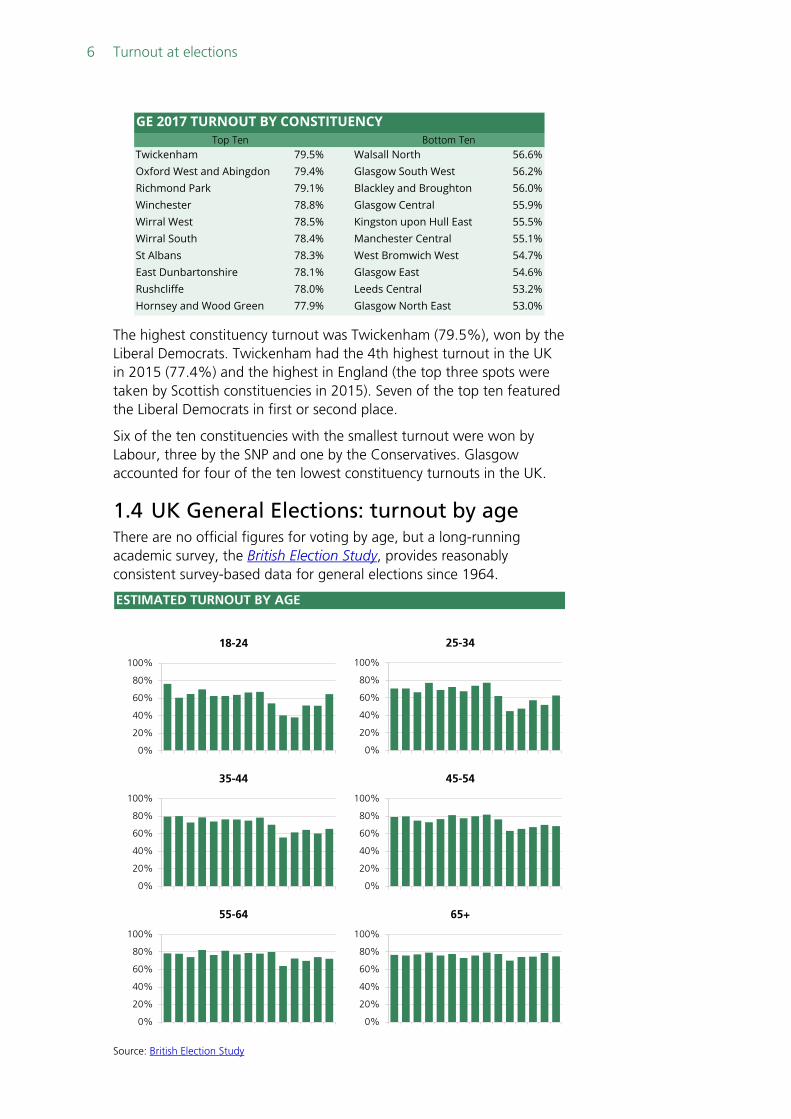
1.4 UK General Elections: turnout by age There are no official figures for voting by age, but a long-running academic survey, the British Election Study, provides reasonably consistent survey-based data for general elections since 1964.
Source: British Election Study
GE 2017 TURNOUT BY CONSTITUENCY
Twickenham 79.5% Walsall North 56.6%Oxford West and Abingdon 79.4% Glasgow South West 56.2%Richmond Park 79.1% Blackley and Broughton 56.0%Winchester 78.8% Glasgow Central 55.9%Wirral West 78.5% Kingston upon Hull East 55.5%Wirral South 78.4% Manchester Central 55.1%St Albans 78.3% West Bromwich West 54.7%East Dunbartonshire 78.1% Glasgow East 54.6%Rushcliffe 78.0% Leeds Central 53.2%Hornsey and Wood Green 77.9% Glasgow North East 53.0%
Top Ten Bottom Ten
ESTIMATED TURNOUT BY AGE
0%
20%
40%
60%
80%
100%
18-24
0%
20%
40%
60%
80%
100%
25-34
0%
20%
40%
60%
80%
100%
35-44
0%
20%
40%
60%
80%
100%
45-54
0%
20%
40%
60%
80%
100%
55-64
0%
20%
40%
60%
80%
100%
65+
7 Commons Library Briefing, 5 July 2019
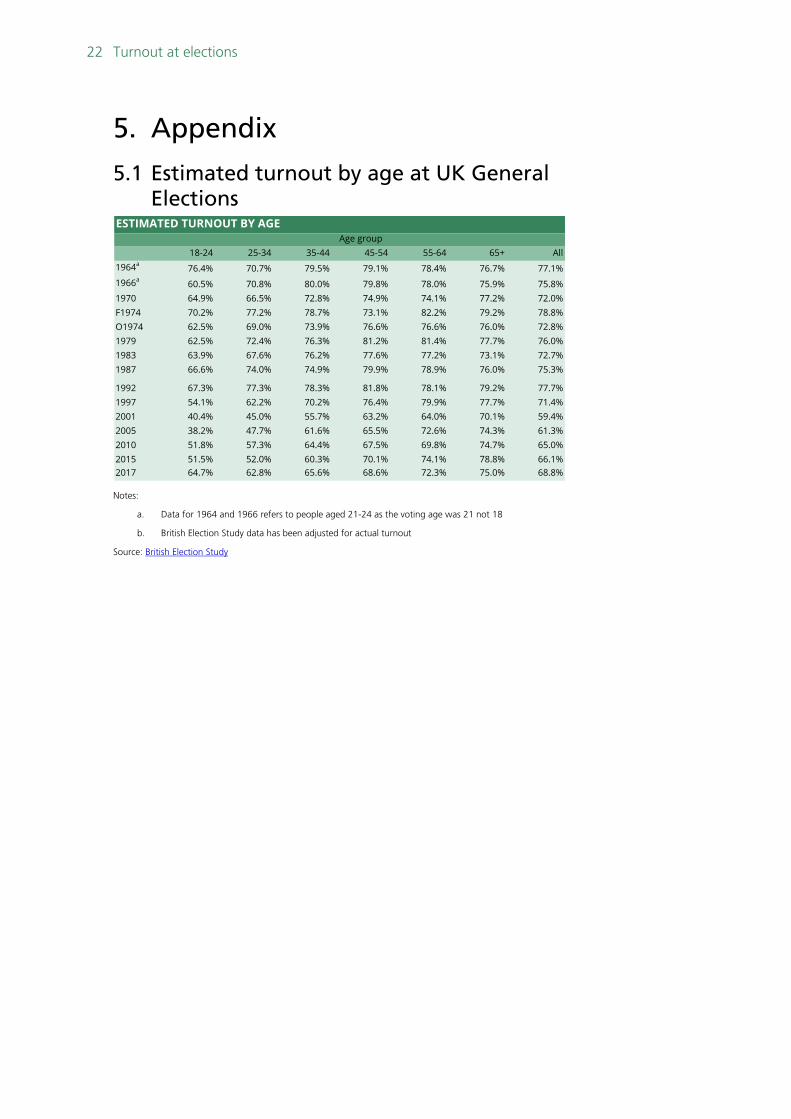
The decline and recent growth in young people’s engagement in politics has been a common theme in political discourse. As seen above, voter turnout has been typically low among young people relative to older age groups. The estimated turnout of 18-24 year olds in the 2017 General Election is the highest since 1992.
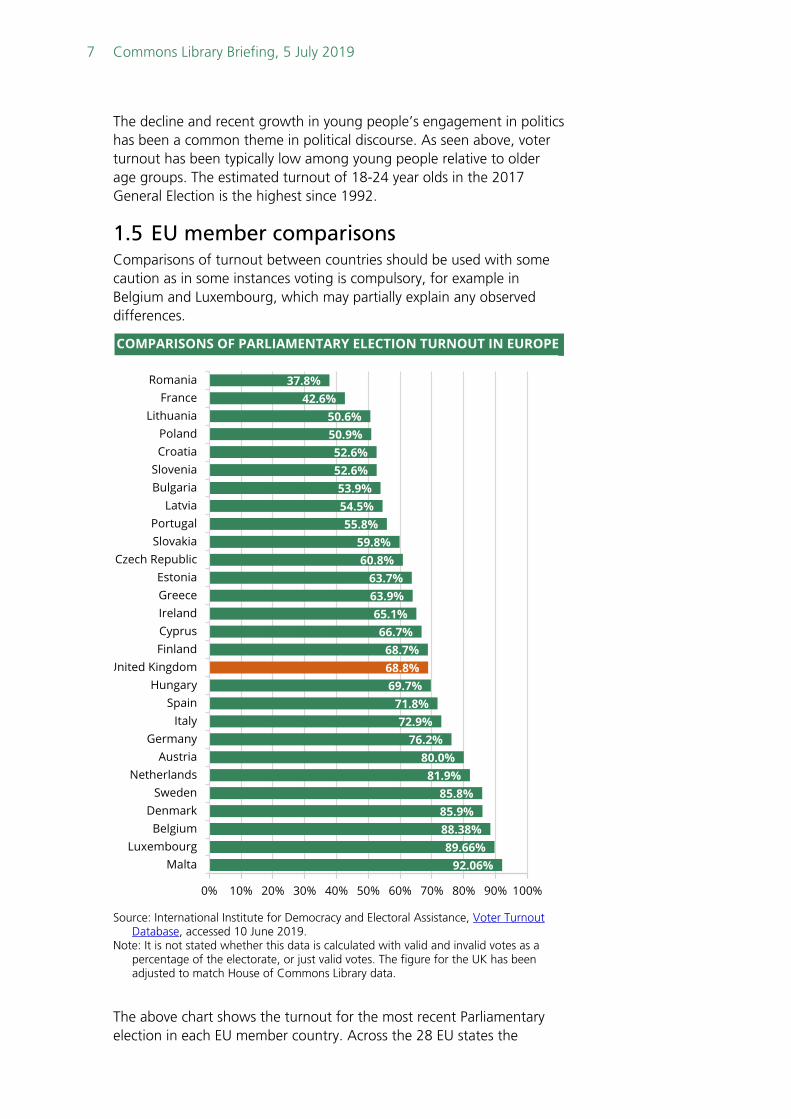
1.5 EU member comparisons Comparisons of turnout between countries should be used with some caution as in some instances voting is compulsory, for example in Belgium and Luxembourg, which may partially explain any observed differences.
Source: International Institute for Democracy and Electoral Assistance, Voter Turnout
Database, accessed 10 June 2019. Note: It is not stated whether this data is calculated with valid and invalid votes as a
percentage of the electorate, or just valid votes. The figure for the UK has been adjusted to match House of Commons Library data.
The above chart shows the turnout for the most recent Parliamentary election in each EU member country. Across the 28 EU states the
COMPARISONS OF PARLIAMENTARY ELECTION TURNOUT IN EUROPE
92.06%89.66%
88.38%85.9%85.8%
81.9%80.0%
76.2%72.9%
71.8%69.7%68.8%68.7%
66.7%65.1%
63.9%63.7%
60.8%59.8%
55.8%54.5%53.9%
52.6%52.6%
50.9%50.6%
42.6%37.8%
0% 10% 20% 30% 40% 50% 60% 70% 80% 90% 100%
MaltaLuxembourg
BelgiumDenmark
SwedenNetherlands
AustriaGermany
ItalySpain
HungaryUnited Kingdom
FinlandCyprusIrelandGreeceEstonia
Czech RepublicSlovakiaPortugal
LatviaBulgariaSlovenia
CroatiaPoland
LithuaniaFrance
Romania
8 Turnout at elections
average turnout for Parliamentary elections was 66.5%. The UK 2017 General Election meant that the UK produced the 12th highest turnout for a Parliamentary election. Cyprus and France experienced the two largest falls in turnout, compared to their previous Parliamentary elections. In the case of Cyprus, turnout fell from 78.7% in 2011 to 66.7% in 2016, whilst turnout in French Parliamentary elections declined from 55.4% in 2012 to 42.6% in 2017. The largest increases from one Parliamentary election to the next, seeing rises of over 7%, were in Hungary (61.8% in 2014 to 69.7% in 2018) and the Netherlands (74.6% in 2012 to 81.9% in 2017).
9 Commons Library Briefing, 5 July 2019
2. European Parliament Elections
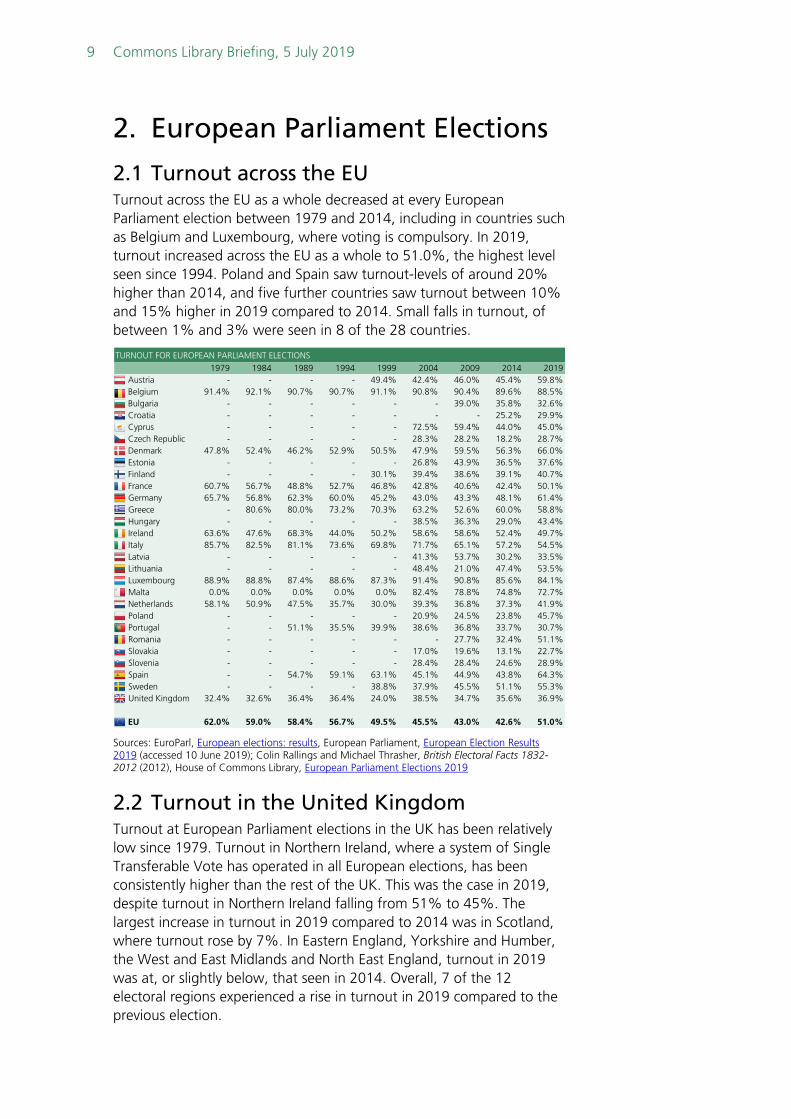
2.1 Turnout across the EU Turnout across the EU as a whole decreased at every European Parliament election between 1979 and 2014, including in countries such as Belgium and Luxembourg, where voting is compulsory. In 2019, turnout increased across the EU as a whole to 51.0%, the highest level seen since 1994. Poland and Spain saw turnout-levels of around 20% higher than 2014, and five further countries saw turnout between 10% and 15% higher in 2019 compared to 2014. Small falls in turnout, of between 1% and 3% were seen in 8 of the 28 countries.
Sources: EuroParl, European elections: results, European Parliament, European Election Results 2019 (accessed 10 June 2019); Colin Rallings and Michael Thrasher, British Electoral Facts 1832-2012 (2012), House of Commons Library, European Parliament Elections 2019
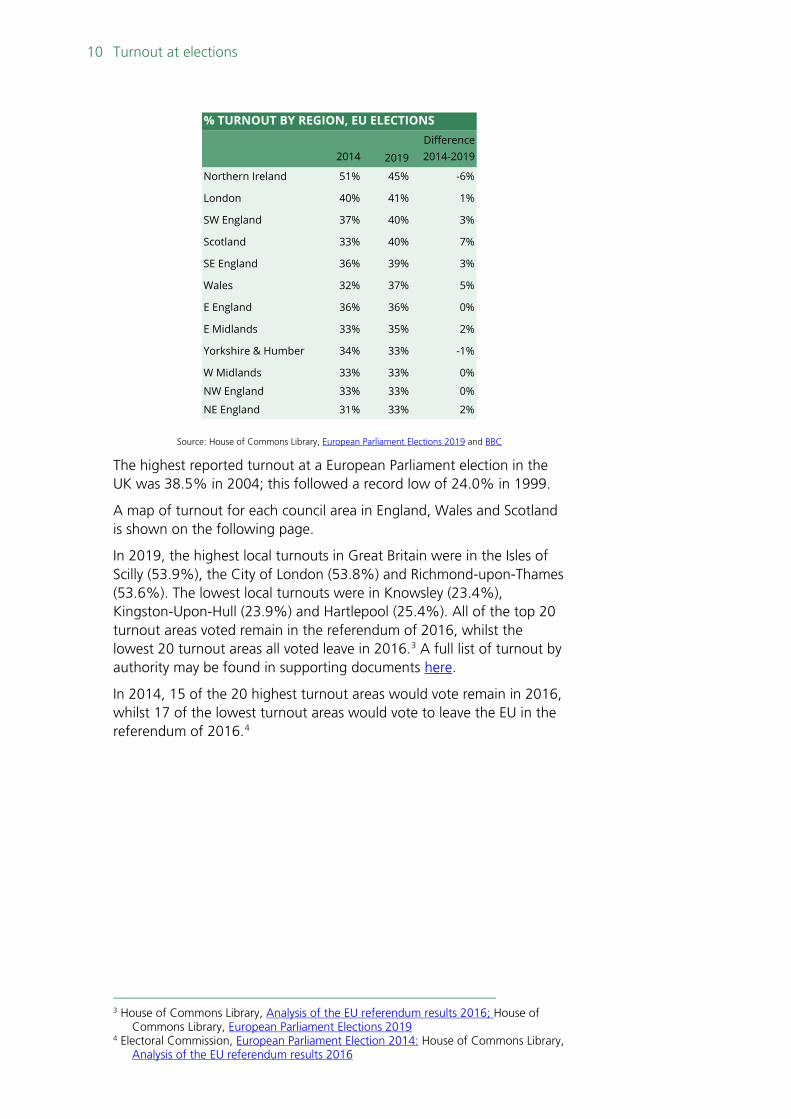
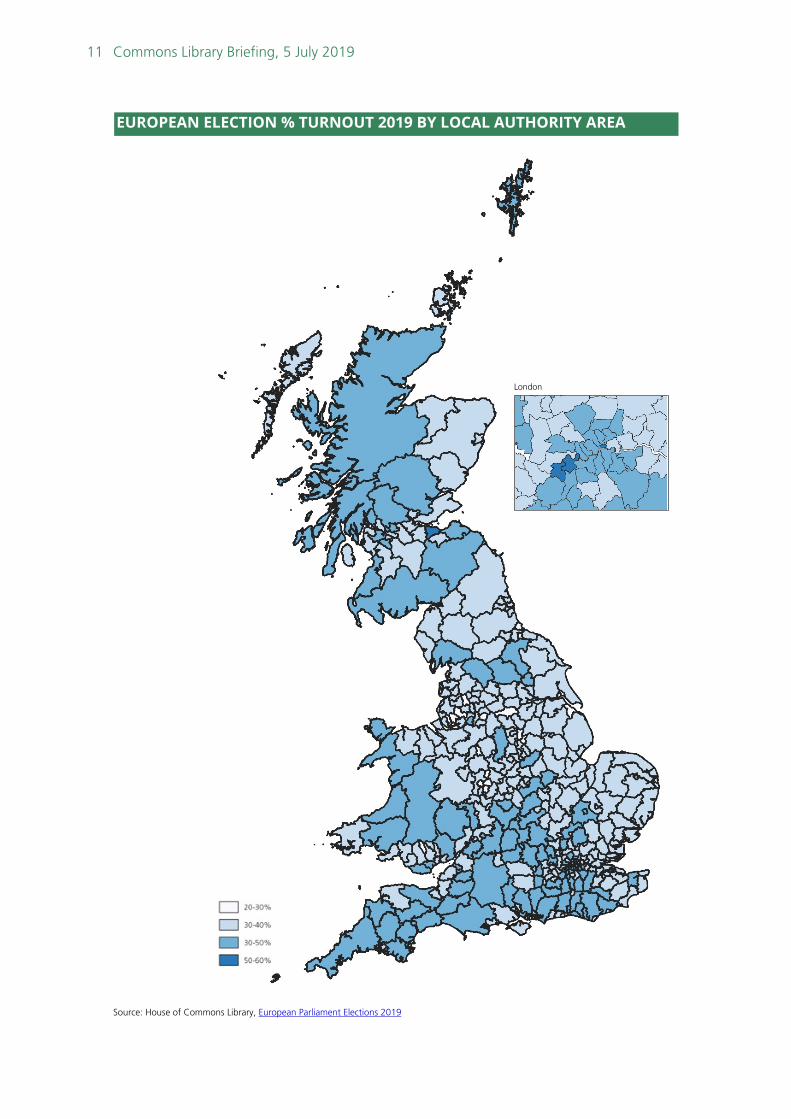
2.2 Turnout in the United Kingdom Turnout at European Parliament elections in the UK has been relatively low since 1979. Turnout in Northern Ireland, where a system of Single Transferable Vote has operated in all European elections, has been consistently higher than the rest of the UK. This was the case in 2019, despite turnout in Northern Ireland falling from 51% to 45%. The largest increase in turnout in 2019 compared to 2014 was in Scotland, where turnout rose by 7%. In Eastern England, Yorkshire and Humber, the West and East Midlands and North East England, turnout in 2019 was at, or slightly below, that seen in 2014. Overall, 7 of the 12 electoral regions experienced a rise in turnout in 2019 compared to the previous election.
TURNOUT FOR EUROPEAN PARLIAMENT ELECTIONS1979 1984 1989 1994 1999 2004 2009 2014 2019
Austria - - - - 49.4% 42.4% 46.0% 45.4% 59.8%Belgium 91.4% 92.1% 90.7% 90.7% 91.1% 90.8% 90.4% 89.6% 88.5%Bulgaria - - - - - - 39.0% 35.8% 32.6%Croatia - - - - - - - 25.2% 29.9%Cyprus - - - - - 72.5% 59.4% 44.0% 45.0%Czech Republic - - - - - 28.3% 28.2% 18.2% 28.7%Denmark 47.8% 52.4% 46.2% 52.9% 50.5% 47.9% 59.5% 56.3% 66.0%Estonia - - - - - 26.8% 43.9% 36.5% 37.6%Finland - - - - 30.1% 39.4% 38.6% 39.1% 40.7%France 60.7% 56.7% 48.8% 52.7% 46.8% 42.8% 40.6% 42.4% 50.1%Germany 65.7% 56.8% 62.3% 60.0% 45.2% 43.0% 43.3% 48.1% 61.4%Greece - 80.6% 80.0% 73.2% 70.3% 63.2% 52.6% 60.0% 58.8%Hungary - - - - - 38.5% 36.3% 29.0% 43.4%Ireland 63.6% 47.6% 68.3% 44.0% 50.2% 58.6% 58.6% 52.4% 49.7%Italy 85.7% 82.5% 81.1% 73.6% 69.8% 71.7% 65.1% 57.2% 54.5%Latvia - - - - - 41.3% 53.7% 30.2% 33.5%Lithuania - - - - - 48.4% 21.0% 47.4% 53.5%Luxembourg 88.9% 88.8% 87.4% 88.6% 87.3% 91.4% 90.8% 85.6% 84.1%Malta 0.0% 0.0% 0.0% 0.0% 0.0% 82.4% 78.8% 74.8% 72.7%Netherlands 58.1% 50.9% 47.5% 35.7% 30.0% 39.3% 36.8% 37.3% 41.9%Poland - - - - - 20.9% 24.5% 23.8% 45.7%Portugal - - 51.1% 35.5% 39.9% 38.6% 36.8% 33.7% 30.7%Romania - - - - - - 27.7% 32.4% 51.1%Slovakia - - - - - 17.0% 19.6% 13.1% 22.7%Slovenia - - - - - 28.4% 28.4% 24.6% 28.9%Spain - - 54.7% 59.1% 63.1% 45.1% 44.9% 43.8% 64.3%Sweden - - - - 38.8% 37.9% 45.5% 51.1% 55.3%United Kingdom 32.4% 32.6% 36.4% 36.4% 24.0% 38.5% 34.7% 35.6% 36.9%
EU 62.0% 59.0% 58.4% 56.7% 49.5% 45.5% 43.0% 42.6% 51.0%
10 Turnout at elections
Source: House of Commons Library, European Parliament Elections 2019 and BBC
The highest reported turnout at a European Parliament election in the UK was 38.5% in 2004; this followed a record low of 24.0% in 1999.
A map of turnout for each council area in England, Wales and Scotland is shown on the following page.
In 2019, the highest local turnouts in Great Britain were in the Isles of Scilly (53.9%), the City of London (53.8%) and Richmond-upon-Thames (53.6%). The lowest local turnouts were in Knowsley (23.4%), Kingston-Upon-Hull (23.9%) and Hartlepool (25.4%). All of the top 20 turnout areas voted remain in the referendum of 2016, whilst the lowest 20 turnout areas all voted leave in 2016.3 A full list of turnout by authority may be found in supporting documents here.
In 2014, 15 of the 20 highest turnout areas would vote remain in 2016, whilst 17 of the lowest turnout areas would vote to leave the EU in the referendum of 2016.4
3 House of Commons Library, Analysis of the EU referendum results 2016; House of
Commons Library, European Parliament Elections 2019 4 Electoral Commission, European Parliament Election 2014: House of Commons Library,
Analysis of the EU referendum results 2016
2014 2019
Difference 2014-2019
Northern Ireland 51% 45% -6%
London 40% 41% 1%
SW England 37% 40% 3%
Scotland 33% 40% 7%
SE England 36% 39% 3%
Wales 32% 37% 5%
E England 36% 36% 0%
E Midlands 33% 35% 2%
Yorkshire & Humber 34% 33% -1%
W Midlands 33% 33% 0%
NW England 33% 33% 0%
NE England 31% 33% 2%
% TURNOUT BY REGION, EU ELECTIONS
11 Commons Library Briefing, 5 July 2019
Source: House of Commons Library, European Parliament Elections 2019
EUROPEAN ELECTION % TURNOUT 2019 BY LOCAL AUTHORITY AREA
London
12 Turnout at elections
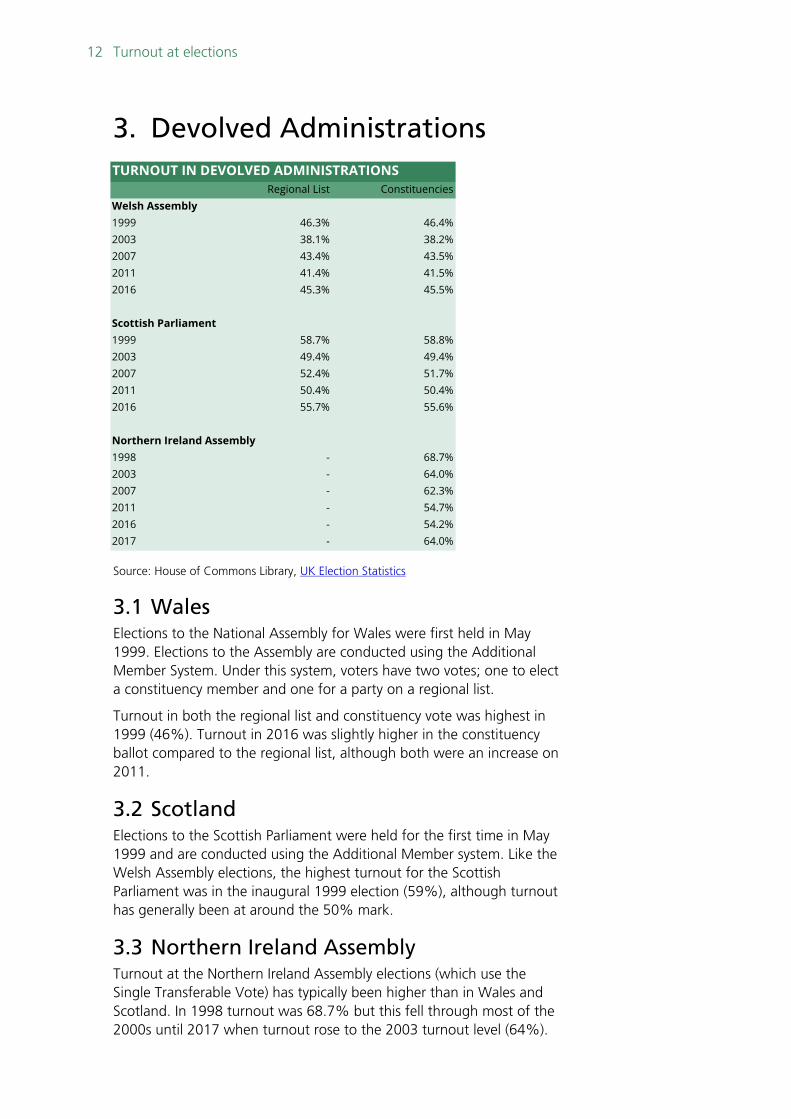
3. Devolved Administrations
Source: House of Commons Library, UK Election Statistics
3.1 Wales Elections to the National Assembly for Wales were first held in May 1999. Elections to the Assembly are conducted using the Additional Member System. Under this system, voters have two votes; one to elect a constituency member and one for a party on a regional list.
Turnout in both the regional list and constituency vote was highest in 1999 (46%). Turnout in 2016 was slightly higher in the constituency ballot compared to the regional list, although both were an increase on 2011.
3.2 Scotland Elections to the Scottish Parliament were held for the first time in May 1999 and are conducted using the Additional Member system. Like the Welsh Assembly elections, the highest turnout for the Scottish Parliament was in the inaugural 1999 election (59%), although turnout has generally been at around the 50% mark.
3.3 Northern Ireland Assembly Turnout at the Northern Ireland Assembly elections (which use the Single Transferable Vote) has typically been higher than in Wales and Scotland. In 1998 turnout was 68.7% but this fell through most of the 2000s until 2017 when turnout rose to the 2003 turnout level (64%).
TURNOUT IN DEVOLVED ADMINISTRATIONSRegional List Constituencies
Welsh Assembly1999 46.3% 46.4%2003 38.1% 38.2%2007 43.4% 43.5%2011 41.4% 41.5%2016 45.3% 45.5%
Scottish Parliament1999 58.7% 58.8%2003 49.4% 49.4%2007 52.4% 51.7%2011 50.4% 50.4%2016 55.7% 55.6%
Northern Ireland Assembly1998 - 68.7%2003 - 64.0%2007 - 62.3%2011 - 54.7%2016 - 54.2%2017 - 64.0%
13 Commons Library Briefing, 5 July 2019
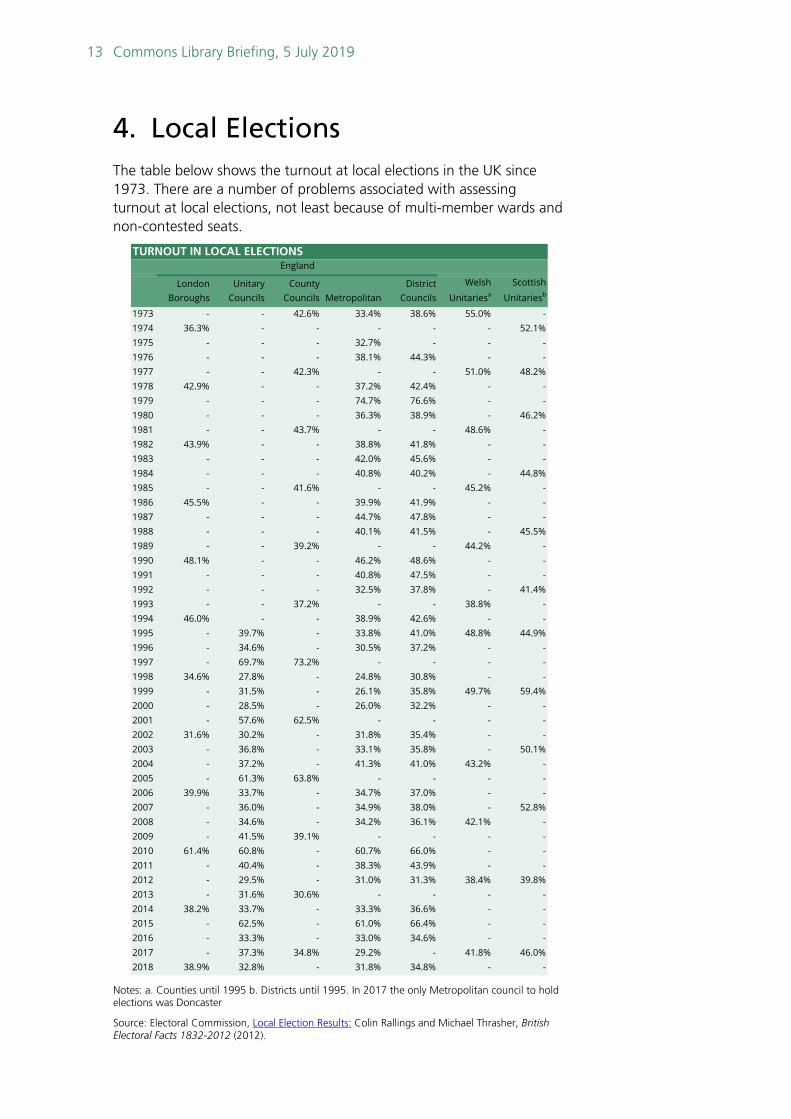
4. Local Elections The table below shows the turnout at local elections in the UK since 1973. There are a number of problems associated with assessing turnout at local elections, not least because of multi-member wards and non-contested seats.
Notes: a. Counties until 1995 b. Districts until 1995. In 2017 the only Metropolitan council to hold elections was Doncaster
Source: Electoral Commission, Local Election Results: Colin Rallings and Michael Thrasher, British Electoral Facts 1832-2012 (2012).
TURNOUT IN LOCAL ELECTIONS
London Boroughs
Unitary Councils
County Councils Metropolitan
District Councils
Welsh
Unitariesa
Scottish
Unitariesb
1973 - - 42.6% 33.4% 38.6% 55.0% -1974 36.3% - - - - - 52.1%1975 - - - 32.7% - - -1976 - - - 38.1% 44.3% - -1977 - - 42.3% - - 51.0% 48.2%1978 42.9% - - 37.2% 42.4% - -1979 - - - 74.7% 76.6% - -1980 - - - 36.3% 38.9% - 46.2%1981 - - 43.7% - - 48.6% -1982 43.9% - - 38.8% 41.8% - -1983 - - - 42.0% 45.6% - -1984 - - - 40.8% 40.2% - 44.8%1985 - - 41.6% - - 45.2% -1986 45.5% - - 39.9% 41.9% - -1987 - - - 44.7% 47.8% - -1988 - - - 40.1% 41.5% - 45.5%1989 - - 39.2% - - 44.2% -1990 48.1% - - 46.2% 48.6% - -1991 - - - 40.8% 47.5% - -1992 - - - 32.5% 37.8% - 41.4%1993 - - 37.2% - - 38.8% -1994 46.0% - - 38.9% 42.6% - -1995 - 39.7% - 33.8% 41.0% 48.8% 44.9%1996 - 34.6% - 30.5% 37.2% - -1997 - 69.7% 73.2% - - - -1998 34.6% 27.8% - 24.8% 30.8% - -1999 - 31.5% - 26.1% 35.8% 49.7% 59.4%2000 - 28.5% - 26.0% 32.2% - -2001 - 57.6% 62.5% - - - -2002 31.6% 30.2% - 31.8% 35.4% - -2003 - 36.8% - 33.1% 35.8% - 50.1%2004 - 37.2% - 41.3% 41.0% 43.2% -2005 - 61.3% 63.8% - - - -2006 39.9% 33.7% - 34.7% 37.0% - -2007 - 36.0% - 34.9% 38.0% - 52.8%2008 - 34.6% - 34.2% 36.1% 42.1% -2009 - 41.5% 39.1% - - - -2010 61.4% 60.8% - 60.7% 66.0% - -2011 - 40.4% - 38.3% 43.9% - -2012 - 29.5% - 31.0% 31.3% 38.4% 39.8%2013 - 31.6% 30.6% - - - -2014 38.2% 33.7% - 33.3% 36.6% - -2015 - 62.5% - 61.0% 66.4% - -2016 - 33.3% - 33.0% 34.6% - -2017 - 37.3% 34.8% 29.2% - 41.8% 46.0%2018 38.9% 32.8% - 31.8% 34.8% - -
England
14 Turnout at elections
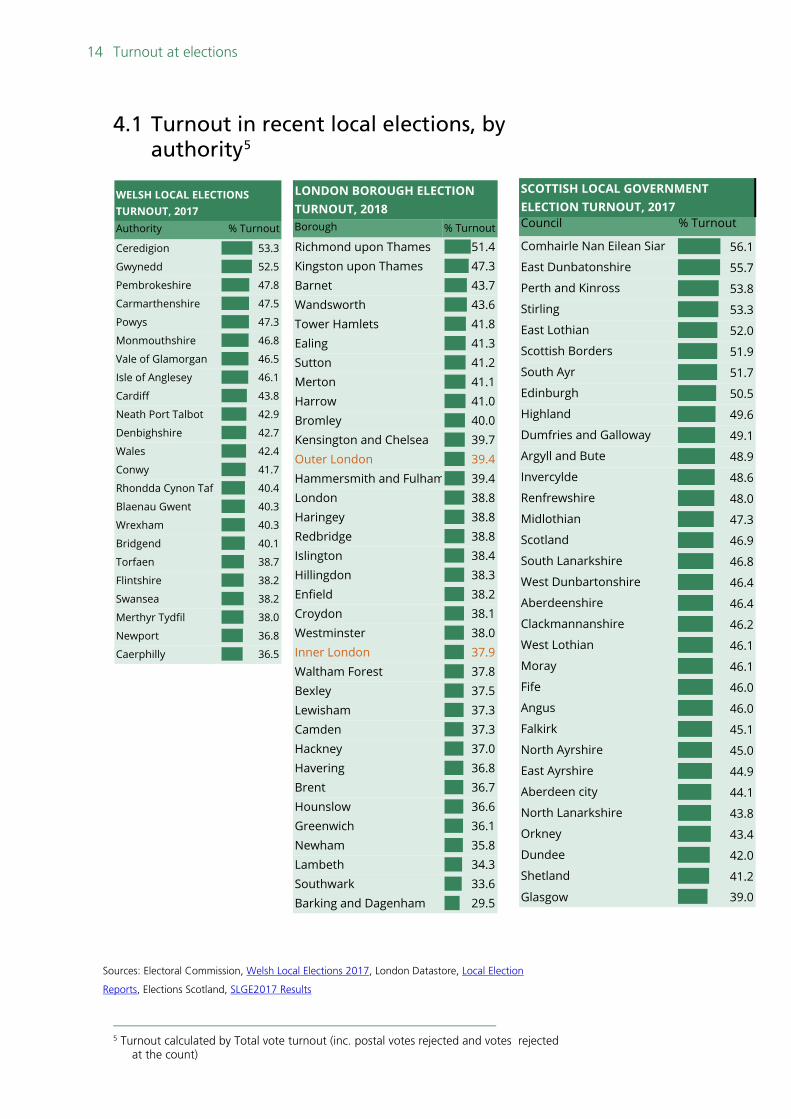
4.1 Turnout in recent local elections, by authority5
5 Turnout calculated by Total vote turnout (inc. postal votes rejected and votes rejected
at the count)
Sources: Electoral Commission, Welsh Local Elections 2017, London Datastore, Local Election
Reports, Elections Scotland, SLGE2017 Results
Authority % Turnout
Ceredigion 53.3
Gwynedd 52.5
Pembrokeshire 47.8
Carmarthenshire 47.5
Powys 47.3
Monmouthshire 46.8
Vale of Glamorgan 46.5
Isle of Anglesey 46.1
Cardiff 43.8
Neath Port Talbot 42.9
Denbighshire 42.7
Wales 42.4
Conwy 41.7
Rhondda Cynon Taf 40.4
Blaenau Gwent 40.3
Wrexham 40.3
Bridgend 40.1
Torfaen 38.7
Flintshire 38.2
Swansea 38.2
Merthyr Tydfil 38.0
Newport 36.8
Caerphilly 36.5
WELSH LOCAL ELECTIONS TURNOUT, 2017
Council % Turnout
Comhairle Nan Eilean Siar 56.1
East Dunbatonshire 55.7
Perth and Kinross 53.8
Stirling 53.3
East Lothian 52.0
Scottish Borders 51.9
South Ayr 51.7
Edinburgh 50.5
Highland 49.6
Dumfries and Galloway 49.1
Argyll and Bute 48.9
Invercylde 48.6
Renfrewshire 48.0
Midlothian 47.3
Scotland 46.9
South Lanarkshire 46.8
West Dunbartonshire 46.4
Aberdeenshire 46.4
Clackmannanshire 46.2
West Lothian 46.1
Moray 46.1
Fife 46.0
Angus 46.0
Falkirk 45.1
North Ayrshire 45.0
East Ayrshire 44.9
Aberdeen city 44.1
North Lanarkshire 43.8
Orkney 43.4
Dundee 42.0
Shetland 41.2
Glasgow 39.0
SCOTTISH LOCAL GOVERNMENT ELECTION TURNOUT, 2017
Borough % Turnout
Richmond upon Thames 51.4Kingston upon Thames 47.3Barnet 43.7Wandsworth 43.6Tower Hamlets 41.8Ealing 41.3Sutton 41.2Merton 41.1Harrow 41.0Bromley 40.0Kensington and Chelsea 39.7Outer London 39.4Hammersmith and Fulham 39.4London 38.8Haringey 38.8Redbridge 38.8Islington 38.4Hillingdon 38.3Enfield 38.2Croydon 38.1Westminster 38.0Inner London 37.9Waltham Forest 37.8Bexley 37.5Lewisham 37.3Camden 37.3Hackney 37.0Havering 36.8Brent 36.7Hounslow 36.6Greenwich 36.1Newham 35.8Lambeth 34.3Southwark 33.6Barking and Dagenham 29.5
LONDON BOROUGH ELECTION TURNOUT, 2018
15 Commons Library Briefing, 5 July 2019
Authority % Turnout Authority % Turnout Authority % Turnout
South Lakeland 48.9 South Lakeland 47.3 South Lakeland 47.6
Bristol, City of 45.0 Winchester 45.3 Winchester 44.5
Winchester 43.8 Mole Valley 44.8 Trafford 43.8
Mole Valley 42.2 Derbyshire Dales 44.5 Mole Valley 43.2
Trafford 41.9 Rushcliffe 43.4 South Cambridgeshire 43.0
Stroud 41.9 South Cambridgeshire 42.9 St Albans 41.7
Pendle 41.7 West Somerset 42.9 Pendle 41.1
Cambridge 40.8 Pendle 42.5 Tandridge 41.1
St Albans 40.8 Cambridge 42.3 Calderdale 41.0
Newcastle upon Tyne 40.7 Cotswold 42.3 Welwyn Hatfield 40.3
Chorley 40.3 West Dorset 41.9 Wokingham 39.8
Craven 40.0 St Albans 41.7 Swindon 39.8
Exeter 39.4 Stroud 41.4 Newcastle upon Tyne 39.6
Oxford 39.2 Rugby 41.3 Watford 39.5
Tandridge 39.2 Northumberland 41.3 Derby 39.1
Woking 39.1 North Norfolk 41.2 North Hertfordshire 39.0
South Cambridgeshire 39.0 Lewes 41.0 Craven 38.9
Stockport 38.7 Mendip 40.8 Bolton 38.8
Bradford 38.6 Purbeck 40.6 Hastings 38.5
Bury 38.5 South Somerset 40.4 Chorley 38.2
TOP 20 TURNOUT AREAS, 2018 ENGLISH LOCAL ELECTIONS
TOP 20 TURNOUT AREAS, 2017 ENGLISH LOCAL ELECTIONS
TOP 20 TURNOUT AREAS, 2016 ENGLISH LOCAL ELECTIONS
Source: Electoral Commission, English Local Elections
16 Turnout at elections
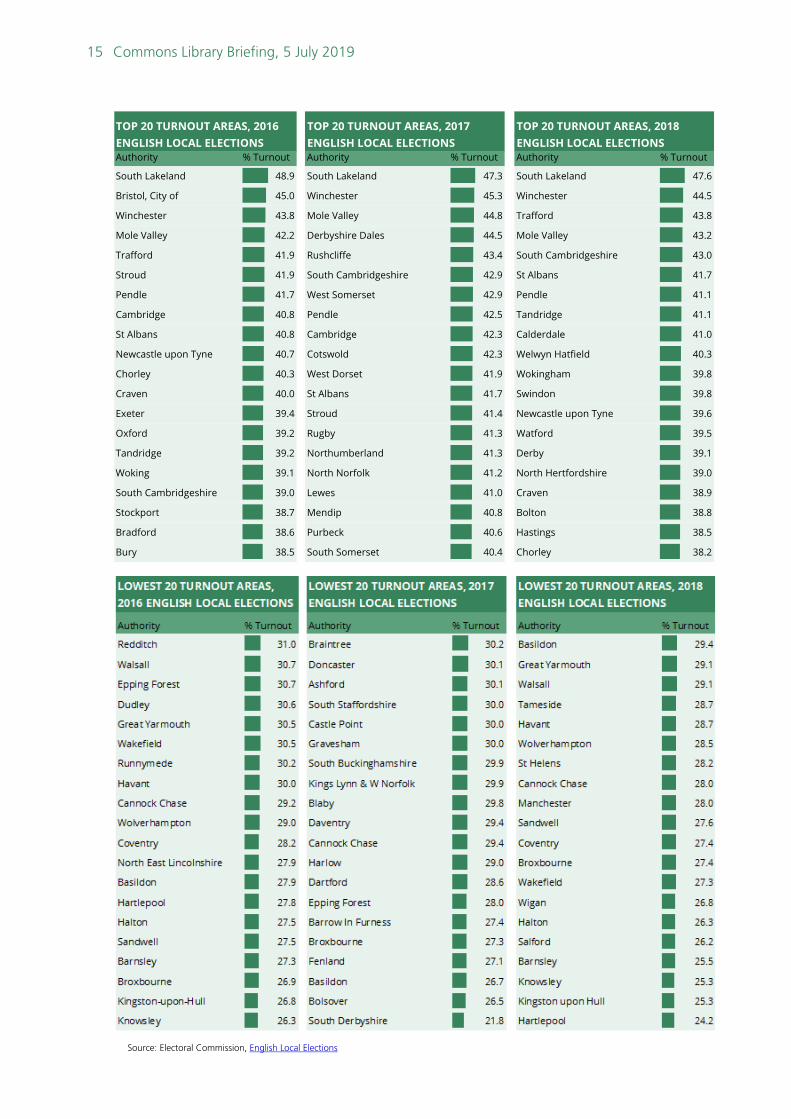
- In 2018, the highest registered turnout for England outside London was in South Lakeland (47.6%), whilst the lowest was seen in Hartlepool (24.2%). This compared to a national turnout of 34.7%.6 10 of the 118 authorities had turnout levels above 40%, and 21 of the 118 authorities saw turnout below 30%.
- In London in 2018, Richmond-upon-Thames had the highest turnout of 51.4%, compared to 29.5% in Barking and Dagenham, which had the lowest turnout.
- In 2017 in England, national turnout was 35.0%. Only 10 of the 122 English authorities had a turnout above 40%, whilst 21 had a turnout below 30%. Turnout ranged in England from 47.3% in South Lakeland to 21.8% in South Derbyshire.
- In Scotland in 2017 the highest turnout was seen in East Renfrewshire (57.8%), whilst the lowest was seen in Glasgow (39%). Scottish overall turnout was 46.9%.
- In Wales in 2017, turnout ranged from 53.3% in Ceredigion to 36.5% in Caerphilly, compared to an overall turnout of 42.4% in Wales.
- In 2016, overall turnout in England was 33.8% in the local elections. The highest turnout was South Lakeland (48.9%), and the lowest was in Knowsley (26.3%).7 24 of the 235 authorities had a turnout above 40%, and 14 had a turnout less than 30%.
6 Electoral Commission, Local elections in England, May 2018 (2018), 5. 7 Electoral Commission, Local and Police and Crime Commissioner Elections May 2016
(2016), 1.
17 Commons Library Briefing, 5 July 2019
4.2 Turnout in recent local elections, by ward in Wales8
Source: Electoral Commission, Local Elections in Wales, May 2017
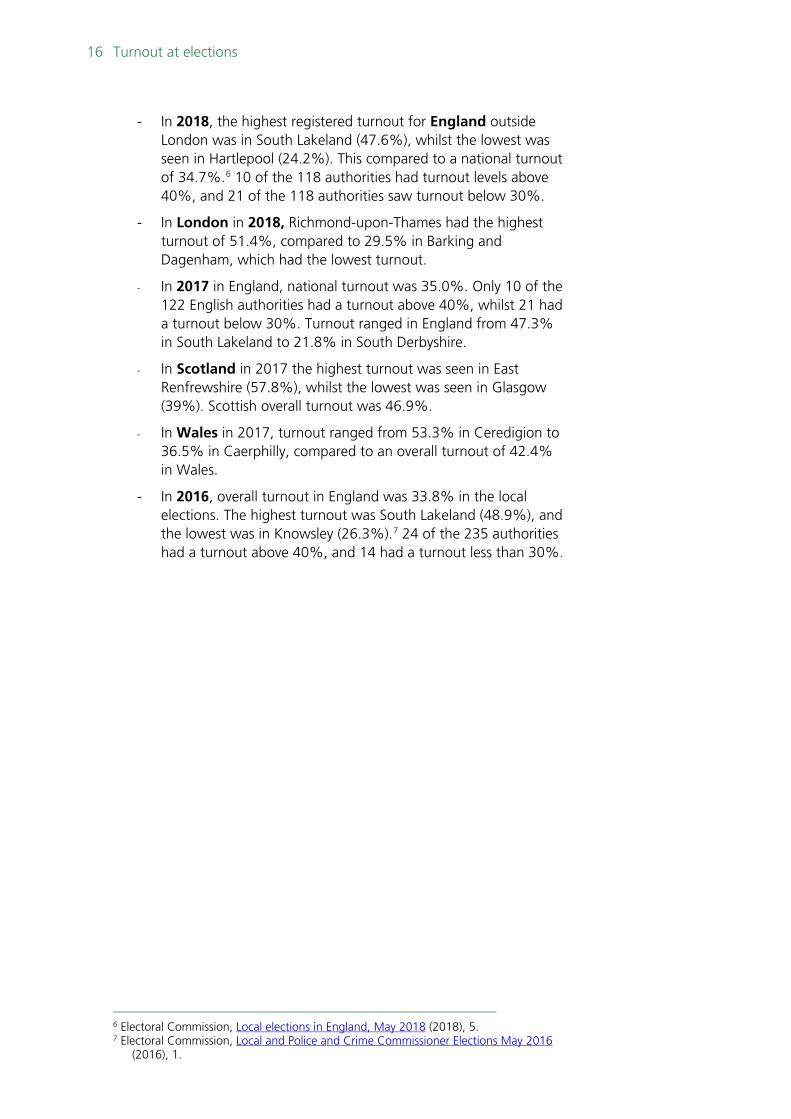
In 2017, in Wales, turnout ranged from 17.3% in Treforest (Rhondda Cyon Taff) to 71.1% in Whitchurch and Tongwynlais (Cardiff).9 This compared to the Welsh overall turnout of 42.4%. The distribution may be seen in the map above. Two council wards saw a turnout of below 20%, whilst 32 council wards experienced turnouts of above 60%. 7 of the 20 highest turnout areas were in Gwynedd, whilst 5 of the 20 lowest turnout areas were in Wrexham.
8 Turnout calculated by total vote turnout (including postal votes rejected and votes
rejected at the count) 9 Electoral Commission, Local Elections in Wales, May 2017 (2017), 3.
% TURNOUT BY WARD, WELSH LOCAL ELECTIONS 2017
18 Turnout at elections
4.3 Turnout in recent local elections, by ward in England10
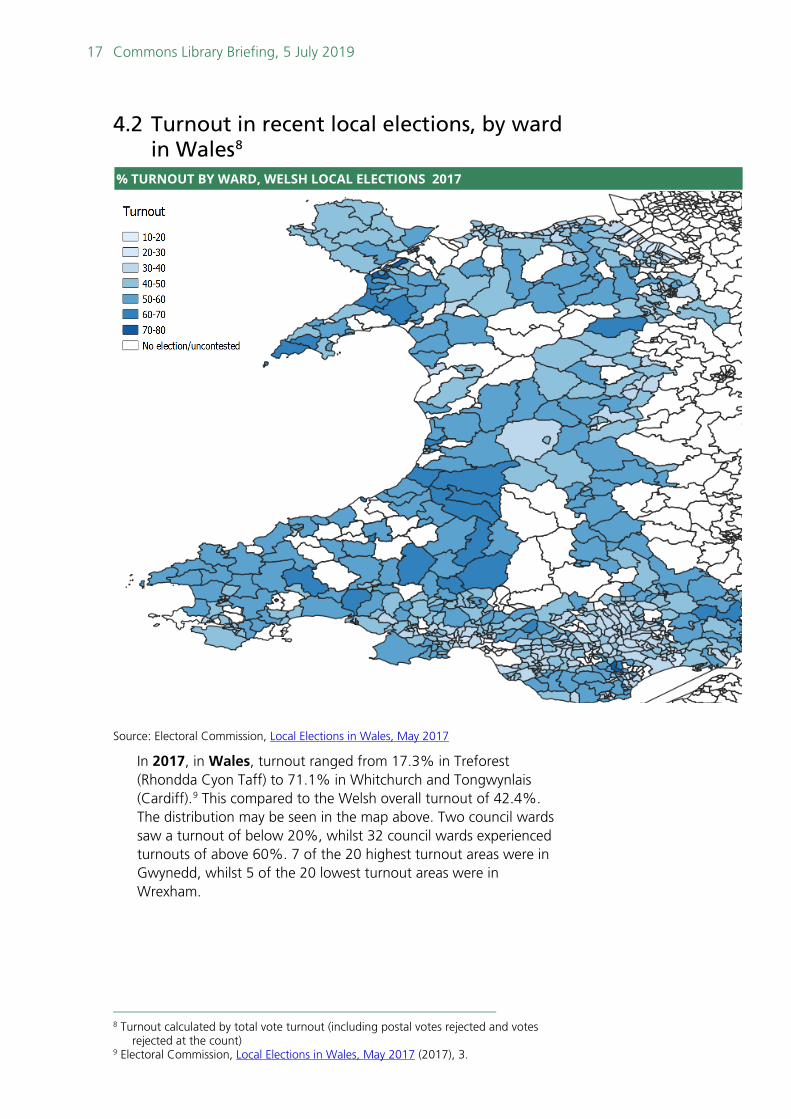
In 2017, turnout in England ranged from 18.1% in Tidworth (Wiltshire) to 60.1% in Hexham West (Northumberland).11 Overall, 6 of the 20 highest turnout areas were in Northumberland and 3 in Wiltshire. 4 of the lowest turnout areas were in South Derbyshire, and 2 in King’s Lynn.
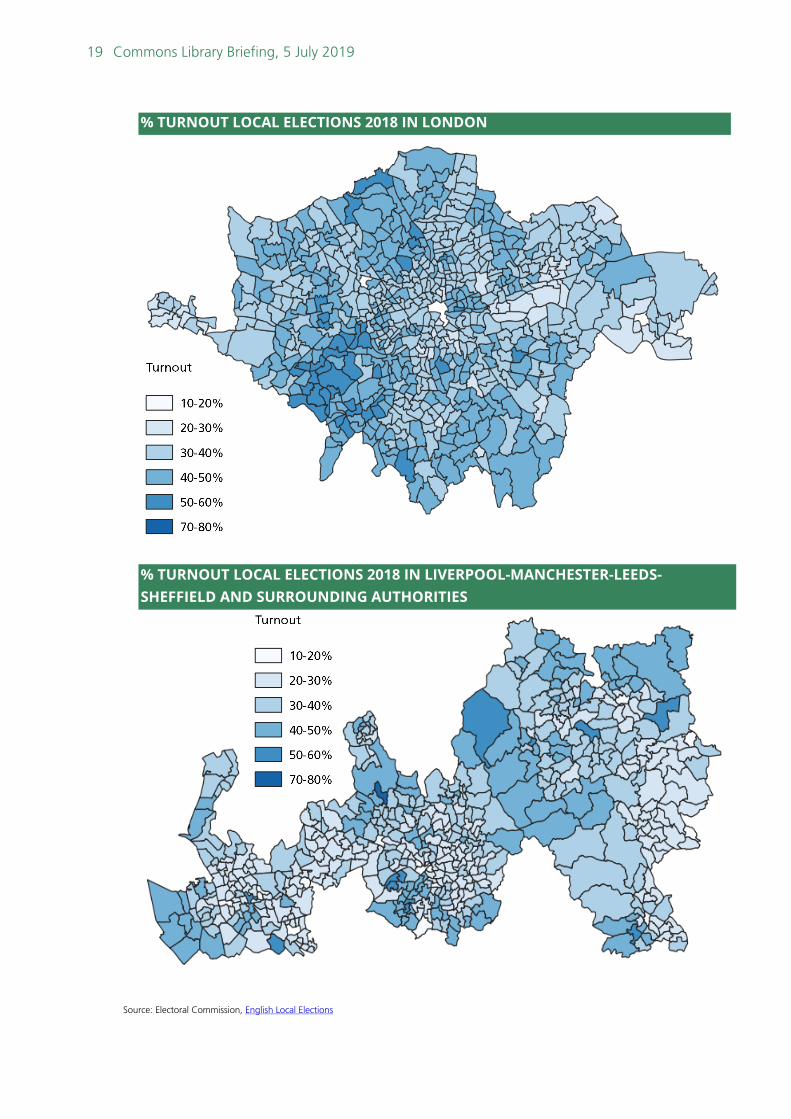
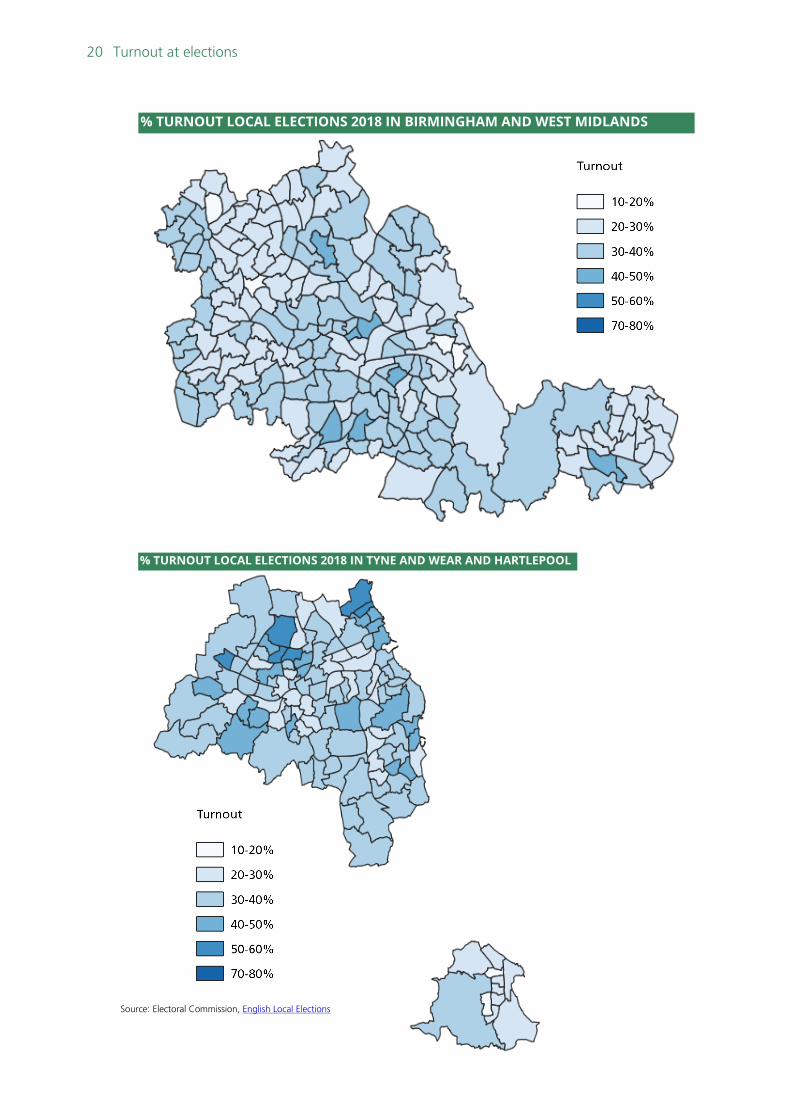
Maps of turnout in 2018 show that turnout in the local elections varied widely between Metropolitan areas, and within them. In 2018, turnout ranged from 77.0% in Bromley Cross (Bolton) to 13.0% in City (Sheffield). The highest turnout ward in London was Dulwich Village (Southwark), at 57.6%, whilst the lowest was in Newington (Southwark), at 24.8%.
10 Turnout calculated by total vote turnout (including postal votes rejected and votes
rejected at the count) 11 Electoral Commission, Local elections in England, May 2017 (2017), 5.
TOP 20 TURNOUT WARDS ENGLAND 2017 LOWEST 20 TURNOUT WARDS ENGLAND 2017
Unitary, Metropolitan and District Authorities Unitary, Metropolitan and District Authorities
Ward Local Authority % Turnout Ward Local Authority % Turnout
Hexham West Northumberland 61.1 Central Richmondshire Richmondshire 22.7
Rugby Bilton & Hillside 60.8 Chigwell & Loughton Broadway Epping Forest 22.6
Pendle Brierfield & Nelson West 59.2 Gaywood South Kings Lynn & W Norfolk 22.6
Morpeth North Northumberland 58.8 Basildon Pitsea Basildon 22.1
Rugby Dunsmore & Leam Valley 58.4 Camp Hill Nuneaton & Bedworth 22.0
Mere Wiltshire 57.9 Gainsborough Hill West Lindsey 21.8
Till & Wylye Valley Wiltshire 57.8 Yarmouth Nelson & Southtown Great Yarmouth 21.8
Rugby Hillmorton 57.4 Hilton South Derbyshire 21.5
Roseland Cornwall 57.4 Bridgwater North & Central Sedgemoor 21.0
Bradford-on-Avon North Wiltshire 56.4 North East Havant Havant 21.0
Morpeth Stobhill Northumberland 56.1 Basildon Laindon Park & Fryerns Basildon 20.9
Rothbury Northumberland 56.0 Durham Woodhouse Close 20.6
Rame Peninsular Cornwall 55.8 Leys Oxford 20.0
Cotswold Cirencester Park 55.4 Old Barrow Barrow In Furness 20.0
Chirbury & Worthen Shropshire 55.4 Kings Lynn North & Central Kings Lynn & W Norfolk 19.5
Bywell Northumberland 55.3 Durham Delves Lane 18.6
South Lakeland Sedbergh & Kirkby Lonsdale 55.2 Wiltshire Tidworth 18.1
Winsley & Westwood Wiltshire 55.2 Swadlincote South South Derbyshire 16.9
Norwich Nelson 54.5 Swadlincote Central South Derbyshire 16.6
Morpeth Kirkhill Northumberland 54.5 Swadlincote North South Derbyshire 15.3
19 Commons Library Briefing, 5 July 2019
% TURNOUT LOCAL ELECTIONS 2018 IN LONDON
% TURNOUT LOCAL ELECTIONS 2018 IN LIVERPOOL-MANCHESTER-LEEDS-SHEFFIELD AND SURROUNDING AUTHORITIES
Source: Electoral Commission, English Local Elections
20 Turnout at elections
% TURNOUT LOCAL ELECTIONS 2018 IN BIRMINGHAM AND WEST MIDLANDS
% TURNOUT LOCAL ELECTIONS 2018 IN TYNE AND WEAR AND HARTLEPOOL
Source: Electoral Commission, English Local Elections
21 Commons Library Briefing, 5 July 2019
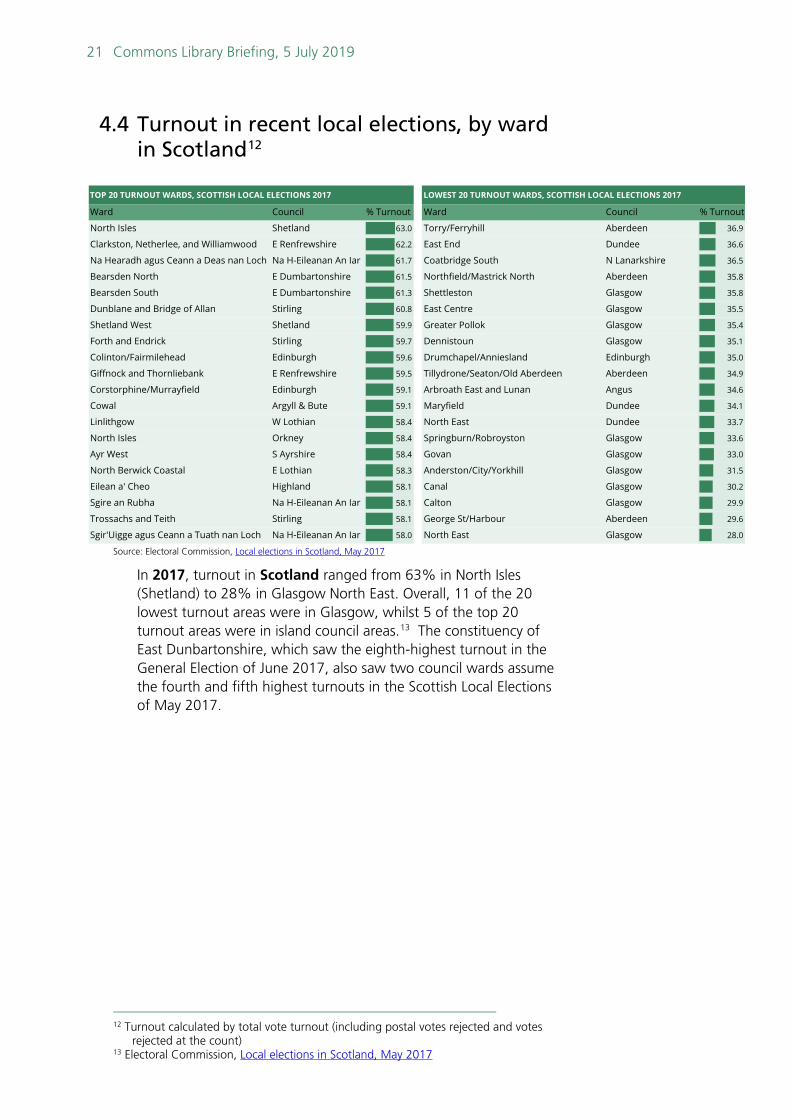
4.4 Turnout in recent local elections, by ward in Scotland12
Source: Electoral Commission, Local elections in Scotland, May 2017
In 2017, turnout in Scotland ranged from 63% in North Isles (Shetland) to 28% in Glasgow North East. Overall, 11 of the 20 lowest turnout areas were in Glasgow, whilst 5 of the top 20 turnout areas were in island council areas.13 The constituency of East Dunbartonshire, which saw the eighth-highest turnout in the General Election of June 2017, also saw two council wards assume the fourth and fifth highest turnouts in the Scottish Local Elections of May 2017.
12 Turnout calculated by total vote turnout (including postal votes rejected and votes
rejected at the count) 13 Electoral Commission, Local elections in Scotland, May 2017
Ward Council % Turnout Ward Council % Turnout
North Isles Shetland 63.0 Torry/Ferryhill Aberdeen 36.9
Clarkston, Netherlee, and Williamwood E Renfrewshire 62.2 East End Dundee 36.6
Na Hearadh agus Ceann a Deas nan Loch Na H-Eileanan An Iar 61.7 Coatbridge South N Lanarkshire 36.5
Bearsden North E Dumbartonshire 61.5 Northfield/Mastrick North Aberdeen 35.8
Bearsden South E Dumbartonshire 61.3 Shettleston Glasgow 35.8
Dunblane and Bridge of Allan Stirling 60.8 East Centre Glasgow 35.5
Shetland West Shetland 59.9 Greater Pollok Glasgow 35.4
Forth and Endrick Stirling 59.7 Dennistoun Glasgow 35.1
Colinton/Fairmilehead Edinburgh 59.6 Drumchapel/Anniesland Edinburgh 35.0
Giffnock and Thornliebank E Renfrewshire 59.5 Tillydrone/Seaton/Old Aberdeen Aberdeen 34.9
Corstorphine/Murrayfield Edinburgh 59.1 Arbroath East and Lunan Angus 34.6
Cowal Argyll & Bute 59.1 Maryfield Dundee 34.1
Linlithgow W Lothian 58.4 North East Dundee 33.7
North Isles Orkney 58.4 Springburn/Robroyston Glasgow 33.6
Ayr West S Ayrshire 58.4 Govan Glasgow 33.0
North Berwick Coastal E Lothian 58.3 Anderston/City/Yorkhill Glasgow 31.5
Eilean a' Cheo Highland 58.1 Canal Glasgow 30.2
Sgire an Rubha Na H-Eileanan An Iar 58.1 Calton Glasgow 29.9
Trossachs and Teith Stirling 58.1 George St/Harbour Aberdeen 29.6
Sgir'Uigge agus Ceann a Tuath nan Loch Na H-Eileanan An Iar 58.0 North East Glasgow 28.0
LOWEST 20 TURNOUT WARDS, SCOTTISH LOCAL ELECTIONS 2017TOP 20 TURNOUT WARDS, SCOTTISH LOCAL ELECTIONS 2017
22 Turnout at elections
5. Appendix
5.1 Estimated turnout by age at UK General Elections
Notes:
a. Data for 1964 and 1966 refers to people aged 21-24 as the voting age was 21 not 18
b. British Election Study data has been adjusted for actual turnout
Source: British Election Study
ESTIMATED TURNOUT BY AGE
18-24 25-34 35-44 45-54 55-64 65+ All1964a 76.4% 70.7% 79.5% 79.1% 78.4% 76.7% 77.1%1966a 60.5% 70.8% 80.0% 79.8% 78.0% 75.9% 75.8%1970 64.9% 66.5% 72.8% 74.9% 74.1% 77.2% 72.0%F1974 70.2% 77.2% 78.7% 73.1% 82.2% 79.2% 78.8%O1974 62.5% 69.0% 73.9% 76.6% 76.6% 76.0% 72.8%1979 62.5% 72.4% 76.3% 81.2% 81.4% 77.7% 76.0%1983 63.9% 67.6% 76.2% 77.6% 77.2% 73.1% 72.7%1987 66.6% 74.0% 74.9% 79.9% 78.9% 76.0% 75.3%
1992 67.3% 77.3% 78.3% 81.8% 78.1% 79.2% 77.7%1997 54.1% 62.2% 70.2% 76.4% 79.9% 77.7% 71.4%2001 40.4% 45.0% 55.7% 63.2% 64.0% 70.1% 59.4%2005 38.2% 47.7% 61.6% 65.5% 72.6% 74.3% 61.3%2010 51.8% 57.3% 64.4% 67.5% 69.8% 74.7% 65.0%2015 51.5% 52.0% 60.3% 70.1% 74.1% 78.8% 66.1%2017 64.7% 62.8% 65.6% 68.6% 72.3% 75.0% 68.8%
Age group
BRIEFING PAPER Number CBP 8060 5 July 2019
About the Library The House of Commons Library research service provides MPs and their staff with the impartial briefing and evidence base they need to do their work in scrutinising Government, proposing legislation, and supporting constituents.
As well as providing MPs with a confidential service we publish open briefing papers, which are available on the Parliament website.
Every effort is made to ensure that the information contained in these publicly available research briefings is correct at the time of publication. Readers should be aware however that briefings are not necessarily updated or otherwise amended to reflect subsequent changes.
If you have any comments on our briefings please email [email protected]. Authors are available to discuss the content of this briefing only with Members and their staff.
If you have any general questions about the work of the House of Commons you can email [email protected].
Disclaimer This information is provided to Members of Parliament in support of their parliamentary duties. It is a general briefing only and should not be relied on as a substitute for specific advice. The House of Commons or the author(s) shall not be liable for any errors or omissions, or for any loss or damage of any kind arising from its use, and may remove, vary or amend any information at any time without prior notice.
The House of Commons accepts no responsibility for any references or links to, or the content of, information maintained by third parties. This information is provided subject to the conditions of the Open Parliament Licence.
Related Documents