Pilot Project on Aquifer Mapping, Karnataka भारत सरकार जल संसाधन, नदी विकास और गंगा संरण मंालय क ीय भूवम जल बोड GOVERNMENT OF INDIA MINISTRY OF WATER RESOURCES, RIVER DEVELOPMENT AND GANGA REJUVENATION CENTRAL GROUND WATER BOARD अंकसंा जल विभाजन भाग, वतपटूर और सी.एन.हली तालुक, तुमकुर वजला, कनाडटक की ायोवगक जल भृतमान विण पररयोजना का वतिेदन PILOT PROJECT ON AQUIFER MAPPING IN ANKASANDRA WATERSHED, PARTS OF TIPTUR & C.N.HALLI TALUKS, TUMKUR DISTRICT, KARNATAKA दवण पविम े,बगलू SOUTH WESTERN REGION, BANGALORE ददसबर-2015 DECEMBER 2015

Welcome message from author
This document is posted to help you gain knowledge. Please leave a comment to let me know what you think about it! Share it to your friends and learn new things together.
Transcript

Pilot Project on Aquifer Mapping, Karnataka
भारत सरकार
जल ससंाधन, नदी विकास और गंगा सरंक्षण मतं्रालय
कें द्रीय भूवम जल बोर्ड
GOVERNMENT OF INDIA MINISTRY OF WATER RESOURCES,
RIVER DEVELOPMENT AND GANGA REJUVENATION
CENTRAL GROUND WATER BOARD
अकंसदं्रा जल विभाजन भाग, वतपटूर और सी.एन.हल्ली तालकु,
तमुकुर वजला, कनाडटक की प्रायोवगक जल भतृमान वित्रण पररयोजना का
प्रवतिदेन
PILOT PROJECT ON AQUIFER MAPPING IN ANKASANDRA WATERSHED,
PARTS OF TIPTUR & C.N.HALLI TALUKS, TUMKUR DISTRICT, KARNATAKA
दवक्षण पविम क्षते्र,बेंगलरूु SOUTH WESTERN REGION, BANGALORE
ददसम्बर-2015 DECEMBER 2015
Pilot Project on Aquifer Mapping, Karnataka
Central Ground Water Board, SWR, Bangalore Page 2
PREFACE
An accurate and comprehensive micro-level scenario of ground water through aquifer mapping in different hydrogeological setting enables robust ground water management plans up to village level. The paradigm shift from development to management of ground water during the last one decade has necessitated the need for a reliable comprehensive aquifer maps on larger scale for equitable and sustainable management of the ground water resources at local scale. Aquifer mapping study involves integration of multidisciplinary scientific aspects including geological, hydrogeological, geophysical, hydrological, hydrogeochemical and ground water modeling. This helps to characterize the quantity, quality and ground water movement in the aquifers and their optimal management plans.
In view of the wide range in options for ground water resources management, Central Ground Water Board (CGWB), South Western Region, Bangalore, Ministry of Water Resources, River Development and Ganga Rejuvenation (MoWR, RD & GR), Government of India has carried out “Pilot project on Aquifer Mapping in Ankasandra Watershed, parts of Tiptur and C.N.Halli taluks, Tumkur district, Karnataka” covering an area of 375 sq.km representing a hard rock terrain.
The main objectives of the study are (i) identification and mapping of aquifers, (ii) quantification of the available ground water resources, (iii) preparation of appropriate management plans as per demand and supply, (iv) aquifer characterisation and (v) institutional arrangements for participatory management. Based upon these studies, a resource-based management plan is suggested through an integrated approach and two major aquifer management plans have been recommended viz., ‘villages favourable for ground water development’ and ‘villages not favourable for ground water development’. Various water stress mitigating options by integrating technical and non-technical measures are also recommended for sustainable ground water development and management in the area.
This report will go a long way in helping the planners and managers as well as the academicians as a guide and reference volume in the field of Ground Water Resources Management (GWRM) particularly at village level. The untiring and sincere efforts put forth by Scientists of Central Ground Water Board, South Western Region, Bangalore in bringing out this publication is thankfully acknowledged. This report will also act as a stepping stone to take up various studies for National Project on Aquifer Mapping.
(Dr.K.R.Sooryanarayana) Head of Office
Pilot Project on Aquifer Mapping, Karnataka
Central Ground Water Board, SWR, Bangalore Page 3
ACNOWLEDGEMENTS
The authors express their deep gratitude to Sri K.B.Biswas, Chairman, Dr.R.C.Jain, Sri.Sushil
Gupta and Dr.S.C.Dhiman, Former Chairman, CGWB, Faridabad for giving opportunity for
association in the pilot project and preparation of this report.
The authors are indebted to Dr.D.Saha, Member (SAM), K.C.Naik, Member (RGI),
Dr.E.Sampath Kumar, Member (SML), and Dr.N.Varadaraj, Former Members, CGWB,
Faridabad for their guidance during the project.
The authors express their sincere thanks to Sri. G.Sudarshan, Former Regional Director and
Dr.K.R.Sooryanarayana, Suptdg. Hydrogeologist for their keen interest, supervision,
guidance and encouragements from time to time for completion of the project and the report.
Sincere thanks are also for his meticulous scrutiny.
Sincere thanks to Dr.K.Md.Najeeb, Former Member (T&TT), CGWB, Faridabad and
Sri.D.Subba Rao, Regional Director, Central Region, Nagpur for the guidance during their
tenure as Regional Directors at SWR, Bangalore. Sincere thanks also to Sri K.V.Kumar,
Former Suptdg. Geophysicist, CGWB for his services during geophysical well logging. Due
thanks are also to Dr.Gnanasundar, and Dr.M.Senthil Kumar, Scientists from CGWB, SECR,
Chennai for their contribution during modelling work.
Sincere thanks to Director, Department of Education, Government of Karnataka for providing
land and NOC for construction of borewells in their school premises.
Thanks are also to various State Government Departments like Department of Mines and
Geology, Karnataka State Remote Sensing Applications Center (KSRSAC), Department of
Revenue, Department of Panchayat Raj and Engineering (PRED), Department of
Horticulture, Department of Minor Irrigation, etc., for providing concerned data.
Sincere thanks to Dr.S.Suresh, Scientist-D and other officers from CGWB, CHQ, Faridabad,
for their support and guidance from time to time.
Thanks are also due to the colleagues from CGWB, SWR and Division – XIV, Bangalore
who helped in completing the pilot project on aquifer mapping at various levels.
Pilot Project on Aquifer Mapping, Karnataka
Central Ground Water Board, SWR, Bangalore Page 4
PILOT PROJECT ON AQUIFER MAPPING IN ANKASANDRA WATERSHED, PARTS OF TIPTUR & C.N.HALLI TALUKS, TUMKUR
DISTRICT, KARNATAKA
CONTENTS
PREFACE
ACKNOWLEDGEMENT
ABBREVAIATIONS
EXECUTIVE SUMMARY
CONTENTS ............................................................................................................................................... 4
1.0 INTRODUCTION ............................................................................................................................... 25
1.1 OBJECTIVES AND SCOPE .............................................................................................................. 27
1.2 APPROACH .................................................................................................................................. 28
1.3 LOCATION .................................................................................................................................... 28
1.3.1 Accessibility .......................................................................................................................... 31
1.3.2 Administrative divisions ....................................................................................................... 31
1.3.3 Demography ......................................................................................................................... 32
1.3.4 Agriculture............................................................................................................................ 32
1.3.5 Industries ............................................................................................................................. 32
1.3.6 Mining activities ................................................................................................................... 33
1.3.7 Urban area ........................................................................................................................... 33
1.3.8 Previous studies ................................................................................................................... 33
2.0 DATA AVAILABILITY & DATA GAP ANALYSIS ................................................................................... 34
2.1 Climate ........................................................................................................................................ 37
2.1.1 Rainfall ................................................................................................................................. 37
2.1.2 Temperature ........................................................................................................................ 37
2.1.3 Humidity ............................................................................................................................... 37
2.1.4 Wind speed .......................................................................................................................... 37
2.1.5 Potential Evapotranspiration (PET) ...................................................................................... 37
2.2 Soil ............................................................................................................................................... 38
2.3 Land use ...................................................................................................................................... 38
2.4 Geomorphology .......................................................................................................................... 38
2.5 Geology ....................................................................................................................................... 38
2.5.1 Stratigraphy .......................................................................................................................... 38
Pilot Project on Aquifer Mapping, Karnataka
Central Ground Water Board, SWR, Bangalore Page 5
2.5.2 Description of the litho units ............................................................................................... 39
2.6 Geophysics .................................................................................................................................. 43
2.7 Sub-surface lithological information ........................................................................................... 43
2.8 Hydrogeology .............................................................................................................................. 44
2.8.1 Aquifer system ..................................................................................................................... 44
2.8.1.1 Phreatic aquifers ........................................................................................................... 45
2.8.1.2 Semi-confined to confined aquifers .............................................................................. 45
2.9 Aquifer disposition ...................................................................................................................... 46
2.10 ground Water level ................................................................................................................... 46
2.11 Water quality ............................................................................................................................ 47
2.12 Recharge parameters ................................................................................................................ 47
2.13 Discharge parameters ............................................................................................................... 47
3.0DATA GENERATION .......................................................................................................................... 48
3.1 Climate ........................................................................................................................................ 48
3.1.1 Rainfall ................................................................................................................................. 48
3.1.2 Drought analysis ................................................................................................................... 51
3.2 Soil ............................................................................................................................................... 51
3.2.1 Infiltration characteristics of Soil ......................................................................................... 53
3.3 Land Use ...................................................................................................................................... 57
3.4 Geomorphology .......................................................................................................................... 62
3.4.1 Drainage characteristics ....................................................................................................... 62
3.4.2 Sub-watershed wise morphometric parameters ................................................................. 63
3.4.4 Hydrogeomorphology .......................................................................................................... 70
3.4.5 Lineament mapping ............................................................................................................. 71
3.5 Geophysics .................................................................................................................................. 77
3.5.1 Geophysics (CGWB).............................................................................................................. 77
3.5.1.1 Surface geophysics ........................................................................................................ 77
3.5.1.1.1 Data acquisition and interpretation ....................................................................... 77
3.5.1.1.2 Results and discussion ........................................................................................... 77
3.5.1.1.3 Weathered thickness contour map ....................................................................... 77
3.5.1.1.4 Depth to basement contour map .......................................................................... 78
3.5.1.1.5 Resistivity behaviour of formations ....................................................................... 79
3.5.1.2 Borehole geophysics ..................................................................................................... 84
3.5.1.3 Conclusion and correlation ........................................................................................... 89
Pilot Project on Aquifer Mapping, Karnataka
Central Ground Water Board, SWR, Bangalore Page 6
3.5.2 Geophysics (from NGRI Report) ........................................................................................... 90
3.6 Sub-Surface Information ........................................................................................................... 104
3.6.1 Ground water exploration through outsourcing (AAP 2013-14) ....................................... 104
3.6.2 Selection of sites for exploratory wells .............................................................................. 104
3.6.3 Construction of exploratory wells ...................................................................................... 104
3.6.4 Dykes .................................................................................................................................. 108
3.6.5 Aquifer parameters ............................................................................................................ 108
3.6.5.1 Slug tests ..................................................................................................................... 108
3.6.5.2 Short duration tests .................................................................................................... 109
3.6.5.3 Long duration tests ..................................................................................................... 109
3.6.6 Fracture analysis ................................................................................................................ 109
3.6.7 Summarized results of ground water exploration ............................................................. 111
3.6.8 Micro level hydrogeological inventory .............................................................................. 119
3.6.9 Conclusions ........................................................................................................................ 134
3.7 groUnd WATER LEVEL ............................................................................................................... 136
3.7.1 Post-monsoon depth to ground water levels .................................................................... 137
3.7.2 Average depth to ground water level ................................................................................ 142
3.7.3 Analysis of depth to ground water levels with time .......................................................... 143
3.7.4 Depth to water table elevation .......................................................................................... 145
3.7.5 Water table fluctuation (WTF) ........................................................................................... 150
3.7.5.1 Water table fluctuation – May 2012 vs. November 2012 .......................................... 150
3.7.5.2 Water table fluctuation – May 2013 vs. September 2013 .......................................... 150
3.7.5.3 Water table fluctuation – September 2013 vs. April 2014 ......................................... 150
3.7.6 Hydrographs ....................................................................................................................... 153
3.8 WATER QUALITY ........................................................................................................................ 156
3.8.1 Relation of ground water quality to Lithology ................................................................... 156
3.8.2 Hydrochemistry in the study area ...................................................................................... 156
3.8.2.1 Ground water quality in Granite formation ................................................................ 158
3.8.2.2 Ground water quality in Schistose formation ............................................................. 158
3.8.3 Suitability of ground water for domestic purpose ............................................................. 159
3.8.3.1 pH ................................................................................................................................ 159
3.8.3.2 Electrical Conductivity (EC) ......................................................................................... 159
3.8.3.3 Total hardness (TH) ..................................................................................................... 160
3.8.3.4 Calcium ........................................................................................................................ 161
Pilot Project on Aquifer Mapping, Karnataka
Central Ground Water Board, SWR, Bangalore Page 7
3.8.3.5 Magnesium ................................................................................................................. 161
3.8.3.6 Sodium ........................................................................................................................ 161
3.8.3.7 Potassium .................................................................................................................... 161
3.8.3.8 Carbonate and Bicarbonate ........................................................................................ 161
3.8.3.9 Chloride ....................................................................................................................... 161
3.8.3.10 Nitrate ....................................................................................................................... 162
3.8.3.11 Sulphate .................................................................................................................... 163
3.8.3.12 Fluoride ..................................................................................................................... 163
3.8.3.13 Phosphate ................................................................................................................. 163
3.8.3.14 Boron ......................................................................................................................... 163
3.8.3.15 Conclusion ................................................................................................................. 163
3.8.4 Heavy metals ...................................................................................................................... 163
3.8.4.1 Zinc .............................................................................................................................. 163
3.8.4.2 Copper ......................................................................................................................... 164
3.8.4.3 Nickel ........................................................................................................................... 164
3.8.4.4 Iron .............................................................................................................................. 164
3.8.5 Suitability of ground water for irrigation ........................................................................... 165
3.8.5.1 Electrical Conductivity ................................................................................................. 166
3.8.5.2 Sodium hazard ............................................................................................................ 167
3.8.5.3 Sodium Adsorption Ratio (SAR) .................................................................................. 167
3.8.5.4 Wilcox diagram ........................................................................................................... 167
3.8.5.5 US Salinity diagram ..................................................................................................... 168
3.8.4.6 Bicarbonate hazard ..................................................................................................... 169
3.8.6 Seasonal variation of ground water quality ....................................................................... 170
3.8.6.1 pH ................................................................................................................................ 170
3.8.6.2 Electrical Conductivity (EC) ......................................................................................... 170
3.8.6.3 Total hardness (TH) ..................................................................................................... 171
3.8.6.4 Calcium ........................................................................................................................ 171
3.8.6.5 Magnesium ................................................................................................................. 171
3.8.6.6 Sodium ........................................................................................................................ 171
3.8.6.7 Potassium .................................................................................................................... 171
3.8.6.8 Carbonate.................................................................................................................... 171
3.8.6.9 Bicarbonate ................................................................................................................. 171
3.8.6.10 Chloride ..................................................................................................................... 172
Pilot Project on Aquifer Mapping, Karnataka
Central Ground Water Board, SWR, Bangalore Page 8
3.8.6.11 Nitrate ....................................................................................................................... 172
3.8.6.12 Sulphate .................................................................................................................... 172
3.8.6.13 Fluoride ..................................................................................................................... 172
3.8.7 Radioactive elements ......................................................................................................... 172
3.8.7.1 Radon in ground water ............................................................................................... 172
3.8.7.2 Radon concentration in the area ................................................................................ 173
3.8.8 Ground water pollution ..................................................................................................... 174
3.9 Recharge Parameters ................................................................................................................ 175
3.9.1 Data collection and compilation ........................................................................................ 175
3.9.2 Ground Water Assessment ................................................................................................ 176
3.9.3 Computation of Ground water Resources ......................................................................... 176
3.9.4 Ground Water Recharge .................................................................................................... 176
3.10 Discharge Parameters ............................................................................................................. 176
3.10.1 Natural Discharge ............................................................................................................. 176
3.10.2 Ground water draft for domestic and industrial purpose ............................................... 176
3.10.3 Ground water draft for irrigation purpose ...................................................................... 177
3.10.4 Categorisation of watershed ............................................................................................ 178
3.10.5 In-storage ground water resources estimation ............................................................... 178
3.11 existing ground water scenario ............................................................................................... 179
4.0 DATA INTEGRARATION ................................................................................................................ 182
4.1 Integration of data from conventional and advanced techniques ........................................... 182
4.2 Value addition from geophysical studies .................................................................................. 182
4.3 Efficacy of various Geophysical techniques for different hydrogeological terrain ................... 187
4.4 Protocol for geophysical investigations in aquifer mapping ..................................................... 187
4.5 Three-DimensionalResistivitySection ....................................................................................... 189
4.6 Views on the surveys carried out by NGRI ................................................................................ 191
4.6.1 Vertical electrical soundings .............................................................................................. 191
4.6.2 GTEM .................................................................................................................................. 192
4.6.3 Electrical resistivity tomography (ERT) .............................................................................. 192
4.6.4 SkyTEM Survey ................................................................................................................... 192
4.6.5 GRP ..................................................................................................................................... 193
4.6.6Efficacy of various types of geophysical surveys ................................................................ 193
4.7 MAJOR FINDINGS ...................................................................................................................... 194
5.0 GENERATION OF AQUIFER MAP ................................................................................................... 196
Pilot Project on Aquifer Mapping, Karnataka
Central Ground Water Board, SWR, Bangalore Page 9
5.1 AQUIFER DISPOSITION .............................................................................................................. 196
5.1.1 Aquifer disposition through borewell inventory................................................................ 196
5.1.2 Aquifer disposition based on exploratory wells through ROCKWORKS software ............. 202
5.1.2 Aquifer disposition based on Geophysical Surveys including SKYTEM .............................. 212
5.2 AQUIFER CHARACTERIZATION .................................................................................................. 213
5.2.1 Long duration pumping test ............................................................................................... 213
5.2.1 Short duration pumping test .............................................................................................. 213
5.2.2 Analysis of Slug test ........................................................................................................... 214
5.2.3. Permeability of the formation .......................................................................................... 214
5.2.3. Characterisation of Aquifers ............................................................................................. 216
6.0 AQUIFER RESPONSE MODEL AND AQUIFER MANAGEMENT FORMULATION .............................. 221
6.1 AQUIFER RESPONSE MODEL ..................................................................................................... 221
6.1.1 Numerical Model Design .................................................................................................... 221
6.1.2 Methodology ...................................................................................................................... 221
6.1.3 Visual MODFLOW ............................................................................................................... 222
6.1.4 Conceptualisation of model ............................................................................................... 222
6.1.5 Grid design ......................................................................................................................... 223
6.1.6 Assumptions used in conceptual model ............................................................................ 224
6.1.7 Geometry and boundary condition ................................................................................... 225
6.1.8 Aquifer parameters ............................................................................................................ 226
6.1.8.1 Conductivity .................................................................................................................... 226
6.1.8.2 Specific storage (Ss) .................................................................................................... 226
6.1.9 Input output stresses ......................................................................................................... 227
6.1.9.1 Recharge due to rainfall .............................................................................................. 227
6.1.9.2 Draft / discharge ......................................................................................................... 228
6.1.10 Groundwater flow equation ............................................................................................ 229
6.1.11 Model calibration ............................................................................................................. 230
6.1.11.1 Steady state calibration ............................................................................................ 230
6.1.11.2 Model Calibration - Remarks .................................................................................... 231
6.1.12 Transient model ............................................................................................................... 232
6.1.12.1 Storage values – transient state ............................................................................... 232
6.1.12.2 Discharge inputs ........................................................................................................ 232
6.1.12.3 Recharge inputs ........................................................................................................ 232
6.1.12.4 Transient state calibrations ...................................................................................... 233
Pilot Project on Aquifer Mapping, Karnataka
Central Ground Water Board, SWR, Bangalore Page 10
Fig. 6.10: Plot of Calculated Vs observed head of Aquifer for March 2014 ............................ 233
6.1.12.5 Remarks of transient condition ................................................................................ 234
6.1.12.6 Cumulative budget – transient state ........................................................................ 234
6.1.12.7 Sensitivity analysis .................................................................................................... 235
6.2 AQUIFER MANAGEMENT PLANFORMULATION ...................................................................... 237
6.2.1 Model forecast for present ground water scenario........................................................... 238
6.2.2 Model forecast -Drought affected years once in 6 years .................................................. 238
6.2.3 Model forecast -Excessive rainfall years once in 6 years ................................................... 239
6.2.4 Model forecast – One percent extra draft for every year ................................................. 240
6.2.5 Model forecast – Response of aquifer by impounding water to existing tanks ................ 240
6.2.6 Predictive model results (of proposed management strategies) ...................................... 241
6.2.7 Results of Management strategy-I ..................................................................................... 242
6.2.8 Results of Management Strategy-II ................................................................................... 242
6.2.9 Results of Management strategy -III .................................................................................. 243
6.2.10 Results of Management strategy –IV ............................................................................... 244
6.2.11 Results of Management Strategy-V ................................................................................. 245
6.2.12 Feasible areas for ground water development (along with yield potential/depth of
drilling/safe yields etc.) ............................................................................................................... 249
6.2.13 Feasible areas for rainwater harvesting and artificial recharge of ground water (vis-a-vis
sub-surface storage space available for recharge and surplus non committed surface water
available for recharge) ................................................................................................................ 251
6.2.14 Aquifer wise vulnerability (Quantity) ............................................................................... 256
6.2.14 Aquifer wise vulnerability (Quality) ................................................................................. 258
7.0 IMPLEMENTATION PLAN & RECOMMENDATION ......................................................................... 261
7.1 IMPLEMENTATION PLAN ........................................................................................................... 261
7.1.1 Implementation plan with ground water development with management options ........ 261
7.1.2 Implementation plan with no further ground water development and with management
practices ...................................................................................................................................... 263
7.1.2.1 Supply side measures .................................................................................................. 263
7.1.2.2 Demand side measures ............................................................................................... 263
7.1.2.3 Participatory ground water management (PGWM) ................................................... 265
7.2 RECOMMENDATIONS................................................................................................................ 270
ANNEXURES .................................................................................................................................... 273
CONTRIBUTORS’ PAGE .................................................................................................................... 313
Pilot Project on Aquifer Mapping, Karnataka
Central Ground Water Board, SWR, Bangalore Page 11
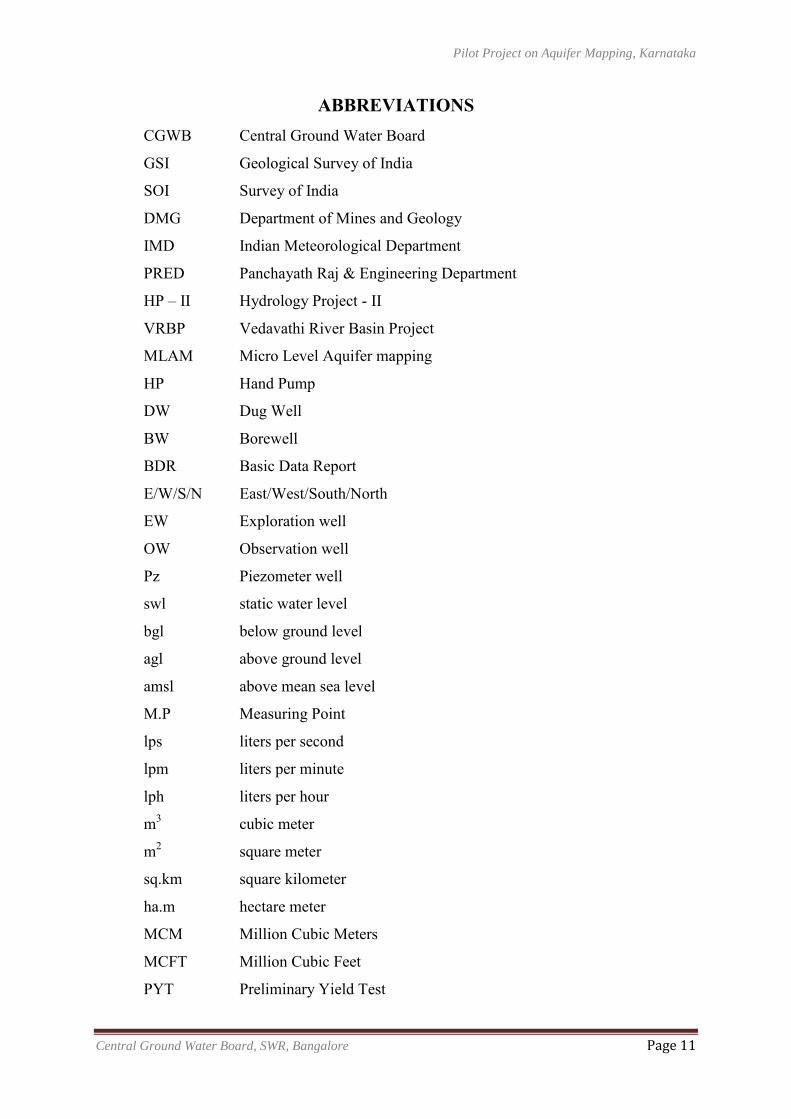
ABBREVIATIONS CGWB Central Ground Water Board
GSI Geological Survey of India
SOI Survey of India
DMG Department of Mines and Geology
IMD Indian Meteorological Department
PRED Panchayath Raj & Engineering Department
HP – II Hydrology Project - II
VRBP Vedavathi River Basin Project
MLAM Micro Level Aquifer mapping
HP Hand Pump
DW Dug Well
BW Borewell
BDR Basic Data Report
E/W/S/N East/West/South/North
EW Exploration well
OW Observation well
Pz Piezometer well
swl static water level
bgl below ground level
agl above ground level
amsl above mean sea level
M.P Measuring Point
lps liters per second
lpm liters per minute
lph liters per hour
m3 cubic meter
m2 square meter
sq.km square kilometer
ha.m hectare meter
MCM Million Cubic Meters
MCFT Million Cubic Feet
PYT Preliminary Yield Test
Pilot Project on Aquifer Mapping, Karnataka
Central Ground Water Board, SWR, Bangalore Page 12
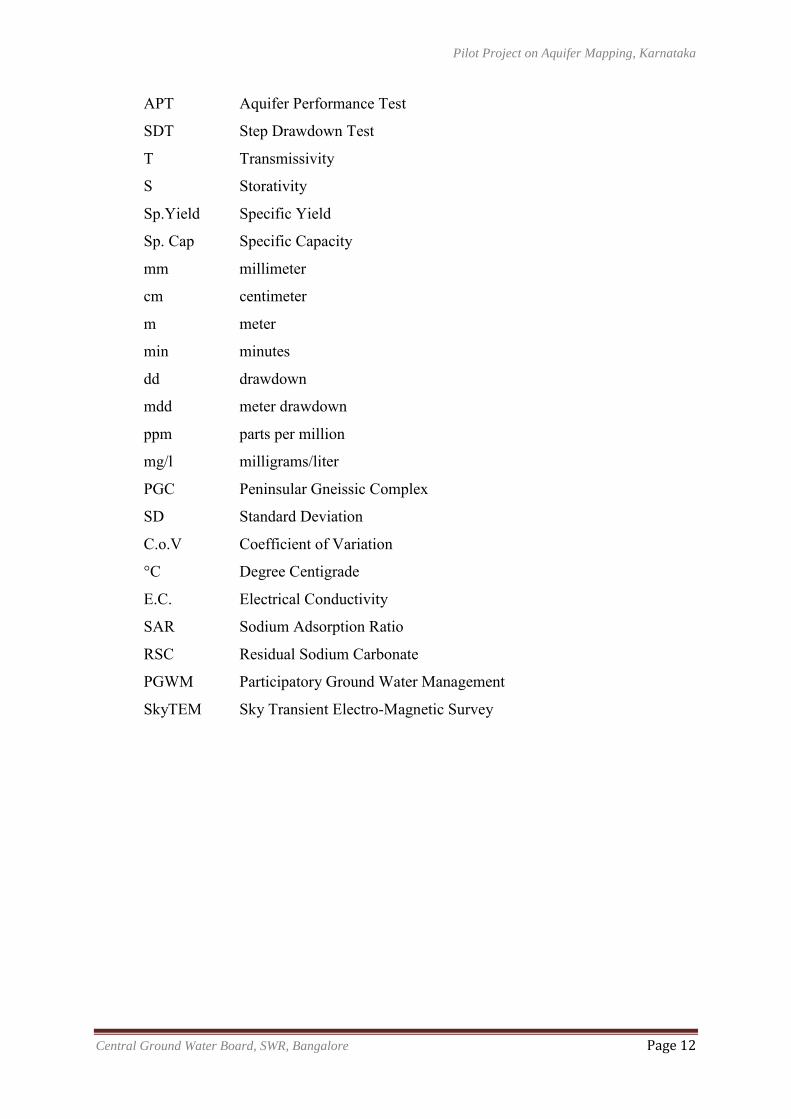
APT Aquifer Performance Test
SDT Step Drawdown Test
T Transmissivity
S Storativity
Sp.Yield Specific Yield
Sp. Cap Specific Capacity
mm millimeter
cm centimeter
m meter
min minutes
dd drawdown
mdd meter drawdown
ppm parts per million
mg/l milligrams/liter
PGC Peninsular Gneissic Complex
SD Standard Deviation
C.o.V Coefficient of Variation
°C Degree Centigrade
E.C. Electrical Conductivity
SAR Sodium Adsorption Ratio
RSC Residual Sodium Carbonate
PGWM Participatory Ground Water Management
SkyTEM Sky Transient Electro-Magnetic Survey
Pilot Project on Aquifer Mapping, Karnataka
Central Ground Water Board, SWR, Bangalore Page 13
EXECUTIVE SUMMARY
Ground water plays a vital role in providing food and water security to the nation. Ground
water management is the most challenging issue, the country faces now. The number of
borewells servicing agriculture is increasing at alarming rate now. The current trend of
chasing the declining water table in search of deeper water bearing zones has entailed high
risk of drilling dry or very low yielding wells, especially in the Hardrock terrain. Ground
water pumping is determined by private decisions; withdrawals are not subjected to any
regulation. In Karnataka state, out of 234 watersheds, 63 watersheds fall in over-exploited
category (GEC 2011). These statistics point out the need for an integrated water management
to make it sustainable. The aquifer mapping is an important step in this direction for
providing protected water supply to all population and also to ensure its sustainability
through water conservation and artificial recharge measures. Aquifer mapping is a
multidisciplinary study wherein a combination of geological, geophysical, hydrologic and
hydro chemical information is applied to characterize the quantity, quality and sustainability
of aquifers.
Ankasandra watershed with an area of 375 sq.kms in the 4D3D8 watershed, covering 138
villages in parts of Tiptur and C.N.Halli taluks of Tumkur district, Karnatakawas selected for
pilot project on aquifer mapping study. The area has mostly clayey, sandy clayey and gravely
clayey soils. It is drained by Torehalla stream with dendritic drainage pattern. The important
crops grown are coconut, arecanut under irrigation and ragi, castor, red gram, etc., under rain
fed cultivation. The area receives about 680 mm rainfall with hot weather and semi-arid
climate. The potential evapotranspiration is more than 1500 mm annually. The area has
general elevation of 860 m amsl in the south to 720 m amsl in the north. Twenty six minor
irrigation tanks existing in the project area, hardly receive any inflow during rainy season.
The area is underlain by Achaean group of rocks consisting of Gneiss (72%), Schist (25%)
and Granites (3%), with occasional dolerite intrusives.
The depth of weathering ranges from negligible to as high as 40 m. The phreatic zone in most
of the project area is de-saturated due to over-draft of the ground water rendering most of the
dug wellsdry. Presently, ground water development is mostly through borewells down to
depth of about 200 m. Ground water monitoring indicates that certain locations, the depth to
ground water level is more than 100 m bgl. The depth to ground water level has continuously
been becoming deeper and deeper with each passing day. Depth to ground water level, water-
table contour and fluctuation maps are generated using the depth to ground water leveldata.
Pilot Project on Aquifer Mapping, Karnataka
Central Ground Water Board, SWR, Bangalore Page 14
The water-table fluctuation is about 10 to 20 m. The ground water flow is towards north and
north-east with a gradient of about 8m/km. Borewell inventory was carried out at 955 wells to
know unit draft, depth of fractures, their yield potential, quality, etc. It reveals that the
average yield is about 3.6 to 7.2 m3/hour. Soil infiltration tests carried out at 20 locations
show that tank beds have negligible infiltration rates due to accumulation of clay and silt.
These tanks are to be de-silted for augmenting infiltration rate.
Exploratory wells constructed at 14 locations down to the depth of 200 m have drilling
discharge ranging from 0.08 to 5.54 lps. Potential fractures are encountered down to the
depth of 200 m bgl. Slug tests, short/long duration Pumping tests are conducted on 14 wells
to decipher know determine the aquifer parameters. Fractureanalyses of wells indicate that
the deeper zones down to 200 m are productive and high yielding when compared to shallow
aquifers. Depth to ground water levels ranged from 12.97 to 80.10 m bgl during the drilling.
The depth of weathering in the area varies from 18.42 to 51.62 m bgl. The Transmissivity
values generally rangbetween 10 and 30 m2/day. The Storativity values generally range from
2x10⁻² to 2x10⁻⁴. Exploration also revealed the occurrence of Dolerite dykes as intrusivesat
various depths with varying thickness at several locations. The contact between Gneiss and
Dolerite is not productive.
A total of 125 Vertical Electrical Soundings (VES) carried out by CGWB deciphered the
lateral and vertical extension of weathered zone, depth to hardrock and presence of fractured
formation. A total of 16 borewells were logged to know the disposition of fractured
formation. It is observed that high gamma counts are noticed against fractured zones.
As a part of carrying out advanced integrated geophysical surveys, NGRI was identified and
awarded contract for taking up geophysical surveys.
NGRI carried out 60 VES, 26 Ground Time Domain Electro Magnetic (Ground TEM), 32
number (15.6 line km) of 2D ERT resistivity imaging, 2909 line kilometer of HeliTEM, and
37 Ground Resistivity Profile (GRP) to delineate weathered, fractured and depth to basement
(massive formation).
SkyTEM survey was also carried out with a line spacing of 150 m having 171 fly-lines in
north east-south west direction. Total flown line km works out to be 2909 of which, 2843 line
km data was considered for processing. The average flight speed of the helicopter was 17 m/s
with an average flight altitude (transmitter frame height) of 35 m above the ground. After
processing the data, initially it is found that in general, the HeliTEM has shown the
Pilot Project on Aquifer Mapping, Karnataka
Central Ground Water Board, SWR, Bangalore Page 15
shallowdepth of investigation (DOI) which indicates poor conduction in the compact
hardrock. However, the general depth of investigation (GDI) is found to be down to 360 m as
per the final interpretation of data.
The net ground water recharge as on March 2014 is 1988 ha.m and the gross ground water
draft for all uses is 3729.88 ha.m. The stage of ground water development is 187.61%.
However, it is observed that the development is not uniform throughout the watershed and in
some of the villages, there is still scope for further development.
Ground water flow modeling was carried out to know the aquifer dynamics for effective
ground water management. Five predictive simulations are prepared by changing various
variables. Attempt to study the impact of impounding water by filling theexisting minor
irrigation tanks to build-up ground water levels was made. It predictedthe in ground water
level in the range of 4 to 7m upto a distance of 2 to 3 km from the tanks.
Analysis of ground waters samples indicate that the ground water is mostly suitable for
domestic and irrigation purpose except the iron concentrations which is beyond permissible
limit at many places. The Radon study at 17 locations revealed the concentration of Radon
from 5.86 Bq/l in Schist to 231 Bq/l in Gneissic formation. The concentration of radon
exceeds the maximum concentration level at 16 locations as per the US Standards. Hence, it
is suggested that the ground water should be used for drinking purpose after 4 days of
pumping.
There is scope for future ground water development in Aralikere, Chattasandra, Dasihalli,
Gaudanahalli, Kallenahalli, Karehalli, Madihalli, Mallenahalli and Upparahalli in C.N.Halli
taluk and Balavaneralu, Bommanahalli, Halkurike, Halkurike Amanaikere,
Mayagondanahalli, Rudrapura and Suragondanahalli villages in Tiptur taluk where the depth
to ground water level is less than 10m bgl. However, while constructing borewells, spacing
norm of 200m between two productive borewells needs to be maintained. Simultaneously, the
management practices should also be taken up for sustainable development of ground water
resources. In other villages, there is no scope forfurther ground water development.
Desiltation of all the existing minor irrigation tanks is essential to enhance their water-storing
capacity increases resulting in enhanced infiltration capacity, which finally will help to
augment ground water resources.
As per Model predictions, the sub-surface storage space available to recharge the aquifers is
estimated to be 6,39,345 ha.m for raising the ground water level upto 10 m bgl and 7,92,205
Pilot Project on Aquifer Mapping, Karnataka
Central Ground Water Board, SWR, Bangalore Page 16
ha.m for raising the water up to 5 m bgl. The total amount of water required to build up the
levels are estimated to be 14,015 ha.m and 20,120 ha.m respectively. There is no surplus
water in the area. Presently, some tanks in Tiptur taluk are impounded with Hemavathi
project canal water. Hence, it is recommended to impound all the existing tanks with canal
water on regular basis for sustainable management of ground water resources.
Participatory ground water management should be adopted for better understanding of the
aquifer system and managing the aquifer by the users themselves and also for sustainability
of ground water resources.
To tackle the problem of dwindling yields or drying up of borewells of farmers, the concept
of crop insurance may be implemented.
This report highlights the compilation of the available baseline information, data gap analysis
and data generation by the combination of geology, geophysics, hydrology, hydrogeology,
hydrochemistry, modeling, etc. The report suggests importing of water from adjacent basin,
whenever surplus surface water is available to fill up the tanks for sustainability of ground
water.
Pilot Project on Aquifer Mapping, Karnataka
Central Ground Water Board, SWR, Bangalore Page 17
List of Tables
Table 1.1: Taluk-wise and village-wise population.
Table 2.1: Data availability and data generated in the study area.
Table 2.2: Stratigraphy of the study area.
Table 2.3: Details of exploratory wells drilled under VRBP.
Table 2.4: Details of pumping test parameter of exploratory wells drilled under VRBP.
Table 2.5: Details of exploratory wells drilled through outsourcing (2004-05).
Table 2.6: Ground water quality of Halkurike network station (2013).
Table 3.1: Month-wise, station-wise rainfall data.
Table 3.2: Classification of soils of the study area.
Table 3.3: Infiltration test details.
Table 3.4: Land use categorization of the study area.
Table 3.5: Details of minor irrigation tanks (more than 40 ha).
Table 3.6: Details of minor irrigation tanks (less than 40 ha).
Table 3.7: Sub-watershed wise morphometric parameters.
Table 3.8: Slope classification of the study area.
Table 3.9: Hydrogeomorphological classification of the study area.
Table 3.10: Number of lineaments and dykes in the study area.
Table 3.11: Details of borehole logging of CGWB wells.
Table 3.12: Total data collected in AQKAR by NGRI.
Table 3.12b: Resistivity ranges for different litho units and hydrogeological conditions.
Table 3.13: ERT results in the Tumkur Pilot Project Area.
Table 3.14: ERTs showing possible presence and absence of deeper saturated fracture zones.
Table 3.15: Hydrogeological details of exploratory wells (2013-14).
Table 3.16: Hydrogeological details of exploratory wells (2013-14).
Table 3.17: Details of dykes encountered in the exploratory borewells.
Table 3.18: Details of pumping test/slug test of exploratory wells (2013-14).
Table 3.19: Fracture analysis of 14 EWs (2013-14).
Table 3.20: Model borewell inventory form.
Table 3.21: Taluk-wise, village-wise number of borewells inventoried.
Table 3.22: Village distribution of total depth of borewells.
Table 3.23: Village-wise depth of weathering.
Table 3.24: Depth-wise occurrence of fractures.
Table 3.25: Analysis of depth vs. fractures.
Pilot Project on Aquifer Mapping, Karnataka
Central Ground Water Board, SWR, Bangalore Page 18
Table 3.26: Analysis of depth vs. yield.
Table 3.27: Village-wise distribution of yield.
Table 3.28: Month-wise average depth to ground water level.
Table 3.29: Month-wise number of station falling in different depth ranges.
Table 3.30: Chemical parameter wise range of concentrations along with IS 10500:2012.
Table 3.31: Computed values of EC, percent sodium, SAR and RSC.
Table 3.32: Classification of irrigation water.
Table 3.33: Radon concentration in ground water in study area. Table 3.34: Formation wise unit draft and total draft for borewells
Table 3.35: Ground Water Resources of the study area on March 2014
Table 3.36: Calculation of In-storage ground water resources estimation Table 4.1: CGWBExploratorywells detailsinAnkasandraWatershedarea.
Table 4.2: Resistivity ranges for different litho units and hydrogeological conditions.
Table 4.3: Efficacy of various types of geophysical surveys.
Table 5.1: Depth-wise occurrence of fractures.
Table 5.2: Analysis of depth vs. fractures.
Table 5.3: Analysis of depth vs. yield.
Table 5.4: Village-wise distribution of yield.
Table 5.5: Format of exploratory well details for Rockworks output.
Table 5.6: Format of lithology data details for Rockworks output.
Table 5.7: Format of stratigraphy data details for Rockworks output.
Table 5.8: Format of fracture depth data details for Rockworks output.
Table 5.9: Format of drilling discharge details for Rockworks output.
Table 5.10: Format of drilling discharge details for Rockworks output.
Table 6.1: Conductivity values
Table 6.2: Distribution of GW draft
Table 6.3: Final set of aquifer parameters arrived through Transient state calibrations
Table 6.4 Cumulative budget (m3) of Ground water for the transient run
Table.6.5 Sensitivity Analyses for change in Hydraulic conductivity values
Table.6.6: Sensitivity Analyses for change in Recharge.
Table.6.7a: Strategies tested for aquifer management plan.
Table 6.7b: Recharge values distributed for drought prediction scenario
Table 6.8: Recharge values distributed for Excess Rainfall years prediction scenario
Table 6.9: Quantum of water impounded in to tanks and its response.
Pilot Project on Aquifer Mapping, Karnataka
Central Ground Water Board, SWR, Bangalore Page 19
Table 6.9a: Cumulative budget of 5 Scenarios.
Table 6.10: Taluk wise list of villages feasible for ground water development with
management practices.
Table 6.11: Taluk wise list of villages feasible for rainwater harvesting and artificial recharge
to ground water.
Table 6.12: Availability of sub-surface space storage (upto 10 m).
Table 6.13: Availability of sub-surface space storage (upto 5 m).
Table 6.14: Taluk wise list of vulnerability villages with respect to ground water quantity.
Table 7.1: Taluk wise list of villages for ground water development.
Table 7.2: Taluk-wise and village-wise number of additional borewells feasible along with
the ground water draft.
Table 7.3: Taluk wise list of villages for no further ground water development.
Pilot Project on Aquifer Mapping, Karnataka
Central Ground Water Board, SWR, Bangalore Page 20
List of Figures:
Fig. 1.1: Location map of the study area.
Fig. 1.2: Satellite image (Google Earth) of the study area.
Fig. 1.3: Taluk wise distribution of villages in the study area.
Fig. 1.4: Transportation network.
Fig. 1.5: Taluk-wise, Hobli-wise distribution of villages.
Fig. 2.1: Data gap analysis.
Fig. 2.2: Geology map.
Fig. 2.3: Hydrograph of Halkurike network station.
Fig. 3.1: Isohyetes (2010).
Fig. 3.2: Isohyetes (2011).
Fig. 3.3: Isohyetes (2012).
Fig. 3.4: Isohyetes (2013).
Fig. 3.5: Soil map.
Fig. 3.6: Location of infiltration test sites.
Fig. 3.7: Distribution of final infiltration rates.
Fig. 3.8: Land use / land cover map.
Fig. 3.9: Drainage map.
Fig. 3.10: Sub-watershed and micro-watersheds of the area.
Fig.3.11: Sub-watershed wise drainage map showing stream orders.
Fig. 3.12: Slope map.
Fig. 3.13: Geomorphology map.
Fig. 3.14: Lineaments and Dykes.
Fig. 3.15: Rose diagrams of lineaments and dykes.
Fig. 3.16: Weathered thickness contour map.
Fig. 3.17: Depth to basement contour map.
Fig. 3.18: Apparent Resistivity at AB/2=25 m.
Fig. 3.19: Apparent Resistivity at AB/2=50 m.
Fig. 3.20: Apparent Resistivity at AB/2=100 m.
Fig. 3.21: Apparent Resistivity at AB/2=200 m.
Fig. 3.22: First layer resistivity map.
Fig. 3.23: Second layer resistivity map.
Fig. 3.24: Third layer resistivity map.
Fig. 3.25: Location map VES sounding.
Pilot Project on Aquifer Mapping, Karnataka
Central Ground Water Board, SWR, Bangalore Page 21
Fig. 3.26: Typical curves in the study area.
Fig. 3.27: Geo-electrical section along Huliar-Tiptur road (Database NGRI & CGWB)
Transient Electromagneticmeasurement (TDEM).
Fig. 3.28: Location map of TDEM survey.
Fig. 3.29: TEM sections showing the subsurface layers.
Fig. 3.30: Resistivity section along NS profile derived from VES (upper) and TEM data.
Fig. 3.31: ERT location map, AQKAR, Tumkur, Karnataka.
Fig. 3.32: Over view of the selected ERT sections in the Tumkur watershed, showing
weathered zone thickness and variations in depth to bedrock.
Fig. 3.33: Weathered zone thickness contour map (Data base NGRI & CGWB).
Fig. 3.34: Saturated zone thickness map (Data base NGRI & CGWB).
Fig. 3.35: GRPsurveylocation map, AQKAR, Tumkur, Karnataka.
Fig. 3.36: Location of exploratory borewells.
Fig. 3.37: Fracture analysis of 14 exploratory wells.
Fig. 3.38: Overlay of well inventory data on village boundary.
Fig. 3.39: Village-wise, depth-wise distribution of borewells.
Fig. 3.40: Village-wise thickness of weathering.
Fig. 3.41: Village-wise occurrence of fractures.
Fig. 3.42: Analysis of depth vs. fractures (scale bar).
Fig. 3.43: Analysis of depth vs. fractures (pie diagram).
Fig. 3.44: Village-wise distribution of yield.
Fig. 3.45: Hydrogeology map.
Fig. 3.46: Location of observation wells.
Fig. 3.47: Depth to ground water level map – Nov. 2011.
Fig. 3.48: Depth to ground water level map – Nov. 2012.
Fig. 3.49: Depth to ground water level map – Sept. 2013.
Fig. 3.50: Depth to ground water level map – May 2012.
Fig. 3.51: Depth to ground water level map – May 2013.
Fig. 3.52: Depth to ground water level map – Apr. 2014.
Fig. 3.53: Hydrograph of average depth to ground water level.
Fig. 3.54: Water table elevation contour map – Nov. 2011.
Fig. 3.55: Water table elevation contour map – May 2012.
Fig. 3.56: Water table elevation contour map – Nov. 2012.
Fig. 3.57: Water table elevation contour map – May 2013.
Pilot Project on Aquifer Mapping, Karnataka
Central Ground Water Board, SWR, Bangalore Page 22
Fig. 3.58: Water table elevation contour map – Sept. 2013.
Fig. 3.59: Water table elevation contour map – Apr. 2014.
Fig. 3.60: Water table fluctuation map.
Fig. 3.61: Water table fluctuation map.
Fig. 3.62: Water table fluctuation map.
Fig. 3.63: Hydrographs of selected stations.
Fig. 3.64: Location of water samples collected (Sept. 2011).
Fig. 3.65: Location of water samples collected (May 2012).
Fig. 3.66: Spatial distribution ofEC (Sept. 2011).
Fig. 3.67: Spatial distribution of Nitrate (Sept. 2011).
Fig. 3.68: Spatial distribution of Iron (Sept. 2011).
Fig. 3.69: Classification of irrigation water quality with respect to EC and Percent Sodium
(Wilcox’s diagram).
Fig. 3.70: Classification of irrigation water quality with respect to Salinity hazard and
Sodium hazard (USSL diagram).
Fig. 4.1: Comparison of geophysical interpreted results with litholog and drill time log of
borehole at Sarathavalli.
Fig. 4.2: DataintegrationandValidationatCGWBdrilledwellatSasaluvillage.
Fig. 4.3: HeliTEM result along with the well yield and litholog (upper); translated
hydrogeological model (lower).
Fig. 4.4: Hydrogeological section along profile-III containing surface exploited aquifer zone-
1(weatheredzone), Aquiferzone-2 (semi-weathered/fissuredzone, aquiferzone-3
(Hardrock).
Fig. 4.5: Hydrogeological section along profile-III containing surface exploited aquifer zone-
1(weatheredzone), Aquiferzone-2 (semi-weathered/fissuredzone, aquifer zone-3
(Hardrock).
Fig. 5.1: Village-wise occurrence of fractures.
Fig. 5.2: Analysis of depth vs. fractures (scale bar).
Fig. 5.3: Analysis of depth vs. fractures (pie diagram).
Fig. 5.4: Village-wise distribution of yield.
Fig. 5.5: Importing of exploratory wells to Rockworks software.
Fig. 5.6: Location of exploratory borewells (Rockworks).
Fig. 5.7: General topography based on elevation.
Fig. 5.8: 2D-single well strip log data.
Pilot Project on Aquifer Mapping, Karnataka
Central Ground Water Board, SWR, Bangalore Page 23
Fig. 5.9: 2D-multi well strip log data.
Fig. 5.10: 3D-multi well strip log data.
Fig. 5.11: 3D-litholog models.
Fig. 5.12: Volumes of individual lithology models.
Fig. 5.13: Lithology profiles.
Fig. 5.14: Lithology cross-sections.
Fig. 5.15: Fence diagrams.
Fig. 5.16: Discharge data models.
Fig. 5.17: Fracture data models.
Fig. 5.18: Three- dimensional aquifer section represented by E-W and NE-SW profiles of 130
m thickness (NGRI).
Fig. 5.19: Permeability map.
Fig. 5.20: Aquifer characterisation – Depth to ground water level (Pre-monsoon 2013).
Fig. 5.21: Aquifer characterisation – Depth to ground water level (Post-monsoon 2013).
Fig. 5.22: Aquifer characterisation – Water quality (Iron).
Fig. 5.23: Aquifer characterisation – 3D Aquifer Disposition.
Fig. 5.24: Aquifer characterisation – Aquifer map.
Fig. 6.1: Modelling Protocol by Mary P.Anderson & William W.Woessner
Fig. 6.2: 2 D Conceptual model of the area
Fig. 6.3: Model area design.
Fig. 6.4: Model design; active inactive grids and single layer and boundary conditions.
Fig. 6.5: Interpolated zone-wise conductivity
Fig. 6.6: Zone-wise Specific storage & Specific yield values.
Fig. 6.7: Recharge values distribution.
Fig. 6.8: Grid-wise distribution of draft / pumping wells to the model area.
Fig. 6.9: Scattered plot for observed and computed heads for steady state condition.
Fig. 6.10: Plot of Calculated Vs observed head of Aquifer for March 2014.
Fig.6.11: Interpolated and observed hydrographs of observation well at Halenahalli
Fig.6.12. Cumulative budget (m3) of Ground water for the transient run
Fig. 6.13: Finer grids and tank locations for impounding water; scenario-IV.
Fig. 6.14 Head Vs. Time
Fig. 6.15 Drawdown Vs. Time
Fig. 6.16 Head Vs. Time
Fig. 6.17 Drawdown Vs. Time
Pilot Project on Aquifer Mapping, Karnataka
Central Ground Water Board, SWR, Bangalore Page 24
Fig. 6.18 Head Vs. Time
Fig. 6.19 Drawdown Vs. Time
Fig. 6.20 Head Vs. Time
Fig. 6.21 Drawdown Vs. Time
Fig. 6.22 Head Vs. Time
Fig. 6.23 Drawdown Vs. Time
Fig. 6.24: Plots of Head Vs Time for selected villages; scenario-IV
Fig. 6.25: Feasible villages for ground water development.
Fig. 6.26: Feasible villages for rainwater harvesting and artificial recharge.
Fig. 6.27: Vulnerability with respect to ground water quantity.
Fig. 6.28: Vulnerability with respect to ground water quantity (Iron).
Fig. 6.29: Aquifer Management Plan.
List of Annexure:
Annexure 1.1: Village wise population as per Census 2011, Titpur taluk.
Annexure 1.2: Village wise population as per Census 2011, C.N.Halli taluk.
Annexure 3.1: Geo-electrical parameters of VES soundings.
Annexure 3.2: Geophysical logging of exploratory borewells along with lithologs.
Annexure 3.3: Month-wise ground water level data of observation wells.
Annexure 3.4: Elevation of ground water levels of Observation wells from mean sea level
(Water table).
Annexure 3.5: Ground water level fluctuation data of Observation wells.
Annexure 3.6: Water quality data (Sept. 2011)
Annexure 3.7: Water quality data (May 2012).
Annexure 3.8: Seasonal variation of ground water quality (September 2011 Vs. May 2012).
Pilot Project on Aquifer Mapping, Karnataka
Central Ground Water Board, SWR, Bangalore Page 25
1.0 INTRODUCTION
The development activities over the years have adversely affected the ground water regime in
many parts of the country. It necessiates a need for scientific planning in the development of
ground water under different Hydrogeological environs and to evolve effective management
practices with the involvement of community for better ground water governance. As India is
the largest user of ground water in the world, there is an urgent need for an accurate and
comprehensive picture of available ground water resources, through aquifer mapping in
different hydro-geological settings to enable the preparation of robust groundwater
management plans for this common pool resource. The Aquifer mapping at the appropriate
scale has to be devised for a sustainable management plan of this precious resource. This will
help in achieving drinking water security, improved irrigation facility and sustainability in
water resources development in large parts of rural and urban India. It will also help in better
management of ground water vulnerable areas. In the present scenario, the ground water
assessment and management is broadly based on administrative boundaries. In some of the
states, surface watershed boundaries are used to collate the information on regional geology,
hydrogeology, aquifer characteristics and ground water geochemistry. These facts underscore
the need for the 3-D picture of demarcated aquifer systems of the country. Hence, aquifer
mapping has been taken-up to delineate the local aquifers of an extent of 100 to 500 sq.kms,
as a unit for water management in the country. The experience gained from the pilot aquifer
mapping projects in five States under Hydrology Project-II (HP-II) and its efficacy in getting
depth information will be used as guiding tools to replicate in the national project of aquifer
mapping.
An ideal micro-level aquifer mapping study consists of:
Geologic Mapping: The geological maps produced by GSI were compiled on
1:50,000 scale. The map provides detailed surface geologic information for the area
including the presence of geologic structures such as faults, folds, fractures, dykes,
etc.
Geophysical Surveys: VES, ERT, Ground TEM, Logging of borewells etc.
Deep drill holes and Interpretation of Subsurface Geology:Lithologic descriptions,
drill cuttings and geophysical logs from deep drill holes for interpreting the nature and
extent of aquifers for preparation of fence diagrams and geologic cross sections for
two-dimensional view of the subsurface.
Pilot Project on Aquifer Mapping, Karnataka
Central Ground Water Board, SWR, Bangalore Page 26
3-D Geologic Model: By interpolating between two-dimensional views, geologic
information on shallow depths is compiled into three-dimensional, process-based
models for predicting what likely occurrence and extent between and beyond the
available points of observation.
Hydrologic Data Collection and Characterization:
Water level monitoring: Representativewells are used as points of measurement
to monitor ground water levels in the shallow and the deep aquifers. Established
wells with long records of historic ground water levels are an important part of
data for analysis.
Hydrographs: Illustrates the depth to water in an aquifer and how it changes over
time.
Hydrologic database: A user-friendly database to design to store well, ground
water level, water quality and location information for long-term use and public
distribution.
Ground water conditions: Converting the ground water level data to produce a
map of the water-table surface to understand ground water flow conditions and the
effects of geologic features on ground water flow.
Aquifer hydraulic properties: Estimates of hydraulic conductivity derived from
aquifer tests are correlated to mapped geologic units to provide a physical basis
for hydraulic properties assigned to aquifers during development of ground water
flow models.
Geochemistry and water quality: Water samples collected from borewells and
dug wells are analysed for chemical content in laboratories to find out the natural
occurrence of contaminants and to identify waters of similar composition and flow
history, differentiate between recent recharge and waters with older residence
times.
Hydrologic and Hydrogeologic 3-D Conceptual Model: Using hydrologic and
geologic information in combination with other chemical constituents to provide
an accurate conceptual model of the movement of ground water through a
complex aquifer system.
Pilot Project on Aquifer Mapping, Karnataka
Central Ground Water Board, SWR, Bangalore Page 27
1.1 OBJECTIVES AND SCOPE
The objectives of the pilot project are-
i. To define the aquifer geometry, type of aquifers, ground water regime behaviours,
hydraulic characteristics and geochemistry of multi-layered aquifer systems on
1:50,000 scale
ii. Intervention of new geophysical techniques and establishing the utility, efficacy and
suitability of these techniques in different hydrogeological setup.
iii. Finalizing the approach and methodology on which National Aquifer mapping
programme of the entire country can be implemented.
iv. The experiences gained can be utilized to upscale the activities to prepare micro level
aquifer mapping.
The activities of the Pilot Project on Aquifer Mapping can be envisaged as follows;
Data Compilation & Data Gap Analysis: One of the important aspect of the aquifer mapping
programme was the synthesis of the large volume of data already collected during specific
studies carried out by Central Ground Water Board and various Government organizations
with a new data set generated that broadly describe an aquifer system. The data were
assembled, analysed, examined, synthesized and interpreted from available sources. These
sources were predominantly non-computerized data, which was converted into computer
based GIS data sets. On the basis of available data, Data Gaps were identified.
Data Generation: There was also a strong need for generating additional data to fill the data
gaps to achieve the task of aquifer mapping. This was achieved by multiple activities such as
exploratory drilling, geophysical techniques, hydro-geochemical analysis, remote sensing,
besides detailed hydrogeological surveys. CSIR-NGRI has been hired as consultant to carry
out geophysical studies including advance Heliborne Transient Electro Magnetic Method
(Heli-TEM) to delineate multi aquifer system; to bring out the efficacy of various
geophysical techniques and a protocol for use of geophysical techniques for aquifer mapping
in different hydrogeological environs.
Aquifer Map Preparation: On the basis of integration of data generated from various studies
of hydrogeology & geophysics, aquifers have been delineated and characterized in terms of
quality and potential. Various maps have been prepared bringing out Characterization of
Aquifers, which can be termed as Aquifer maps providing spatial variation (lateral & vertical)
Pilot Project on Aquifer Mapping, Karnataka
Central Ground Water Board, SWR, Bangalore Page 28
in reference aquifer extremities, quality, ground water level, potential and vulnerability
(quality & quantity).
Aquifer Response Model: On the basis of aquifer characterization, issues pertaining to
sustainable aquifer management in the area have been identified. Initially, a conceptual model
has been developed for the pilot area and subsequently, a mathematical model has been
formulated simulating the field situation, which was calibrated and validated with the field
data. Various scenarios have been tested in the model to study the response of the aquifer to
various stress conditions and predictive simulations have been carried out up to the year
2025.
Aquifer Management Plan Formulation: Aquifer response Model has been utilized to identify
a suitable strategy for sustainable development of the aquifer in the area.
1.2 APPROACH
The Aquifer management involves:
Identification of aquifer on the basis of geology;
Identification of recharge and discharge areas;
Assessment of aquifer capacity and yield through aquifer mapping;
Protection of recharge area and built-up of groundwater level through artificial
recharge.
Treating groundwater as a common pool resource;
Encouraging community use of groundwater and restricting individual use;
Putting in place an institutional mechanism and legal back up for community
groundwater management;
Awareness generation regarding groundwater and science of hydrogeology.
1.3 LOCATION
In Karnataka State, select watershed was identified for pilot Micro Level Aquifer Mapping
(MLAM) purpose following the criteria of over exploitation of ground water, deep ground
water levels, low rainfall, prevailing drought conditions, etc. Accordingly, Ankasandra
watershed has been identified in Tumkur district, which is a part of 4D3D8watershed and
covers parts of Tiptur and C.N.Halli taluks. The area is located at a distance of 5 km North of
Tiptur town, from Kupparadoddahalli village of Tiptur taluk in the south to Ankasandra
village in C.N.Halli taluk towards north. The area falls in the Survey of India toposheet no.
57 C/7 and 57 C/11 and lies between North latitudes 13 16' 15" to 13 25' 45" and East
Pilot Project on Aquifer Mapping, Karnataka
Central Ground Water Board, SWR, Bangalore Page 29
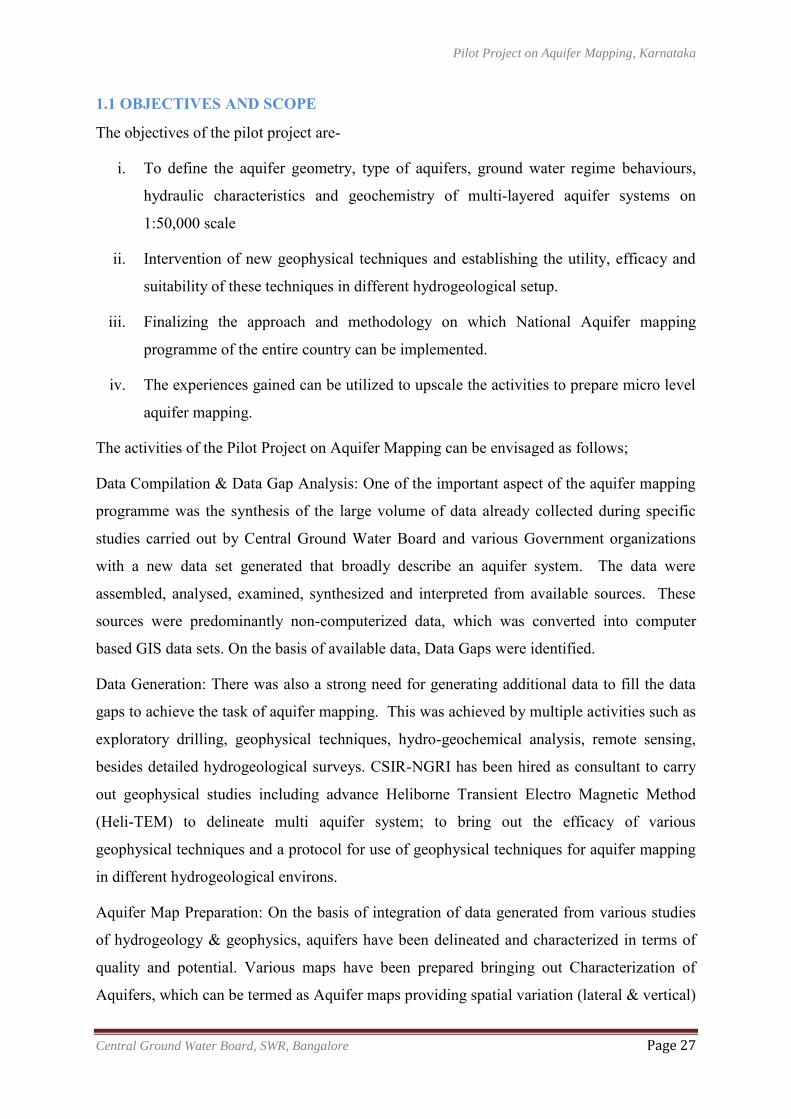
longitudes 76 23' 45" to 76 38' 40". The total area of the watershed is 375 sq.km and covers
138 villages. Out of 138 villages, 108 villages (51 in Tiptur and 57 in C.N.Halli taluks) are
fully covered and 30 villages (17 in Tiptur and 13 in C.N.Halli taluks) are partially covered in
the study area. The partially covered villages (with geographical area less than 50% falling in
watershed) are not are not considered for assessment. The location map is shown in
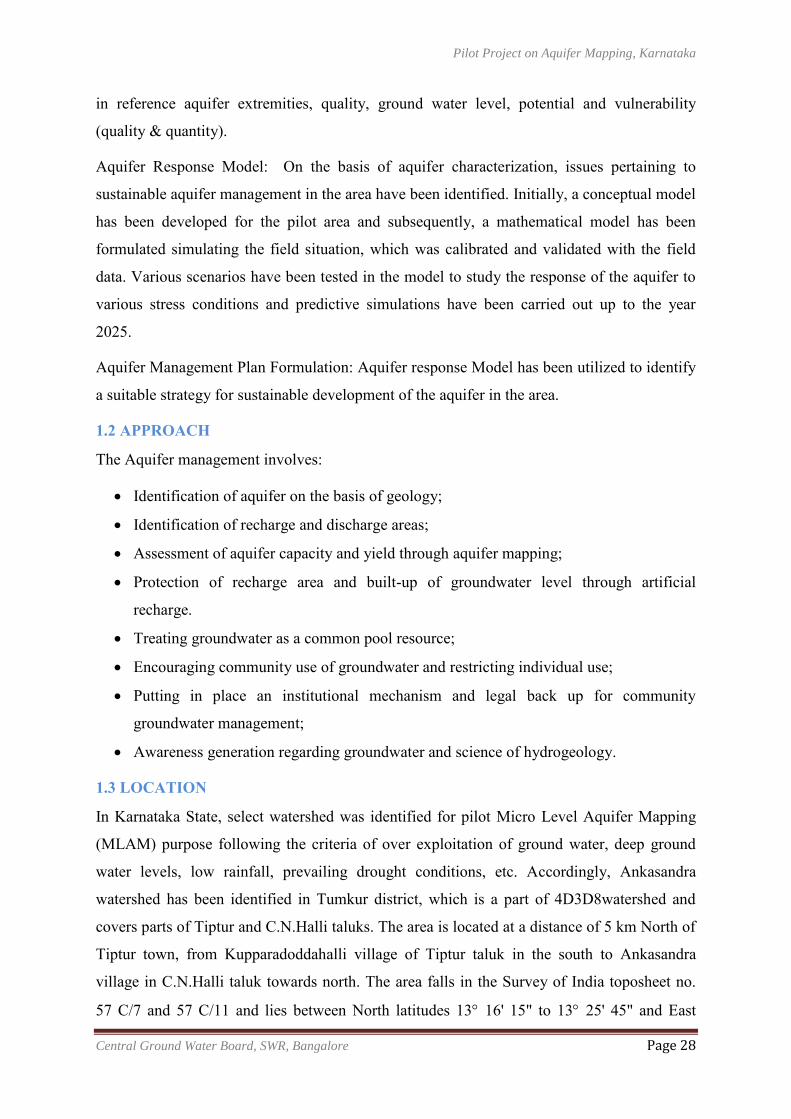
Fig.1.1.The taluk wise list of villages is given in Annexure 1.1 and 1.2. The satellite image
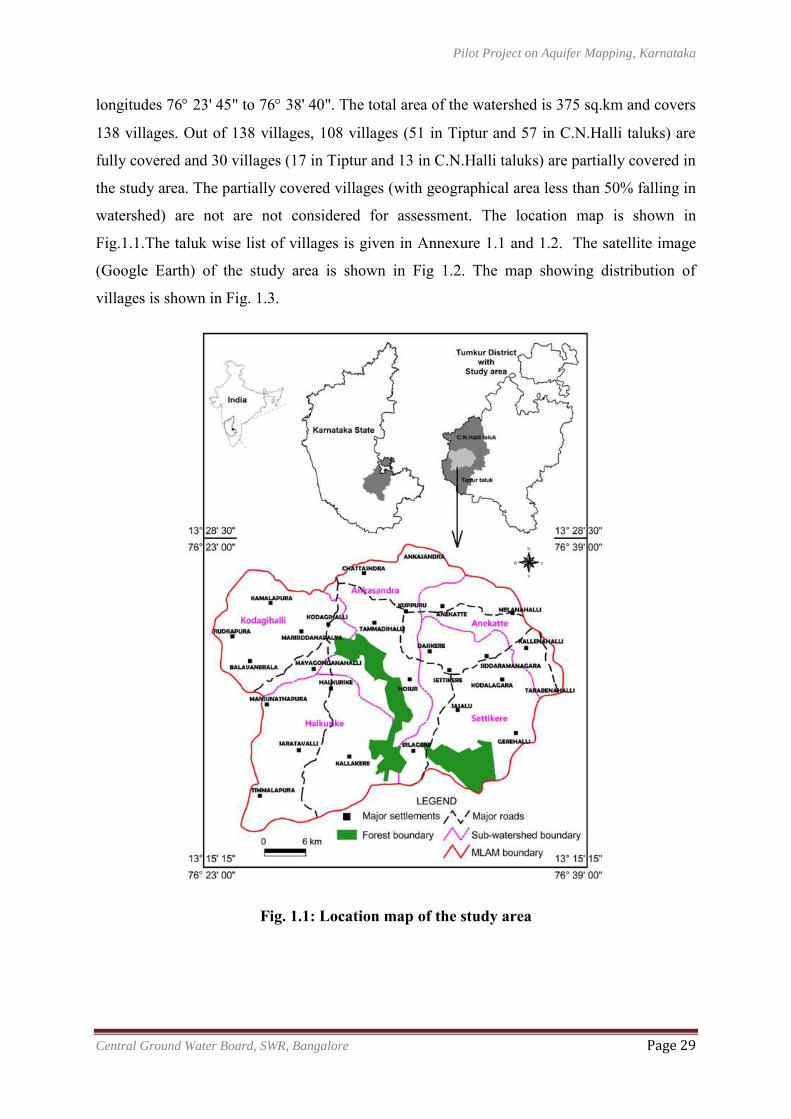
(Google Earth) of the study area is shown in Fig 1.2. The map showing distribution of
villages is shown in Fig. 1.3.
Fig. 1.1: Location map of the study area
Pilot Project on Aquifer Mapping, Karnataka
Central Ground Water Board, SWR, Bangalore Page 30
Fig. 1.2: Satellite image (Google Earth) of the study area
Fig. 1.3: Taluk wise distribution of villages in the study area
Pilot Project on Aquifer Mapping, Karnataka
Central Ground Water Board, SWR, Bangalore Page 31
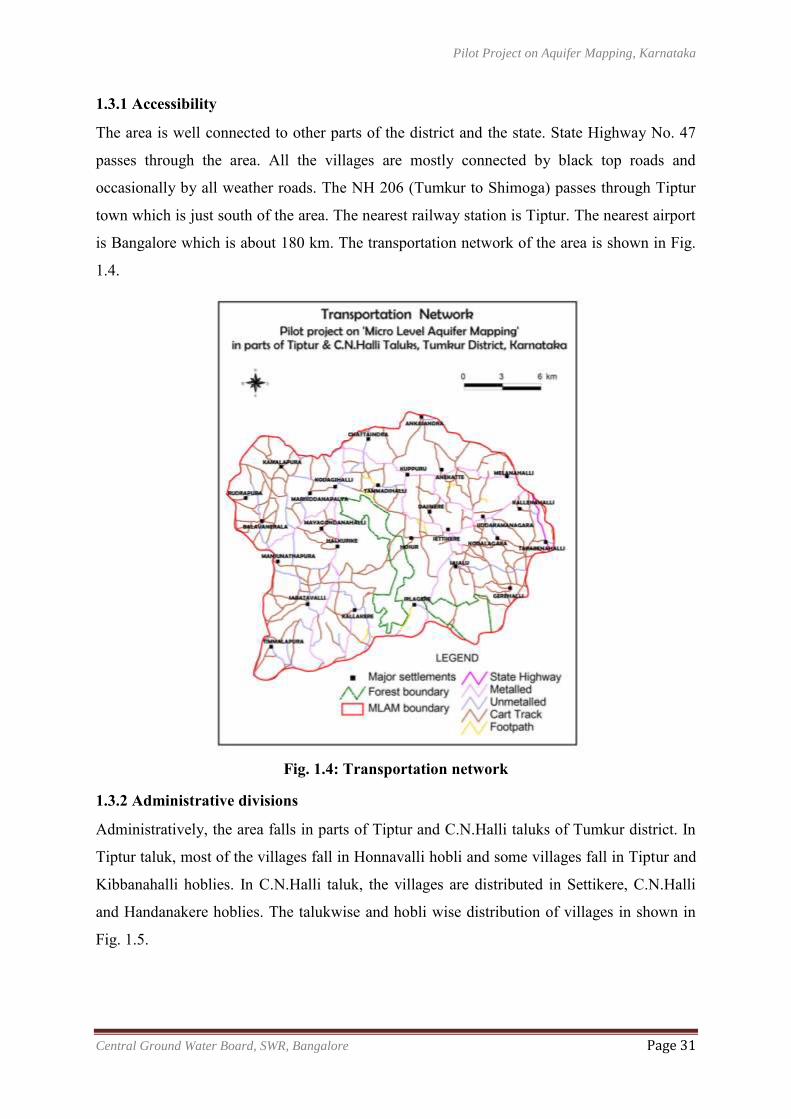
1.3.1 Accessibility
The area is well connected to other parts of the district and the state. State Highway No. 47
passes through the area. All the villages are mostly connected by black top roads and
occasionally by all weather roads. The NH 206 (Tumkur to Shimoga) passes through Tiptur
town which is just south of the area. The nearest railway station is Tiptur. The nearest airport
is Bangalore which is about 180 km. The transportation network of the area is shown in Fig.
1.4.
Fig. 1.4: Transportation network
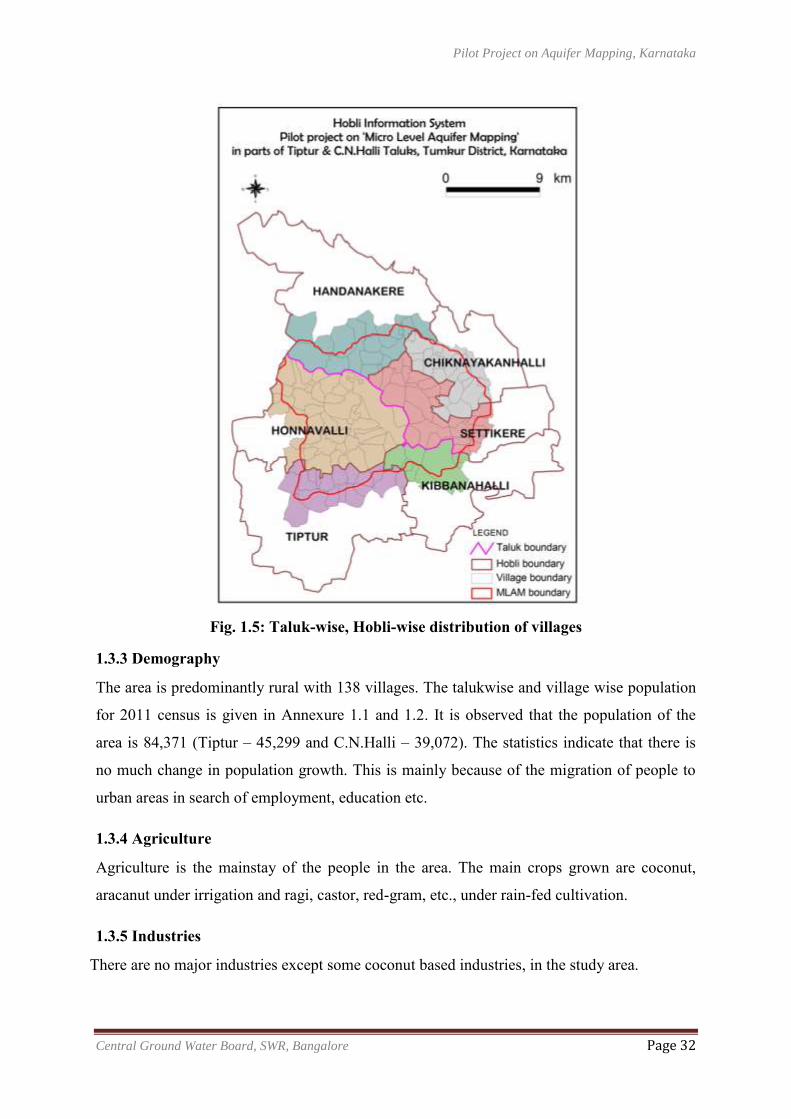
1.3.2 Administrative divisions
Administratively, the area falls in parts of Tiptur and C.N.Halli taluks of Tumkur district. In
Tiptur taluk, most of the villages fall in Honnavalli hobli and some villages fall in Tiptur and
Kibbanahalli hoblies. In C.N.Halli taluk, the villages are distributed in Settikere, C.N.Halli
and Handanakere hoblies. The talukwise and hobli wise distribution of villages in shown in
Fig. 1.5.
Pilot Project on Aquifer Mapping, Karnataka
Central Ground Water Board, SWR, Bangalore Page 32
Fig. 1.5: Taluk-wise, Hobli-wise distribution of villages
1.3.3 Demography
The area is predominantly rural with 138 villages. The talukwise and village wise population
for 2011 census is given in Annexure 1.1 and 1.2. It is observed that the population of the
area is 84,371 (Tiptur – 45,299 and C.N.Halli – 39,072). The statistics indicate that there is
no much change in population growth. This is mainly because of the migration of people to
urban areas in search of employment, education etc.
1.3.4 Agriculture
Agriculture is the mainstay of the people in the area. The main crops grown are coconut,
aracanut under irrigation and ragi, castor, red-gram, etc., under rain-fed cultivation.
1.3.5 Industries
There are no major industries except some coconut based industries, in the study area.
Pilot Project on Aquifer Mapping, Karnataka
Central Ground Water Board, SWR, Bangalore Page 33
1.3.6 Mining activities
There is no mining activity in the area; however, Granite quarrying is seen around Bandegate
village
1.3.7 Urban area
The study area is predominantly rural and is devoid of urban area.
1.3.8 Previous studies
Ground water studies have been carried out in the area by CGWB as a part of Vedavathi River
Basin Project (VRBP) during 1977-78. Four exploratory borewells were drilled during this
project. The reappraisal Hydrogeological surveys were carried out by Sri K.Kumaresan, Asst.
Hydrogeologist in Tiptur taluk during 1995-96. Sri L.J.Balachandra, Scientist-B carried out
Ground water management studies in Tumkur, Gubbi and Tiptur taluks of Tumkur district
during AAP 2003-04. During AAP 2004-05, three exploration wells were drilled down to 200
m to combat the drought conditions. CGWB is continuously monitoring ground water
observation wells and piezometers established in the area apart from ground water quality
monitoring once in a year.
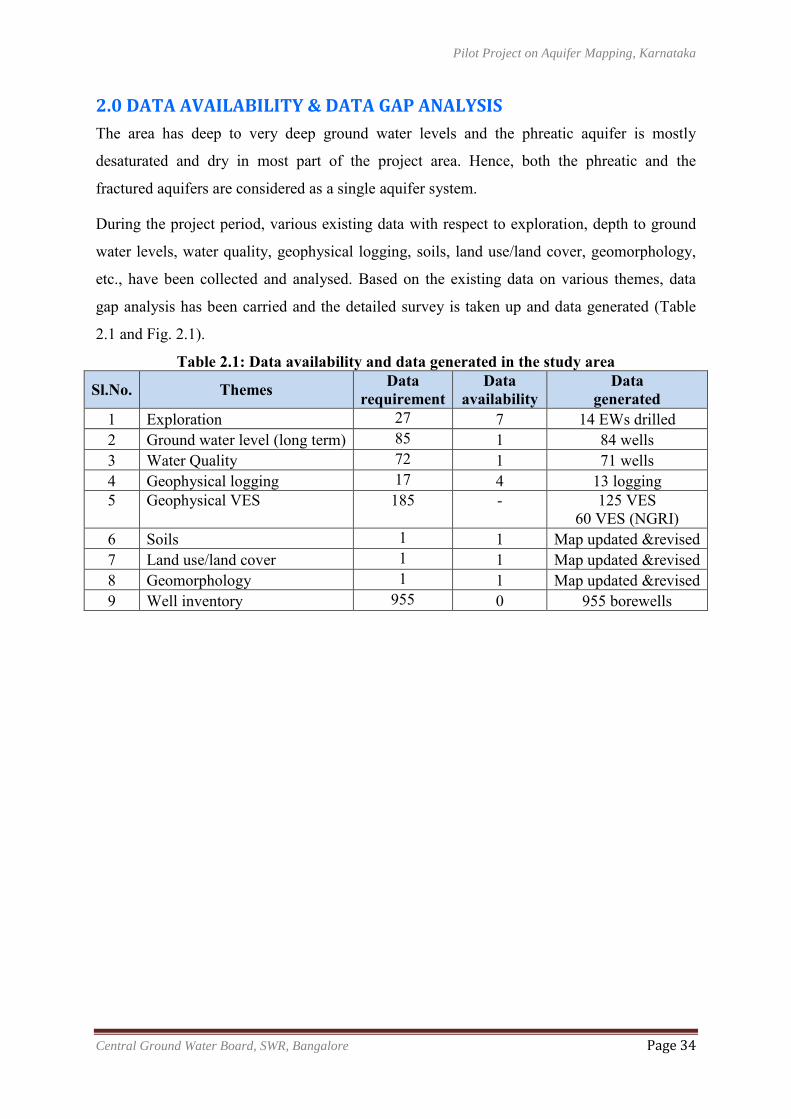
Pilot Project on Aquifer Mapping, Karnataka
Central Ground Water Board, SWR, Bangalore Page 34
2.0 DATA AVAILABILITY & DATA GAP ANALYSIS
The area has deep to very deep ground water levels and the phreatic aquifer is mostly
desaturated and dry in most part of the project area. Hence, both the phreatic and the
fractured aquifers are considered as a single aquifer system.
During the project period, various existing data with respect to exploration, depth to ground
water levels, water quality, geophysical logging, soils, land use/land cover, geomorphology,
etc., have been collected and analysed. Based on the existing data on various themes, data
gap analysis has been carried and the detailed survey is taken up and data generated (Table
2.1 and Fig. 2.1).
Table 2.1: Data availability and data generated in the study area
Sl.No. Themes Data requirement
Data availability
Data generated
1 Exploration 27 7 14 EWs drilled 2 Ground water level (long term) 85 1 84 wells 3 Water Quality 72 1 71 wells 4 Geophysical logging 17 4 13 logging 5 Geophysical VES 185 - 125 VES
60 VES (NGRI) 6 Soils 1 1 Map updated &revised 7 Land use/land cover 1 1 Map updated &revised 8 Geomorphology 1 1 Map updated &revised 9 Well inventory 955 0 955 borewells
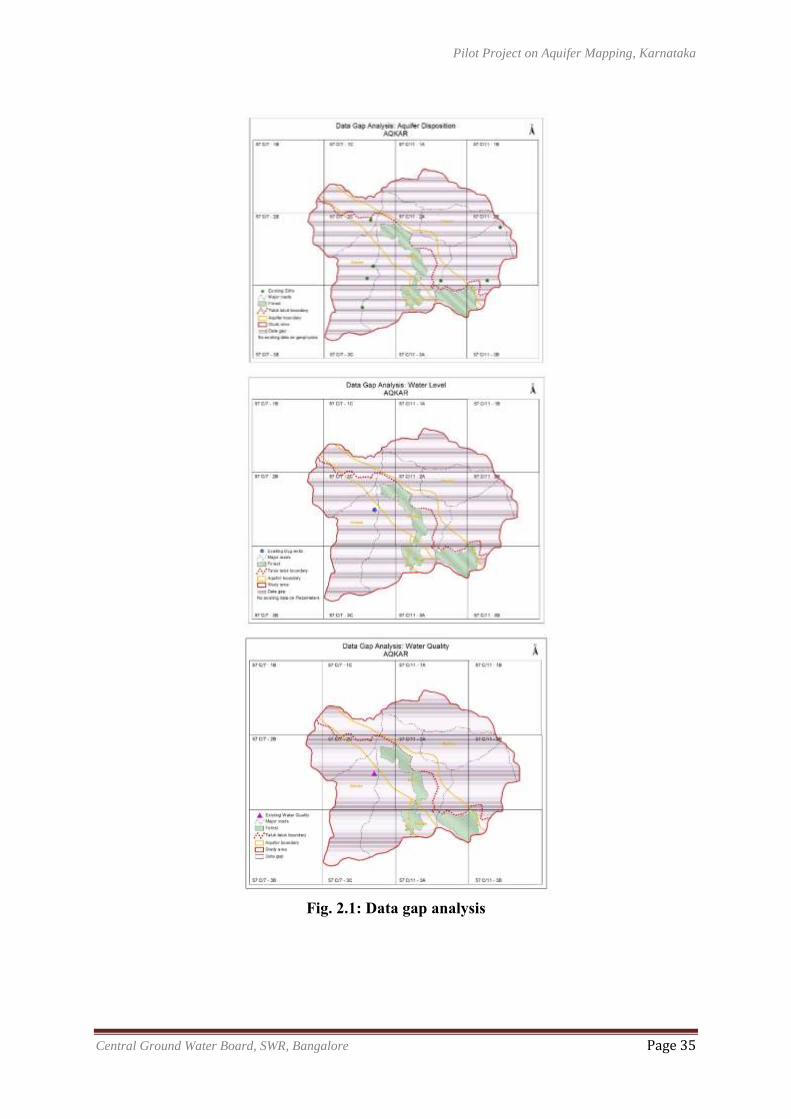
Pilot Project on Aquifer Mapping, Karnataka
Central Ground Water Board, SWR, Bangalore Page 35
Fig. 2.1: Data gap analysis
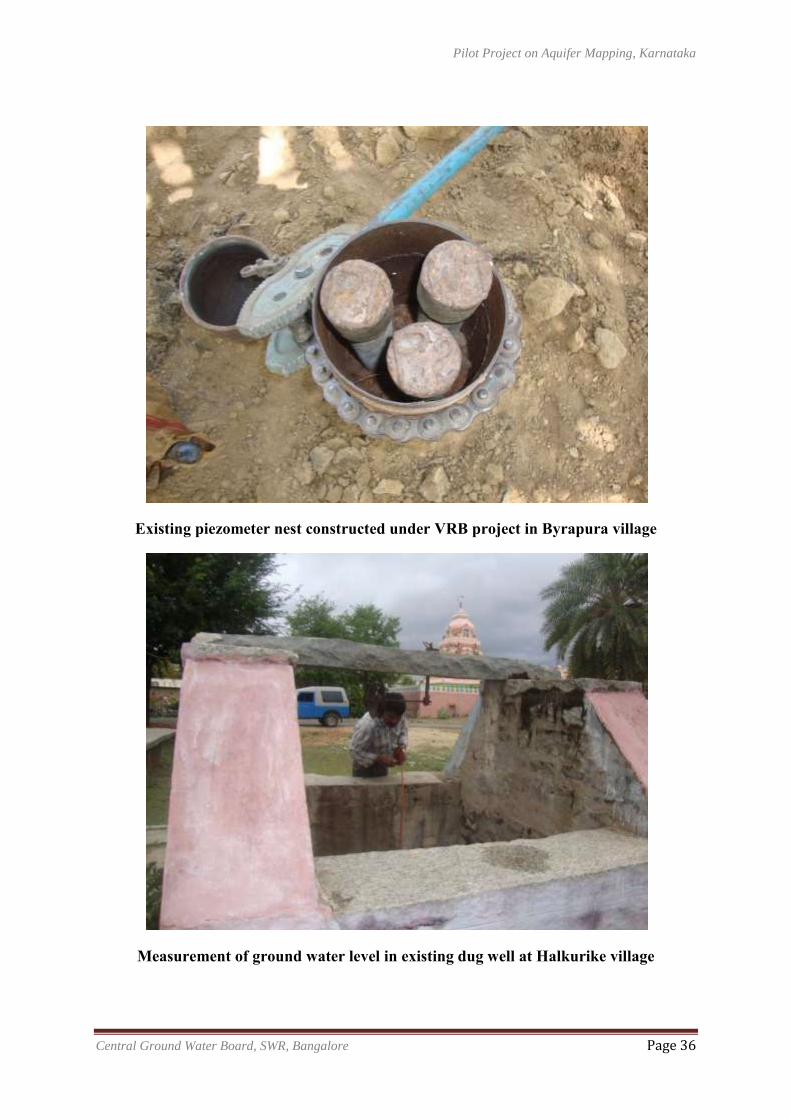
Pilot Project on Aquifer Mapping, Karnataka
Central Ground Water Board, SWR, Bangalore Page 36
Existing piezometer nest constructed under VRB project in Byrapura village
Measurement of ground water level in existing dug well at Halkurike village
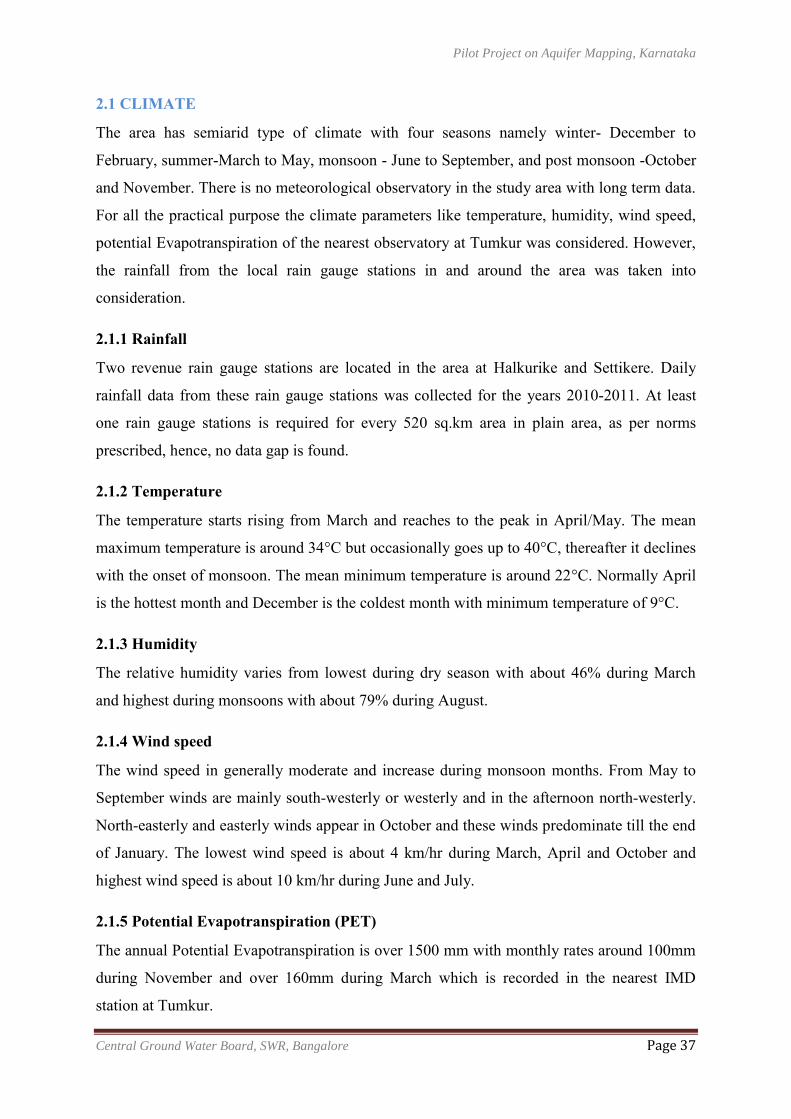
Pilot Project on Aquifer Mapping, Karnataka
Central Ground Water Board, SWR, Bangalore Page 37
2.1 CLIMATE
The area has semiarid type of climate with four seasons namely winter- December to
February, summer-March to May, monsoon - June to September, and post monsoon -October
and November. There is no meteorological observatory in the study area with long term data.
For all the practical purpose the climate parameters like temperature, humidity, wind speed,
potential Evapotranspiration of the nearest observatory at Tumkur was considered. However,
the rainfall from the local rain gauge stations in and around the area was taken into
consideration.
2.1.1 Rainfall
Two revenue rain gauge stations are located in the area at Halkurike and Settikere. Daily
rainfall data from these rain gauge stations was collected for the years 2010-2011. At least
one rain gauge stations is required for every 520 sq.km area in plain area, as per norms
prescribed, hence, no data gap is found.
2.1.2 Temperature
The temperature starts rising from March and reaches to the peak in April/May. The mean
maximum temperature is around 34°C but occasionally goes up to 40°C, thereafter it declines
with the onset of monsoon. The mean minimum temperature is around 22°C. Normally April
is the hottest month and December is the coldest month with minimum temperature of 9°C.
2.1.3 Humidity
The relative humidity varies from lowest during dry season with about 46% during March
and highest during monsoons with about 79% during August.
2.1.4 Wind speed
The wind speed in generally moderate and increase during monsoon months. From May to
September winds are mainly south-westerly or westerly and in the afternoon north-westerly.
North-easterly and easterly winds appear in October and these winds predominate till the end
of January. The lowest wind speed is about 4 km/hr during March, April and October and
highest wind speed is about 10 km/hr during June and July.
2.1.5 Potential Evapotranspiration (PET)
The annual Potential Evapotranspiration is over 1500 mm with monthly rates around 100mm
during November and over 160mm during March which is recorded in the nearest IMD
station at Tumkur.
Pilot Project on Aquifer Mapping, Karnataka
Central Ground Water Board, SWR, Bangalore Page 38
2.2 SOIL
The study area is mainly covered with both rock out crops and very good fertile soil. Based
on the remote sensing data and field checks, the soil map was prepared. It indicates that
clayey skeletal, clayey mixed, sandy clayey soil and gravely clayey soil are distributed in the
study area.
2.3 LAND USE
As per the statistics of 2010-11, forest covers about 4.65% of the total geographical area.
Land not available for cultivation (non-agricultural land and barren land) and other
uncultivable land (cultivable waste, permanent pastures, trees and groves) cover about
11.78% and 20.53% respectively. The fallow land (current and other fallow lands) covers
3.11% of the total area. The net area sown is 59.90%. The area sown more than once is
12.53%.
2.4 GEOMORPHOLOGY
The study covers an area of375 sq.kms and falls in watershed 4D3D8.The southern boundary
of the watershed forms the surface water divide between Cauvery and Krishna basins. It has
an undulating terrain forming gentle to moderate slope towards north. The highest elevation
of 941 m above MSL (m amsl) is in the southern part of the watershed located just south of
Adinayakanahalli state forest. The lowest elevation of 720 m amsl is noticed at Ankasandra
village in the northern part of the watershed.
2.5 GEOLOGY
2.5.1 Stratigraphy
The area is occupied by mainly rock types belonging to Archaean age. Major part of the area
is underlain by the Migmatite Gneiss of peninsular Gneissic complex (PGC) with enclaves of
high grade Meta ultramafic rocks which are older than PGC, belonging to Sargur Group.
These rocks are overlain by Dharwar Super Group rocks (Bababudan Group) mostly
consisting of Schists trending NW-SE direction cutting across the entire area. A small area is
occupied by the grey Granite intrusive in the SE part. The SW part and eastern part is criss-
crossed by basic dykes (Dolerite.).The Stratigraphy of the area is presented in Table 2.2.
Majority of the project is occupied by Gneisses which cover about 270 sq.km (72%) of the
total area followed by Schists which occupy94 sq.km (25%). A small area of 11 sq.km is
occupied by Granites covering only 3% of total project area.
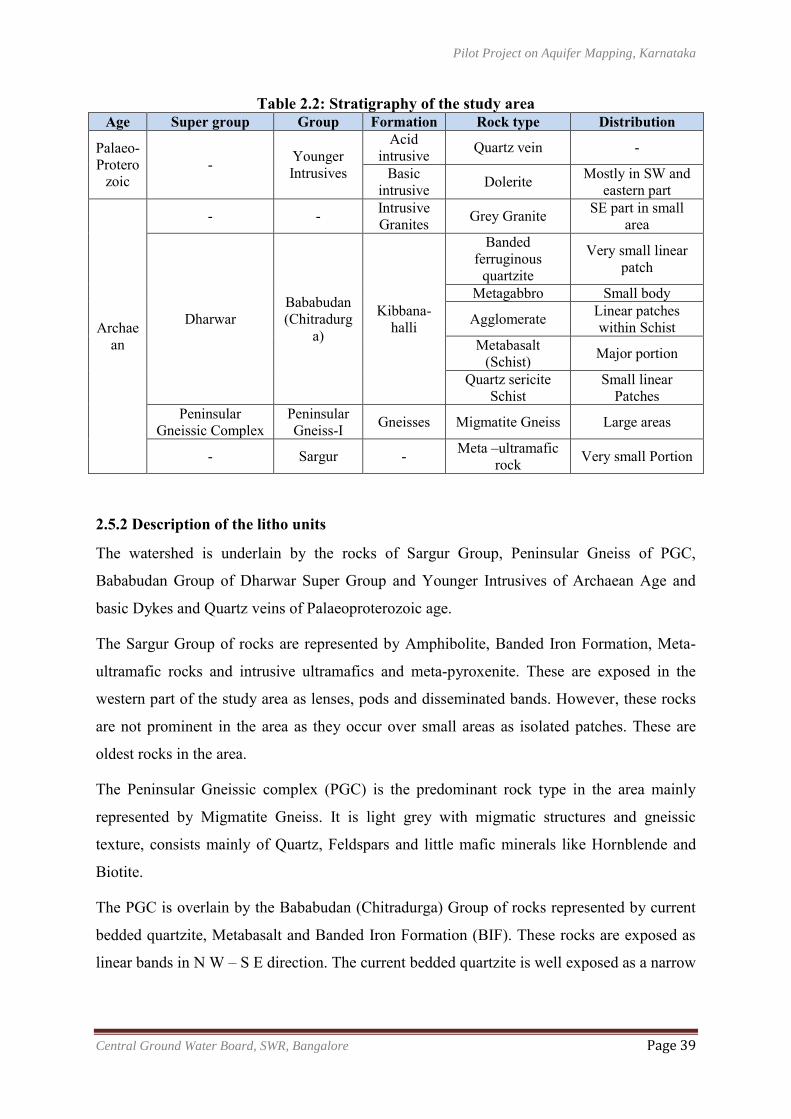
Pilot Project on Aquifer Mapping, Karnataka
Central Ground Water Board, SWR, Bangalore Page 39
Table 2.2: Stratigraphy of the study area Age Super group Group Formation Rock type Distribution
Palaeo- Protero
zoic - Younger
Intrusives
Acid intrusive Quartz vein -
Basic intrusive Dolerite Mostly in SW and
eastern part
Archaean
- - Intrusive Granites Grey Granite SE part in small
area
Dharwar Bababudan (Chitradurg
a)
Kibbana- halli
Banded ferruginous
quartzite
Very small linear patch
Metagabbro Small body
Agglomerate Linear patches within Schist
Metabasalt (Schist) Major portion
Quartz sericite Schist
Small linear Patches
Peninsular Gneissic Complex
Peninsular Gneiss-I Gneisses Migmatite Gneiss Large areas
- Sargur - Meta –ultramafic rock Very small Portion
2.5.2 Description of the litho units
The watershed is underlain by the rocks of Sargur Group, Peninsular Gneiss of PGC,
Bababudan Group of Dharwar Super Group and Younger Intrusives of Archaean Age and
basic Dykes and Quartz veins of Palaeoproterozoic age.
The Sargur Group of rocks are represented by Amphibolite, Banded Iron Formation, Meta-
ultramafic rocks and intrusive ultramafics and meta-pyroxenite. These are exposed in the
western part of the study area as lenses, pods and disseminated bands. However, these rocks
are not prominent in the area as they occur over small areas as isolated patches. These are
oldest rocks in the area.
The Peninsular Gneissic complex (PGC) is the predominant rock type in the area mainly
represented by Migmatite Gneiss. It is light grey with migmatic structures and gneissic
texture, consists mainly of Quartz, Feldspars and little mafic minerals like Hornblende and
Biotite.
The PGC is overlain by the Bababudan (Chitradurga) Group of rocks represented by current
bedded quartzite, Metabasalt and Banded Iron Formation (BIF). These rocks are exposed as
linear bands in N W – S E direction. The current bedded quartzite is well exposed as a narrow
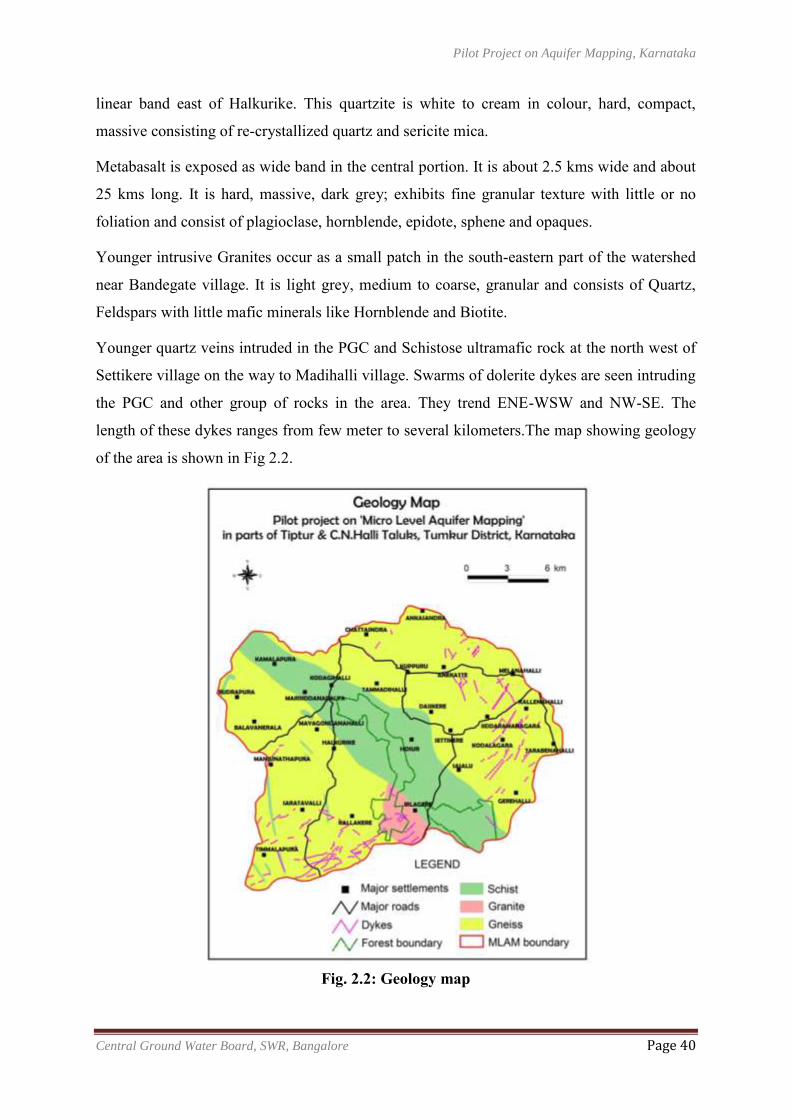
Pilot Project on Aquifer Mapping, Karnataka
Central Ground Water Board, SWR, Bangalore Page 40
linear band east of Halkurike. This quartzite is white to cream in colour, hard, compact,
massive consisting of re-crystallized quartz and sericite mica.
Metabasalt is exposed as wide band in the central portion. It is about 2.5 kms wide and about
25 kms long. It is hard, massive, dark grey; exhibits fine granular texture with little or no
foliation and consist of plagioclase, hornblende, epidote, sphene and opaques.
Younger intrusive Granites occur as a small patch in the south-eastern part of the watershed
near Bandegate village. It is light grey, medium to coarse, granular and consists of Quartz,
Feldspars with little mafic minerals like Hornblende and Biotite.
Younger quartz veins intruded in the PGC and Schistose ultramafic rock at the north west of
Settikere village on the way to Madihalli village. Swarms of dolerite dykes are seen intruding
the PGC and other group of rocks in the area. They trend ENE-WSW and NW-SE. The
length of these dykes ranges from few meter to several kilometers.The map showing geology
of the area is shown in Fig 2.2.
Fig. 2.2: Geology map
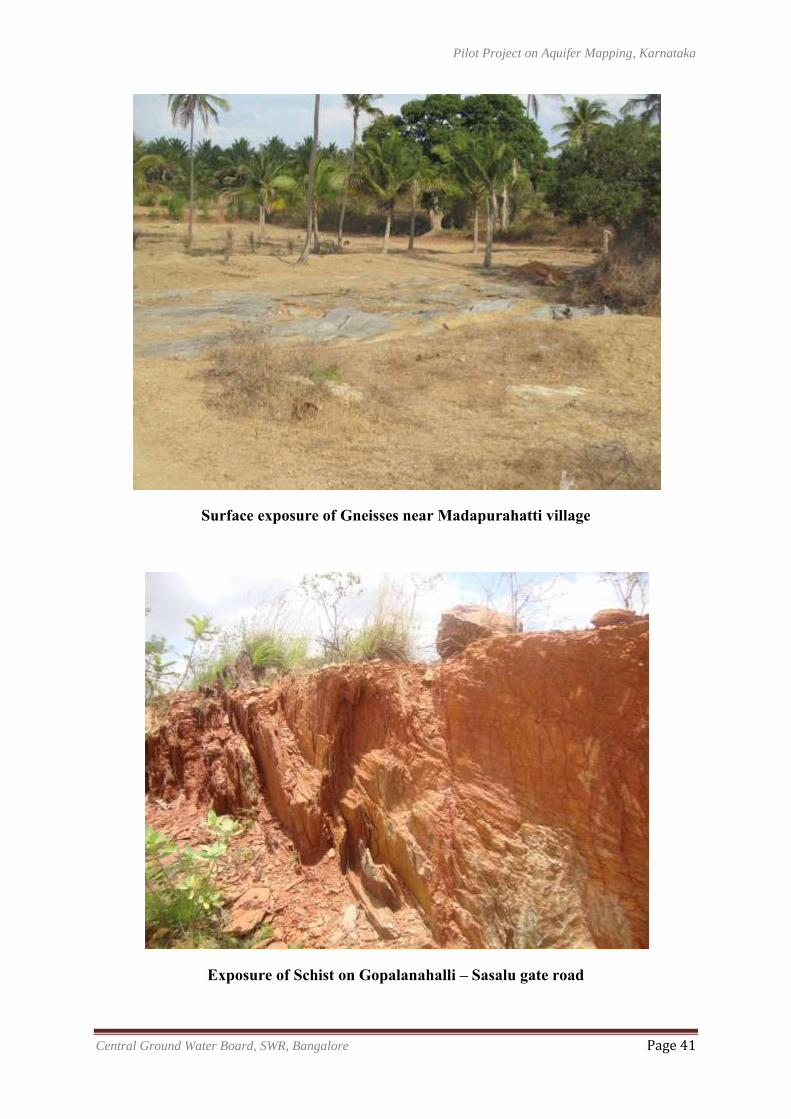
Pilot Project on Aquifer Mapping, Karnataka
Central Ground Water Board, SWR, Bangalore Page 41
Surface exposure of Gneisses near Madapurahatti village
Exposure of Schist on Gopalanahalli – Sasalu gate road
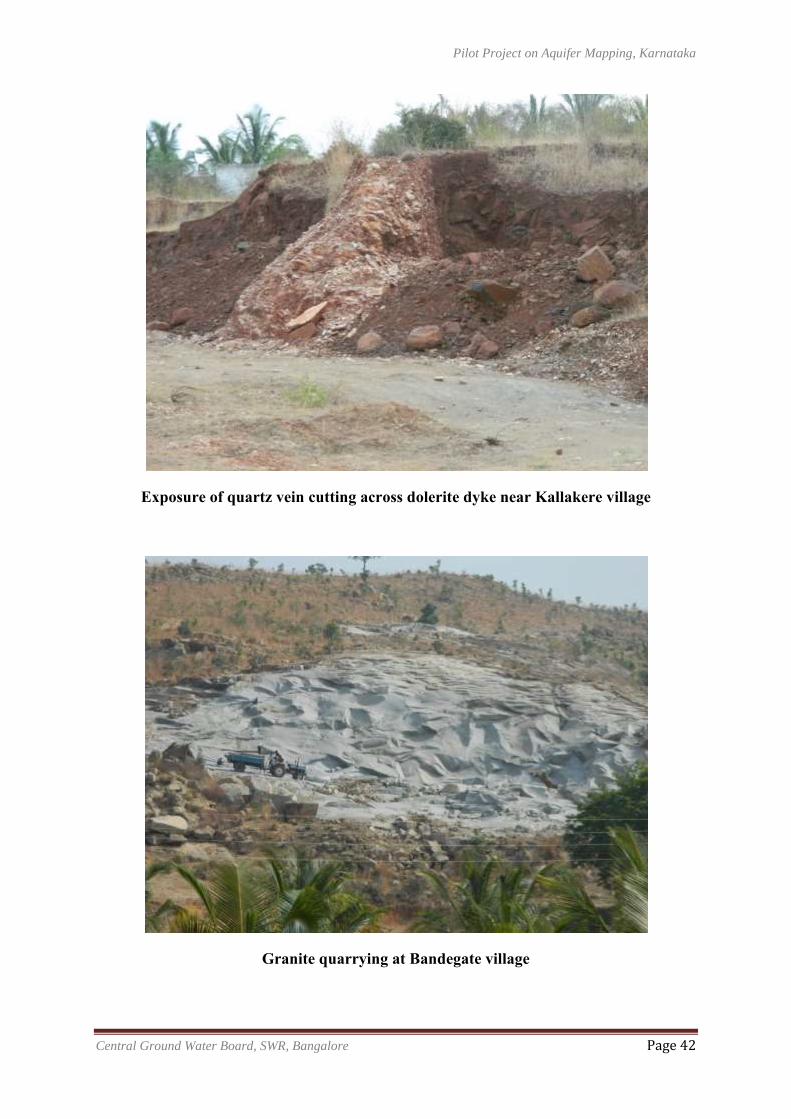
Pilot Project on Aquifer Mapping, Karnataka
Central Ground Water Board, SWR, Bangalore Page 42
Exposure of quartz vein cutting across dolerite dyke near Kallakere village
Granite quarrying at Bandegate village
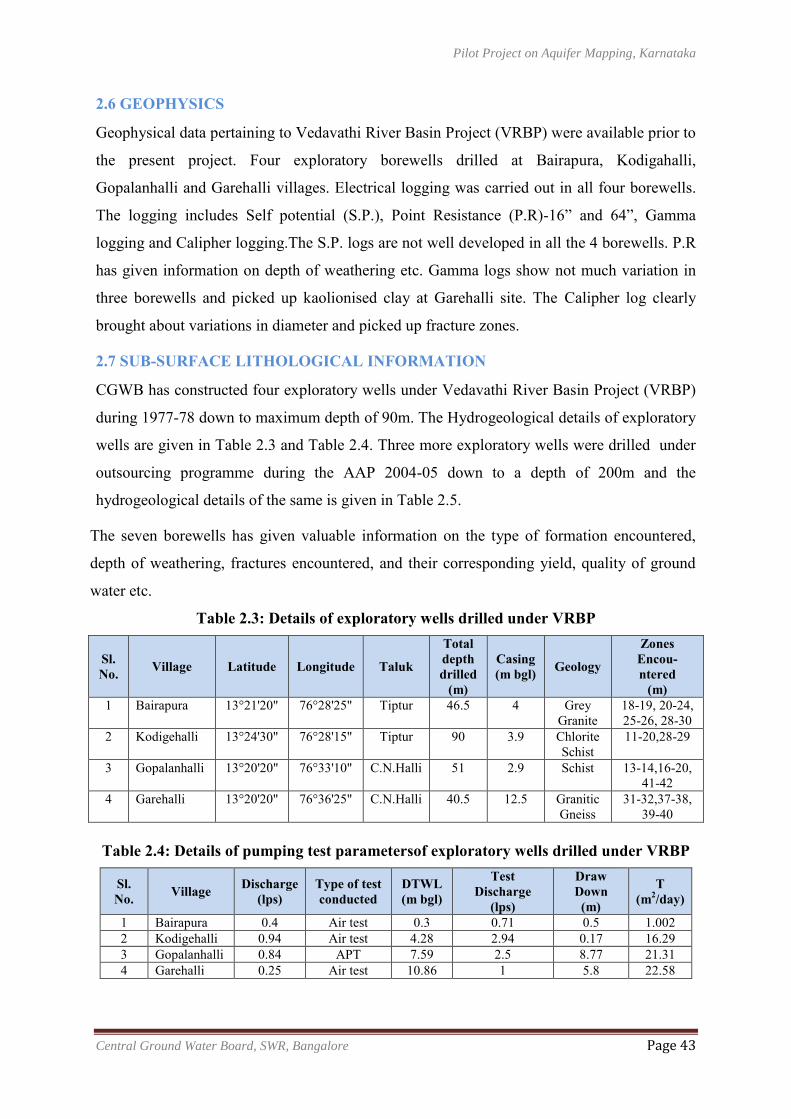
Pilot Project on Aquifer Mapping, Karnataka
Central Ground Water Board, SWR, Bangalore Page 43
2.6 GEOPHYSICS
Geophysical data pertaining to Vedavathi River Basin Project (VRBP) were available prior to
the present project. Four exploratory borewells drilled at Bairapura, Kodigahalli,
Gopalanhalli and Garehalli villages. Electrical logging was carried out in all four borewells.
The logging includes Self potential (S.P.), Point Resistance (P.R)-16” and 64”, Gamma
logging and Calipher logging.The S.P. logs are not well developed in all the 4 borewells. P.R
has given information on depth of weathering etc. Gamma logs show not much variation in
three borewells and picked up kaolionised clay at Garehalli site. The Calipher log clearly
brought about variations in diameter and picked up fracture zones.
2.7 SUB-SURFACE LITHOLOGICAL INFORMATION
CGWB has constructed four exploratory wells under Vedavathi River Basin Project (VRBP)
during 1977-78 down to maximum depth of 90m. The Hydrogeological details of exploratory
wells are given in Table 2.3 and Table 2.4. Three more exploratory wells were drilled under
outsourcing programme during the AAP 2004-05 down to a depth of 200m and the
hydrogeological details of the same is given in Table 2.5.
The seven borewells has given valuable information on the type of formation encountered,
depth of weathering, fractures encountered, and their corresponding yield, quality of ground
water etc.
Table 2.3: Details of exploratory wells drilled under VRBP
Sl. No. Village Latitude Longitude Taluk
Total depth drilled
(m)
Casing (m bgl) Geology
Zones Encou- ntered
(m) 1 Bairapura 13°21'20" 76°28'25" Tiptur 46.5 4 Grey
Granite 18-19, 20-24, 25-26, 28-30
2 Kodigehalli 13°24'30" 76°28'15" Tiptur 90 3.9 Chlorite Schist
11-20,28-29
3 Gopalanhalli 13°20'20" 76°33'10" C.N.Halli 51 2.9 Schist 13-14,16-20, 41-42
4 Garehalli 13°20'20" 76°36'25" C.N.Halli 40.5 12.5 Granitic Gneiss
31-32,37-38, 39-40
Table 2.4: Details of pumping test parametersof exploratory wells drilled under VRBP
Sl. No. Village Discharge
(lps) Type of test conducted
DTWL (m bgl)
Test Discharge
(lps)
Draw Down (m)
T (m2/day)
1 Bairapura 0.4 Air test 0.3 0.71 0.5 1.002 2 Kodigehalli 0.94 Air test 4.28 2.94 0.17 16.29 3 Gopalanhalli 0.84 APT 7.59 2.5 8.77 21.31 4 Garehalli 0.25 Air test 10.86 1 5.8 22.58
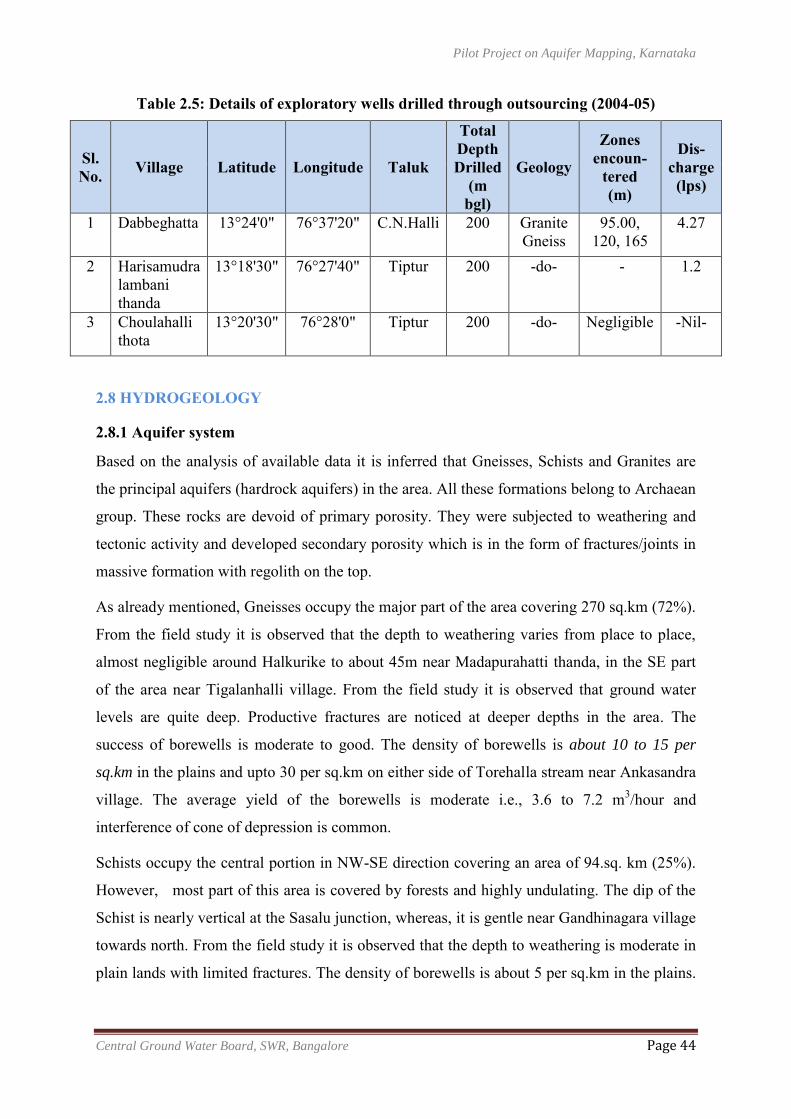
Pilot Project on Aquifer Mapping, Karnataka
Central Ground Water Board, SWR, Bangalore Page 44
Table 2.5: Details of exploratory wells drilled through outsourcing (2004-05)
Sl. No. Village Latitude Longitude Taluk
Total Depth Drilled
(m bgl)
Geology
Zones encoun-
tered (m)
Dis- charge (lps)
1 Dabbeghatta 13°24'0" 76°37'20" C.N.Halli 200 Granite Gneiss
95.00, 120, 165
4.27
2 Harisamudra lambani thanda
13°18'30" 76°27'40" Tiptur 200 -do- - 1.2
3 Choulahalli thota
13°20'30" 76°28'0" Tiptur 200 -do- Negligible -Nil-
2.8 HYDROGEOLOGY
2.8.1 Aquifer system
Based on the analysis of available data it is inferred that Gneisses, Schists and Granites are
the principal aquifers (hardrock aquifers) in the area. All these formations belong to Archaean
group. These rocks are devoid of primary porosity. They were subjected to weathering and
tectonic activity and developed secondary porosity which is in the form of fractures/joints in
massive formation with regolith on the top.
As already mentioned, Gneisses occupy the major part of the area covering 270 sq.km (72%).
From the field study it is observed that the depth to weathering varies from place to place,
almost negligible around Halkurike to about 45m near Madapurahatti thanda, in the SE part
of the area near Tigalanhalli village. From the field study it is observed that ground water
levels are quite deep. Productive fractures are noticed at deeper depths in the area. The
success of borewells is moderate to good. The density of borewells is about 10 to 15 per
sq.km in the plains and upto 30 per sq.km on either side of Torehalla stream near Ankasandra
village. The average yield of the borewells is moderate i.e., 3.6 to 7.2 m3/hour and
interference of cone of depression is common.
Schists occupy the central portion in NW-SE direction covering an area of 94.sq. km (25%).
However, most part of this area is covered by forests and highly undulating. The dip of the
Schist is nearly vertical at the Sasalu junction, whereas, it is gentle near Gandhinagara village
towards north. From the field study it is observed that the depth to weathering is moderate in
plain lands with limited fractures. The density of borewells is about 5 per sq.km in the plains.
Pilot Project on Aquifer Mapping, Karnataka
Central Ground Water Board, SWR, Bangalore Page 45
The average yield of the borewells is also limited to 3.6 m3/ hour showing very low yield of
the formation.
Granites occur in the SE part of the area covering 11 sq.km (3%) as a small patch only. The
area occupied by Granites is highly undulating with isolated hills, as seen near Bandegate
village. From the field study it is observed that the depth to weathering is very limited and
occurrence of fractures are also limited to shallow depths. The average yield of the borewells
is also limited to 5.4 m3/ hour.
Ground water is being extracted mostly through borewells in the area. Due to increase in
number of borewells over a period of time mostly for irrigation purpose, the depth to ground
water levels have gone deeper and deeper and found to be more than 100 m bgl at certain
locations (Huchanahatti village). Ground water occurs mostly in fractured system which is in
semi-confined to confined condition. However, ground water around Halkurike village occurs
in phreatic condition where the depth to ground water level is about five meters.
2.8.1.1 Phreatic aquifers Phreatic aquifers are developed due to weathering of the formations. All the three principal
formations viz., Gneisses, Schists and Granites are subjected to weathering with varying
thickness. The exploratory wells data and the borewells inventory indicate that the
weathering thickness ranges from a minimum of 5 m to a maximum of 42 m in Gneisses.
However, most frequent depth of weathering is between 10 and 20 m. Depth of weathering
between 20and 30m was observed in eastern and western part of the project area. More than
40 m depth of weathering is found in isolated patches in SE and NE parts of the area. Most of
the phreatic aquifers are desaturated, due to heavy extraction of ground water through
borewells for irrigation purpose. Ground water occurs in water-table condition in and around
Halkurike village.
In Schistose formation the depth to weathering is less when compared to Gneisses and
generally ranges from 5 to 15m. In Granite formation the depth of weathering is very limited
and at many places outcrops are seen.
2.8.1.2 Semi-confined to confined aquifers Ground water occurs in semi-confined to confined conditions in fractured formation at deeper
levels in all the three formations. It is common to observe that the ground water level comes
up from original level after cessation of drilling due to confined nature of the aquifer.
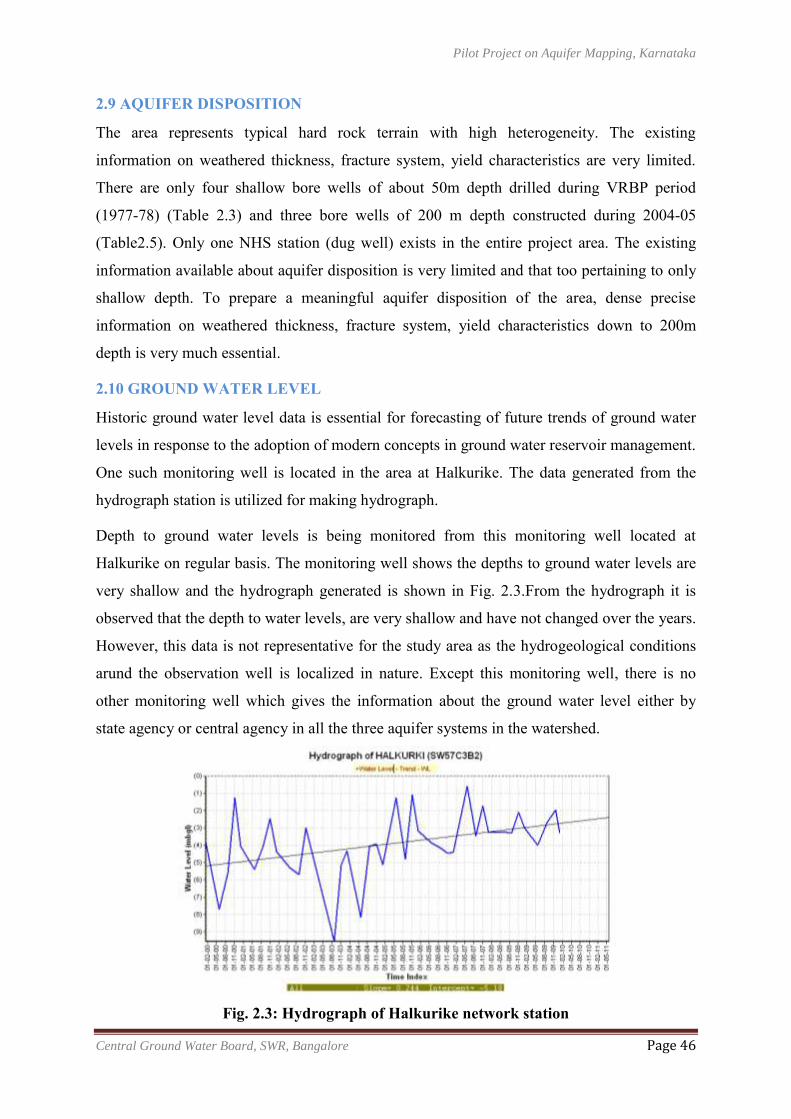
Pilot Project on Aquifer Mapping, Karnataka
Central Ground Water Board, SWR, Bangalore Page 46
2.9 AQUIFER DISPOSITION
The area represents typical hard rock terrain with high heterogeneity. The existing
information on weathered thickness, fracture system, yield characteristics are very limited.
There are only four shallow bore wells of about 50m depth drilled during VRBP period
(1977-78) (Table 2.3) and three bore wells of 200 m depth constructed during 2004-05
(Table2.5). Only one NHS station (dug well) exists in the entire project area. The existing
information available about aquifer disposition is very limited and that too pertaining to only
shallow depth. To prepare a meaningful aquifer disposition of the area, dense precise
information on weathered thickness, fracture system, yield characteristics down to 200m
depth is very much essential.
2.10 GROUND WATER LEVEL
Historic ground water level data is essential for forecasting of future trends of ground water
levels in response to the adoption of modern concepts in ground water reservoir management.
One such monitoring well is located in the area at Halkurike. The data generated from the
hydrograph station is utilized for making hydrograph.
Depth to ground water levels is being monitored from this monitoring well located at
Halkurike on regular basis. The monitoring well shows the depths to ground water levels are
very shallow and the hydrograph generated is shown in Fig. 2.3.From the hydrograph it is
observed that the depth to water levels, are very shallow and have not changed over the years.
However, this data is not representative for the study area as the hydrogeological conditions
arund the observation well is localized in nature. Except this monitoring well, there is no
other monitoring well which gives the information about the ground water level either by
state agency or central agency in all the three aquifer systems in the watershed.
Fig. 2.3: Hydrograph of Halkurike network station
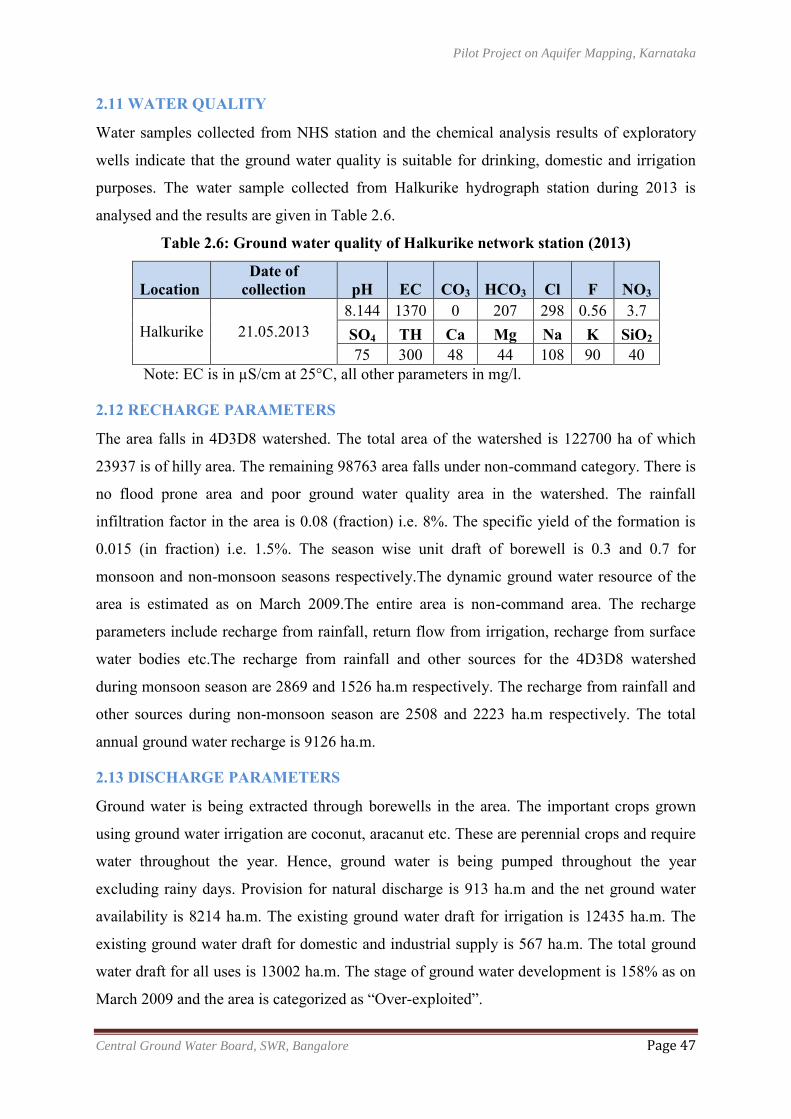
Pilot Project on Aquifer Mapping, Karnataka
Central Ground Water Board, SWR, Bangalore Page 47
2.11 WATER QUALITY
Water samples collected from NHS station and the chemical analysis results of exploratory
wells indicate that the ground water quality is suitable for drinking, domestic and irrigation
purposes. The water sample collected from Halkurike hydrograph station during 2013 is
analysed and the results are given in Table 2.6.
Table 2.6: Ground water quality of Halkurike network station (2013)
Location Date of
collection pH EC CO3 HCO3 Cl F NO3
Halkurike 21.05.2013 8.144 1370 0 207 298 0.56 3.7 SO4 TH Ca Mg Na K SiO2 75 300 48 44 108 90 40
Note: EC is in µS/cm at 25°C, all other parameters in mg/l.
2.12 RECHARGE PARAMETERS
The area falls in 4D3D8 watershed. The total area of the watershed is 122700 ha of which
23937 is of hilly area. The remaining 98763 area falls under non-command category. There is
no flood prone area and poor ground water quality area in the watershed. The rainfall
infiltration factor in the area is 0.08 (fraction) i.e. 8%. The specific yield of the formation is
0.015 (in fraction) i.e. 1.5%. The season wise unit draft of borewell is 0.3 and 0.7 for
monsoon and non-monsoon seasons respectively.The dynamic ground water resource of the
area is estimated as on March 2009.The entire area is non-command area. The recharge
parameters include recharge from rainfall, return flow from irrigation, recharge from surface
water bodies etc.The recharge from rainfall and other sources for the 4D3D8 watershed
during monsoon season are 2869 and 1526 ha.m respectively. The recharge from rainfall and
other sources during non-monsoon season are 2508 and 2223 ha.m respectively. The total
annual ground water recharge is 9126 ha.m.
2.13 DISCHARGE PARAMETERS
Ground water is being extracted through borewells in the area. The important crops grown
using ground water irrigation are coconut, aracanut etc. These are perennial crops and require
water throughout the year. Hence, ground water is being pumped throughout the year
excluding rainy days. Provision for natural discharge is 913 ha.m and the net ground water
availability is 8214 ha.m. The existing ground water draft for irrigation is 12435 ha.m. The
existing ground water draft for domestic and industrial supply is 567 ha.m. The total ground
water draft for all uses is 13002 ha.m. The stage of ground water development is 158% as on
March 2009 and the area is categorized as “Over-exploited”.
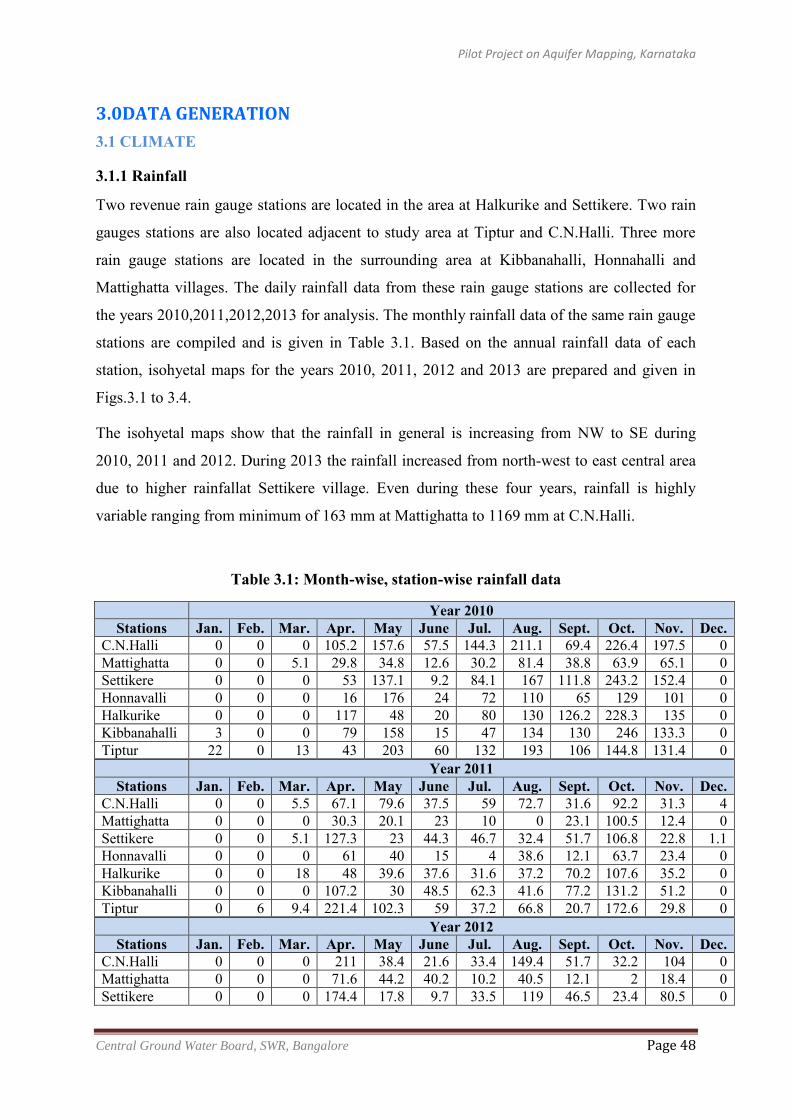
Pilot Project on Aquifer Mapping, Karnataka
Central Ground Water Board, SWR, Bangalore Page 48
3.0DATA GENERATION
3.1 CLIMATE
3.1.1 Rainfall
Two revenue rain gauge stations are located in the area at Halkurike and Settikere. Two rain
gauges stations are also located adjacent to study area at Tiptur and C.N.Halli. Three more
rain gauge stations are located in the surrounding area at Kibbanahalli, Honnahalli and
Mattighatta villages. The daily rainfall data from these rain gauge stations are collected for
the years 2010,2011,2012,2013 for analysis. The monthly rainfall data of the same rain gauge
stations are compiled and is given in Table 3.1. Based on the annual rainfall data of each
station, isohyetal maps for the years 2010, 2011, 2012 and 2013 are prepared and given in
Figs.3.1 to 3.4.
The isohyetal maps show that the rainfall in general is increasing from NW to SE during
2010, 2011 and 2012. During 2013 the rainfall increased from north-west to east central area
due to higher rainfallat Settikere village. Even during these four years, rainfall is highly
variable ranging from minimum of 163 mm at Mattighatta to 1169 mm at C.N.Halli.
Table 3.1: Month-wise, station-wise rainfall data
Year 2010
Stations Jan. Feb. Mar. Apr. May June Jul. Aug. Sept. Oct. Nov. Dec. C.N.Halli 0 0 0 105.2 157.6 57.5 144.3 211.1 69.4 226.4 197.5 0 Mattighatta 0 0 5.1 29.8 34.8 12.6 30.2 81.4 38.8 63.9 65.1 0 Settikere 0 0 0 53 137.1 9.2 84.1 167 111.8 243.2 152.4 0 Honnavalli 0 0 0 16 176 24 72 110 65 129 101 0 Halkurike 0 0 0 117 48 20 80 130 126.2 228.3 135 0 Kibbanahalli 3 0 0 79 158 15 47 134 130 246 133.3 0 Tiptur 22 0 13 43 203 60 132 193 106 144.8 131.4 0
Year 2011
Stations Jan. Feb. Mar. Apr. May June Jul. Aug. Sept. Oct. Nov. Dec. C.N.Halli 0 0 5.5 67.1 79.6 37.5 59 72.7 31.6 92.2 31.3 4 Mattighatta 0 0 0 30.3 20.1 23 10 0 23.1 100.5 12.4 0 Settikere 0 0 5.1 127.3 23 44.3 46.7 32.4 51.7 106.8 22.8 1.1 Honnavalli 0 0 0 61 40 15 4 38.6 12.1 63.7 23.4 0 Halkurike 0 0 18 48 39.6 37.6 31.6 37.2 70.2 107.6 35.2 0 Kibbanahalli 0 0 0 107.2 30 48.5 62.3 41.6 77.2 131.2 51.2 0 Tiptur 0 6 9.4 221.4 102.3 59 37.2 66.8 20.7 172.6 29.8 0
Year 2012
Stations Jan. Feb. Mar. Apr. May June Jul. Aug. Sept. Oct. Nov. Dec. C.N.Halli 0 0 0 211 38.4 21.6 33.4 149.4 51.7 32.2 104 0 Mattighatta 0 0 0 71.6 44.2 40.2 10.2 40.5 12.1 2 18.4 0 Settikere 0 0 0 174.4 17.8 9.7 33.5 119 46.5 23.4 80.5 0
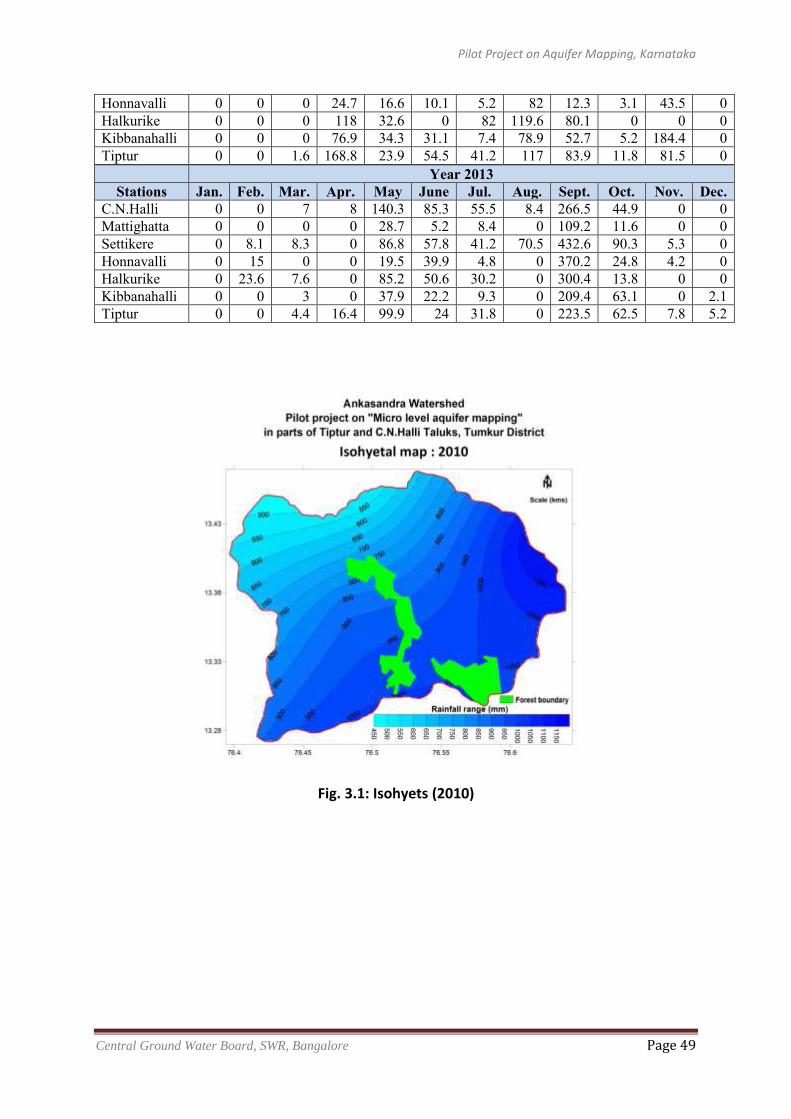
Pilot Project on Aquifer Mapping, Karnataka
Central Ground Water Board, SWR, Bangalore Page 49
Honnavalli 0 0 0 24.7 16.6 10.1 5.2 82 12.3 3.1 43.5 0 Halkurike 0 0 0 118 32.6 0 82 119.6 80.1 0 0 0 Kibbanahalli 0 0 0 76.9 34.3 31.1 7.4 78.9 52.7 5.2 184.4 0 Tiptur 0 0 1.6 168.8 23.9 54.5 41.2 117 83.9 11.8 81.5 0
Year 2013
Stations Jan. Feb. Mar. Apr. May June Jul. Aug. Sept. Oct. Nov. Dec. C.N.Halli 0 0 7 8 140.3 85.3 55.5 8.4 266.5 44.9 0 0 Mattighatta 0 0 0 0 28.7 5.2 8.4 0 109.2 11.6 0 0 Settikere 0 8.1 8.3 0 86.8 57.8 41.2 70.5 432.6 90.3 5.3 0 Honnavalli 0 15 0 0 19.5 39.9 4.8 0 370.2 24.8 4.2 0 Halkurike 0 23.6 7.6 0 85.2 50.6 30.2 0 300.4 13.8 0 0 Kibbanahalli 0 0 3 0 37.9 22.2 9.3 0 209.4 63.1 0 2.1 Tiptur 0 0 4.4 16.4 99.9 24 31.8 0 223.5 62.5 7.8 5.2
Fig. 3.1: Isohyets (2010)
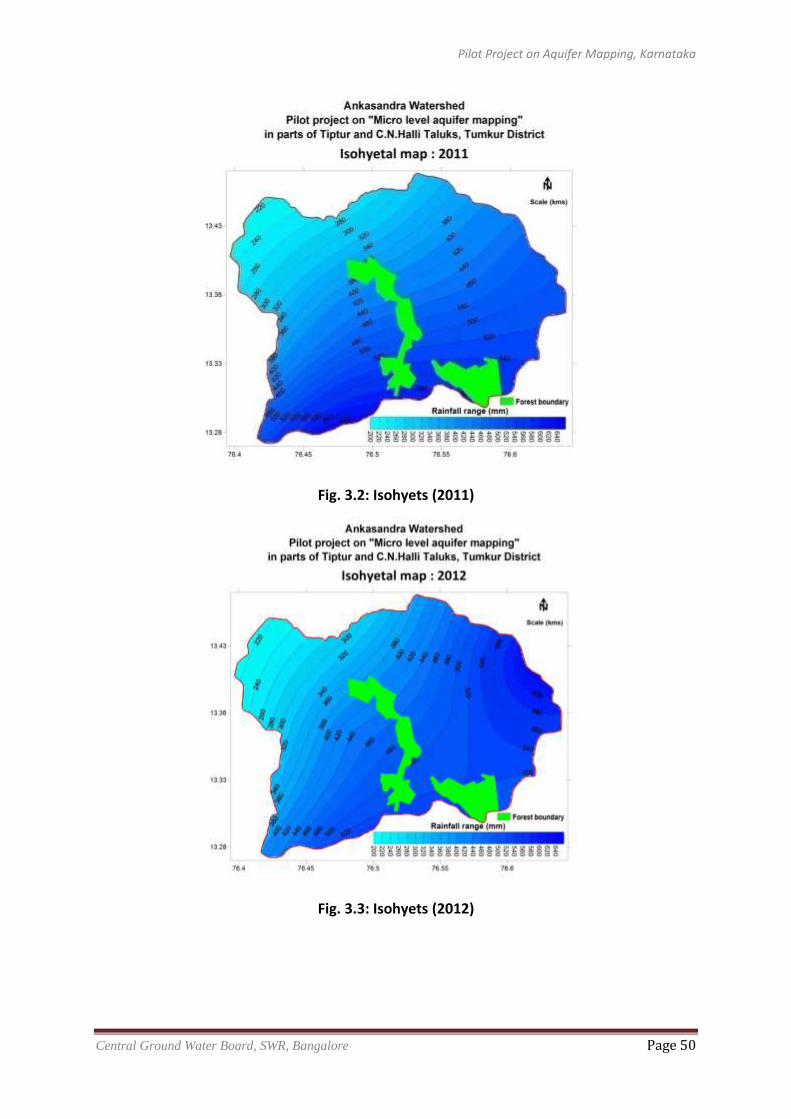
Pilot Project on Aquifer Mapping, Karnataka
Central Ground Water Board, SWR, Bangalore Page 50
Fig. 3.2: Isohyets (2011)
Fig. 3.3: Isohyets (2012)
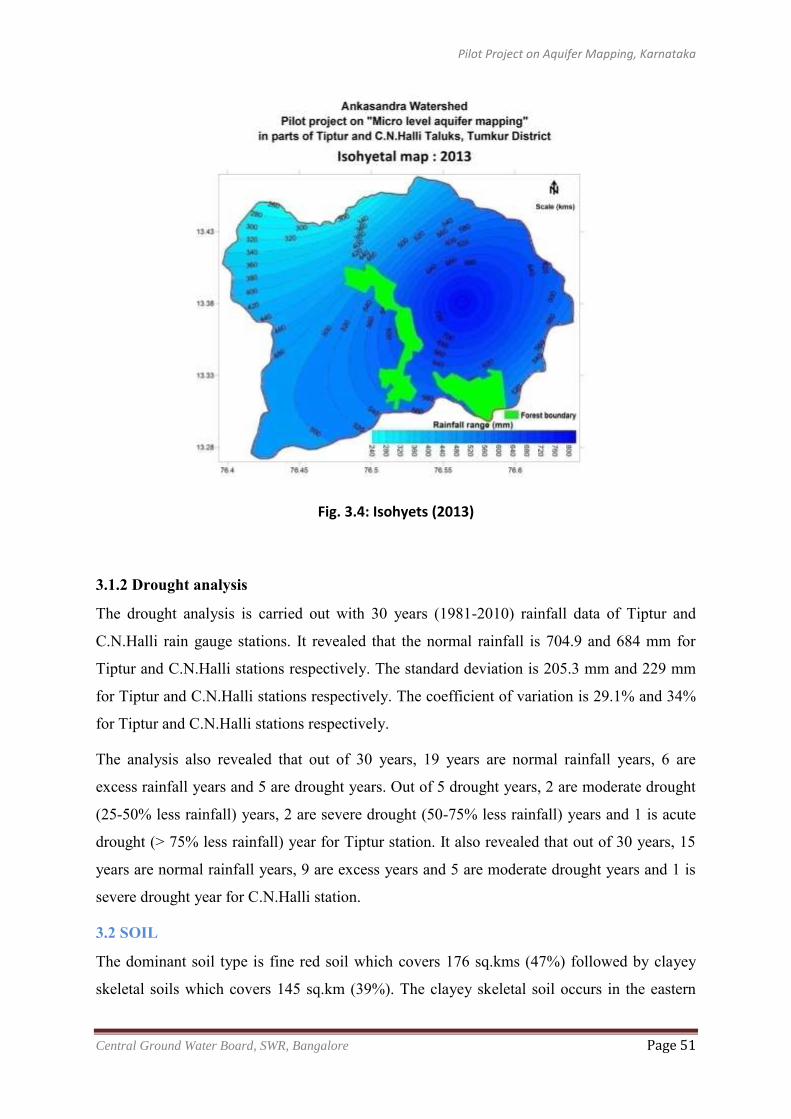
Pilot Project on Aquifer Mapping, Karnataka
Central Ground Water Board, SWR, Bangalore Page 51
Fig. 3.4: Isohyets (2013)
3.1.2 Drought analysis
The drought analysis is carried out with 30 years (1981-2010) rainfall data of Tiptur and
C.N.Halli rain gauge stations. It revealed that the normal rainfall is 704.9 and 684 mm for
Tiptur and C.N.Halli stations respectively. The standard deviation is 205.3 mm and 229 mm
for Tiptur and C.N.Halli stations respectively. The coefficient of variation is 29.1% and 34%
for Tiptur and C.N.Halli stations respectively.
The analysis also revealed that out of 30 years, 19 years are normal rainfall years, 6 are
excess rainfall years and 5 are drought years. Out of 5 drought years, 2 are moderate drought
(25-50% less rainfall) years, 2 are severe drought (50-75% less rainfall) years and 1 is acute
drought (> 75% less rainfall) year for Tiptur station. It also revealed that out of 30 years, 15
years are normal rainfall years, 9 are excess years and 5 are moderate drought years and 1 is
severe drought year for C.N.Halli station.
3.2 SOIL
The dominant soil type is fine red soil which covers 176 sq.kms (47%) followed by clayey
skeletal soils which covers 145 sq.km (39%). The clayey skeletal soil occurs in the eastern
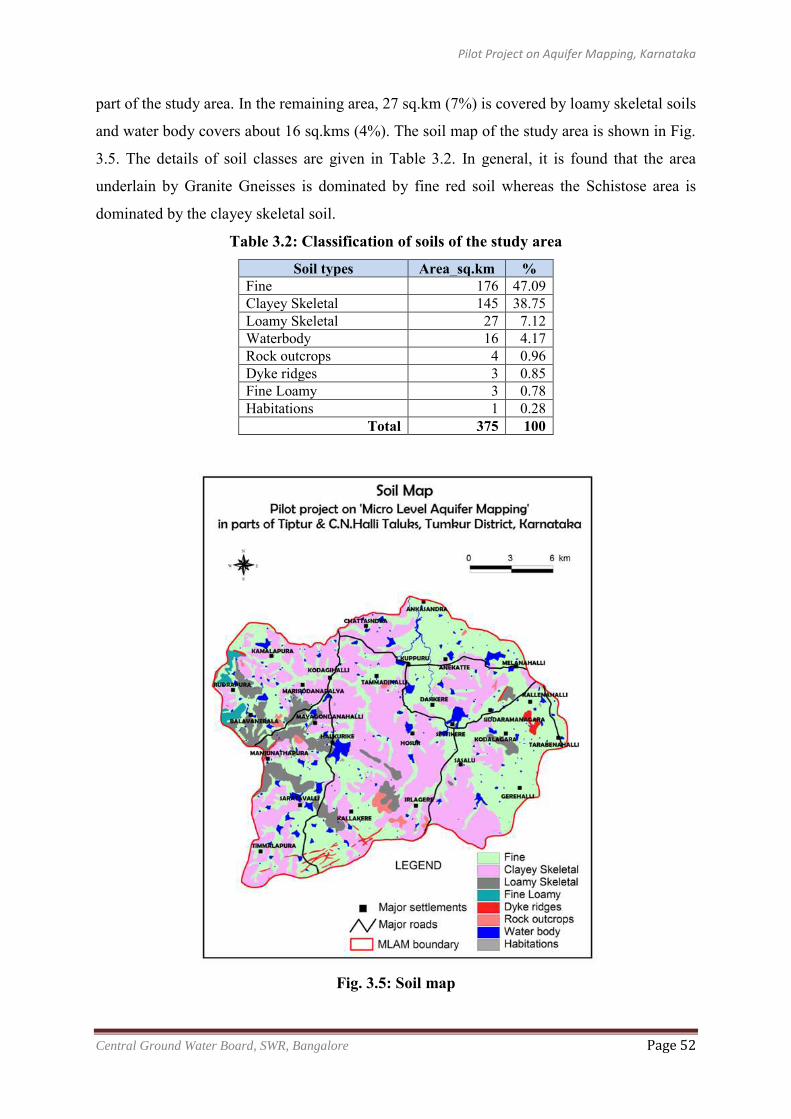
Pilot Project on Aquifer Mapping, Karnataka
Central Ground Water Board, SWR, Bangalore Page 52
part of the study area. In the remaining area, 27 sq.km (7%) is covered by loamy skeletal soils
and water body covers about 16 sq.kms (4%). The soil map of the study area is shown in Fig.
3.5. The details of soil classes are given in Table 3.2. In general, it is found that the area
underlain by Granite Gneisses is dominated by fine red soil whereas the Schistose area is
dominated by the clayey skeletal soil.
Table 3.2: Classification of soils of the study area
Soil types Area_sq.km % Fine 176 47.09 Clayey Skeletal 145 38.75 Loamy Skeletal 27 7.12 Waterbody 16 4.17 Rock outcrops 4 0.96 Dyke ridges 3 0.85 Fine Loamy 3 0.78 Habitations 1 0.28
Total 375 100
Fig. 3.5: Soil map
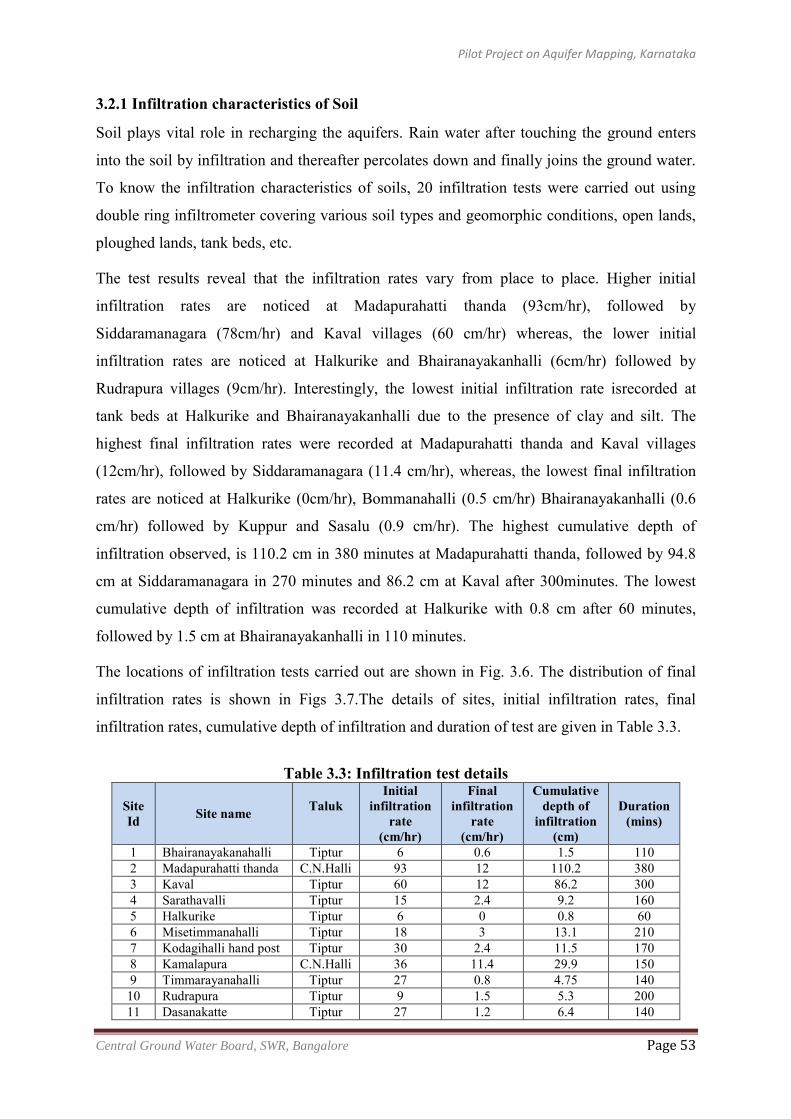
Pilot Project on Aquifer Mapping, Karnataka
Central Ground Water Board, SWR, Bangalore Page 53
3.2.1 Infiltration characteristics of Soil
Soil plays vital role in recharging the aquifers. Rain water after touching the ground enters
into the soil by infiltration and thereafter percolates down and finally joins the ground water.
To know the infiltration characteristics of soils, 20 infiltration tests were carried out using
double ring infiltrometer covering various soil types and geomorphic conditions, open lands,
ploughed lands, tank beds, etc.
The test results reveal that the infiltration rates vary from place to place. Higher initial
infiltration rates are noticed at Madapurahatti thanda (93cm/hr), followed by
Siddaramanagara (78cm/hr) and Kaval villages (60 cm/hr) whereas, the lower initial
infiltration rates are noticed at Halkurike and Bhairanayakanhalli (6cm/hr) followed by
Rudrapura villages (9cm/hr). Interestingly, the lowest initial infiltration rate isrecorded at
tank beds at Halkurike and Bhairanayakanhalli due to the presence of clay and silt. The
highest final infiltration rates were recorded at Madapurahatti thanda and Kaval villages
(12cm/hr), followed by Siddaramanagara (11.4 cm/hr), whereas, the lowest final infiltration
rates are noticed at Halkurike (0cm/hr), Bommanahalli (0.5 cm/hr) Bhairanayakanhalli (0.6
cm/hr) followed by Kuppur and Sasalu (0.9 cm/hr). The highest cumulative depth of
infiltration observed, is 110.2 cm in 380 minutes at Madapurahatti thanda, followed by 94.8
cm at Siddaramanagara in 270 minutes and 86.2 cm at Kaval after 300minutes. The lowest
cumulative depth of infiltration was recorded at Halkurike with 0.8 cm after 60 minutes,
followed by 1.5 cm at Bhairanayakanhalli in 110 minutes.
The locations of infiltration tests carried out are shown in Fig. 3.6. The distribution of final
infiltration rates is shown in Figs 3.7.The details of sites, initial infiltration rates, final
infiltration rates, cumulative depth of infiltration and duration of test are given in Table 3.3.
Table 3.3: Infiltration test details
Site Id Site name Taluk
Initial infiltration
rate (cm/hr)
Final infiltration
rate (cm/hr)
Cumulative depth of
infiltration (cm)
Duration (mins)
1 Bhairanayakanahalli Tiptur 6 0.6 1.5 110 2 Madapurahatti thanda C.N.Halli 93 12 110.2 380 3 Kaval Tiptur 60 12 86.2 300 4 Sarathavalli Tiptur 15 2.4 9.2 160 5 Halkurike Tiptur 6 0 0.8 60 6 Misetimmanahalli Tiptur 18 3 13.1 210 7 Kodagihalli hand post Tiptur 30 2.4 11.5 170 8 Kamalapura C.N.Halli 36 11.4 29.9 150 9 Timmarayanahalli Tiptur 27 0.8 4.75 140 10 Rudrapura Tiptur 9 1.5 5.3 200 11 Dasanakatte Tiptur 27 1.2 6.4 140
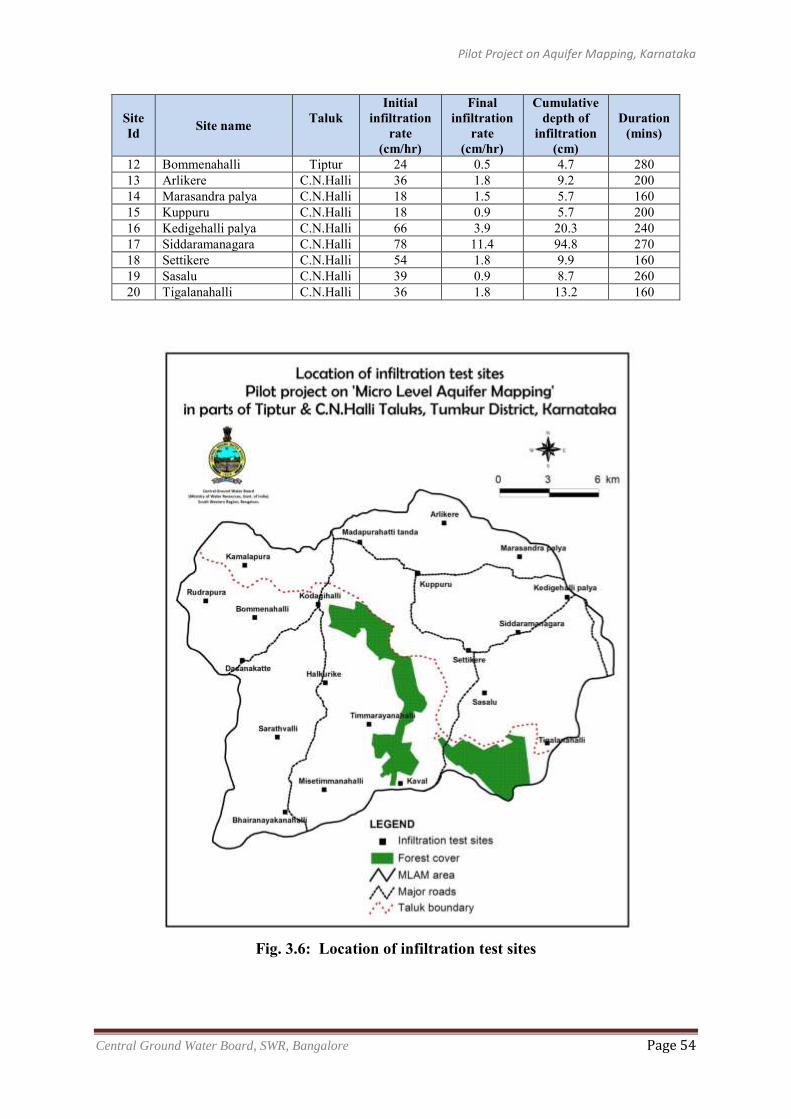
Pilot Project on Aquifer Mapping, Karnataka
Central Ground Water Board, SWR, Bangalore Page 54
Site Id Site name Taluk
Initial infiltration
rate (cm/hr)
Final infiltration
rate (cm/hr)
Cumulative depth of
infiltration (cm)
Duration (mins)
12 Bommenahalli Tiptur 24 0.5 4.7 280 13 Arlikere C.N.Halli 36 1.8 9.2 200 14 Marasandra palya C.N.Halli 18 1.5 5.7 160 15 Kuppuru C.N.Halli 18 0.9 5.7 200 16 Kedigehalli palya C.N.Halli 66 3.9 20.3 240 17 Siddaramanagara C.N.Halli 78 11.4 94.8 270 18 Settikere C.N.Halli 54 1.8 9.9 160 19 Sasalu C.N.Halli 39 0.9 8.7 260 20 Tigalanahalli C.N.Halli 36 1.8 13.2 160
Fig. 3.6: Location of infiltration test sites
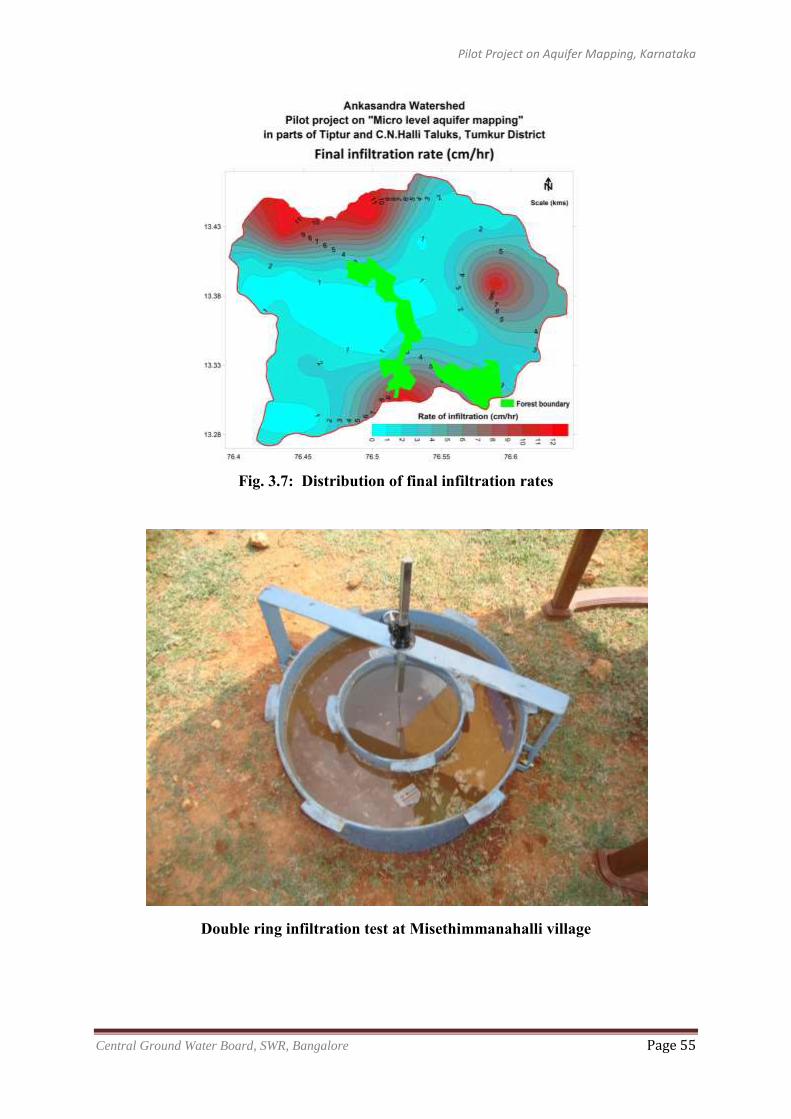
Pilot Project on Aquifer Mapping, Karnataka
Central Ground Water Board, SWR, Bangalore Page 55
Fig. 3.7: Distribution of final infiltration rates
Double ring infiltration test at Misethimmanahalli village
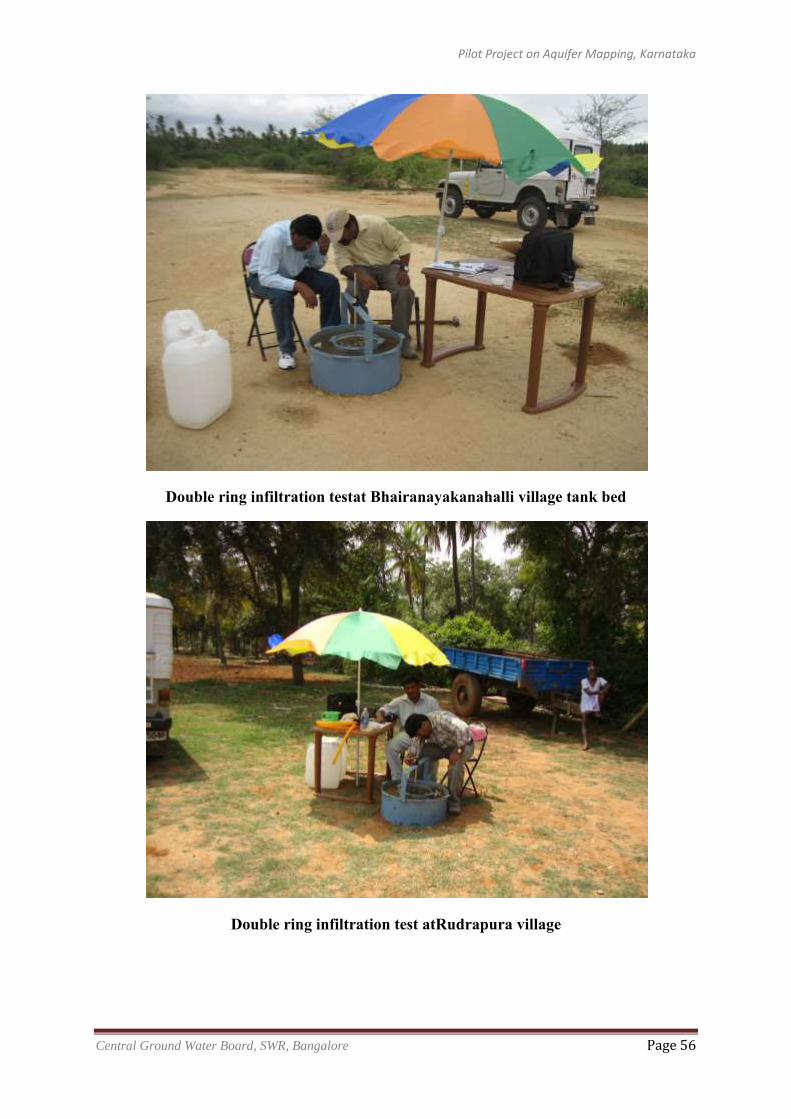
Pilot Project on Aquifer Mapping, Karnataka
Central Ground Water Board, SWR, Bangalore Page 56
Double ring infiltration testat Bhairanayakanahalli village tank bed
Double ring infiltration test atRudrapura village
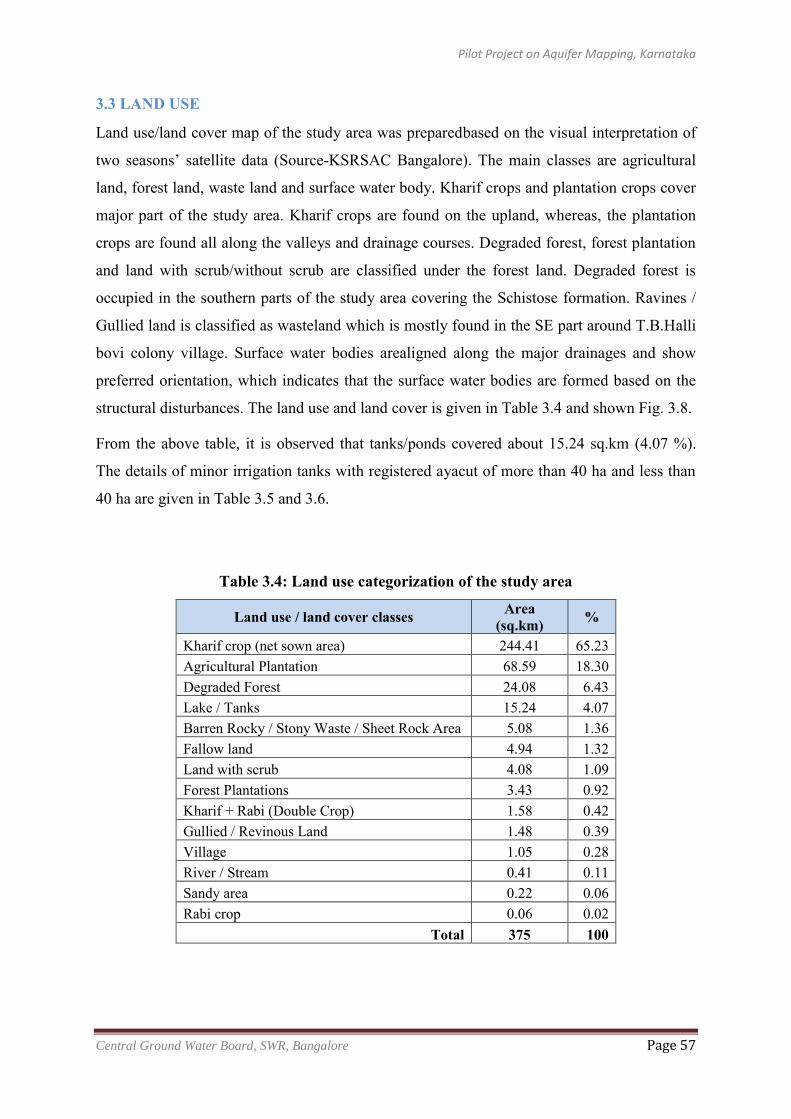
Pilot Project on Aquifer Mapping, Karnataka
Central Ground Water Board, SWR, Bangalore Page 57
3.3 LAND USE
Land use/land cover map of the study area was preparedbased on the visual interpretation of
two seasons’ satellite data (Source-KSRSAC Bangalore). The main classes are agricultural
land, forest land, waste land and surface water body. Kharif crops and plantation crops cover
major part of the study area. Kharif crops are found on the upland, whereas, the plantation
crops are found all along the valleys and drainage courses. Degraded forest, forest plantation
and land with scrub/without scrub are classified under the forest land. Degraded forest is
occupied in the southern parts of the study area covering the Schistose formation. Ravines /
Gullied land is classified as wasteland which is mostly found in the SE part around T.B.Halli
bovi colony village. Surface water bodies arealigned along the major drainages and show
preferred orientation, which indicates that the surface water bodies are formed based on the
structural disturbances. The land use and land cover is given in Table 3.4 and shown Fig. 3.8.
From the above table, it is observed that tanks/ponds covered about 15.24 sq.km (4.07 %).
The details of minor irrigation tanks with registered ayacut of more than 40 ha and less than
40 ha are given in Table 3.5 and 3.6.
Table 3.4: Land use categorization of the study area
Land use / land cover classes Area (sq.km) %
Kharif crop (net sown area) 244.41 65.23 Agricultural Plantation 68.59 18.30 Degraded Forest 24.08 6.43 Lake / Tanks 15.24 4.07 Barren Rocky / Stony Waste / Sheet Rock Area 5.08 1.36 Fallow land 4.94 1.32 Land with scrub 4.08 1.09 Forest Plantations 3.43 0.92 Kharif + Rabi (Double Crop) 1.58 0.42 Gullied / Revinous Land 1.48 0.39 Village 1.05 0.28 River / Stream 0.41 0.11 Sandy area 0.22 0.06 Rabi crop 0.06 0.02
Total 375 100
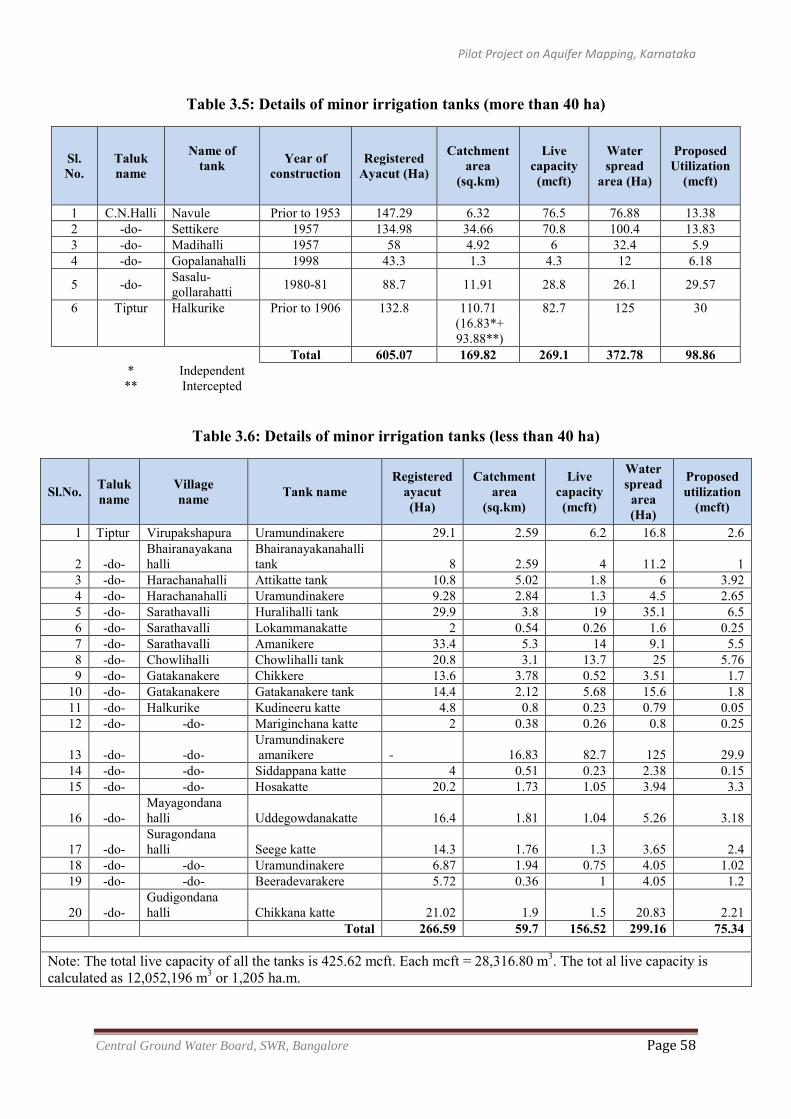
Pilot Project on Aquifer Mapping, Karnataka
Central Ground Water Board, SWR, Bangalore Page 58
Table 3.5: Details of minor irrigation tanks (more than 40 ha)
Sl. No.
Taluk name
Name of tank
Year of construction
Registered Ayacut (Ha)
Catchment area
(sq.km)
Live capacity (mcft)
Water spread
area (Ha)
Proposed Utilization
(mcft)
1 C.N.Halli Navule Prior to 1953 147.29 6.32 76.5 76.88 13.38 2 -do- Settikere 1957 134.98 34.66 70.8 100.4 13.83 3 -do- Madihalli 1957 58 4.92 6 32.4 5.9 4 -do- Gopalanahalli 1998 43.3 1.3 4.3 12 6.18
5 -do- Sasalu- gollarahatti 1980-81 88.7 11.91 28.8 26.1 29.57
6 Tiptur Halkurike Prior to 1906 132.8 110.71 (16.83*+ 93.88**)
82.7 125 30
Total 605.07 169.82 269.1 372.78 98.86
* Independent ** Intercepted
Table 3.6: Details of minor irrigation tanks (less than 40 ha)
Sl.No. Taluk name
Village name Tank name
Registered ayacut (Ha)
Catchment area
(sq.km)
Live capacity (mcft)
Water spread
area (Ha)
Proposed utilization
(mcft)
1 Tiptur Virupakshapura Uramundinakere 29.1 2.59 6.2 16.8 2.6
2 -do- Bhairanayakana halli
Bhairanayakanahalli tank 8 2.59 4 11.2 1
3 -do- Harachanahalli Attikatte tank 10.8 5.02 1.8 6 3.92 4 -do- Harachanahalli Uramundinakere 9.28 2.84 1.3 4.5 2.65 5 -do- Sarathavalli Huralihalli tank 29.9 3.8 19 35.1 6.5 6 -do- Sarathavalli Lokammanakatte 2 0.54 0.26 1.6 0.25 7 -do- Sarathavalli Amanikere 33.4 5.3 14 9.1 5.5 8 -do- Chowlihalli Chowlihalli tank 20.8 3.1 13.7 25 5.76 9 -do- Gatakanakere Chikkere 13.6 3.78 0.52 3.51 1.7
10 -do- Gatakanakere Gatakanakere tank 14.4 2.12 5.68 15.6 1.8 11 -do- Halkurike Kudineeru katte 4.8 0.8 0.23 0.79 0.05 12 -do- -do- Mariginchana katte 2 0.38 0.26 0.8 0.25
13 -do- -do- Uramundinakere amanikere - 16.83 82.7 125 29.9
14 -do- -do- Siddappana katte 4 0.51 0.23 2.38 0.15 15 -do- -do- Hosakatte 20.2 1.73 1.05 3.94 3.3
16 -do- Mayagondana halli Uddegowdanakatte 16.4 1.81 1.04 5.26 3.18
17 -do- Suragondana halli Seege katte 14.3 1.76 1.3 3.65 2.4
18 -do- -do- Uramundinakere 6.87 1.94 0.75 4.05 1.02 19 -do- -do- Beeradevarakere 5.72 0.36 1 4.05 1.2
20 -do- Gudigondana halli Chikkana katte 21.02 1.9 1.5 20.83 2.21
Total 266.59 59.7 156.52 299.16 75.34
Note: The total live capacity of all the tanks is 425.62 mcft. Each mcft = 28,316.80 m3. The tot al live capacity is calculated as 12,052,196 m3 or 1,205 ha.m.
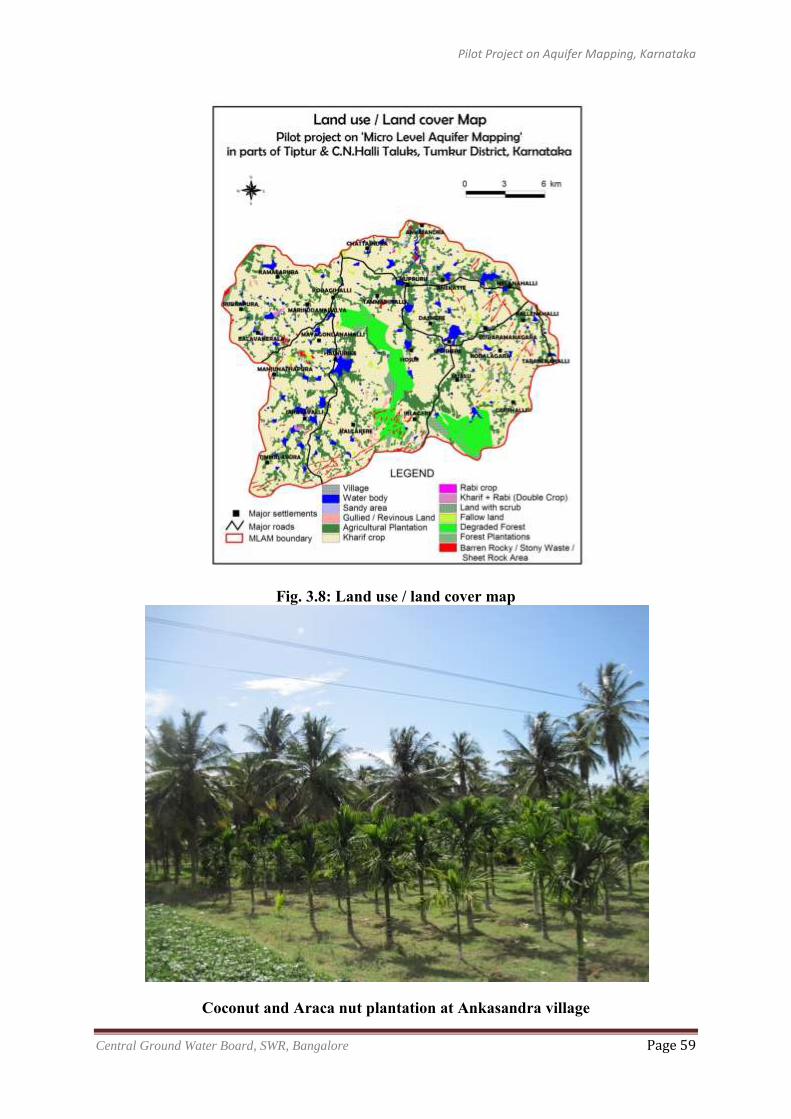
Pilot Project on Aquifer Mapping, Karnataka
Central Ground Water Board, SWR, Bangalore Page 59
Fig. 3.8: Land use / land cover map
Coconut and Araca nut plantation at Ankasandra village
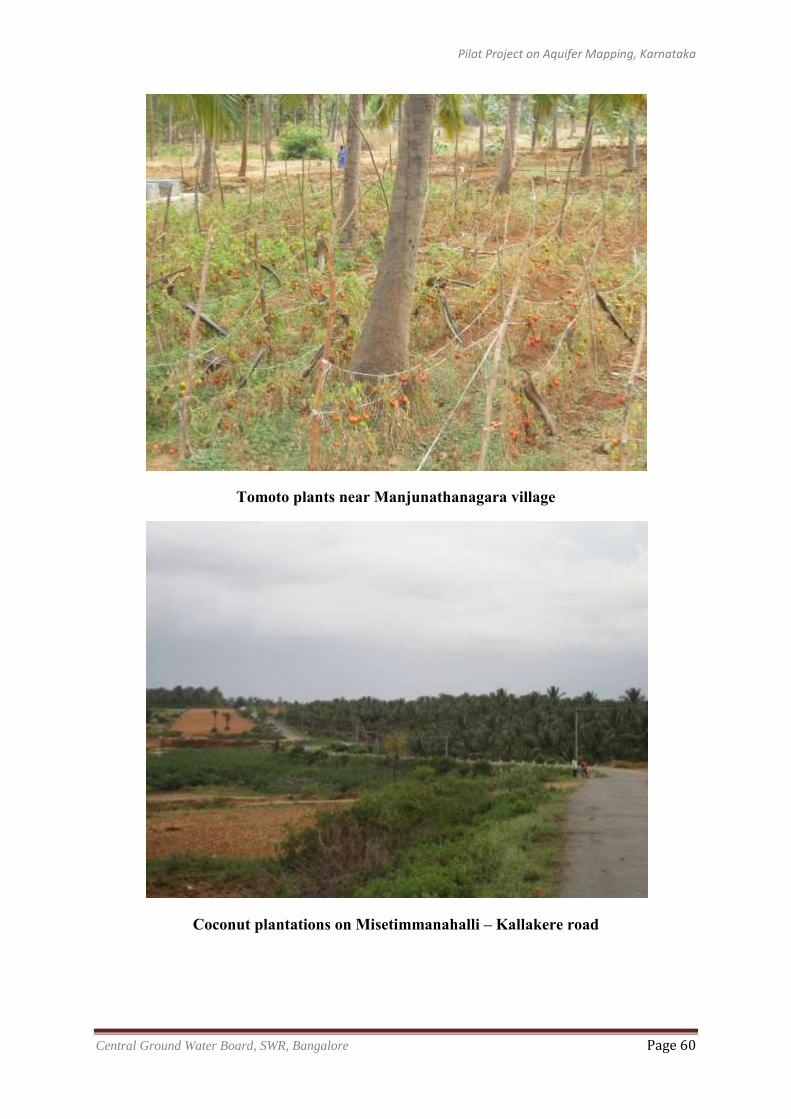
Pilot Project on Aquifer Mapping, Karnataka
Central Ground Water Board, SWR, Bangalore Page 60
Tomoto plants near Manjunathanagara village
Coconut plantations on Misetimmanahalli – Kallakere road
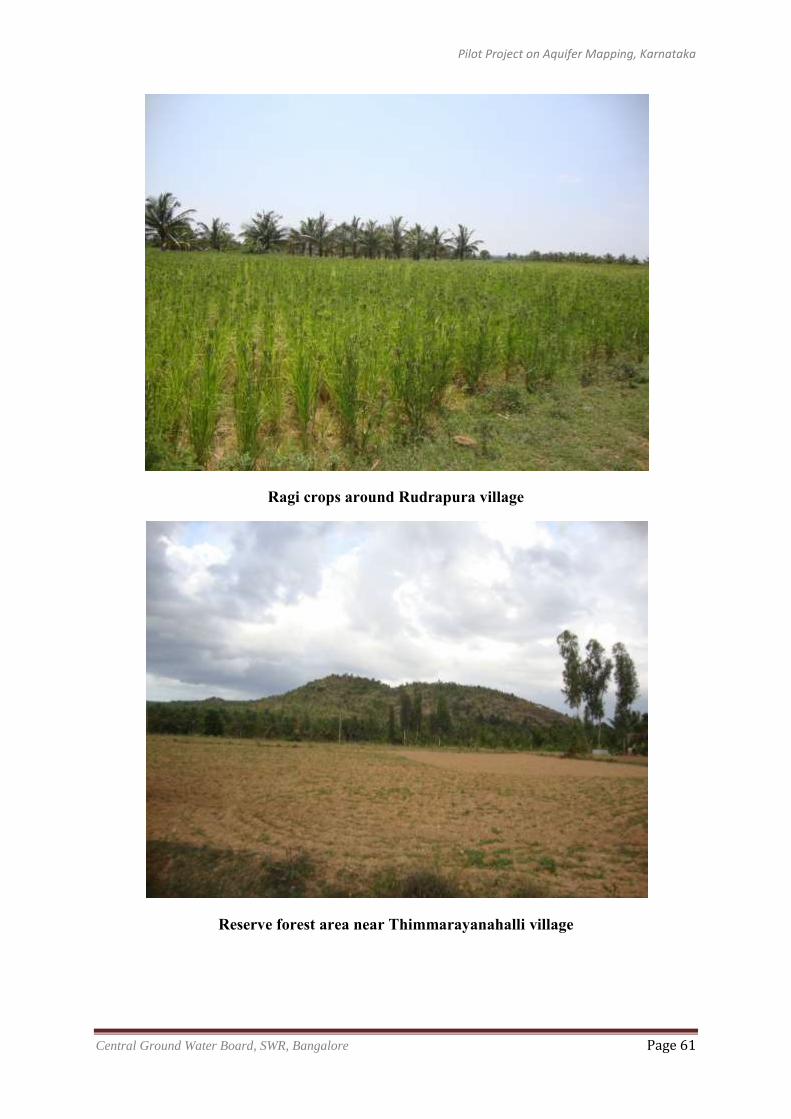
Pilot Project on Aquifer Mapping, Karnataka
Central Ground Water Board, SWR, Bangalore Page 61
Ragi crops around Rudrapura village
Reserve forest area near Thimmarayanahalli village
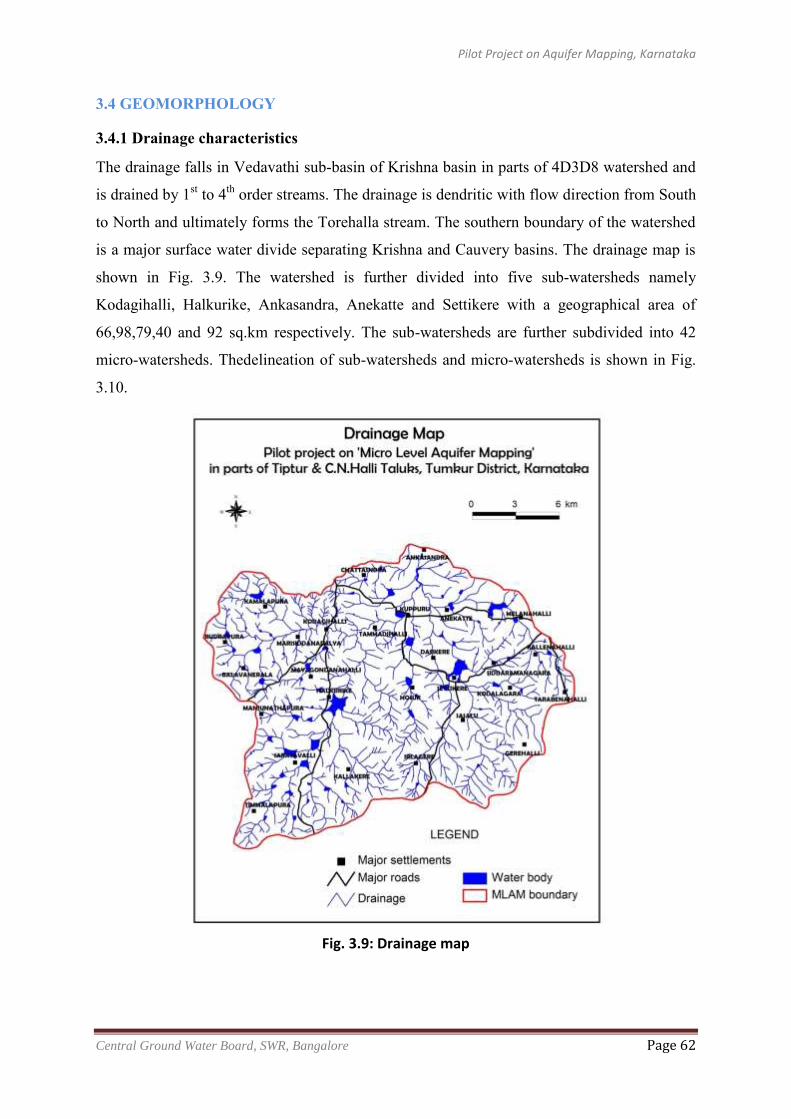
Pilot Project on Aquifer Mapping, Karnataka
Central Ground Water Board, SWR, Bangalore Page 62
3.4 GEOMORPHOLOGY
3.4.1 Drainage characteristics
The drainage falls in Vedavathi sub-basin of Krishna basin in parts of 4D3D8 watershed and
is drained by 1st to 4th order streams. The drainage is dendritic with flow direction from South
to North and ultimately forms the Torehalla stream. The southern boundary of the watershed
is a major surface water divide separating Krishna and Cauvery basins. The drainage map is
shown in Fig. 3.9. The watershed is further divided into five sub-watersheds namely
Kodagihalli, Halkurike, Ankasandra, Anekatte and Settikere with a geographical area of
66,98,79,40 and 92 sq.km respectively. The sub-watersheds are further subdivided into 42
micro-watersheds. Thedelineation of sub-watersheds and micro-watersheds is shown in Fig.
3.10.
Fig. 3.9: Drainage map
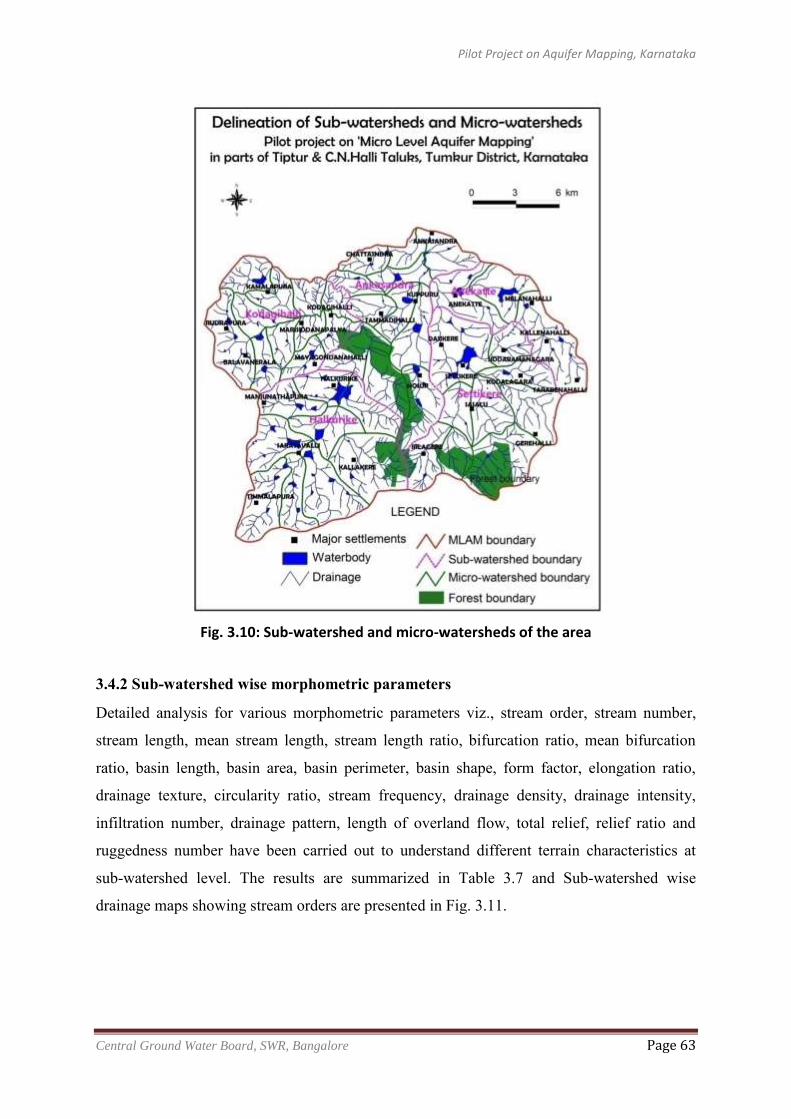
Pilot Project on Aquifer Mapping, Karnataka
Central Ground Water Board, SWR, Bangalore Page 63
Fig. 3.10: Sub-watershed and micro-watersheds of the area
3.4.2 Sub-watershed wise morphometric parameters
Detailed analysis for various morphometric parameters viz., stream order, stream number,
stream length, mean stream length, stream length ratio, bifurcation ratio, mean bifurcation
ratio, basin length, basin area, basin perimeter, basin shape, form factor, elongation ratio,
drainage texture, circularity ratio, stream frequency, drainage density, drainage intensity,
infiltration number, drainage pattern, length of overland flow, total relief, relief ratio and
ruggedness number have been carried out to understand different terrain characteristics at
sub-watershed level. The results are summarized in Table 3.7 and Sub-watershed wise
drainage maps showing stream orders are presented in Fig. 3.11.
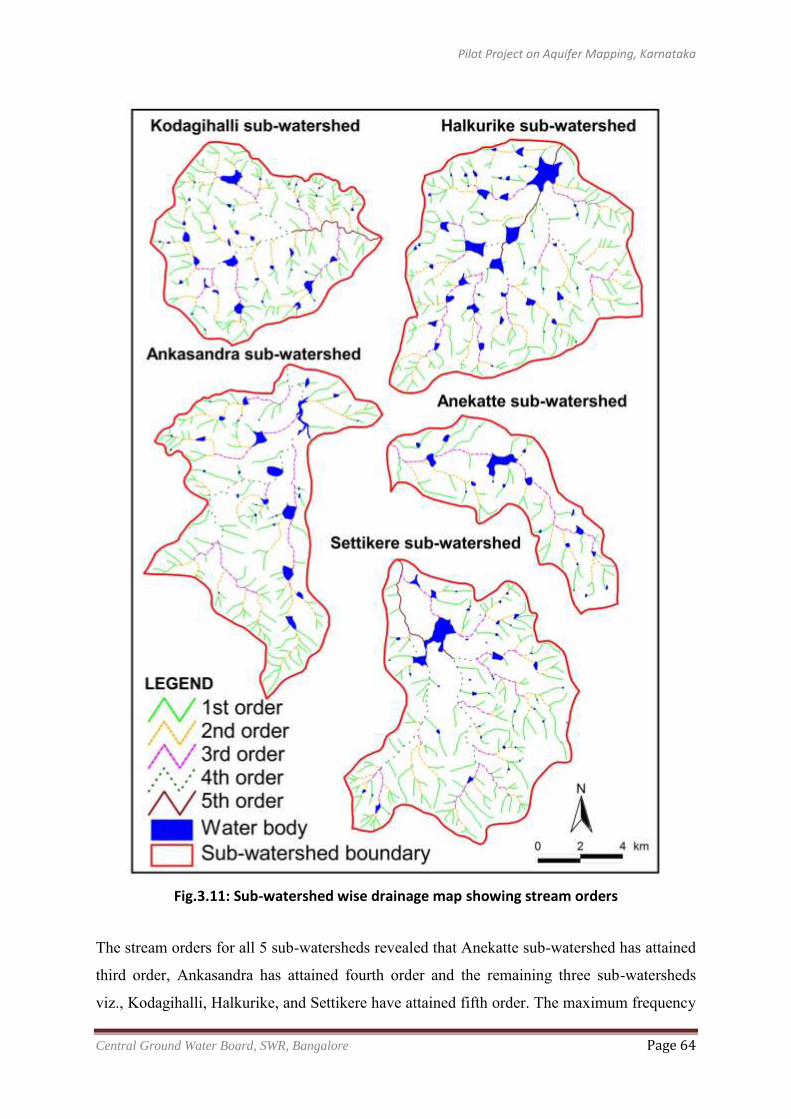
Pilot Project on Aquifer Mapping, Karnataka
Central Ground Water Board, SWR, Bangalore Page 64
Fig.3.11: Sub-watershed wise drainage map showing stream orders
The stream orders for all 5 sub-watersheds revealed that Anekatte sub-watershed has attained
third order, Ankasandra has attained fourth order and the remaining three sub-watersheds
viz., Kodagihalli, Halkurike, and Settikere have attained fifth order. The maximum frequency
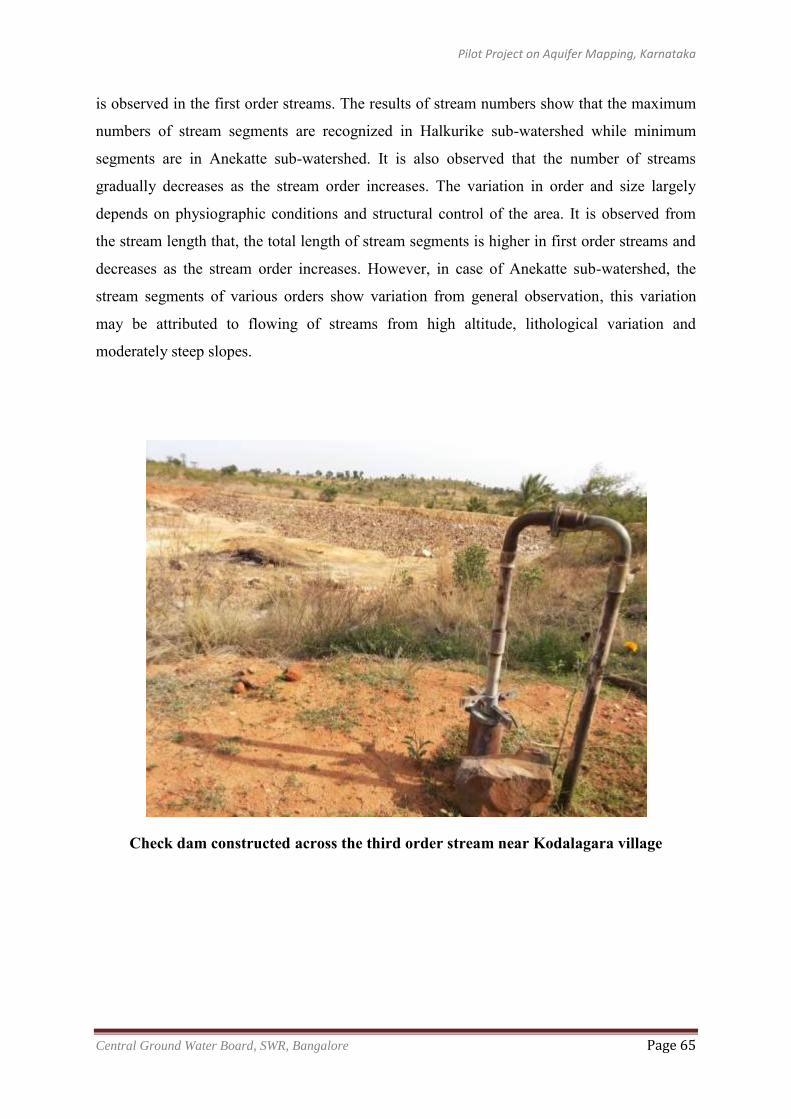
Pilot Project on Aquifer Mapping, Karnataka
Central Ground Water Board, SWR, Bangalore Page 65
is observed in the first order streams. The results of stream numbers show that the maximum
numbers of stream segments are recognized in Halkurike sub-watershed while minimum
segments are in Anekatte sub-watershed. It is also observed that the number of streams
gradually decreases as the stream order increases. The variation in order and size largely
depends on physiographic conditions and structural control of the area. It is observed from
the stream length that, the total length of stream segments is higher in first order streams and
decreases as the stream order increases. However, in case of Anekatte sub-watershed, the
stream segments of various orders show variation from general observation, this variation
may be attributed to flowing of streams from high altitude, lithological variation and
moderately steep slopes.
Check dam constructed across the third order stream near Kodalagara village
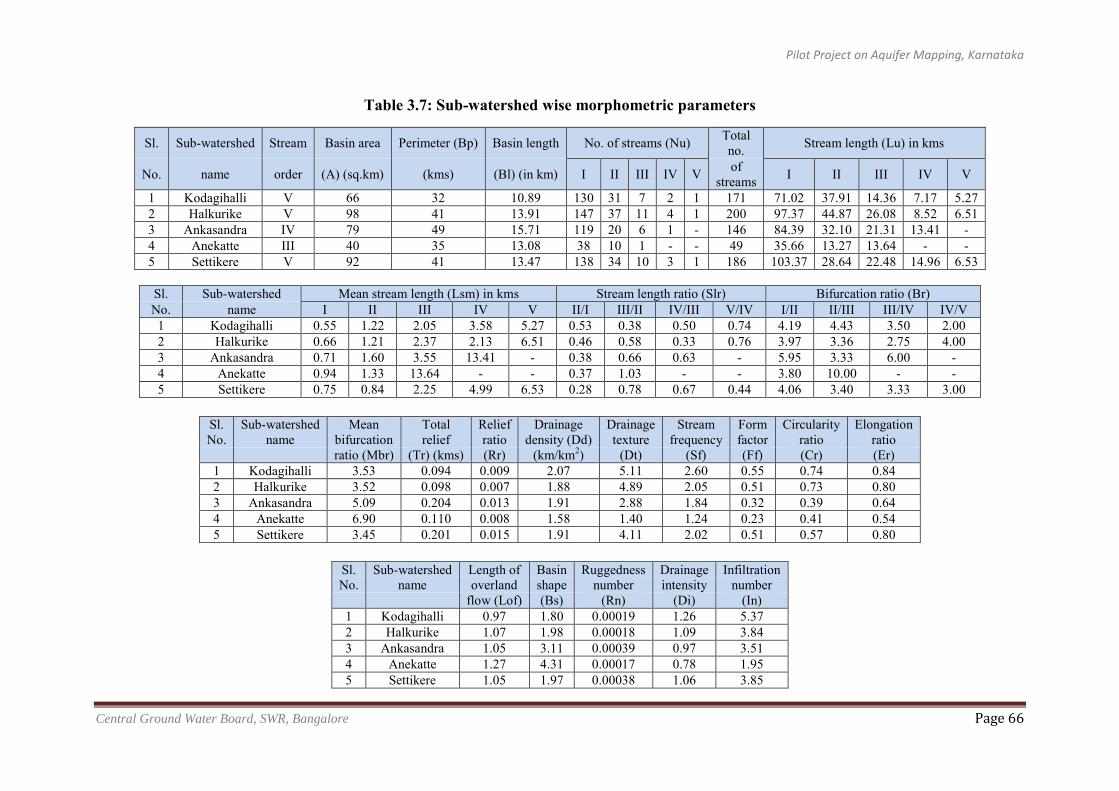
Pilot Project on Aquifer Mapping, Karnataka
Central Ground Water Board, SWR, Bangalore Page 66
Table 3.7: Sub-watershed wise morphometric parameters
Sl. Sub-watershed Stream Basin area Perimeter (Bp) Basin length No. of streams (Nu) Total no. Stream length (Lu) in kms
No. name order (A) (sq.km) (kms) (Bl) (in km) I II III IV V of streams I II III IV V
1 Kodagihalli V 66 32 10.89 130 31 7 2 1 171 71.02 37.91 14.36 7.17 5.27 2 Halkurike V 98 41 13.91 147 37 11 4 1 200 97.37 44.87 26.08 8.52 6.51 3 Ankasandra IV 79 49 15.71 119 20 6 1 - 146 84.39 32.10 21.31 13.41 - 4 Anekatte III 40 35 13.08 38 10 1 - - 49 35.66 13.27 13.64 - - 5 Settikere V 92 41 13.47 138 34 10 3 1 186 103.37 28.64 22.48 14.96 6.53
Sl. Sub-watershed Mean stream length (Lsm) in kms Stream length ratio (Slr) Bifurcation ratio (Br) No. name I II III IV V II/I III/II IV/III V/IV I/II II/III III/IV IV/V 1 Kodagihalli 0.55 1.22 2.05 3.58 5.27 0.53 0.38 0.50 0.74 4.19 4.43 3.50 2.00 2 Halkurike 0.66 1.21 2.37 2.13 6.51 0.46 0.58 0.33 0.76 3.97 3.36 2.75 4.00 3 Ankasandra 0.71 1.60 3.55 13.41 - 0.38 0.66 0.63 - 5.95 3.33 6.00 - 4 Anekatte 0.94 1.33 13.64 - - 0.37 1.03 - - 3.80 10.00 - - 5 Settikere 0.75 0.84 2.25 4.99 6.53 0.28 0.78 0.67 0.44 4.06 3.40 3.33 3.00
Sl. Sub-watershed Mean Total Relief Drainage Drainage Stream Form Circularity Elongation No. name bifurcation relief ratio density (Dd) texture frequency factor ratio ratio
ratio (Mbr) (Tr) (kms) (Rr) (km/km2) (Dt) (Sf) (Ff) (Cr) (Er) 1 Kodagihalli 3.53 0.094 0.009 2.07 5.11 2.60 0.55 0.74 0.84 2 Halkurike 3.52 0.098 0.007 1.88 4.89 2.05 0.51 0.73 0.80 3 Ankasandra 5.09 0.204 0.013 1.91 2.88 1.84 0.32 0.39 0.64 4 Anekatte 6.90 0.110 0.008 1.58 1.40 1.24 0.23 0.41 0.54 5 Settikere 3.45 0.201 0.015 1.91 4.11 2.02 0.51 0.57 0.80
Sl. Sub-watershed Length of Basin Ruggedness Drainage Infiltration No. name overland shape number intensity number
flow (Lof) (Bs) (Rn) (Di) (In) 1 Kodagihalli 0.97 1.80 0.00019 1.26 5.37 2 Halkurike 1.07 1.98 0.00018 1.09 3.84 3 Ankasandra 1.05 3.11 0.00039 0.97 3.51 4 Anekatte 1.27 4.31 0.00017 0.78 1.95 5 Settikere 1.05 1.97 0.00038 1.06 3.85
Pilot Project on Aquifer Mapping, Karnataka.
Central Ground Water Board, SWR, Bangalore Page 67
The bifurcation ratio values vary from 2 to 10. It is observed that it is not the same from one
order to its next order. These irregularities are dependent upon the geological and lithological
characteristics of the drainage basin. The higher values of bifurcation ratio indicate strong
structural control on the drainage pattern while, lower values are indicative of sub-watersheds
which are less affected by structural disturbances. Mean bifurcation ratio varies from 3.45 to
6.90 and all sub-watersheds except Anekattefall under normal basin category and less structural
control on the drainage development.
Basin length varies from 10.89 to 15.71 kms and high basin length indicates elongated nature of
the watershed. The sub-Basin areas have been computed which range from 40 to98 sq.kms. The
analysis indicates that the Halkurike is the largest sub-watershed while Anekatte is the smallest.
Basin perimeter varies from 32 kms (Kodagihalli sub-watershed) to 49 (Ankasandra sub-
watershed).
Basin shape values for each sub-watershed indicate that, Kodagihalli, Settikere and Halkurike
sub-watersheds show lower basin shape values and have sharply peaked flood discharge periods
while, Anekatte and Ankasandra sub-watersheds show weaker flood discharge periods.
Form factor values were observed and analysed that Anekatte and Ankasandra sub-watersheds
show an elongated basin nature with lower peak flows of longer duration due to lower form
factor value (0.23 and 0.32 respectively); Halkurike, Settikere and Kodagihalli sub-watersheds
are close to circular basins due to higher form factor values.
Elongation ratio values generally vary from near to 0.6 to 1.0 over a wide variety of climatic and
geologic types. These values can be grouped into three categories namely (a) circular (>0.9), (b)
oval (0.9 to 0.8), (c) elongated (<0.7). In the present study, these values were derived for each
sub-watersheds and it varies from 0.54 to 0.84 indicating that Settikere, Halkurike and
Kodagihalli sub-watersheds are circular, while, Anekatte and Ankasandra sub-watersheds are
falling under elongated type.
Circularity ratio value ranges from 0.39 to 0.74 and reveals that Ankasandra (0.39) and Anekatte
sub-watersheds (0.41) are representing elongated nature of basin type.
Drainage texture has been classified into five different textures i.e., very coarse (< 2), coarse (2
to 4), moderate (4 to 6), fine (6 to 8) and very fine (> 8). In the present study, the drainage
Pilot Project on Aquifer Mapping, Karnataka.
Central Ground Water Board, SWR, Bangalore Page 68
texture varies from 1.40 to 5.11 which indicate that Anekatte sub-watershed falls under very
coarse, Ankasandra sub-watershed under coarse and Settikere, Halkurike and Kodagihalli sub-
watersheds fall under moderate type of drainage texture. Stream frequency varies from 1.24 to
2.60. It exhibits almost positive correlation with the drainage density values of the sub-
watersheds indicating the increase in stream population with respect to increase in drainage
density.
Drainage density varies between 1.58 (Anekatte sub-watershed) and 2.07 km/ km2 (Kodagihalli
sub-watershed). It may be pertinent to note that the low values of drainage density are
characteristics of regions underlain by highly permeable material with vegetative cover and low
relief, whereas, the high values of drainage density indicate regions of weak and impermeable
subsurface material, sparse vegetation and mountainous relief. Drainage Intensity varies between
0.78 (Anekatte sub-watershed) and 1.26 (Kodagihalli sub-watershed). The lower value of
drainage intensity implies that drainage density and stream frequency have little effect (if any) on
the extent to which the surface has been lowered by agents of denudation. With lower values of
drainage density, stream frequency and drainage intensity, surface run-off is not quickly removed
from the watershed, making it highly susceptible to flooding, gully erosion and landslides.
Drainage pattern is dendritic type. This is most common pattern which is formed in a drainage
basin composed of fairly homogeneous rock without control by the underlying geologic
structure. The longer the time of formation of a drainage basin, the more easily the dendritic
pattern is formed. Length of overland flow values vary from 0.97 to 1.27. It is revealed that the
length of overland flow is less in Kodagihallisub-watershed as drainage density is high when
compared to the remaining sub-watersheds.
Total relief varies from 0.204 kms (Ankasandra sub-watershed) to 0.094 (Kodagihalli sub-
watershed).Relief ratio ranges from 0.007 in Halkurike sub-watershed to 0.015 in Settikere sub-
watershed. It is also observed that the high values of relief ratio indicate steep slope and high
relief, while the lower values may indicate the presence of basement rocks exposed in the form
of small ridges and mounds with lower degree of slope.
Ruggedness number values were calculated which varies from 0.00018 to 0.00039. The low
ruggedness value of sub-watershed implies that the area is less prone to soil erosion and have
intrinsic structural complexity in association with relief and drainage density.
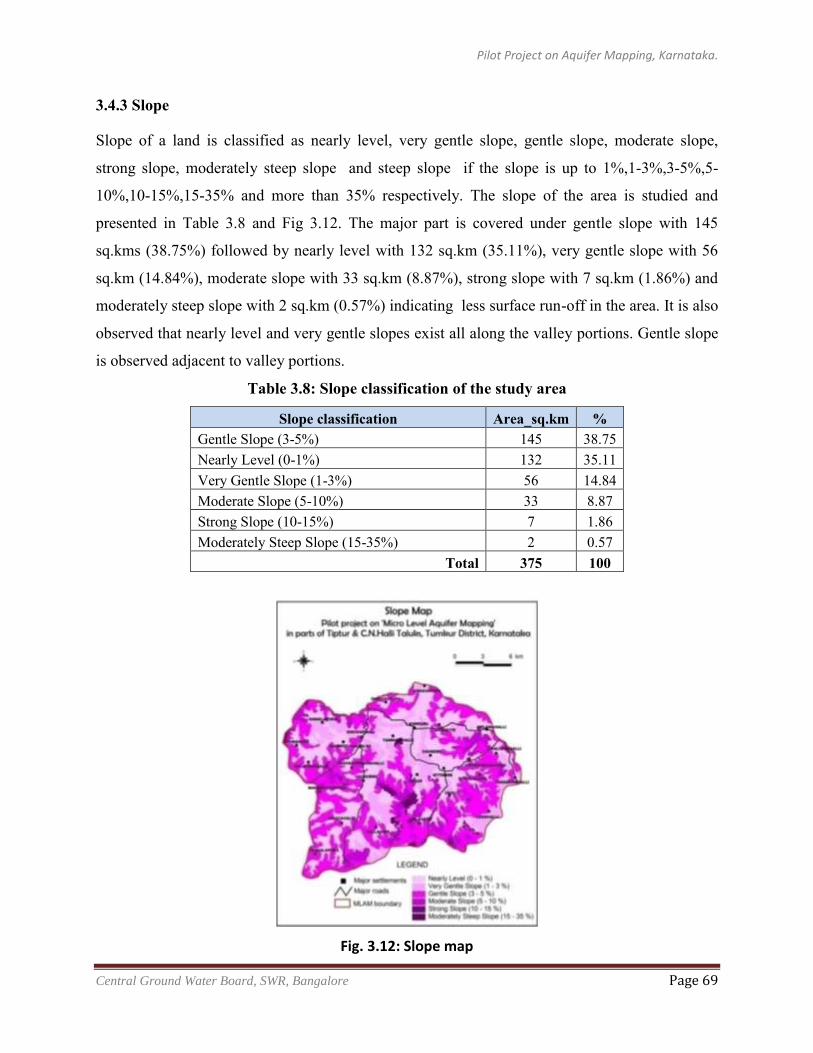
Pilot Project on Aquifer Mapping, Karnataka.
Central Ground Water Board, SWR, Bangalore Page 69
3.4.3 Slope
Slope of a land is classified as nearly level, very gentle slope, gentle slope, moderate slope,
strong slope, moderately steep slope and steep slope if the slope is up to 1%,1-3%,3-5%,5-
10%,10-15%,15-35% and more than 35% respectively. The slope of the area is studied and
presented in Table 3.8 and Fig 3.12. The major part is covered under gentle slope with 145
sq.kms (38.75%) followed by nearly level with 132 sq.km (35.11%), very gentle slope with 56
sq.km (14.84%), moderate slope with 33 sq.km (8.87%), strong slope with 7 sq.km (1.86%) and
moderately steep slope with 2 sq.km (0.57%) indicating less surface run-off in the area. It is also
observed that nearly level and very gentle slopes exist all along the valley portions. Gentle slope
is observed adjacent to valley portions.
Table 3.8: Slope classification of the study area
Slope classification Area_sq.km % Gentle Slope (3-5%) 145 38.75 Nearly Level (0-1%) 132 35.11 Very Gentle Slope (1-3%) 56 14.84 Moderate Slope (5-10%) 33 8.87 Strong Slope (10-15%) 7 1.86 Moderately Steep Slope (15-35%) 2 0.57
Total 375 100
Fig. 3.12: Slope map
Pilot Project on Aquifer Mapping, Karnataka.
Central Ground Water Board, SWR, Bangalore Page 70
3.4.4 Hydrogeomorphology
The various geomorphological features noticed in the study area are structural hill, residual hill,
pediment inselberg complex, inselberg, pediment, shallow weathered pediplain, moderately
weathered pediplain, valley-fills and water bodies. The shallow weathered pediplain is the
dominant geomorphological feature covering 195.26 sq.km (52%) followed by valley-fills
covering 98.64 sq.km (26.32%),whilethe pediment covers 25.47 sq.km (6.80%). These
threealtogether cover about 85% of total area(Table 3.9). The map showing geomorphology of
the area is shown in Fig. 3.13. The shallow, moderately weathered pediplain and the valley-fills
which cover majority of the area, are more weathered compared to other units and are suitable
for ground water storage and development.
Table 3.9: Hydrogeomorphological classification of the study area
Geomorphic units Area_sq.km % Shallow weathered pediplain 195.26 52.10 Valley fill 98.64 26.32 Pediment 25.47 6.80 Water body 15.76 4.21 Moderately weathered pediplain 14.19 3.79 Structural hill 13.75 3.67 Pediment inselberg complex 8.98 2.40 Residual hill 2.38 0.64 Inselberg 0.35 0.09
Total 375 100
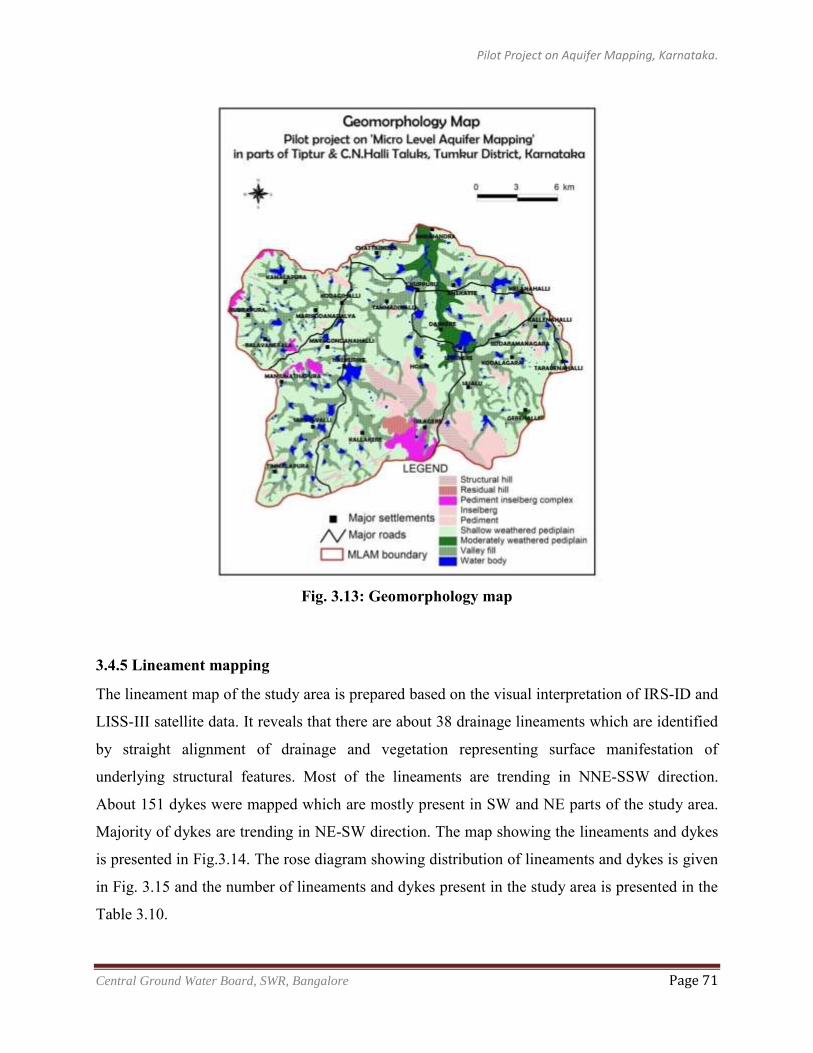
Pilot Project on Aquifer Mapping, Karnataka.
Central Ground Water Board, SWR, Bangalore Page 71
Fig. 3.13: Geomorphology map
3.4.5 Lineament mapping
The lineament map of the study area is prepared based on the visual interpretation of IRS-ID and
LISS-III satellite data. It reveals that there are about 38 drainage lineaments which are identified
by straight alignment of drainage and vegetation representing surface manifestation of
underlying structural features. Most of the lineaments are trending in NNE-SSW direction.
About 151 dykes were mapped which are mostly present in SW and NE parts of the study area.
Majority of dykes are trending in NE-SW direction. The map showing the lineaments and dykes
is presented in Fig.3.14. The rose diagram showing distribution of lineaments and dykes is given
in Fig. 3.15 and the number of lineaments and dykes present in the study area is presented in the
Table 3.10.
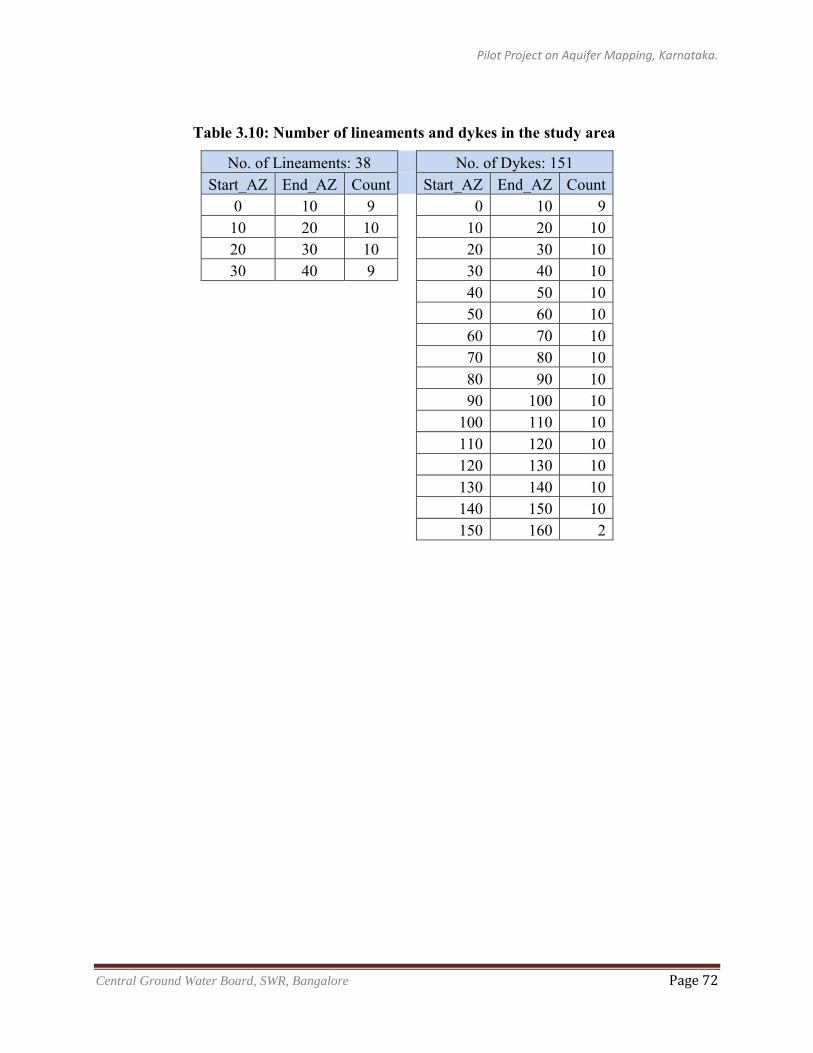
Pilot Project on Aquifer Mapping, Karnataka.
Central Ground Water Board, SWR, Bangalore Page 72
Table 3.10: Number of lineaments and dykes in the study area
No. of Lineaments: 38
No. of Dykes: 151 Start_AZ End_AZ Count
Start_AZ End_AZ Count
0 10 9
0 10 9 10 20 10
10 20 10
20 30 10
20 30 10 30 40 9
30 40 10
40 50 10
50 60 10
60 70 10
70 80 10
80 90 10
90 100 10
100 110 10
110 120 10
120 130 10
130 140 10
140 150 10
150 160 2
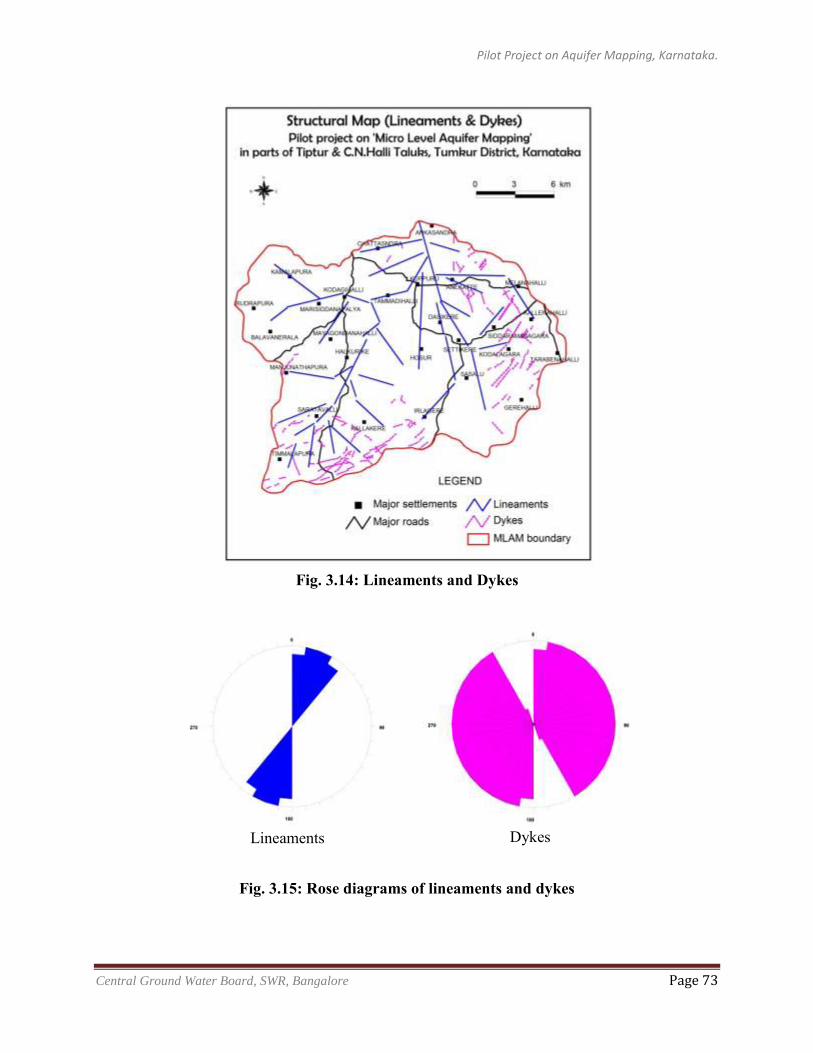
Pilot Project on Aquifer Mapping, Karnataka.
Central Ground Water Board, SWR, Bangalore Page 73
Fig. 3.14: Lineaments and Dykes
Lineaments
Dykes
Fig. 3.15: Rose diagrams of lineaments and dykes
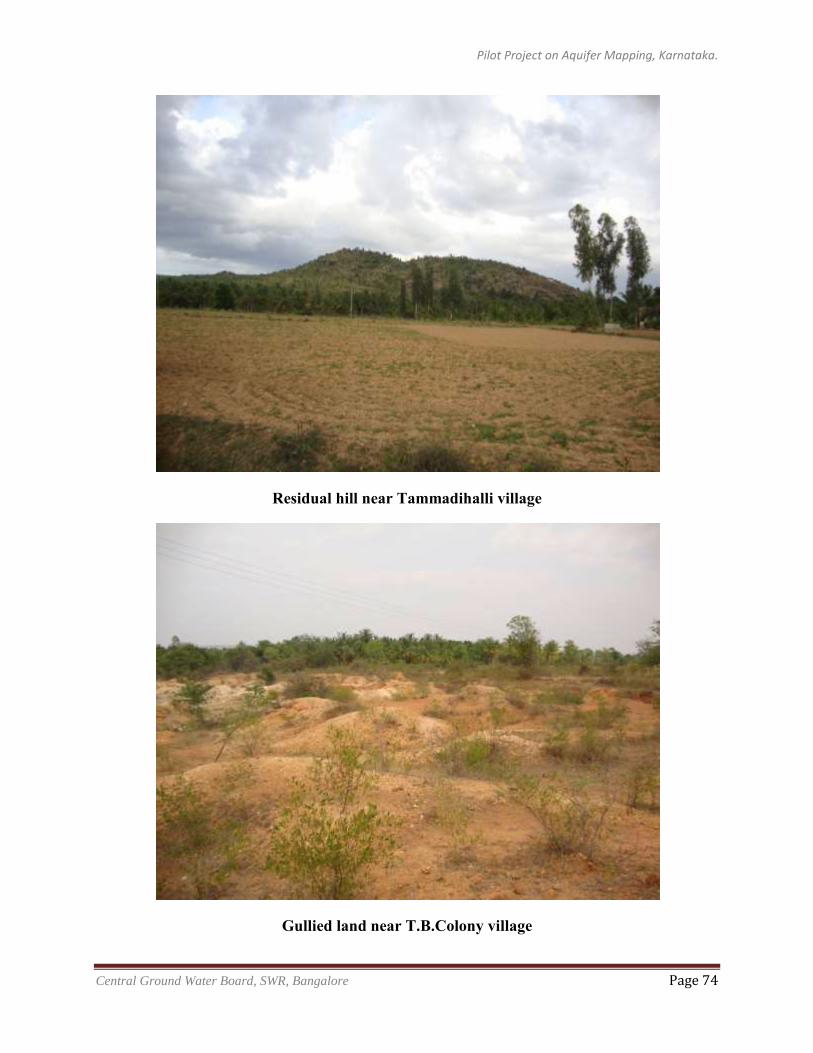
Pilot Project on Aquifer Mapping, Karnataka.
Central Ground Water Board, SWR, Bangalore Page 74
Residual hill near Tammadihalli village
Gullied land near T.B.Colony village
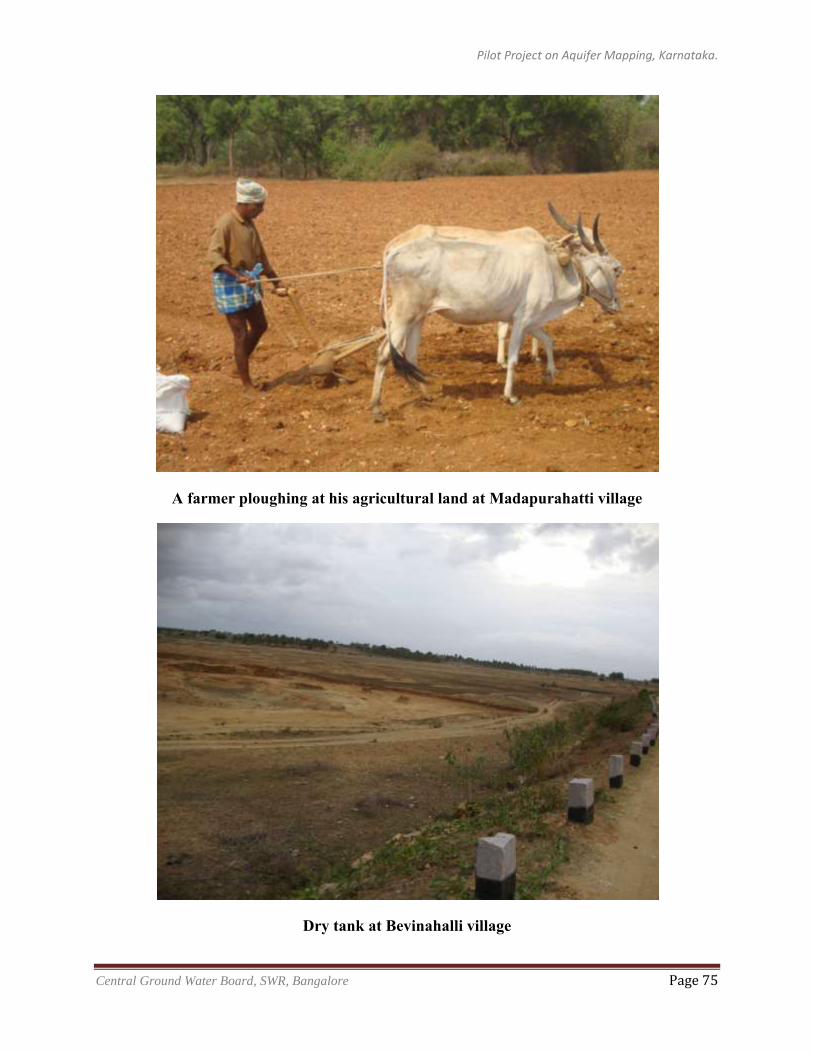
Pilot Project on Aquifer Mapping, Karnataka.
Central Ground Water Board, SWR, Bangalore Page 75
A farmer ploughing at his agricultural land at Madapurahatti village
Dry tank at Bevinahalli village
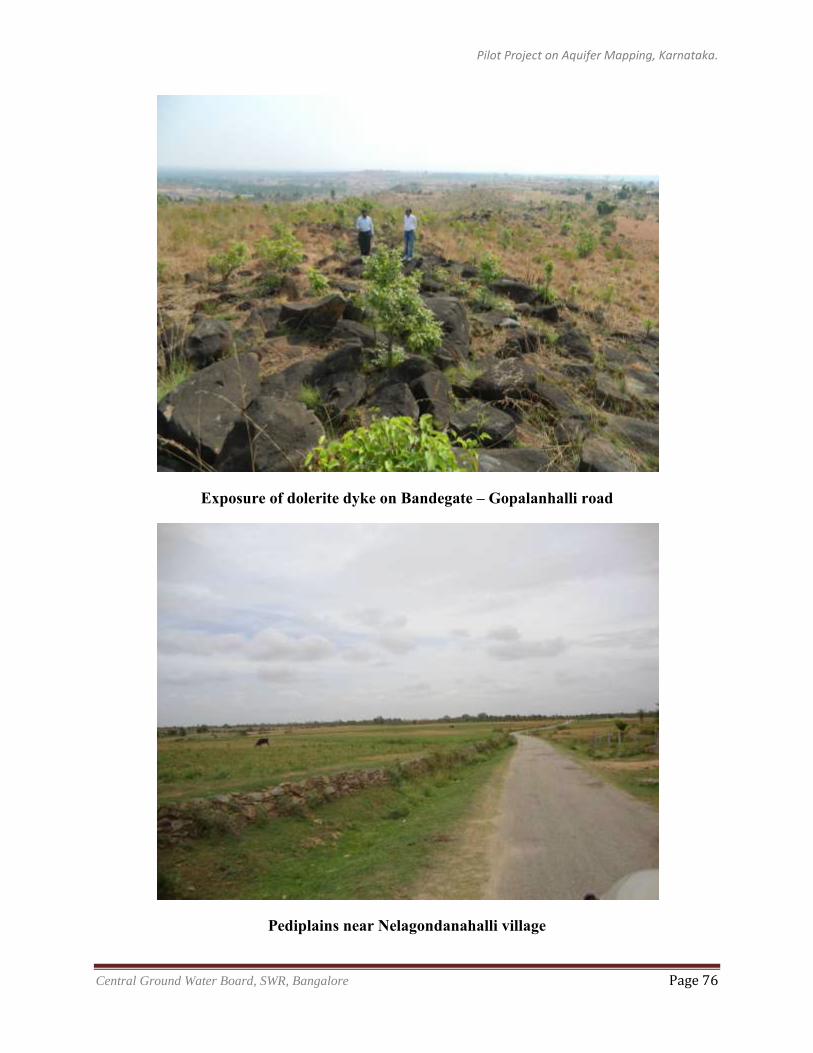
Pilot Project on Aquifer Mapping, Karnataka.
Central Ground Water Board, SWR, Bangalore Page 76
Exposure of dolerite dyke on Bandegate – Gopalanhalli road
Pediplains near Nelagondanahalli village
Pilot Project on Aquifer Mapping, Karnataka.
Central Ground Water Board, SWR, Bangalore Page 77
3.5 GEOPHYSICS
3.5.1 Geophysics (CGWB) 3.5.1.1 Surface geophysics Surface geophysical surveys in the form of Vertical Electrical Soundings (VES) were conducted
in the study area. The preliminary objective of the survey is to decipher the weathered layer
thickness and the fractured thickness, layer resistivity of weathered, fractured and massive
formations. In addition, the surveys were also aimed at computing subsurface geophysical
parameters in the area.
3.5.1.1.1 Data acquisition and interpretation
A total 125 VES were carried out with station interval 2 km in grid pattern using IGIS
Hyderabad, make ATS-SSR-MP and Mac-Ohm, OYO Japan make Resistivity meters.
Schlumberger electrode spreading was used with maximum current electrode separation of
AB/2=300 m. The apparent resistivity from the field plotted in a log-log graph paper shows that
most of the sounding curves reflect the presence of three to four geoelectric layers of A, H and
HA types. The initial interpretation of the VES data was accomplished using a conventional
partial curve matching technique with a two layer master curve and auxiliary diagrams.
Estimation of resistivity layers and thickness were obtained and used as starting models. The
computer aided interpretation (Schum and IP2WIN) based on optimization techniques were used
to analyse the data. Dug well/borewell information was incorporated and the layered earth
models from the VES interpretation were kept as simple as possible by not allowing results with
too many thin layers. The geo-electrical parameters of VES are given in Annexure 3.1.
3.5.1.1.2 Results and discussion
Based on the survey results, contour maps of weathered thickness, depth to basement, apparent
resistivity contour maps (AB/2=25m, AB/2=100m, AB/2=200m), second layer resistivity and
third layer resistivity maps have been prepared.
3.5.1.1.3 Weathered thickness contour map
The weathered thickness map indicated that in 70% of the area, the depth to weathering is around
10m. In Ankasandra watershed area, in north east and eastern part of C.N.Halli taluk, the
weathered thickness varies between 30 and 40 m. The weathered thickness contour map is
shown in Fig. 3.16.
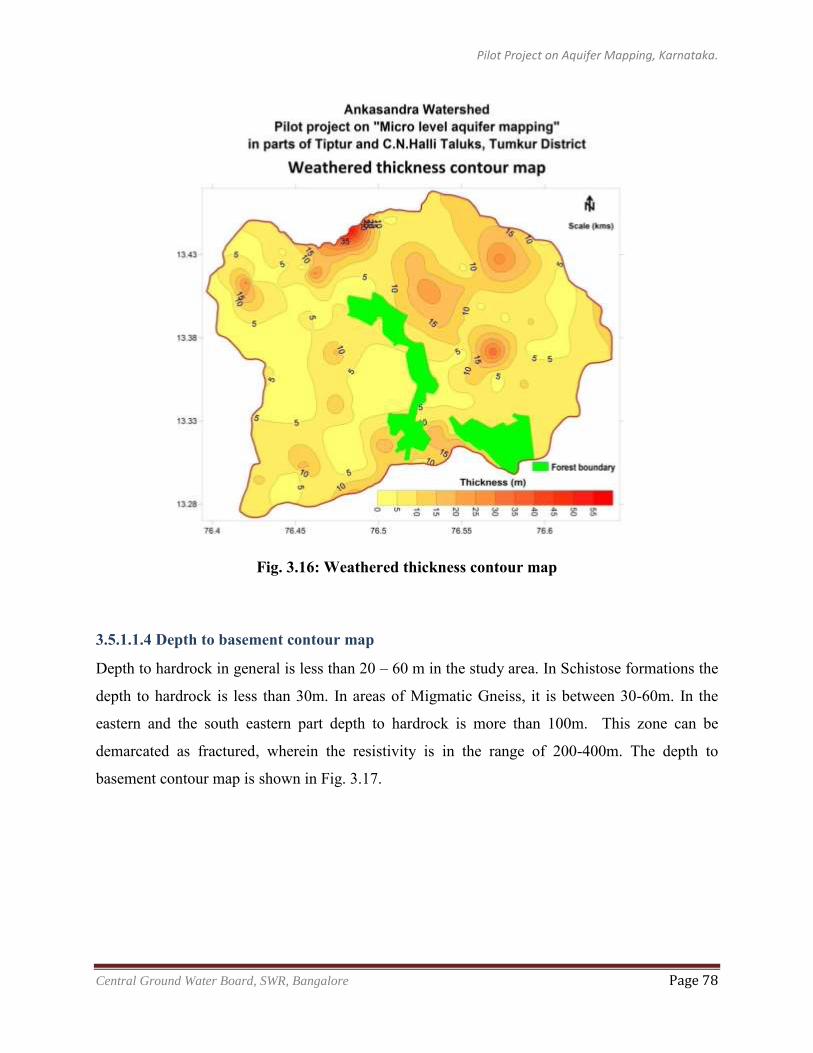
Pilot Project on Aquifer Mapping, Karnataka.
Central Ground Water Board, SWR, Bangalore Page 78
Fig. 3.16: Weathered thickness contour map
3.5.1.1.4 Depth to basement contour map
Depth to hardrock in general is less than 20 – 60 m in the study area. In Schistose formations the
depth to hardrock is less than 30m. In areas of Migmatic Gneiss, it is between 30-60m. In the
eastern and the south eastern part depth to hardrock is more than 100m. This zone can be
demarcated as fractured, wherein the resistivity is in the range of 200-400m. The depth to
basement contour map is shown in Fig. 3.17.
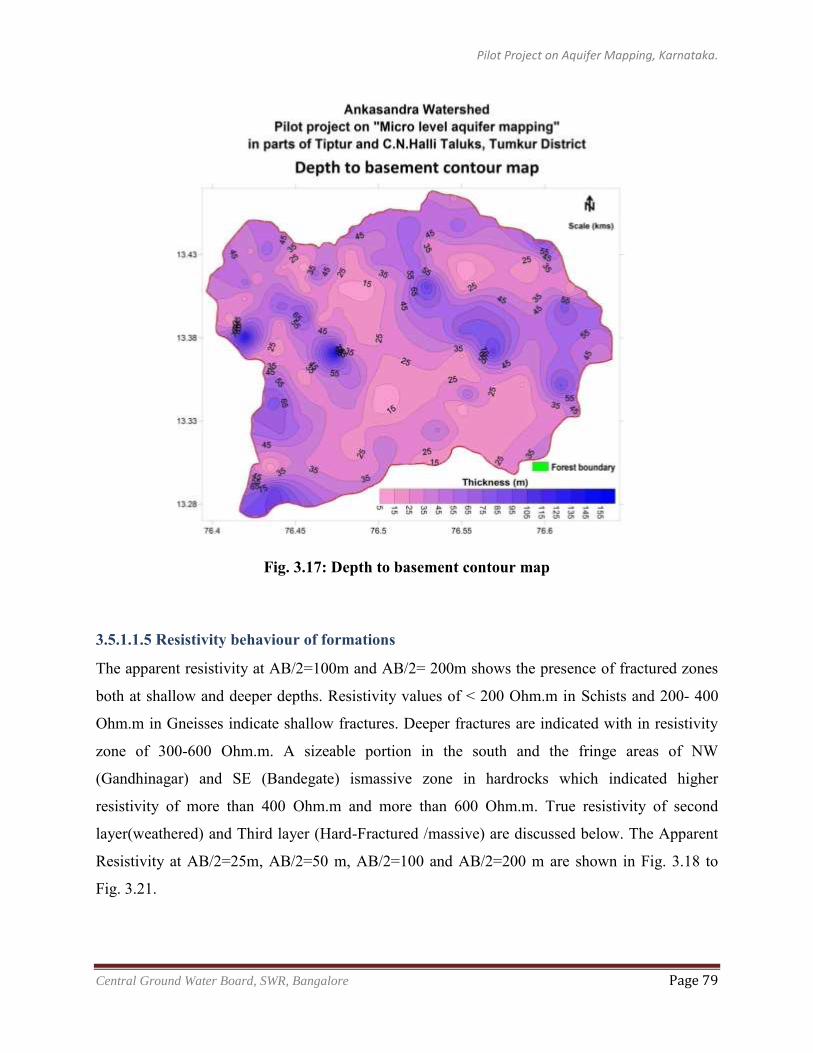
Pilot Project on Aquifer Mapping, Karnataka.
Central Ground Water Board, SWR, Bangalore Page 79
Fig. 3.17: Depth to basement contour map
3.5.1.1.5 Resistivity behaviour of formations
The apparent resistivity at AB/2=100m and AB/2= 200m shows the presence of fractured zones
both at shallow and deeper depths. Resistivity values of < 200 Ohm.m in Schists and 200- 400
Ohm.m in Gneisses indicate shallow fractures. Deeper fractures are indicated with in resistivity
zone of 300-600 Ohm.m. A sizeable portion in the south and the fringe areas of NW
(Gandhinagar) and SE (Bandegate) ismassive zone in hardrocks which indicated higher
resistivity of more than 400 Ohm.m and more than 600 Ohm.m. True resistivity of second
layer(weathered) and Third layer (Hard-Fractured /massive) are discussed below. The Apparent
Resistivity at AB/2=25m, AB/2=50 m, AB/2=100 and AB/2=200 m are shown in Fig. 3.18 to
Fig. 3.21.
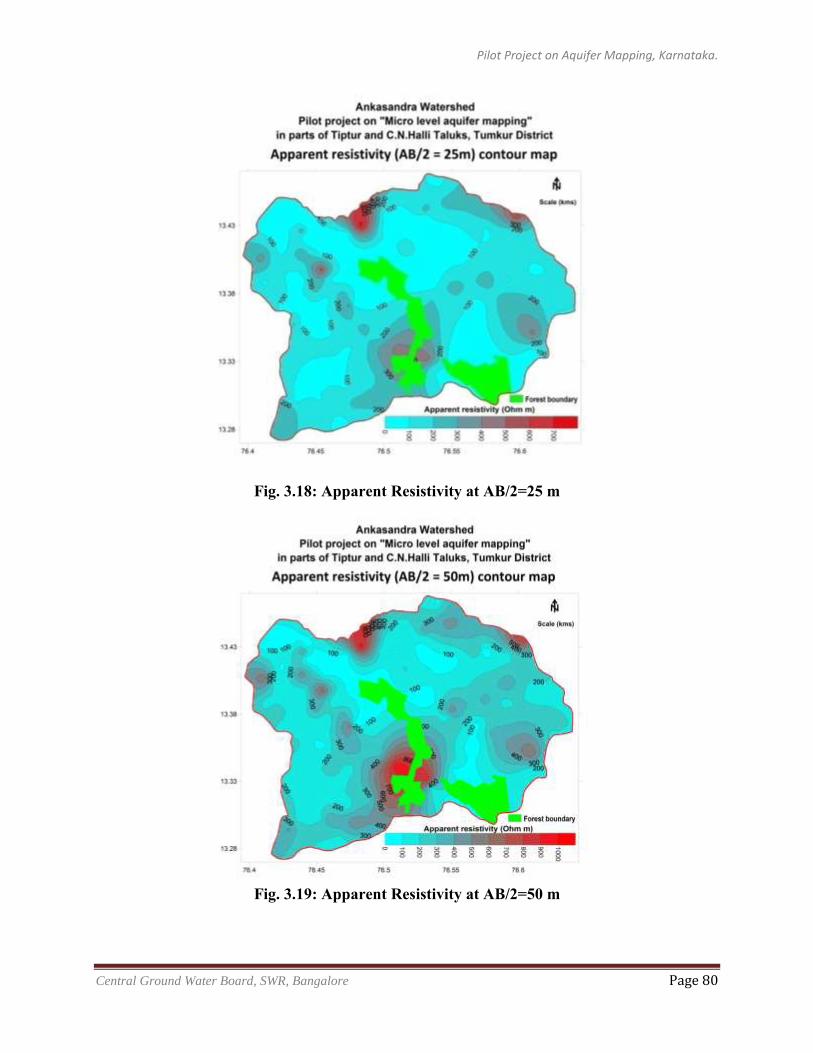
Pilot Project on Aquifer Mapping, Karnataka.
Central Ground Water Board, SWR, Bangalore Page 80
Fig. 3.18: Apparent Resistivity at AB/2=25 m
Fig. 3.19: Apparent Resistivity at AB/2=50 m
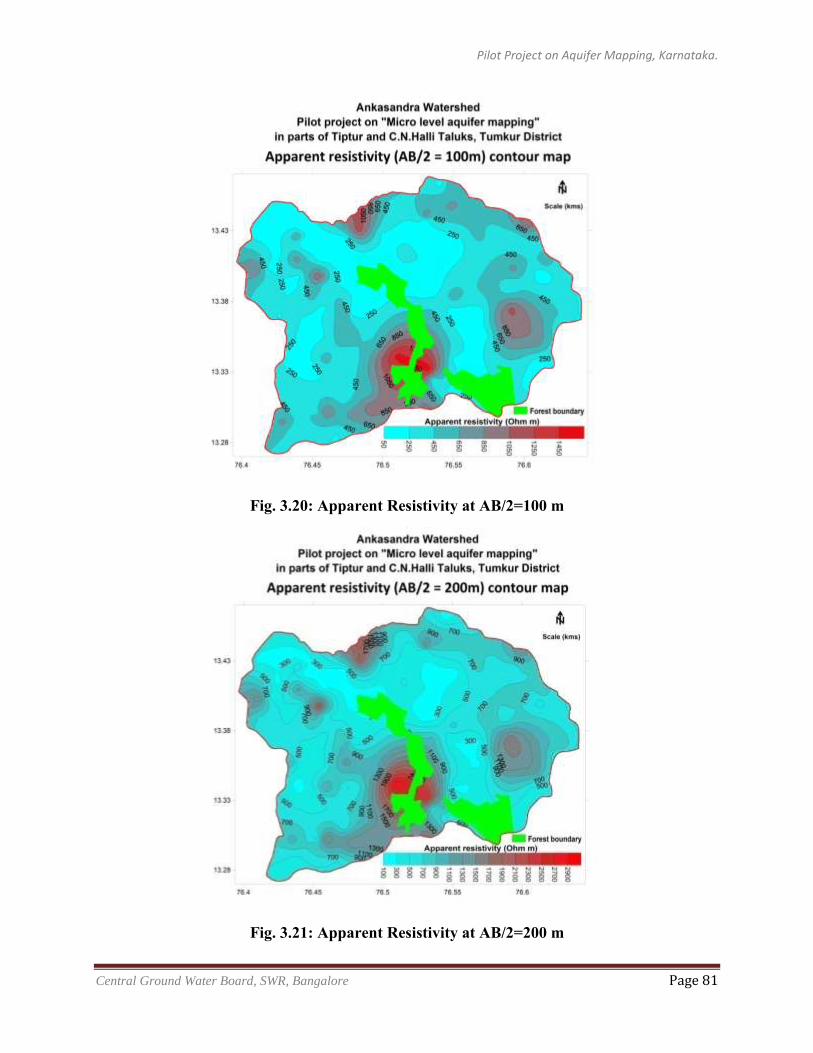
Pilot Project on Aquifer Mapping, Karnataka.
Central Ground Water Board, SWR, Bangalore Page 81
Fig. 3.20: Apparent Resistivity at AB/2=100 m
Fig. 3.21: Apparent Resistivity at AB/2=200 m
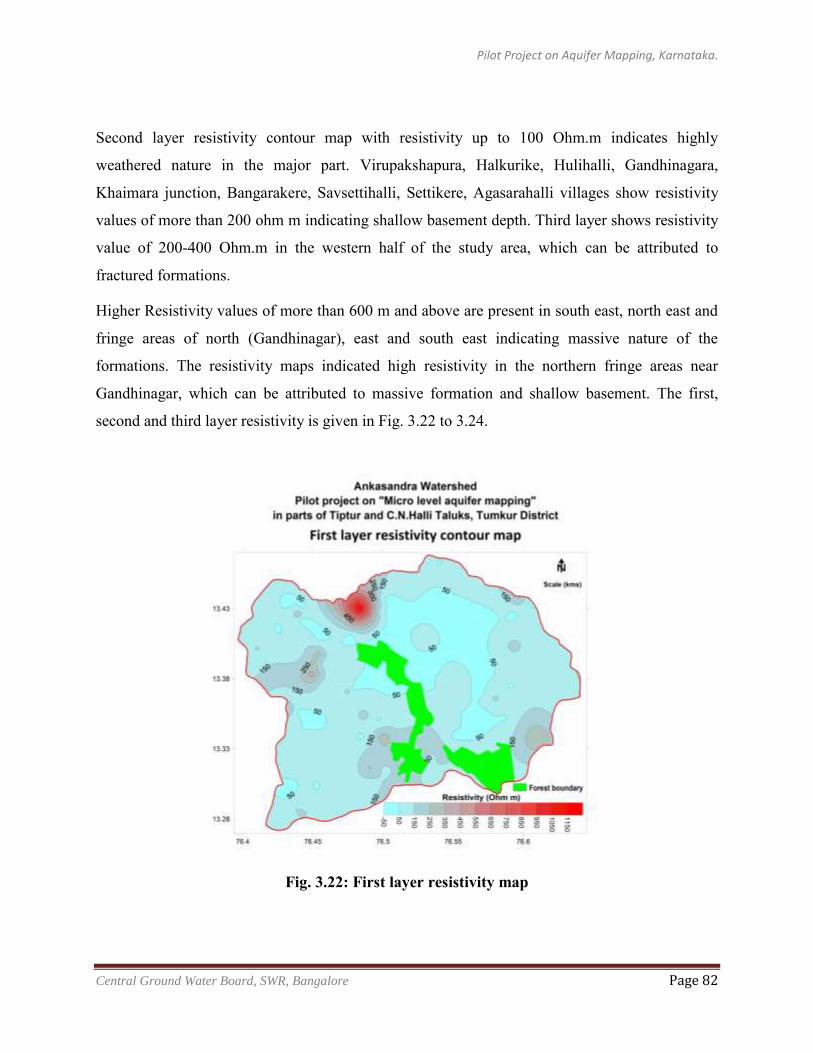
Pilot Project on Aquifer Mapping, Karnataka.
Central Ground Water Board, SWR, Bangalore Page 82
Second layer resistivity contour map with resistivity up to 100 Ohm.m indicates highly
weathered nature in the major part. Virupakshapura, Halkurike, Hulihalli, Gandhinagara,
Khaimara junction, Bangarakere, Savsettihalli, Settikere, Agasarahalli villages show resistivity
values of more than 200 ohm m indicating shallow basement depth. Third layer shows resistivity
value of 200-400 Ohm.m in the western half of the study area, which can be attributed to
fractured formations.
Higher Resistivity values of more than 600 m and above are present in south east, north east and
fringe areas of north (Gandhinagar), east and south east indicating massive nature of the
formations. The resistivity maps indicated high resistivity in the northern fringe areas near
Gandhinagar, which can be attributed to massive formation and shallow basement. The first,
second and third layer resistivity is given in Fig. 3.22 to 3.24.
Fig. 3.22: First layer resistivity map
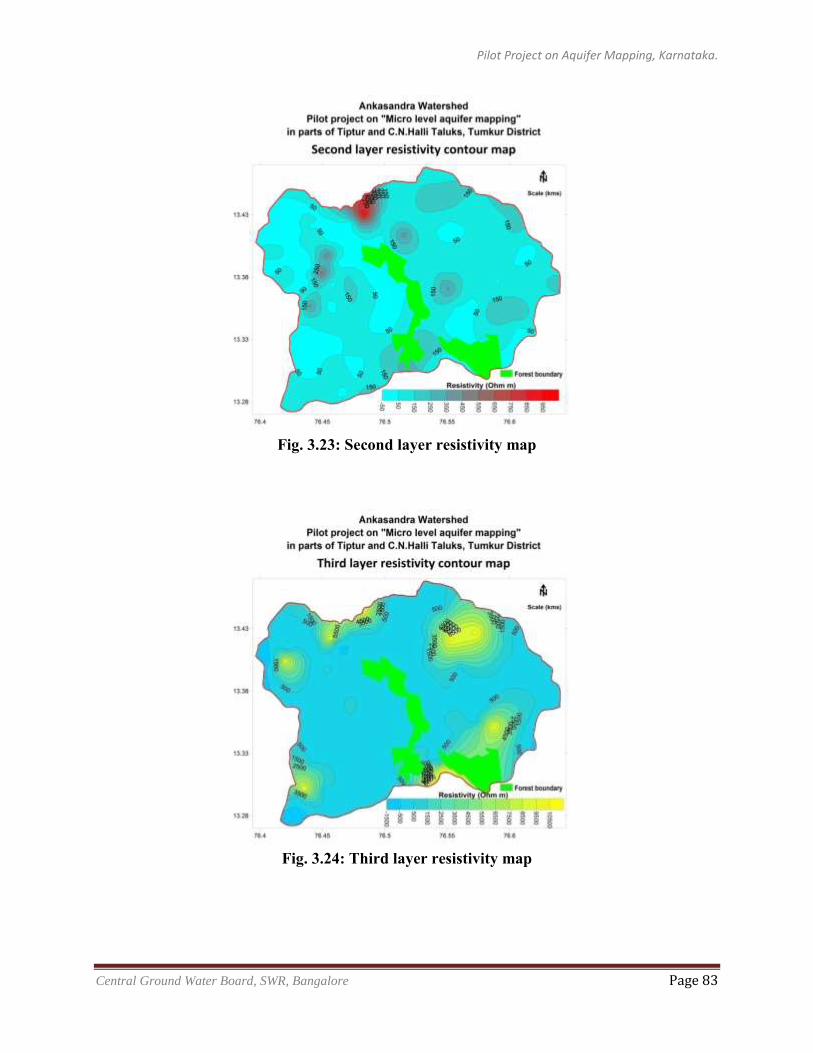
Pilot Project on Aquifer Mapping, Karnataka.
Central Ground Water Board, SWR, Bangalore Page 83
Fig. 3.23: Second layer resistivity map
Fig. 3.24: Third layer resistivity map
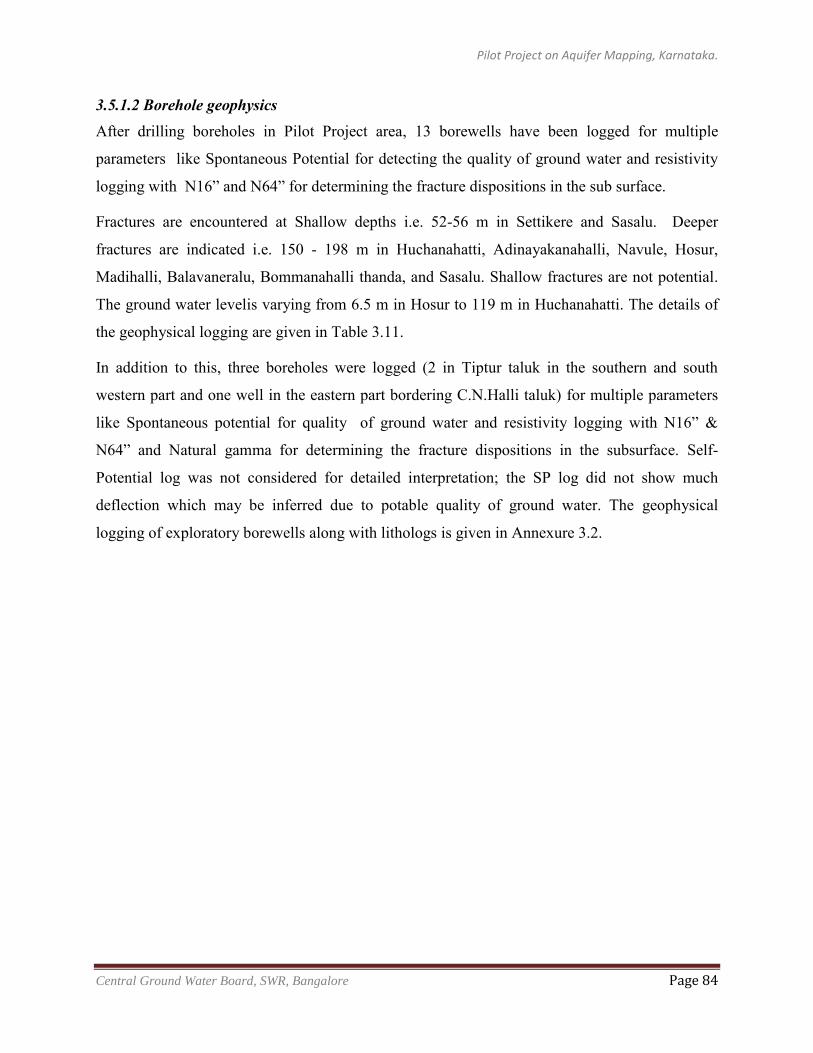
Pilot Project on Aquifer Mapping, Karnataka.
Central Ground Water Board, SWR, Bangalore Page 84
3.5.1.2 Borehole geophysics After drilling boreholes in Pilot Project area, 13 borewells have been logged for multiple
parameters like Spontaneous Potential for detecting the quality of ground water and resistivity
logging with N16” and N64” for determining the fracture dispositions in the sub surface.
Fractures are encountered at Shallow depths i.e. 52-56 m in Settikere and Sasalu. Deeper
fractures are indicated i.e. 150 - 198 m in Huchanahatti, Adinayakanahalli, Navule, Hosur,
Madihalli, Balavaneralu, Bommanahalli thanda, and Sasalu. Shallow fractures are not potential.
The ground water levelis varying from 6.5 m in Hosur to 119 m in Huchanahatti. The details of
the geophysical logging are given in Table 3.11.
In addition to this, three boreholes were logged (2 in Tiptur taluk in the southern and south
western part and one well in the eastern part bordering C.N.Halli taluk) for multiple parameters
like Spontaneous potential for quality of ground water and resistivity logging with N16” &
N64” and Natural gamma for determining the fracture dispositions in the subsurface. Self-
Potential log was not considered for detailed interpretation; the SP log did not show much
deflection which may be inferred due to potable quality of ground water. The geophysical
logging of exploratory borewells along with lithologs is given in Annexure 3.2.
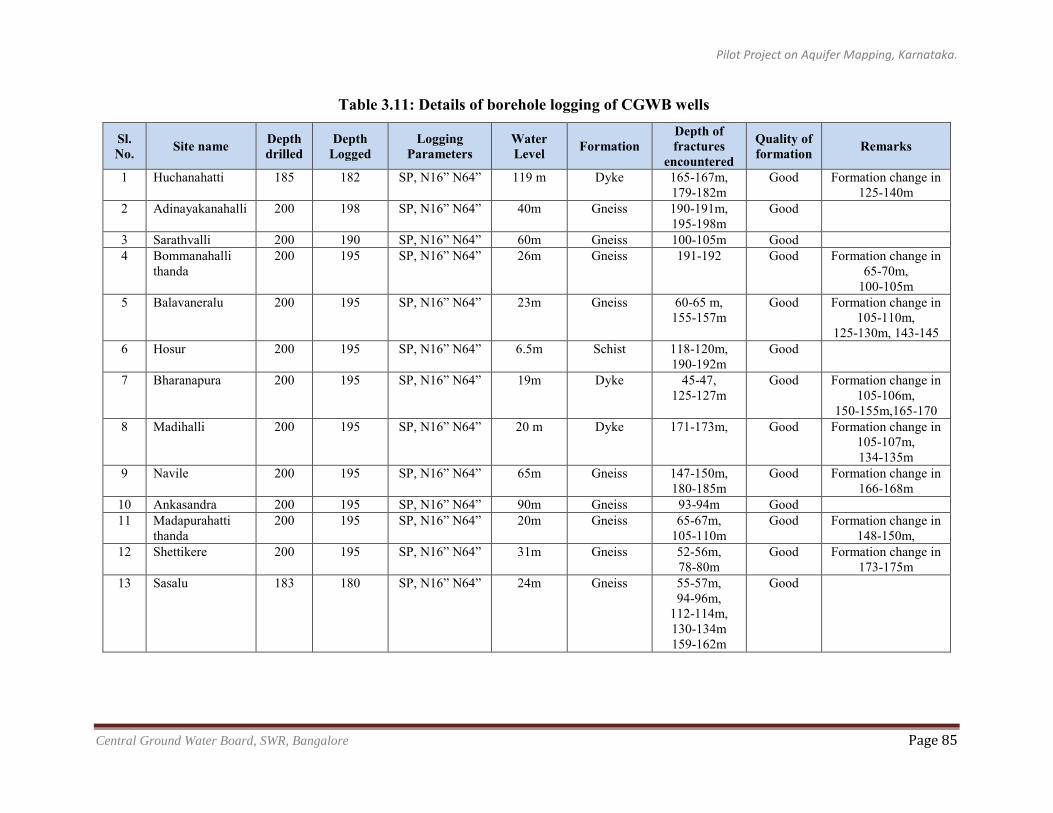
Pilot Project on Aquifer Mapping, Karnataka.
Central Ground Water Board, SWR, Bangalore Page 85
Table 3.11: Details of borehole logging of CGWB wells
Sl. No. Site name Depth
drilled Depth
Logged Logging
Parameters Water Level Formation
Depth of fractures
encountered
Quality of formation Remarks
1 Huchanahatti 185 182 SP, N16” N64” 119 m Dyke 165-167m, 179-182m
Good Formation change in 125-140m
2 Adinayakanahalli 200 198 SP, N16” N64” 40m Gneiss 190-191m, 195-198m
Good
3 Sarathvalli 200 190 SP, N16” N64” 60m Gneiss 100-105m Good 4 Bommanahalli
thanda 200 195 SP, N16” N64” 26m Gneiss 191-192 Good Formation change in
65-70m, 100-105m
5 Balavaneralu 200 195 SP, N16” N64” 23m Gneiss 60-65 m, 155-157m
Good Formation change in 105-110m,
125-130m, 143-145 6 Hosur 200 195 SP, N16” N64” 6.5m Schist 118-120m,
190-192m Good
7 Bharanapura 200 195 SP, N16” N64” 19m Dyke 45-47, 125-127m
Good Formation change in 105-106m,
150-155m,165-170 8 Madihalli 200 195 SP, N16” N64” 20 m Dyke 171-173m, Good Formation change in
105-107m, 134-135m
9 Navile 200 195 SP, N16” N64” 65m Gneiss 147-150m, 180-185m
Good Formation change in 166-168m
10 Ankasandra 200 195 SP, N16” N64” 90m Gneiss 93-94m Good 11 Madapurahatti
thanda 200 195 SP, N16” N64” 20m Gneiss 65-67m,
105-110m Good Formation change in
148-150m, 12 Shettikere 200 195 SP, N16” N64” 31m Gneiss 52-56m,
78-80m Good Formation change in
173-175m 13 Sasalu 183 180 SP, N16” N64” 24m Gneiss 55-57m,
94-96m, 112-114m, 130-134m 159-162m
Good
Pilot Project on Aquifer Mapping, Karnataka.
Central Ground Water Board, SWR, Bangalore Page 86
a) Huchanahatti:
Bore hole logged up to 182 m with the parameters of SP, N16” and N64”. Two major fractures
are encountered in the depth range of 165—167 m bgl (resistivity ranges between 80- 200 ohm
m in N64” and 500-700 ohm m in N16”) and 179-182 m bgl (resistivity ranges between 240- 360
ohm m in N64” and 860-900 ohm m in N16”). Electrical log is matching with the litholog. Depth
to ground water level is deep i.e.119 m bgl in this site. Formation change is observed in the
depth range of 140 m bgl onwards based on the resistivity behaviour.
b) Adinayakanahalli:
Bore hole is logged up to a depth of 198 m with the parameters of SP, N16” and N64”. Two
fractures are observed at the depth of 75-77 m bgl (resistivity ranges between 40- 200 ohm m)
190-191 m bgl (resistivity ranges between 220- 280 ohm m). Formation is Gneiss and depth to
ground water levelis 40 m bgl.
c) Sarathavalli:
Bore hole is logged up to 190 m with the parameters of SP, N16” and N64”. Only one fracture
is encountered in this site at the depth of 98-104m bgl (Resistivity ranges between 120-360 ohm
m). Formation is Gneiss and depth to ground water levelis 60 m bgl.
d) Bommanahallithanda:
Bore hole is logged up to 195 m with the parameters of SP, N16” and N64”. Fractures are
observed in the depth range of 66-68,( resistivity ranges between 240- 300 ohm m in N64” and
400-520 ohm m in N16”), 88-90 m bgl (resistivity ranges between 50- 500 ohm m in N64” and
560-760 ohm m in N16”), 98-102 m bgl (resistivity ranges between 160- 200 ohm m in N64”
and 360-400 ohm m in N16”), 188-190 m bgl (resistivity ranges between 200- 400 ohm m in
N64” and 380-500 ohm m in N16”) . Formation is Gneiss and depth to ground water levelis 26
m bgl.
e) Baluvanerlu:
Bore hole is logged up to 195 m with the parameters of SP, N16” and N64”. Two fractures are
observed at the depth range of 60-65 m bgl (resistivity ranges between 50- 160 ohm m in
N64” and 280-440 ohm m in N16”), 108-110 m bgl (resistivity ranges between 200- 240 ohm m
Pilot Project on Aquifer Mapping, Karnataka.
Central Ground Water Board, SWR, Bangalore Page 87
in N64” and 400-440 ohm m in N16”), 125-126 m bgl (resistivity ranges between 40- 200 ohm
m in N64” and 1060-1160 ohm m in N16”)and 155-157 m bgl (resistivity ranges between 240-
320 ohm m in N64” and 860-1360 ohm m in N16”). Formation is Gneiss and depth to ground
water levelis 23 m bgl.
f) Hosur:
Bore hole is logged up to 195 m with the parameters of SP, N16” and N64”. Two fractures are
encountered in this site at the depth of 119-120 m bgl (resistivity ranges between 560- 620 ohm
m in N64” and 1280-1450 ohm m in N16”) and 195-196 m bgl (resistivity ranges between 560-
640 ohm m in N64” and 1100-1600 ohm m in N16”). Formation is Schist and depth to ground
water level is very shallow i.e. 6.5 m bgl.
g) Bharanapura:
Bore hole is logged up to 195 m with the parameters of SP, N16” and N64”. Two fractures are
encountered in this site at the depth of 45-47 m bgl (resistivity ranges between 1400- 1480 ohm
m in N64” and 2200-2280 ohm m in N16”), 73-75 m bgl (resistivity ranges between 400- 1200
ohm m in N64” and 200-400 ohm m in N16”), 105-106 m bgl (resistivity ranges between 360-
1200 ohm m in N64” and 1800-2000 ohm m in N16”) and 125-127 m bgl (resistivity ranges
between 1200- 1840 ohm m in N64” and 1800-2080 ohm m in N16”). Formation is Dyke and
depth to ground water levelis 19 m bgl.
h) Madhihalli:
Bore hole is logged up to 195 m with the parameters of SP, N16” and N64”. Only one fracture is
encountered in this site at the depth of 171-173 m bgl (resistivity ranges between 100- 120 ohm
m in N64” and 120-200 ohm m in N16”). The formation change is observed between Dyke and
Gneiss with lowering of resistivity in the depth range of 107-108 to 134-136 m bgl. Depth to
ground water levelis 20 m bgl.
i) Navule:
Bore hole is logged in this site up to 195 m with the parameters of SP, N16” and N64”. Only one
fracture is encountered in this site at the depth between 183-185 m bgl (resistivity ranges
between 122- 160 ohm m in N64” and 240- 400 ohm m in N16”). The formation is Gneiss and
depth to ground water levelis 65 m bgl.
Pilot Project on Aquifer Mapping, Karnataka.
Central Ground Water Board, SWR, Bangalore Page 88
j) Ankasandra:
Bore hole is logged up to 195 m with the parameters of SP, N16” and N64”. Only one fracture
is encountered in this site at the depth of 93-94 m bgl. Formation is Gneiss and depth to ground
water levelis 65 m bgl.
k) Madapurahattithanda:
Bore hole is logged in this site up to 195 m with the parameters of SP, N16” and N64”.
Formation change is observed as lowering of resistivity in the depth of 65- 67 m bgl & 102 – 105
m bgl. Fractures are observed between the depth range of 158-160 m bgl (resistivity ranges
between 100- 120 ohm m in N64” and 400-780 ohm m in N16”) and 174-176 m bgl (resistivity
ranges between 40- 140 ohm m in N64” and 500-600 ohm m in N16”). The formation is Gneiss
and depth to ground water level is 20 m bgl.
l) Settikere:
Bore hole is logged up to 195 m with the parameters of SP, N16” and N64”. Two fractures are
encountered in this site at the depth of 52-56 m bgl (resistivity ranges between 200- 400 ohm m
in N64” and 440-500 ohm m in N16”) and 78-80 m bgl (resistivity ranges between 100- 240 ohm
m in N64” and 400-500 ohm m in N16”). The formation is Gneiss and depth to ground water
levelis 31 m bgl.
k) Sasalu:
Bore hole is logged up to 180 m with the parameters of SP, N16” and N64”. Five fractures are
encountered in this site at the depth of 55-57 m bgl (resistivity ranges between 1300- 1700 ohm
m in N64” and 1240-1280 ohm m in N16”), 94-96 m bgl (resistivity ranges between 700- 1200
ohm m in N64” and 1280-1760 ohm m in N16”), 112-114 m bgl (resistivity ranges between 840-
1640 ohm m in N64” and 1200-2720 ohm m in N16”), 130-134 m bgl (resistivity ranges between
500- 700 ohm m in N64” and 900-1140 ohm m in N16”), 159-162 m bgl (resistivity ranges
between 700- 2300 ohm m in N64” and 1600-2000 ohm m in N16”) and 172-173, m bgl
(resistivity ranges between 1440- 2560 ohm m in N64” and 1280-2400 ohm m in N16”)
Formation is Gneiss and depth to ground water levelis 24 m bgl.
Pilot Project on Aquifer Mapping, Karnataka.
Central Ground Water Board, SWR, Bangalore Page 89
l) Khaimara Junction:
Two highly fractured zones from 67-72 and 76-80 m bgl were observed. In the gamma log, two
distinct zones of gamma counts were observed viz., from 10-70 m bgl – high gamma count and
generally less gamma count from 70-135 m bgl.
m) Manakikere:
It is observed that, natural gamma indicated high counts in the fractured zone. Also, between
depths of 65-108, which is reflected as massive/hard formation in the resistivity log, has been
depicted as low gamma counts in general with minor kinks in between indicating minor fractures
in that depth range.
n) Timmarayanahalli:
In normal resistivity log, greater variation of resistivity is observed below 115m. Similarly,
Natural gamma log also indicated grater variation in gamma counts (low as 60 to>350) below
145m depth, which may be attributed to highly disturbed formation at depth. The S.P. log
indicated clear development below 90m with positive deflection against low resistivity zones
reflected in Normal resistivity log. Logging indicated shallow weathered zone at Khaimara
junction in C.N.Halli taluk and deeper weathered zone up to 33m in Manakikere and
Timmarayanahalli. The fractures are more frequent up to depth of 90 m in all the wells and
deeper fractures are encountered in Manakikere and Timmarayanahalli at 113-125 m and 172-
176 m respectively. Natural gamma log indicated high gamma counts against resistivity lows at
fractured zones. Also, distinct behaviour of resistivity and gamma counts were observed where
greater variations of values were indicated.
3.5.1.3 Conclusion and correlation Results have revealed the lateral and vertical extent of weathered zone, depth to hardrock,
fractured formations and massive formations, which were demarcated based on distinct
geophysical signatures. Borehole logging indicated disposition of fractured formations,
especially, the natural gamma logging which showed high gamma counts against fractured
zones. Indication of fractured zones in the western half of the study area from resistivity
behaviour and deeper fractures indicated from logging at Manakikere and Timmarayanahalli are
well correlated with hydrogeological features such as lineaments and intrusions in the western
part of the study area.
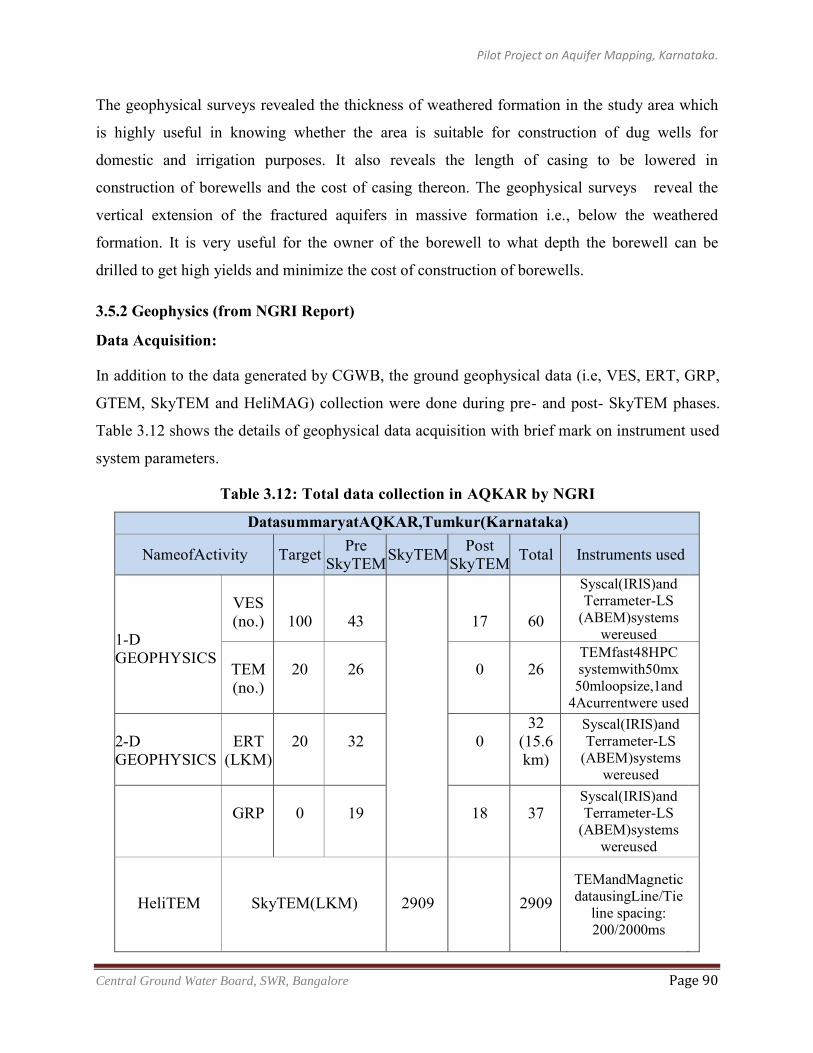
Pilot Project on Aquifer Mapping, Karnataka.
Central Ground Water Board, SWR, Bangalore Page 90
The geophysical surveys revealed the thickness of weathered formation in the study area which
is highly useful in knowing whether the area is suitable for construction of dug wells for
domestic and irrigation purposes. It also reveals the length of casing to be lowered in
construction of borewells and the cost of casing thereon. The geophysical surveys reveal the
vertical extension of the fractured aquifers in massive formation i.e., below the weathered
formation. It is very useful for the owner of the borewell to what depth the borewell can be
drilled to get high yields and minimize the cost of construction of borewells.
3.5.2 Geophysics (from NGRI Report)
Data Acquisition:
In addition to the data generated by CGWB, the ground geophysical data (i.e, VES, ERT, GRP,
GTEM, SkyTEM and HeliMAG) collection were done during pre- and post- SkyTEM phases.
Table 3.12 shows the details of geophysical data acquisition with brief mark on instrument used
system parameters.
Table 3.12: Total data collection in AQKAR by NGRI
DatasummaryatAQKAR,Tumkur(Karnataka)
NameofActivity Target Pre SkyTEM SkyTEM Post
SkyTEM Total Instruments used
1-D GEOPHYSICS
VES (no.)
100
43
17
60
Syscal(IRIS)and Terrameter-LS
(ABEM)systems wereused
TEM (no.)
20
26
0
26
TEMfast48HPC systemwith50mx 50mloopsize,1and
4Acurrentwere used
2-D GEOPHYSICS
ERT
(LKM)
20
32
0
32 (15.6 km)
Syscal(IRIS)and Terrameter-LS
(ABEM)systems wereused
GRP
0
19
18
37
Syscal(IRIS)and Terrameter-LS
(ABEM)systems wereused
HeliTEM
SkyTEM(LKM)
2909
2909
TEMandMagnetic datausingLine/Tie
line spacing: 200/2000ms
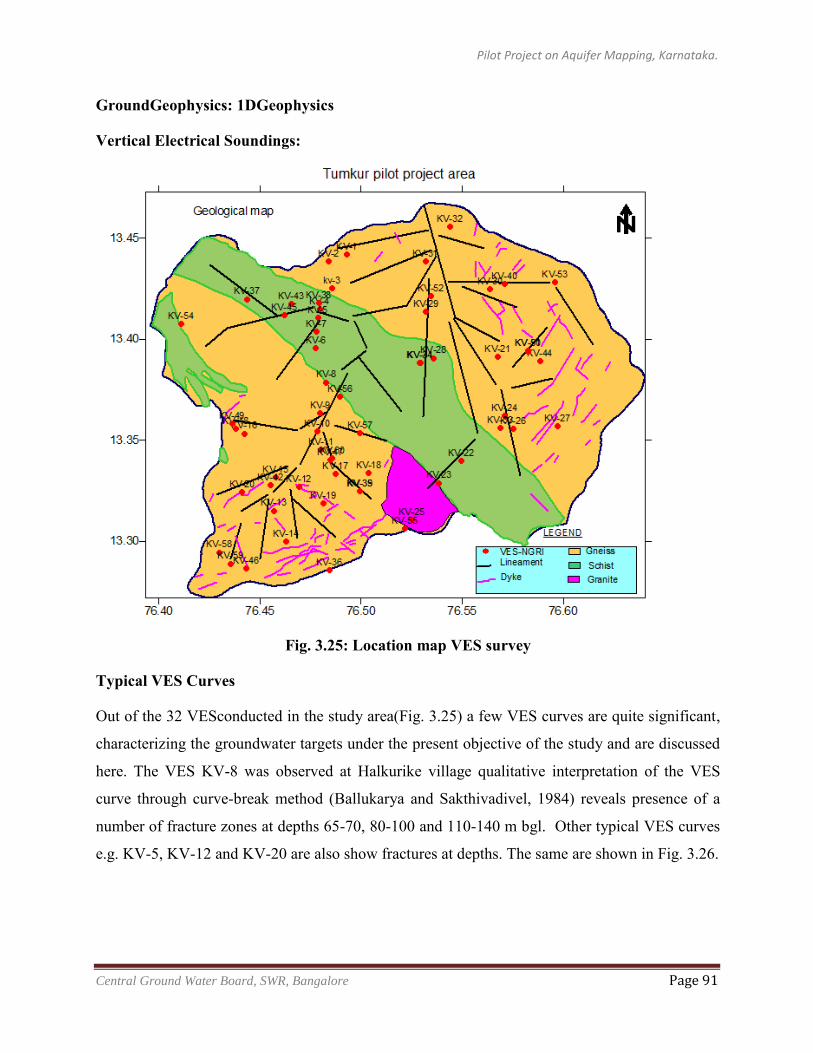
Pilot Project on Aquifer Mapping, Karnataka.
Central Ground Water Board, SWR, Bangalore Page 91
GroundGeophysics: 1DGeophysics
Vertical Electrical Soundings:
Fig. 3.25: Location map VES survey
Typical VES Curves
Out of the 32 VESconducted in the study area(Fig. 3.25) a few VES curves are quite significant,
characterizing the groundwater targets under the present objective of the study and are discussed
here. The VES KV-8 was observed at Halkurike village qualitative interpretation of the VES
curve through curve-break method (Ballukarya and Sakthivadivel, 1984) reveals presence of a
number of fracture zones at depths 65-70, 80-100 and 110-140 m bgl. Other typical VES curves
e.g. KV-5, KV-12 and KV-20 are also show fractures at depths. The same are shown in Fig. 3.26.
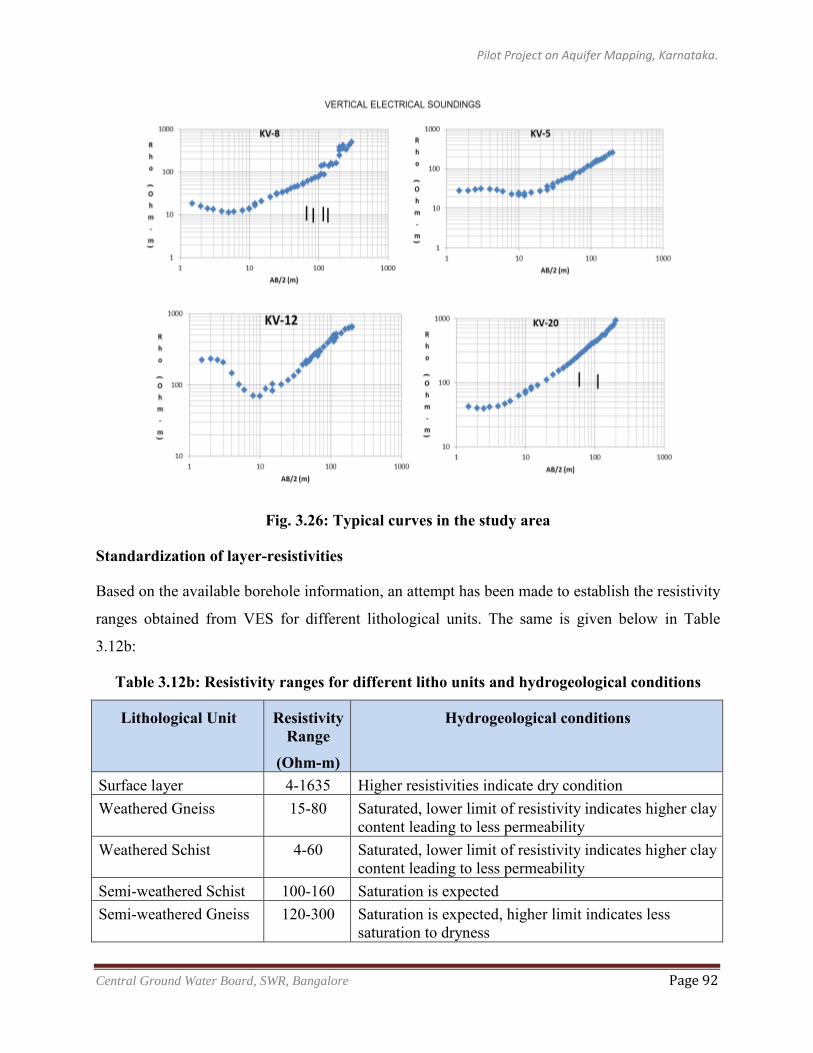
Pilot Project on Aquifer Mapping, Karnataka.
Central Ground Water Board, SWR, Bangalore Page 92
Fig. 3.26: Typical curves in the study area
Standardization of layer-resistivities
Based on the available borehole information, an attempt has been made to establish the resistivity
ranges obtained from VES for different lithological units. The same is given below in Table
3.12b:
Table 3.12b: Resistivity ranges for different litho units and hydrogeological conditions
Lithological Unit Resistivity Range
(Ohm-m)
Hydrogeological conditions
Surface layer 4-1635 Higher resistivities indicate dry condition Weathered Gneiss 15-80 Saturated, lower limit of resistivity indicates higher clay
content leading to less permeability Weathered Schist 4-60 Saturated, lower limit of resistivity indicates higher clay
content leading to less permeability Semi-weathered Schist 100-160 Saturation is expected Semi-weathered Gneiss 120-300 Saturation is expected, higher limit indicates less
saturation to dryness
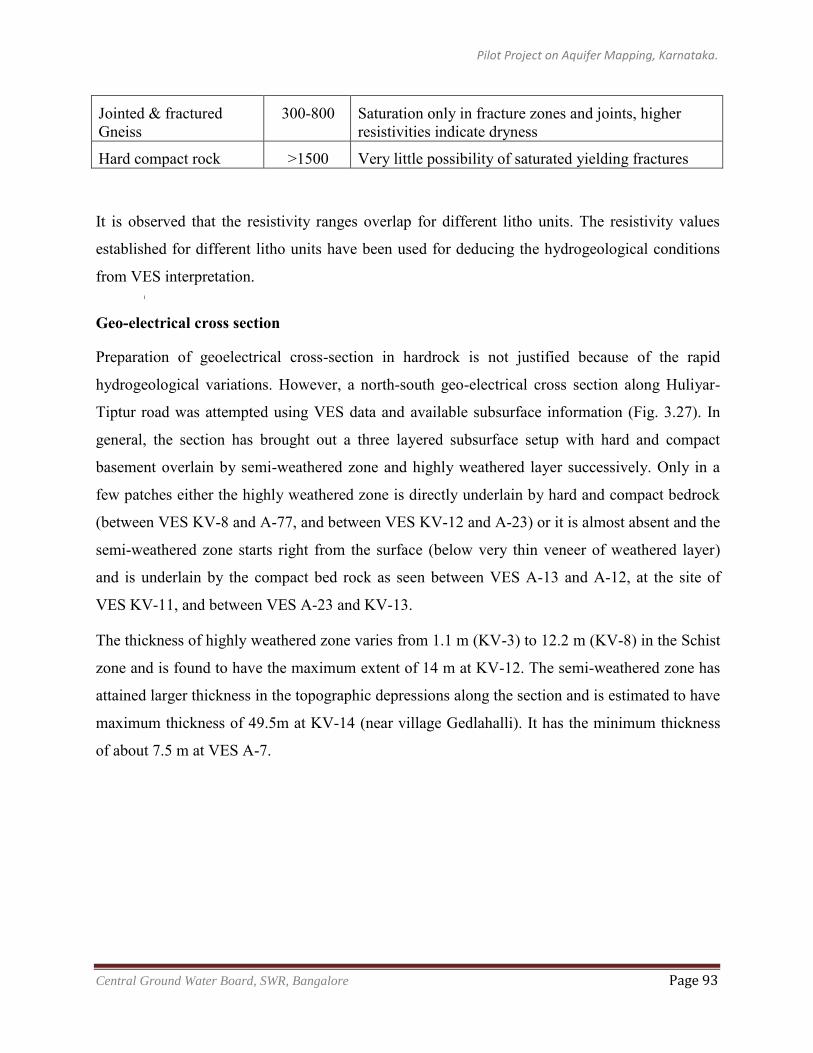
Pilot Project on Aquifer Mapping, Karnataka.
Central Ground Water Board, SWR, Bangalore Page 93
Jointed & fractured Gneiss
300-800 Saturation only in fracture zones and joints, higher resistivities indicate dryness
Hard compact rock >1500 Very little possibility of saturated yielding fractures
It is observed that the resistivity ranges overlap for different litho units. The resistivity values
established for different litho units have been used for deducing the hydrogeological conditions
from VES interpretation. [
Geo-electrical cross section
Preparation of geoelectrical cross-section in hardrock is not justified because of the rapid
hydrogeological variations. However, a north-south geo-electrical cross section along Huliyar-
Tiptur road was attempted using VES data and available subsurface information (Fig. 3.27). In
general, the section has brought out a three layered subsurface setup with hard and compact
basement overlain by semi-weathered zone and highly weathered layer successively. Only in a
few patches either the highly weathered zone is directly underlain by hard and compact bedrock
(between VES KV-8 and A-77, and between VES KV-12 and A-23) or it is almost absent and the
semi-weathered zone starts right from the surface (below very thin veneer of weathered layer)
and is underlain by the compact bed rock as seen between VES A-13 and A-12, at the site of
VES KV-11, and between VES A-23 and KV-13.
The thickness of highly weathered zone varies from 1.1 m (KV-3) to 12.2 m (KV-8) in the Schist
zone and is found to have the maximum extent of 14 m at KV-12. The semi-weathered zone has
attained larger thickness in the topographic depressions along the section and is estimated to have
maximum thickness of 49.5m at KV-14 (near village Gedlahalli). It has the minimum thickness
of about 7.5 m at VES A-7.
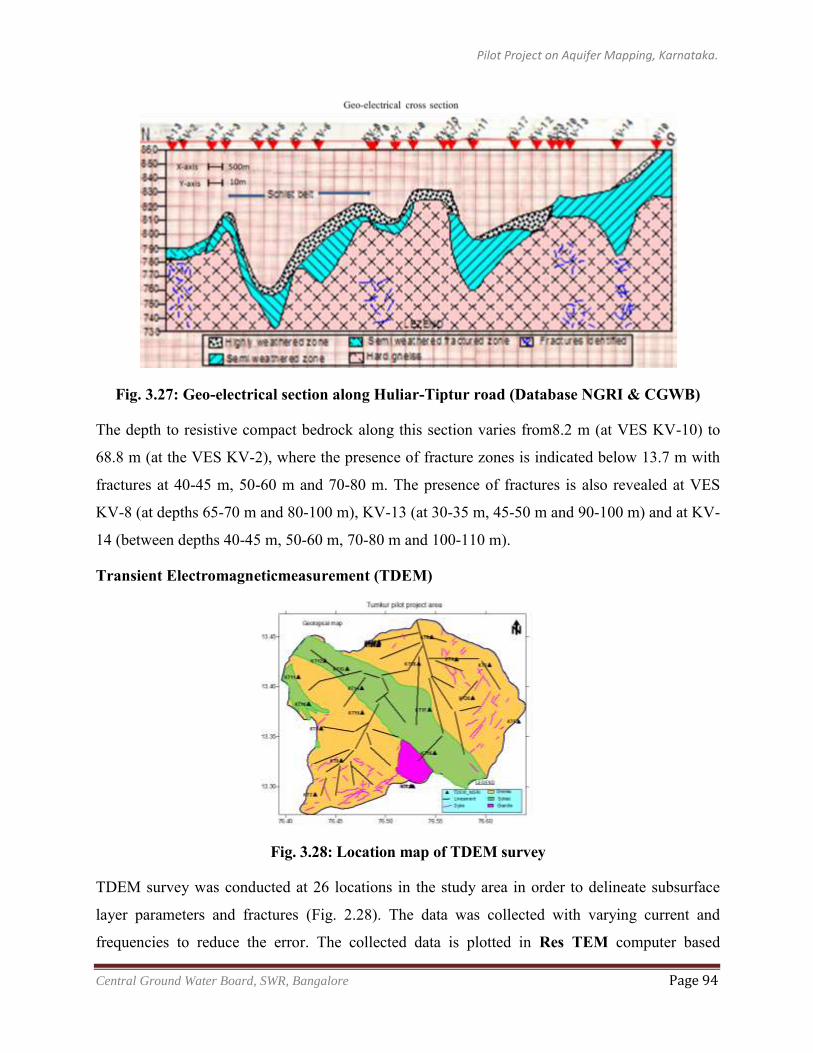
Pilot Project on Aquifer Mapping, Karnataka.
Central Ground Water Board, SWR, Bangalore Page 94
Fig. 3.27: Geo-electrical section along Huliar-Tiptur road (Database NGRI & CGWB)
The depth to resistive compact bedrock along this section varies from8.2 m (at VES KV-10) to
68.8 m (at the VES KV-2), where the presence of fracture zones is indicated below 13.7 m with
fractures at 40-45 m, 50-60 m and 70-80 m. The presence of fractures is also revealed at VES
KV-8 (at depths 65-70 m and 80-100 m), KV-13 (at 30-35 m, 45-50 m and 90-100 m) and at KV-
14 (between depths 40-45 m, 50-60 m, 70-80 m and 100-110 m).
Transient Electromagneticmeasurement (TDEM)
Fig. 3.28: Location map of TDEM survey
TDEM survey was conducted at 26 locations in the study area in order to delineate subsurface
layer parameters and fractures (Fig. 2.28). The data was collected with varying current and
frequencies to reduce the error. The collected data is plotted in Res TEM computer based
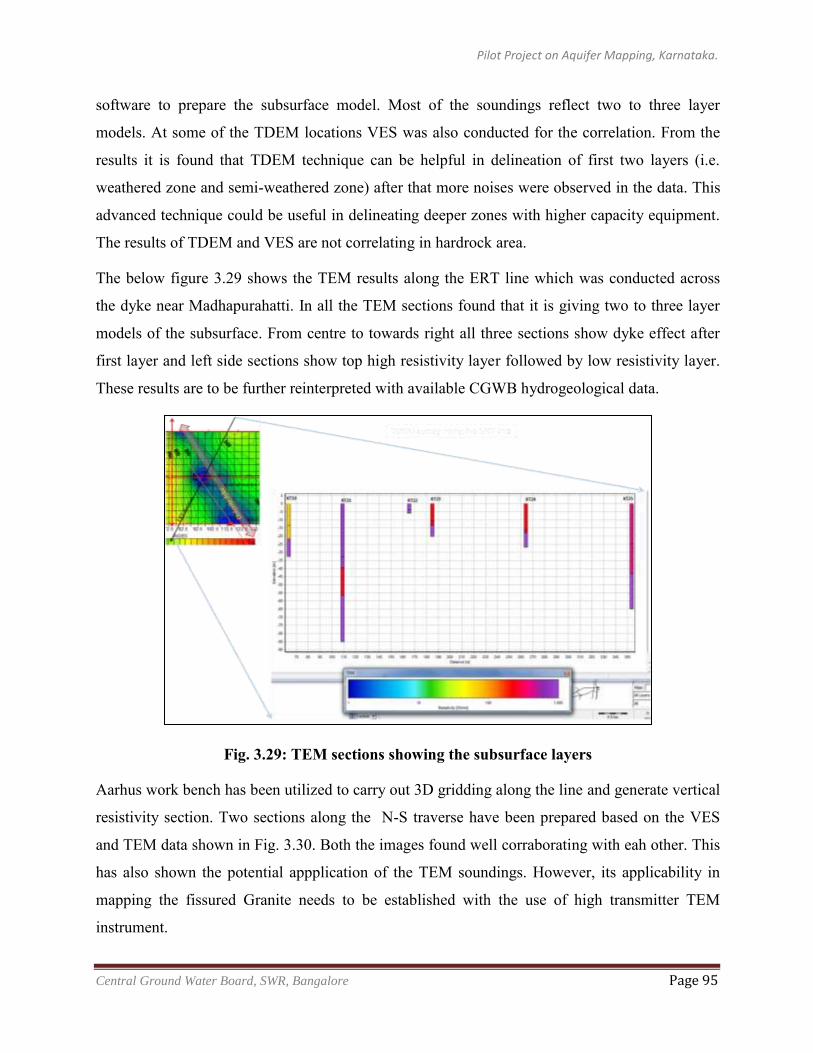
Pilot Project on Aquifer Mapping, Karnataka.
Central Ground Water Board, SWR, Bangalore Page 95
software to prepare the subsurface model. Most of the soundings reflect two to three layer
models. At some of the TDEM locations VES was also conducted for the correlation. From the
results it is found that TDEM technique can be helpful in delineation of first two layers (i.e.
weathered zone and semi-weathered zone) after that more noises were observed in the data. This
advanced technique could be useful in delineating deeper zones with higher capacity equipment.
The results of TDEM and VES are not correlating in hardrock area.
The below figure 3.29 shows the TEM results along the ERT line which was conducted across
the dyke near Madhapurahatti. In all the TEM sections found that it is giving two to three layer
models of the subsurface. From centre to towards right all three sections show dyke effect after
first layer and left side sections show top high resistivity layer followed by low resistivity layer.
These results are to be further reinterpreted with available CGWB hydrogeological data.
Fig. 3.29: TEM sections showing the subsurface layers
Aarhus work bench has been utilized to carry out 3D gridding along the line and generate vertical
resistivity section. Two sections along the N-S traverse have been prepared based on the VES
and TEM data shown in Fig. 3.30. Both the images found well corraborating with eah other. This
has also shown the potential appplication of the TEM soundings. However, its applicability in
mapping the fissured Granite needs to be established with the use of high transmitter TEM
instrument.
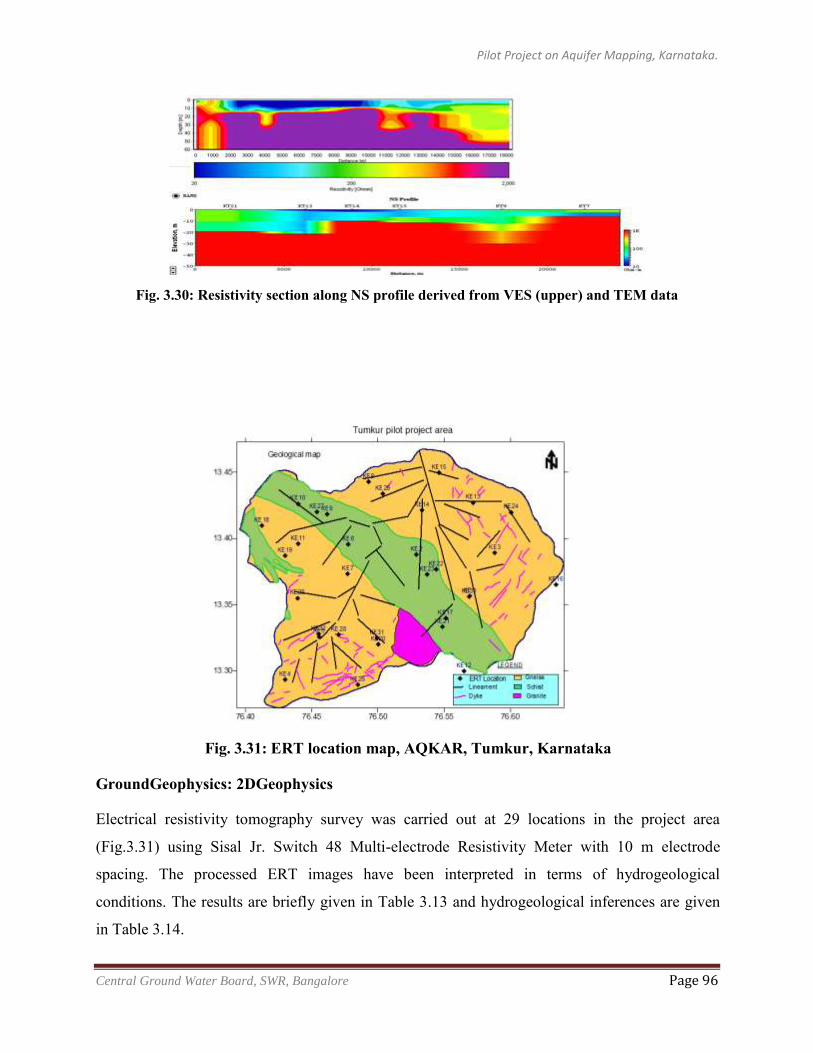
Pilot Project on Aquifer Mapping, Karnataka.
Central Ground Water Board, SWR, Bangalore Page 96
Fig. 3.30: Resistivity section along NS profile derived from VES (upper) and TEM data
Fig. 3.31: ERT location map, AQKAR, Tumkur, Karnataka
GroundGeophysics: 2DGeophysics
Electrical resistivity tomography survey was carried out at 29 locations in the project area
(Fig.3.31) using Sisal Jr. Switch 48 Multi-electrode Resistivity Meter with 10 m electrode
spacing. The processed ERT images have been interpreted in terms of hydrogeological
conditions. The results are briefly given in Table 3.13 and hydrogeological inferences are given
in Table 3.14.
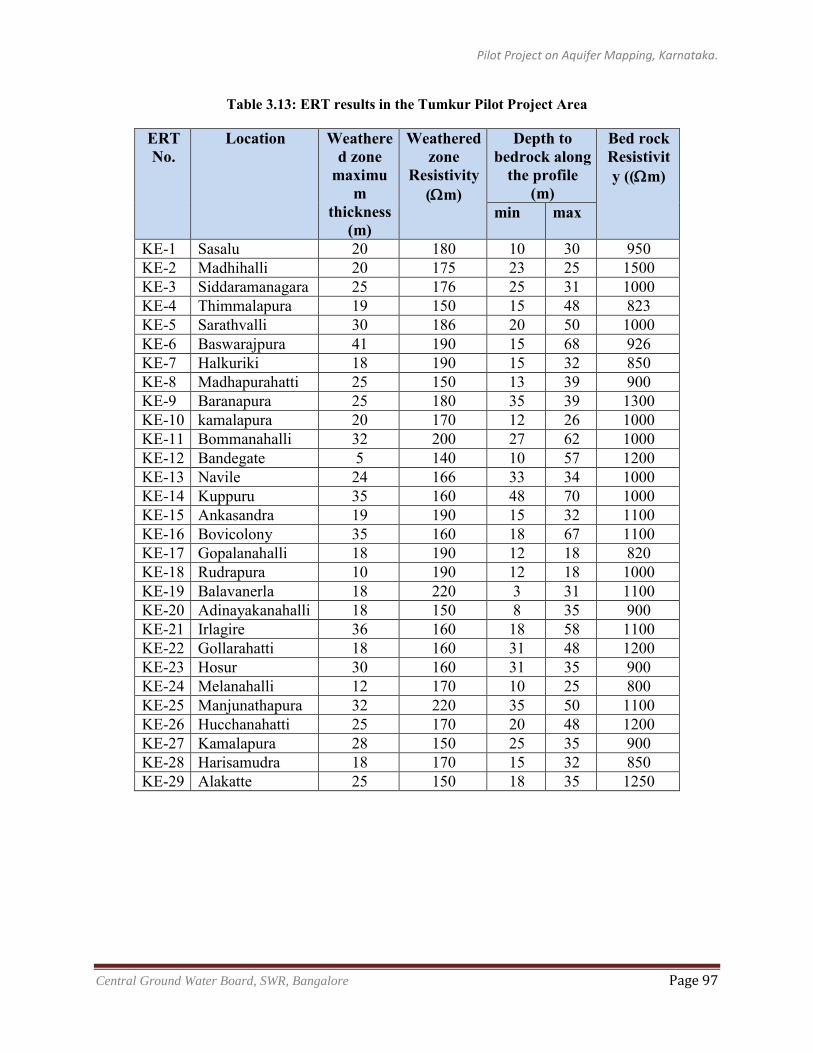
Pilot Project on Aquifer Mapping, Karnataka.
Central Ground Water Board, SWR, Bangalore Page 97
Table 3.13: ERT results in the Tumkur Pilot Project Area
ERT No.
Location Weathered zone
maximum
thickness (m)
Weathered zone
Resistivity (m)
Depth to bedrock along
the profile (m)
Bed rock Resistivity ((m)
min max
KE-1 Sasalu 20 180 10 30 950 KE-2 Madhihalli 20 175 23 25 1500 KE-3 Siddaramanagara 25 176 25 31 1000 KE-4 Thimmalapura 19 150 15 48 823 KE-5 Sarathvalli 30 186 20 50 1000 KE-6 Baswarajpura 41 190 15 68 926 KE-7 Halkuriki 18 190 15 32 850 KE-8 Madhapurahatti 25 150 13 39 900 KE-9 Baranapura 25 180 35 39 1300 KE-10 kamalapura 20 170 12 26 1000 KE-11 Bommanahalli 32 200 27 62 1000 KE-12 Bandegate 5 140 10 57 1200 KE-13 Navile 24 166 33 34 1000 KE-14 Kuppuru 35 160 48 70 1000 KE-15 Ankasandra 19 190 15 32 1100 KE-16 Bovicolony 35 160 18 67 1100 KE-17 Gopalanahalli 18 190 12 18 820 KE-18 Rudrapura 10 190 12 18 1000 KE-19 Balavanerla 18 220 3 31 1100 KE-20 Adinayakanahalli 18 150 8 35 900 KE-21 Irlagire 36 160 18 58 1100 KE-22 Gollarahatti 18 160 31 48 1200 KE-23 Hosur 30 160 31 35 900 KE-24 Melanahalli 12 170 10 25 800 KE-25 Manjunathapura 32 220 35 50 1100 KE-26 Hucchanahatti 25 170 20 48 1200 KE-27 Kamalapura 28 150 25 35 900 KE-28 Harisamudra 18 170 15 32 850 KE-29 Alakatte 25 150 18 35 1250
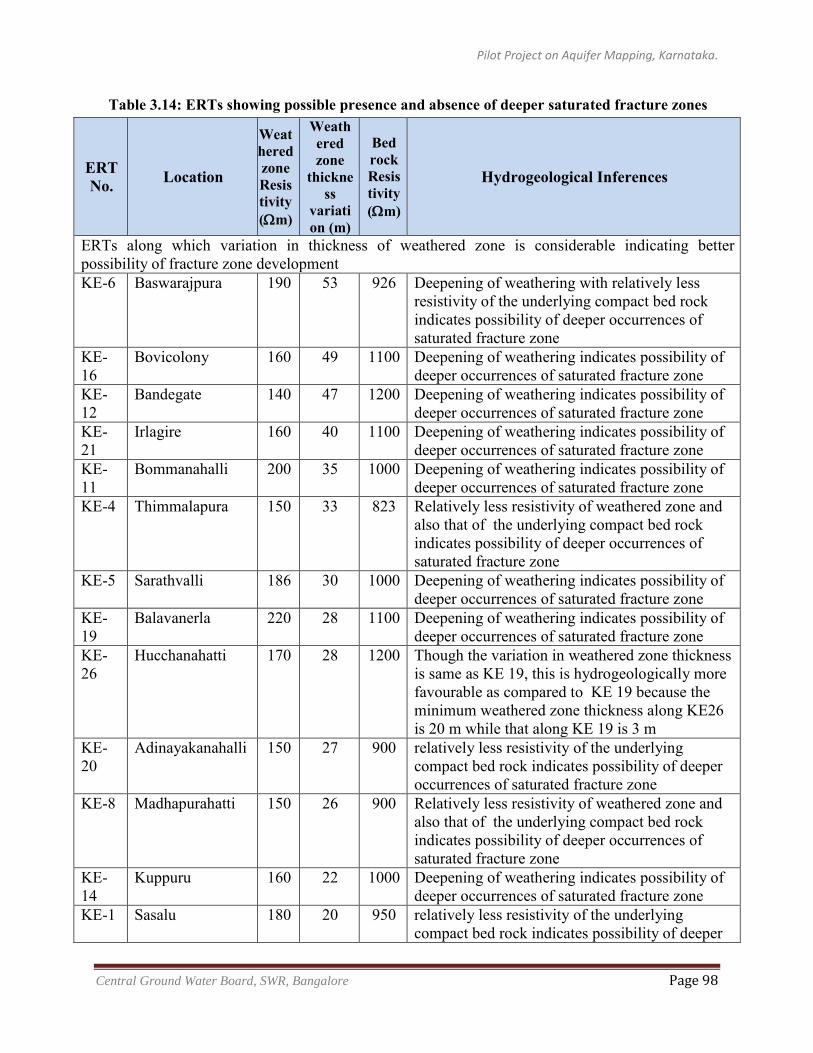
Pilot Project on Aquifer Mapping, Karnataka.
Central Ground Water Board, SWR, Bangalore Page 98
Table 3.14: ERTs showing possible presence and absence of deeper saturated fracture zones
ERT No. Location
Weathered zone Resistivity (m)
Weathered zone
thickness
variation (m)
Bed rock Resistivity (m)
Hydrogeological Inferences
ERTs along which variation in thickness of weathered zone is considerable indicating better possibility of fracture zone development KE-6 Baswarajpura 190 53 926 Deepening of weathering with relatively less
resistivity of the underlying compact bed rock indicates possibility of deeper occurrences of saturated fracture zone
KE-16
Bovicolony 160 49 1100 Deepening of weathering indicates possibility of deeper occurrences of saturated fracture zone
KE-12
Bandegate 140 47 1200 Deepening of weathering indicates possibility of deeper occurrences of saturated fracture zone
KE-21
Irlagire 160 40 1100 Deepening of weathering indicates possibility of deeper occurrences of saturated fracture zone
KE-11
Bommanahalli 200 35 1000 Deepening of weathering indicates possibility of deeper occurrences of saturated fracture zone
KE-4 Thimmalapura 150 33 823 Relatively less resistivity of weathered zone and also that of the underlying compact bed rock indicates possibility of deeper occurrences of saturated fracture zone
KE-5 Sarathvalli 186 30 1000 Deepening of weathering indicates possibility of deeper occurrences of saturated fracture zone
KE-19
Balavanerla 220 28 1100 Deepening of weathering indicates possibility of deeper occurrences of saturated fracture zone
KE-26
Hucchanahatti 170 28 1200 Though the variation in weathered zone thickness is same as KE 19, this is hydrogeologically more favourable as compared to KE 19 because the minimum weathered zone thickness along KE26 is 20 m while that along KE 19 is 3 m
KE-20
Adinayakanahalli 150 27 900 relatively less resistivity of the underlying compact bed rock indicates possibility of deeper occurrences of saturated fracture zone
KE-8 Madhapurahatti 150 26 900 Relatively less resistivity of weathered zone and also that of the underlying compact bed rock indicates possibility of deeper occurrences of saturated fracture zone
KE-14
Kuppuru 160 22 1000 Deepening of weathering indicates possibility of deeper occurrences of saturated fracture zone
KE-1 Sasalu 180 20 950 relatively less resistivity of the underlying compact bed rock indicates possibility of deeper
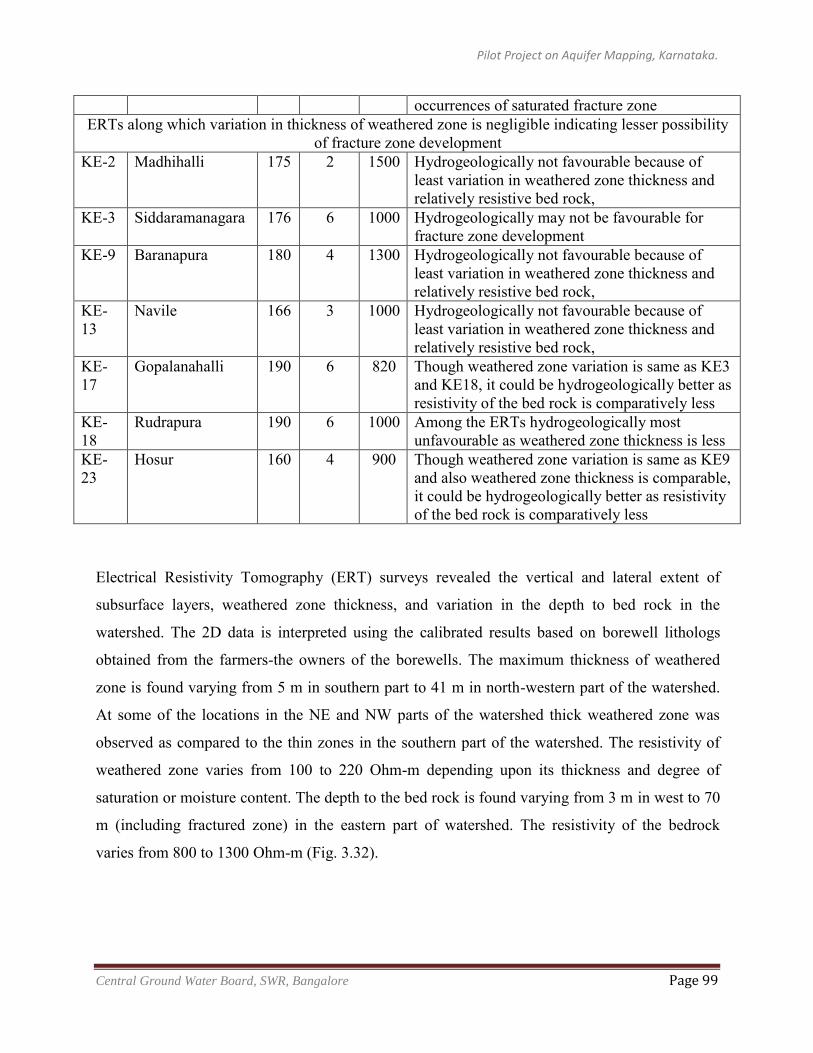
Pilot Project on Aquifer Mapping, Karnataka.
Central Ground Water Board, SWR, Bangalore Page 99
occurrences of saturated fracture zone ERTs along which variation in thickness of weathered zone is negligible indicating lesser possibility
of fracture zone development KE-2 Madhihalli 175 2 1500 Hydrogeologically not favourable because of
least variation in weathered zone thickness and relatively resistive bed rock,
KE-3 Siddaramanagara 176 6 1000 Hydrogeologically may not be favourable for fracture zone development
KE-9 Baranapura 180 4 1300 Hydrogeologically not favourable because of least variation in weathered zone thickness and relatively resistive bed rock,
KE-13
Navile 166 3 1000 Hydrogeologically not favourable because of least variation in weathered zone thickness and relatively resistive bed rock,
KE-17
Gopalanahalli 190 6 820 Though weathered zone variation is same as KE3 and KE18, it could be hydrogeologically better as resistivity of the bed rock is comparatively less
KE-18
Rudrapura 190 6 1000 Among the ERTs hydrogeologically most unfavourable as weathered zone thickness is less
KE-23
Hosur 160 4 900 Though weathered zone variation is same as KE9 and also weathered zone thickness is comparable, it could be hydrogeologically better as resistivity of the bed rock is comparatively less
Electrical Resistivity Tomography (ERT) surveys revealed the vertical and lateral extent of
subsurface layers, weathered zone thickness, and variation in the depth to bed rock in the
watershed. The 2D data is interpreted using the calibrated results based on borewell lithologs
obtained from the farmers-the owners of the borewells. The maximum thickness of weathered
zone is found varying from 5 m in southern part to 41 m in north-western part of the watershed.
At some of the locations in the NE and NW parts of the watershed thick weathered zone was
observed as compared to the thin zones in the southern part of the watershed. The resistivity of
weathered zone varies from 100 to 220 Ohm-m depending upon its thickness and degree of
saturation or moisture content. The depth to the bed rock is found varying from 3 m in west to 70
m (including fractured zone) in the eastern part of watershed. The resistivity of the bedrock
varies from 800 to 1300 Ohm-m (Fig. 3.32).
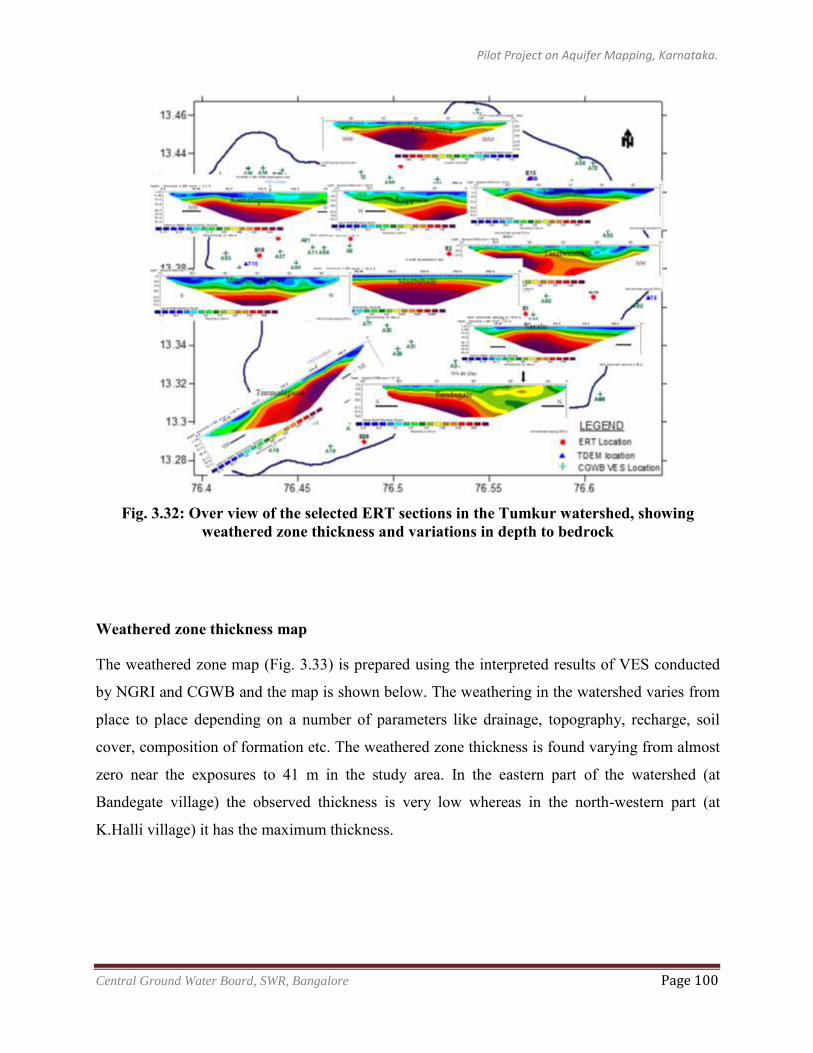
Pilot Project on Aquifer Mapping, Karnataka.
Central Ground Water Board, SWR, Bangalore Page 100
Fig. 3.32: Over view of the selected ERT sections in the Tumkur watershed, showing
weathered zone thickness and variations in depth to bedrock
Weathered zone thickness map
The weathered zone map (Fig. 3.33) is prepared using the interpreted results of VES conducted
by NGRI and CGWB and the map is shown below. The weathering in the watershed varies from
place to place depending on a number of parameters like drainage, topography, recharge, soil
cover, composition of formation etc. The weathered zone thickness is found varying from almost
zero near the exposures to 41 m in the study area. In the eastern part of the watershed (at
Bandegate village) the observed thickness is very low whereas in the north-western part (at
K.Halli village) it has the maximum thickness.
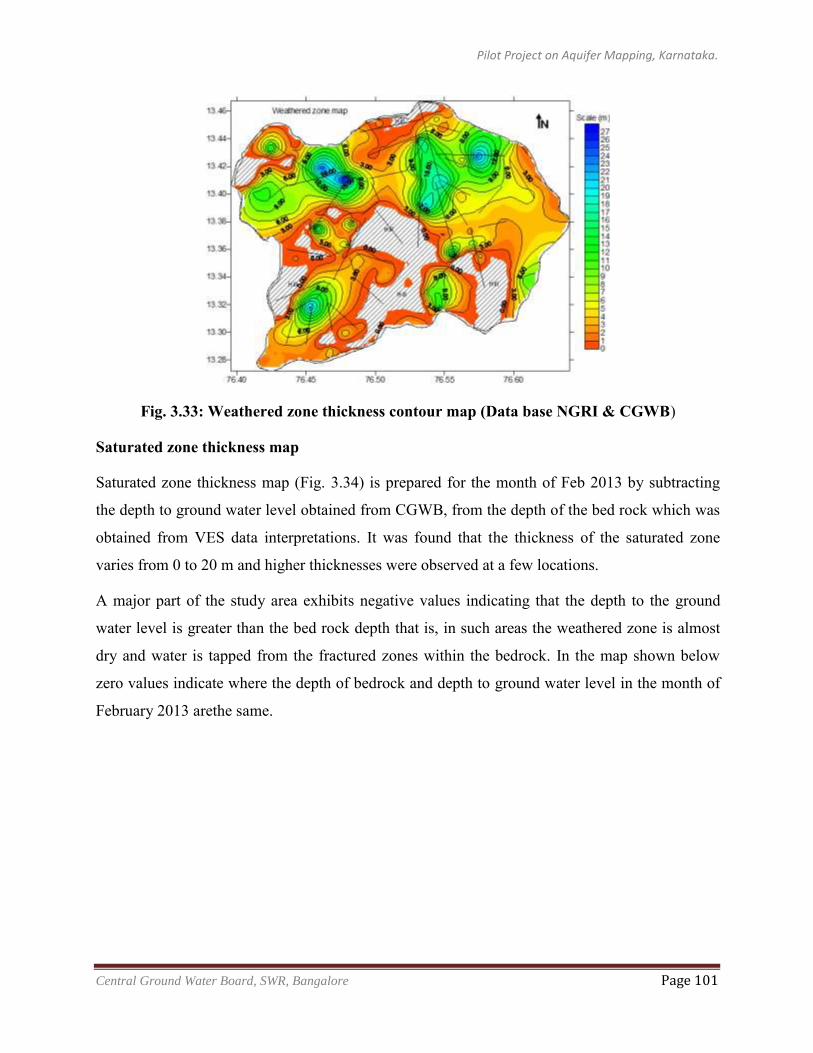
Pilot Project on Aquifer Mapping, Karnataka.
Central Ground Water Board, SWR, Bangalore Page 101
Fig. 3.33: Weathered zone thickness contour map (Data base NGRI & CGWB)
Saturated zone thickness map
Saturated zone thickness map (Fig. 3.34) is prepared for the month of Feb 2013 by subtracting
the depth to ground water level obtained from CGWB, from the depth of the bed rock which was
obtained from VES data interpretations. It was found that the thickness of the saturated zone
varies from 0 to 20 m and higher thicknesses were observed at a few locations.
A major part of the study area exhibits negative values indicating that the depth to the ground
water level is greater than the bed rock depth that is, in such areas the weathered zone is almost
dry and water is tapped from the fractured zones within the bedrock. In the map shown below
zero values indicate where the depth of bedrock and depth to ground water level in the month of
February 2013 arethe same.
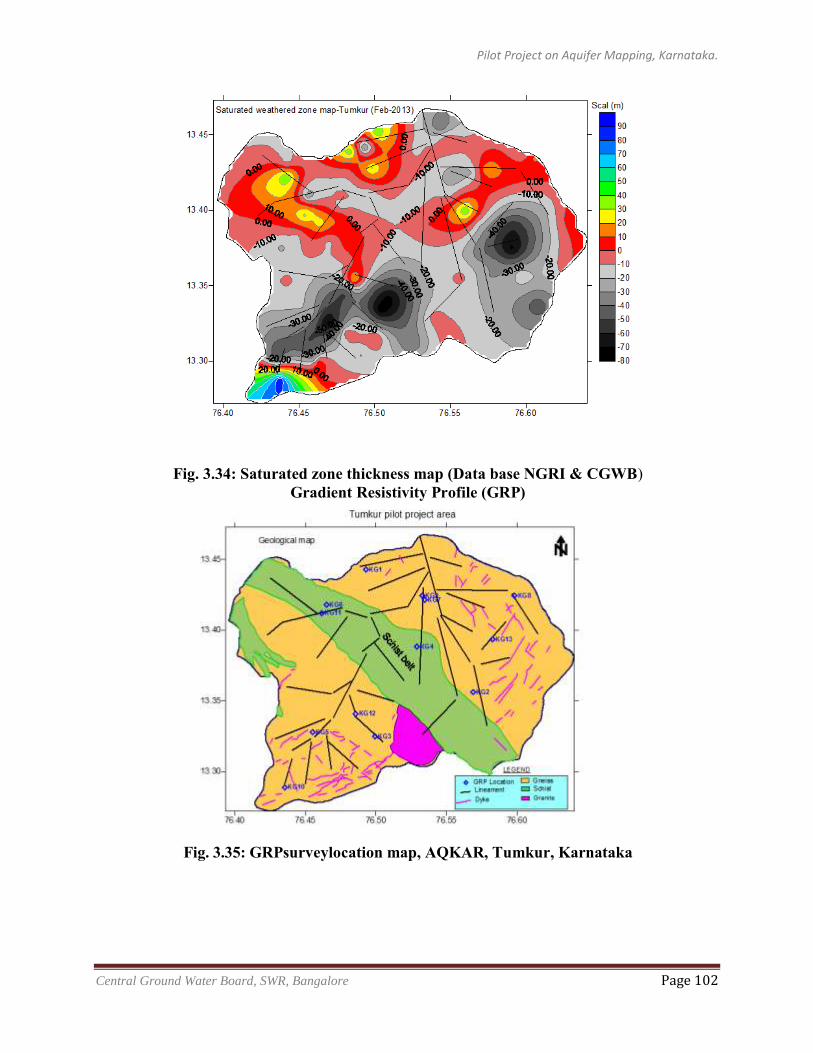
Pilot Project on Aquifer Mapping, Karnataka.
Central Ground Water Board, SWR, Bangalore Page 102
Fig. 3.34: Saturated zone thickness map (Data base NGRI & CGWB) Gradient Resistivity Profile (GRP)
Fig. 3.35: GRPsurveylocation map, AQKAR, Tumkur, Karnataka
Pilot Project on Aquifer Mapping, Karnataka.
Central Ground Water Board, SWR, Bangalore Page 103
Heliborne Geophysical Surveys:
SKYTEM & HELIMAG Surveys
The modern state of art Heliborne Geophysical survey, the major component of the AQUIM
project has been done in collaboration with Aarhus University, Denmark using dual movement
SkyTEM system developed at Aarhus University and operated and owned by SkyTEM Survey
Aps, Denmark.
Dual moment ensures high-resolution information from top to deep level by means of low and
high transmitter moments. Originally, it was planned to carry out SkyTEM surveys first,
followed by the ground based investigation for spot geophysical character verification. However,
due to time and administrative constraints, the heliborne survey was carried out only in the early
part of the year 2014.
The aim of the survey was to map the principal dewatered unconfined aquifer at shallow level
and fractured aquifers occurring at an average depth below 100 m under recently induced stress
of exploitation for agriculture over the entire area. The heliborne survey data was acquired with
closely spaced fly line based acquisition. The result of this project also focused towards
highlighting the applicability of heliborne survey for complex hydrogeological environment
similar to that of AQKAR where over-exploitation prevails with major influencing semi-arid
environment. The pilot study aims to demonstrate that the heliborne surveys provide a very
efficient, cost effective and rapid methodology with high resolution information for wide aquifer
mapping programme (NAQUIM).
In the surveyed area, agricultureis the main activity and agriculture produce based industries
essentially depend on ground water which is in vulnerability stage of scarcity and drying up.
Though geologically the area seems to be simple with Gneiss and Schists due to hydrogeological
complexity of tectonic remnants related conditions, the survey is important in understanding the
aquifer system and its areal extension. With a moderate degree of variability in topography,
lithological composition, air pressure, quality of ground water, etc., which are likely to influence
the data quality, adequate care has been taken while using the state of art data processing and
inversional algorithms while generating the output through using the laterally and spatially
constrained diversion (LCI & SCI) approaches.
Pilot Project on Aquifer Mapping, Karnataka.
Central Ground Water Board, SWR, Bangalore Page 104
3.6 SUB-SURFACE INFORMATION
3.6.1 Ground water exploration through outsourcing (AAP 2013-14)
Under the pilot project on aquifer mapping, it is proposed to construct 20 exploratory wells (EW)
to know the aquifer type, yield, geometry, ground water quality and Specific capacity,
Transmissivity (T) and Storage coefficient up to 200m depth. However, only 14 exploratory
wells were drilled in the area.
3.6.2 Selection of sites for exploratory wells
For test drilling of 14 EWs, 30 tentative sites were selected in Government lands based on
interpretation of geology, topography, spatial distribution etc. on 1:50,000 scale maps followed
by field reconnaissance and geophysical investigations. No objection certificates (NOC) were
collected from the concerned Government authorities.
3.6.3 Construction of exploratory wells
After receiving the NOC from state authorities, 14 (70 % - before heliborne survey) sites were
shown to drilling consultancy for construction of wells. Drilling at Sarathavalli was commenced
on 24/7/2013. The other 13 EWs were taken up at Balavaneralu, Bommanahalli thanda,
Bharanapura, Hosur, Madapurahatti thanda, Navule, Ankasandra, Huchanahatti,
Adinayakanahalli, Settikere, Sasalu, Madihalli and T.B.Colony villages subsequently. The
drilling activity was completed on 02/10/2013.
Construction of EWs began with drilling in weathered formation from the ground until hard
formation is reached. The soft formation is cased with 8” casing pipe up to desired depth to avoid
collapsing. Subsequently, drilling continued with 61/2 or 6 inch drilling bit down to depth of 200
m. Lithological samples were collected for every 3 m to know the subsurface geology of the
area. The fractures encountered at different depth were recorded down along with yields and
water samples were collected to know the change in ground water quality with depth. Wherever
high yields are encountered, drilling to the target depth of 200 m could not be done due to high
water pressure. After completion of the well, the well was fitted with suitable well cap and
protection box.
In these 14 EWs, the length of casing lowered ranges from 18.92 m at Ankasandra to 52.12 mat
Madapurahatti thanda site. The static ground water level ranges from 12.97 m bgl at Hosur to
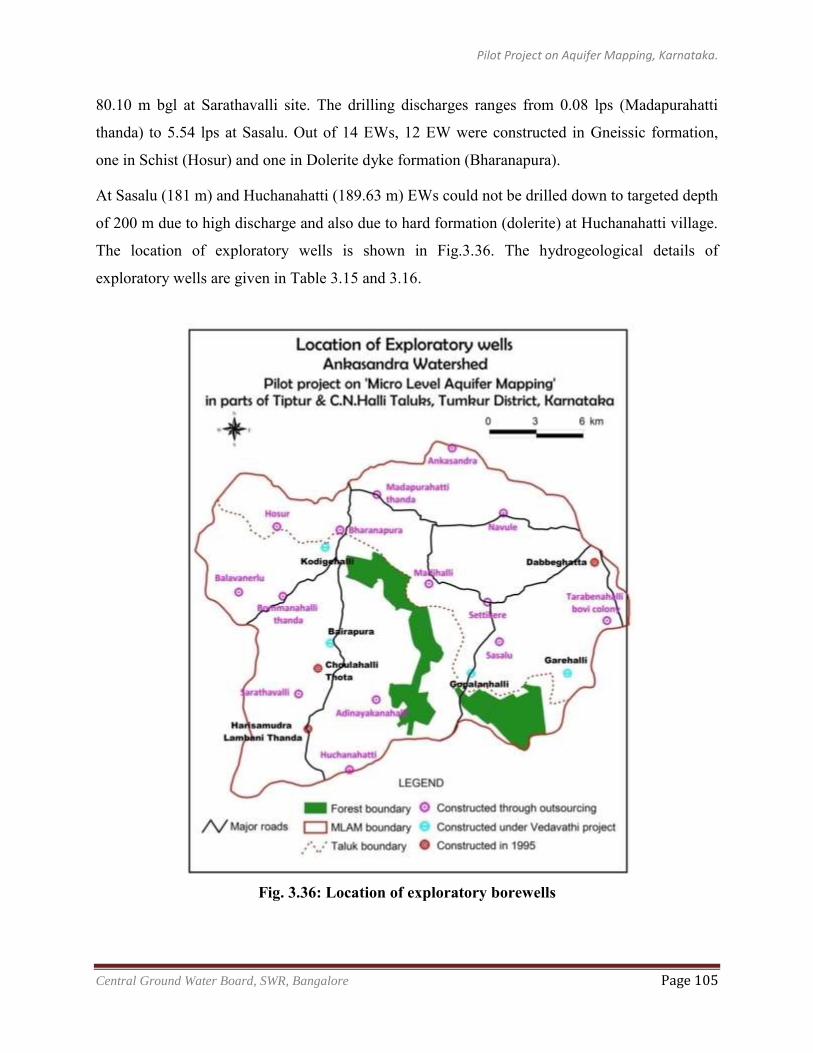
Pilot Project on Aquifer Mapping, Karnataka.
Central Ground Water Board, SWR, Bangalore Page 105
80.10 m bgl at Sarathavalli site. The drilling discharges ranges from 0.08 lps (Madapurahatti
thanda) to 5.54 lps at Sasalu. Out of 14 EWs, 12 EW were constructed in Gneissic formation,
one in Schist (Hosur) and one in Dolerite dyke formation (Bharanapura).
At Sasalu (181 m) and Huchanahatti (189.63 m) EWs could not be drilled down to targeted depth
of 200 m due to high discharge and also due to hard formation (dolerite) at Huchanahatti village.
The location of exploratory wells is shown in Fig.3.36. The hydrogeological details of
exploratory wells are given in Table 3.15 and 3.16.
Fig. 3.36: Location of exploratory borewells
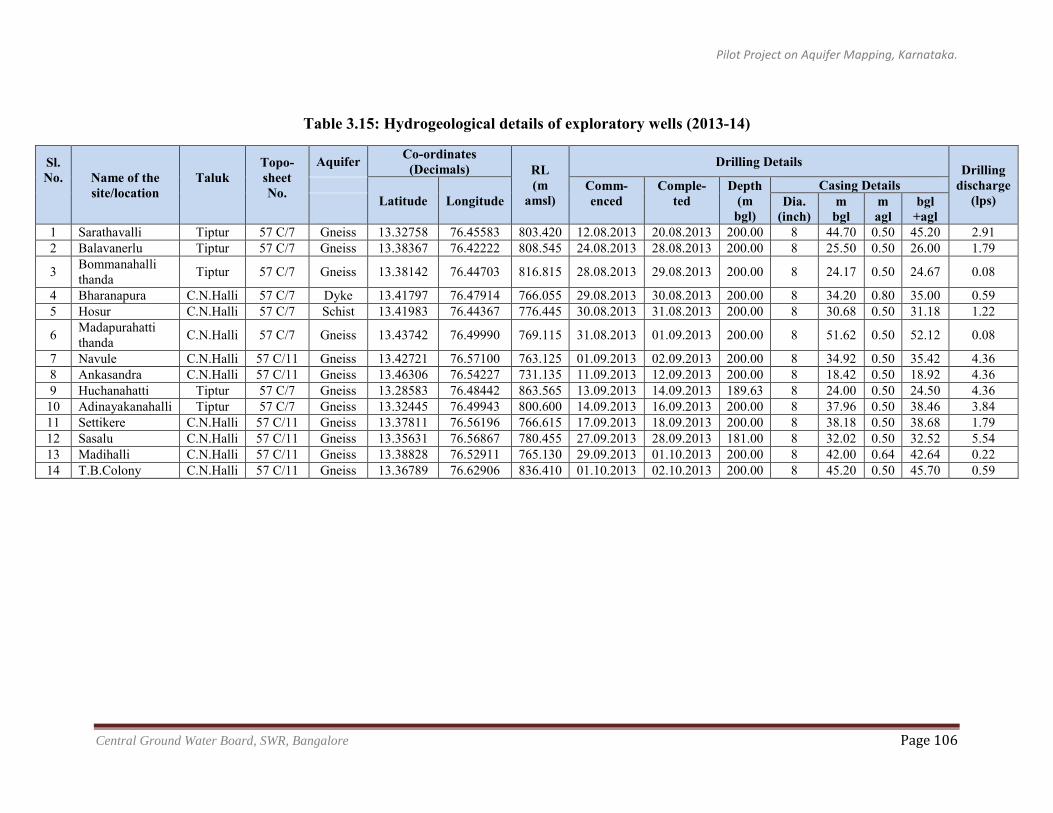
Pilot Project on Aquifer Mapping, Karnataka.
Central Ground Water Board, SWR, Bangalore Page 106
Table 3.15: Hydrogeological details of exploratory wells (2013-14)
Sl. No.
Name of the site/location
Taluk
Topo- sheet No.
Aquifer Co-ordinates (Decimals) RL
(m amsl)
Drilling Details Drilling discharge
(lps) Latitude Longitude Comm- enced
Comple- ted
Depth (m
bgl)
Casing Details
Dia.
(inch) m
bgl m agl
bgl +agl
1 Sarathavalli Tiptur 57 C/7 Gneiss 13.32758 76.45583 803.420 12.08.2013 20.08.2013 200.00 8 44.70 0.50 45.20 2.91 2 Balavanerlu Tiptur 57 C/7 Gneiss 13.38367 76.42222 808.545 24.08.2013 28.08.2013 200.00 8 25.50 0.50 26.00 1.79
3 Bommanahalli thanda Tiptur 57 C/7 Gneiss 13.38142 76.44703 816.815 28.08.2013 29.08.2013 200.00 8 24.17 0.50 24.67 0.08
4 Bharanapura C.N.Halli 57 C/7 Dyke 13.41797 76.47914 766.055 29.08.2013 30.08.2013 200.00 8 34.20 0.80 35.00 0.59 5 Hosur C.N.Halli 57 C/7 Schist 13.41983 76.44367 776.445 30.08.2013 31.08.2013 200.00 8 30.68 0.50 31.18 1.22
6 Madapurahatti thanda C.N.Halli 57 C/7 Gneiss 13.43742 76.49990 769.115 31.08.2013 01.09.2013 200.00 8 51.62 0.50 52.12 0.08
7 Navule C.N.Halli 57 C/11 Gneiss 13.42721 76.57100 763.125 01.09.2013 02.09.2013 200.00 8 34.92 0.50 35.42 4.36 8 Ankasandra C.N.Halli 57 C/11 Gneiss 13.46306 76.54227 731.135 11.09.2013 12.09.2013 200.00 8 18.42 0.50 18.92 4.36 9 Huchanahatti Tiptur 57 C/7 Gneiss 13.28583 76.48442 863.565 13.09.2013 14.09.2013 189.63 8 24.00 0.50 24.50 4.36
10 Adinayakanahalli Tiptur 57 C/7 Gneiss 13.32445 76.49943 800.600 14.09.2013 16.09.2013 200.00 8 37.96 0.50 38.46 3.84 11 Settikere C.N.Halli 57 C/11 Gneiss 13.37811 76.56196 766.615 17.09.2013 18.09.2013 200.00 8 38.18 0.50 38.68 1.79 12 Sasalu C.N.Halli 57 C/11 Gneiss 13.35631 76.56867 780.455 27.09.2013 28.09.2013 181.00 8 32.02 0.50 32.52 5.54 13 Madihalli C.N.Halli 57 C/11 Gneiss 13.38828 76.52911 765.130 29.09.2013 01.10.2013 200.00 8 42.00 0.64 42.64 0.22 14 T.B.Colony C.N.Halli 57 C/11 Gneiss 13.36789 76.62906 836.410 01.10.2013 02.10.2013 200.00 8 45.20 0.50 45.70 0.59
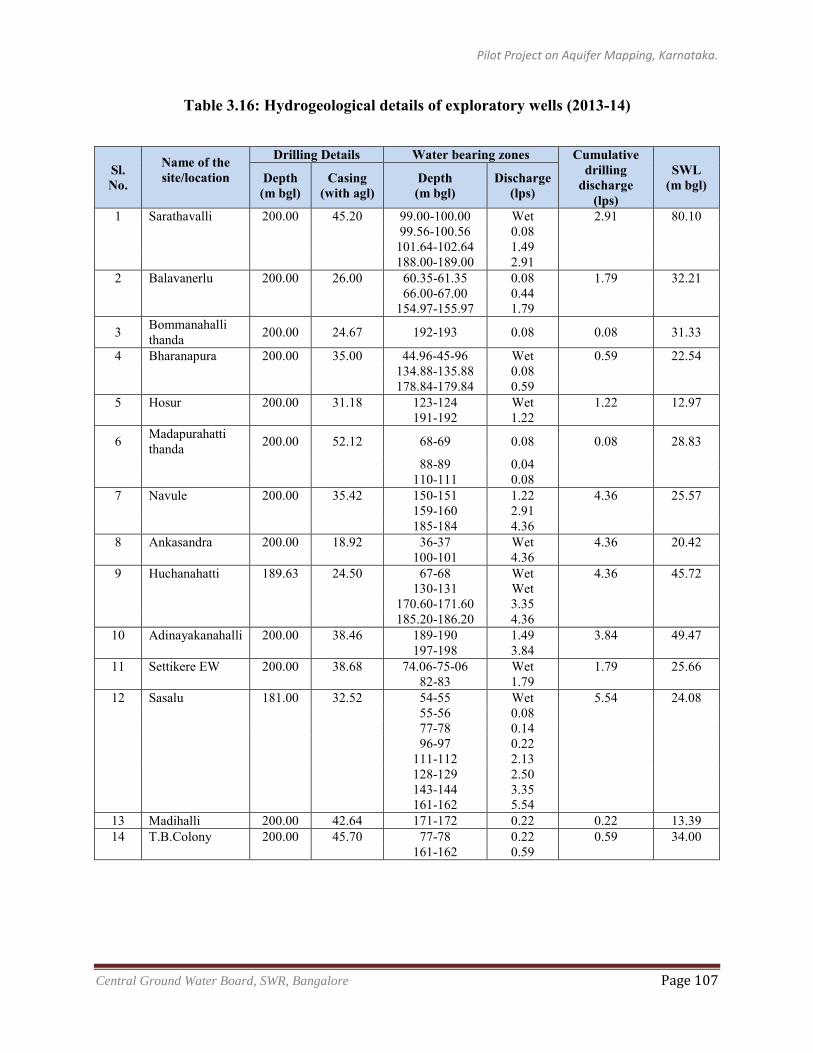
Pilot Project on Aquifer Mapping, Karnataka.
Central Ground Water Board, SWR, Bangalore Page 107
Table 3.16: Hydrogeological details of exploratory wells (2013-14)
Sl. No.
Name of the site/location
Drilling Details Water bearing zones Cumulative drilling
discharge (lps)
SWL (m bgl) Depth
(m bgl) Casing
(with agl) Depth (m bgl)
Discharge (lps)
1 Sarathavalli 200.00 45.20 99.00-100.00 Wet 2.91 80.10 99.56-100.56 0.08 101.64-102.64 1.49 188.00-189.00 2.91 2 Balavanerlu 200.00 26.00 60.35-61.35 0.08 1.79 32.21 66.00-67.00 0.44 154.97-155.97 1.79
3 Bommanahalli thanda 200.00 24.67 192-193 0.08 0.08 31.33
4 Bharanapura 200.00 35.00 44.96-45-96 Wet 0.59 22.54 134.88-135.88 0.08 178.84-179.84 0.59 5 Hosur 200.00 31.18 123-124 Wet 1.22 12.97 191-192 1.22
6 Madapurahatti thanda 200.00 52.12 68-69 0.08 0.08 28.83
88-89 0.04 110-111 0.08 7 Navule 200.00 35.42 150-151 1.22 4.36 25.57 159-160 2.91 185-184 4.36 8 Ankasandra 200.00 18.92 36-37 Wet 4.36 20.42 100-101 4.36 9 Huchanahatti 189.63 24.50 67-68 Wet 4.36 45.72 130-131 Wet 170.60-171.60 3.35 185.20-186.20 4.36
10 Adinayakanahalli 200.00 38.46 189-190 1.49 3.84 49.47 197-198 3.84
11 Settikere EW 200.00 38.68 74.06-75-06 Wet 1.79 25.66 82-83 1.79
12 Sasalu 181.00 32.52 54-55 Wet 5.54 24.08 55-56 0.08 77-78 0.14 96-97 0.22 111-112 2.13 128-129 2.50 143-144 3.35 161-162 5.54
13 Madihalli 200.00 42.64 171-172 0.22 0.22 13.39 14 T.B.Colony 200.00 45.70 77-78 0.22 0.59 34.00 161-162 0.59
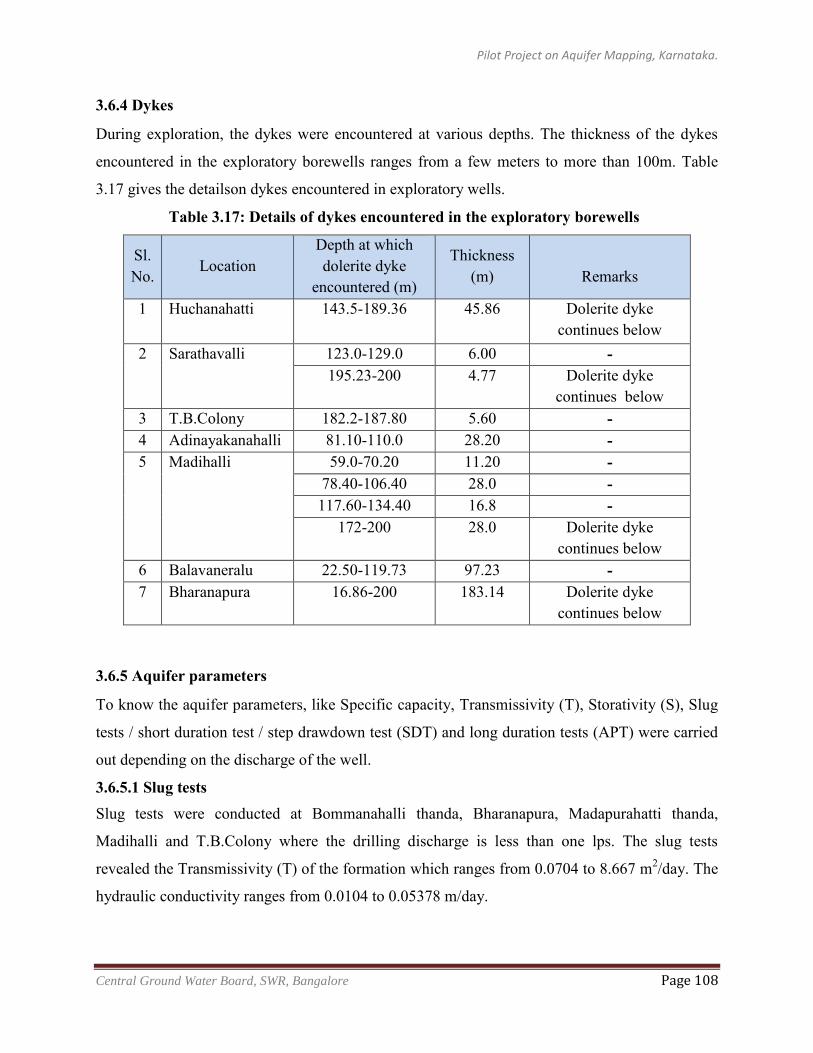
Pilot Project on Aquifer Mapping, Karnataka.
Central Ground Water Board, SWR, Bangalore Page 108
3.6.4 Dykes
During exploration, the dykes were encountered at various depths. The thickness of the dykes
encountered in the exploratory borewells ranges from a few meters to more than 100m. Table
3.17 gives the detailson dykes encountered in exploratory wells.
Table 3.17: Details of dykes encountered in the exploratory borewells
Sl. No. Location
Depth at which dolerite dyke
encountered (m)
Thickness (m)
Remarks
1 Huchanahatti 143.5-189.36 45.86 Dolerite dyke continues below
2 Sarathavalli 123.0-129.0 6.00 - 195.23-200 4.77 Dolerite dyke
continues below 3 T.B.Colony 182.2-187.80 5.60 - 4 Adinayakanahalli 81.10-110.0 28.20 - 5 Madihalli 59.0-70.20 11.20 -
78.40-106.40 28.0 - 117.60-134.40 16.8 -
172-200 28.0 Dolerite dyke continues below
6 Balavaneralu 22.50-119.73 97.23 - 7 Bharanapura 16.86-200 183.14 Dolerite dyke
continues below
3.6.5 Aquifer parameters
To know the aquifer parameters, like Specific capacity, Transmissivity (T), Storativity (S), Slug
tests / short duration test / step drawdown test (SDT) and long duration tests (APT) were carried
out depending on the discharge of the well.
3.6.5.1 Slug tests Slug tests were conducted at Bommanahalli thanda, Bharanapura, Madapurahatti thanda,
Madihalli and T.B.Colony where the drilling discharge is less than one lps. The slug tests
revealed the Transmissivity (T) of the formation which ranges from 0.0704 to 8.667 m2/day. The
hydraulic conductivity ranges from 0.0104 to 0.05378 m/day.
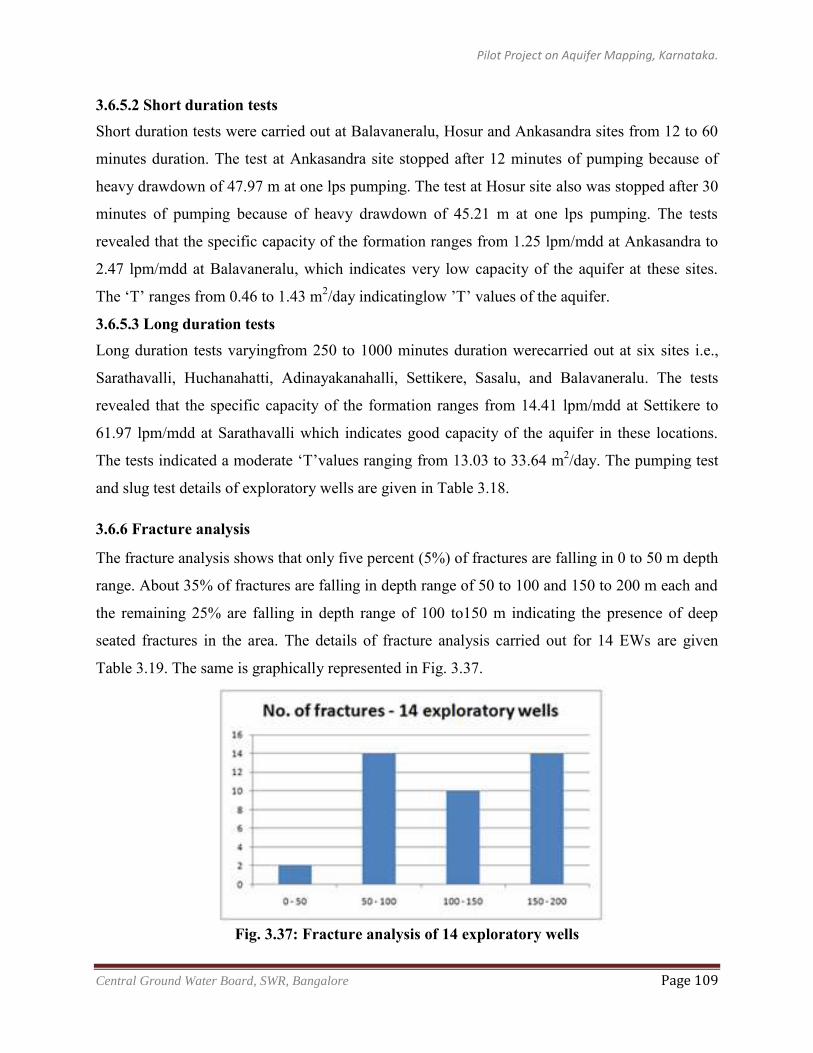
Pilot Project on Aquifer Mapping, Karnataka.
Central Ground Water Board, SWR, Bangalore Page 109
3.6.5.2 Short duration tests Short duration tests were carried out at Balavaneralu, Hosur and Ankasandra sites from 12 to 60
minutes duration. The test at Ankasandra site stopped after 12 minutes of pumping because of
heavy drawdown of 47.97 m at one lps pumping. The test at Hosur site also was stopped after 30
minutes of pumping because of heavy drawdown of 45.21 m at one lps pumping. The tests
revealed that the specific capacity of the formation ranges from 1.25 lpm/mdd at Ankasandra to
2.47 lpm/mdd at Balavaneralu, which indicates very low capacity of the aquifer at these sites.
The ‘T’ ranges from 0.46 to 1.43 m2/day indicatinglow ’T’ values of the aquifer.
3.6.5.3 Long duration tests Long duration tests varyingfrom 250 to 1000 minutes duration werecarried out at six sites i.e.,
Sarathavalli, Huchanahatti, Adinayakanahalli, Settikere, Sasalu, and Balavaneralu. The tests
revealed that the specific capacity of the formation ranges from 14.41 lpm/mdd at Settikere to
61.97 lpm/mdd at Sarathavalli which indicates good capacity of the aquifer in these locations.
The tests indicated a moderate ‘T’values ranging from 13.03 to 33.64 m2/day. The pumping test
and slug test details of exploratory wells are given in Table 3.18.
3.6.6 Fracture analysis
The fracture analysis shows that only five percent (5%) of fractures are falling in 0 to 50 m depth
range. About 35% of fractures are falling in depth range of 50 to 100 and 150 to 200 m each and
the remaining 25% are falling in depth range of 100 to150 m indicating the presence of deep
seated fractures in the area. The details of fracture analysis carried out for 14 EWs are given
Table 3.19. The same is graphically represented in Fig. 3.37.
Fig. 3.37: Fracture analysis of 14 exploratory wells
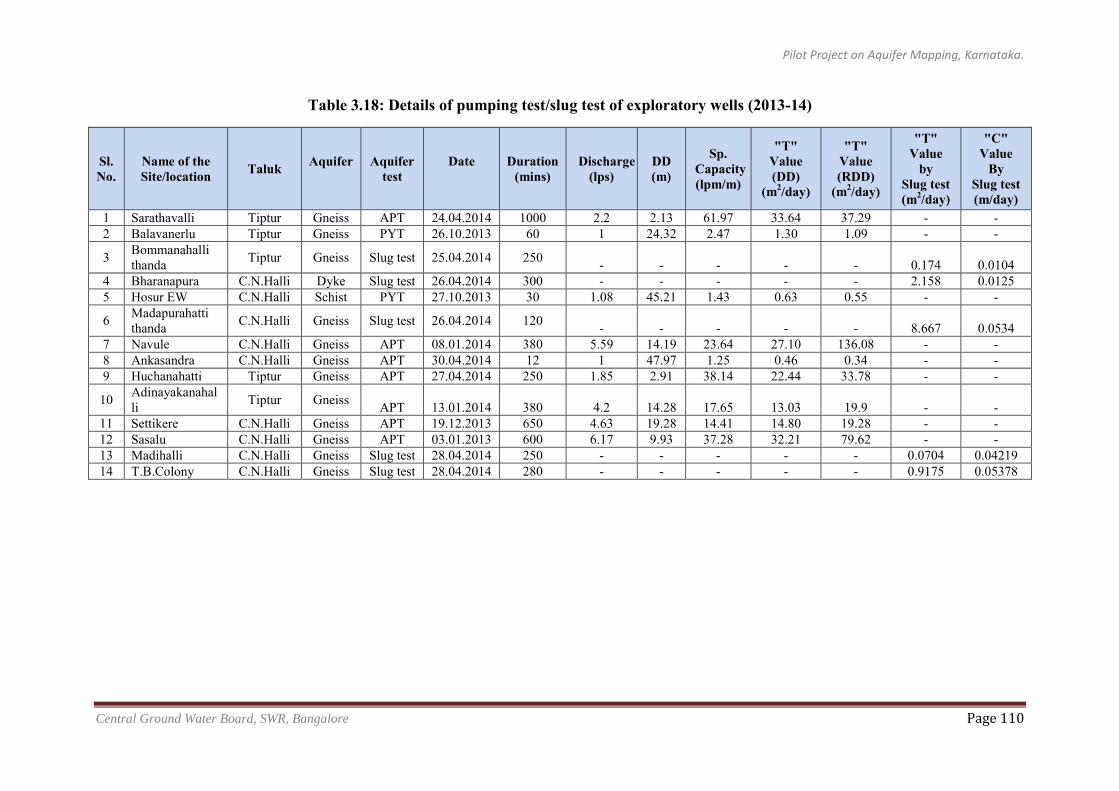
Pilot Project on Aquifer Mapping, Karnataka.
Central Ground Water Board, SWR, Bangalore Page 110
Table 3.18: Details of pumping test/slug test of exploratory wells (2013-14)
Sl. No.
Name of the Site/location Taluk Aquifer
Aquifer
test Date
Duration
(mins) Discharge
(lps) DD (m)
Sp. Capacity (lpm/m)
"T" Value (DD)
(m2/day)
"T" Value (RDD)
(m2/day)
"T" Value
by Slug test (m2/day)
"C" Value
By Slug test (m/day)
1 Sarathavalli Tiptur Gneiss APT 24.04.2014 1000 2.2 2.13 61.97 33.64 37.29 - - 2 Balavanerlu Tiptur Gneiss PYT 26.10.2013 60 1 24.32 2.47 1.30 1.09 - -
3 Bommanahalli thanda Tiptur Gneiss Slug test 25.04.2014 250 - - - - - 0.174 0.0104
4 Bharanapura C.N.Halli Dyke Slug test 26.04.2014 300 - - - - - 2.158 0.0125 5 Hosur EW C.N.Halli Schist PYT 27.10.2013 30 1.08 45.21 1.43 0.63 0.55 - -
6 Madapurahatti thanda C.N.Halli Gneiss Slug test 26.04.2014 120 - - - - - 8.667 0.0534
7 Navule C.N.Halli Gneiss APT 08.01.2014 380 5.59 14.19 23.64 27.10 136.08 - - 8 Ankasandra C.N.Halli Gneiss APT 30.04.2014 12 1 47.97 1.25 0.46 0.34 - - 9 Huchanahatti Tiptur Gneiss APT 27.04.2014 250 1.85 2.91 38.14 22.44 33.78 - -
10 Adinayakanahalli Tiptur Gneiss APT 13.01.2014 380 4.2 14.28 17.65 13.03 19.9 - -
11 Settikere C.N.Halli Gneiss APT 19.12.2013 650 4.63 19.28 14.41 14.80 19.28 - - 12 Sasalu C.N.Halli Gneiss APT 03.01.2013 600 6.17 9.93 37.28 32.21 79.62 - - 13 Madihalli C.N.Halli Gneiss Slug test 28.04.2014 250 - - - - - 0.0704 0.04219 14 T.B.Colony C.N.Halli Gneiss Slug test 28.04.2014 280 - - - - - 0.9175 0.05378
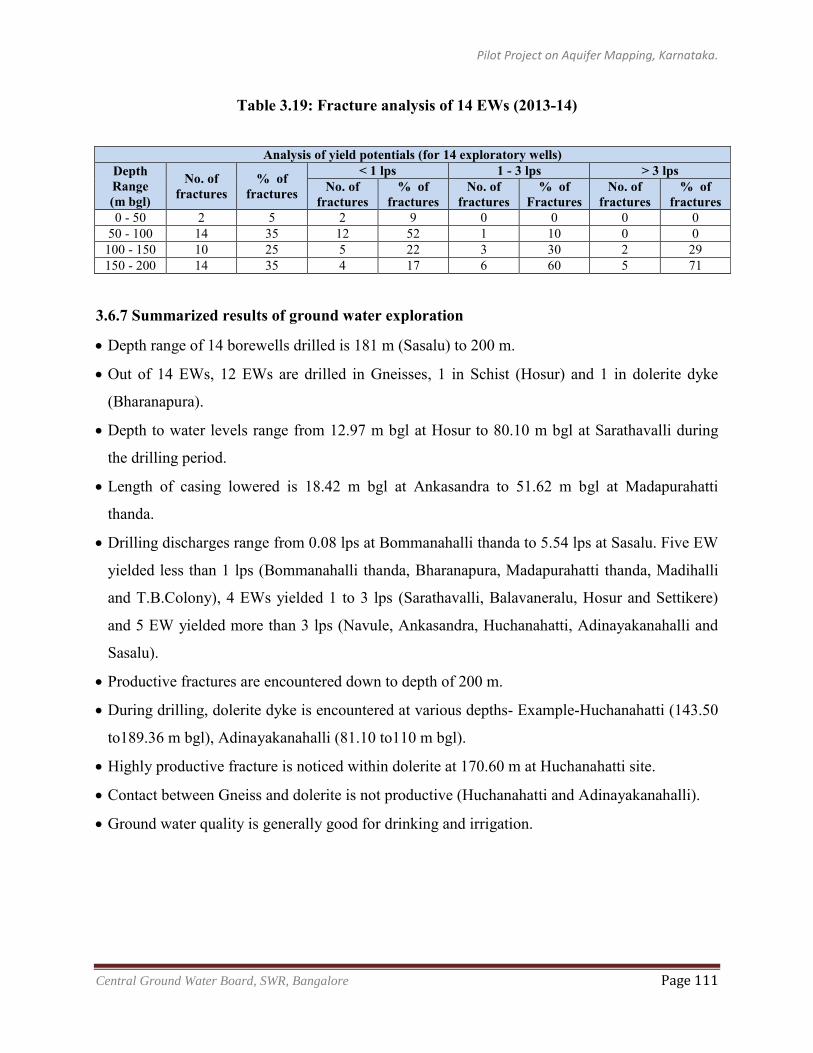
Pilot Project on Aquifer Mapping, Karnataka.
Central Ground Water Board, SWR, Bangalore Page 111
Table 3.19: Fracture analysis of 14 EWs (2013-14)
Analysis of yield potentials (for 14 exploratory wells) Depth Range (m bgl)
No. of fractures
% of fractures
< 1 lps 1 - 3 lps > 3 lps No. of
fractures % of
fractures No. of
fractures % of
Fractures No. of
fractures % of
fractures 0 - 50 2 5 2 9 0 0 0 0
50 - 100 14 35 12 52 1 10 0 0 100 - 150 10 25 5 22 3 30 2 29 150 - 200 14 35 4 17 6 60 5 71
3.6.7 Summarized results of ground water exploration
Depth range of 14 borewells drilled is 181 m (Sasalu) to 200 m.
Out of 14 EWs, 12 EWs are drilled in Gneisses, 1 in Schist (Hosur) and 1 in dolerite dyke
(Bharanapura).
Depth to water levels range from 12.97 m bgl at Hosur to 80.10 m bgl at Sarathavalli during
the drilling period.
Length of casing lowered is 18.42 m bgl at Ankasandra to 51.62 m bgl at Madapurahatti
thanda.
Drilling discharges range from 0.08 lps at Bommanahalli thanda to 5.54 lps at Sasalu. Five EW
yielded less than 1 lps (Bommanahalli thanda, Bharanapura, Madapurahatti thanda, Madihalli
and T.B.Colony), 4 EWs yielded 1 to 3 lps (Sarathavalli, Balavaneralu, Hosur and Settikere)
and 5 EW yielded more than 3 lps (Navule, Ankasandra, Huchanahatti, Adinayakanahalli and
Sasalu).
Productive fractures are encountered down to depth of 200 m.
During drilling, dolerite dyke is encountered at various depths- Example-Huchanahatti (143.50
to189.36 m bgl), Adinayakanahalli (81.10 to110 m bgl).
Highly productive fracture is noticed within dolerite at 170.60 m at Huchanahatti site.
Contact between Gneiss and dolerite is not productive (Huchanahatti and Adinayakanahalli).
Ground water quality is generally good for drinking and irrigation.
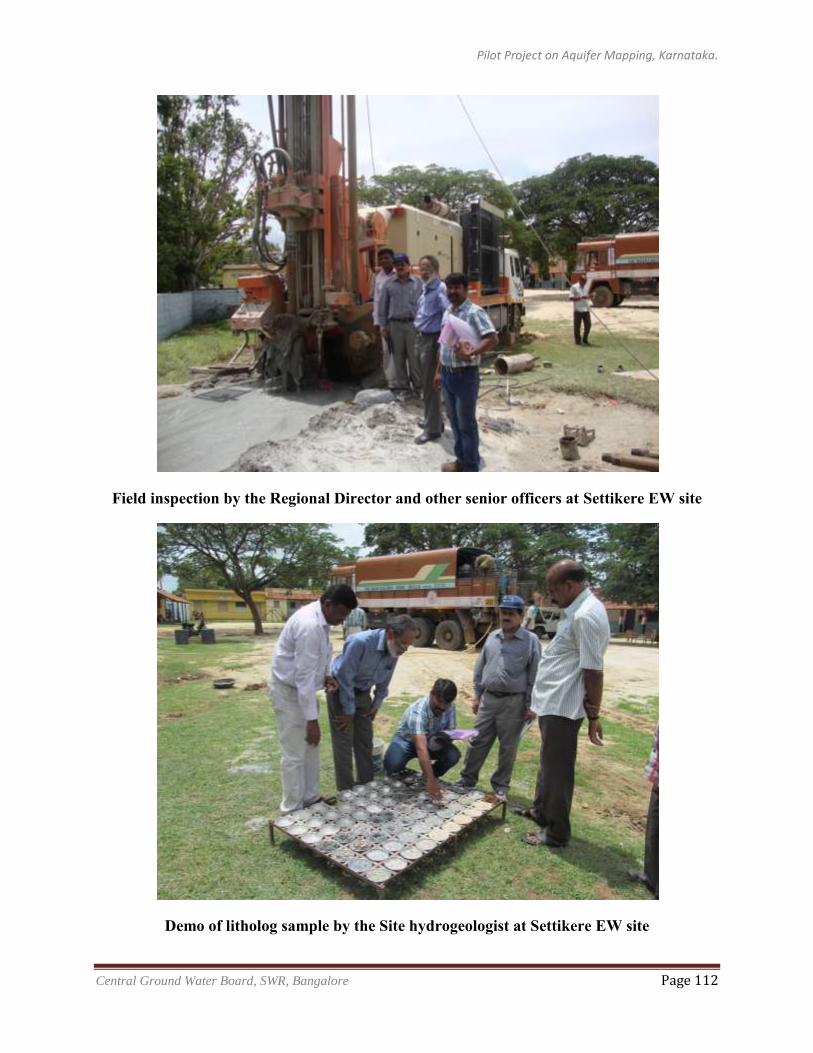
Pilot Project on Aquifer Mapping, Karnataka.
Central Ground Water Board, SWR, Bangalore Page 112
Field inspection by the Regional Director and other senior officers at Settikere EW site
Demo of litholog sample by the Site hydrogeologist at Settikere EW site
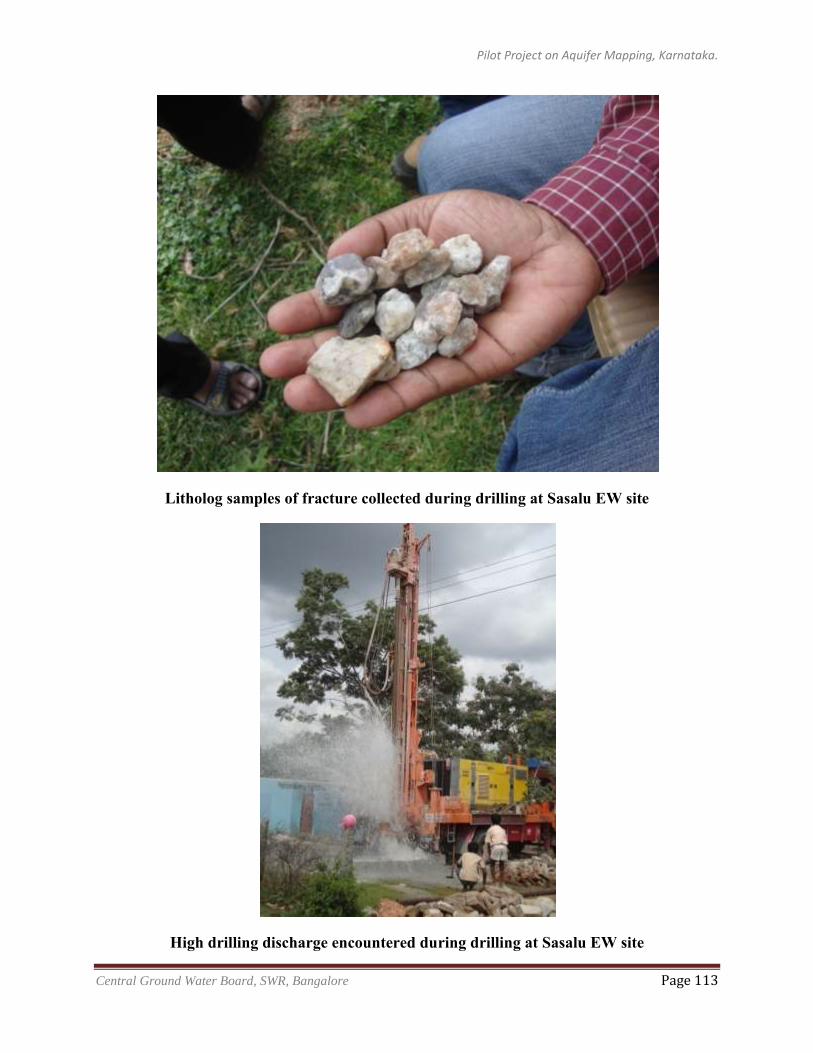
Pilot Project on Aquifer Mapping, Karnataka.
Central Ground Water Board, SWR, Bangalore Page 113
Litholog samples of fracture collected during drilling at Sasalu EW site
High drilling discharge encountered during drilling at Sasalu EW site
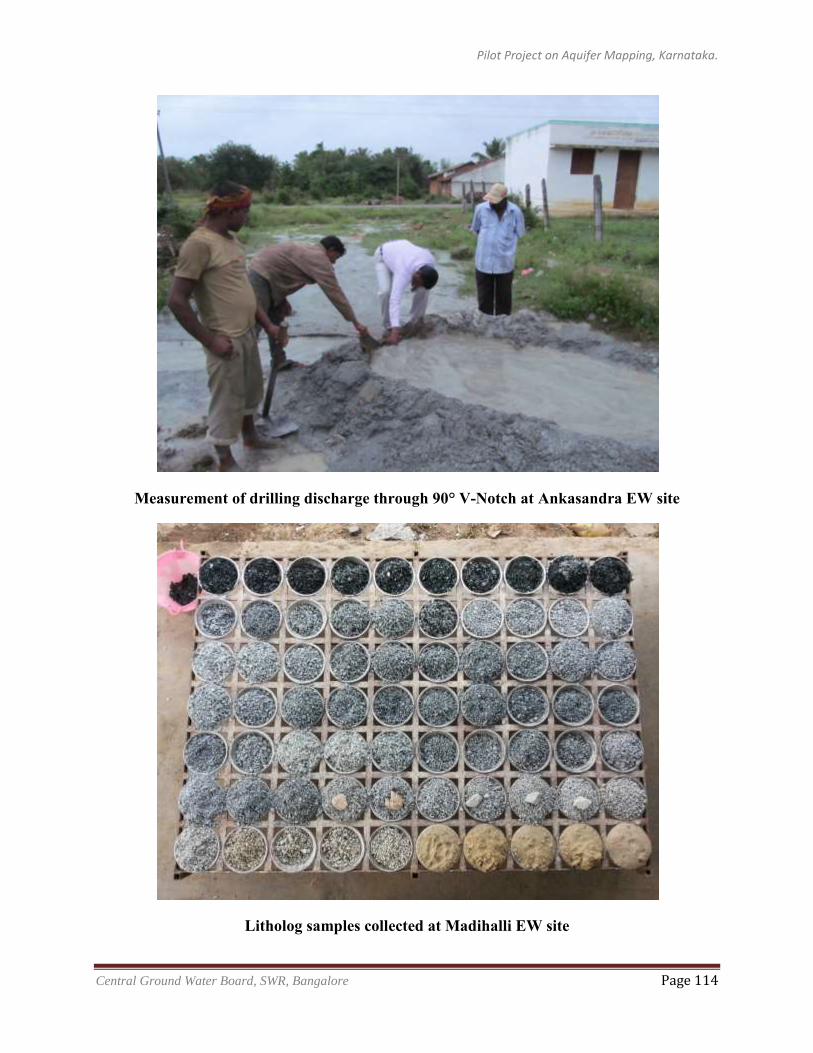
Pilot Project on Aquifer Mapping, Karnataka.
Central Ground Water Board, SWR, Bangalore Page 114
Measurement of drilling discharge through 90° V-Notch at Ankasandra EW site
Litholog samples collected at Madihalli EW site
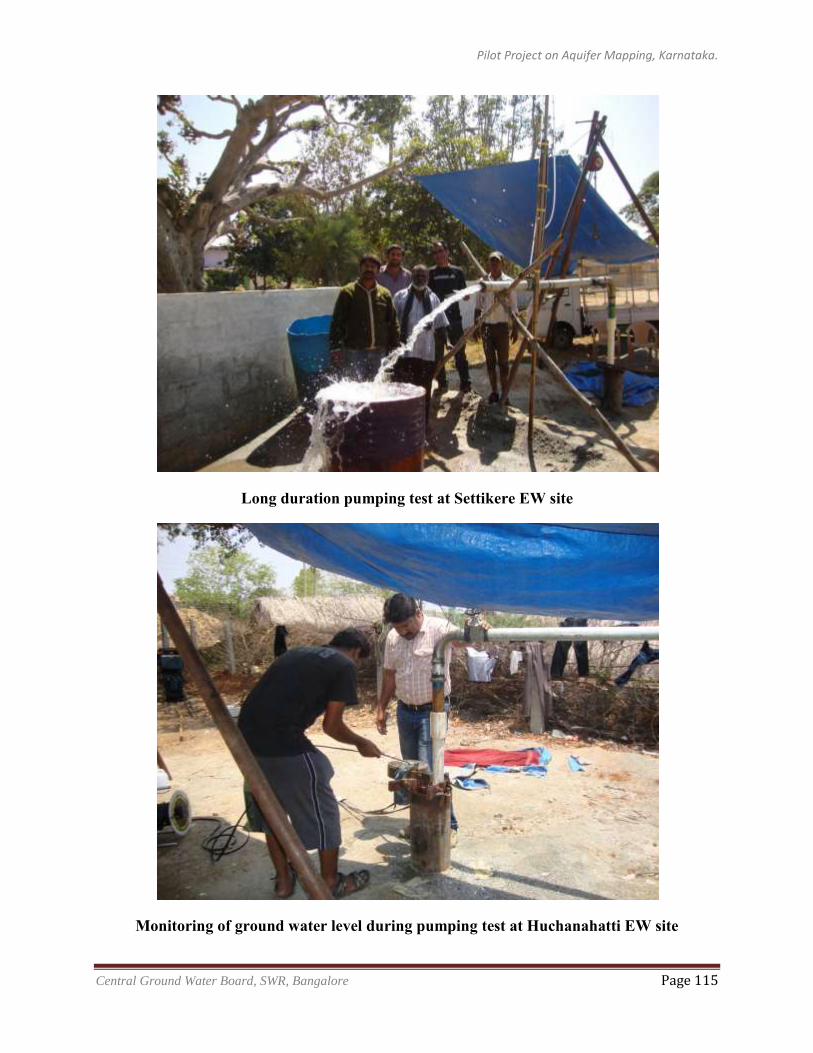
Pilot Project on Aquifer Mapping, Karnataka.
Central Ground Water Board, SWR, Bangalore Page 115
Long duration pumping test at Settikere EW site
Monitoring of ground water level during pumping test at Huchanahatti EW site
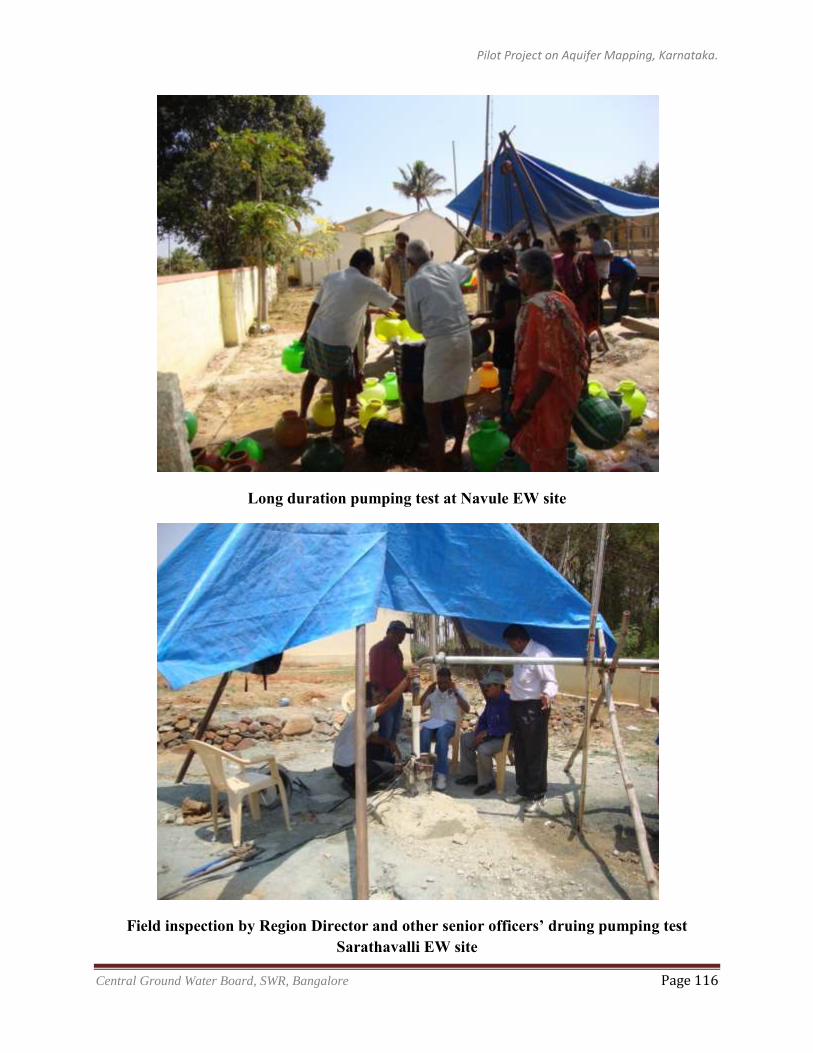
Pilot Project on Aquifer Mapping, Karnataka.
Central Ground Water Board, SWR, Bangalore Page 116
Long duration pumping test at Navule EW site
Field inspection by Region Director and other senior officers’ druing pumping test Sarathavalli EW site
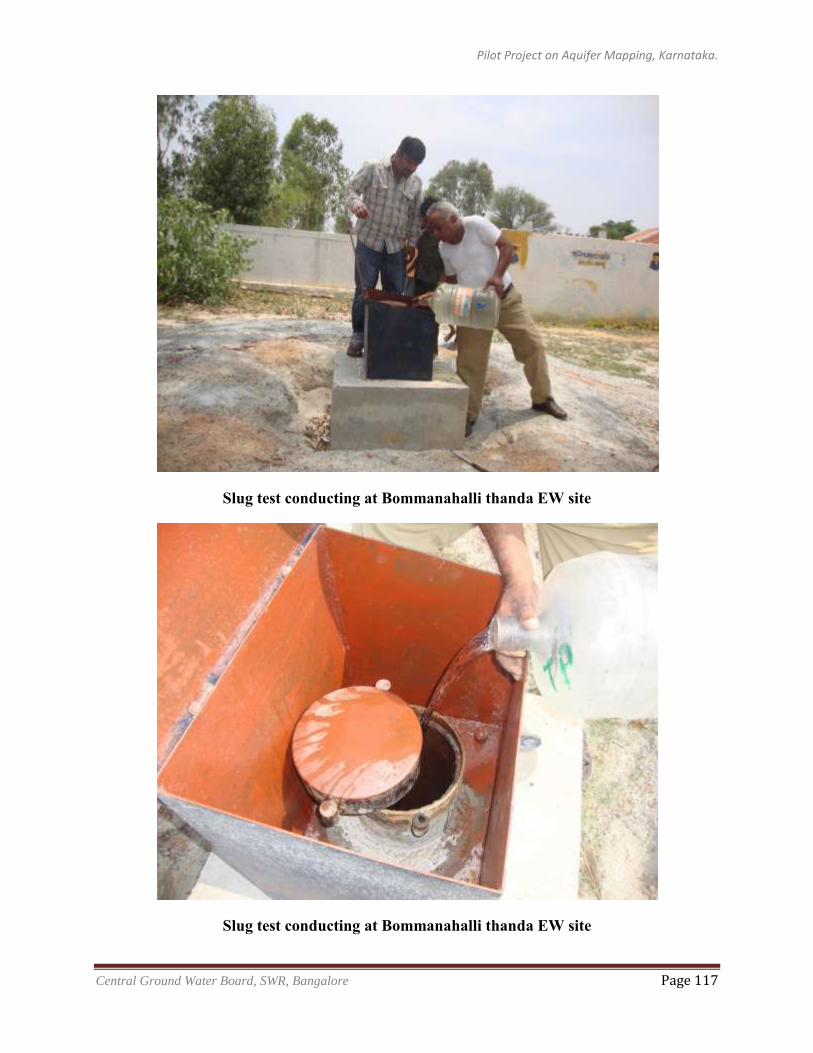
Pilot Project on Aquifer Mapping, Karnataka.
Central Ground Water Board, SWR, Bangalore Page 117
Slug test conducting at Bommanahalli thanda EW site
Slug test conducting at Bommanahalli thanda EW site
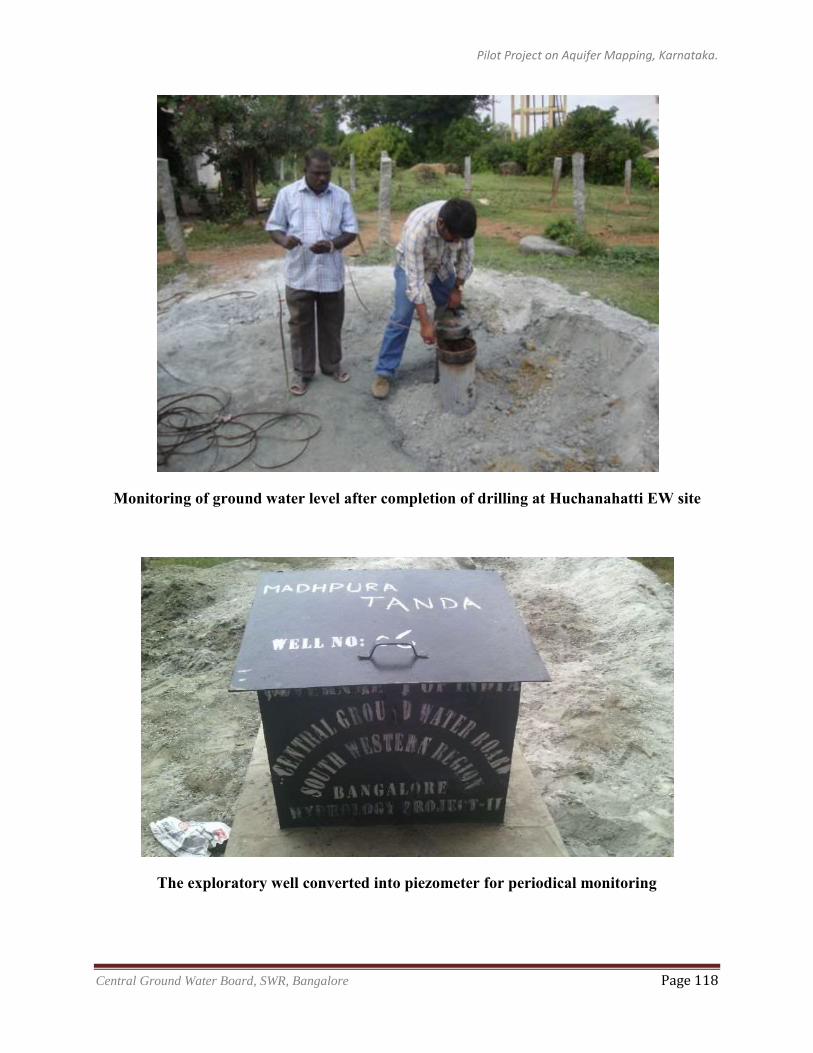
Pilot Project on Aquifer Mapping, Karnataka.
Central Ground Water Board, SWR, Bangalore Page 118
Monitoring of ground water level after completion of drilling at Huchanahatti EW site
The exploratory well converted into piezometer for periodical monitoring
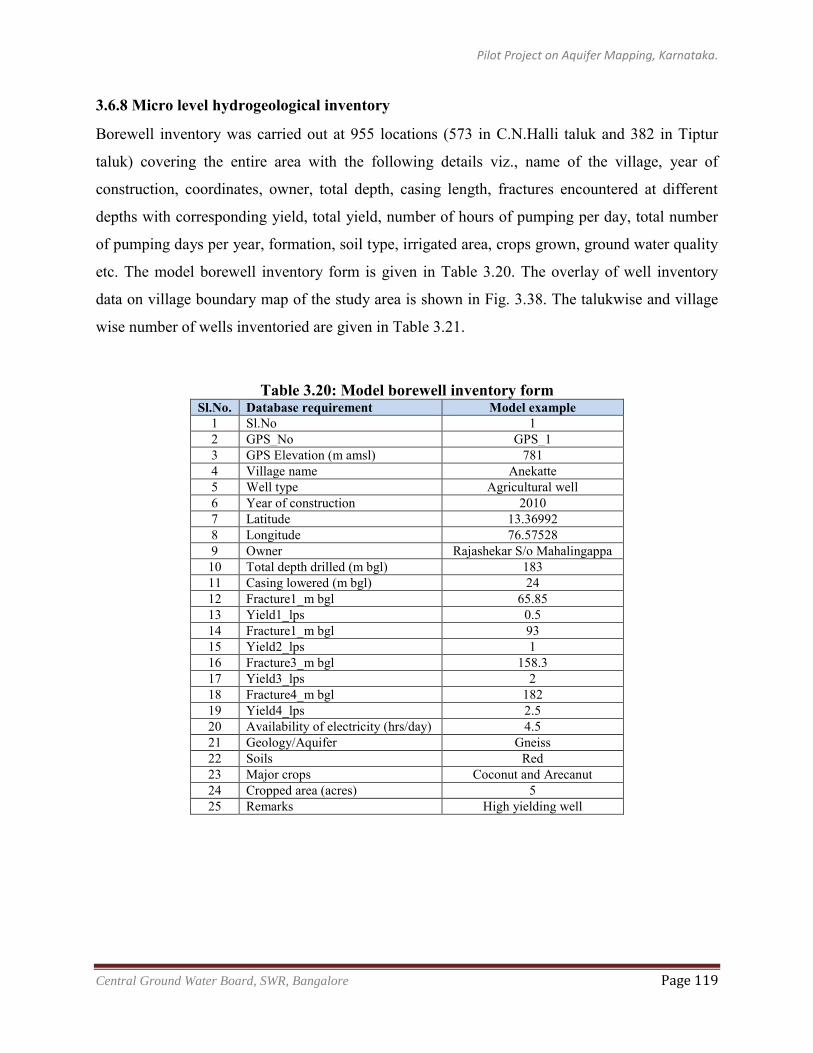
Pilot Project on Aquifer Mapping, Karnataka.
Central Ground Water Board, SWR, Bangalore Page 119
3.6.8 Micro level hydrogeological inventory
Borewell inventory was carried out at 955 locations (573 in C.N.Halli taluk and 382 in Tiptur
taluk) covering the entire area with the following details viz., name of the village, year of
construction, coordinates, owner, total depth, casing length, fractures encountered at different
depths with corresponding yield, total yield, number of hours of pumping per day, total number
of pumping days per year, formation, soil type, irrigated area, crops grown, ground water quality
etc. The model borewell inventory form is given in Table 3.20. The overlay of well inventory
data on village boundary map of the study area is shown in Fig. 3.38. The talukwise and village
wise number of wells inventoried are given in Table 3.21.
Table 3.20: Model borewell inventory form Sl.No. Database requirement Model example
1 Sl.No 1 2 GPS_No GPS_1 3 GPS Elevation (m amsl) 781 4 Village name Anekatte 5 Well type Agricultural well 6 Year of construction 2010 7 Latitude 13.36992 8 Longitude 76.57528 9 Owner Rajashekar S/o Mahalingappa 10 Total depth drilled (m bgl) 183 11 Casing lowered (m bgl) 24 12 Fracture1_m bgl 65.85 13 Yield1_lps 0.5 14 Fracture1_m bgl 93 15 Yield2_lps 1 16 Fracture3_m bgl 158.3 17 Yield3_lps 2 18 Fracture4_m bgl 182 19 Yield4_lps 2.5 20 Availability of electricity (hrs/day) 4.5 21 Geology/Aquifer Gneiss 22 Soils Red 23 Major crops Coconut and Arecanut 24 Cropped area (acres) 5 25 Remarks High yielding well
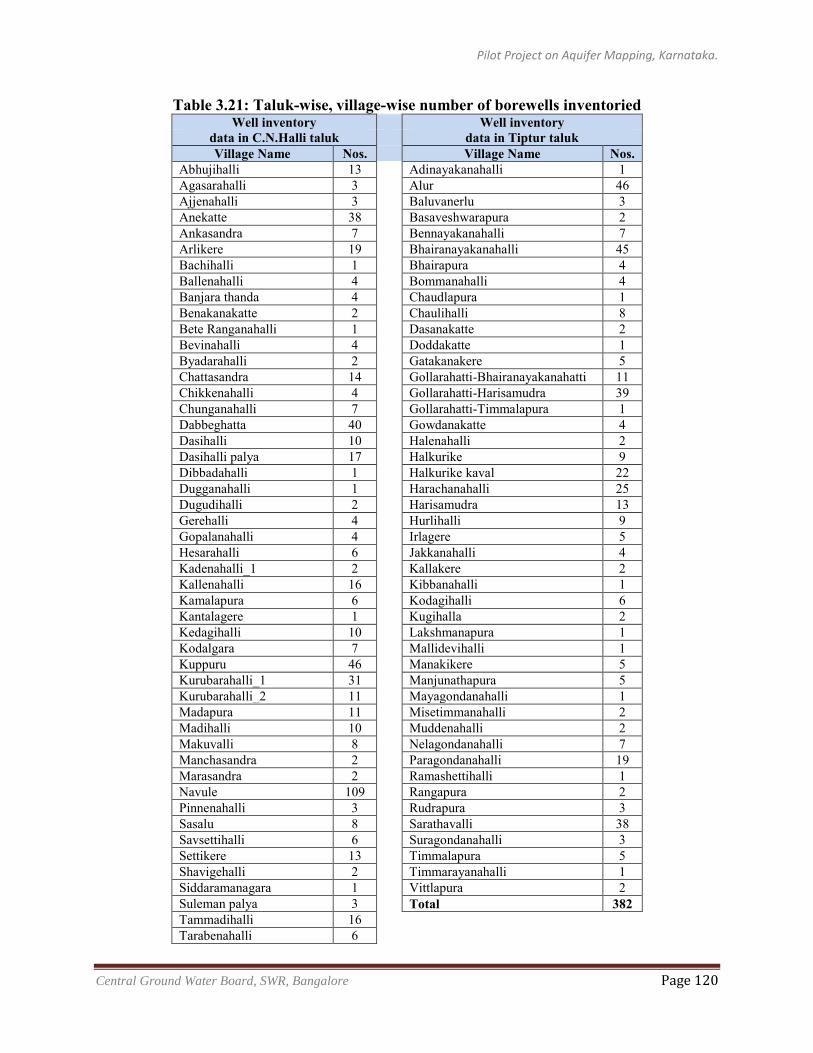
Pilot Project on Aquifer Mapping, Karnataka.
Central Ground Water Board, SWR, Bangalore Page 120
Table 3.21: Taluk-wise, village-wise number of borewells inventoried Well inventory Well inventory
data in C.N.Halli taluk data in Tiptur taluk Village Name Nos. Village Name Nos.
Abhujihalli 13 Adinayakanahalli 1 Agasarahalli 3 Alur 46 Ajjenahalli 3 Baluvanerlu 3 Anekatte 38 Basaveshwarapura 2 Ankasandra 7 Bennayakanahalli 7 Arlikere 19 Bhairanayakanahalli 45 Bachihalli 1 Bhairapura 4 Ballenahalli 4 Bommanahalli 4 Banjara thanda 4 Chaudlapura 1 Benakanakatte 2 Chaulihalli 8 Bete Ranganahalli 1 Dasanakatte 2 Bevinahalli 4 Doddakatte 1 Byadarahalli 2 Gatakanakere 5 Chattasandra 14 Gollarahatti-Bhairanayakanahatti 11 Chikkenahalli 4 Gollarahatti-Harisamudra 39 Chunganahalli 7 Gollarahatti-Timmalapura 1 Dabbeghatta 40 Gowdanakatte 4 Dasihalli 10 Halenahalli 2 Dasihalli palya 17 Halkurike 9 Dibbadahalli 1 Halkurike kaval 22 Dugganahalli 1 Harachanahalli 25 Dugudihalli 2 Harisamudra 13 Gerehalli 4 Hurlihalli 9 Gopalanahalli 4 Irlagere 5 Hesarahalli 6 Jakkanahalli 4 Kadenahalli_1 2 Kallakere 2 Kallenahalli 16 Kibbanahalli 1 Kamalapura 6 Kodagihalli 6 Kantalagere 1 Kugihalla 2 Kedagihalli 10 Lakshmanapura 1 Kodalgara 7 Mallidevihalli 1 Kuppuru 46 Manakikere 5 Kurubarahalli_1 31 Manjunathapura 5 Kurubarahalli_2 11 Mayagondanahalli 1 Madapura 11 Misetimmanahalli 2 Madihalli 10 Muddenahalli 2 Makuvalli 8 Nelagondanahalli 7 Manchasandra 2 Paragondanahalli 19 Marasandra 2 Ramashettihalli 1 Navule 109 Rangapura 2 Pinnenahalli 3 Rudrapura 3 Sasalu 8 Sarathavalli 38 Savsettihalli 6 Suragondanahalli 3 Settikere 13 Timmalapura 5 Shavigehalli 2 Timmarayanahalli 1 Siddaramanagara 1 Vittlapura 2 Suleman palya 3 Total 382 Tammadihalli 16 Tarabenahalli 6
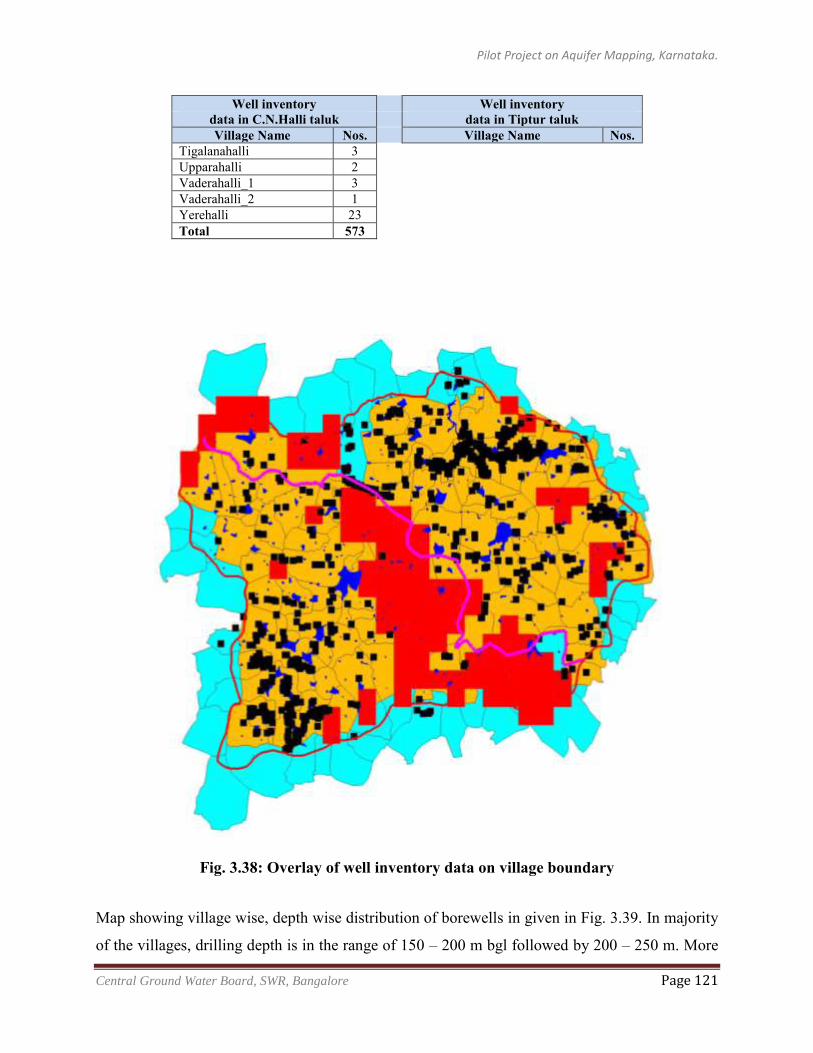
Pilot Project on Aquifer Mapping, Karnataka.
Central Ground Water Board, SWR, Bangalore Page 121
Well inventory Well inventory data in C.N.Halli taluk data in Tiptur taluk Village Name Nos. Village Name Nos.
Tigalanahalli 3 Upparahalli 2 Vaderahalli_1 3 Vaderahalli_2 1 Yerehalli 23 Total 573
Fig. 3.38: Overlay of well inventory data on village boundary
Map showing village wise, depth wise distribution of borewells in given in Fig. 3.39. In majority
of the villages, drilling depth is in the range of 150 – 200 m bgl followed by 200 – 250 m. More
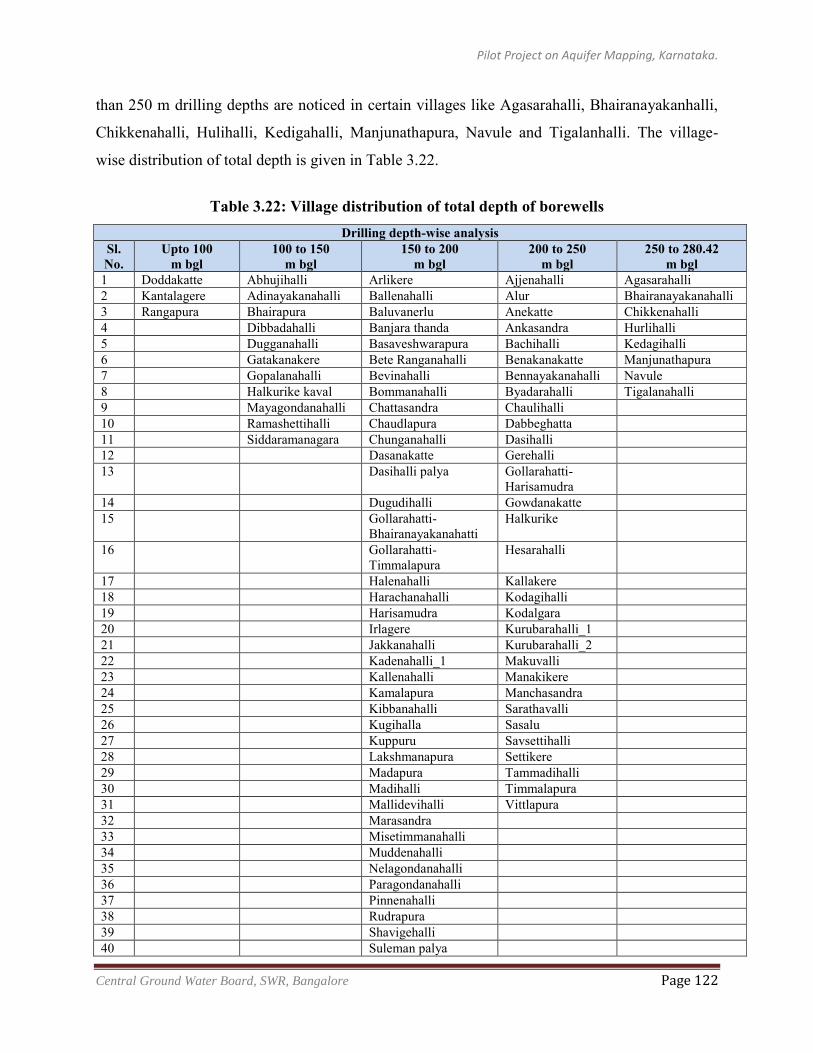
Pilot Project on Aquifer Mapping, Karnataka.
Central Ground Water Board, SWR, Bangalore Page 122
than 250 m drilling depths are noticed in certain villages like Agasarahalli, Bhairanayakanhalli,
Chikkenahalli, Hulihalli, Kedigahalli, Manjunathapura, Navule and Tigalanhalli. The village-
wise distribution of total depth is given in Table 3.22.
Table 3.22: Village distribution of total depth of borewells
Drilling depth-wise analysis Sl. No.
Upto 100 m bgl
100 to 150 m bgl
150 to 200 m bgl
200 to 250 m bgl
250 to 280.42 m bgl
1 Doddakatte Abhujihalli Arlikere Ajjenahalli Agasarahalli 2 Kantalagere Adinayakanahalli Ballenahalli Alur Bhairanayakanahalli 3 Rangapura Bhairapura Baluvanerlu Anekatte Chikkenahalli 4 Dibbadahalli Banjara thanda Ankasandra Hurlihalli 5 Dugganahalli Basaveshwarapura Bachihalli Kedagihalli 6 Gatakanakere Bete Ranganahalli Benakanakatte Manjunathapura 7 Gopalanahalli Bevinahalli Bennayakanahalli Navule 8 Halkurike kaval Bommanahalli Byadarahalli Tigalanahalli 9 Mayagondanahalli Chattasandra Chaulihalli 10 Ramashettihalli Chaudlapura Dabbeghatta 11 Siddaramanagara Chunganahalli Dasihalli 12 Dasanakatte Gerehalli 13 Dasihalli palya Gollarahatti-
Harisamudra
14 Dugudihalli Gowdanakatte 15 Gollarahatti-
Bhairanayakanahatti Halkurike
16 Gollarahatti- Timmalapura
Hesarahalli
17 Halenahalli Kallakere 18 Harachanahalli Kodagihalli 19 Harisamudra Kodalgara 20 Irlagere Kurubarahalli_1 21 Jakkanahalli Kurubarahalli_2 22 Kadenahalli_1 Makuvalli 23 Kallenahalli Manakikere 24 Kamalapura Manchasandra 25 Kibbanahalli Sarathavalli 26 Kugihalla Sasalu 27 Kuppuru Savsettihalli 28 Lakshmanapura Settikere 29 Madapura Tammadihalli 30 Madihalli Timmalapura 31 Mallidevihalli Vittlapura 32 Marasandra 33 Misetimmanahalli 34 Muddenahalli 35 Nelagondanahalli 36 Paragondanahalli 37 Pinnenahalli 38 Rudrapura 39 Shavigehalli 40 Suleman palya
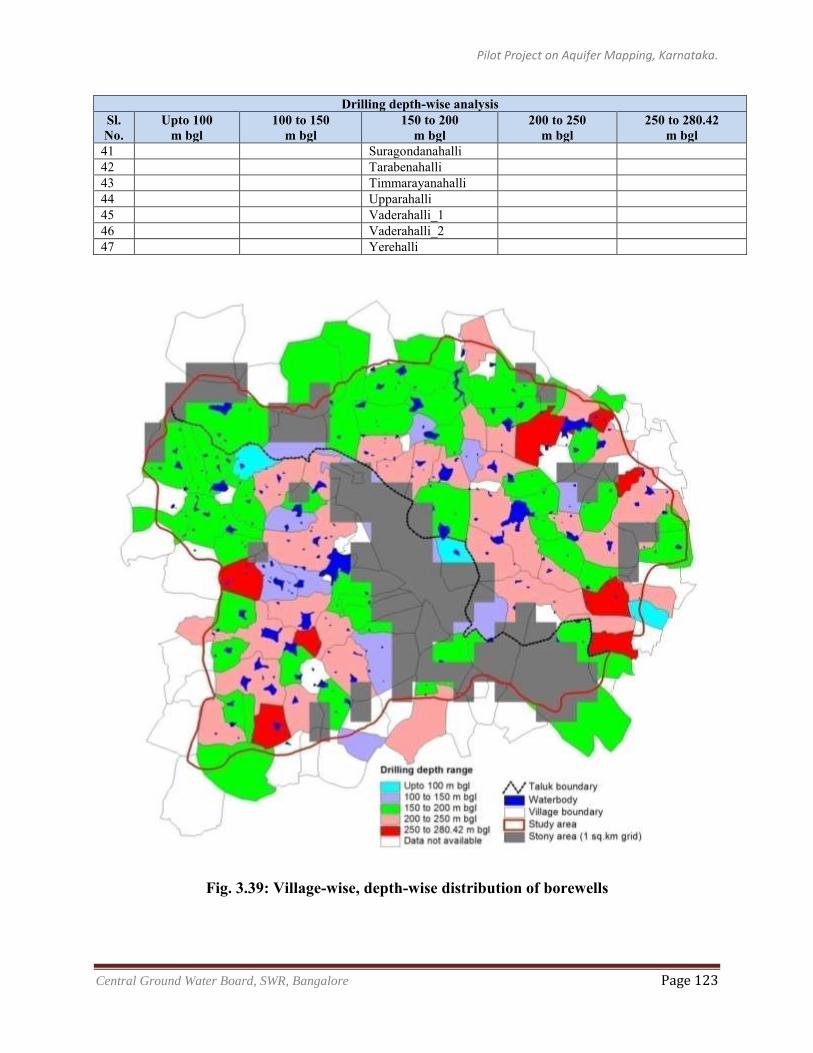
Pilot Project on Aquifer Mapping, Karnataka.
Central Ground Water Board, SWR, Bangalore Page 123
Drilling depth-wise analysis Sl. No.
Upto 100 m bgl
100 to 150 m bgl
150 to 200 m bgl
200 to 250 m bgl
250 to 280.42 m bgl
41 Suragondanahalli 42 Tarabenahalli 43 Timmarayanahalli 44 Upparahalli 45 Vaderahalli_1 46 Vaderahalli_2 47 Yerehalli
Fig. 3.39: Village-wise, depth-wise distribution of borewells
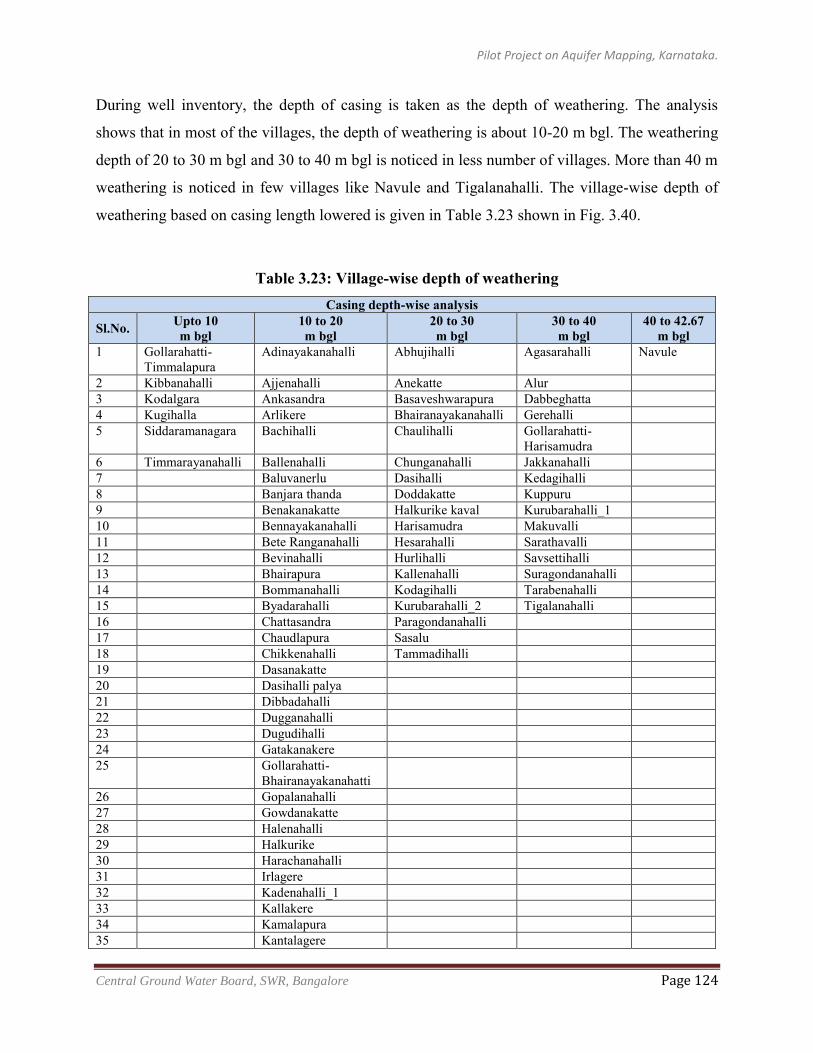
Pilot Project on Aquifer Mapping, Karnataka.
Central Ground Water Board, SWR, Bangalore Page 124
During well inventory, the depth of casing is taken as the depth of weathering. The analysis
shows that in most of the villages, the depth of weathering is about 10-20 m bgl. The weathering
depth of 20 to 30 m bgl and 30 to 40 m bgl is noticed in less number of villages. More than 40 m
weathering is noticed in few villages like Navule and Tigalanahalli. The village-wise depth of
weathering based on casing length lowered is given in Table 3.23 shown in Fig. 3.40.
Table 3.23: Village-wise depth of weathering Casing depth-wise analysis
Sl.No. Upto 10 m bgl
10 to 20 m bgl
20 to 30 m bgl
30 to 40 m bgl
40 to 42.67 m bgl
1 Gollarahatti- Timmalapura
Adinayakanahalli Abhujihalli Agasarahalli Navule
2 Kibbanahalli Ajjenahalli Anekatte Alur 3 Kodalgara Ankasandra Basaveshwarapura Dabbeghatta 4 Kugihalla Arlikere Bhairanayakanahalli Gerehalli 5 Siddaramanagara Bachihalli Chaulihalli Gollarahatti-
Harisamudra
6 Timmarayanahalli Ballenahalli Chunganahalli Jakkanahalli 7 Baluvanerlu Dasihalli Kedagihalli 8 Banjara thanda Doddakatte Kuppuru 9 Benakanakatte Halkurike kaval Kurubarahalli_1 10 Bennayakanahalli Harisamudra Makuvalli 11 Bete Ranganahalli Hesarahalli Sarathavalli 12 Bevinahalli Hurlihalli Savsettihalli 13 Bhairapura Kallenahalli Suragondanahalli 14 Bommanahalli Kodagihalli Tarabenahalli 15 Byadarahalli Kurubarahalli_2 Tigalanahalli 16 Chattasandra Paragondanahalli 17 Chaudlapura Sasalu 18 Chikkenahalli Tammadihalli 19 Dasanakatte 20 Dasihalli palya 21 Dibbadahalli 22 Dugganahalli 23 Dugudihalli 24 Gatakanakere 25 Gollarahatti-
Bhairanayakanahatti
26 Gopalanahalli 27 Gowdanakatte 28 Halenahalli 29 Halkurike 30 Harachanahalli 31 Irlagere 32 Kadenahalli_1 33 Kallakere 34 Kamalapura 35 Kantalagere
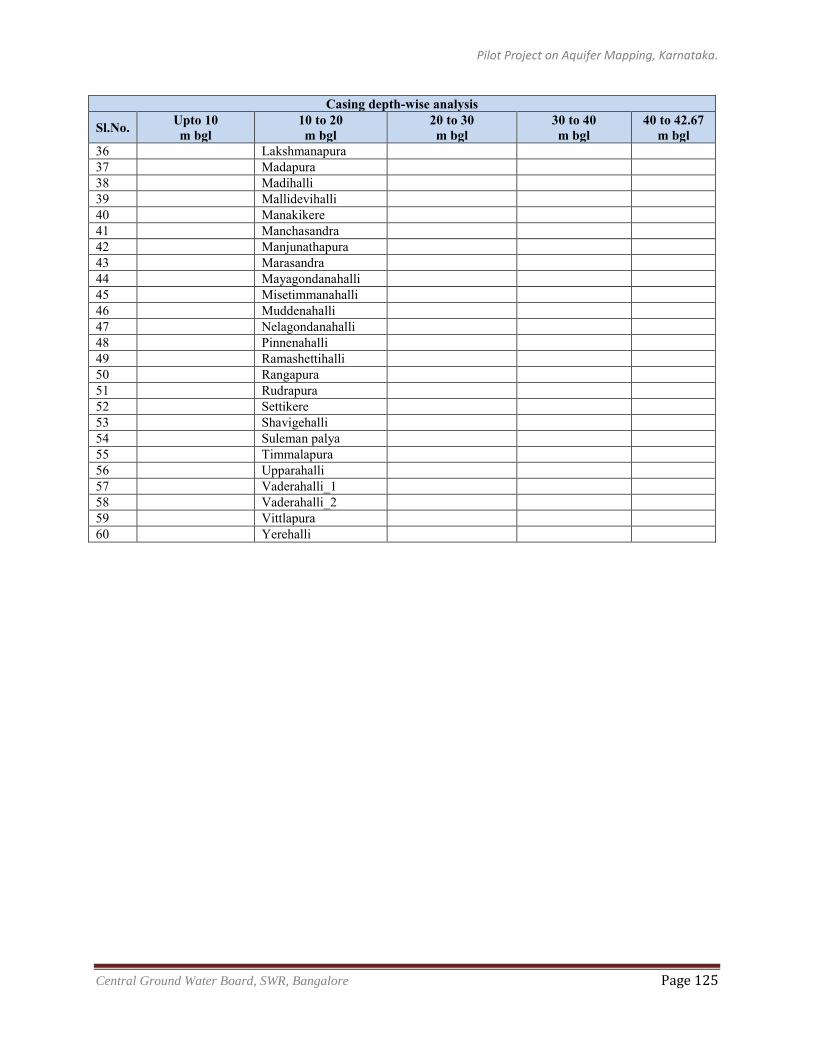
Pilot Project on Aquifer Mapping, Karnataka.
Central Ground Water Board, SWR, Bangalore Page 125
Casing depth-wise analysis
Sl.No. Upto 10 m bgl
10 to 20 m bgl
20 to 30 m bgl
30 to 40 m bgl
40 to 42.67 m bgl
36 Lakshmanapura 37 Madapura 38 Madihalli 39 Mallidevihalli 40 Manakikere 41 Manchasandra 42 Manjunathapura 43 Marasandra 44 Mayagondanahalli 45 Misetimmanahalli 46 Muddenahalli 47 Nelagondanahalli 48 Pinnenahalli 49 Ramashettihalli 50 Rangapura 51 Rudrapura 52 Settikere 53 Shavigehalli 54 Suleman palya 55 Timmalapura 56 Upparahalli 57 Vaderahalli_1 58 Vaderahalli_2 59 Vittlapura 60 Yerehalli
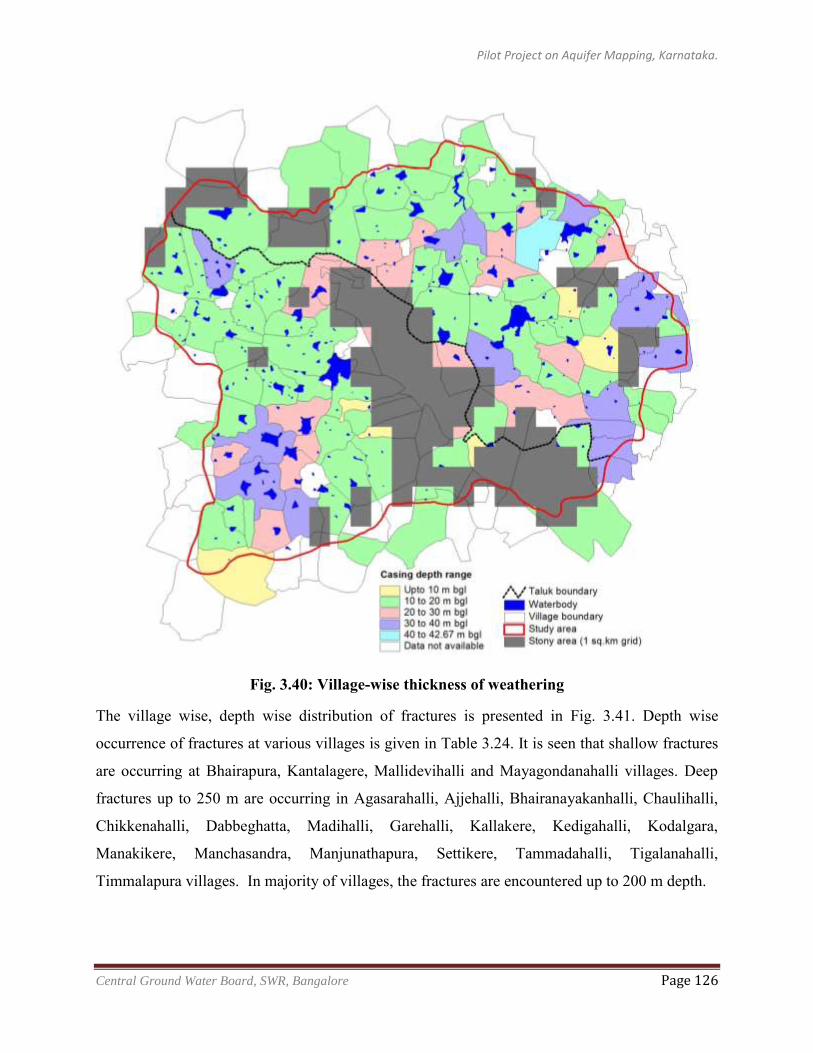
Pilot Project on Aquifer Mapping, Karnataka.
Central Ground Water Board, SWR, Bangalore Page 126
Fig. 3.40: Village-wise thickness of weathering
The village wise, depth wise distribution of fractures is presented in Fig. 3.41. Depth wise
occurrence of fractures at various villages is given in Table 3.24. It is seen that shallow fractures
are occurring at Bhairapura, Kantalagere, Mallidevihalli and Mayagondanahalli villages. Deep
fractures up to 250 m are occurring in Agasarahalli, Ajjehalli, Bhairanayakanhalli, Chaulihalli,
Chikkenahalli, Dabbeghatta, Madihalli, Garehalli, Kallakere, Kedigahalli, Kodalgara,
Manakikere, Manchasandra, Manjunathapura, Settikere, Tammadahalli, Tigalanahalli,
Timmalapura villages. In majority of villages, the fractures are encountered up to 200 m depth.
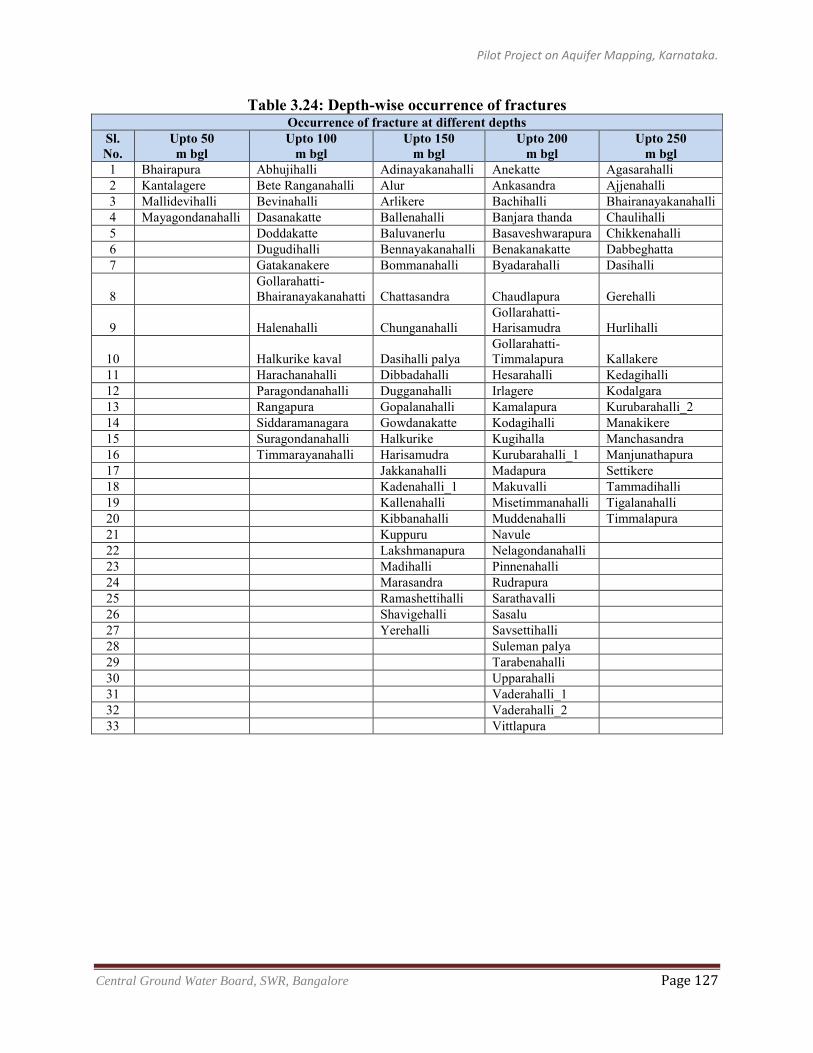
Pilot Project on Aquifer Mapping, Karnataka.
Central Ground Water Board, SWR, Bangalore Page 127
Table 3.24: Depth-wise occurrence of fractures Occurrence of fracture at different depths
Sl. No.
Upto 50 m bgl
Upto 100 m bgl
Upto 150 m bgl
Upto 200 m bgl
Upto 250 m bgl
1 Bhairapura Abhujihalli Adinayakanahalli Anekatte Agasarahalli 2 Kantalagere Bete Ranganahalli Alur Ankasandra Ajjenahalli 3 Mallidevihalli Bevinahalli Arlikere Bachihalli Bhairanayakanahalli 4 Mayagondanahalli Dasanakatte Ballenahalli Banjara thanda Chaulihalli 5
Doddakatte Baluvanerlu Basaveshwarapura Chikkenahalli
6
Dugudihalli Bennayakanahalli Benakanakatte Dabbeghatta 7
Gatakanakere Bommanahalli Byadarahalli Dasihalli
8
Gollarahatti- Bhairanayakanahatti Chattasandra Chaudlapura Gerehalli
9
Halenahalli Chunganahalli Gollarahatti- Harisamudra Hurlihalli
10
Halkurike kaval Dasihalli palya Gollarahatti- Timmalapura Kallakere
11
Harachanahalli Dibbadahalli Hesarahalli Kedagihalli 12
Paragondanahalli Dugganahalli Irlagere Kodalgara
13
Rangapura Gopalanahalli Kamalapura Kurubarahalli_2 14
Siddaramanagara Gowdanakatte Kodagihalli Manakikere
15
Suragondanahalli Halkurike Kugihalla Manchasandra 16
Timmarayanahalli Harisamudra Kurubarahalli_1 Manjunathapura
17
Jakkanahalli Madapura Settikere 18
Kadenahalli_1 Makuvalli Tammadihalli
19
Kallenahalli Misetimmanahalli Tigalanahalli 20
Kibbanahalli Muddenahalli Timmalapura
21
Kuppuru Navule 22
Lakshmanapura Nelagondanahalli
23
Madihalli Pinnenahalli 24
Marasandra Rudrapura
25
Ramashettihalli Sarathavalli 26
Shavigehalli Sasalu
27
Yerehalli Savsettihalli 28
Suleman palya
29
Tarabenahalli 30
Upparahalli
31
Vaderahalli_1 32
Vaderahalli_2
33
Vittlapura
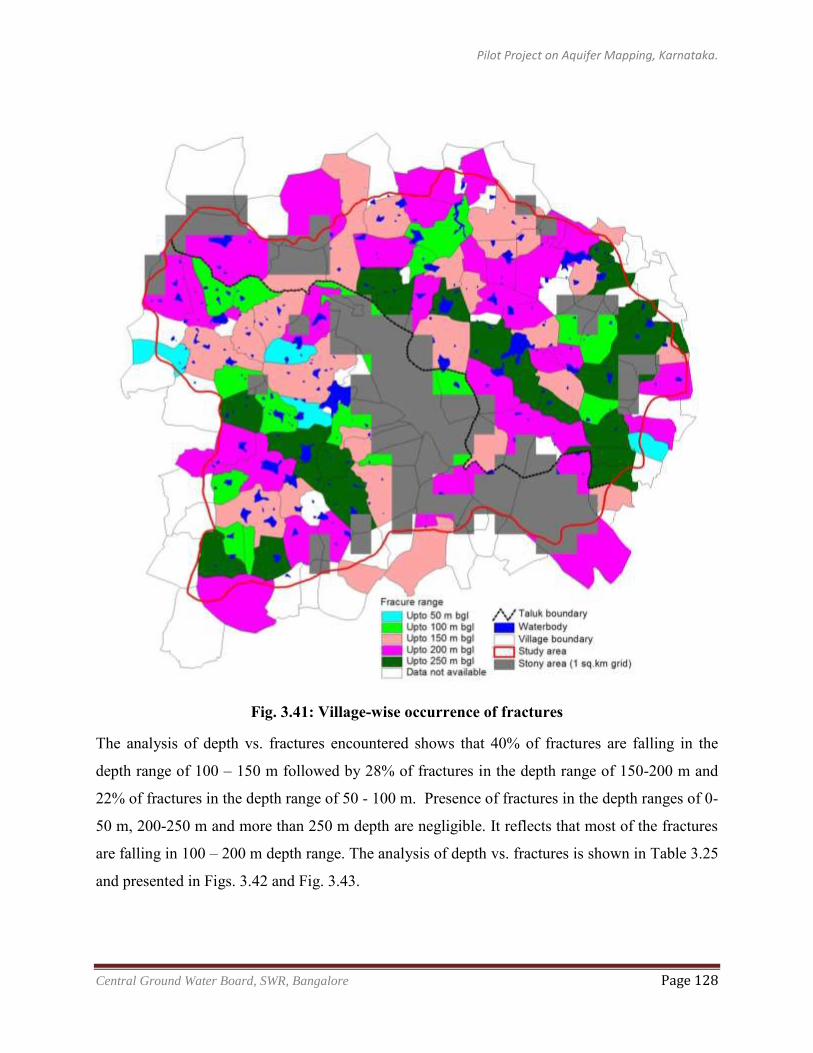
Pilot Project on Aquifer Mapping, Karnataka.
Central Ground Water Board, SWR, Bangalore Page 128
Fig. 3.41: Village-wise occurrence of fractures
The analysis of depth vs. fractures encountered shows that 40% of fractures are falling in the
depth range of 100 – 150 m followed by 28% of fractures in the depth range of 150-200 m and
22% of fractures in the depth range of 50 - 100 m. Presence of fractures in the depth ranges of 0-
50 m, 200-250 m and more than 250 m depth are negligible. It reflects that most of the fractures
are falling in 100 – 200 m depth range. The analysis of depth vs. fractures is shown in Table 3.25
and presented in Figs. 3.42 and Fig. 3.43.
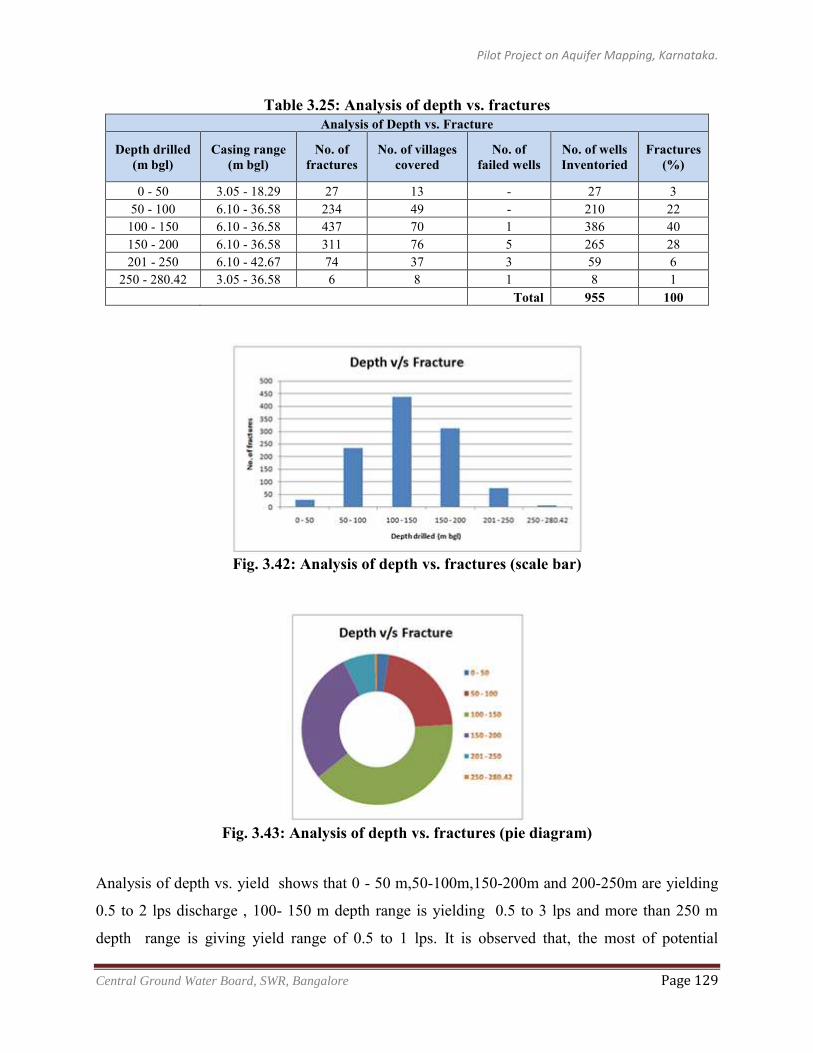
Pilot Project on Aquifer Mapping, Karnataka.
Central Ground Water Board, SWR, Bangalore Page 129
Table 3.25: Analysis of depth vs. fractures Analysis of Depth vs. Fracture
Depth drilled (m bgl)
Casing range (m bgl)
No. of fractures
No. of villages covered
No. of failed wells
No. of wells Inventoried
Fractures (%)
0 - 50 3.05 - 18.29 27 13 - 27 3 50 - 100 6.10 - 36.58 234 49 - 210 22
100 - 150 6.10 - 36.58 437 70 1 386 40 150 - 200 6.10 - 36.58 311 76 5 265 28 201 - 250 6.10 - 42.67 74 37 3 59 6
250 - 280.42 3.05 - 36.58 6 8 1 8 1
Total 955 100
Fig. 3.42: Analysis of depth vs. fractures (scale bar)
Fig. 3.43: Analysis of depth vs. fractures (pie diagram)
Analysis of depth vs. yield shows that 0 - 50 m,50-100m,150-200m and 200-250m are yielding
0.5 to 2 lps discharge , 100- 150 m depth range is yielding 0.5 to 3 lps and more than 250 m
depth range is giving yield range of 0.5 to 1 lps. It is observed that, the most of potential
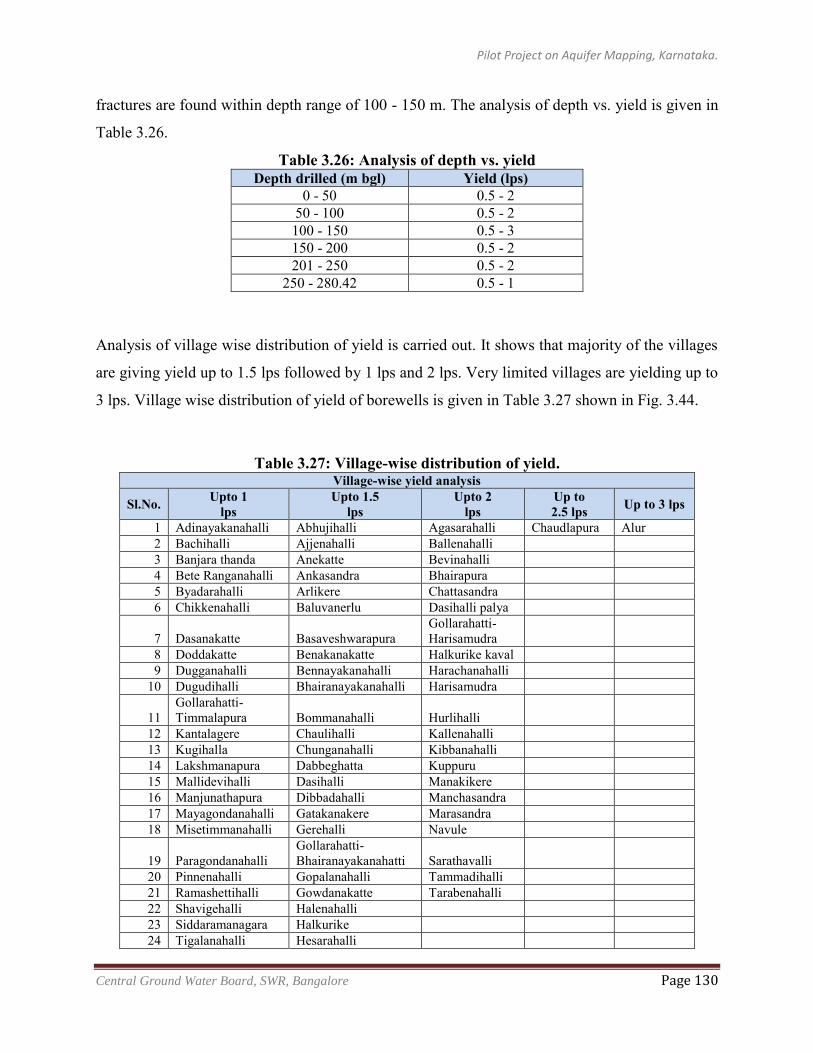
Pilot Project on Aquifer Mapping, Karnataka.
Central Ground Water Board, SWR, Bangalore Page 130
fractures are found within depth range of 100 - 150 m. The analysis of depth vs. yield is given in
Table 3.26.
Table 3.26: Analysis of depth vs. yield Depth drilled (m bgl) Yield (lps)
0 - 50 0.5 - 2 50 - 100 0.5 - 2 100 - 150 0.5 - 3 150 - 200 0.5 - 2 201 - 250 0.5 - 2
250 - 280.42 0.5 - 1
Analysis of village wise distribution of yield is carried out. It shows that majority of the villages
are giving yield up to 1.5 lps followed by 1 lps and 2 lps. Very limited villages are yielding up to
3 lps. Village wise distribution of yield of borewells is given in Table 3.27 shown in Fig. 3.44.
Table 3.27: Village-wise distribution of yield. Village-wise yield analysis
Sl.No. Upto 1 lps
Upto 1.5 lps
Upto 2 lps
Up to 2.5 lps Up to 3 lps
1 Adinayakanahalli Abhujihalli Agasarahalli Chaudlapura Alur 2 Bachihalli Ajjenahalli Ballenahalli
3 Banjara thanda Anekatte Bevinahalli 4 Bete Ranganahalli Ankasandra Bhairapura 5 Byadarahalli Arlikere Chattasandra 6 Chikkenahalli Baluvanerlu Dasihalli palya
7 Dasanakatte Basaveshwarapura Gollarahatti- Harisamudra
8 Doddakatte Benakanakatte Halkurike kaval 9 Dugganahalli Bennayakanahalli Harachanahalli 10 Dugudihalli Bhairanayakanahalli Harisamudra
11 Gollarahatti- Timmalapura Bommanahalli Hurlihalli
12 Kantalagere Chaulihalli Kallenahalli 13 Kugihalla Chunganahalli Kibbanahalli 14 Lakshmanapura Dabbeghatta Kuppuru 15 Mallidevihalli Dasihalli Manakikere 16 Manjunathapura Dibbadahalli Manchasandra 17 Mayagondanahalli Gatakanakere Marasandra 18 Misetimmanahalli Gerehalli Navule
19 Paragondanahalli Gollarahatti- Bhairanayakanahatti Sarathavalli
20 Pinnenahalli Gopalanahalli Tammadihalli 21 Ramashettihalli Gowdanakatte Tarabenahalli 22 Shavigehalli Halenahalli
23 Siddaramanagara Halkurike 24 Tigalanahalli Hesarahalli
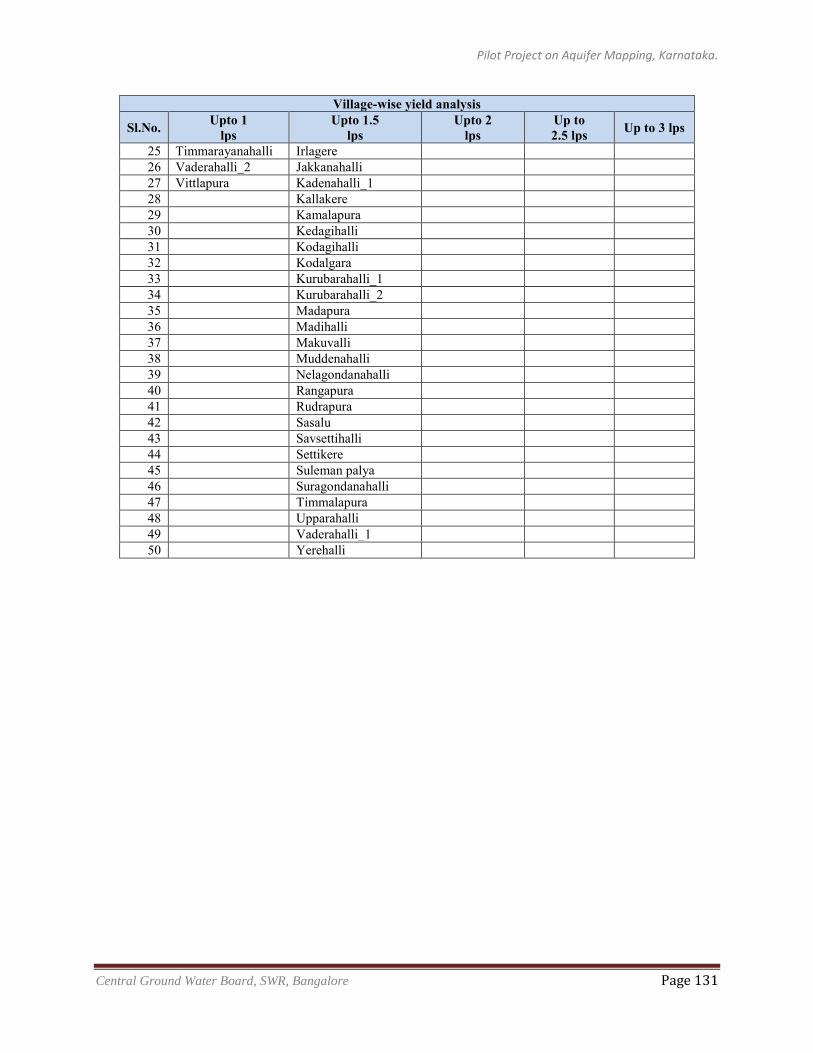
Pilot Project on Aquifer Mapping, Karnataka.
Central Ground Water Board, SWR, Bangalore Page 131
Village-wise yield analysis
Sl.No. Upto 1 lps
Upto 1.5 lps
Upto 2 lps
Up to 2.5 lps Up to 3 lps
25 Timmarayanahalli Irlagere 26 Vaderahalli_2 Jakkanahalli 27 Vittlapura Kadenahalli_1 28
Kallakere
29
Kamalapura 30
Kedagihalli
31
Kodagihalli 32
Kodalgara
33
Kurubarahalli_1 34
Kurubarahalli_2
35
Madapura 36
Madihalli
37
Makuvalli 38
Muddenahalli
39
Nelagondanahalli 40
Rangapura
41
Rudrapura 42
Sasalu
43
Savsettihalli 44
Settikere
45
Suleman palya 46
Suragondanahalli
47
Timmalapura 48
Upparahalli
49
Vaderahalli_1 50
Yerehalli
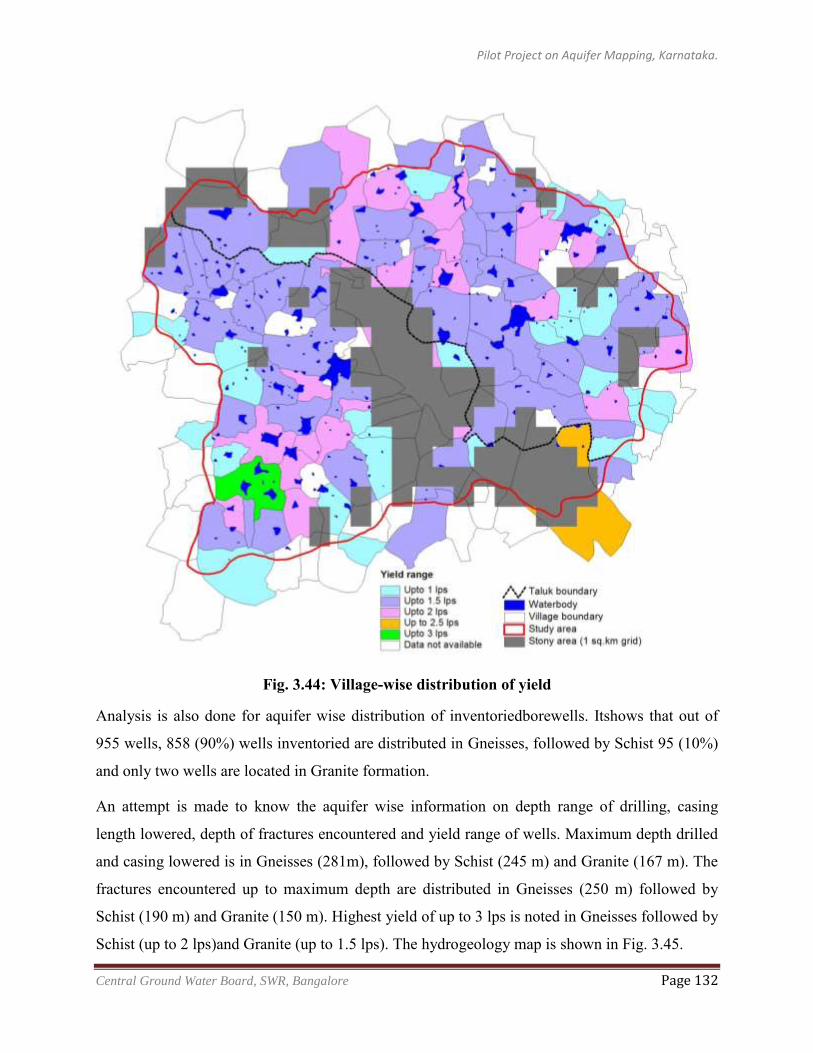
Pilot Project on Aquifer Mapping, Karnataka.
Central Ground Water Board, SWR, Bangalore Page 132
Fig. 3.44: Village-wise distribution of yield
Analysis is also done for aquifer wise distribution of inventoriedborewells. Itshows that out of
955 wells, 858 (90%) wells inventoried are distributed in Gneisses, followed by Schist 95 (10%)
and only two wells are located in Granite formation.
An attempt is made to know the aquifer wise information on depth range of drilling, casing
length lowered, depth of fractures encountered and yield range of wells. Maximum depth drilled
and casing lowered is in Gneisses (281m), followed by Schist (245 m) and Granite (167 m). The
fractures encountered up to maximum depth are distributed in Gneisses (250 m) followed by
Schist (190 m) and Granite (150 m). Highest yield of up to 3 lps is noted in Gneisses followed by
Schist (up to 2 lps)and Granite (up to 1.5 lps). The hydrogeology map is shown in Fig. 3.45.
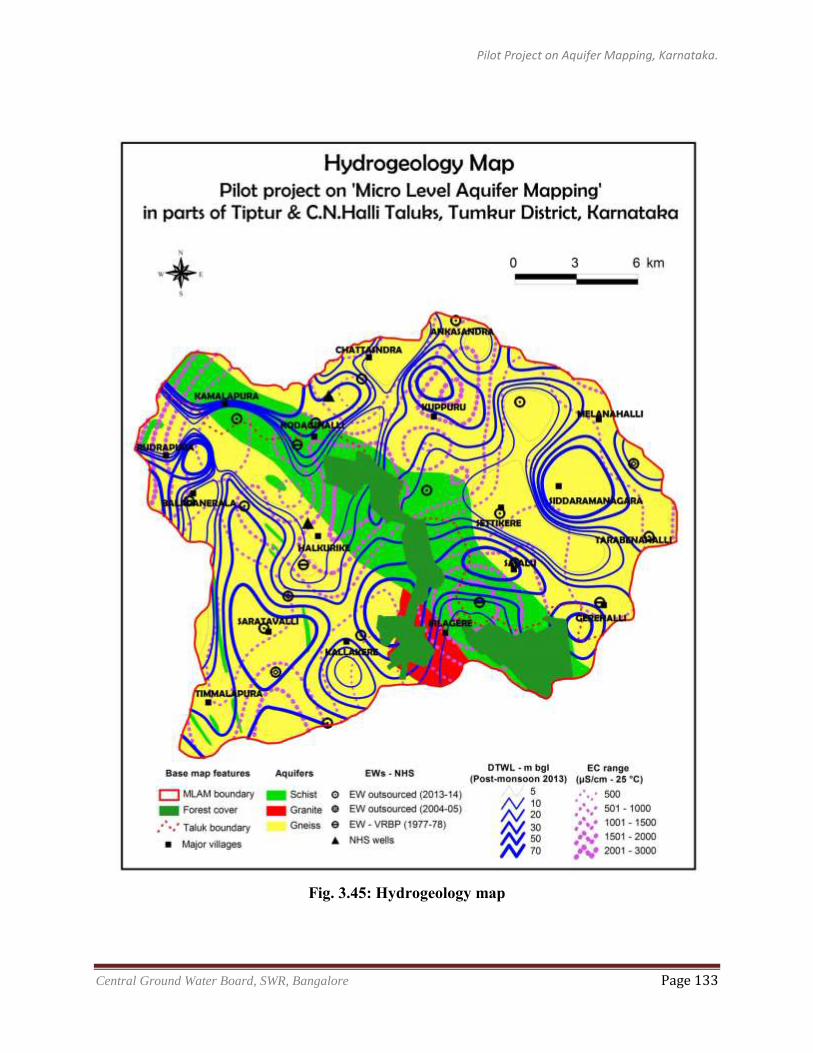
Pilot Project on Aquifer Mapping, Karnataka.
Central Ground Water Board, SWR, Bangalore Page 133
Fig. 3.45: Hydrogeology map
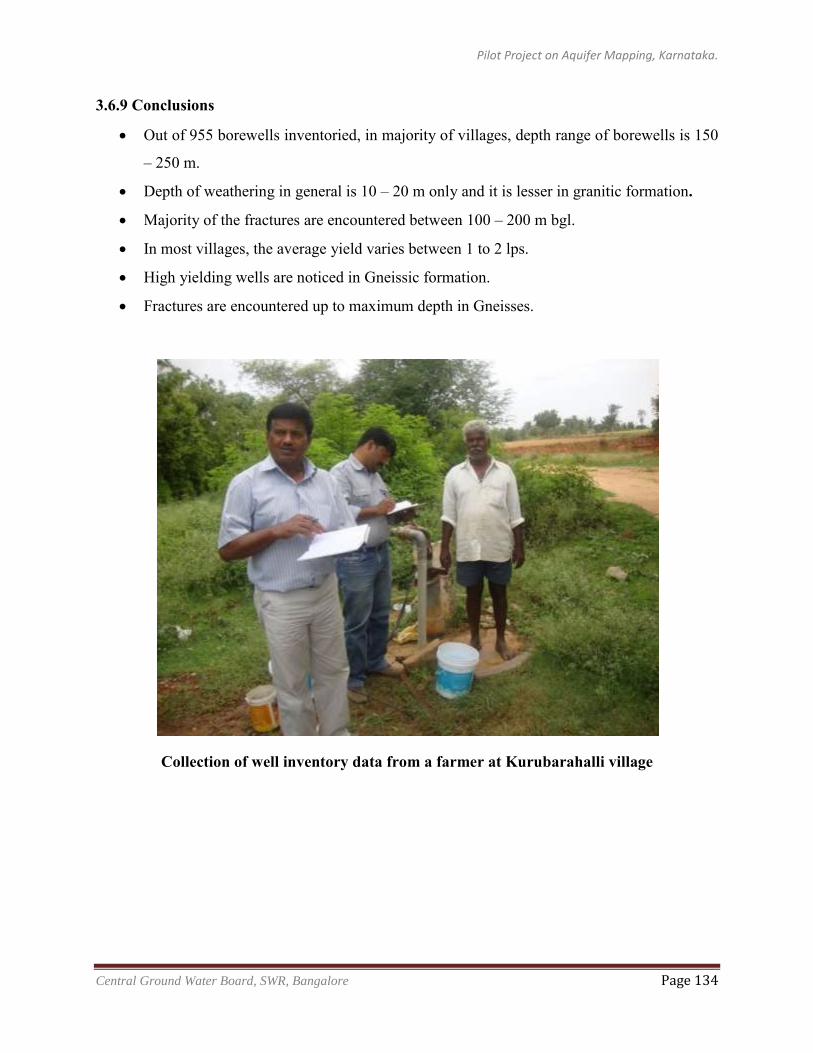
Pilot Project on Aquifer Mapping, Karnataka.
Central Ground Water Board, SWR, Bangalore Page 134
3.6.9 Conclusions
Out of 955 borewells inventoried, in majority of villages, depth range of borewells is 150
– 250 m.
Depth of weathering in general is 10 – 20 m only and it is lesser in granitic formation.
Majority of the fractures are encountered between 100 – 200 m bgl.
In most villages, the average yield varies between 1 to 2 lps.
High yielding wells are noticed in Gneissic formation.
Fractures are encountered up to maximum depth in Gneisses.
Collection of well inventory data from a farmer at Kurubarahalli village
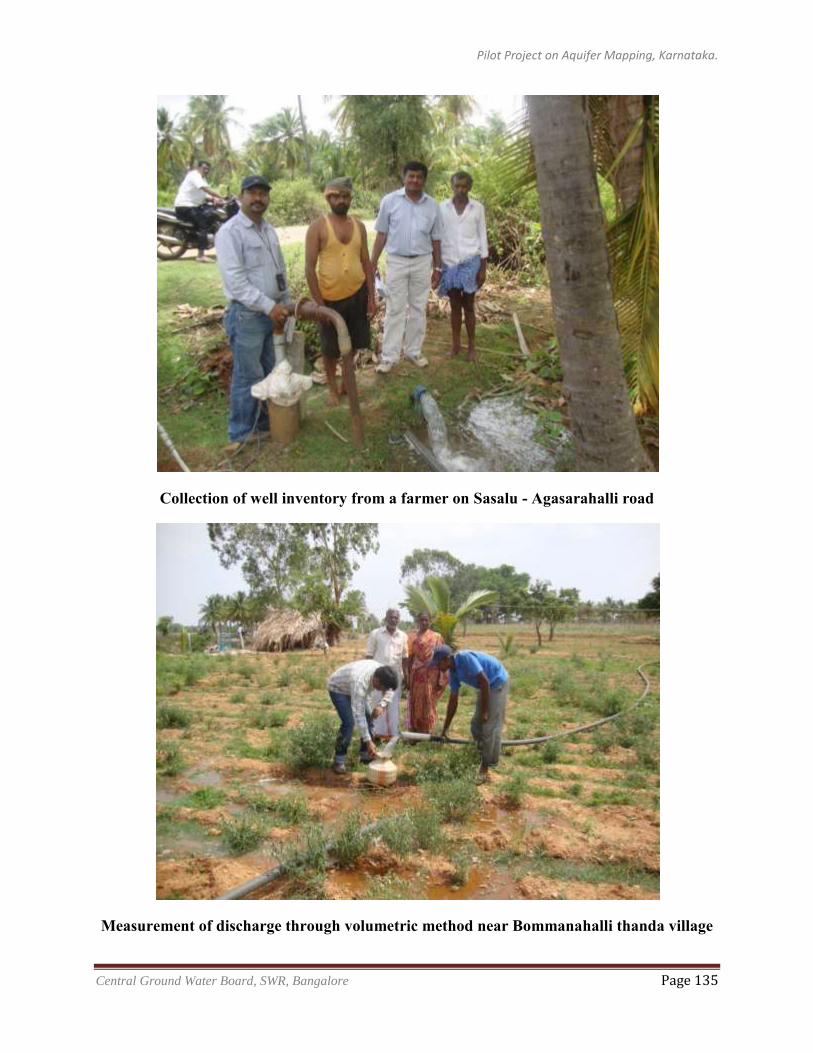
Pilot Project on Aquifer Mapping, Karnataka.
Central Ground Water Board, SWR, Bangalore Page 135
Collection of well inventory from a farmer on Sasalu - Agasarahalli road
Measurement of discharge through volumetric method near Bommanahalli thanda village
Pilot Project on Aquifer Mapping, Karnataka.
Central Ground Water Board, SWR, Bangalore Page 136
3.7 GROUND WATER LEVEL
To study the behaviour of ground water in time and space, 52 observation wells were established
during September 2011, to monitor the ground water levels on monthly basis. Subsequently, the
number of observation wells were increased to 86 for better representation of various aquifers.
As the phreatic aquifer is completely desaturated except in Halkurike and surrounding area,
borewells fitted with hand pumps for rural water supply were established as key observation
wells. Some observation wells were also established outside the boundary of the watershed to
have optimum monitoring mechanism. During the course of study, 14 exploratory wells were
drilled through outsourcing, which are also added to monitoring list and the final count became
104 observation wells. The locations of observation wells are shown in Fig. 3.46. The month-
wise depth to ground water level data of key observation wells are given in Annexure 3.3. The
elevation of ground water level data of observation wells from mean sea level is given in
Annexure 3.4. The ground water level fluctuation data is given in Annexure 3.5.
Based on ground water level data of all the observation wells, three types of maps are generated
Depth to ground water level map for each monitoring
Water table contour map and
Water table fluctuation map
Depth to ground water level map shows the depth to ground water level at that particular time.
Water table contour map shows the water table elevation form mean sea level and gives
information on ground water flow direction and gradient. Water table fluctuation map gives
information on change in ground water level and hence, change in ground water storage between
two different periods of time.
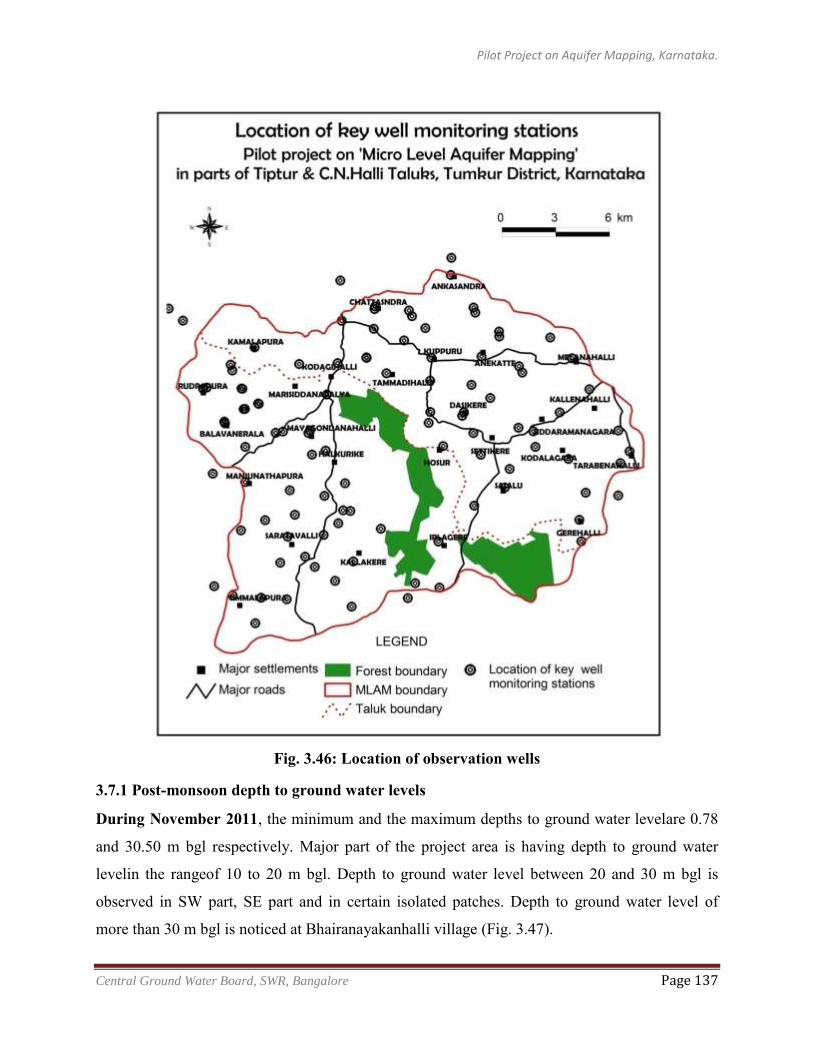
Pilot Project on Aquifer Mapping, Karnataka.
Central Ground Water Board, SWR, Bangalore Page 137
Fig. 3.46: Location of observation wells
3.7.1 Post-monsoon depth to ground water levels
During November 2011, the minimum and the maximum depths to ground water levelare 0.78
and 30.50 m bgl respectively. Major part of the project area is having depth to ground water
levelin the rangeof 10 to 20 m bgl. Depth to ground water level between 20 and 30 m bgl is
observed in SW part, SE part and in certain isolated patches. Depth to ground water level of
more than 30 m bgl is noticed at Bhairanayakanhalli village (Fig. 3.47).
Pilot Project on Aquifer Mapping, Karnataka.
Central Ground Water Board, SWR, Bangalore Page 138
During November 2012, the minimum and the maximum depths to ground water levelare 0.66
and 74.58 m bgl respectively. The major part of the area is having depth to ground water level
ranging from 20 to 50 m bgl. The depth to ground water levels of more than 50 m bgl and also
less than 20 m bgl are noticed in isolated patches (Fig. 3.48).
During September 2013, the minimum and maximum depth to ground water level is 0.49 m to
88.44 m bgl. The major part of the area is having depth to ground water level ranging from 20 –
50 m bgl. Depth to ground water level of more than 50 m is noticed in SW part of the area in
small patches. It is observed that during the post-monsoon period also in general ground water
levels have steadily declined from 10 to 20 m bgl during 2011 to 20 to 50 m bgl during 2013
(Fig. 3.49).
3.7.2 Pre-monsoon depth to ground water levels
During May 2012, the minimum and the maximum depths to ground water level are 1.81 to
47.76 m bgl respectively. The major part of the area is having depth to ground water level
ranging from 10 to 30 m bgl. Depth to ground water level of more than 30 m bgl is noticed in
SW part of the area (Fig. 3.50).
During May 2013, the minimum and the maximum depths to ground water levelare 3.67 to
88.44 m bgl respectively. The major part of the area is having depth to ground water level
ranging from 30 to 50 m bgl. Depth to ground water level of more than 50 m bgl is noticed in
SW part and SE part of the area (Fig. 3.51).
During April 2014, the minimum and the maximum depths to ground water levelare3.58 to
132.87 m bgl respectively. The major part of the area is having depth to ground water level
ranging from 30-50 m bgl. Depth to ground water level of more than 50 m bgl is noticed in SW
part, NE part and Northern part of the area (Fig. 3.52). As in the case of pre-monsoon, ground
water levels also have declined from 10 to 30 m bgl during May 2012 to 30 to 50 m bgl during
April 2014.
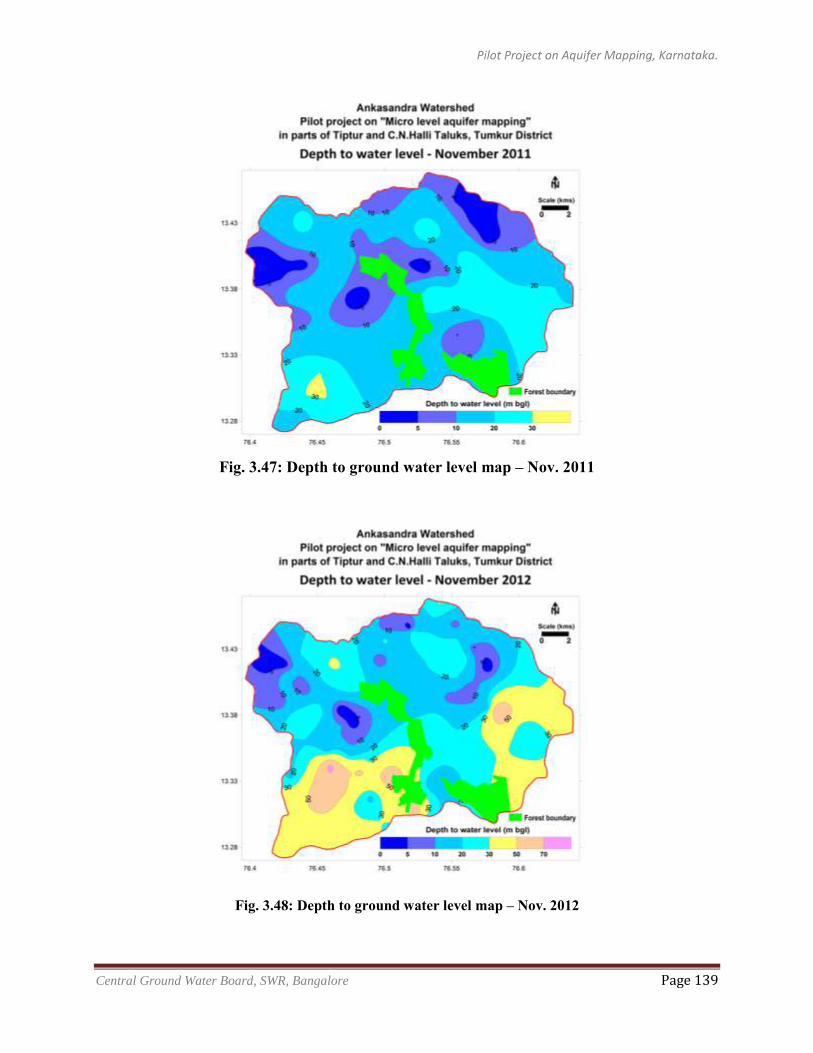
Pilot Project on Aquifer Mapping, Karnataka.
Central Ground Water Board, SWR, Bangalore Page 139
Fig. 3.47: Depth to ground water level map – Nov. 2011
Fig. 3.48: Depth to ground water level map – Nov. 2012
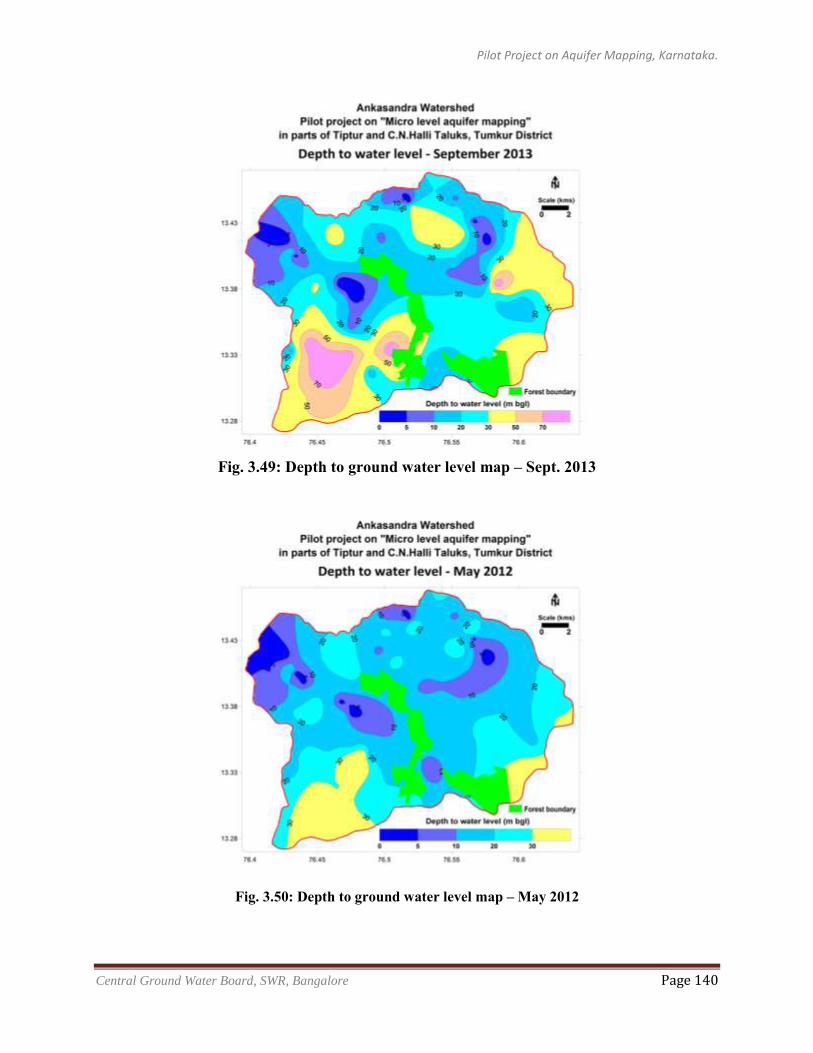
Pilot Project on Aquifer Mapping, Karnataka.
Central Ground Water Board, SWR, Bangalore Page 140
Fig. 3.49: Depth to ground water level map – Sept. 2013
Fig. 3.50: Depth to ground water level map – May 2012
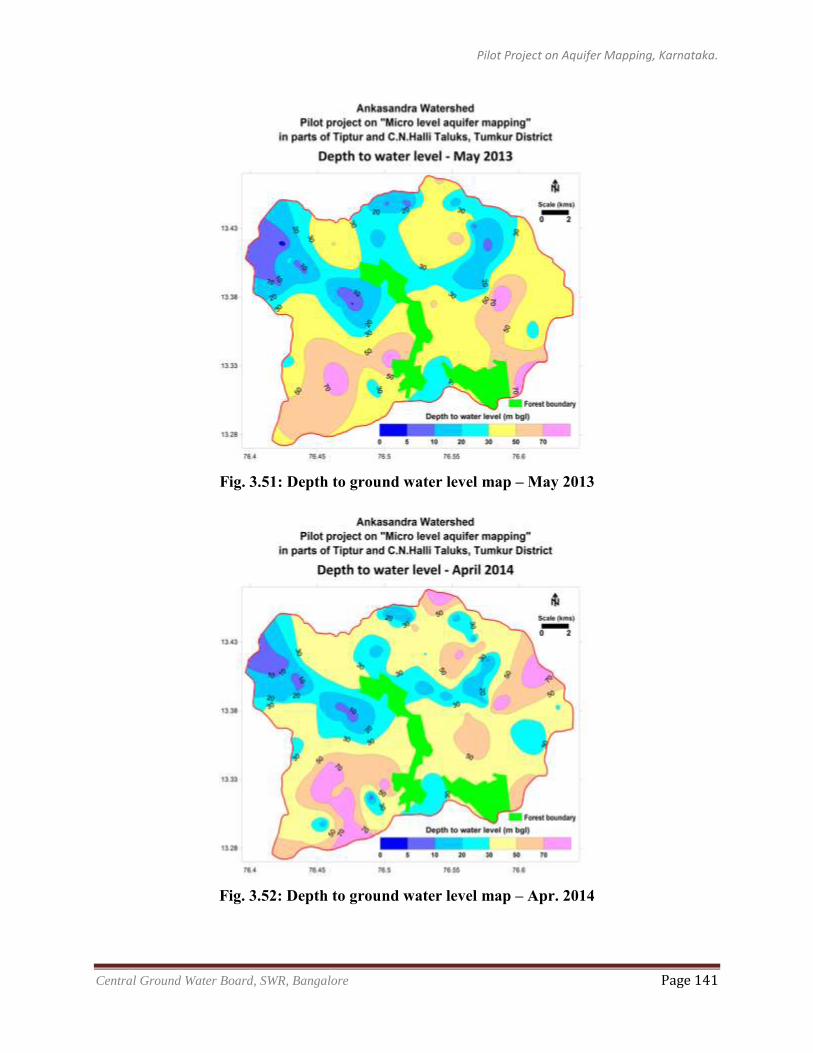
Pilot Project on Aquifer Mapping, Karnataka.
Central Ground Water Board, SWR, Bangalore Page 141
Fig. 3.51: Depth to ground water level map – May 2013
Fig. 3.52: Depth to ground water level map – Apr. 2014
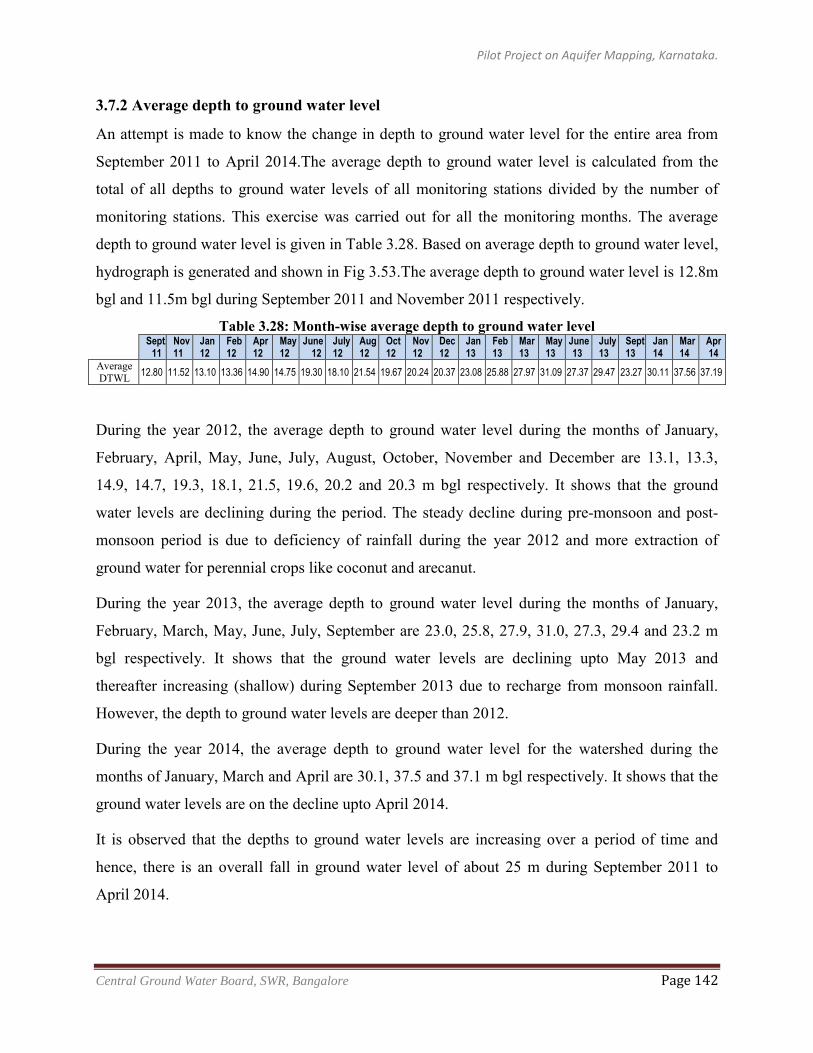
Pilot Project on Aquifer Mapping, Karnataka.
Central Ground Water Board, SWR, Bangalore Page 142
3.7.2 Average depth to ground water level
An attempt is made to know the change in depth to ground water level for the entire area from
September 2011 to April 2014.The average depth to ground water level is calculated from the
total of all depths to ground water levels of all monitoring stations divided by the number of
monitoring stations. This exercise was carried out for all the monitoring months. The average
depth to ground water level is given in Table 3.28. Based on average depth to ground water level,
hydrograph is generated and shown in Fig 3.53.The average depth to ground water level is 12.8m
bgl and 11.5m bgl during September 2011 and November 2011 respectively.
Table 3.28: Month-wise average depth to ground water level
Sept.
11 Nov 11
Jan 12
Feb 12
Apr 12
May 12
June 12
July 12
Aug 12
Oct 12
Nov 12
Dec 12
Jan 13
Feb 13
Mar 13
May 13
June 13
July 13
Sept. 13
Jan 14
Mar 14
Apr 14
Average DTWL 12.80 11.52 13.10 13.36 14.90 14.75 19.30 18.10 21.54 19.67 20.24 20.37 23.08 25.88 27.97 31.09 27.37 29.47 23.27 30.11 37.56 37.19
During the year 2012, the average depth to ground water level during the months of January,
February, April, May, June, July, August, October, November and December are 13.1, 13.3,
14.9, 14.7, 19.3, 18.1, 21.5, 19.6, 20.2 and 20.3 m bgl respectively. It shows that the ground
water levels are declining during the period. The steady decline during pre-monsoon and post-
monsoon period is due to deficiency of rainfall during the year 2012 and more extraction of
ground water for perennial crops like coconut and arecanut.
During the year 2013, the average depth to ground water level during the months of January,
February, March, May, June, July, September are 23.0, 25.8, 27.9, 31.0, 27.3, 29.4 and 23.2 m
bgl respectively. It shows that the ground water levels are declining upto May 2013 and
thereafter increasing (shallow) during September 2013 due to recharge from monsoon rainfall.
However, the depth to ground water levels are deeper than 2012.
During the year 2014, the average depth to ground water level for the watershed during the
months of January, March and April are 30.1, 37.5 and 37.1 m bgl respectively. It shows that the
ground water levels are on the decline upto April 2014.
It is observed that the depths to ground water levels are increasing over a period of time and
hence, there is an overall fall in ground water level of about 25 m during September 2011 to
April 2014.
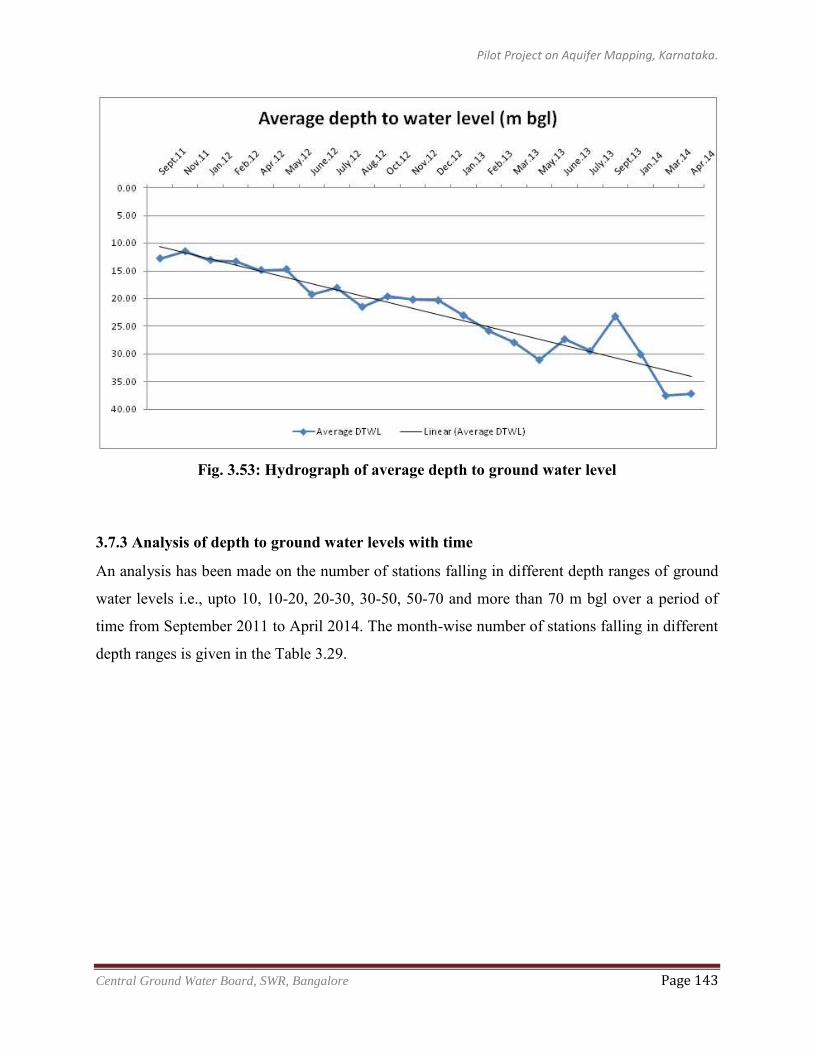
Pilot Project on Aquifer Mapping, Karnataka.
Central Ground Water Board, SWR, Bangalore Page 143
Fig. 3.53: Hydrograph of average depth to ground water level
3.7.3 Analysis of depth to ground water levels with time
An analysis has been made on the number of stations falling in different depth ranges of ground
water levels i.e., upto 10, 10-20, 20-30, 30-50, 50-70 and more than 70 m bgl over a period of
time from September 2011 to April 2014. The month-wise number of stations falling in different
depth ranges is given in the Table 3.29.
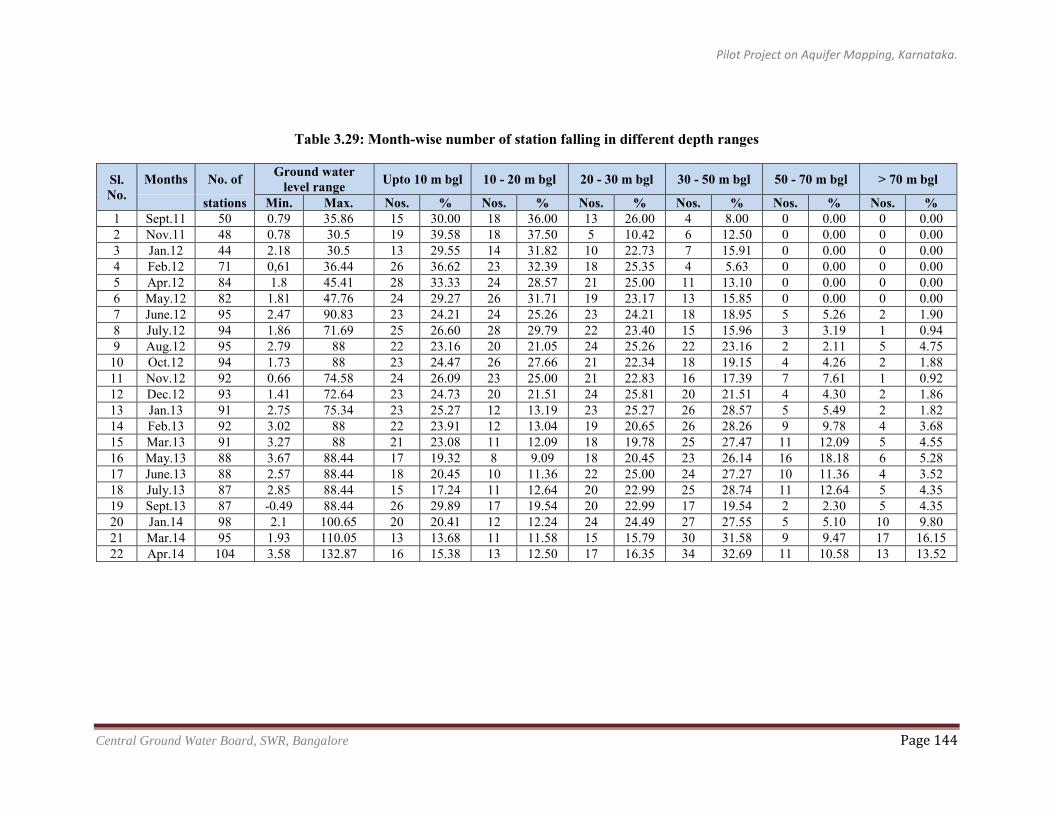
Pilot Project on Aquifer Mapping, Karnataka.
Central Ground Water Board, SWR, Bangalore Page 144
Table 3.29: Month-wise number of station falling in different depth ranges
Sl. No.
Months No. of Ground water level range Upto 10 m bgl 10 - 20 m bgl 20 - 30 m bgl 30 - 50 m bgl 50 - 70 m bgl > 70 m bgl
stations Min. Max. Nos. % Nos. % Nos. % Nos. % Nos. % Nos. % 1 Sept.11 50 0.79 35.86 15 30.00 18 36.00 13 26.00 4 8.00 0 0.00 0 0.00 2 Nov.11 48 0.78 30.5 19 39.58 18 37.50 5 10.42 6 12.50 0 0.00 0 0.00 3 Jan.12 44 2.18 30.5 13 29.55 14 31.82 10 22.73 7 15.91 0 0.00 0 0.00 4 Feb.12 71 0,61 36.44 26 36.62 23 32.39 18 25.35 4 5.63 0 0.00 0 0.00 5 Apr.12 84 1.8 45.41 28 33.33 24 28.57 21 25.00 11 13.10 0 0.00 0 0.00 6 May.12 82 1.81 47.76 24 29.27 26 31.71 19 23.17 13 15.85 0 0.00 0 0.00 7 June.12 95 2.47 90.83 23 24.21 24 25.26 23 24.21 18 18.95 5 5.26 2 1.90 8 July.12 94 1.86 71.69 25 26.60 28 29.79 22 23.40 15 15.96 3 3.19 1 0.94 9 Aug.12 95 2.79 88 22 23.16 20 21.05 24 25.26 22 23.16 2 2.11 5 4.75
10 Oct.12 94 1.73 88 23 24.47 26 27.66 21 22.34 18 19.15 4 4.26 2 1.88 11 Nov.12 92 0.66 74.58 24 26.09 23 25.00 21 22.83 16 17.39 7 7.61 1 0.92 12 Dec.12 93 1.41 72.64 23 24.73 20 21.51 24 25.81 20 21.51 4 4.30 2 1.86 13 Jan.13 91 2.75 75.34 23 25.27 12 13.19 23 25.27 26 28.57 5 5.49 2 1.82 14 Feb.13 92 3.02 88 22 23.91 12 13.04 19 20.65 26 28.26 9 9.78 4 3.68 15 Mar.13 91 3.27 88 21 23.08 11 12.09 18 19.78 25 27.47 11 12.09 5 4.55 16 May.13 88 3.67 88.44 17 19.32 8 9.09 18 20.45 23 26.14 16 18.18 6 5.28 17 June.13 88 2.57 88.44 18 20.45 10 11.36 22 25.00 24 27.27 10 11.36 4 3.52 18 July.13 87 2.85 88.44 15 17.24 11 12.64 20 22.99 25 28.74 11 12.64 5 4.35 19 Sept.13 87 -0.49 88.44 26 29.89 17 19.54 20 22.99 17 19.54 2 2.30 5 4.35 20 Jan.14 98 2.1 100.65 20 20.41 12 12.24 24 24.49 27 27.55 5 5.10 10 9.80 21 Mar.14 95 1.93 110.05 13 13.68 11 11.58 15 15.79 30 31.58 9 9.47 17 16.15 22 Apr.14 104 3.58 132.87 16 15.38 13 12.50 17 16.35 34 32.69 11 10.58 13 13.52
Pilot Project on Aquifer Mapping, Karnataka.
Central Ground Water Board, SWR, Bangalore Page 145
The analysis shows that during September 2011, 30% of stations are having depths to ground
water levels less than 10 m bgl, 36% of stations between 10-20 m bgl, 26% of stations between
20-30 m bgl and only 8% of the stations are having depth toground water levels between 30-50
m bgl. No station was having ground water level deeper than 36 m bgl. By the end of April 2014,
it is observed that there is a major change in the depth to ground water level scenario in the study
area. The number of stations having ground water level upto 10 m bgl gradually decreased from
30% at the beginning of the monitoring to 15% in April 2014 whereas, the number of stations
showing deeper ground water levels from 50-70 and more than 70 m bgl increased from nil to
11% and nil to 14% respectively by April 2014 i.e., in more than 25% of the wells, the ground
water level have gone down more than 50 m bgl. It indicates the decline inground water levels
over the period of time from September 2011 to April 2014.
3.7.4 Depth to water table elevation
During September 2011, the minimum and the maximum water table elevations are 708.36 m
amsl at Kuppur and 858.77 m amsl at Bandegate village respectively. The majority of the area is
having water table elevation between 750 to 800 m amsl. Water table elevation between 725 to
750 m amsl is noticed in the northern part whereas, more than 800 m amsl is noticed along the
southern boundary of the watershed. The water table gradient is about 8.33 m/km at Bandegate
village towards north and about 6 m/km near Kupparadoddahalli village towards northeast.
During November 2011, the water table elevation ranges from 708.36 m amsl at Kuppur to
858.43 m amsl at Bandegate village. The majority of the area is having water table elevation
between 750 to 800 m amsl. Water table elevation between 725 to 750 m amsl is noticed in the
northern part whereas, more than 800 m amsl is noticed along the southern boundary of the
watershed. The water table gradient is about 8.33 m/km at Bandegate village towards north and
about 6 m/km near Kupparadoddahalli village towards northeast (Fig. 3.54).
During May 2012, the water table elevation ranges from 703.18 m amsl at Ankasandra to
865.25 m amsl at Bandegate village. The majority of the area is having water table elevation
between 725 to 800 m amsl. Water table elevation of less than 725 m amsl is noticed near
Ankasandra village whereas, more than 800 m amsl is noticed along the southern boundary of
the watershed. The water table gradient is about 9 m/km at Bandegate village towards north and
about 6.48 m/km near Kupparadoddahalli village towards northeast (Fig. 3.55).
Pilot Project on Aquifer Mapping, Karnataka.
Central Ground Water Board, SWR, Bangalore Page 146
During November 2012, the water table elevation ranges from 696.41 m amsl at Ankasandra to
856.17 m amsl at Bandegate village. The majority of the area is having water table elevation
between 725 to 800 m amsl. Water table elevation of less than 725 m amsl is noticed in the
northern part in a very small area whereas, more than 800 m amsl is noticed along the southern
boundary of the watershed over a small area. The water table gradient is about 8.88 m/km at
Bandegate village towards north and about 6.4 m/km near Kupparadoddahalli village towards
northeast (Fig. 3.56).
During May 2013, the water table elevation ranges from 672.36 m amsl at Ankasandra to
852.62 m amsl at Kaval village. The water table elevation map shows that majority of the area is
having water table elevation between 725 to 775 m amsl. Water table elevation of less than 725
m amsl is noticed near Ankasandra village whereas, more than 775 m amsl is noticed mostly
along the southern boundary of the watershed. The water table gradient is about 10 m/km at
Bandegate village towards north and about 7.2 m/km near Kupparadoddahalli village towards
northeast (Fig. 3.57).
During September 2013, the water table elevation ranges from 695.86 m amsl at Kuppuru to
868.28 m amsl at Bandegate village. The water table elevation map shows that majority of the
area is having water table elevation between 725 to 775 m amsl. Water table elevation less than
725 m amsl is noticed near Ankasandra village and also around Sarathavalli village. More than
775 m amsl is noticed mostly along the southern and western boundary of the watershed. The
water table gradient is about 9.55 m/km at Bandegate village towards north and about 6.88 m/km
near Kupparadoddahalli village towards northeast (Fig. 3.58).
During April 2014, the water table elevation ranges from 631.06 m amsl at Ankasandra to
853.58 m amsl at Kaval village. The majority of the area is having water table elevation between
700 to 775 m amsl. Water table elevation less than 700 m amsl is noticed near Ankasandra
village whereas, more than 775 m amsl is noticed mostly along the southern, south eastern and
western boundary of the watershed. The water table gradient is about 12.33 m/km at Bandegate
towards north and about 8.88 m/km near Kupparadoddahalli towards northeast (Fig. 3.59).
Initially the water table gradient was between 6 to 8m/km during 2011.Subsequently, water table
gradient varied between 8 to 10m/km.
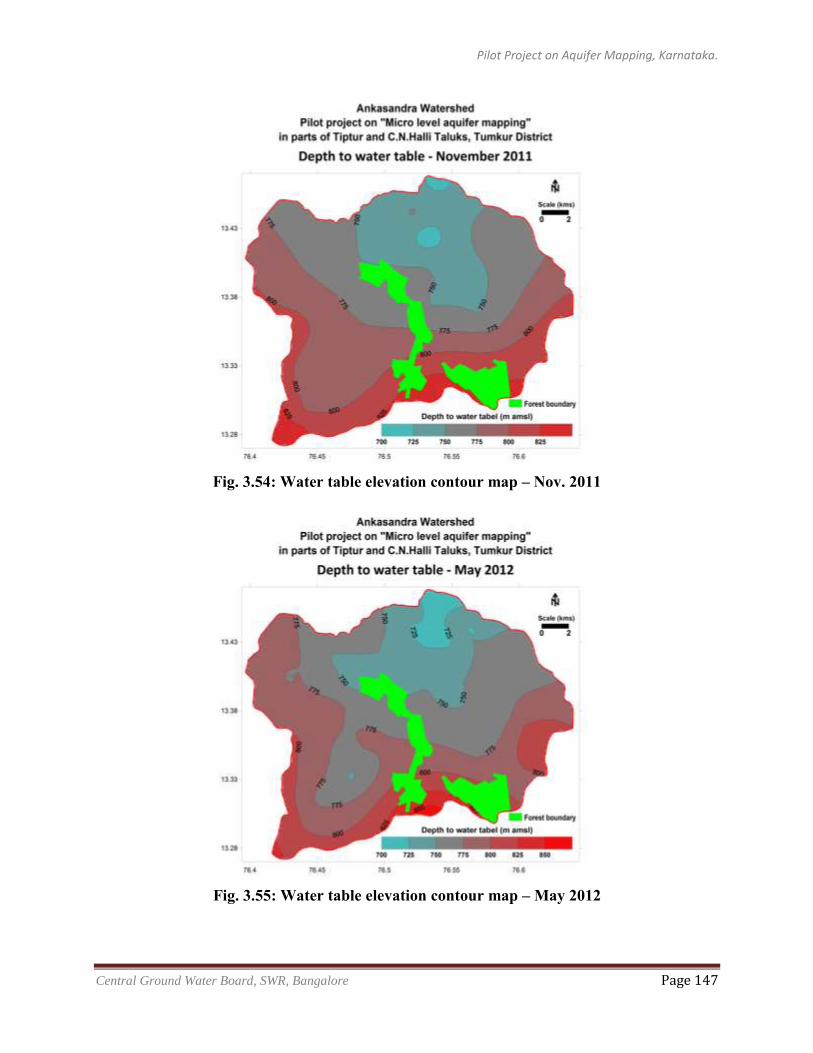
Pilot Project on Aquifer Mapping, Karnataka.
Central Ground Water Board, SWR, Bangalore Page 147
Fig. 3.54: Water table elevation contour map – Nov. 2011
Fig. 3.55: Water table elevation contour map – May 2012
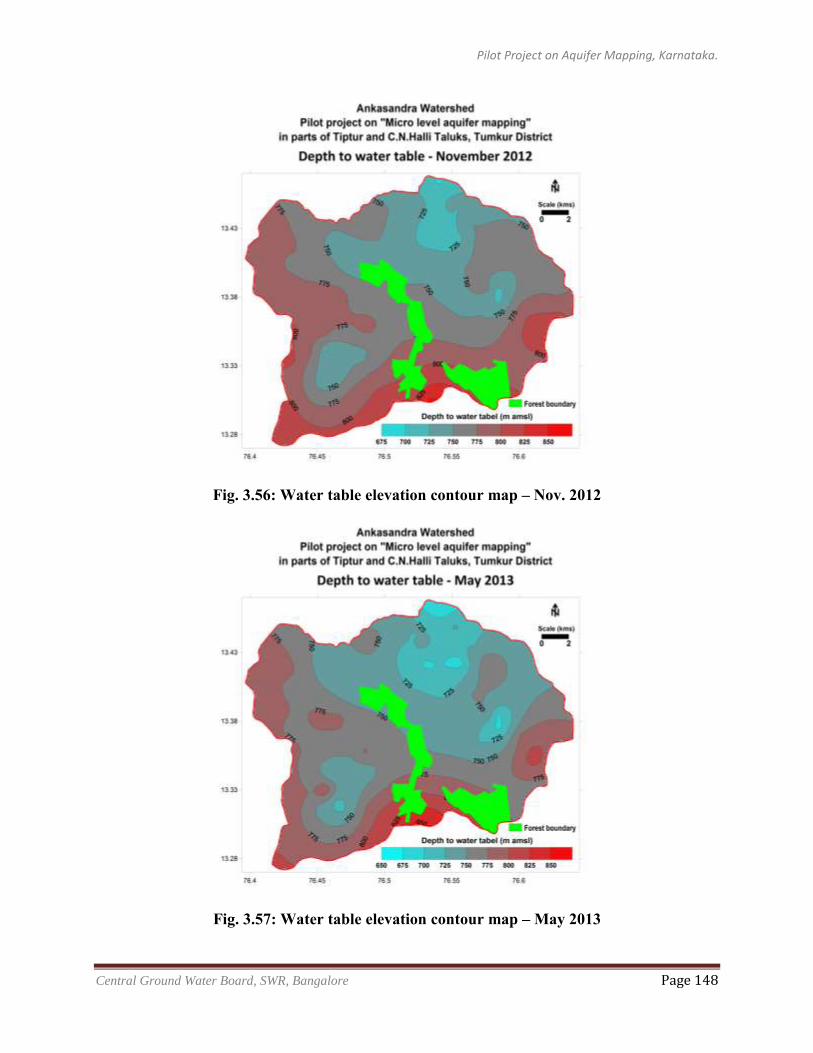
Pilot Project on Aquifer Mapping, Karnataka.
Central Ground Water Board, SWR, Bangalore Page 148
Fig. 3.56: Water table elevation contour map – Nov. 2012
Fig. 3.57: Water table elevation contour map – May 2013
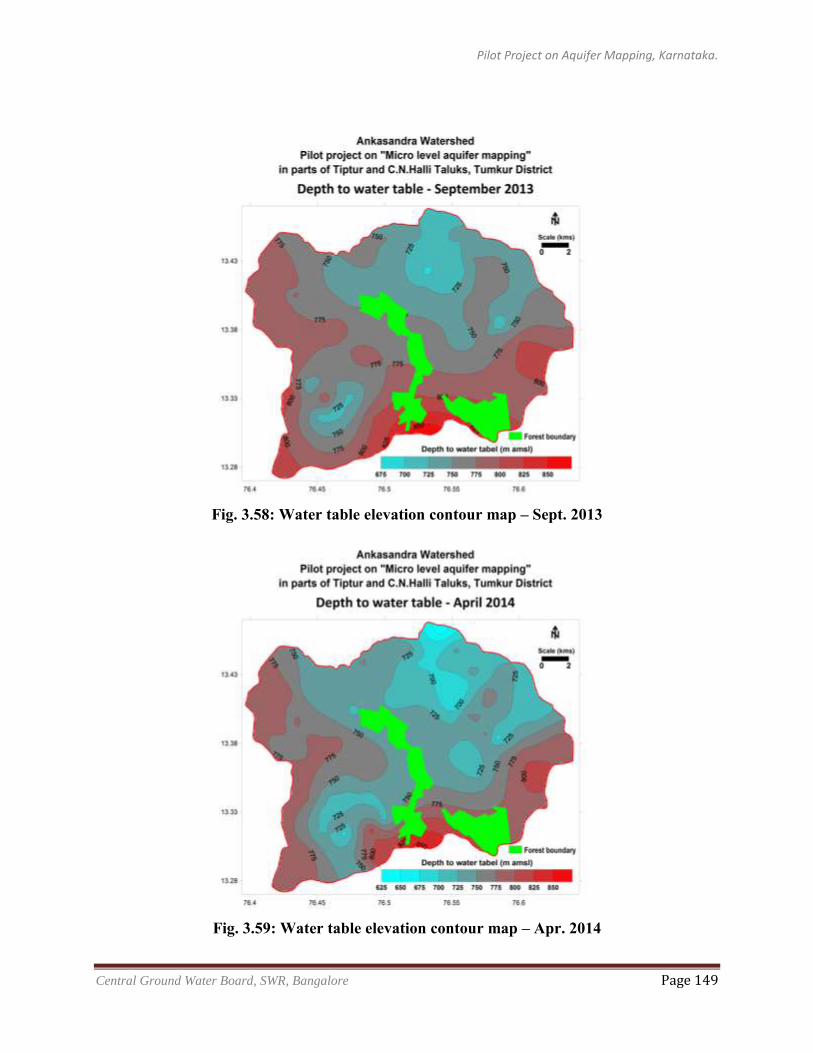
Pilot Project on Aquifer Mapping, Karnataka.
Central Ground Water Board, SWR, Bangalore Page 149
Fig. 3.58: Water table elevation contour map – Sept. 2013
Fig. 3.59: Water table elevation contour map – Apr. 2014
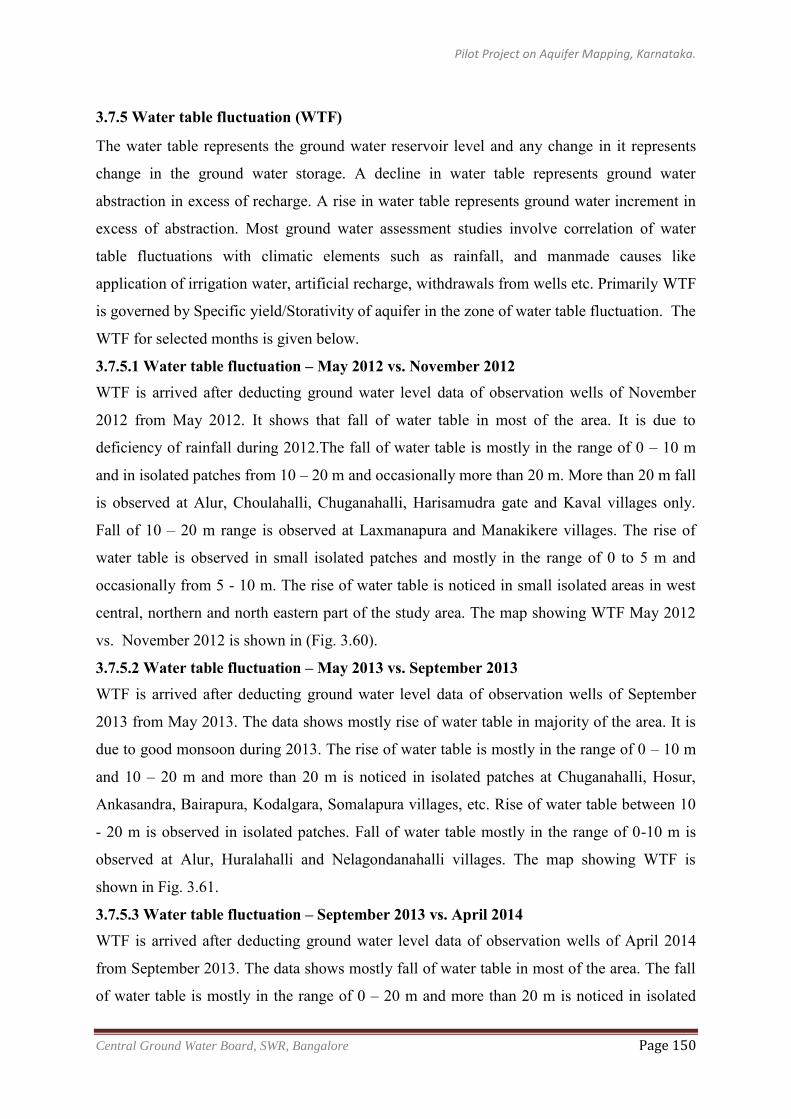
Pilot Project on Aquifer Mapping, Karnataka.
Central Ground Water Board, SWR, Bangalore Page 150
3.7.5 Water table fluctuation (WTF)
The water table represents the ground water reservoir level and any change in it represents
change in the ground water storage. A decline in water table represents ground water
abstraction in excess of recharge. A rise in water table represents ground water increment in
excess of abstraction. Most ground water assessment studies involve correlation of water
table fluctuations with climatic elements such as rainfall, and manmade causes like
application of irrigation water, artificial recharge, withdrawals from wells etc. Primarily WTF
is governed by Specific yield/Storativity of aquifer in the zone of water table fluctuation. The
WTF for selected months is given below.
3.7.5.1 Water table fluctuation – May 2012 vs. November 2012 WTF is arrived after deducting ground water level data of observation wells of November
2012 from May 2012. It shows that fall of water table in most of the area. It is due to
deficiency of rainfall during 2012.The fall of water table is mostly in the range of 0 – 10 m
and in isolated patches from 10 – 20 m and occasionally more than 20 m. More than 20 m fall
is observed at Alur, Choulahalli, Chuganahalli, Harisamudra gate and Kaval villages only.
Fall of 10 – 20 m range is observed at Laxmanapura and Manakikere villages. The rise of
water table is observed in small isolated patches and mostly in the range of 0 to 5 m and
occasionally from 5 - 10 m. The rise of water table is noticed in small isolated areas in west
central, northern and north eastern part of the study area. The map showing WTF May 2012
vs. November 2012 is shown in (Fig. 3.60).
3.7.5.2 Water table fluctuation – May 2013 vs. September 2013 WTF is arrived after deducting ground water level data of observation wells of September
2013 from May 2013. The data shows mostly rise of water table in majority of the area. It is
due to good monsoon during 2013. The rise of water table is mostly in the range of 0 – 10 m
and 10 – 20 m and more than 20 m is noticed in isolated patches at Chuganahalli, Hosur,
Ankasandra, Bairapura, Kodalgara, Somalapura villages, etc. Rise of water table between 10
- 20 m is observed in isolated patches. Fall of water table mostly in the range of 0-10 m is
observed at Alur, Huralahalli and Nelagondanahalli villages. The map showing WTF is
shown in Fig. 3.61.
3.7.5.3 Water table fluctuation – September 2013 vs. April 2014 WTF is arrived after deducting ground water level data of observation wells of April 2014
from September 2013. The data shows mostly fall of water table in most of the area. The fall
of water table is mostly in the range of 0 – 20 m and more than 20 m is noticed in isolated
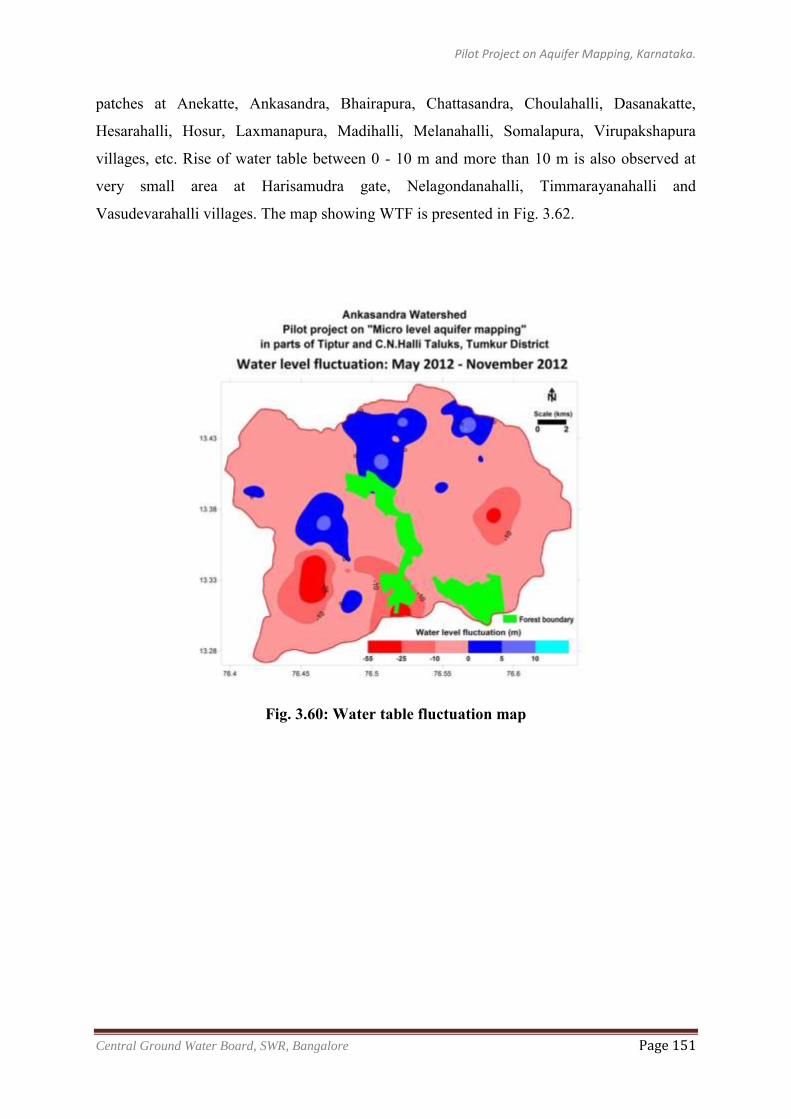
Pilot Project on Aquifer Mapping, Karnataka.
Central Ground Water Board, SWR, Bangalore Page 151
patches at Anekatte, Ankasandra, Bhairapura, Chattasandra, Choulahalli, Dasanakatte,
Hesarahalli, Hosur, Laxmanapura, Madihalli, Melanahalli, Somalapura, Virupakshapura
villages, etc. Rise of water table between 0 - 10 m and more than 10 m is also observed at
very small area at Harisamudra gate, Nelagondanahalli, Timmarayanahalli and
Vasudevarahalli villages. The map showing WTF is presented in Fig. 3.62.
Fig. 3.60: Water table fluctuation map
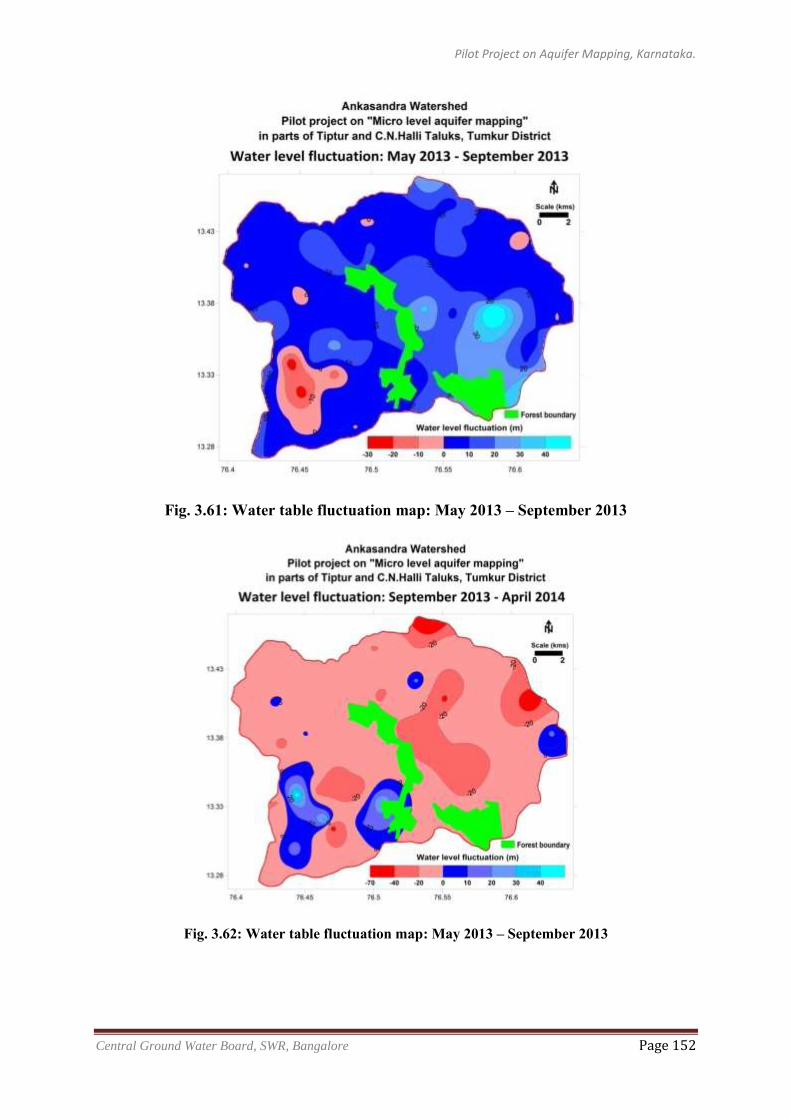
Pilot Project on Aquifer Mapping, Karnataka.
Central Ground Water Board, SWR, Bangalore Page 152
Fig. 3.61: Water table fluctuation map: May 2013 – September 2013
Fig. 3.62: Water table fluctuation map: May 2013 – September 2013
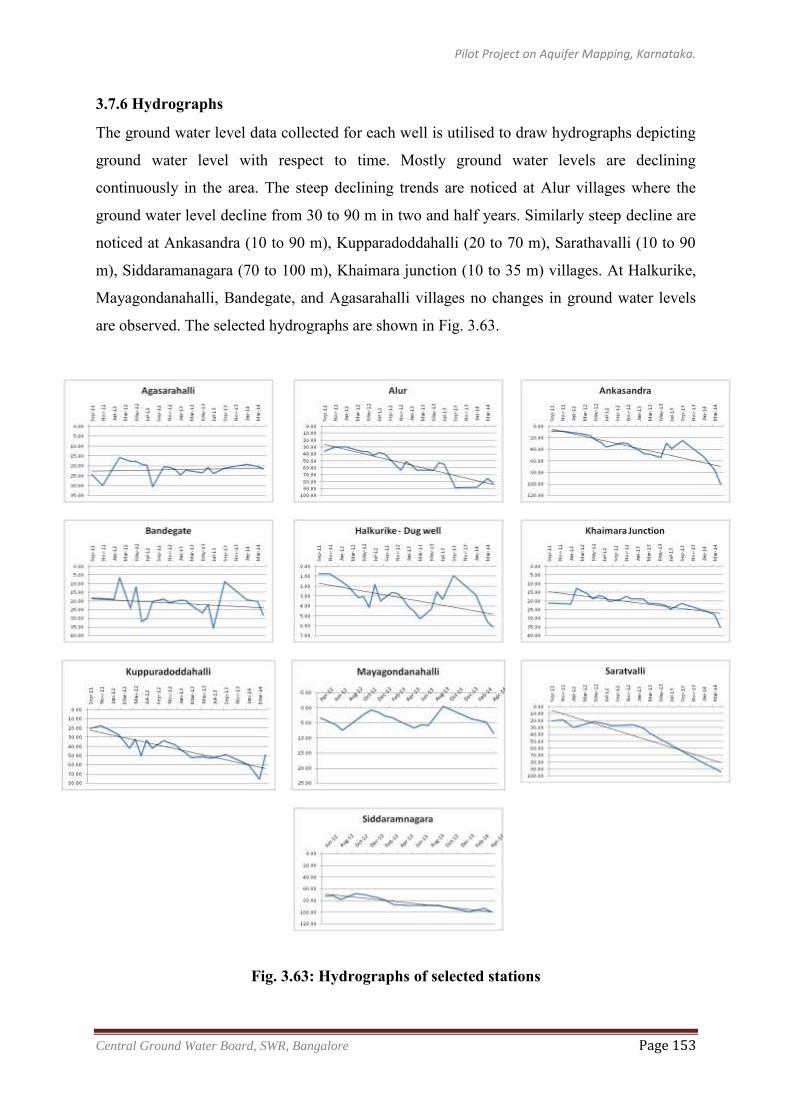
Pilot Project on Aquifer Mapping, Karnataka.
Central Ground Water Board, SWR, Bangalore Page 153
3.7.6 Hydrographs
The ground water level data collected for each well is utilised to draw hydrographs depicting
ground water level with respect to time. Mostly ground water levels are declining
continuously in the area. The steep declining trends are noticed at Alur villages where the
ground water level decline from 30 to 90 m in two and half years. Similarly steep decline are
noticed at Ankasandra (10 to 90 m), Kupparadoddahalli (20 to 70 m), Sarathavalli (10 to 90
m), Siddaramanagara (70 to 100 m), Khaimara junction (10 to 35 m) villages. At Halkurike,
Mayagondanahalli, Bandegate, and Agasarahalli villages no changes in ground water levels
are observed. The selected hydrographs are shown in Fig. 3.63.
Fig. 3.63: Hydrographs of selected stations
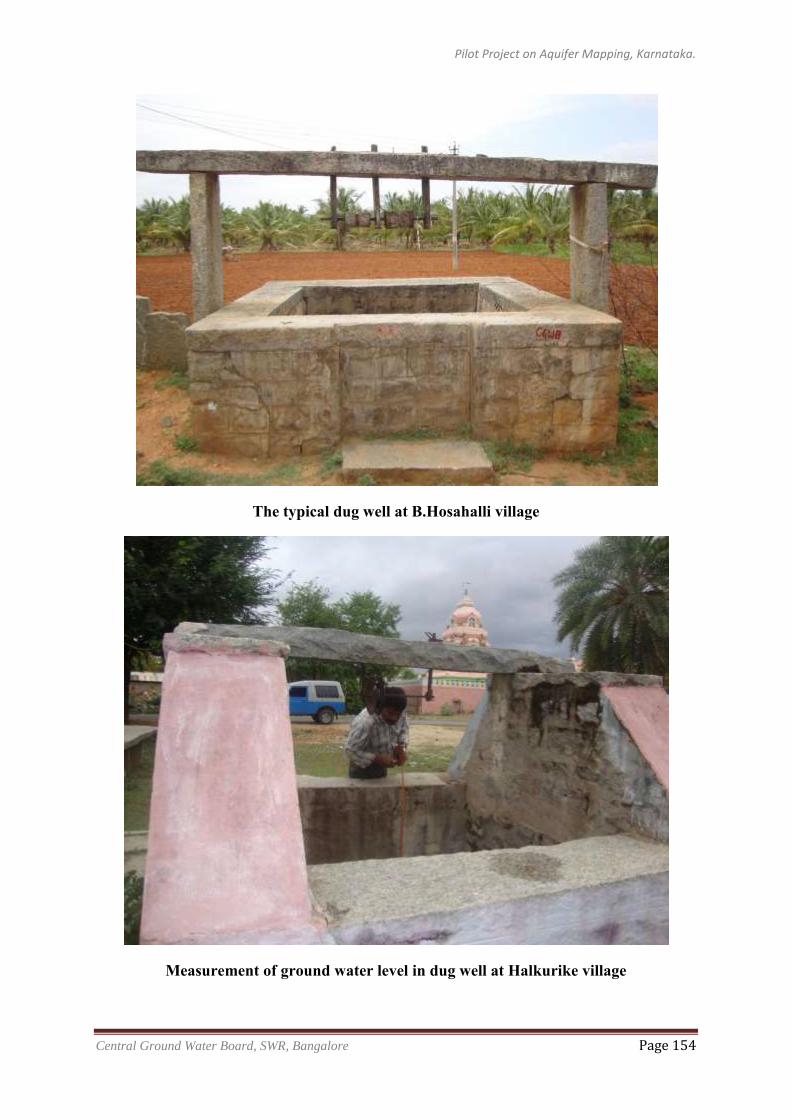
Pilot Project on Aquifer Mapping, Karnataka.
Central Ground Water Board, SWR, Bangalore Page 154
The typical dug well at B.Hosahalli village
Measurement of ground water level in dug well at Halkurike village
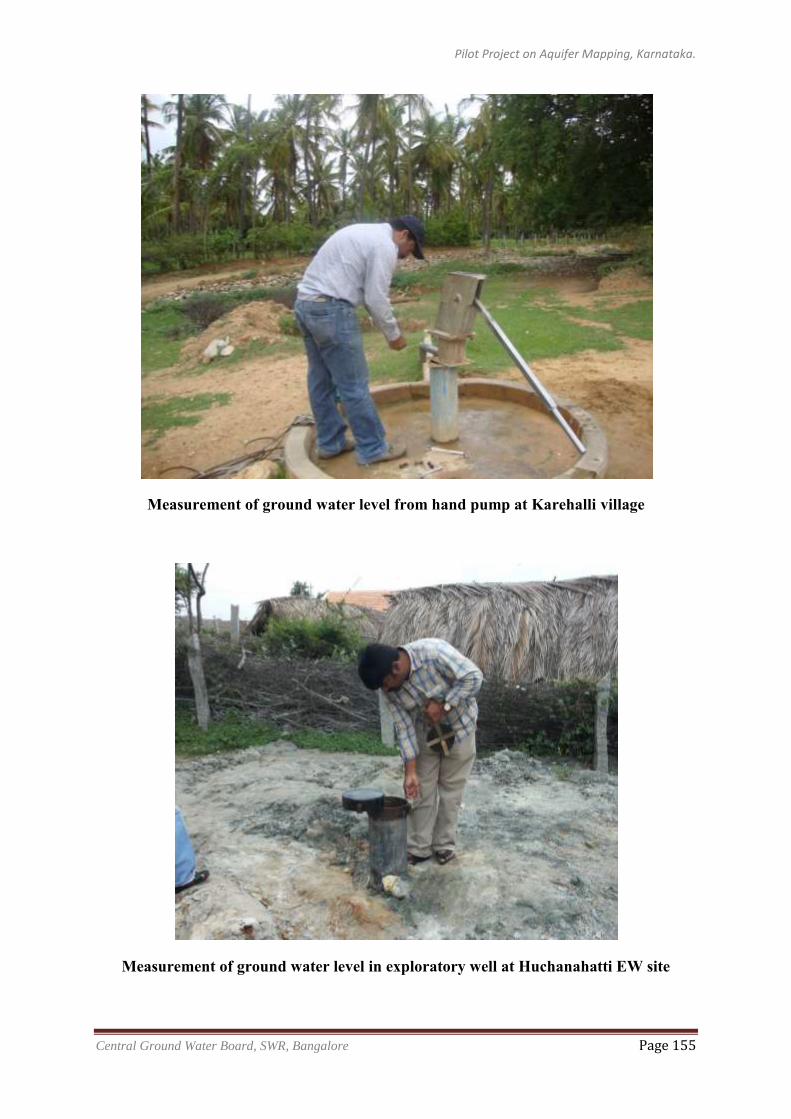
Pilot Project on Aquifer Mapping, Karnataka.
Central Ground Water Board, SWR, Bangalore Page 155
Measurement of ground water level from hand pump at Karehalli village
Measurement of ground water level in exploratory well at Huchanahatti EW site
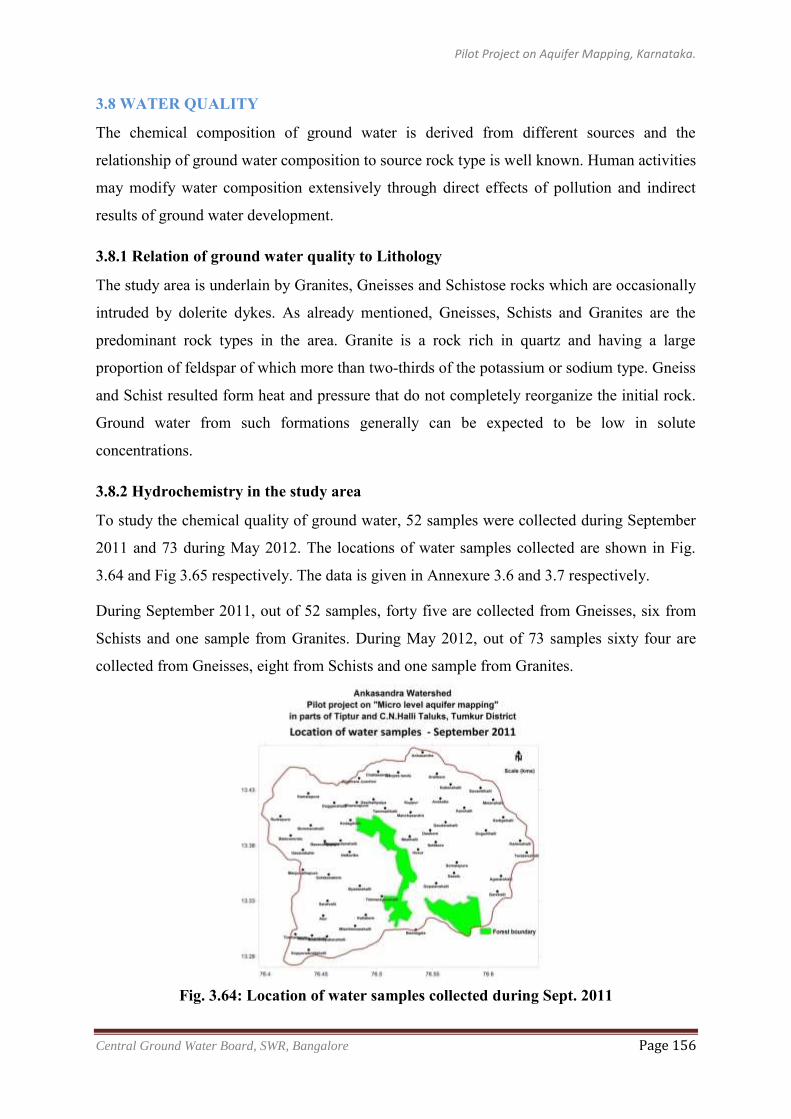
Pilot Project on Aquifer Mapping, Karnataka.
Central Ground Water Board, SWR, Bangalore Page 156
3.8 WATER QUALITY
The chemical composition of ground water is derived from different sources and the
relationship of ground water composition to source rock type is well known. Human activities
may modify water composition extensively through direct effects of pollution and indirect
results of ground water development.
3.8.1 Relation of ground water quality to Lithology
The study area is underlain by Granites, Gneisses and Schistose rocks which are occasionally
intruded by dolerite dykes. As already mentioned, Gneisses, Schists and Granites are the
predominant rock types in the area. Granite is a rock rich in quartz and having a large
proportion of feldspar of which more than two-thirds of the potassium or sodium type. Gneiss
and Schist resulted form heat and pressure that do not completely reorganize the initial rock.
Ground water from such formations generally can be expected to be low in solute
concentrations.
3.8.2 Hydrochemistry in the study area
To study the chemical quality of ground water, 52 samples were collected during September
2011 and 73 during May 2012. The locations of water samples collected are shown in Fig.
3.64 and Fig 3.65 respectively. The data is given in Annexure 3.6 and 3.7 respectively.
During September 2011, out of 52 samples, forty five are collected from Gneisses, six from
Schists and one sample from Granites. During May 2012, out of 73 samples sixty four are
collected from Gneisses, eight from Schists and one sample from Granites.
Fig. 3.64: Location of water samples collected during Sept. 2011
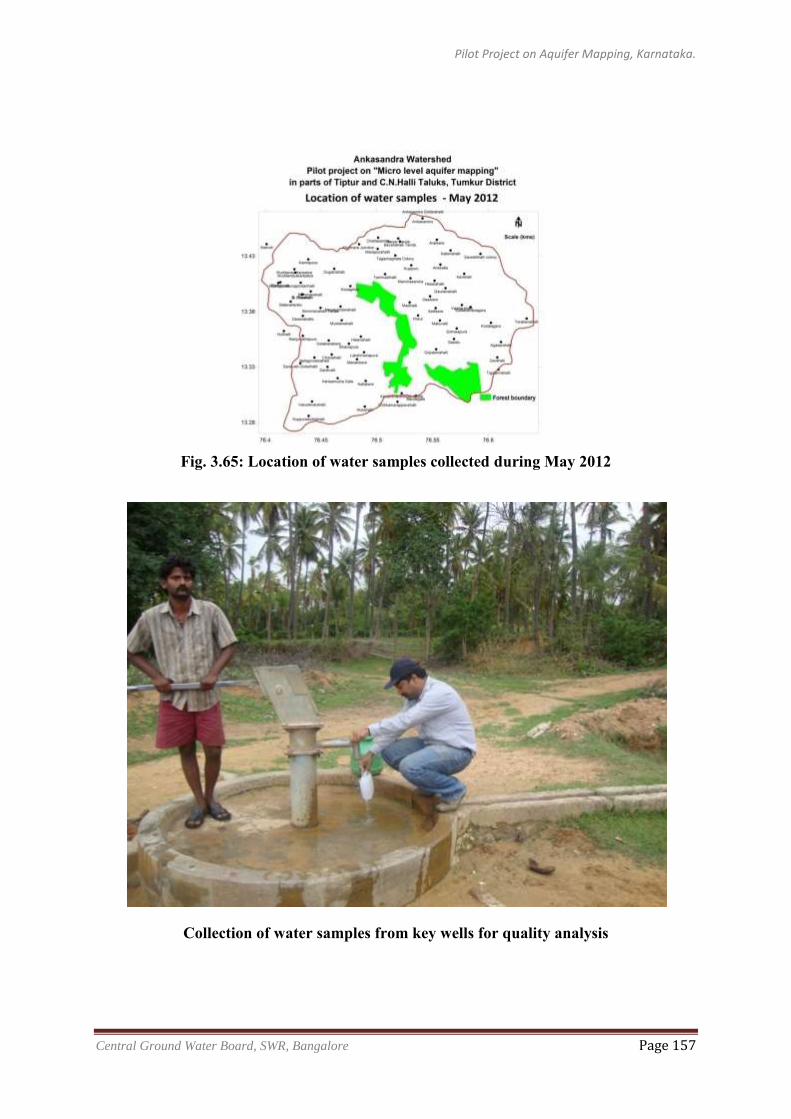
Pilot Project on Aquifer Mapping, Karnataka.
Central Ground Water Board, SWR, Bangalore Page 157
Fig. 3.65: Location of water samples collected during May 2012
Collection of water samples from key wells for quality analysis
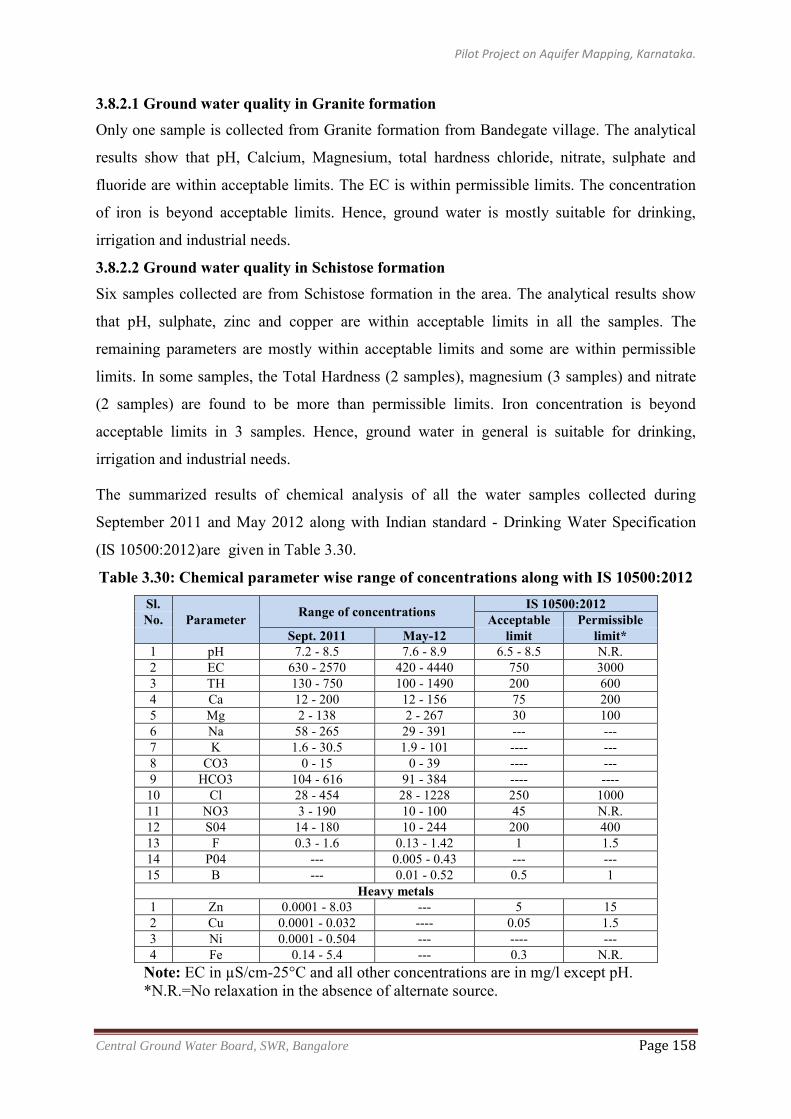
Pilot Project on Aquifer Mapping, Karnataka.
Central Ground Water Board, SWR, Bangalore Page 158
3.8.2.1 Ground water quality in Granite formation Only one sample is collected from Granite formation from Bandegate village. The analytical
results show that pH, Calcium, Magnesium, total hardness chloride, nitrate, sulphate and
fluoride are within acceptable limits. The EC is within permissible limits. The concentration
of iron is beyond acceptable limits. Hence, ground water is mostly suitable for drinking,
irrigation and industrial needs.
3.8.2.2 Ground water quality in Schistose formation Six samples collected are from Schistose formation in the area. The analytical results show
that pH, sulphate, zinc and copper are within acceptable limits in all the samples. The
remaining parameters are mostly within acceptable limits and some are within permissible
limits. In some samples, the Total Hardness (2 samples), magnesium (3 samples) and nitrate
(2 samples) are found to be more than permissible limits. Iron concentration is beyond
acceptable limits in 3 samples. Hence, ground water in general is suitable for drinking,
irrigation and industrial needs.
The summarized results of chemical analysis of all the water samples collected during
September 2011 and May 2012 along with Indian standard - Drinking Water Specification
(IS 10500:2012)are given in Table 3.30.
Table 3.30: Chemical parameter wise range of concentrations along with IS 10500:2012 Sl.
Parameter Range of concentrations IS 10500:2012 No. Acceptable Permissible
Sept. 2011 May-12 limit limit* 1 pH 7.2 - 8.5 7.6 - 8.9 6.5 - 8.5 N.R. 2 EC 630 - 2570 420 - 4440 750 3000 3 TH 130 - 750 100 - 1490 200 600 4 Ca 12 - 200 12 - 156 75 200 5 Mg 2 - 138 2 - 267 30 100 6 Na 58 - 265 29 - 391 --- --- 7 K 1.6 - 30.5 1.9 - 101 ---- --- 8 CO3 0 - 15 0 - 39 ---- --- 9 HCO3 104 - 616 91 - 384 ---- ---- 10 Cl 28 - 454 28 - 1228 250 1000 11 NO3 3 - 190 10 - 100 45 N.R. 12 S04 14 - 180 10 - 244 200 400 13 F 0.3 - 1.6 0.13 - 1.42 1 1.5 14 P04 --- 0.005 - 0.43 --- --- 15 B --- 0.01 - 0.52 0.5 1
Heavy metals 1 Zn 0.0001 - 8.03 --- 5 15 2 Cu 0.0001 - 0.032 ---- 0.05 1.5 3 Ni 0.0001 - 0.504 --- ---- --- 4 Fe 0.14 - 5.4 --- 0.3 N.R.
Note: EC in µS/cm-25°C and all other concentrations are in mg/l except pH. *N.R.=No relaxation in the absence of alternate source.
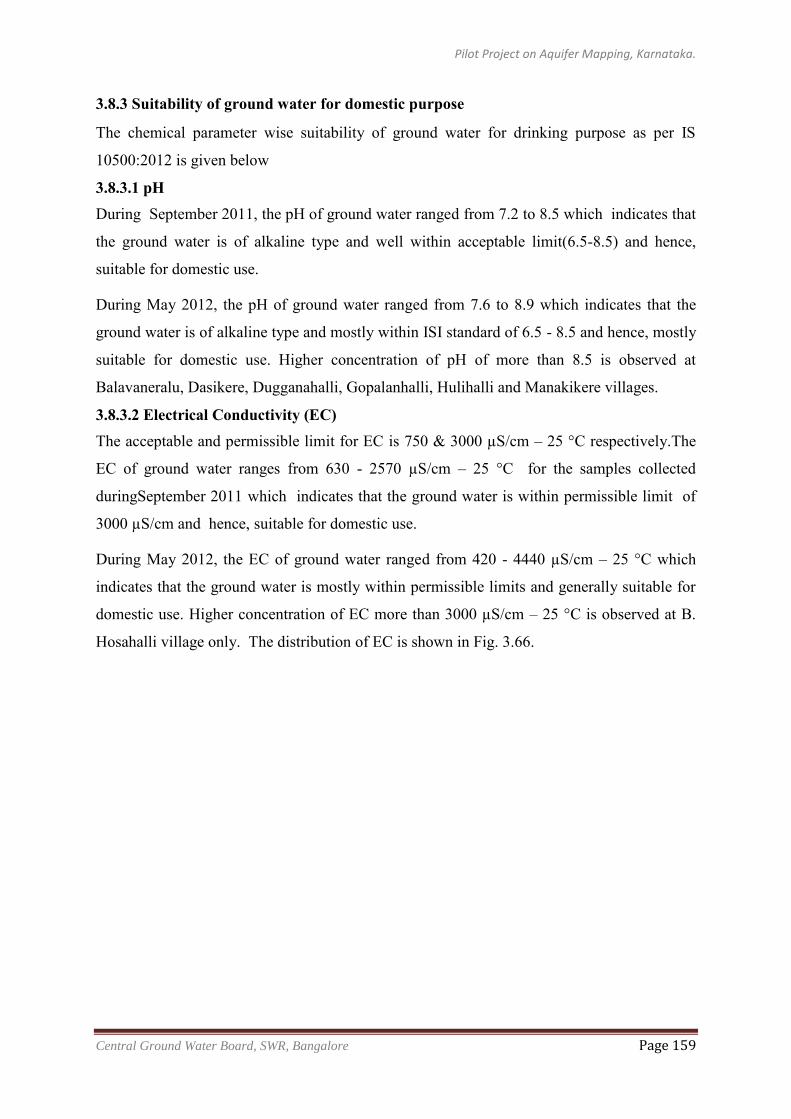
Pilot Project on Aquifer Mapping, Karnataka.
Central Ground Water Board, SWR, Bangalore Page 159
3.8.3 Suitability of ground water for domestic purpose
The chemical parameter wise suitability of ground water for drinking purpose as per IS
10500:2012 is given below
3.8.3.1 pH During September 2011, the pH of ground water ranged from 7.2 to 8.5 which indicates that
the ground water is of alkaline type and well within acceptable limit(6.5-8.5) and hence,
suitable for domestic use.
During May 2012, the pH of ground water ranged from 7.6 to 8.9 which indicates that the
ground water is of alkaline type and mostly within ISI standard of 6.5 - 8.5 and hence, mostly
suitable for domestic use. Higher concentration of pH of more than 8.5 is observed at
Balavaneralu, Dasikere, Dugganahalli, Gopalanhalli, Hulihalli and Manakikere villages.
3.8.3.2 Electrical Conductivity (EC) The acceptable and permissible limit for EC is 750 & 3000 µS/cm – 25 °C respectively.The
EC of ground water ranges from 630 - 2570 µS/cm – 25 °C for the samples collected
duringSeptember 2011 which indicates that the ground water is within permissible limit of
3000 µS/cm and hence, suitable for domestic use.
During May 2012, the EC of ground water ranged from 420 - 4440 µS/cm – 25 °C which
indicates that the ground water is mostly within permissible limits and generally suitable for
domestic use. Higher concentration of EC more than 3000 µS/cm – 25 °C is observed at B.
Hosahalli village only. The distribution of EC is shown in Fig. 3.66.
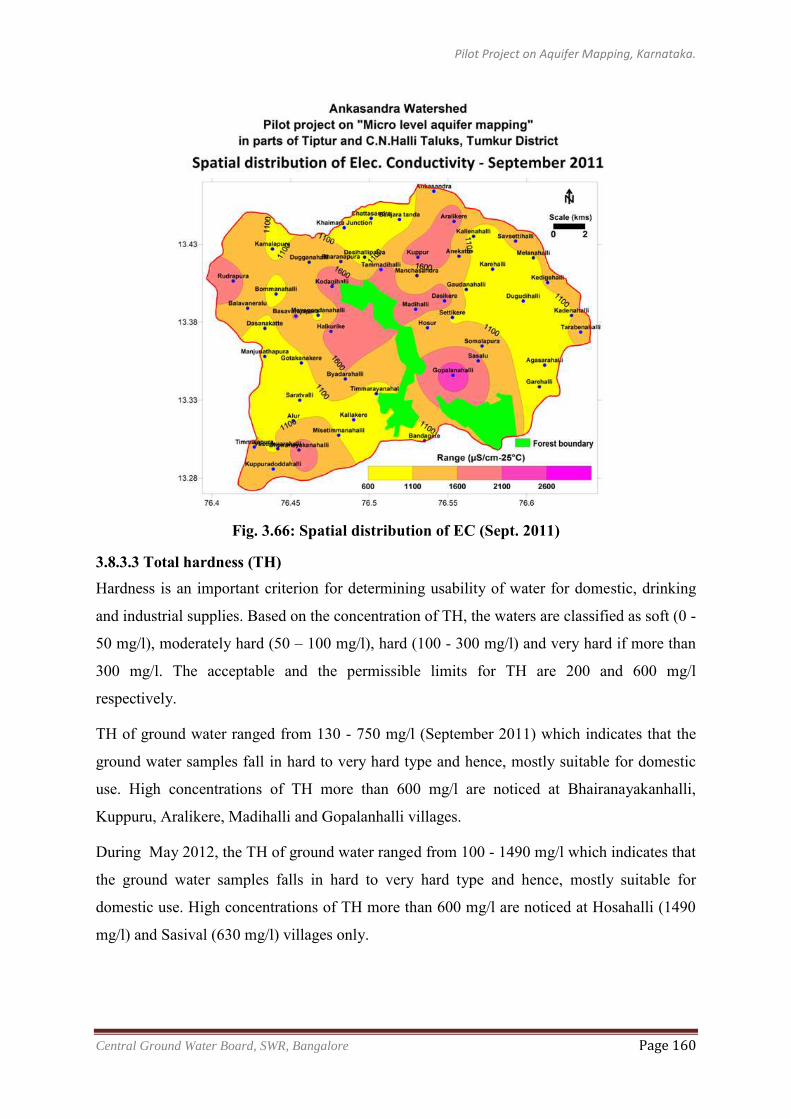
Pilot Project on Aquifer Mapping, Karnataka.
Central Ground Water Board, SWR, Bangalore Page 160
Fig. 3.66: Spatial distribution of EC (Sept. 2011)
3.8.3.3 Total hardness (TH) Hardness is an important criterion for determining usability of water for domestic, drinking
and industrial supplies. Based on the concentration of TH, the waters are classified as soft (0 -
50 mg/l), moderately hard (50 – 100 mg/l), hard (100 - 300 mg/l) and very hard if more than
300 mg/l. The acceptable and the permissible limits for TH are 200 and 600 mg/l
respectively.
TH of ground water ranged from 130 - 750 mg/l (September 2011) which indicates that the
ground water samples fall in hard to very hard type and hence, mostly suitable for domestic
use. High concentrations of TH more than 600 mg/l are noticed at Bhairanayakanhalli,
Kuppuru, Aralikere, Madihalli and Gopalanhalli villages.
During May 2012, the TH of ground water ranged from 100 - 1490 mg/l which indicates that
the ground water samples falls in hard to very hard type and hence, mostly suitable for
domestic use. High concentrations of TH more than 600 mg/l are noticed at Hosahalli (1490
mg/l) and Sasival (630 mg/l) villages only.
Pilot Project on Aquifer Mapping, Karnataka.
Central Ground Water Board, SWR, Bangalore Page 161
3.8.3.4 Calcium The acceptable and the permissible limits for calcium are 75 and 200 mg/l respectively. The
concentration of calcium in ground water ranged from 12 - 200 mg/l (September 2011)
whereas, during May 2012, the concentration of Calcium in ground water ranges from 12 -
156 mg/l respectively. During both the periods the ground water is within the permissible
limit and suitable for domestic use.
3.8.3.5 Magnesium The acceptable and the permissible limits for magnesium are 30 and 100 mg/l respectively.
During September 2011, the concentration of Magnesium in ground water ranged from 2 to
138 mg/l and mostly suitable for domestic use. Higher concentrations of Magnesium beyond
permissible limits are noticed at Kuppuru, Kodigehalli, Madihalli and Gopalanhalli villages.
During May 2012, the concentration of Magnesium in ground water ranged from 2 to 267
mg/l and mostly within the permissible limit and suitable for domestic use. Higher
concentrations beyond permissible limits are noticed at B.Hosahalli village only.
3.8.3.6 Sodium There are no acceptable and permissible limits for sodium concentration. During September
2011, the concentration of Sodium in ground water ranged from 58 - 265 mg/l. During May
2012, the concentration of Sodium ranges from 100 - 1490 mg/l.
3.8.3.7 Potassium Acceptable and permissible limits for potassium concentration are not fixed. During
September 2011, the concentration of potassium ranged from 1.6 - 30.5 mg/l. During May
2012, the concentration of potassium ranges from 1.9 - 101 mg/l.
3.8.3.8 Carbonate and Bicarbonate There are no acceptable and permissible limits for carbonate and bicarbonate concentrations.
During September 2011, the concentration of carbonate ranged from 0 - 15 mg/l. During May
2012, its concentration ranges from 0 - 39 mg/l. During September 2011, the concentration of
Bicarbonate ranges from 104 - 616 mg/l. During May 2012, the concentration of Bicarbonate
ranges from 91 - 384 mg/l.
3.8.3.9 Chloride The acceptable and the permissible limits for chloride are 250 and 1000 mg/l respectively.
During September 2011, the concentration of chloride in ground water ranged from 28 – 454
mg/l during May 2012its concentration ranges from 28 - 1228 mg/l. During both the periods
it is found to be mostly within the permissible limit and suitable for domestic use. Higher
concentration of chloride beyond permissible limits is noticed at B.Hosahalli village only.
Pilot Project on Aquifer Mapping, Karnataka.
Central Ground Water Board, SWR, Bangalore Page 162
3.8.3.10 Nitrate The acceptable limit for nitrate is 45 mg/l and there is no relaxation for permissible
limit.During September 2011, the concentration of nitrate in ground water ranged from 3 -
190 mg/l and mostly suitable for domestic use. Higher concentrations of nitrate beyond
acceptable limits are noticed at Kupparadoddahalli, Bairanayakanahalli, Dugganahalli,
Anekatte, Aralikere, Ankasandra, Dasikere, Savsettihalli, Sasalu and Gopalanhalli villages.
During May 2012, the concentration of nitrate ranged from 10 - 100 mg/l and mostly within
the acceptable limit and suitable for domestic use. Higher concentration of nitrate beyond
acceptable limit are noticed at B.Hosahalli, Balavaneralu, Banjar thanda, Bevanahalli thanda,
Chattasandra, Dasanakatte, Dasikere, Hosur, Hulihalli, Kamalapura, Kupparadoddahalli,
Madapurahatti, Madihalli, Mayagondanahalli, Rudrapura, Settikere, and Vasudevarahalli
villages. Higher concentration of nitrate is mostly due to domestic pollution. The distribution
of nitrate is shown in Fig. 3.67.
Fig. 3.67: Spatial distribution of Nitrate (Sept. 2011)
Pilot Project on Aquifer Mapping, Karnataka.
Central Ground Water Board, SWR, Bangalore Page 163
3.8.3.11 Sulphate The acceptable and the permissible limits for sulphate are 200 and 400 mg/l respectively.
During September 2011, the concentration of sulphate in ground water ranged from 14 to 180
mg/l and is within the acceptable limit. During May 2012, the concentration of sulphate
ranged from 10 - 244 mg/l and hence, within the permissible limit.
3.8.3.12 Fluoride The acceptable and the permissible limits for Fluoride are 1 and 1.5 mg/l respectively. During
September 2011, the concentration of Fluoride in ground water ranged from 0.3 to 1.6 mg/l
and hence, mostly within the permissible limit. Higher concentrations of Fluoride beyond
permissible limit are noticed at Banjarathanda village only. During May 2012, the
concentration of Fluoride ranged from 0.13 - 1.42 mg/l and hence, within the permissible
limit and suitable for drinking purpose.
3.8.3.13 Phosphate There are no acceptable and the permissible limits of phosphorous concentration. During
May 2012, the concentration of Phosphorous ranged from 0.005 - 0.43 mg/l.
3.8.3.14 Boron The acceptable and the permissible limits for Boron are 0.5 and 1.0 mg/l respectively. During
May 2012, the concentration of Boron in ground water ranged from 0.01 - 0.52 mg/l and
hence, within the permissible limit.
3.8.3.15 Conclusion From the above study it is found that the ground water is generally suitable for drinking
purpose except at few isolated locations where the concentration of nitrate is higher than
acceptable limit and some areas the concentration of iron is beyond acceptable limit.
3.8.4 Heavy metals
Heavy metal concentrations of Zinc, Copper, Nickel and Iron were also analysed for 52
samples of September 2011 and the details are given below.
3.8.4.1 Zinc The acceptable and the permissible limits for Zinc are 5 and 15 mg/l respectively. During
September 2011, the concentration of Zinc in ground water ranged from 0.0001 - 8.03 mg/l
and hence, within permissible limit.
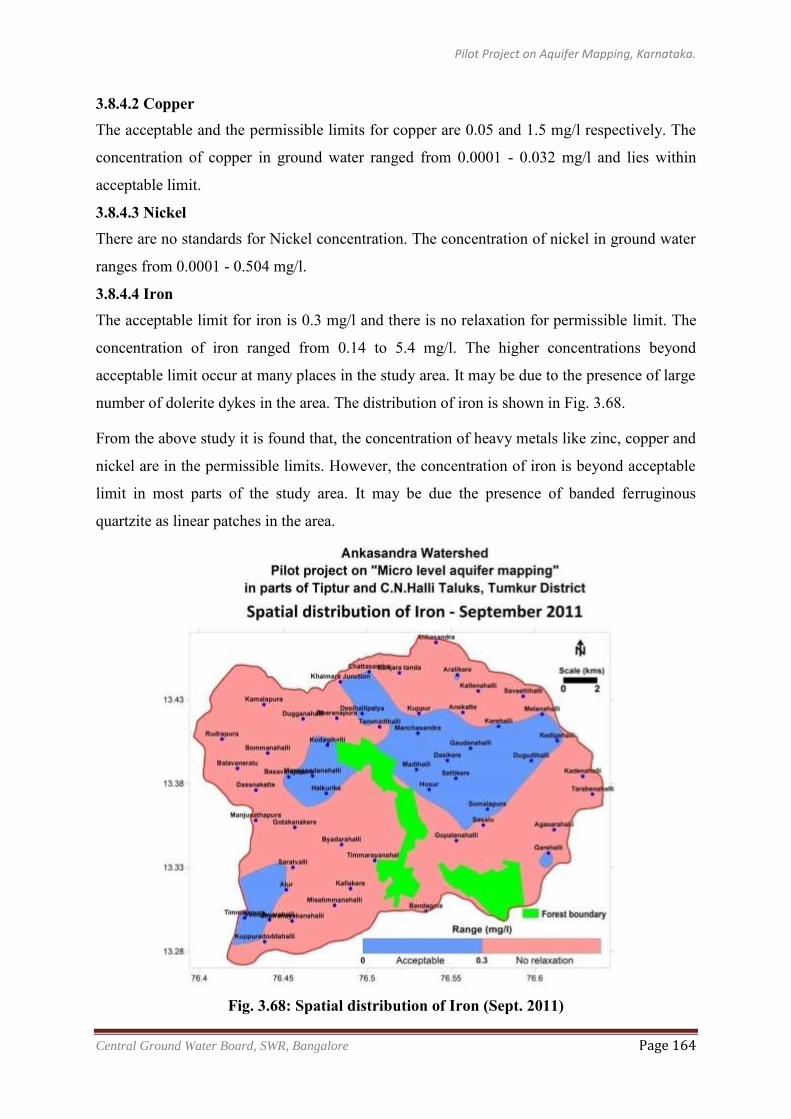
Pilot Project on Aquifer Mapping, Karnataka.
Central Ground Water Board, SWR, Bangalore Page 164
3.8.4.2 Copper The acceptable and the permissible limits for copper are 0.05 and 1.5 mg/l respectively. The
concentration of copper in ground water ranged from 0.0001 - 0.032 mg/l and lies within
acceptable limit.
3.8.4.3 Nickel There are no standards for Nickel concentration. The concentration of nickel in ground water
ranges from 0.0001 - 0.504 mg/l.
3.8.4.4 Iron The acceptable limit for iron is 0.3 mg/l and there is no relaxation for permissible limit. The
concentration of iron ranged from 0.14 to 5.4 mg/l. The higher concentrations beyond
acceptable limit occur at many places in the study area. It may be due to the presence of large
number of dolerite dykes in the area. The distribution of iron is shown in Fig. 3.68.
From the above study it is found that, the concentration of heavy metals like zinc, copper and
nickel are in the permissible limits. However, the concentration of iron is beyond acceptable
limit in most parts of the study area. It may be due the presence of banded ferruginous
quartzite as linear patches in the area.
Fig. 3.68: Spatial distribution of Iron (Sept. 2011)
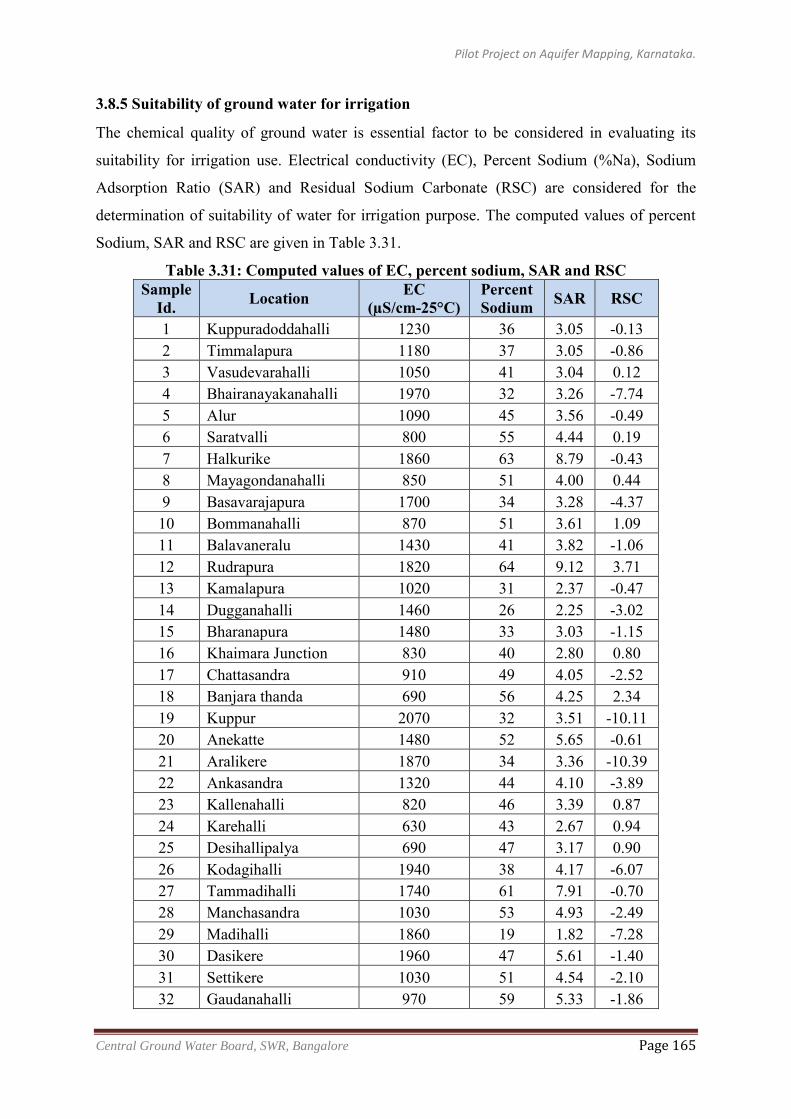
Pilot Project on Aquifer Mapping, Karnataka.
Central Ground Water Board, SWR, Bangalore Page 165
3.8.5 Suitability of ground water for irrigation
The chemical quality of ground water is essential factor to be considered in evaluating its
suitability for irrigation use. Electrical conductivity (EC), Percent Sodium (%Na), Sodium
Adsorption Ratio (SAR) and Residual Sodium Carbonate (RSC) are considered for the
determination of suitability of water for irrigation purpose. The computed values of percent
Sodium, SAR and RSC are given in Table 3.31.
Table 3.31: Computed values of EC, percent sodium, SAR and RSC Sample
Id. Location EC (µS/cm-25°C)
Percent Sodium SAR RSC
1 Kuppuradoddahalli 1230 36 3.05 -0.13 2 Timmalapura 1180 37 3.05 -0.86 3 Vasudevarahalli 1050 41 3.04 0.12 4 Bhairanayakanahalli 1970 32 3.26 -7.74 5 Alur 1090 45 3.56 -0.49 6 Saratvalli 800 55 4.44 0.19 7 Halkurike 1860 63 8.79 -0.43 8 Mayagondanahalli 850 51 4.00 0.44 9 Basavarajapura 1700 34 3.28 -4.37 10 Bommanahalli 870 51 3.61 1.09 11 Balavaneralu 1430 41 3.82 -1.06 12 Rudrapura 1820 64 9.12 3.71 13 Kamalapura 1020 31 2.37 -0.47 14 Dugganahalli 1460 26 2.25 -3.02 15 Bharanapura 1480 33 3.03 -1.15 16 Khaimara Junction 830 40 2.80 0.80 17 Chattasandra 910 49 4.05 -2.52 18 Banjara thanda 690 56 4.25 2.34 19 Kuppur 2070 32 3.51 -10.11 20 Anekatte 1480 52 5.65 -0.61 21 Aralikere 1870 34 3.36 -10.39 22 Ankasandra 1320 44 4.10 -3.89 23 Kallenahalli 820 46 3.39 0.87 24 Karehalli 630 43 2.67 0.94 25 Desihallipalya 690 47 3.17 0.90 26 Kodagihalli 1940 38 4.17 -6.07 27 Tammadihalli 1740 61 7.91 -0.70 28 Manchasandra 1030 53 4.93 -2.49 29 Madihalli 1860 19 1.82 -7.28 30 Dasikere 1960 47 5.61 -1.40 31 Settikere 1030 51 4.54 -2.10 32 Gaudanahalli 970 59 5.33 -1.86
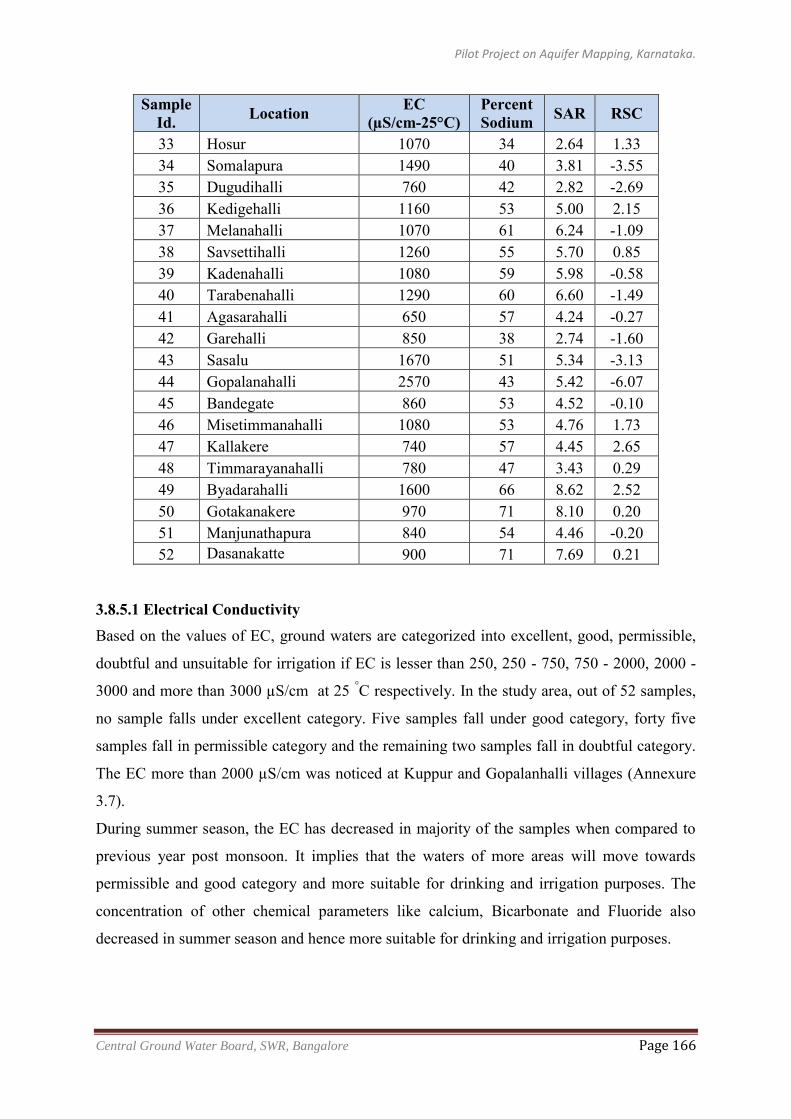
Pilot Project on Aquifer Mapping, Karnataka.
Central Ground Water Board, SWR, Bangalore Page 166
Sample Id. Location EC
(µS/cm-25°C) Percent Sodium SAR RSC
33 Hosur 1070 34 2.64 1.33 34 Somalapura 1490 40 3.81 -3.55 35 Dugudihalli 760 42 2.82 -2.69 36 Kedigehalli 1160 53 5.00 2.15 37 Melanahalli 1070 61 6.24 -1.09 38 Savsettihalli 1260 55 5.70 0.85 39 Kadenahalli 1080 59 5.98 -0.58 40 Tarabenahalli 1290 60 6.60 -1.49 41 Agasarahalli 650 57 4.24 -0.27 42 Garehalli 850 38 2.74 -1.60 43 Sasalu 1670 51 5.34 -3.13 44 Gopalanahalli 2570 43 5.42 -6.07 45 Bandegate 860 53 4.52 -0.10 46 Misetimmanahalli 1080 53 4.76 1.73 47 Kallakere 740 57 4.45 2.65 48 Timmarayanahalli 780 47 3.43 0.29 49 Byadarahalli 1600 66 8.62 2.52 50 Gotakanakere 970 71 8.10 0.20 51 Manjunathapura 840 54 4.46 -0.20 52 Dasanakatte 900 71 7.69 0.21
3.8.5.1 Electrical Conductivity Based on the values of EC, ground waters are categorized into excellent, good, permissible,
doubtful and unsuitable for irrigation if EC is lesser than 250, 250 - 750, 750 - 2000, 2000 -
3000 and more than 3000 µS/cm at 25 °C respectively. In the study area, out of 52 samples,
no sample falls under excellent category. Five samples fall under good category, forty five
samples fall in permissible category and the remaining two samples fall in doubtful category.
The EC more than 2000 µS/cm was noticed at Kuppur and Gopalanhalli villages (Annexure
3.7).
During summer season, the EC has decreased in majority of the samples when compared to
previous year post monsoon. It implies that the waters of more areas will move towards
permissible and good category and more suitable for drinking and irrigation purposes. The
concentration of other chemical parameters like calcium, Bicarbonate and Fluoride also
decreased in summer season and hence more suitable for drinking and irrigation purposes.
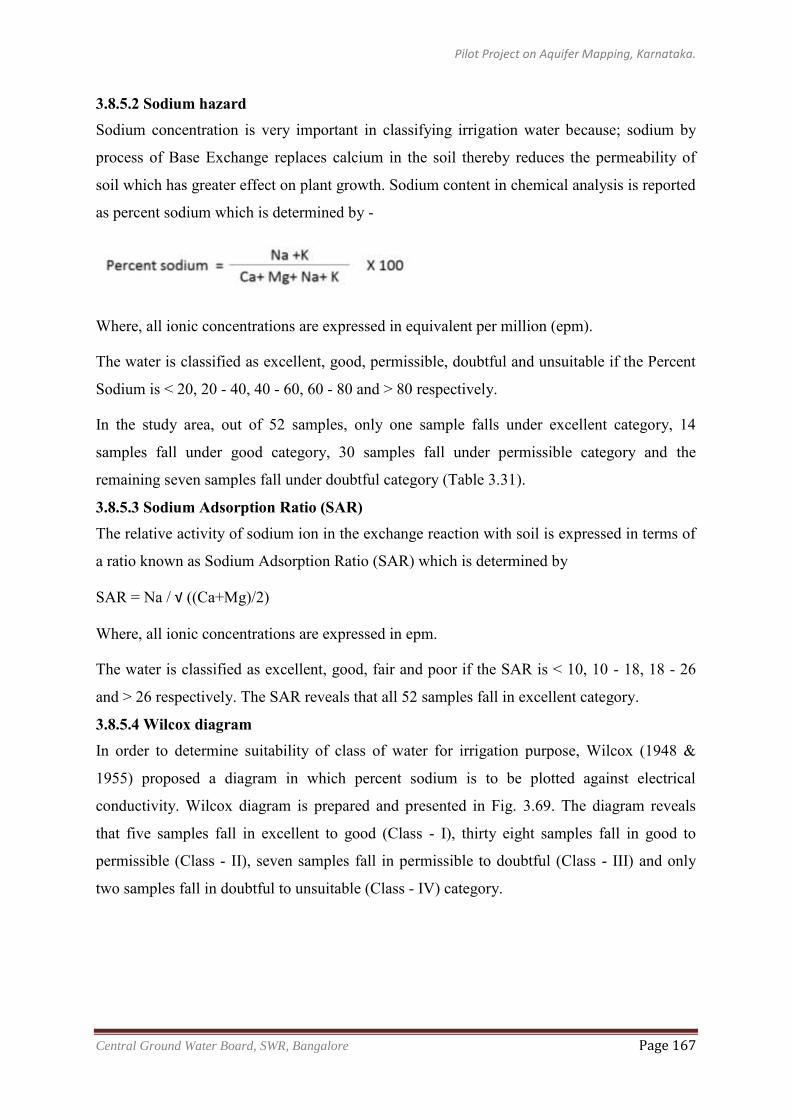
Pilot Project on Aquifer Mapping, Karnataka.
Central Ground Water Board, SWR, Bangalore Page 167
3.8.5.2 Sodium hazard Sodium concentration is very important in classifying irrigation water because; sodium by
process of Base Exchange replaces calcium in the soil thereby reduces the permeability of
soil which has greater effect on plant growth. Sodium content in chemical analysis is reported
as percent sodium which is determined by -
Where, all ionic concentrations are expressed in equivalent per million (epm).
The water is classified as excellent, good, permissible, doubtful and unsuitable if the Percent
Sodium is < 20, 20 - 40, 40 - 60, 60 - 80 and > 80 respectively.
In the study area, out of 52 samples, only one sample falls under excellent category, 14
samples fall under good category, 30 samples fall under permissible category and the
remaining seven samples fall under doubtful category (Table 3.31).
3.8.5.3 Sodium Adsorption Ratio (SAR) The relative activity of sodium ion in the exchange reaction with soil is expressed in terms of
a ratio known as Sodium Adsorption Ratio (SAR) which is determined by
SAR = Na / √ ((Ca+Mg)/2)
Where, all ionic concentrations are expressed in epm.
The water is classified as excellent, good, fair and poor if the SAR is < 10, 10 - 18, 18 - 26
and > 26 respectively. The SAR reveals that all 52 samples fall in excellent category.
3.8.5.4 Wilcox diagram In order to determine suitability of class of water for irrigation purpose, Wilcox (1948 &
1955) proposed a diagram in which percent sodium is to be plotted against electrical
conductivity. Wilcox diagram is prepared and presented in Fig. 3.69. The diagram reveals
that five samples fall in excellent to good (Class - I), thirty eight samples fall in good to
permissible (Class - II), seven samples fall in permissible to doubtful (Class - III) and only
two samples fall in doubtful to unsuitable (Class - IV) category.
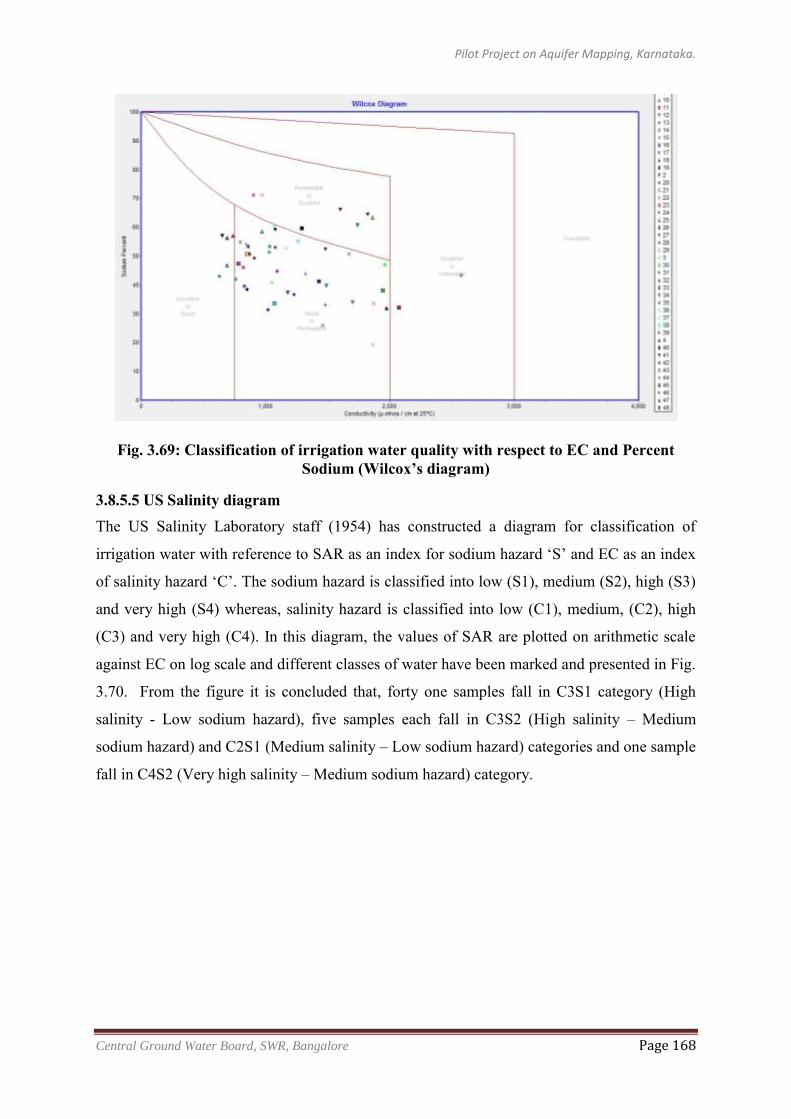
Pilot Project on Aquifer Mapping, Karnataka.
Central Ground Water Board, SWR, Bangalore Page 168
Fig. 3.69: Classification of irrigation water quality with respect to EC and Percent Sodium (Wilcox’s diagram)
3.8.5.5 US Salinity diagram The US Salinity Laboratory staff (1954) has constructed a diagram for classification of
irrigation water with reference to SAR as an index for sodium hazard ‘S’ and EC as an index
of salinity hazard ‘C’. The sodium hazard is classified into low (S1), medium (S2), high (S3)
and very high (S4) whereas, salinity hazard is classified into low (C1), medium, (C2), high
(C3) and very high (C4). In this diagram, the values of SAR are plotted on arithmetic scale
against EC on log scale and different classes of water have been marked and presented in Fig.
3.70. From the figure it is concluded that, forty one samples fall in C3S1 category (High
salinity - Low sodium hazard), five samples each fall in C3S2 (High salinity – Medium
sodium hazard) and C2S1 (Medium salinity – Low sodium hazard) categories and one sample
fall in C4S2 (Very high salinity – Medium sodium hazard) category.
Pilot Project on Aquifer Mapping, Karnataka.
Central Ground Water Board, SWR, Bangalore Page 169
Fig. 3.70: Classification of irrigation water quality with respect to Salinity hazard and
Sodium hazard (USSL diagram)
3.8.4.6 Bicarbonate hazard The Bi-carbonate concentration of water has been suggested as additional criterion to study
the suitability of ground water for irrigation purpose. If the water contains high concentration
of bicarbonate ion, there is a tendency of calcium and magnesium ions to precipitate as
carbonates. The convenient way of expressing values of the water in terms of Residual
Sodium Carbonate (RSC) is as follows.
Where all the ionic concentrations are expressed in epm
On the basis of RSC, ground waters are divided into three categories viz., safe, marginal and
unsuitable if RSC is < 1.25, 1.25 - 2.5 and > 2.5 respectively and shown in Table 3.32. It
shows that out of 52 samples, 45 samples fall in safe category, 4 samples in marginal and 3
samples in unsuitable category.
Ground waters in the study area are generally alkaline in nature and the pH varies from 7.2 to
8.5. The concentration of EC varies from 630 to 2570 µS/cm-25 °C and mostly suitable for
irrigations purposes. According to percent sodium, two percent samples fall in excellent
category, twenty seven percent samples fall in good category, fifty eight percent samples fall
in permissible category and thirteen percent samples fall in doubtful category. According to
Sodium Adsorption Ratio all the samples fall in excellent category. As per RSC, eighty six
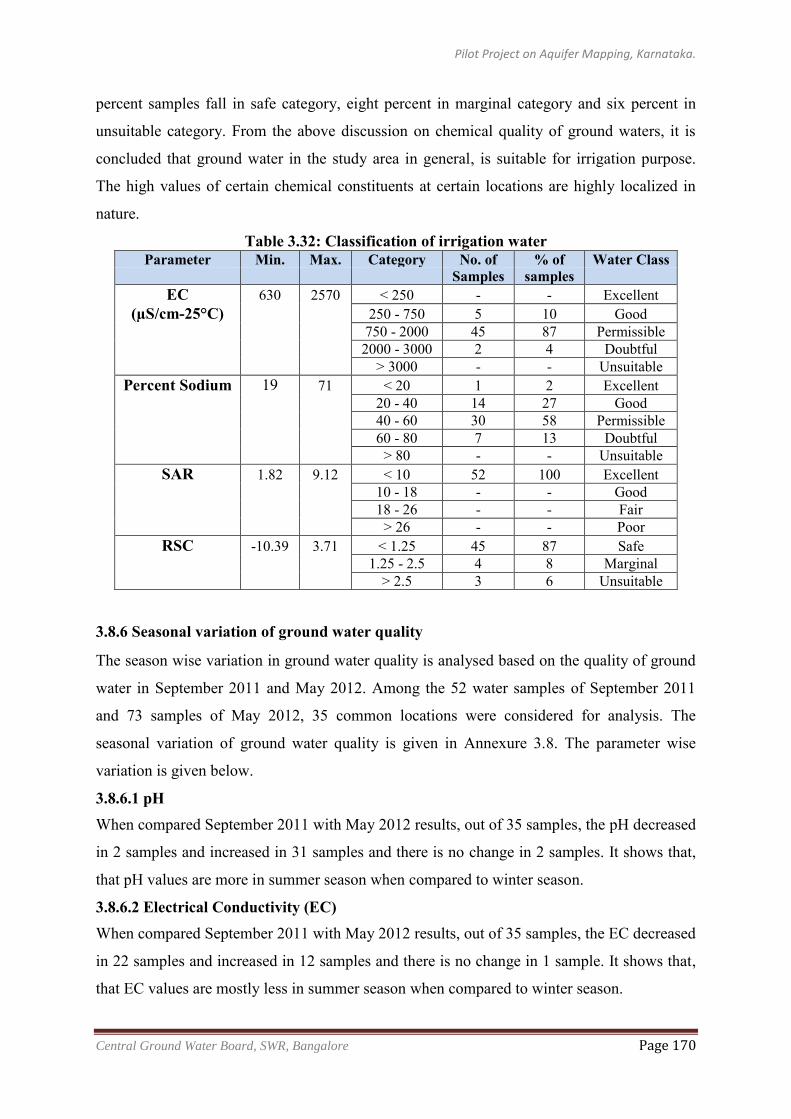
Pilot Project on Aquifer Mapping, Karnataka.
Central Ground Water Board, SWR, Bangalore Page 170
percent samples fall in safe category, eight percent in marginal category and six percent in
unsuitable category. From the above discussion on chemical quality of ground waters, it is
concluded that ground water in the study area in general, is suitable for irrigation purpose.
The high values of certain chemical constituents at certain locations are highly localized in
nature.
Table 3.32: Classification of irrigation water Parameter Min. Max. Category No. of % of Water Class
Samples samples EC 630 2570 < 250 - - Excellent
(µS/cm-25°C)
250 - 750 5 10 Good
750 - 2000 45 87 Permissible
2000 - 3000 2 4 Doubtful
> 3000 - - Unsuitable
Percent Sodium 19 71 < 20 1 2 Excellent
20 - 40 14 27 Good
40 - 60 30 58 Permissible
60 - 80 7 13 Doubtful
> 80 - - Unsuitable
SAR 1.82 9.12 < 10 52 100 Excellent
10 - 18 - - Good
18 - 26 - - Fair
> 26 - - Poor
RSC -10.39 3.71 < 1.25 45 87 Safe
1.25 - 2.5 4 8 Marginal
> 2.5 3 6 Unsuitable
3.8.6 Seasonal variation of ground water quality
The season wise variation in ground water quality is analysed based on the quality of ground
water in September 2011 and May 2012. Among the 52 water samples of September 2011
and 73 samples of May 2012, 35 common locations were considered for analysis. The
seasonal variation of ground water quality is given in Annexure 3.8. The parameter wise
variation is given below.
3.8.6.1 pH When compared September 2011 with May 2012 results, out of 35 samples, the pH decreased
in 2 samples and increased in 31 samples and there is no change in 2 samples. It shows that,
that pH values are more in summer season when compared to winter season.
3.8.6.2 Electrical Conductivity (EC) When compared September 2011 with May 2012 results, out of 35 samples, the EC decreased
in 22 samples and increased in 12 samples and there is no change in 1 sample. It shows that,
that EC values are mostly less in summer season when compared to winter season.
Pilot Project on Aquifer Mapping, Karnataka.
Central Ground Water Board, SWR, Bangalore Page 171
3.8.6.3 Total hardness (TH) When compared September 2011 with May 2012 results, out of 35 samples, the TH
decreased in 7 samples and increased in 25 samples and there is no change in 3 samples. It
shows that that, TH values are mostly more in summer season when compared to winter
season.
3.8.6.4 Calcium When compared September 2011 with May 2012 results, out of 35 samples, the concentration
of Calcium decreased in 25 samples and increased in 8 samples and there is no change in 2
samples. It shows that that, the concentration of calcium decreased in summer season when
compared to winter season.
3.8.6.5 Magnesium When compared September 2011 with May 2012 results, out of 35 samples, the concentration
of Magnesium decreased in 7 samples and increased in 25samples and there is no change in 3
samples. The concentration of calcium increased in summer season when compared to winter
season.
3.8.6.6 Sodium When compared September 2011 with May 2012 results, out of 35 samples, the concentration
of sodium decreased in 20 samples and increased in 15 samples. It reflects the mixed trend of
sodium concentration with season.
3.8.6.7 Potassium When compared September 2011 with May 2012 results, out of 35 samples, the concentration
of potassium decreased in 18 samples and increased in 16 samples and there is no change in 1
sample. It reflects the mixed trend of potassium concentration with season.
3.8.6.8 Carbonate When compared September 2011 with May 2012 results, out of 35 samples, the concentration
of carbonate decreased in 1 sample and increased in 11 samples and there is no change in 23
samples. From the analysis, it is found that that, the concentration of carbonate is showing
increasing trend because of increase in pH during summer season. If the pH increases more
than 8.2, carbonate will exist.
3.8.6.9 Bicarbonate When compared September 2011 with May 2012 results, out of 35 samples, the concentration
of bicarbonate decreased in 25 samples and increased in 10 samples. It shows that that the
concentration of bicarbonate mostly decreased because of its conversion to carbonate in
summer season.
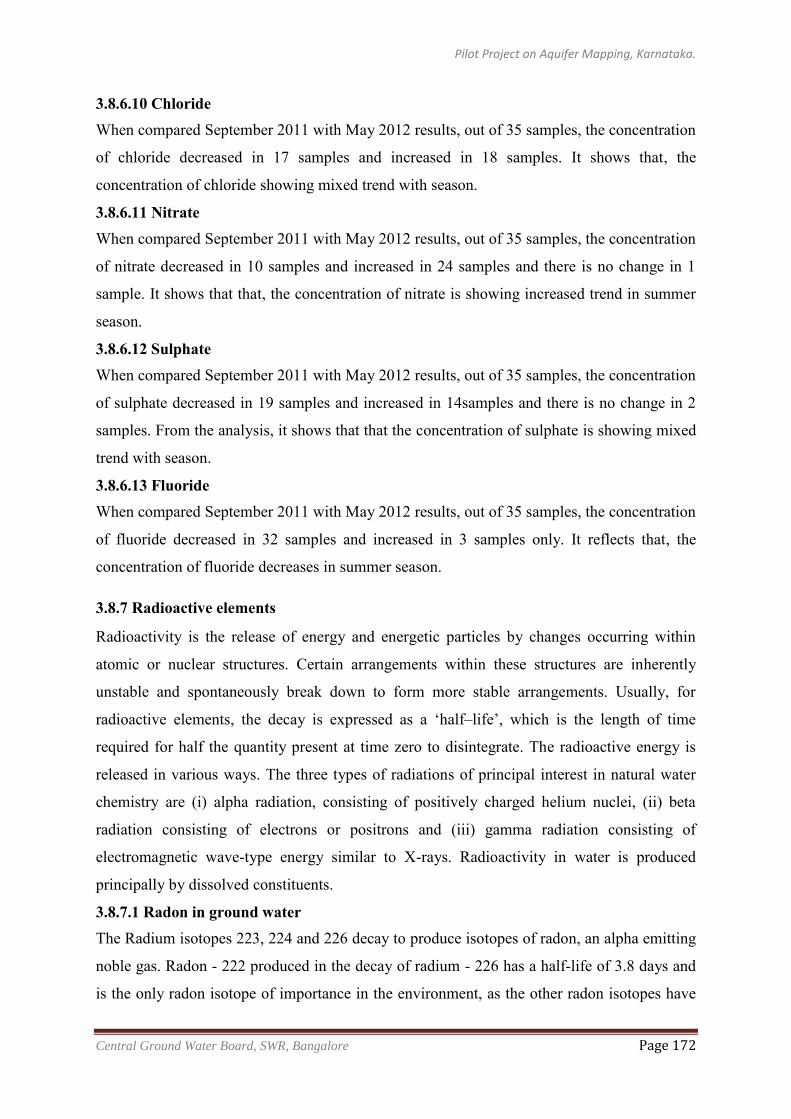
Pilot Project on Aquifer Mapping, Karnataka.
Central Ground Water Board, SWR, Bangalore Page 172
3.8.6.10 Chloride When compared September 2011 with May 2012 results, out of 35 samples, the concentration
of chloride decreased in 17 samples and increased in 18 samples. It shows that, the
concentration of chloride showing mixed trend with season.
3.8.6.11 Nitrate When compared September 2011 with May 2012 results, out of 35 samples, the concentration
of nitrate decreased in 10 samples and increased in 24 samples and there is no change in 1
sample. It shows that that, the concentration of nitrate is showing increased trend in summer
season.
3.8.6.12 Sulphate When compared September 2011 with May 2012 results, out of 35 samples, the concentration
of sulphate decreased in 19 samples and increased in 14samples and there is no change in 2
samples. From the analysis, it shows that that the concentration of sulphate is showing mixed
trend with season.
3.8.6.13 Fluoride When compared September 2011 with May 2012 results, out of 35 samples, the concentration
of fluoride decreased in 32 samples and increased in 3 samples only. It reflects that, the
concentration of fluoride decreases in summer season.
3.8.7 Radioactive elements
Radioactivity is the release of energy and energetic particles by changes occurring within
atomic or nuclear structures. Certain arrangements within these structures are inherently
unstable and spontaneously break down to form more stable arrangements. Usually, for
radioactive elements, the decay is expressed as a ‘half–life’, which is the length of time
required for half the quantity present at time zero to disintegrate. The radioactive energy is
released in various ways. The three types of radiations of principal interest in natural water
chemistry are (i) alpha radiation, consisting of positively charged helium nuclei, (ii) beta
radiation consisting of electrons or positrons and (iii) gamma radiation consisting of
electromagnetic wave-type energy similar to X-rays. Radioactivity in water is produced
principally by dissolved constituents.
3.8.7.1 Radon in ground water The Radium isotopes 223, 224 and 226 decay to produce isotopes of radon, an alpha emitting
noble gas. Radon - 222 produced in the decay of radium - 226 has a half-life of 3.8 days and
is the only radon isotope of importance in the environment, as the other radon isotopes have
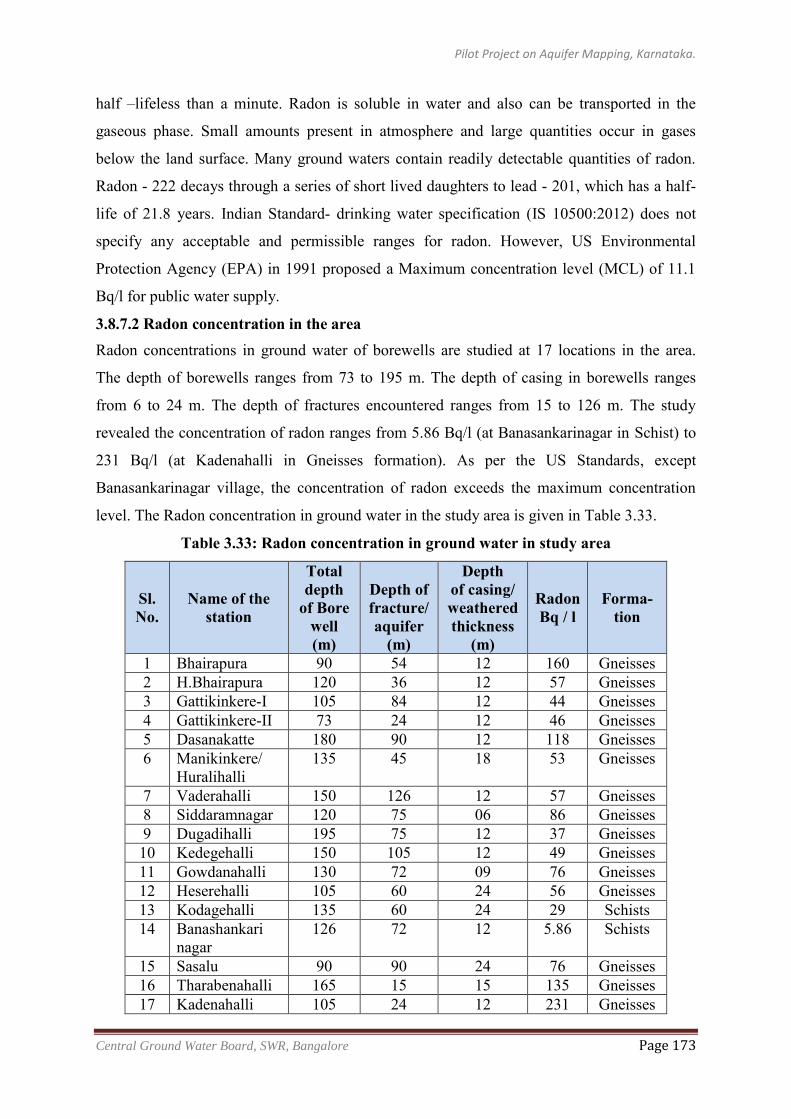
Pilot Project on Aquifer Mapping, Karnataka.
Central Ground Water Board, SWR, Bangalore Page 173
half –lifeless than a minute. Radon is soluble in water and also can be transported in the
gaseous phase. Small amounts present in atmosphere and large quantities occur in gases
below the land surface. Many ground waters contain readily detectable quantities of radon.
Radon - 222 decays through a series of short lived daughters to lead - 201, which has a half-
life of 21.8 years. Indian Standard- drinking water specification (IS 10500:2012) does not
specify any acceptable and permissible ranges for radon. However, US Environmental
Protection Agency (EPA) in 1991 proposed a Maximum concentration level (MCL) of 11.1
Bq/l for public water supply.
3.8.7.2 Radon concentration in the area Radon concentrations in ground water of borewells are studied at 17 locations in the area.
The depth of borewells ranges from 73 to 195 m. The depth of casing in borewells ranges
from 6 to 24 m. The depth of fractures encountered ranges from 15 to 126 m. The study
revealed the concentration of radon ranges from 5.86 Bq/l (at Banasankarinagar in Schist) to
231 Bq/l (at Kadenahalli in Gneisses formation). As per the US Standards, except
Banasankarinagar village, the concentration of radon exceeds the maximum concentration
level. The Radon concentration in ground water in the study area is given in Table 3.33.
Table 3.33: Radon concentration in ground water in study area
Sl. No.
Name of the station
Total depth
of Bore well (m)
Depth of fracture/ aquifer
(m)
Depth of casing/ weathered thickness
(m)
Radon Bq / l
Forma- tion
1 Bhairapura 90 54 12 160 Gneisses 2 H.Bhairapura 120 36 12 57 Gneisses 3 Gattikinkere-I 105 84 12 44 Gneisses 4 Gattikinkere-II 73 24 12 46 Gneisses 5 Dasanakatte 180 90 12 118 Gneisses 6 Manikinkere/
Huralihalli 135 45 18 53 Gneisses
7 Vaderahalli 150 126 12 57 Gneisses 8 Siddaramnagar 120 75 06 86 Gneisses 9 Dugadihalli 195 75 12 37 Gneisses 10 Kedegehalli 150 105 12 49 Gneisses 11 Gowdanahalli 130 72 09 76 Gneisses 12 Heserehalli 105 60 24 56 Gneisses 13 Kodagehalli 135 60 24 29 Schists 14 Banashankari
nagar 126 72 12 5.86 Schists
15 Sasalu 90 90 24 76 Gneisses 16 Tharabenahalli 165 15 15 135 Gneisses 17 Kadenahalli 105 24 12 231 Gneisses
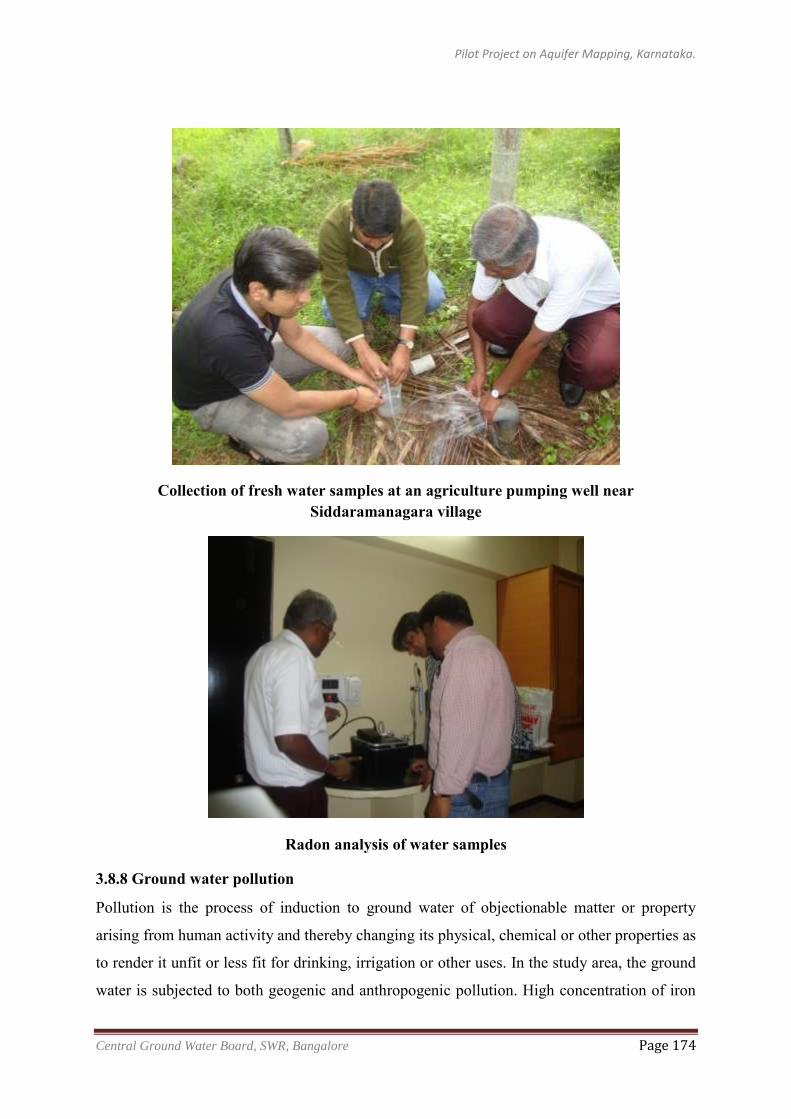
Pilot Project on Aquifer Mapping, Karnataka.
Central Ground Water Board, SWR, Bangalore Page 174
Collection of fresh water samples at an agriculture pumping well near Siddaramanagara village
Radon analysis of water samples
3.8.8 Ground water pollution
Pollution is the process of induction to ground water of objectionable matter or property
arising from human activity and thereby changing its physical, chemical or other properties as
to render it unfit or less fit for drinking, irrigation or other uses. In the study area, the ground
water is subjected to both geogenic and anthropogenic pollution. High concentration of iron
Pilot Project on Aquifer Mapping, Karnataka.
Central Ground Water Board, SWR, Bangalore Page 175
at most places beyond acceptable limit (0.3 mg/l) is mainly due to geogenic pollution. High
concentration of nitrate at certain places beyond acceptable limit (45 mg/l) is due to human
activity and it is highly localized in and around village habitations.
3.9 RECHARGE PARAMETERS
The dynamic ground water resources of the study area which is part of 4D3D8 watershed is
computed based on Ground Water Estimation Methodology 1997 (GEM 97) as on
31.3.2014.The GEM-97 is an improvement version over the GEC-84 taking into
consideration of many ground water aspects based on field investigations. The major
improvement over GEC 1984 is that the watershed is taken as assessment unit and then
appropriated for administrative units. Sub-areas viz. hilly area is excluded, poor quality areas
as per local standards separately dealt with and the rest of the area is classified as command
and non-command for ground water assessment.
Season wise ground water resource assessment is done for each sub-area. For monsoon
recharge, post-monsoon ground water levels is taken after a month of cessation,thereby
ensuring that, base flow after monsoon, not utilised for development, is avoided during
estimation.
Methodology has been provided for determination of specific yield based on ground water
balance approach in dry season for non-command area in hardrock terrain. Norm for return
flow from irrigation is based on type of source, type of crop and depth to water table.
Categorisation is based on stage of development and long term trend in pre-& post monsoon
ground water levels. Allocation for domestic and industrial use is more realistic based on
population density and relative load on ground water for the purposes.
3.9.1 Data collection and compilation
The following data were collected during the field work and from various State Govt.
Departments. viz. daily rainfall data for 4 years (2010-2013), infiltration rates of soil,
inventory of borewells for unit draft, aquifer information, quality etc., area under ground
water irrigation, well census, details pertaining to tanks, cropping pattern, command and non-
command area, population growth, watershed, geology, soil, hilly area, location of
observation wells, rain gauge stations and taluk boundaries were digitised. The periodical
ground water level data collected from observation wells established by CGWB and also
from DMG, Govt. of Karnataka were processed and mean ground water level fluctuation and
trends were estimated.
Pilot Project on Aquifer Mapping, Karnataka.
Central Ground Water Board, SWR, Bangalore Page 176
3.9.2 Ground Water Assessment
There is no command area in the watershed. Similarly, there is no mappable poor quality area
in the watershed. The areas having slope of more than 20% are supposed to have very quick
run off and little recharge to ground water. Similarly, areas having massive rock exposures
are also not suitable for augmenting recharge to ground water. Hence, an area of about 2546
ha is excluded for recharge calculations and an area of 34954 ha is considered for ground
water recharge.
3.9.3 Computation of Ground water Resources
The dynamic groundwater resource of the watershed is assessed as on March 2014.
3.9.4 Ground Water Recharge
For the purpose of evaluation of ground water recharge, rainfall infiltration method is
followed. The average amount of rainfall received during the year 2013-14 is 632 mm after
making the average of all influencing rain gauge stations. The rainfall infiltration factor is
taken as 10% in the study area because the farmers have constructed farm bunds to collect
rainwater at most of the places.
The ground water recharge is calculated as, Area * 10% of Rainfall (m)
=34954 ha * 63.2/1000 = 2209 ha.m
Recharge from return flow from irrigation is negligible as most of the farmers are practicing
drip irrigation. Recharge from minor irrigation tanks is also negligible as the tanks are not
receiving any inflows.
3.10 DISCHARGE PARAMETERS
3.10.1 Natural Discharge
GEM-97 accounts for natural discharge like base flow and evapo-transpiration from
groundwater source as 5% & 10% of annual recharge in case of recharge calculated by WTF
method and RIF method respectively. In the study area, it is taken as 10% as transpiration
from coconut trees is high in the area. Therefore, the natural discharge is 220.9 ha.m and the
net ground water availability is 1988.1 ha.m (19.88 MCM)
3.10.2 Ground water draft for domestic and industrial purpose
The area is predominantly rural with a density of 180 persons per sq.km. There are about
67,357 persons and some coconut based industries in the area. It is observed that the
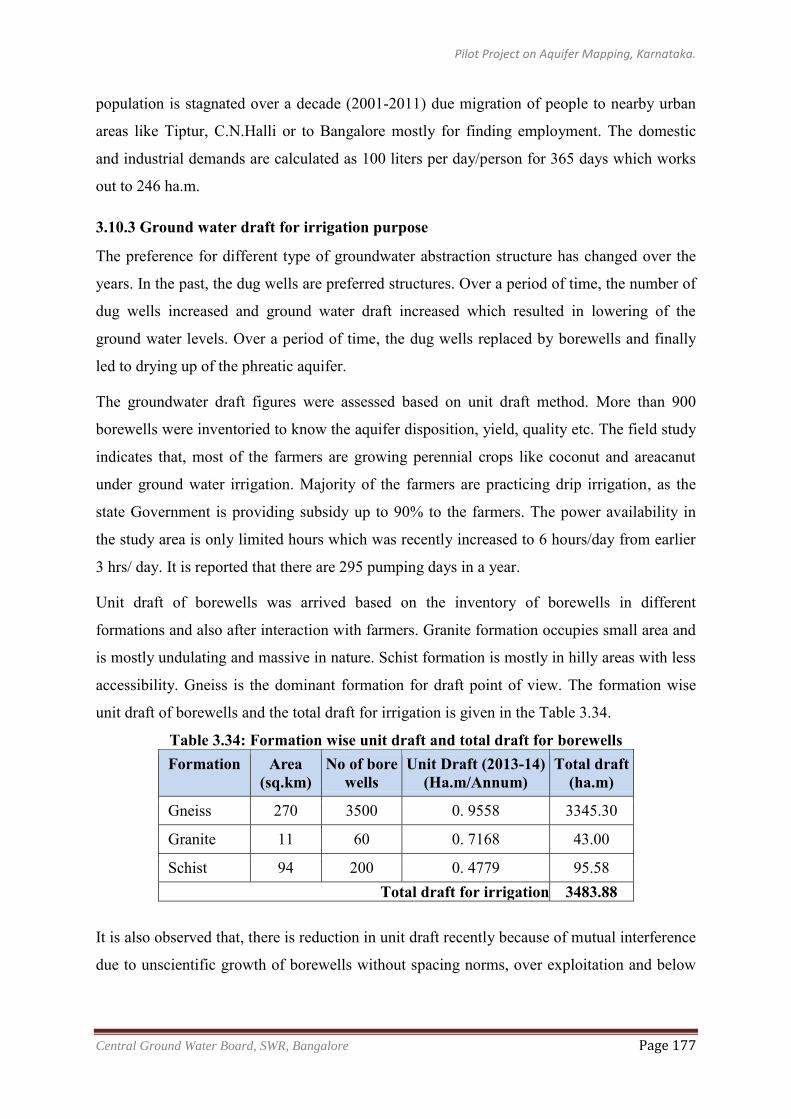
Pilot Project on Aquifer Mapping, Karnataka.
Central Ground Water Board, SWR, Bangalore Page 177
population is stagnated over a decade (2001-2011) due migration of people to nearby urban
areas like Tiptur, C.N.Halli or to Bangalore mostly for finding employment. The domestic
and industrial demands are calculated as 100 liters per day/person for 365 days which works
out to 246 ha.m.
3.10.3 Ground water draft for irrigation purpose
The preference for different type of groundwater abstraction structure has changed over the
years. In the past, the dug wells are preferred structures. Over a period of time, the number of
dug wells increased and ground water draft increased which resulted in lowering of the
ground water levels. Over a period of time, the dug wells replaced by borewells and finally
led to drying up of the phreatic aquifer.
The groundwater draft figures were assessed based on unit draft method. More than 900
borewells were inventoried to know the aquifer disposition, yield, quality etc. The field study
indicates that, most of the farmers are growing perennial crops like coconut and areacanut
under ground water irrigation. Majority of the farmers are practicing drip irrigation, as the
state Government is providing subsidy up to 90% to the farmers. The power availability in
the study area is only limited hours which was recently increased to 6 hours/day from earlier
3 hrs/ day. It is reported that there are 295 pumping days in a year.
Unit draft of borewells was arrived based on the inventory of borewells in different
formations and also after interaction with farmers. Granite formation occupies small area and
is mostly undulating and massive in nature. Schist formation is mostly in hilly areas with less
accessibility. Gneiss is the dominant formation for draft point of view. The formation wise
unit draft of borewells and the total draft for irrigation is given in the Table 3.34.
Table 3.34: Formation wise unit draft and total draft for borewells Formation Area
(sq.km) No of bore
wells Unit Draft (2013-14)
(Ha.m/Annum) Total draft
(ha.m)
Gneiss 270 3500 0. 9558 3345.30
Granite 11 60 0. 7168 43.00
Schist 94 200 0. 4779 95.58 Total draft for irrigation 3483.88
It is also observed that, there is reduction in unit draft recently because of mutual interference
due to unscientific growth of borewells without spacing norms, over exploitation and below
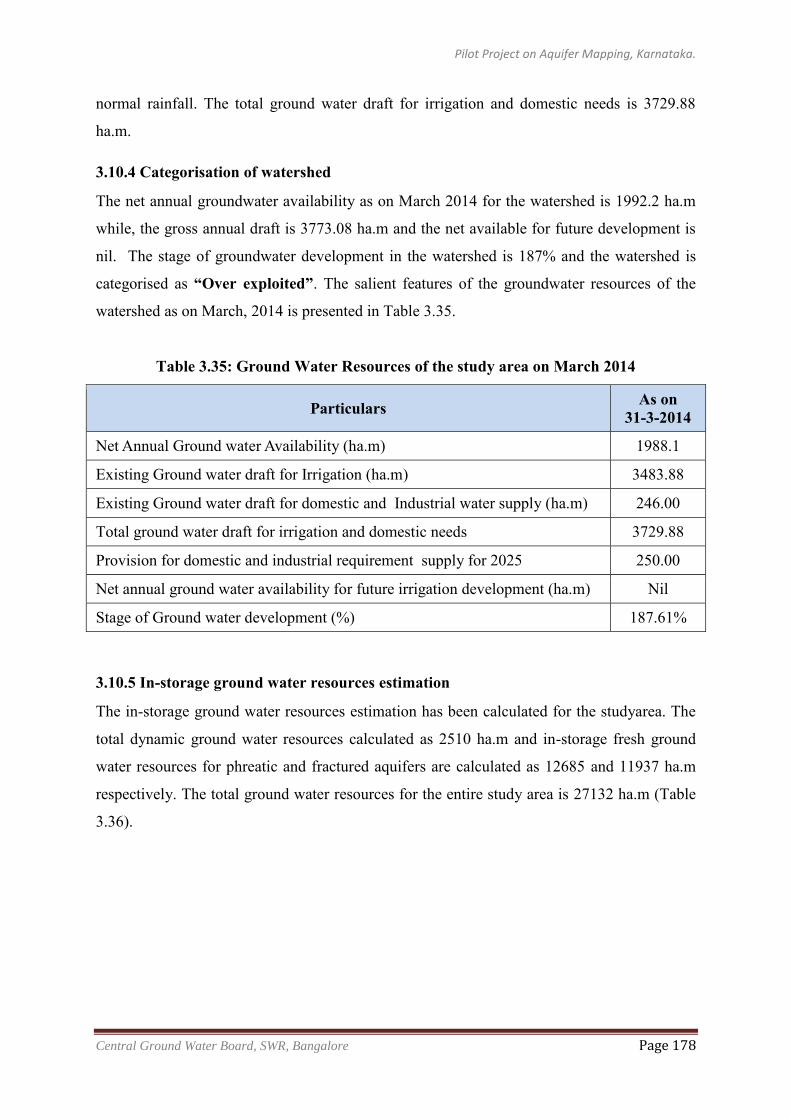
Pilot Project on Aquifer Mapping, Karnataka.
Central Ground Water Board, SWR, Bangalore Page 178
normal rainfall. The total ground water draft for irrigation and domestic needs is 3729.88
ha.m.
3.10.4 Categorisation of watershed
The net annual groundwater availability as on March 2014 for the watershed is 1992.2 ha.m
while, the gross annual draft is 3773.08 ha.m and the net available for future development is
nil. The stage of groundwater development in the watershed is 187% and the watershed is
categorised as “Over exploited”. The salient features of the groundwater resources of the
watershed as on March, 2014 is presented in Table 3.35.
Table 3.35: Ground Water Resources of the study area on March 2014
Particulars As on 31-3-2014
Net Annual Ground water Availability (ha.m) 1988.1
Existing Ground water draft for Irrigation (ha.m) 3483.88
Existing Ground water draft for domestic and Industrial water supply (ha.m) 246.00
Total ground water draft for irrigation and domestic needs 3729.88
Provision for domestic and industrial requirement supply for 2025 250.00
Net annual ground water availability for future irrigation development (ha.m) Nil
Stage of Ground water development (%) 187.61%
3.10.5 In-storage ground water resources estimation
The in-storage ground water resources estimation has been calculated for the studyarea. The
total dynamic ground water resources calculated as 2510 ha.m and in-storage fresh ground
water resources for phreatic and fractured aquifers are calculated as 12685 and 11937 ha.m
respectively. The total ground water resources for the entire study area is 27132 ha.m (Table
3.36).
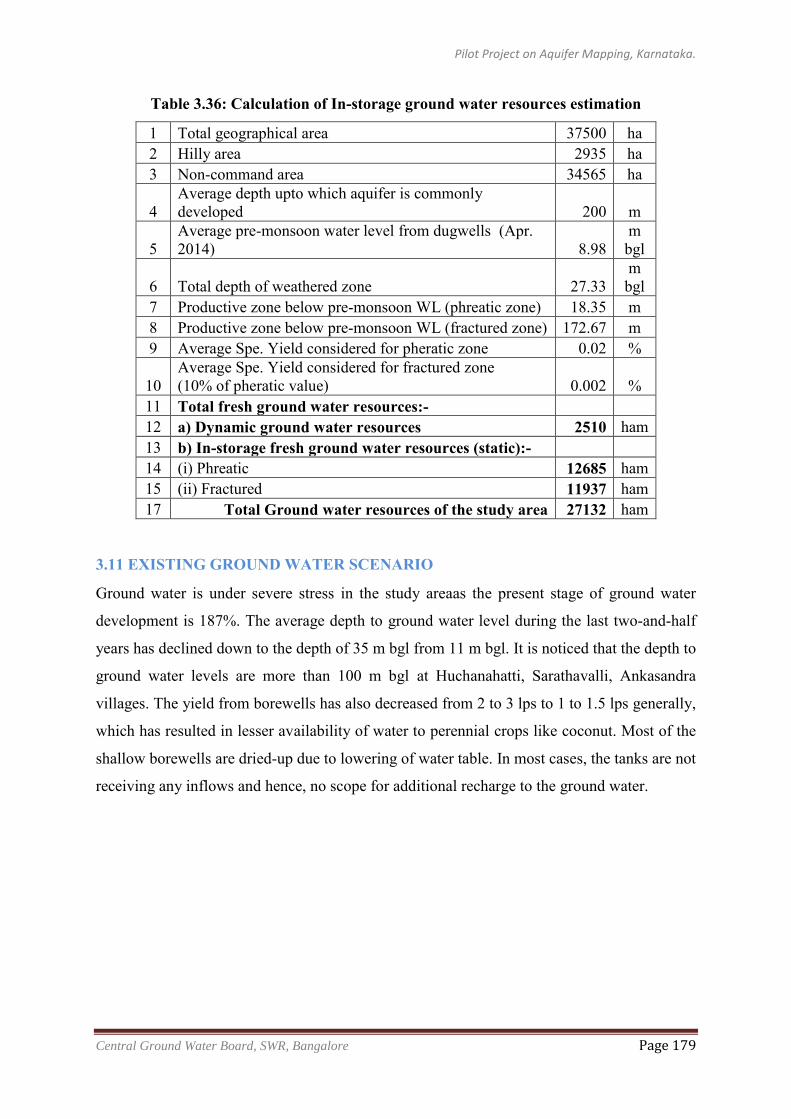
Pilot Project on Aquifer Mapping, Karnataka.
Central Ground Water Board, SWR, Bangalore Page 179
Table 3.36: Calculation of In-storage ground water resources estimation
1 Total geographical area 37500 ha 2 Hilly area 2935 ha 3 Non-command area 34565 ha
4 Average depth upto which aquifer is commonly developed 200 m
5 Average pre-monsoon water level from dugwells (Apr. 2014) 8.98
m bgl
6 Total depth of weathered zone 27.33 m bgl
7 Productive zone below pre-monsoon WL (phreatic zone) 18.35 m 8 Productive zone below pre-monsoon WL (fractured zone) 172.67 m 9 Average Spe. Yield considered for pheratic zone 0.02 %
10 Average Spe. Yield considered for fractured zone (10% of pheratic value) 0.002 %
11 Total fresh ground water resources:- 12 a) Dynamic ground water resources 2510 ham 13 b) In-storage fresh ground water resources (static):- 14 (i) Phreatic 12685 ham 15 (ii) Fractured 11937 ham 17 Total Ground water resources of the study area 27132 ham
3.11 EXISTING GROUND WATER SCENARIO
Ground water is under severe stress in the study areaas the present stage of ground water
development is 187%. The average depth to ground water level during the last two-and-half
years has declined down to the depth of 35 m bgl from 11 m bgl. It is noticed that the depth to
ground water levels are more than 100 m bgl at Huchanahatti, Sarathavalli, Ankasandra
villages. The yield from borewells has also decreased from 2 to 3 lps to 1 to 1.5 lps generally,
which has resulted in lesser availability of water to perennial crops like coconut. Most of the
shallow borewells are dried-up due to lowering of water table. In most cases, the tanks are not
receiving any inflows and hence, no scope for additional recharge to the ground water.
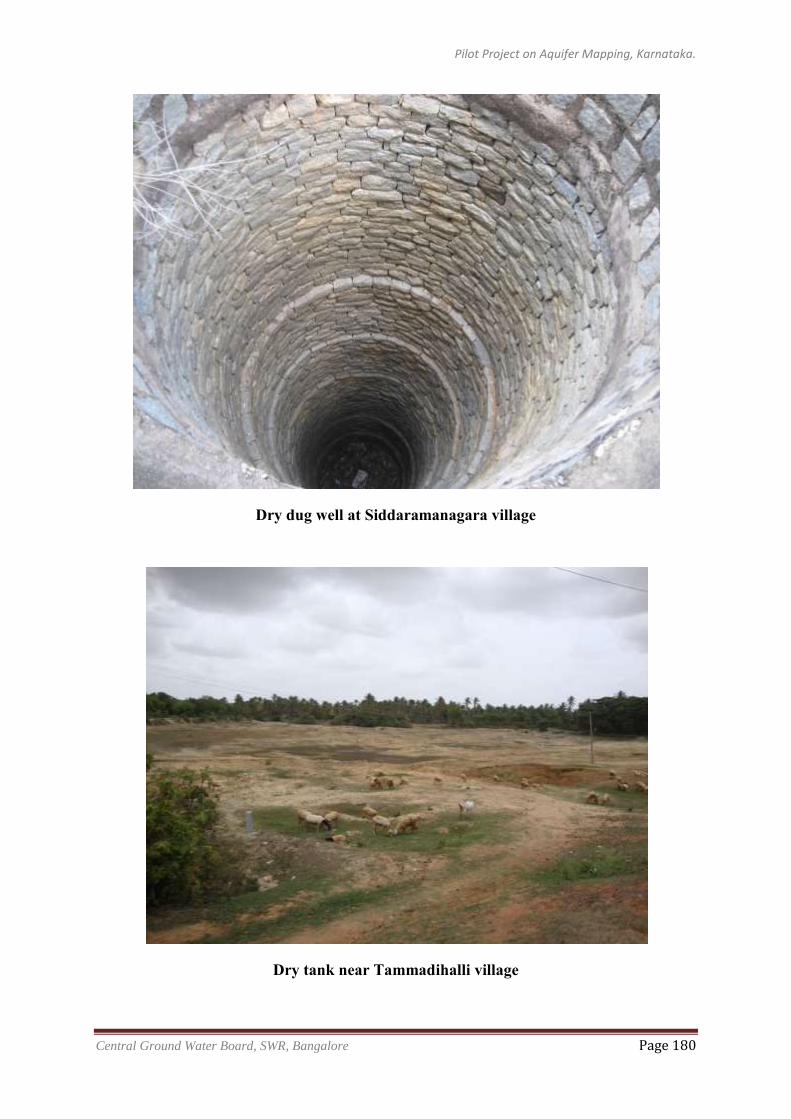
Pilot Project on Aquifer Mapping, Karnataka.
Central Ground Water Board, SWR, Bangalore Page 180
Dry dug well at Siddaramanagara village
Dry tank near Tammadihalli village
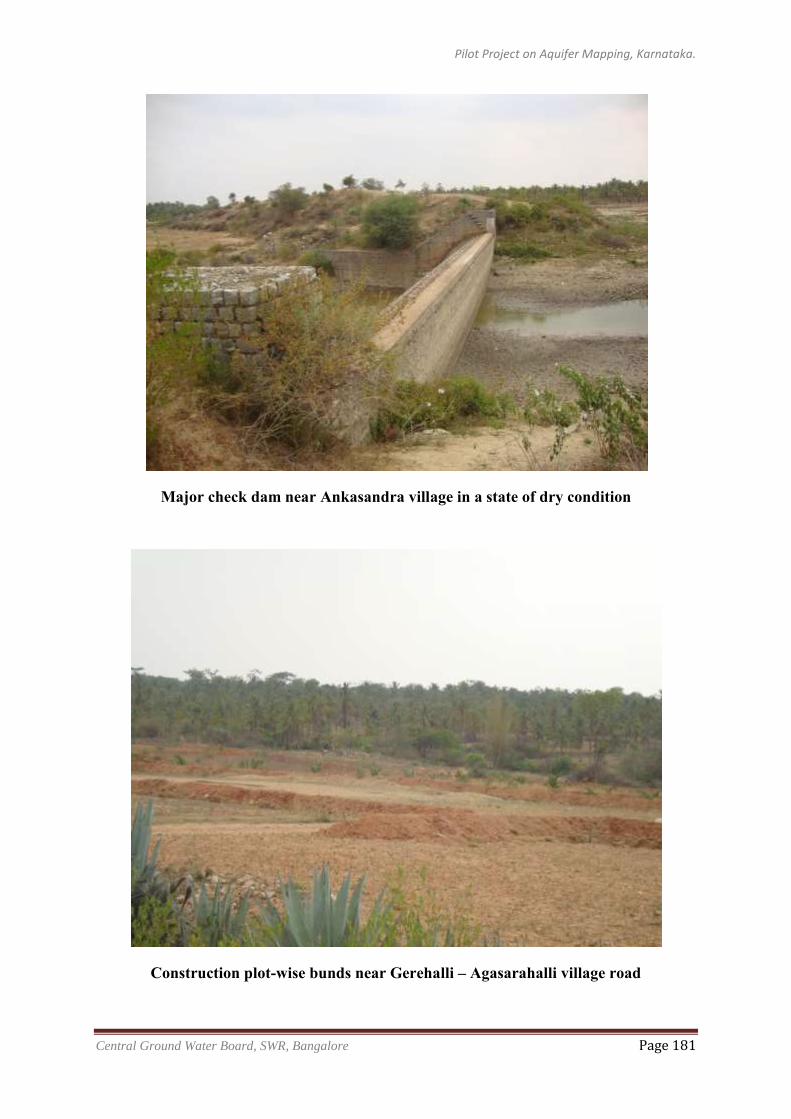
Pilot Project on Aquifer Mapping, Karnataka.
Central Ground Water Board, SWR, Bangalore Page 181
Major check dam near Ankasandra village in a state of dry condition
Construction plot-wise bunds near Gerehalli – Agasarahalli village road
Pilot Project on Aquifer Mapping, Karnataka.
Central Ground Water Board, SWR, Bangalore Page 182
4.0 DATA INTEGRARATION
4.1 INTEGRATION OF DATA FROM CONVENTIONAL AND ADVANCED TECHNIQUES
In order to achieve one of the main objectives of mapping the principal aquifer, we
established an approach for translating the geophysical results into the hydrogeological
models through the steps as follows:
i. SkyTEM results are calibrated against the drilling lighologs, ground geophysical
results and then integrated lithological logsareprepared for selected sites.
ii. Equivalent litho-units of the integrated logs are converted into principal litho-units
as proxy of principal aquifer and aquitard.
iii. The principal lithologs are imported to the Arhus Workbench and incorporated
with the individual sections prepared at each 2 km X 2 km gridline.
iv. The principal litho-facies are interpolated and extrapolated along the SkyTEM
sections using the calibrated resistivity values.
v. Based on the hydrostratigraphy, the principal lithological units are finally
attributed into principal aquifer, bedrocks.
Lithological layer boundaries are prepared for all possible SCI model separated ~25m from
each other along the grid lines. This is followed by gridding using the krigging interpolation
scheme. Of course, the interpolation has averaged out some of the sharp anomalies indicating
smooth variation. In order to retain the small-scale variation, it is desired to do the
digitization and demarcation of lithological boundaries for all the flight lines.
4.2 VALUE ADDITION FROM GEOPHYSICAL STUDIES
With the results from the SkyTEM survey, a first order understanding of the SkyTEM
responses with the ground geophysics (i.e. ERT, VES), exploratory well lithologs and
aquifers encountered was made at all the drilling sites. This attempt is made to validate the
efficacy of newly inducted SkyTEM tool in aquifer mapping.
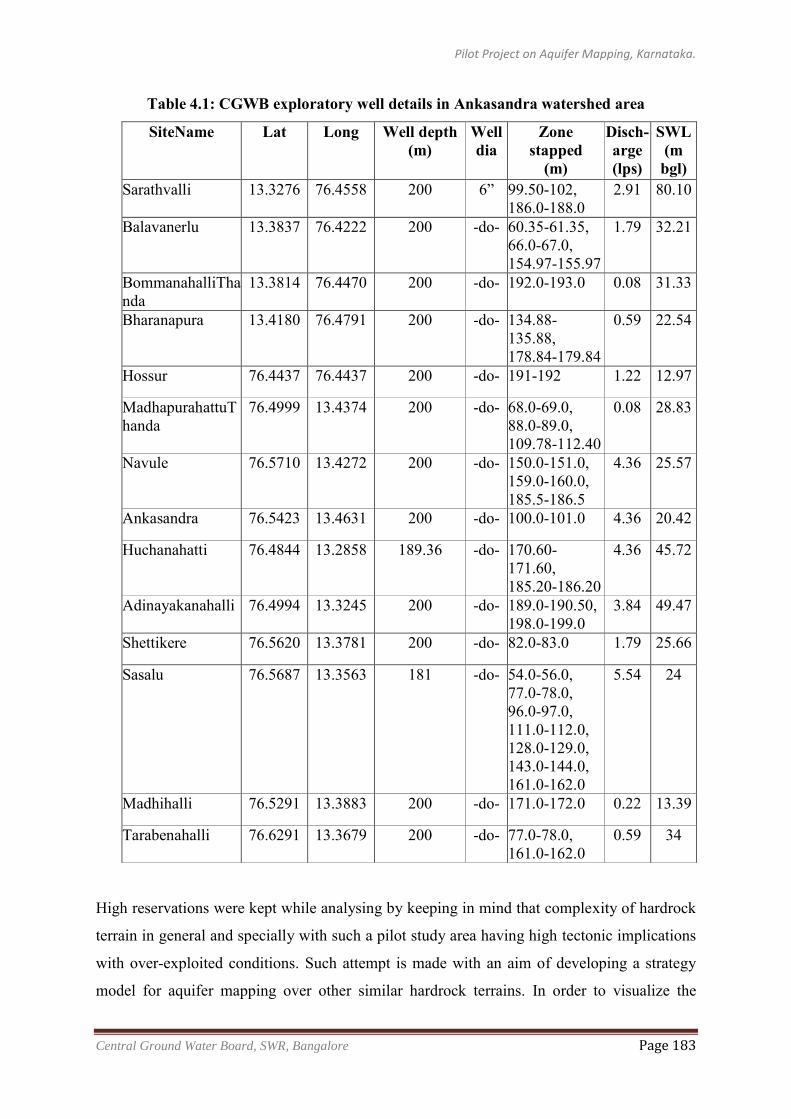
Pilot Project on Aquifer Mapping, Karnataka.
Central Ground Water Board, SWR, Bangalore Page 183
Table 4.1: CGWB exploratory well details in Ankasandra watershed area
SiteName Lat Long Well depth (m)
Well dia
Zone stapped
(m)
Disch-arge (lps)
SWL (m bgl)
Sarathvalli 13.3276 76.4558 200 6” 99.50-102, 186.0-188.0
2.91 80.10
Balavanerlu 13.3837 76.4222 200 -do- 60.35-61.35, 66.0-67.0, 154.97-155.97
1.79 32.21
BommanahalliTha nda
13.3814 76.4470 200 -do- 192.0-193.0 0.08 31.33
Bharanapura 13.4180 76.4791 200 -do- 134.88-135.88, 178.84-179.84
0.59 22.54
Hossur 76.4437 76.4437 200 -do- 191-192 1.22 12.97
MadhapurahattuT handa
76.4999 13.4374 200 -do- 68.0-69.0, 88.0-89.0, 109.78-112.40
0.08 28.83
Navule 76.5710 13.4272 200 -do- 150.0-151.0, 159.0-160.0, 185.5-186.5
4.36 25.57
Ankasandra 76.5423 13.4631 200 -do- 100.0-101.0 4.36 20.42
Huchanahatti 76.4844 13.2858 189.36 -do- 170.60-171.60, 185.20-186.20
4.36 45.72
Adinayakanahalli 76.4994 13.3245 200 -do- 189.0-190.50, 198.0-199.0
3.84 49.47
Shettikere 76.5620 13.3781 200 -do- 82.0-83.0 1.79 25.66
Sasalu 76.5687 13.3563 181 -do- 54.0-56.0, 77.0-78.0, 96.0-97.0, 111.0-112.0, 128.0-129.0, 143.0-144.0, 161.0-162.0
5.54 24
Madhihalli 76.5291 13.3883 200 -do- 171.0-172.0 0.22 13.39
Tarabenahalli 76.6291 13.3679 200 -do- 77.0-78.0, 161.0-162.0
0.59 34
High reservations were kept while analysing by keeping in mind that complexity of hardrock
terrain in general and specially with such a pilot study area having high tectonic implications
with over-exploited conditions. Such attempt is made with an aim of developing a strategy
model for aquifer mapping over other similar hardrock terrains. In order to visualize the
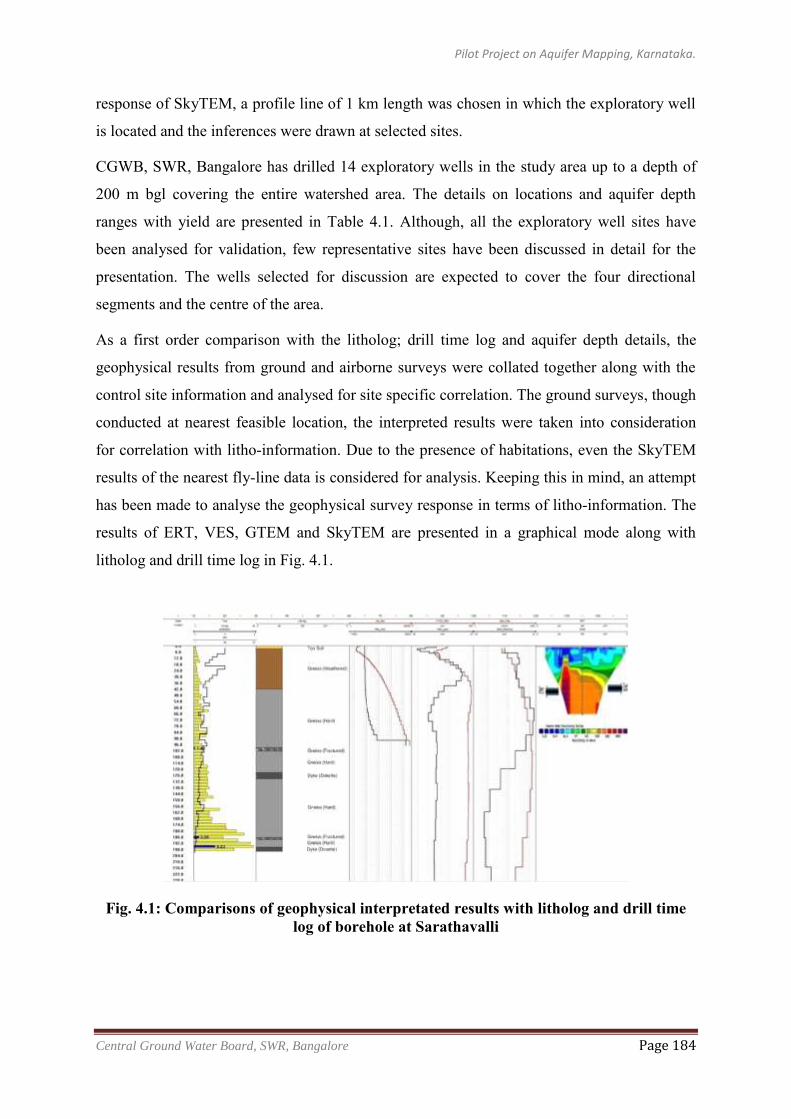
Pilot Project on Aquifer Mapping, Karnataka.
Central Ground Water Board, SWR, Bangalore Page 184
response of SkyTEM, a profile line of 1 km length was chosen in which the exploratory well
is located and the inferences were drawn at selected sites.
CGWB, SWR, Bangalore has drilled 14 exploratory wells in the study area up to a depth of
200 m bgl covering the entire watershed area. The details on locations and aquifer depth
ranges with yield are presented in Table 4.1. Although, all the exploratory well sites have
been analysed for validation, few representative sites have been discussed in detail for the
presentation. The wells selected for discussion are expected to cover the four directional
segments and the centre of the area.
As a first order comparison with the litholog; drill time log and aquifer depth details, the
geophysical results from ground and airborne surveys were collated together along with the
control site information and analysed for site specific correlation. The ground surveys, though
conducted at nearest feasible location, the interpreted results were taken into consideration
for correlation with litho-information. Due to the presence of habitations, even the SkyTEM
results of the nearest fly-line data is considered for analysis. Keeping this in mind, an attempt
has been made to analyse the geophysical survey response in terms of litho-information. The
results of ERT, VES, GTEM and SkyTEM are presented in a graphical mode along with
litholog and drill time log in Fig. 4.1.
Fig. 4.1: Comparisons of geophysical interpretated results with litholog and drill time log of borehole at Sarathavalli
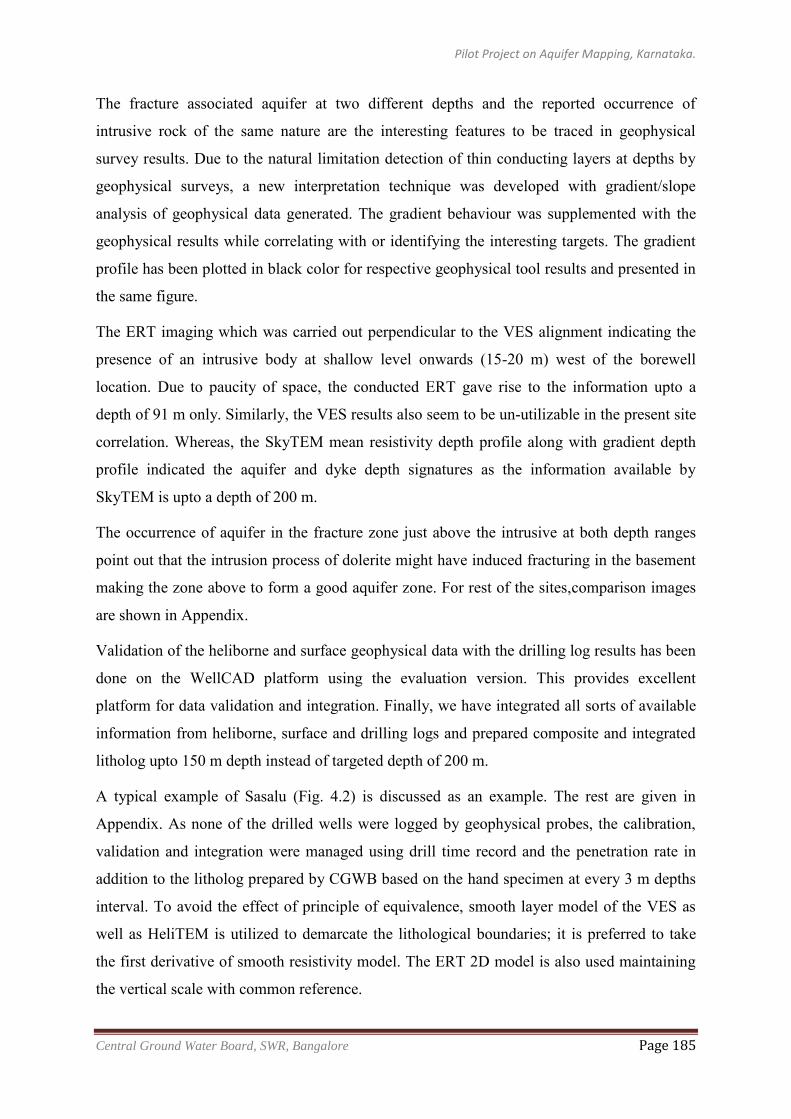
Pilot Project on Aquifer Mapping, Karnataka.
Central Ground Water Board, SWR, Bangalore Page 185
The fracture associated aquifer at two different depths and the reported occurrence of
intrusive rock of the same nature are the interesting features to be traced in geophysical
survey results. Due to the natural limitation detection of thin conducting layers at depths by
geophysical surveys, a new interpretation technique was developed with gradient/slope
analysis of geophysical data generated. The gradient behaviour was supplemented with the
geophysical results while correlating with or identifying the interesting targets. The gradient
profile has been plotted in black color for respective geophysical tool results and presented in
the same figure.
The ERT imaging which was carried out perpendicular to the VES alignment indicating the
presence of an intrusive body at shallow level onwards (15-20 m) west of the borewell
location. Due to paucity of space, the conducted ERT gave rise to the information upto a
depth of 91 m only. Similarly, the VES results also seem to be un-utilizable in the present site
correlation. Whereas, the SkyTEM mean resistivity depth profile along with gradient depth
profile indicated the aquifer and dyke depth signatures as the information available by
SkyTEM is upto a depth of 200 m.
The occurrence of aquifer in the fracture zone just above the intrusive at both depth ranges
point out that the intrusion process of dolerite might have induced fracturing in the basement
making the zone above to form a good aquifer zone. For rest of the sites,comparison images
are shown in Appendix.
Validation of the heliborne and surface geophysical data with the drilling log results has been
done on the WellCAD platform using the evaluation version. This provides excellent
platform for data validation and integration. Finally, we have integrated all sorts of available
information from heliborne, surface and drilling logs and prepared composite and integrated
litholog upto 150 m depth instead of targeted depth of 200 m.
A typical example of Sasalu (Fig. 4.2) is discussed as an example. The rest are given in
Appendix. As none of the drilled wells were logged by geophysical probes, the calibration,
validation and integration were managed using drill time record and the penetration rate in
addition to the litholog prepared by CGWB based on the hand specimen at every 3 m depths
interval. To avoid the effect of principle of equivalence, smooth layer model of the VES as
well as HeliTEM is utilized to demarcate the lithological boundaries; it is preferred to take
the first derivative of smooth resistivity model. The ERT 2D model is also used maintaining
the vertical scale with common reference.
Pilot Project on Aquifer Mapping, Karnataka.
Central Ground Water Board, SWR, Bangalore Page 186
Fig. 4.2: Data integration and Validation of CGWB drilled well at Sasalu village
The top 10 m showing high penetration rate (PR) is an indicative of soft formation, which
given as top soil in CGWB litholog. The measured resistivity by VES, SkyTEM and ERT are
also found low in the range of 10-20 Ohm.m. There is sharp change of the grade of the VES
and HTEM revealing encountering the litho-interface. There is another sharp change at
around 15 m, which reveals increase in the compactness of the rock matrix. Though the
drilling log shows encountering the ~30 m, the PR and HTEM-RES_Grade found change at
35 m, which is within the agreement limit. As per the drilling record, first moisture
encountered at 54-56 m depth below ground has also been found responded by the HTEM-
RES Grade.
There are six sets of fractures encountered at respectively 77-7, 96-97, 111-112, 128-129,
143-144 and 161-162 m depths. The corresponding cumulative well discharges (i.e. yield)
with depths are also given in blue color. The fractures at 111-112 and 161-161 are the major
contributor of the ground water discharge, which showed significant increase in yield. The
SkyTEM resistivity and its first derivative shown respectively as HTEM-RES and HTEM-
RES_Grade reveal down-to-one correspondence. The HTEM-RES result below 150 m in the
present case loses its sensitivity and hence, may not be taken for interpretation. The strong
correspondence of various litho-interfaces including the potential fracture encountered at 111
m depth with SkyTEM result does validate to the HeliTEM results. Strong correlation of the
HTEM at shallow level validates the contribution of the low moment data. This is very
important from the point of mapping the weathering profile, which is hardly 10-20 m thick.
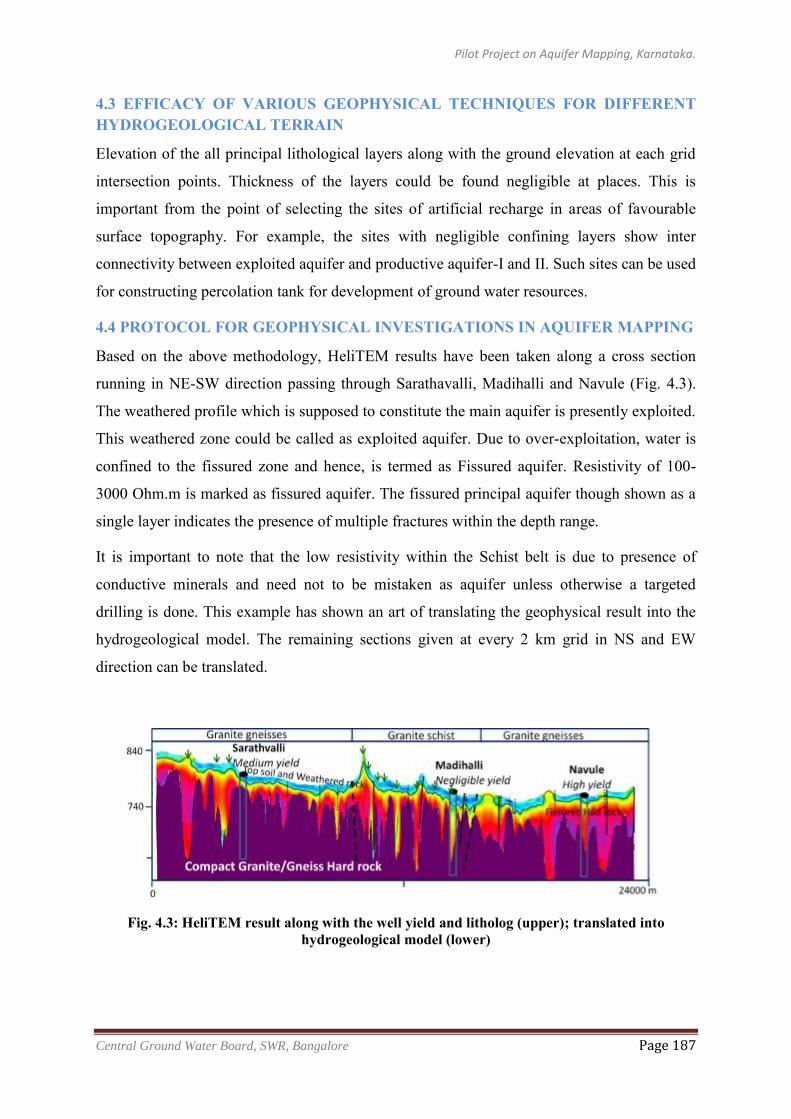
Pilot Project on Aquifer Mapping, Karnataka.
Central Ground Water Board, SWR, Bangalore Page 187
4.3 EFFICACY OF VARIOUS GEOPHYSICAL TECHNIQUES FOR DIFFERENT HYDROGEOLOGICAL TERRAIN
Elevation of the all principal lithological layers along with the ground elevation at each grid
intersection points. Thickness of the layers could be found negligible at places. This is
important from the point of selecting the sites of artificial recharge in areas of favourable
surface topography. For example, the sites with negligible confining layers show inter
connectivity between exploited aquifer and productive aquifer-I and II. Such sites can be used
for constructing percolation tank for development of ground water resources.
4.4 PROTOCOL FOR GEOPHYSICAL INVESTIGATIONS IN AQUIFER MAPPING
Based on the above methodology, HeliTEM results have been taken along a cross section
running in NE-SW direction passing through Sarathavalli, Madihalli and Navule (Fig. 4.3).
The weathered profile which is supposed to constitute the main aquifer is presently exploited.
This weathered zone could be called as exploited aquifer. Due to over-exploitation, water is
confined to the fissured zone and hence, is termed as Fissured aquifer. Resistivity of 100-
3000 Ohm.m is marked as fissured aquifer. The fissured principal aquifer though shown as a
single layer indicates the presence of multiple fractures within the depth range.
It is important to note that the low resistivity within the Schist belt is due to presence of
conductive minerals and need not to be mistaken as aquifer unless otherwise a targeted
drilling is done. This example has shown an art of translating the geophysical result into the
hydrogeological model. The remaining sections given at every 2 km grid in NS and EW
direction can be translated.
Fig. 4.3: HeliTEM result along with the well yield and litholog (upper); translated into hydrogeological model (lower)
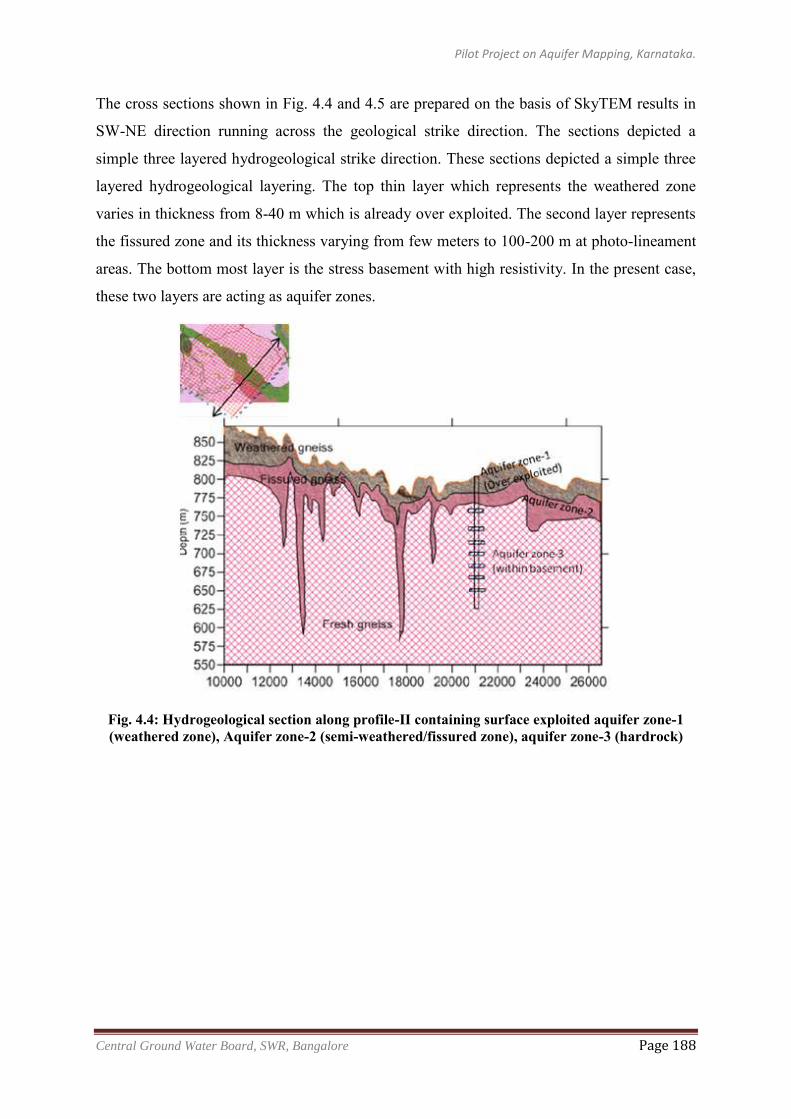
Pilot Project on Aquifer Mapping, Karnataka.
Central Ground Water Board, SWR, Bangalore Page 188
The cross sections shown in Fig. 4.4 and 4.5 are prepared on the basis of SkyTEM results in
SW-NE direction running across the geological strike direction. The sections depicted a
simple three layered hydrogeological strike direction. These sections depicted a simple three
layered hydrogeological layering. The top thin layer which represents the weathered zone
varies in thickness from 8-40 m which is already over exploited. The second layer represents
the fissured zone and its thickness varying from few meters to 100-200 m at photo-lineament
areas. The bottom most layer is the stress basement with high resistivity. In the present case,
these two layers are acting as aquifer zones.
Fig. 4.4: Hydrogeological section along profile-II containing surface exploited aquifer zone-1 (weathered zone), Aquifer zone-2 (semi-weathered/fissured zone), aquifer zone-3 (hardrock)
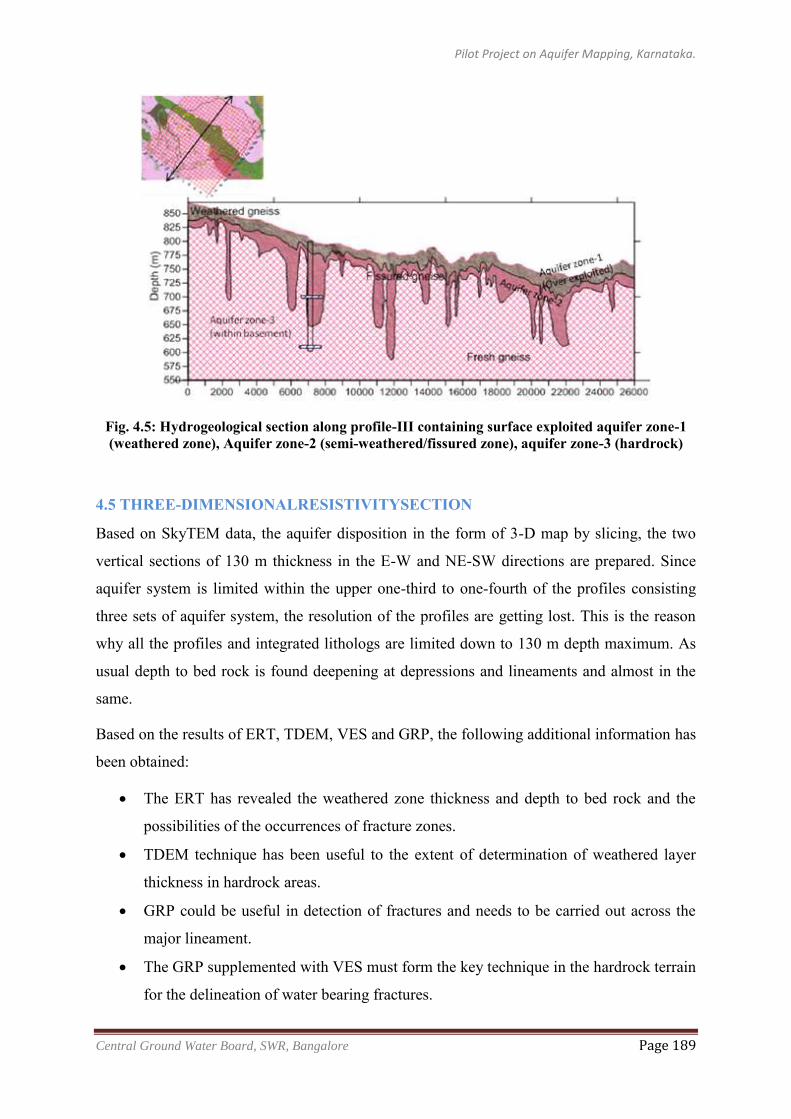
Pilot Project on Aquifer Mapping, Karnataka.
Central Ground Water Board, SWR, Bangalore Page 189
Fig. 4.5: Hydrogeological section along profile-III containing surface exploited aquifer zone-1 (weathered zone), Aquifer zone-2 (semi-weathered/fissured zone), aquifer zone-3 (hardrock)
4.5 THREE-DIMENSIONALRESISTIVITYSECTION
Based on SkyTEM data, the aquifer disposition in the form of 3-D map by slicing, the two
vertical sections of 130 m thickness in the E-W and NE-SW directions are prepared. Since
aquifer system is limited within the upper one-third to one-fourth of the profiles consisting
three sets of aquifer system, the resolution of the profiles are getting lost. This is the reason
why all the profiles and integrated lithologs are limited down to 130 m depth maximum. As
usual depth to bed rock is found deepening at depressions and lineaments and almost in the
same.
Based on the results of ERT, TDEM, VES and GRP, the following additional information has
been obtained:
The ERT has revealed the weathered zone thickness and depth to bed rock and the
possibilities of the occurrences of fracture zones.
TDEM technique has been useful to the extent of determination of weathered layer
thickness in hardrock areas.
GRP could be useful in detection of fractures and needs to be carried out across the
major lineament.
The GRP supplemented with VES must form the key technique in the hardrock terrain
for the delineation of water bearing fractures.
Pilot Project on Aquifer Mapping, Karnataka.
Central Ground Water Board, SWR, Bangalore Page 190
Findings of Heliborne Surveys:
The area is quite complex with rapid hydrogeological variations. Ground water is mostly
occurring in the deeper thin fracture zones which make its detection by HeliTEM survey a
challenge. The combination of heliborne magnetic and electromagnetic results and the
geological information helped in identifying several buried linear structures which control the
ground water occurrences in fracture zones. These regional structures could neither be picked
up through satellite imageries nor through surface mapping. Locations with favourable TEM
signatures along these magnetic lineaments could prove to be successful drilling sites. Mostly
the high yielding wells are found to be falling in the areas near these lineaments or the
contact of Granite, Gneisses and Schist.
It has shown even more than 200 m depth of investigation over buried lineaments identified
by HeliMAG. While the HeliMAG results could be used to identify area in proximity of
structures, the HeliTEM results could be used as follow-up in those areas to pinpoint sites and
characterize their hydrogeological suitability for water well drilling. A comparative
performance of VES, ERT, GRP, G-TEM and SkyTEM revealed that SkyTEM survey with
dense and high quality data has added great value in mapping the sub-surface that revealed
several features of high significance in terms of ground water occurrence and dynamics and
hence aquifer mapping. The major SkyTEM findings in the area as follows:
A number of NW-SE, NE-SW and N-S faults, and dykes manifested as magnetic
lineaments have been identified which are not picked up in satellite imageries.
The potential ground water zones are inferred from magnetic lineaments.
The magnetic lineaments in E-W and NE-SW directions are more suitable as revealed
by the high yielding well at Navule.
The dip of the fault plane could be inferred. The areas in proximity of the fault in
down dip direction hold better ground water potentiality.
The contact between Granite, Gneiss and Schist is precisely delineated. The
successful well can be located near the contact preferable on Gneiss in the NE part.
The weathered and weathered-fracture zones have been delineated. The thickness of
weathered rock is roughly 20-40 m.
Precise dry and saturated weathered zone map and hydrogeologically sensitive
structural map can be prepared from the combination of HeliTEM and HeliMAG.
Lineaments are inferred by HeliMAG results.
The depth of weathering and fracture occurrences is significantly high along the
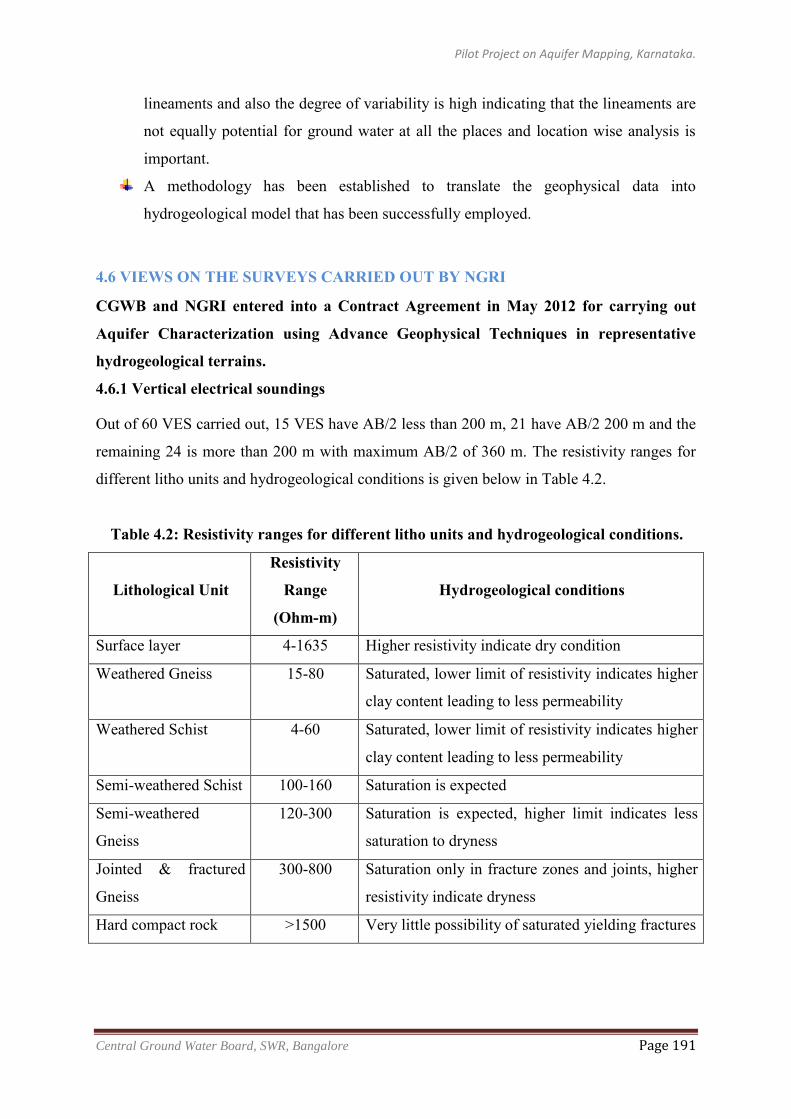
Pilot Project on Aquifer Mapping, Karnataka.
Central Ground Water Board, SWR, Bangalore Page 191
lineaments and also the degree of variability is high indicating that the lineaments are
not equally potential for ground water at all the places and location wise analysis is
important.
A methodology has been established to translate the geophysical data into
hydrogeological model that has been successfully employed.
4.6 VIEWS ON THE SURVEYS CARRIED OUT BY NGRI
CGWB and NGRI entered into a Contract Agreement in May 2012 for carrying out
Aquifer Characterization using Advance Geophysical Techniques in representative
hydrogeological terrains.
4.6.1 Vertical electrical soundings
Out of 60 VES carried out, 15 VES have AB/2 less than 200 m, 21 have AB/2 200 m and the
remaining 24 is more than 200 m with maximum AB/2 of 360 m. The resistivity ranges for
different litho units and hydrogeological conditions is given below in Table 4.2.
Table 4.2: Resistivity ranges for different litho units and hydrogeological conditions.
Lithological Unit
Resistivity
Range
(Ohm-m)
Hydrogeological conditions
Surface layer 4-1635 Higher resistivity indicate dry condition
Weathered Gneiss 15-80 Saturated, lower limit of resistivity indicates higher
clay content leading to less permeability
Weathered Schist 4-60 Saturated, lower limit of resistivity indicates higher
clay content leading to less permeability
Semi-weathered Schist 100-160 Saturation is expected
Semi-weathered
Gneiss
120-300 Saturation is expected, higher limit indicates less
saturation to dryness
Jointed & fractured
Gneiss
300-800 Saturation only in fracture zones and joints, higher
resistivity indicate dryness
Hard compact rock >1500 Very little possibility of saturated yielding fractures
Pilot Project on Aquifer Mapping, Karnataka.
Central Ground Water Board, SWR, Bangalore Page 192
It is observed that the resistivity ranges overlap for different litho units. The resistivity values
established for different litho-units have been used for deducing the hydrogeological
conditions from VES interpretation.
Comment:
i. VES results have been given only as layers. Within the compact hardrock, the resistivity is
shown as very high.
4.6.2 GTEM
GTEM were carried out at 26 locations to delineate sub-surface layer parameters and
fractures. It is found that GTEM techniques can be helpful to delineate first two layers
namely weathered and semi-weathered zones. More noise is reported after these zones and
data is not interpretable. At some of the GTEM locations, VES were also carried out for
correlation. However, the results of GTEM and VES are not very well correlated in this
hardrock area.
4.6.3 Electrical resistivity tomography (ERT)
ERT were carried out at 32 places with a total of 15.6 line km in the area. In 30 places out of
32, the depth of investigation is 91.2m or less. The depth of investigation is 115 m and 165 m
only at two locations.
Comment:
ERT surveys revealed the vertical and lateral extent of subsurface lithology, weathered zone
thickness and variation in depth to bed rock. The studies have not revealed the fractured
depths precisely and indicated only possibility of fracture zone at deeper levels.
4.6.4 SkyTEM Survey
SKYTEM surveys were carried out with a line spacing of 150 m having 171 fly lines in NE-
SW direction. Total flown line km works out to be 2909 of which 2843 line km data is
accepted for processing. The average flight speed of the helicopter was 17 m/sec with an
average flight altitude of 35 m above ground.
Findings:
The study was aimed at to infer low resistivity deeper zones associated with lineaments
(fractures) through Generalized Depth of Investigation (GDI) of HeliTEM as the ground
water levels are deep in the area. The GDI is a newly used concept as fracture zones filled
with water produced sufficiently deep inductive environment and hence, deep information are
obtained. The places over compact resistive zones without any significant fracture zone will
have shallow GDI limited to the bottom of weathered zone. The depth sensitivity of HeliTEM
Pilot Project on Aquifer Mapping, Karnataka.
Central Ground Water Board, SWR, Bangalore Page 193
in terms of GDI can be used to identify the deeper fracture zones. Once the fracture zone is
identified and demarcated laterally, the HeliTEM soundings in that zone can be further
studied to define the possible depth zone of the occurrence of fractures. It may not be
possible to identify the deeper thin fractures but, the zones where such fractures can occur
can be defined. In the present area, a significant observation is that the maximum GDI is 360
m i.e. there is a possibility of encountering conductive fracture zone upto 360 m depth.
Further, fracturing zones occurring at depths beyond 100 to 150 m can be detected if thin
fractures area significantly high yielding indicating a larger geometry and conductivity
contrast. The resistivity ranges are upto 300 Ohm.m for weathered formation, 300 to 2000
Ohm.m for fissured formation and more than 2000 Ohm.m for fresh Gneiss/Schist.
The heterogeneity and complexity are characteristics features of the hardrocks. All these
integrated geophysical surveys have expressed these complexities in term of geophysical
properties of hardrock. The SkyTEM results have indicated the general depth of occurrence
of water bearing zones.
4.6.5 GRP
The studies were carried out to pinpoint sites for exploration. At Sasalu site, the technique
has helped to identify the potential zones and VES and ERT techniques are used to confirm
the fracture depths. This has clearly illustrated the efficacy of applications of combined
geophysical techniques like GRP, VES and ERT for ground water studies.
At Adinayakanahalli site, the GRP technique indicates that, the technique is useful for
identification of deep fractures. Generally, it is concluded that GRP technique is useful to
confirm and to identify the fracture depths with the help of other techniques such as VES and
ERT. Hence, the limitation in these technique needs to be confirmed i.e., GRP alone does not
give the clear cut confirmation of presence of fracture zone.
4.6.6Efficacy of various types of geophysical surveys
The efficacy of various types of geophysical surveys carried out by NGRI is given in the
following table.
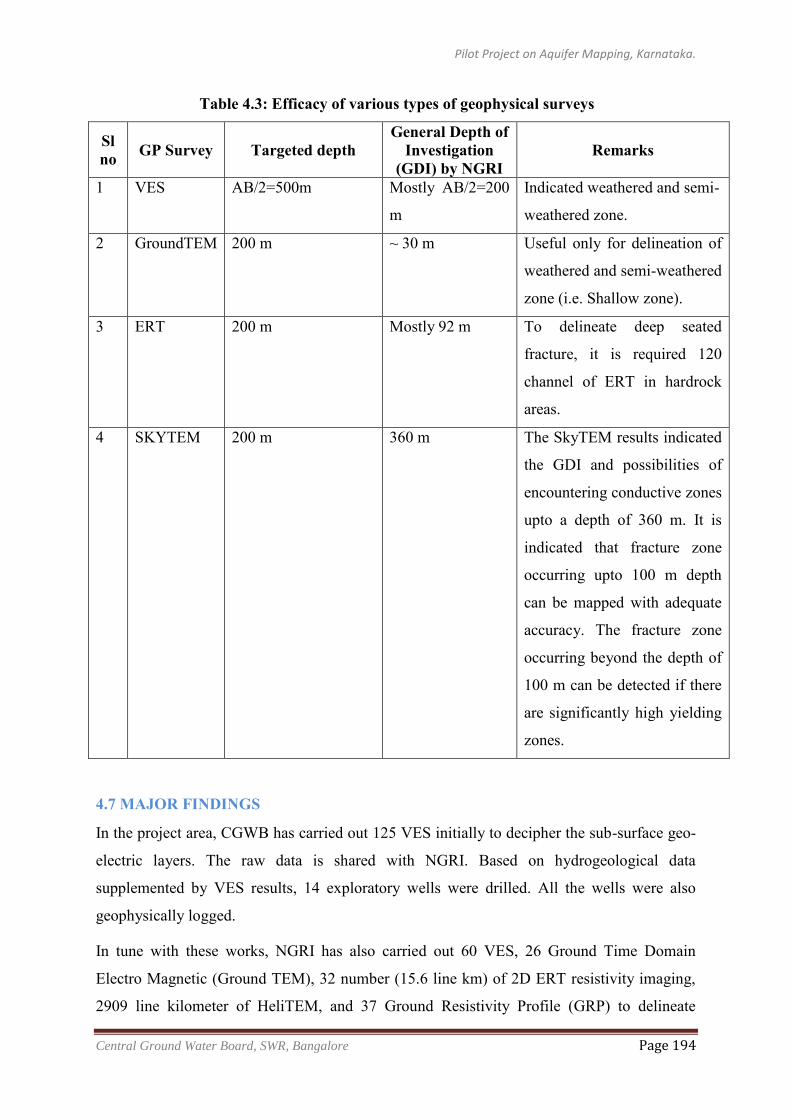
Pilot Project on Aquifer Mapping, Karnataka.
Central Ground Water Board, SWR, Bangalore Page 194
Table 4.3: Efficacy of various types of geophysical surveys
Sl no GP Survey Targeted depth
General Depth of Investigation
(GDI) by NGRI Remarks
1 VES AB/2=500m Mostly AB/2=200
m
Indicated weathered and semi-
weathered zone.
2 GroundTEM 200 m ~ 30 m Useful only for delineation of
weathered and semi-weathered
zone (i.e. Shallow zone).
3 ERT 200 m Mostly 92 m To delineate deep seated
fracture, it is required 120
channel of ERT in hardrock
areas.
4 SKYTEM 200 m 360 m The SkyTEM results indicated
the GDI and possibilities of
encountering conductive zones
upto a depth of 360 m. It is
indicated that fracture zone
occurring upto 100 m depth
can be mapped with adequate
accuracy. The fracture zone
occurring beyond the depth of
100 m can be detected if there
are significantly high yielding
zones.
4.7 MAJOR FINDINGS
In the project area, CGWB has carried out 125 VES initially to decipher the sub-surface geo-
electric layers. The raw data is shared with NGRI. Based on hydrogeological data
supplemented by VES results, 14 exploratory wells were drilled. All the wells were also
geophysically logged.
In tune with these works, NGRI has also carried out 60 VES, 26 Ground Time Domain
Electro Magnetic (Ground TEM), 32 number (15.6 line km) of 2D ERT resistivity imaging,
2909 line kilometer of HeliTEM, and 37 Ground Resistivity Profile (GRP) to delineate
Pilot Project on Aquifer Mapping, Karnataka.
Central Ground Water Board, SWR, Bangalore Page 195
weathered, fractured and depth to basement (massive formation). Studies revealed that deep
fractures play a major role for occurrence of ground water in thin hardrock terrain. Initially,
NGRI made an attempt to delineate fractures using integrated ground water geophysical
techniques like VES, ERT, GTEM and GRP. From the results, it is observed that GRP
technique could be useful for the qualitative delineation of fractures and their orientation
whereas, VES and ERT can be helpful in deciphering both the weathered zone and fracture
depth. Based on the results of GRP, VES and ERT surveys the following information has
been obtained;
The GRP surveys with close spacing could help in identifying the orientation of the
conductive formations. This technique will work effectively at lineament sites. The
GRP lows are observed as fractures and these fractures are confirmed by the drilling
borehole at Sasalu village.
The VES also picked up fractures at GRP lows (i.e., at Sasalu village and few nearby
CGWB wells) whereas, the ERT has given idea about the lithology. Further, the VES
with close spacing is a good technique to detect thin fractures in granitic area.
The GRP supplemented with VES technique forms the key in the hardrock terrain for
the delineation of water bearing fractures.
Comments:
The combination of heliborne magnetic and electro-magnetic surveys employed in pilot
project area have helped in deciphering weathered and semi-weathered zones which are
restricted to shallow depths (up to 60 m bgl). Further, it is indicated that, thin structures could
neither be picked up through satellite imageries nor through surface mapping. However, these
signatures are newly traced ones as per the interpretation and need to be checked and
validated in field. Specific depth of occurrence of fractures is also not indicated and only
relative and general description of sub-surface conditions is interpreted. The general depth of
investigation (GDI) by SkyTEM is upto 360 m bgl. The fracture zones occurring beyond the
depth of 100 m bgl can only be detected if the fracture zones are high yielding. Further, the
sites recommended based upon the SkyTEM results also need to be tested by drilling to prove
the applicability of SkyTEM technique in hardrock terrain.
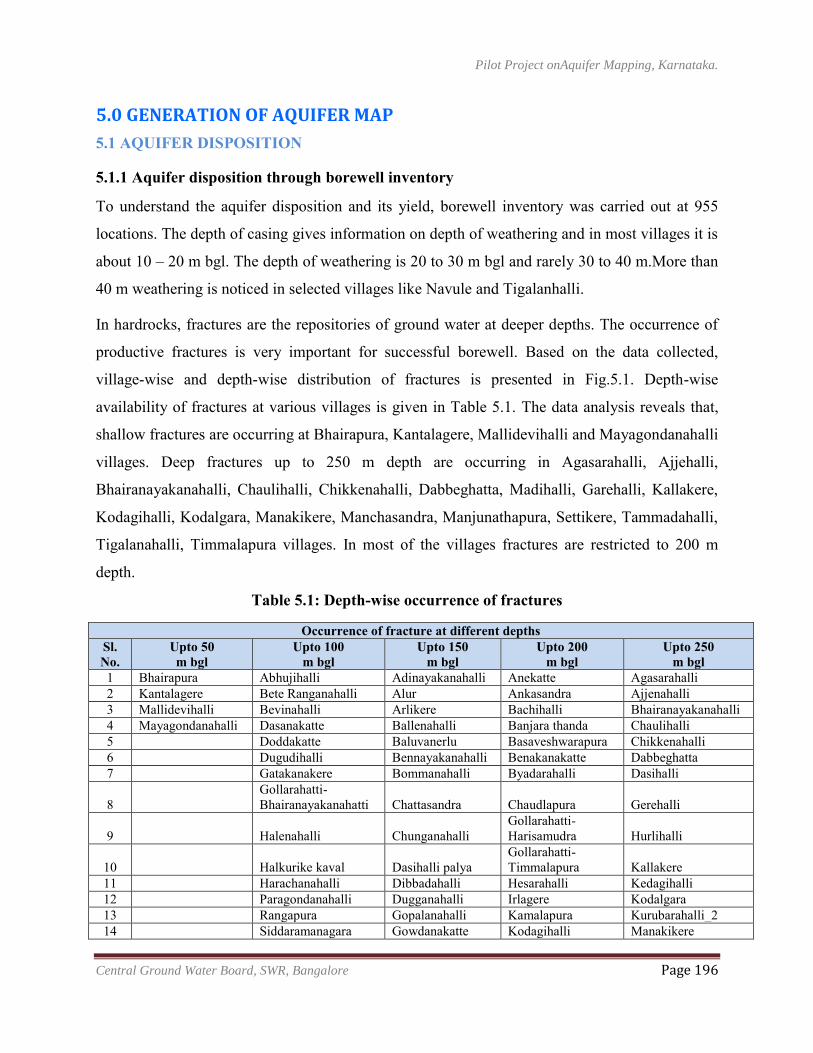
Pilot Project onAquifer Mapping, Karnataka.
Central Ground Water Board, SWR, Bangalore Page 196
5.0 GENERATION OF AQUIFER MAP
5.1 AQUIFER DISPOSITION
5.1.1 Aquifer disposition through borewell inventory
To understand the aquifer disposition and its yield, borewell inventory was carried out at 955
locations. The depth of casing gives information on depth of weathering and in most villages it is
about 10 – 20 m bgl. The depth of weathering is 20 to 30 m bgl and rarely 30 to 40 m.More than
40 m weathering is noticed in selected villages like Navule and Tigalanhalli.
In hardrocks, fractures are the repositories of ground water at deeper depths. The occurrence of
productive fractures is very important for successful borewell. Based on the data collected,
village-wise and depth-wise distribution of fractures is presented in Fig.5.1. Depth-wise
availability of fractures at various villages is given in Table 5.1. The data analysis reveals that,
shallow fractures are occurring at Bhairapura, Kantalagere, Mallidevihalli and Mayagondanahalli
villages. Deep fractures up to 250 m depth are occurring in Agasarahalli, Ajjehalli,
Bhairanayakanahalli, Chaulihalli, Chikkenahalli, Dabbeghatta, Madihalli, Garehalli, Kallakere,
Kodagihalli, Kodalgara, Manakikere, Manchasandra, Manjunathapura, Settikere, Tammadahalli,
Tigalanahalli, Timmalapura villages. In most of the villages fractures are restricted to 200 m
depth.
Table 5.1: Depth-wise occurrence of fractures
Occurrence of fracture at different depths Sl. No.
Upto 50 m bgl
Upto 100 m bgl
Upto 150 m bgl
Upto 200 m bgl
Upto 250 m bgl
1 Bhairapura Abhujihalli Adinayakanahalli Anekatte Agasarahalli 2 Kantalagere Bete Ranganahalli Alur Ankasandra Ajjenahalli 3 Mallidevihalli Bevinahalli Arlikere Bachihalli Bhairanayakanahalli 4 Mayagondanahalli Dasanakatte Ballenahalli Banjara thanda Chaulihalli 5
Doddakatte Baluvanerlu Basaveshwarapura Chikkenahalli
6
Dugudihalli Bennayakanahalli Benakanakatte Dabbeghatta 7
Gatakanakere Bommanahalli Byadarahalli Dasihalli
8
Gollarahatti- Bhairanayakanahatti Chattasandra Chaudlapura Gerehalli
9
Halenahalli Chunganahalli Gollarahatti- Harisamudra Hurlihalli
10
Halkurike kaval Dasihalli palya Gollarahatti- Timmalapura Kallakere
11
Harachanahalli Dibbadahalli Hesarahalli Kedagihalli 12
Paragondanahalli Dugganahalli Irlagere Kodalgara
13
Rangapura Gopalanahalli Kamalapura Kurubarahalli_2 14
Siddaramanagara Gowdanakatte Kodagihalli Manakikere
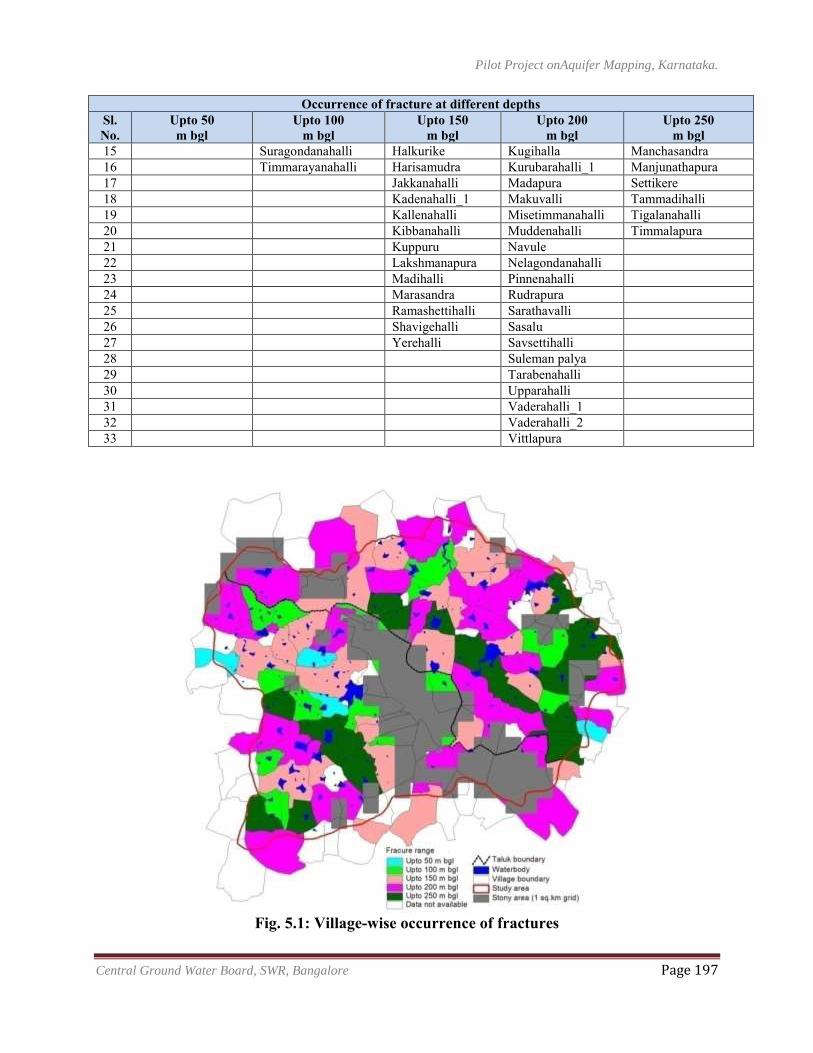
Pilot Project onAquifer Mapping, Karnataka.
Central Ground Water Board, SWR, Bangalore Page 197
Occurrence of fracture at different depths Sl. No.
Upto 50 m bgl
Upto 100 m bgl
Upto 150 m bgl
Upto 200 m bgl
Upto 250 m bgl
15
Suragondanahalli Halkurike Kugihalla Manchasandra 16
Timmarayanahalli Harisamudra Kurubarahalli_1 Manjunathapura
17
Jakkanahalli Madapura Settikere 18
Kadenahalli_1 Makuvalli Tammadihalli
19
Kallenahalli Misetimmanahalli Tigalanahalli 20
Kibbanahalli Muddenahalli Timmalapura
21
Kuppuru Navule 22
Lakshmanapura Nelagondanahalli
23
Madihalli Pinnenahalli 24
Marasandra Rudrapura
25
Ramashettihalli Sarathavalli 26
Shavigehalli Sasalu
27
Yerehalli Savsettihalli 28
Suleman palya
29
Tarabenahalli 30
Upparahalli
31
Vaderahalli_1 32
Vaderahalli_2
33
Vittlapura
Fig. 5.1: Village-wise occurrence of fractures
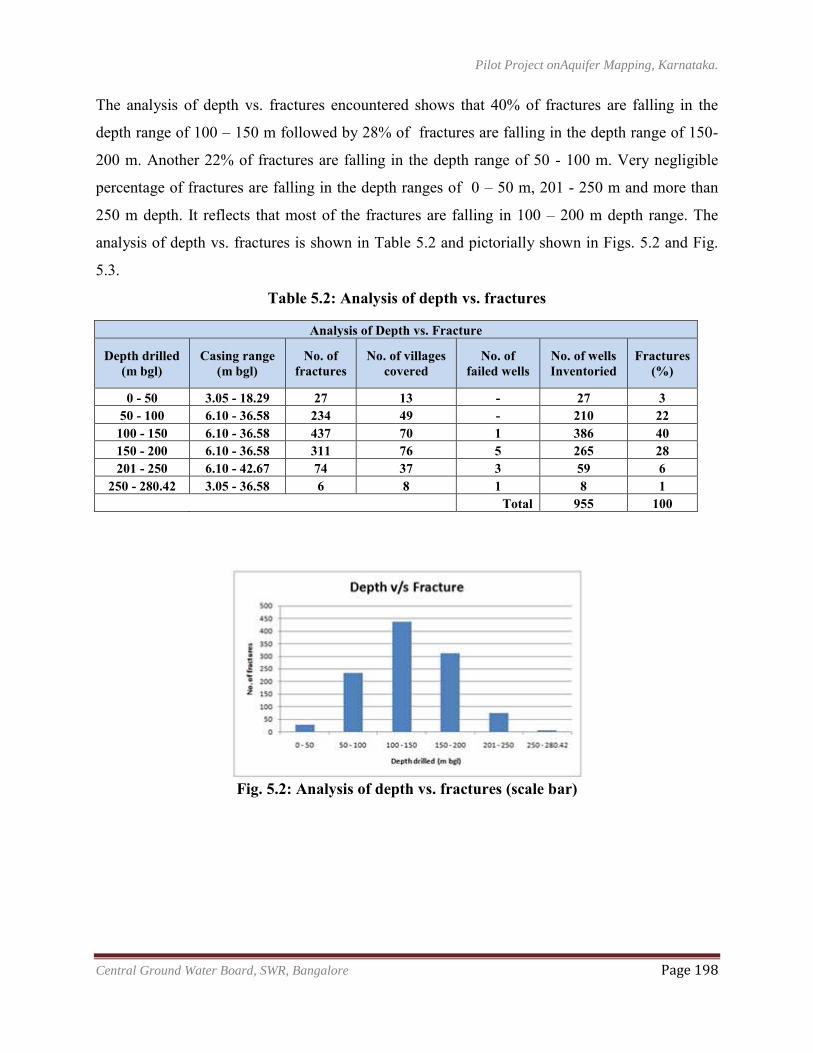
Pilot Project onAquifer Mapping, Karnataka.
Central Ground Water Board, SWR, Bangalore Page 198
The analysis of depth vs. fractures encountered shows that 40% of fractures are falling in the
depth range of 100 – 150 m followed by 28% of fractures are falling in the depth range of 150-
200 m. Another 22% of fractures are falling in the depth range of 50 - 100 m. Very negligible
percentage of fractures are falling in the depth ranges of 0 – 50 m, 201 - 250 m and more than
250 m depth. It reflects that most of the fractures are falling in 100 – 200 m depth range. The
analysis of depth vs. fractures is shown in Table 5.2 and pictorially shown in Figs. 5.2 and Fig.
5.3.
Table 5.2: Analysis of depth vs. fractures
Analysis of Depth vs. Fracture
Depth drilled (m bgl)
Casing range (m bgl)
No. of fractures
No. of villages covered
No. of failed wells
No. of wells Inventoried
Fractures (%)
0 - 50 3.05 - 18.29 27 13 - 27 3 50 - 100 6.10 - 36.58 234 49 - 210 22
100 - 150 6.10 - 36.58 437 70 1 386 40 150 - 200 6.10 - 36.58 311 76 5 265 28 201 - 250 6.10 - 42.67 74 37 3 59 6
250 - 280.42 3.05 - 36.58 6 8 1 8 1
Total 955 100
Fig. 5.2: Analysis of depth vs. fractures (scale bar)
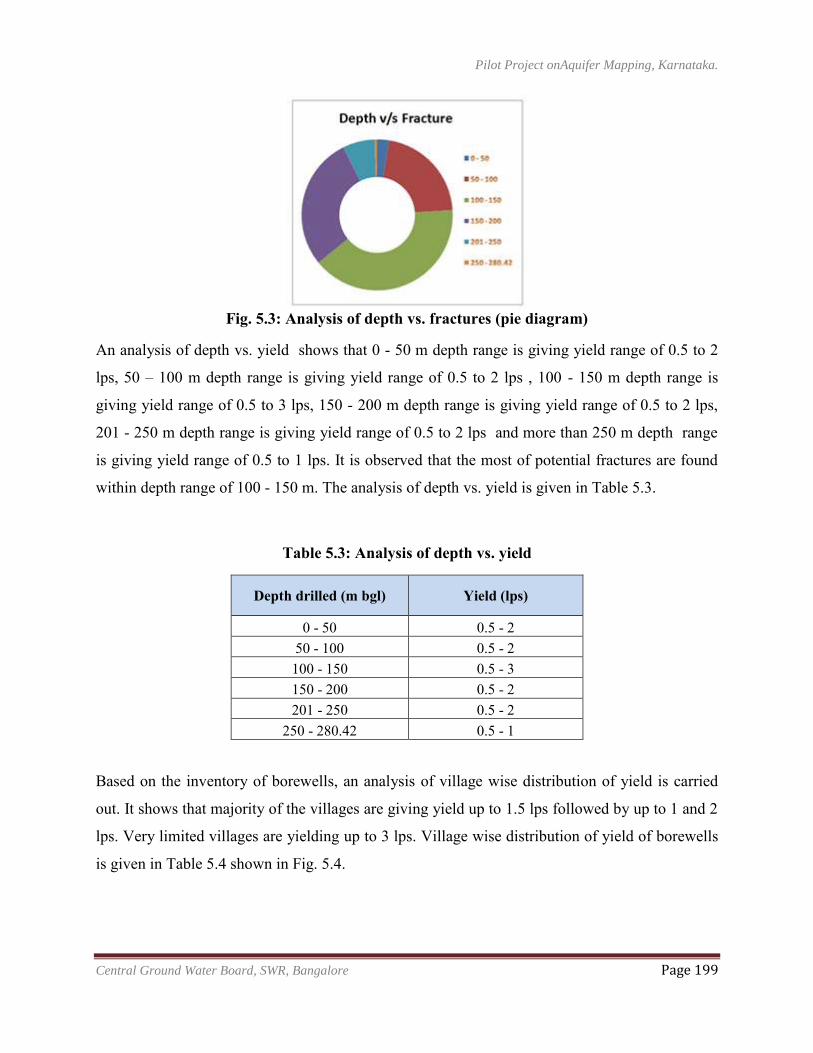
Pilot Project onAquifer Mapping, Karnataka.
Central Ground Water Board, SWR, Bangalore Page 199
Fig. 5.3: Analysis of depth vs. fractures (pie diagram)
An analysis of depth vs. yield shows that 0 - 50 m depth range is giving yield range of 0.5 to 2
lps, 50 – 100 m depth range is giving yield range of 0.5 to 2 lps , 100 - 150 m depth range is
giving yield range of 0.5 to 3 lps, 150 - 200 m depth range is giving yield range of 0.5 to 2 lps,
201 - 250 m depth range is giving yield range of 0.5 to 2 lps and more than 250 m depth range
is giving yield range of 0.5 to 1 lps. It is observed that the most of potential fractures are found
within depth range of 100 - 150 m. The analysis of depth vs. yield is given in Table 5.3.
Table 5.3: Analysis of depth vs. yield
Depth drilled (m bgl) Yield (lps)
0 - 50 0.5 - 2 50 - 100 0.5 - 2 100 - 150 0.5 - 3 150 - 200 0.5 - 2 201 - 250 0.5 - 2
250 - 280.42 0.5 - 1
Based on the inventory of borewells, an analysis of village wise distribution of yield is carried
out. It shows that majority of the villages are giving yield up to 1.5 lps followed by up to 1 and 2
lps. Very limited villages are yielding up to 3 lps. Village wise distribution of yield of borewells
is given in Table 5.4 shown in Fig. 5.4.
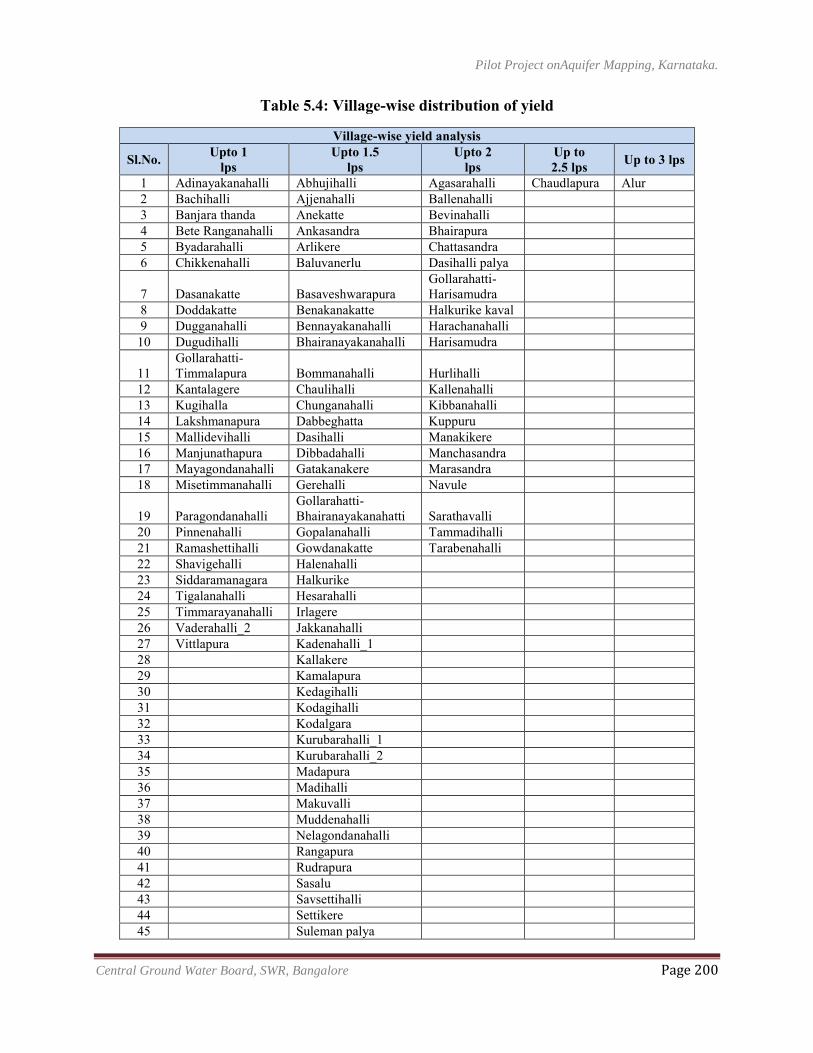
Pilot Project onAquifer Mapping, Karnataka.
Central Ground Water Board, SWR, Bangalore Page 200
Table 5.4: Village-wise distribution of yield
Village-wise yield analysis
Sl.No. Upto 1 lps
Upto 1.5 lps
Upto 2 lps
Up to 2.5 lps Up to 3 lps
1 Adinayakanahalli Abhujihalli Agasarahalli Chaudlapura Alur 2 Bachihalli Ajjenahalli Ballenahalli
3 Banjara thanda Anekatte Bevinahalli 4 Bete Ranganahalli Ankasandra Bhairapura 5 Byadarahalli Arlikere Chattasandra 6 Chikkenahalli Baluvanerlu Dasihalli palya
7 Dasanakatte Basaveshwarapura Gollarahatti- Harisamudra
8 Doddakatte Benakanakatte Halkurike kaval 9 Dugganahalli Bennayakanahalli Harachanahalli 10 Dugudihalli Bhairanayakanahalli Harisamudra
11 Gollarahatti- Timmalapura Bommanahalli Hurlihalli
12 Kantalagere Chaulihalli Kallenahalli 13 Kugihalla Chunganahalli Kibbanahalli 14 Lakshmanapura Dabbeghatta Kuppuru 15 Mallidevihalli Dasihalli Manakikere 16 Manjunathapura Dibbadahalli Manchasandra 17 Mayagondanahalli Gatakanakere Marasandra 18 Misetimmanahalli Gerehalli Navule
19 Paragondanahalli Gollarahatti- Bhairanayakanahatti Sarathavalli
20 Pinnenahalli Gopalanahalli Tammadihalli 21 Ramashettihalli Gowdanakatte Tarabenahalli 22 Shavigehalli Halenahalli
23 Siddaramanagara Halkurike 24 Tigalanahalli Hesarahalli 25 Timmarayanahalli Irlagere 26 Vaderahalli_2 Jakkanahalli 27 Vittlapura Kadenahalli_1 28
Kallakere
29
Kamalapura 30
Kedagihalli
31
Kodagihalli 32
Kodalgara
33
Kurubarahalli_1 34
Kurubarahalli_2
35
Madapura 36
Madihalli
37
Makuvalli 38
Muddenahalli
39
Nelagondanahalli 40
Rangapura
41
Rudrapura 42
Sasalu
43
Savsettihalli 44
Settikere
45
Suleman palya
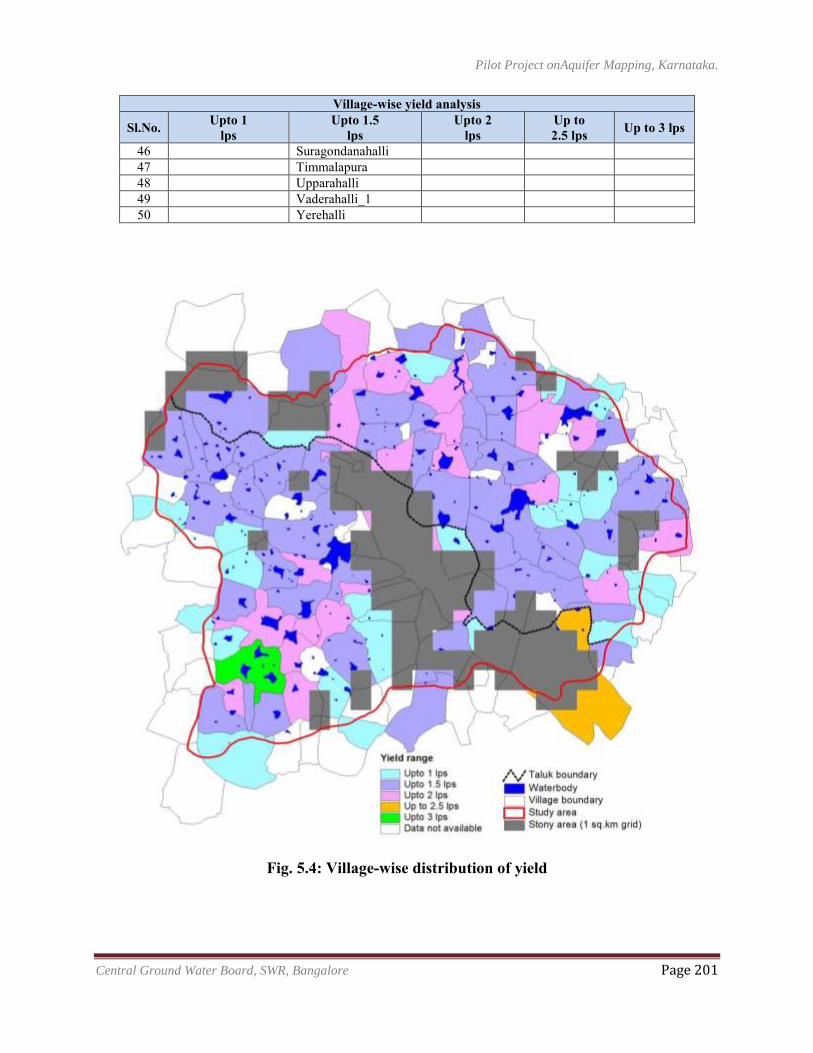
Pilot Project onAquifer Mapping, Karnataka.
Central Ground Water Board, SWR, Bangalore Page 201
Village-wise yield analysis
Sl.No. Upto 1 lps
Upto 1.5 lps
Upto 2 lps
Up to 2.5 lps Up to 3 lps
46
Suragondanahalli 47
Timmalapura
48
Upparahalli 49
Vaderahalli_1
50
Yerehalli
Fig. 5.4: Village-wise distribution of yield
Pilot Project onAquifer Mapping, Karnataka.
Central Ground Water Board, SWR, Bangalore Page 202
An analysis is also done for aquifer-wise distribution of inventoried borewells. It shows that out
of 955 wellsinventoried, 858 (90%) wells are in Gneisses, followed by 95 (10%) in Schist and
only two wells in Granite formation.
Conclusions
The depth of weathering in general is 10 – 20 m only and lesser in granitic formation.
Most of the fractures are encountered between 100 – 200 m bgl.
In most villages, the average yield varies between 1 and 2 lps.
High yielding wells are noticed in Gneissic formation.
Fractures encountered up to maximum depth in Gneisses.
Note: It is observed that most of the farmers are not lowering the casing pipe up to massive
formation. Hence, the thickness of weathering is higher than the length of casing lowered.
5.1.2 Aquifer disposition based on exploratory wells through ROCKWORKS software
The geotechnical software, ROCKWORKS15 was utilized for the analysis of the 21 exploratory
wells drilled under VRBP, outsourced wells drilled during AAP 2004-05 and during AAP 2013-
14 under pilot project on aquifer mapping. The software requires basic details of exploratory
wells like coordinates, elevation, total depth drilled and casing length lowered. Then depth-wise
lithology data, stratigraphy data, fracture depth, drilling discharge, etc., for each exploratory well
is given. The format of database required for the software is given in Table 5.5 to 5.9. Then the
data base is to be imported into Rockworks software (Fig. 5.5). The software gives outputs viz.
Distribution of exploratory wells (Fig. 5.6), general topography based on elevation (Fig 5.7), 2D
single well strip log data for each well, 2D multi-well strip log data of wells, 3D multi-well strip
log data of wells, 3D lithology models, volumes of individual lithology masses, lithology
profiles, lithology cross-sections, fence diagrams, discharge data models and fracture data
models through interpolation technique.
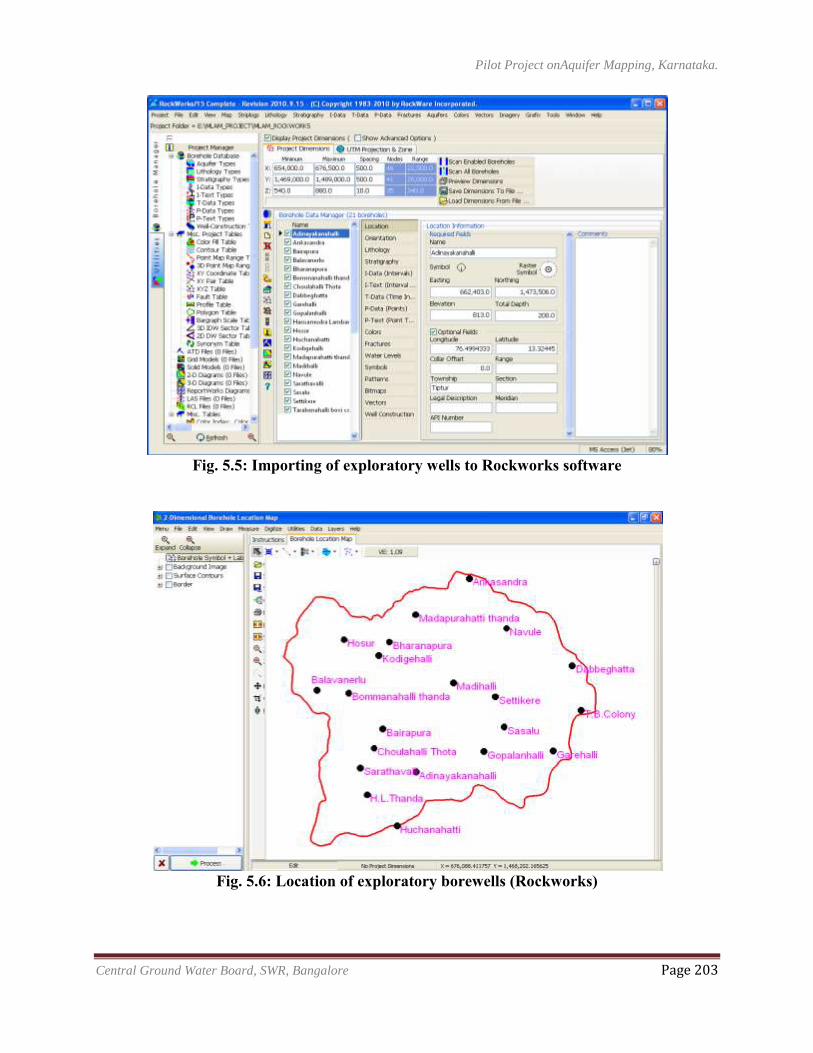
Pilot Project onAquifer Mapping, Karnataka.
Central Ground Water Board, SWR, Bangalore Page 203
Fig. 5.5: Importing of exploratory wells to Rockworks software
Fig. 5.6: Location of exploratory borewells (Rockworks)
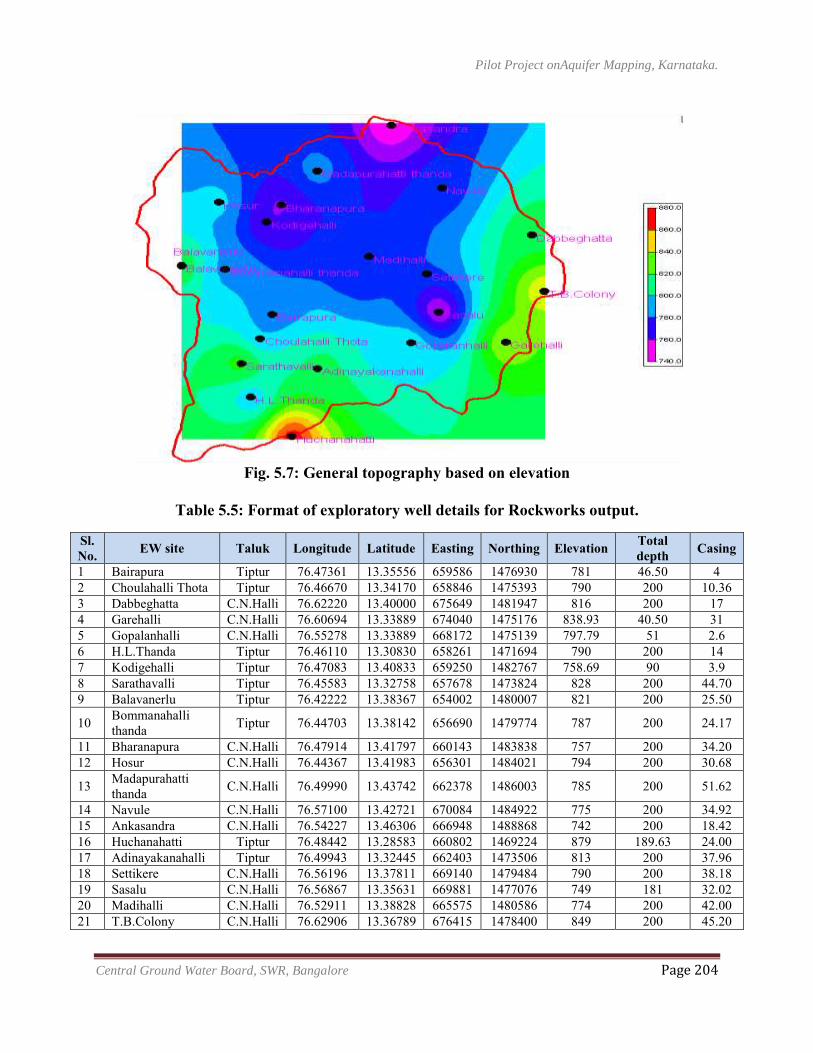
Pilot Project onAquifer Mapping, Karnataka.
Central Ground Water Board, SWR, Bangalore Page 204
Fig. 5.7: General topography based on elevation
Table 5.5: Format of exploratory well details for Rockworks output.
Sl. No. EW site Taluk Longitude Latitude Easting Northing Elevation Total
depth Casing
1 Bairapura Tiptur 76.47361 13.35556 659586 1476930 781 46.50 4 2 Choulahalli Thota Tiptur 76.46670 13.34170 658846 1475393 790 200 10.36 3 Dabbeghatta C.N.Halli 76.62220 13.40000 675649 1481947 816 200 17 4 Garehalli C.N.Halli 76.60694 13.33889 674040 1475176 838.93 40.50 31 5 Gopalanhalli C.N.Halli 76.55278 13.33889 668172 1475139 797.79 51 2.6 6 H.L.Thanda Tiptur 76.46110 13.30830 658261 1471694 790 200 14 7 Kodigehalli Tiptur 76.47083 13.40833 659250 1482767 758.69 90 3.9 8 Sarathavalli Tiptur 76.45583 13.32758 657678 1473824 828 200 44.70 9 Balavanerlu Tiptur 76.42222 13.38367 654002 1480007 821 200 25.50
10 Bommanahalli thanda Tiptur 76.44703 13.38142 656690 1479774 787 200 24.17
11 Bharanapura C.N.Halli 76.47914 13.41797 660143 1483838 757 200 34.20 12 Hosur C.N.Halli 76.44367 13.41983 656301 1484021 794 200 30.68
13 Madapurahatti thanda C.N.Halli 76.49990 13.43742 662378 1486003 785 200 51.62
14 Navule C.N.Halli 76.57100 13.42721 670084 1484922 775 200 34.92 15 Ankasandra C.N.Halli 76.54227 13.46306 666948 1488868 742 200 18.42 16 Huchanahatti Tiptur 76.48442 13.28583 660802 1469224 879 189.63 24.00 17 Adinayakanahalli Tiptur 76.49943 13.32445 662403 1473506 813 200 37.96 18 Settikere C.N.Halli 76.56196 13.37811 669140 1479484 790 200 38.18 19 Sasalu C.N.Halli 76.56867 13.35631 669881 1477076 749 181 32.02 20 Madihalli C.N.Halli 76.52911 13.38828 665575 1480586 774 200 42.00 21 T.B.Colony C.N.Halli 76.62906 13.36789 676415 1478400 849 200 45.20
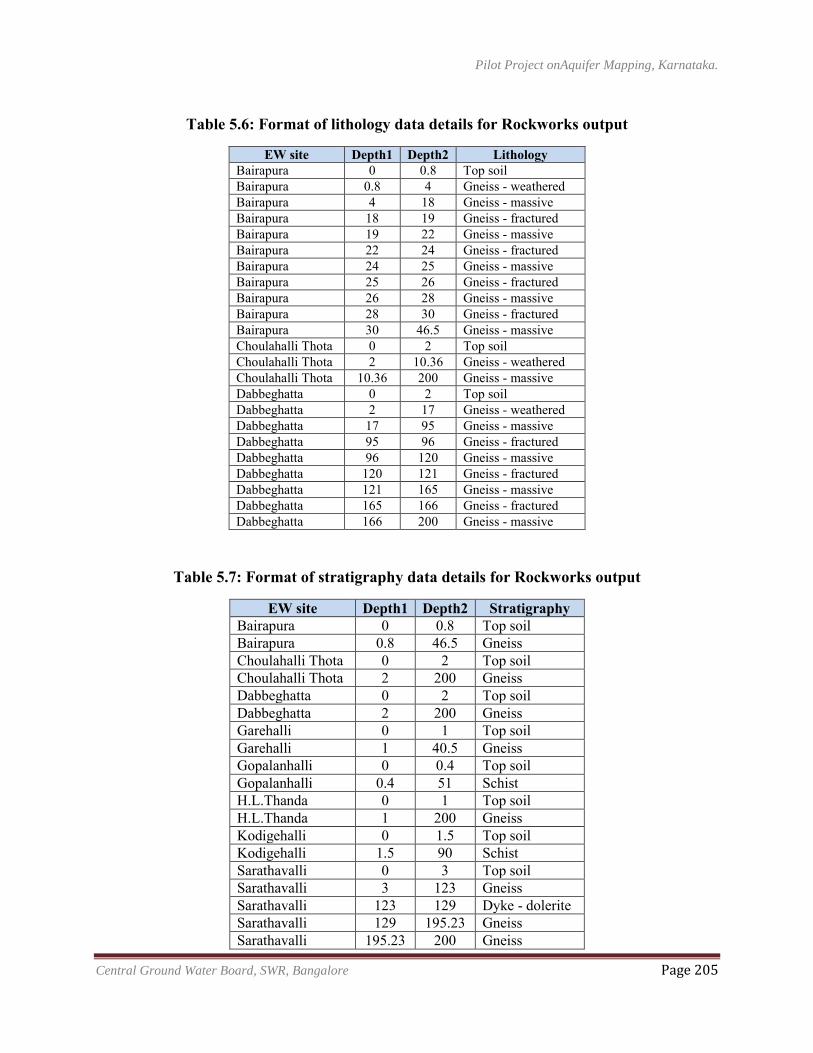
Pilot Project onAquifer Mapping, Karnataka.
Central Ground Water Board, SWR, Bangalore Page 205
Table 5.6: Format of lithology data details for Rockworks output
EW site Depth1 Depth2 Lithology Bairapura 0 0.8 Top soil Bairapura 0.8 4 Gneiss - weathered Bairapura 4 18 Gneiss - massive Bairapura 18 19 Gneiss - fractured Bairapura 19 22 Gneiss - massive Bairapura 22 24 Gneiss - fractured Bairapura 24 25 Gneiss - massive Bairapura 25 26 Gneiss - fractured Bairapura 26 28 Gneiss - massive Bairapura 28 30 Gneiss - fractured Bairapura 30 46.5 Gneiss - massive Choulahalli Thota 0 2 Top soil Choulahalli Thota 2 10.36 Gneiss - weathered Choulahalli Thota 10.36 200 Gneiss - massive Dabbeghatta 0 2 Top soil Dabbeghatta 2 17 Gneiss - weathered Dabbeghatta 17 95 Gneiss - massive Dabbeghatta 95 96 Gneiss - fractured Dabbeghatta 96 120 Gneiss - massive Dabbeghatta 120 121 Gneiss - fractured Dabbeghatta 121 165 Gneiss - massive Dabbeghatta 165 166 Gneiss - fractured Dabbeghatta 166 200 Gneiss - massive
Table 5.7: Format of stratigraphy data details for Rockworks output
EW site Depth1 Depth2 Stratigraphy Bairapura 0 0.8 Top soil Bairapura 0.8 46.5 Gneiss Choulahalli Thota 0 2 Top soil Choulahalli Thota 2 200 Gneiss Dabbeghatta 0 2 Top soil Dabbeghatta 2 200 Gneiss Garehalli 0 1 Top soil Garehalli 1 40.5 Gneiss Gopalanhalli 0 0.4 Top soil Gopalanhalli 0.4 51 Schist H.L.Thanda 0 1 Top soil H.L.Thanda 1 200 Gneiss Kodigehalli 0 1.5 Top soil Kodigehalli 1.5 90 Schist Sarathavalli 0 3 Top soil Sarathavalli 3 123 Gneiss Sarathavalli 123 129 Dyke - dolerite Sarathavalli 129 195.23 Gneiss Sarathavalli 195.23 200 Gneiss
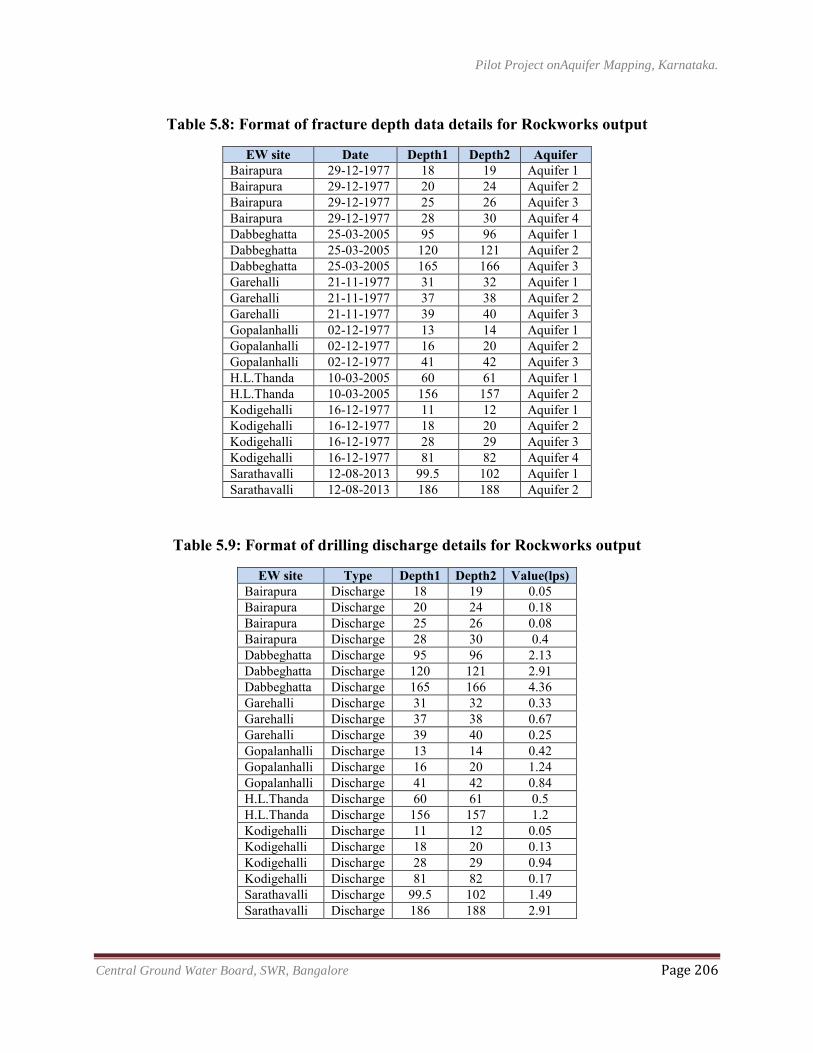
Pilot Project onAquifer Mapping, Karnataka.
Central Ground Water Board, SWR, Bangalore Page 206
Table 5.8: Format of fracture depth data details for Rockworks output
EW site Date Depth1 Depth2 Aquifer Bairapura 29-12-1977 18 19 Aquifer 1 Bairapura 29-12-1977 20 24 Aquifer 2 Bairapura 29-12-1977 25 26 Aquifer 3 Bairapura 29-12-1977 28 30 Aquifer 4 Dabbeghatta 25-03-2005 95 96 Aquifer 1 Dabbeghatta 25-03-2005 120 121 Aquifer 2 Dabbeghatta 25-03-2005 165 166 Aquifer 3 Garehalli 21-11-1977 31 32 Aquifer 1 Garehalli 21-11-1977 37 38 Aquifer 2 Garehalli 21-11-1977 39 40 Aquifer 3 Gopalanhalli 02-12-1977 13 14 Aquifer 1 Gopalanhalli 02-12-1977 16 20 Aquifer 2 Gopalanhalli 02-12-1977 41 42 Aquifer 3 H.L.Thanda 10-03-2005 60 61 Aquifer 1 H.L.Thanda 10-03-2005 156 157 Aquifer 2 Kodigehalli 16-12-1977 11 12 Aquifer 1 Kodigehalli 16-12-1977 18 20 Aquifer 2 Kodigehalli 16-12-1977 28 29 Aquifer 3 Kodigehalli 16-12-1977 81 82 Aquifer 4 Sarathavalli 12-08-2013 99.5 102 Aquifer 1 Sarathavalli 12-08-2013 186 188 Aquifer 2
Table 5.9: Format of drilling discharge details for Rockworks output
EW site Type Depth1 Depth2 Value(lps) Bairapura Discharge 18 19 0.05 Bairapura Discharge 20 24 0.18 Bairapura Discharge 25 26 0.08 Bairapura Discharge 28 30 0.4 Dabbeghatta Discharge 95 96 2.13 Dabbeghatta Discharge 120 121 2.91 Dabbeghatta Discharge 165 166 4.36 Garehalli Discharge 31 32 0.33 Garehalli Discharge 37 38 0.67 Garehalli Discharge 39 40 0.25 Gopalanhalli Discharge 13 14 0.42 Gopalanhalli Discharge 16 20 1.24 Gopalanhalli Discharge 41 42 0.84 H.L.Thanda Discharge 60 61 0.5 H.L.Thanda Discharge 156 157 1.2 Kodigehalli Discharge 11 12 0.05 Kodigehalli Discharge 18 20 0.13 Kodigehalli Discharge 28 29 0.94 Kodigehalli Discharge 81 82 0.17 Sarathavalli Discharge 99.5 102 1.49 Sarathavalli Discharge 186 188 2.91
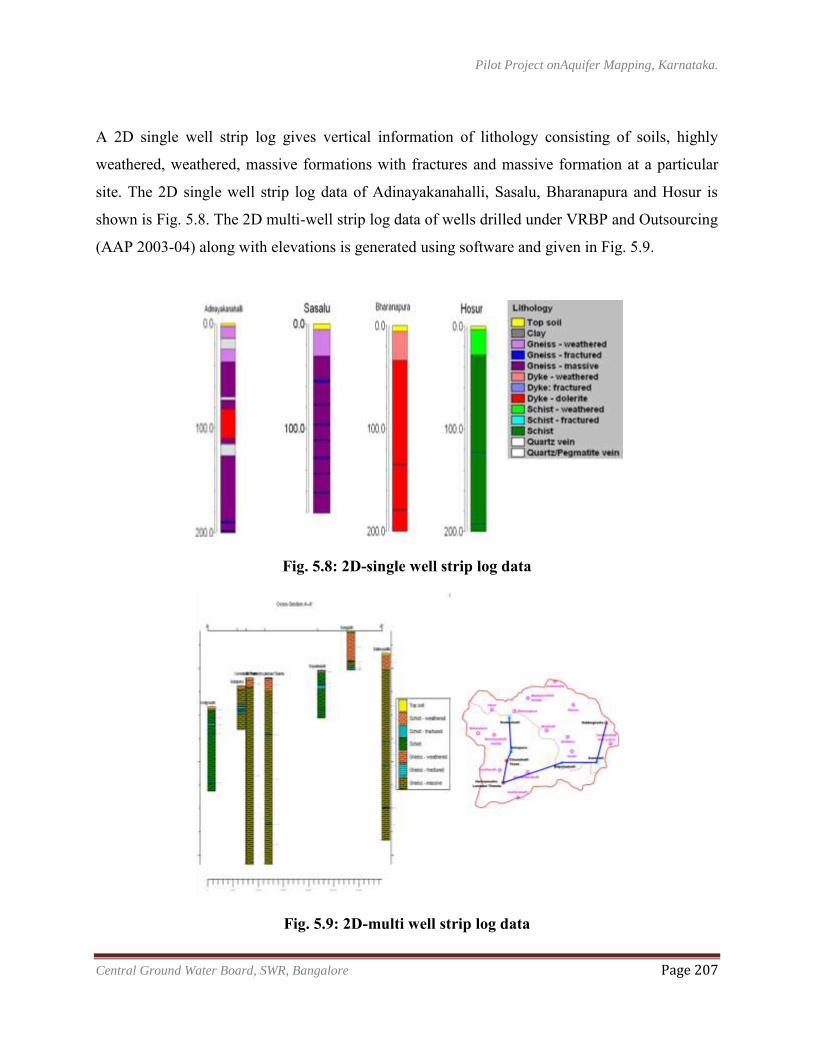
Pilot Project onAquifer Mapping, Karnataka.
Central Ground Water Board, SWR, Bangalore Page 207
A 2D single well strip log gives vertical information of lithology consisting of soils, highly
weathered, weathered, massive formations with fractures and massive formation at a particular
site. The 2D single well strip log data of Adinayakanahalli, Sasalu, Bharanapura and Hosur is
shown is Fig. 5.8. The 2D multi-well strip log data of wells drilled under VRBP and Outsourcing
(AAP 2003-04) along with elevations is generated using software and given in Fig. 5.9.
Fig. 5.8: 2D-single well strip log data
Fig. 5.9: 2D-multi well strip log data
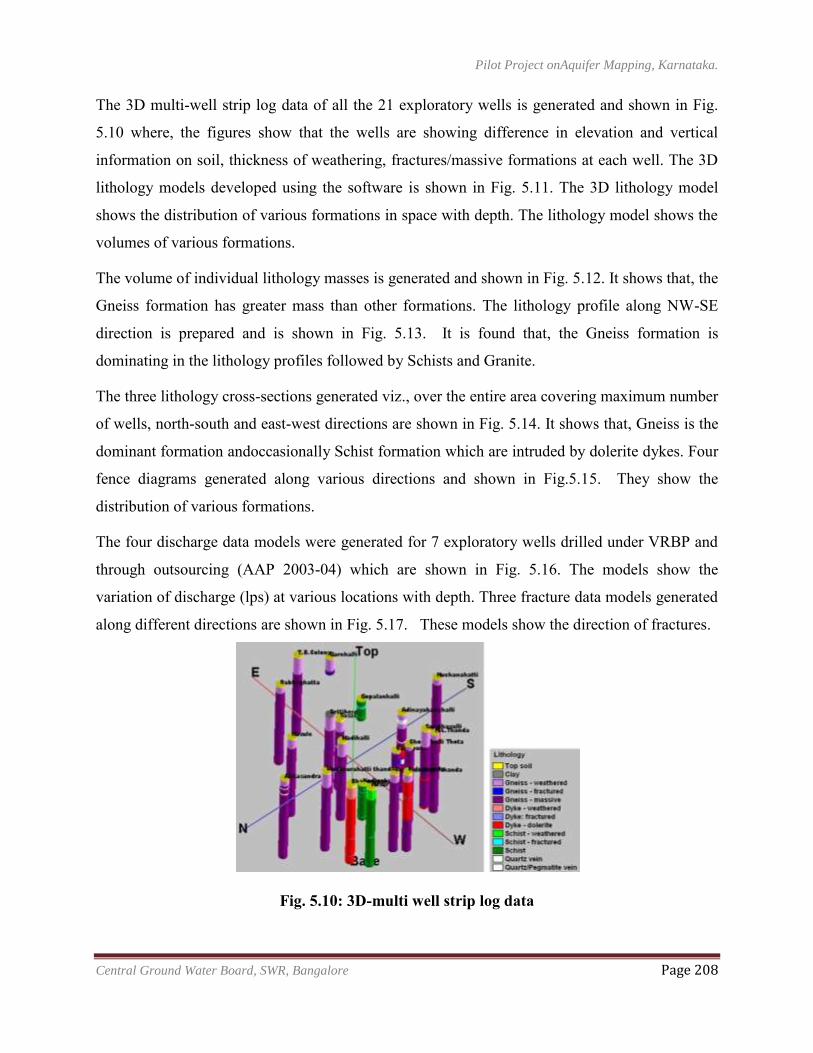
Pilot Project onAquifer Mapping, Karnataka.
Central Ground Water Board, SWR, Bangalore Page 208
The 3D multi-well strip log data of all the 21 exploratory wells is generated and shown in Fig.
5.10 where, the figures show that the wells are showing difference in elevation and vertical
information on soil, thickness of weathering, fractures/massive formations at each well. The 3D
lithology models developed using the software is shown in Fig. 5.11. The 3D lithology model
shows the distribution of various formations in space with depth. The lithology model shows the
volumes of various formations.
The volume of individual lithology masses is generated and shown in Fig. 5.12. It shows that, the
Gneiss formation has greater mass than other formations. The lithology profile along NW-SE
direction is prepared and is shown in Fig. 5.13. It is found that, the Gneiss formation is
dominating in the lithology profiles followed by Schists and Granite.
The three lithology cross-sections generated viz., over the entire area covering maximum number
of wells, north-south and east-west directions are shown in Fig. 5.14. It shows that, Gneiss is the
dominant formation andoccasionally Schist formation which are intruded by dolerite dykes. Four
fence diagrams generated along various directions and shown in Fig.5.15. They show the
distribution of various formations.
The four discharge data models were generated for 7 exploratory wells drilled under VRBP and
through outsourcing (AAP 2003-04) which are shown in Fig. 5.16. The models show the
variation of discharge (lps) at various locations with depth. Three fracture data models generated
along different directions are shown in Fig. 5.17. These models show the direction of fractures.
Fig. 5.10: 3D-multi well strip log data
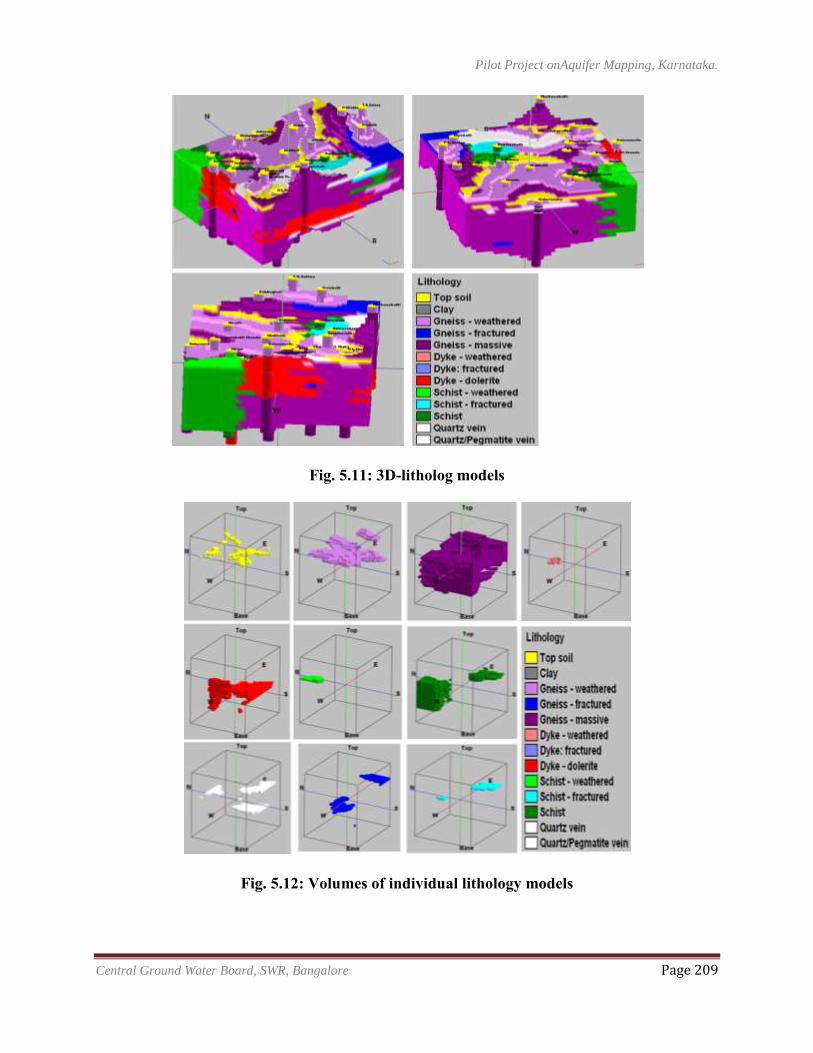
Pilot Project onAquifer Mapping, Karnataka.
Central Ground Water Board, SWR, Bangalore Page 209
Fig. 5.11: 3D-litholog models
Fig. 5.12: Volumes of individual lithology models
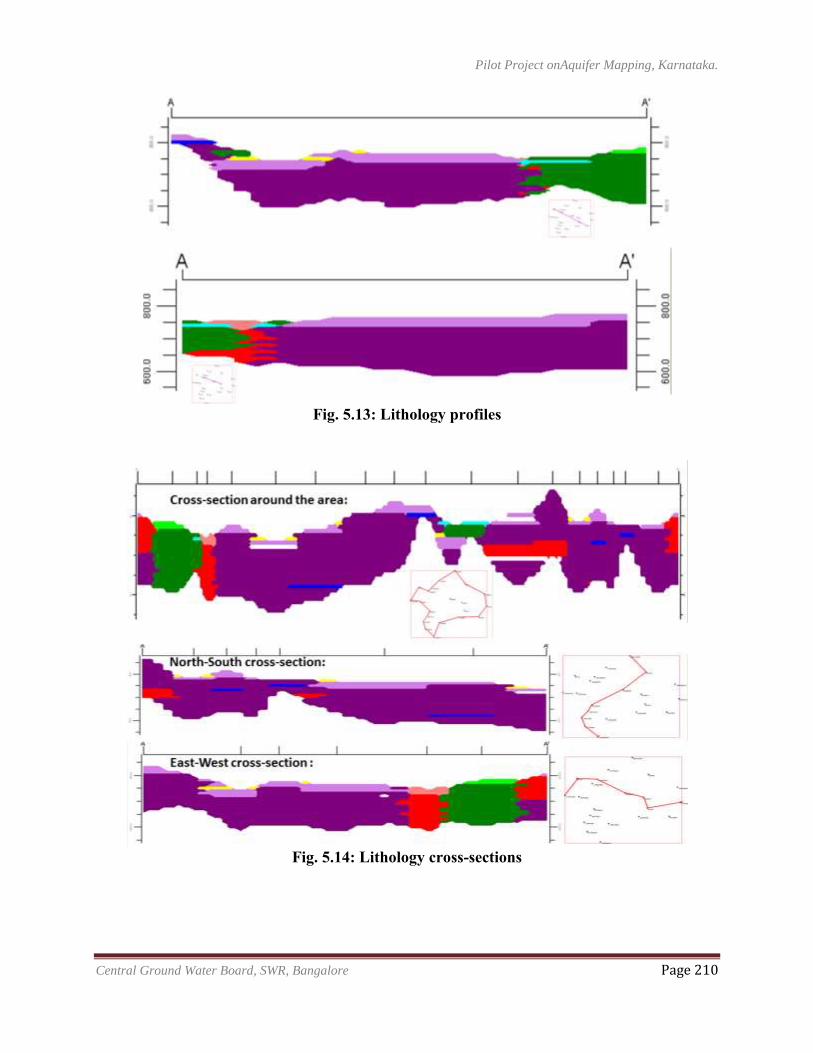
Pilot Project onAquifer Mapping, Karnataka.
Central Ground Water Board, SWR, Bangalore Page 210
Fig. 5.13: Lithology profiles
Fig. 5.14: Lithology cross-sections
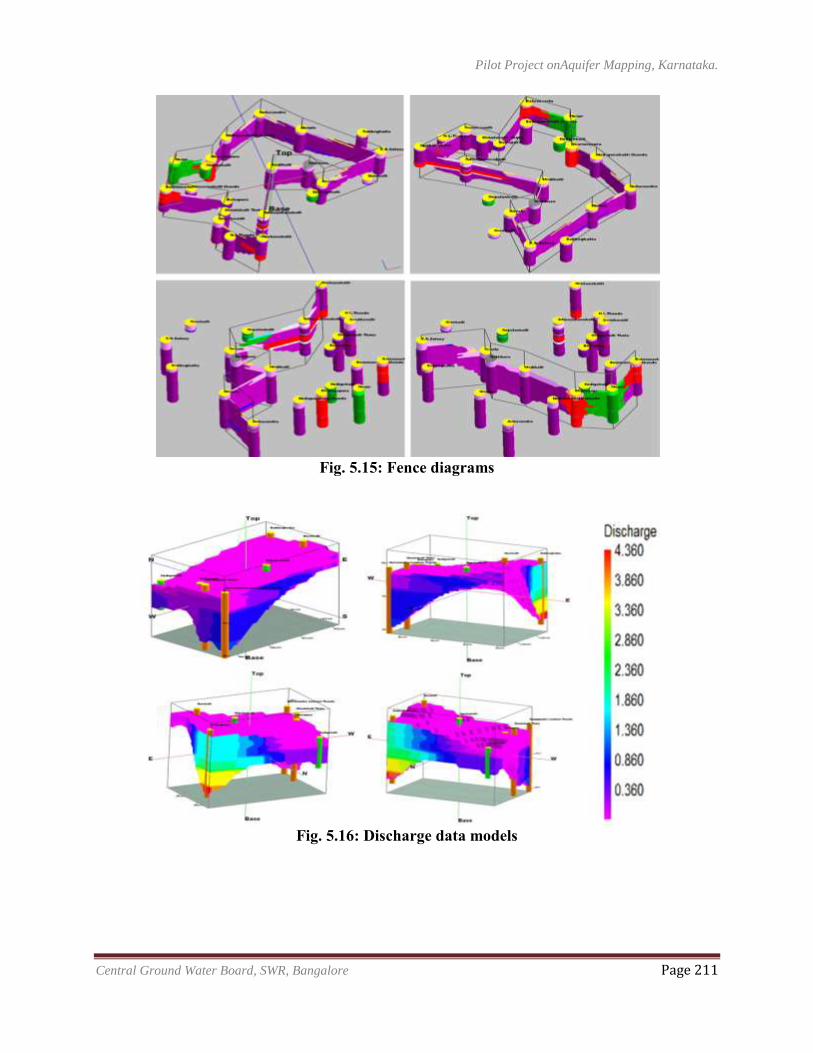
Pilot Project onAquifer Mapping, Karnataka.
Central Ground Water Board, SWR, Bangalore Page 211
Fig. 5.15: Fence diagrams
Fig. 5.16: Discharge data models
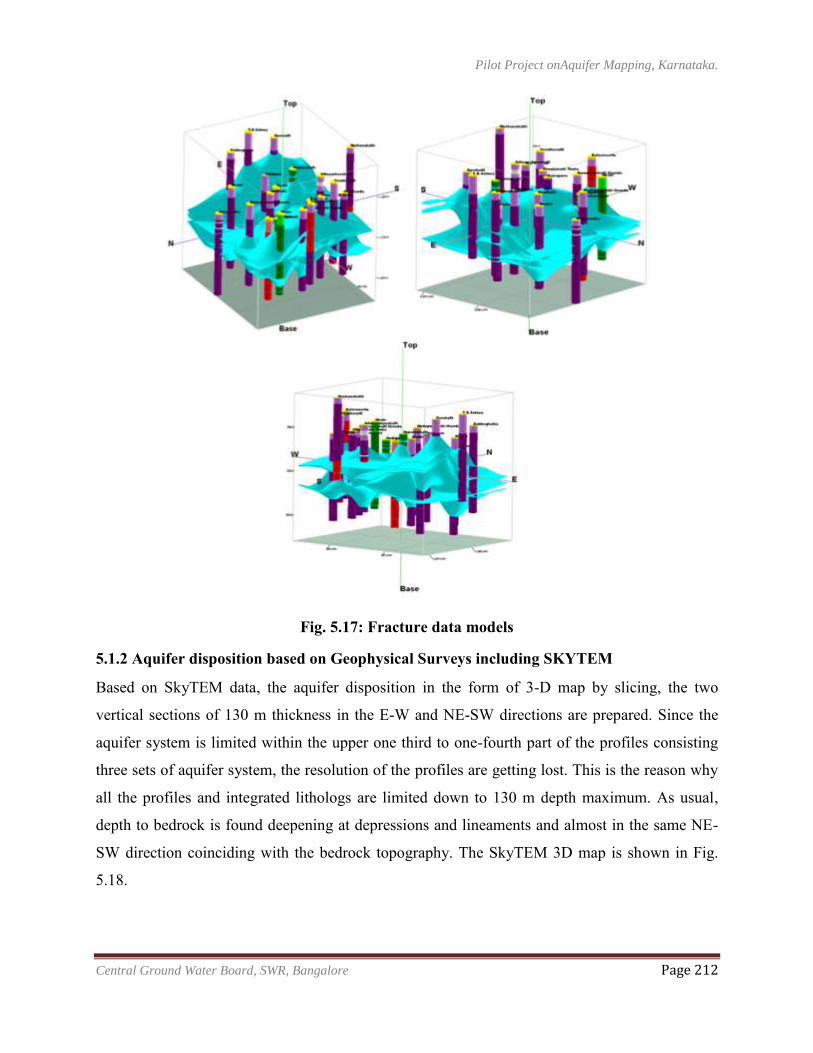
Pilot Project onAquifer Mapping, Karnataka.
Central Ground Water Board, SWR, Bangalore Page 212
Fig. 5.17: Fracture data models
5.1.2 Aquifer disposition based on Geophysical Surveys including SKYTEM
Based on SkyTEM data, the aquifer disposition in the form of 3-D map by slicing, the two
vertical sections of 130 m thickness in the E-W and NE-SW directions are prepared. Since the
aquifer system is limited within the upper one third to one-fourth part of the profiles consisting
three sets of aquifer system, the resolution of the profiles are getting lost. This is the reason why
all the profiles and integrated lithologs are limited down to 130 m depth maximum. As usual,
depth to bedrock is found deepening at depressions and lineaments and almost in the same NE-
SW direction coinciding with the bedrock topography. The SkyTEM 3D map is shown in Fig.
5.18.
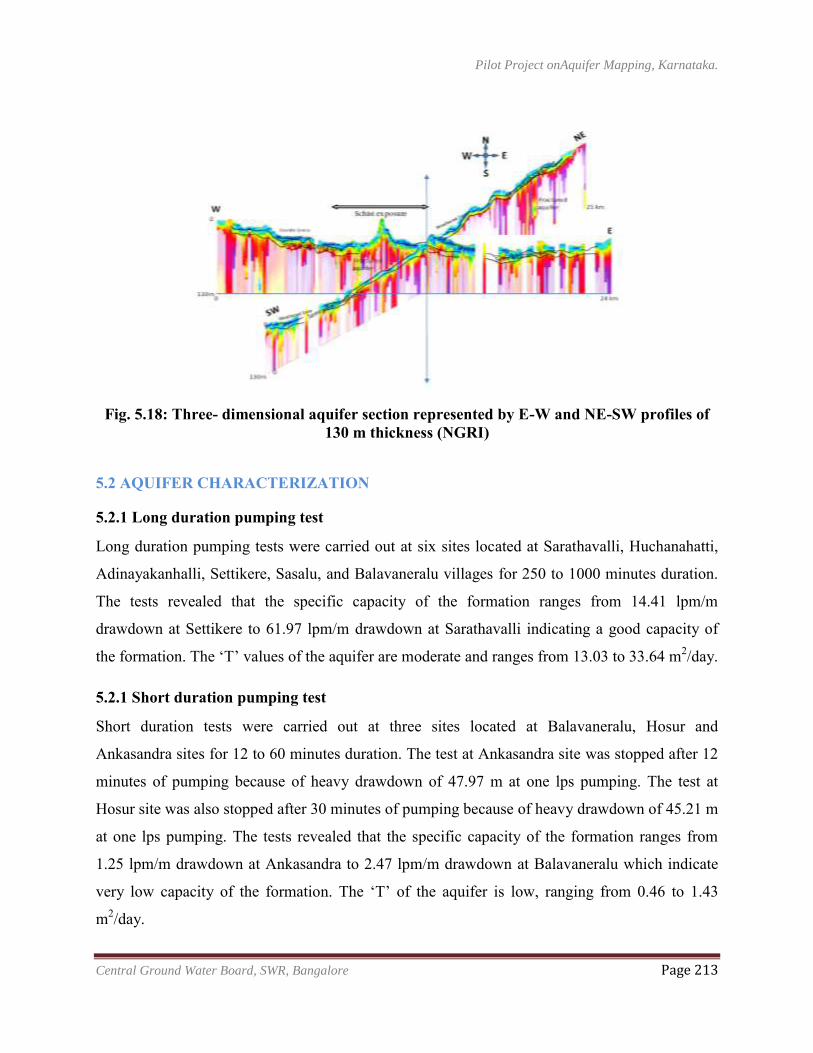
Pilot Project onAquifer Mapping, Karnataka.
Central Ground Water Board, SWR, Bangalore Page 213
Fig. 5.18: Three- dimensional aquifer section represented by E-W and NE-SW profiles of 130 m thickness (NGRI)
5.2 AQUIFER CHARACTERIZATION
5.2.1 Long duration pumping test
Long duration pumping tests were carried out at six sites located at Sarathavalli, Huchanahatti,
Adinayakanhalli, Settikere, Sasalu, and Balavaneralu villages for 250 to 1000 minutes duration.
The tests revealed that the specific capacity of the formation ranges from 14.41 lpm/m
drawdown at Settikere to 61.97 lpm/m drawdown at Sarathavalli indicating a good capacity of
the formation. The ‘T’ values of the aquifer are moderate and ranges from 13.03 to 33.64 m2/day.
5.2.1 Short duration pumping test
Short duration tests were carried out at three sites located at Balavaneralu, Hosur and
Ankasandra sites for 12 to 60 minutes duration. The test at Ankasandra site was stopped after 12
minutes of pumping because of heavy drawdown of 47.97 m at one lps pumping. The test at
Hosur site was also stopped after 30 minutes of pumping because of heavy drawdown of 45.21 m
at one lps pumping. The tests revealed that the specific capacity of the formation ranges from
1.25 lpm/m drawdown at Ankasandra to 2.47 lpm/m drawdown at Balavaneralu which indicate
very low capacity of the formation. The ‘T’ of the aquifer is low, ranging from 0.46 to 1.43
m2/day.
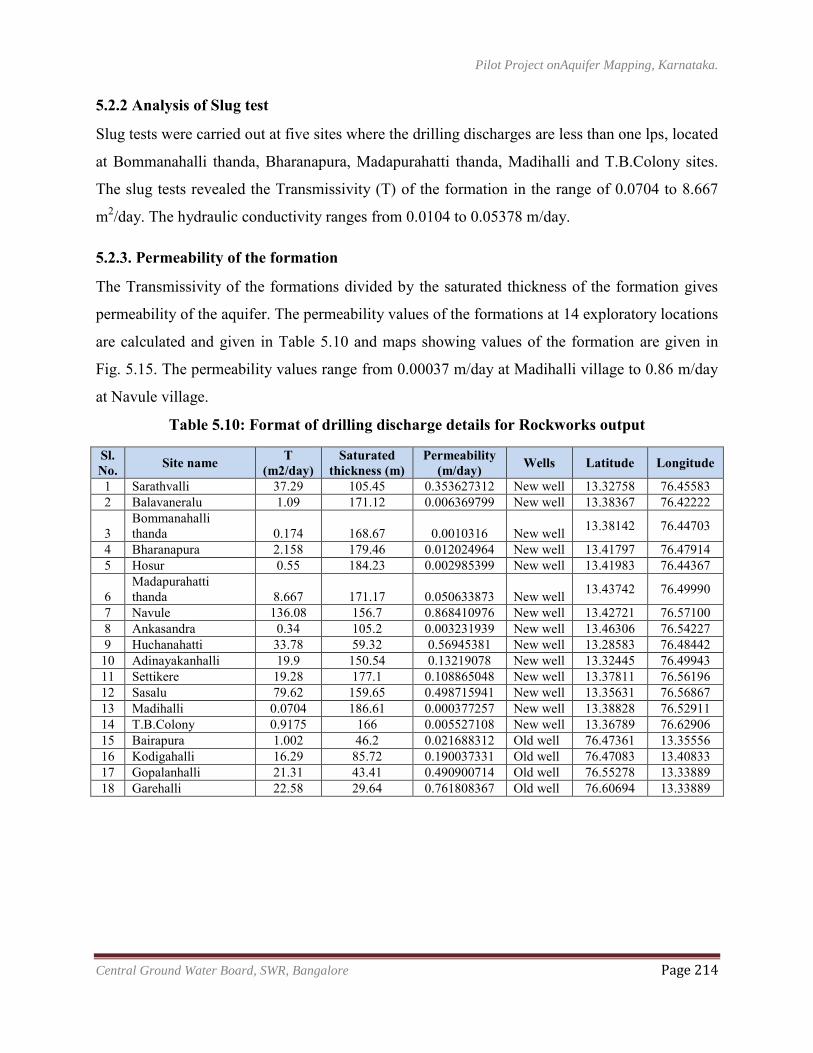
Pilot Project onAquifer Mapping, Karnataka.
Central Ground Water Board, SWR, Bangalore Page 214
5.2.2 Analysis of Slug test
Slug tests were carried out at five sites where the drilling discharges are less than one lps, located
at Bommanahalli thanda, Bharanapura, Madapurahatti thanda, Madihalli and T.B.Colony sites.
The slug tests revealed the Transmissivity (T) of the formation in the range of 0.0704 to 8.667
m2/day. The hydraulic conductivity ranges from 0.0104 to 0.05378 m/day.
5.2.3. Permeability of the formation
The Transmissivity of the formations divided by the saturated thickness of the formation gives
permeability of the aquifer. The permeability values of the formations at 14 exploratory locations
are calculated and given in Table 5.10 and maps showing values of the formation are given in
Fig. 5.15. The permeability values range from 0.00037 m/day at Madihalli village to 0.86 m/day
at Navule village.
Table 5.10: Format of drilling discharge details for Rockworks output
Sl. No. Site name T
(m2/day) Saturated
thickness (m) Permeability
(m/day) Wells Latitude Longitude
1 Sarathvalli 37.29 105.45 0.353627312 New well 13.32758 76.45583 2 Balavaneralu 1.09 171.12 0.006369799 New well 13.38367 76.42222
3 Bommanahalli thanda 0.174 168.67 0.0010316 New well 13.38142 76.44703
4 Bharanapura 2.158 179.46 0.012024964 New well 13.41797 76.47914 5 Hosur 0.55 184.23 0.002985399 New well 13.41983 76.44367
6 Madapurahatti thanda 8.667 171.17 0.050633873 New well 13.43742 76.49990
7 Navule 136.08 156.7 0.868410976 New well 13.42721 76.57100 8 Ankasandra 0.34 105.2 0.003231939 New well 13.46306 76.54227 9 Huchanahatti 33.78 59.32 0.56945381 New well 13.28583 76.48442 10 Adinayakanhalli 19.9 150.54 0.13219078 New well 13.32445 76.49943 11 Settikere 19.28 177.1 0.108865048 New well 13.37811 76.56196 12 Sasalu 79.62 159.65 0.498715941 New well 13.35631 76.56867 13 Madihalli 0.0704 186.61 0.000377257 New well 13.38828 76.52911 14 T.B.Colony 0.9175 166 0.005527108 New well 13.36789 76.62906 15 Bairapura 1.002 46.2 0.021688312 Old well 76.47361 13.35556 16 Kodigahalli 16.29 85.72 0.190037331 Old well 76.47083 13.40833 17 Gopalanhalli 21.31 43.41 0.490900714 Old well 76.55278 13.33889 18 Garehalli 22.58 29.64 0.761808367 Old well 76.60694 13.33889
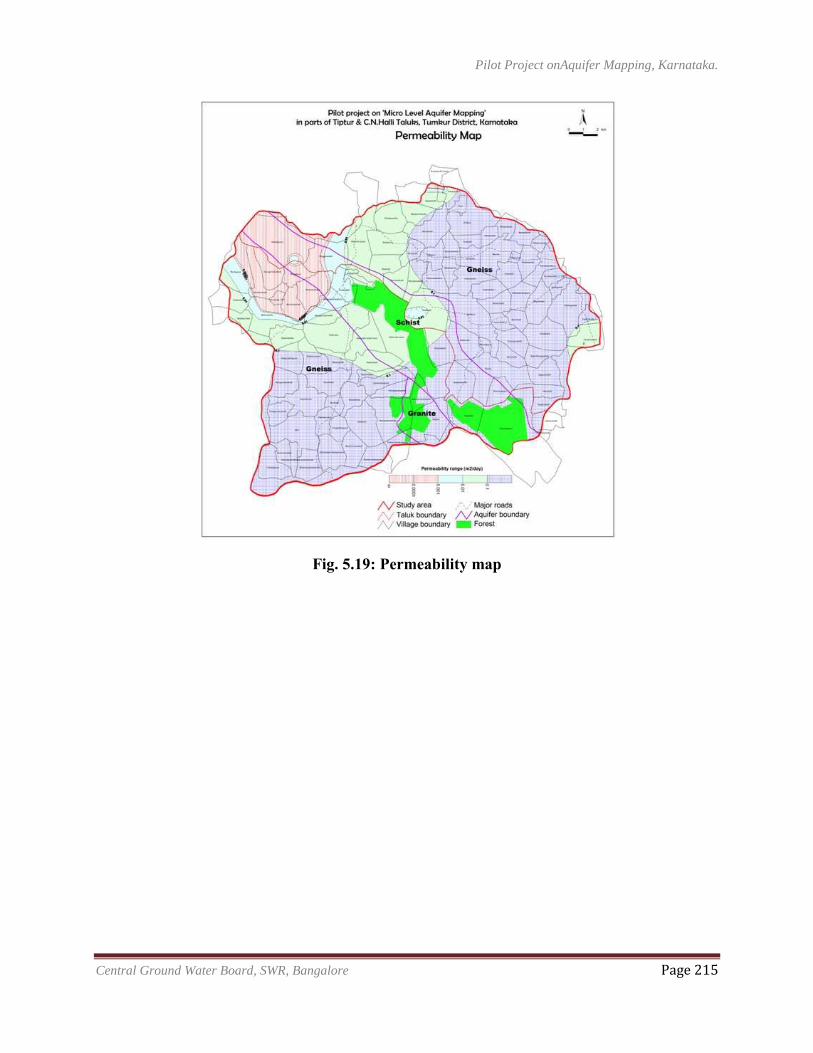
Pilot Project onAquifer Mapping, Karnataka.
Central Ground Water Board, SWR, Bangalore Page 215
Fig. 5.19: Permeability map
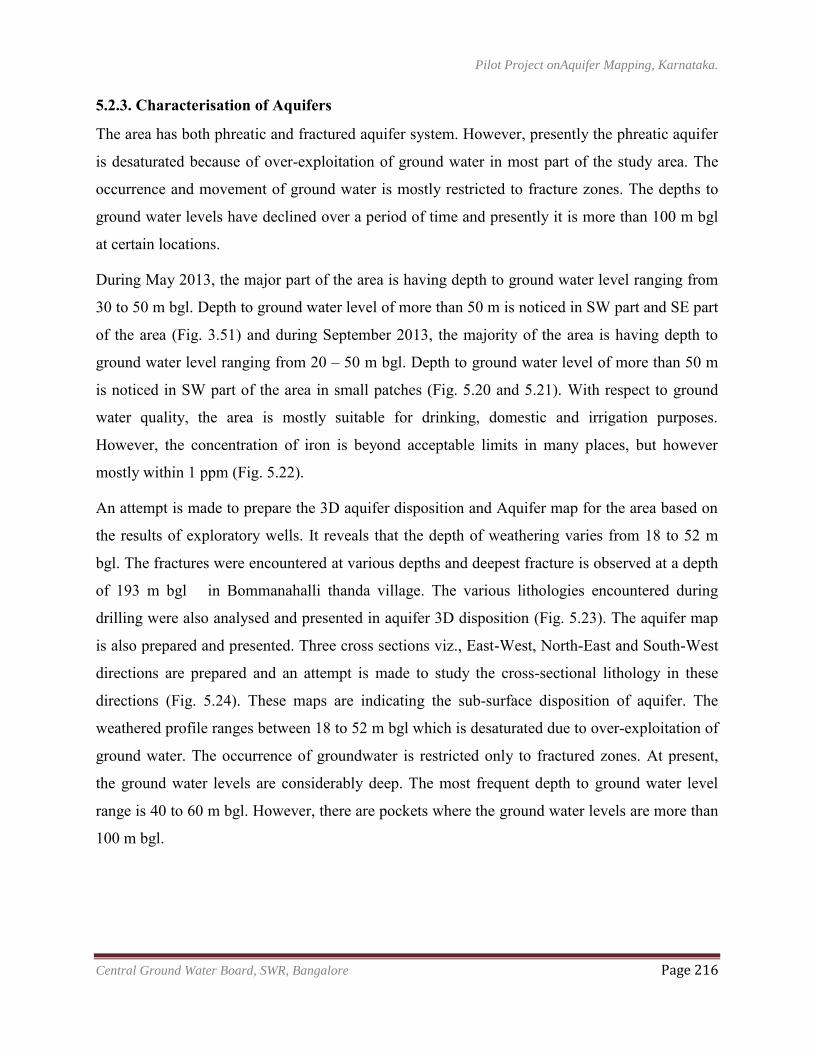
Pilot Project onAquifer Mapping, Karnataka.
Central Ground Water Board, SWR, Bangalore Page 216
5.2.3. Characterisation of Aquifers
The area has both phreatic and fractured aquifer system. However, presently the phreatic aquifer
is desaturated because of over-exploitation of ground water in most part of the study area. The
occurrence and movement of ground water is mostly restricted to fracture zones. The depths to
ground water levels have declined over a period of time and presently it is more than 100 m bgl
at certain locations.
During May 2013, the major part of the area is having depth to ground water level ranging from
30 to 50 m bgl. Depth to ground water level of more than 50 m is noticed in SW part and SE part
of the area (Fig. 3.51) and during September 2013, the majority of the area is having depth to
ground water level ranging from 20 – 50 m bgl. Depth to ground water level of more than 50 m
is noticed in SW part of the area in small patches (Fig. 5.20 and 5.21). With respect to ground
water quality, the area is mostly suitable for drinking, domestic and irrigation purposes.
However, the concentration of iron is beyond acceptable limits in many places, but however
mostly within 1 ppm (Fig. 5.22).
An attempt is made to prepare the 3D aquifer disposition and Aquifer map for the area based on
the results of exploratory wells. It reveals that the depth of weathering varies from 18 to 52 m
bgl. The fractures were encountered at various depths and deepest fracture is observed at a depth
of 193 m bgl in Bommanahalli thanda village. The various lithologies encountered during
drilling were also analysed and presented in aquifer 3D disposition (Fig. 5.23). The aquifer map
is also prepared and presented. Three cross sections viz., East-West, North-East and South-West
directions are prepared and an attempt is made to study the cross-sectional lithology in these
directions (Fig. 5.24). These maps are indicating the sub-surface disposition of aquifer. The
weathered profile ranges between 18 to 52 m bgl which is desaturated due to over-exploitation of
ground water. The occurrence of groundwater is restricted only to fractured zones. At present,
the ground water levels are considerably deep. The most frequent depth to ground water level
range is 40 to 60 m bgl. However, there are pockets where the ground water levels are more than
100 m bgl.
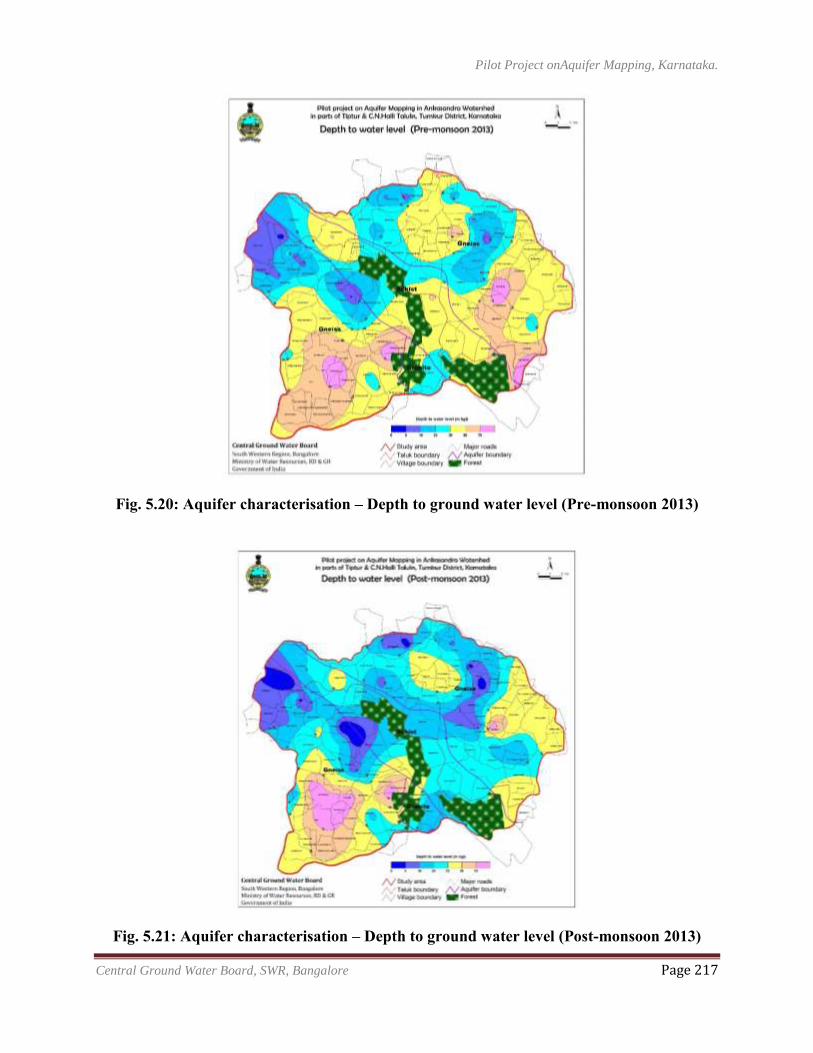
Pilot Project onAquifer Mapping, Karnataka.
Central Ground Water Board, SWR, Bangalore Page 217
Fig. 5.20: Aquifer characterisation – Depth to ground water level (Pre-monsoon 2013)
Fig. 5.21: Aquifer characterisation – Depth to ground water level (Post-monsoon 2013)
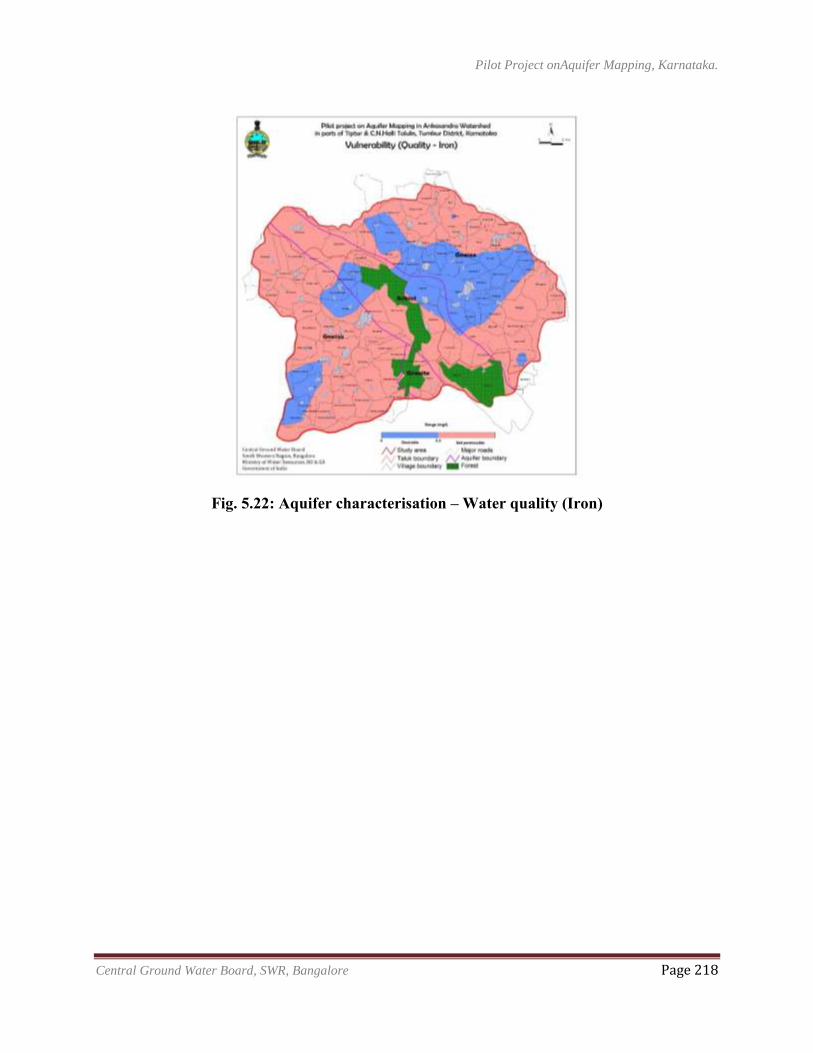
Pilot Project onAquifer Mapping, Karnataka.
Central Ground Water Board, SWR, Bangalore Page 218
Fig. 5.22: Aquifer characterisation – Water quality (Iron)
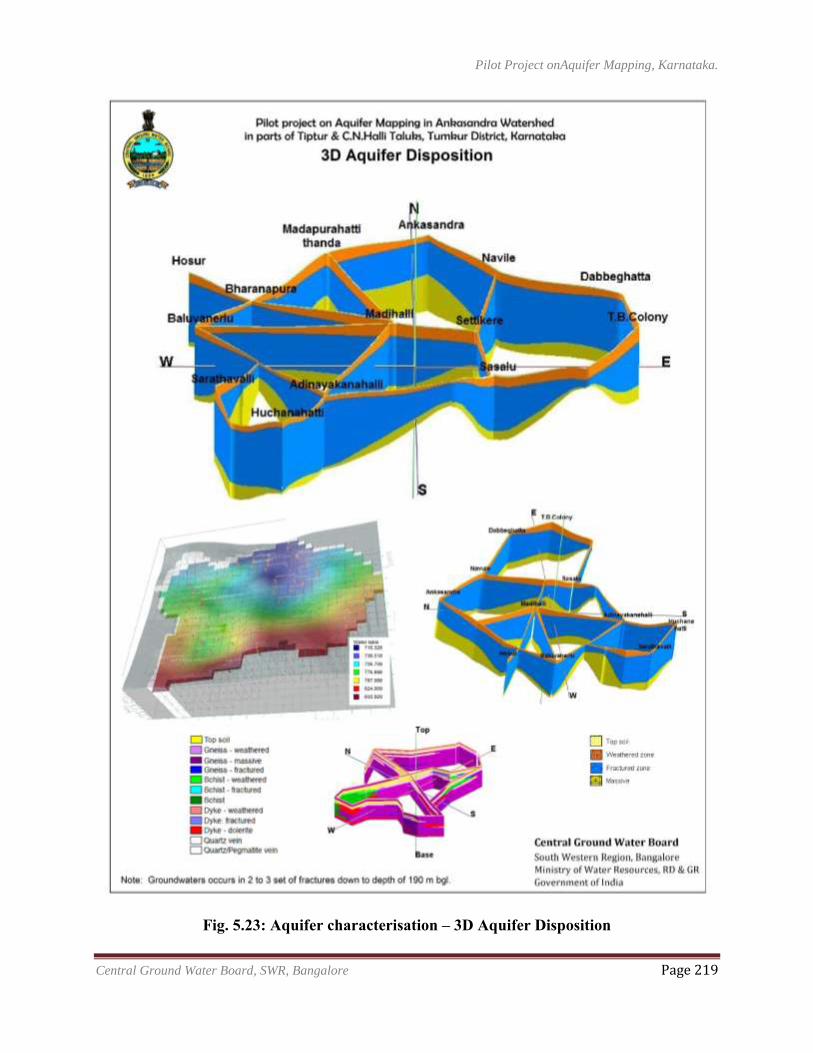
Pilot Project onAquifer Mapping, Karnataka.
Central Ground Water Board, SWR, Bangalore Page 219
Fig. 5.23: Aquifer characterisation – 3D Aquifer Disposition
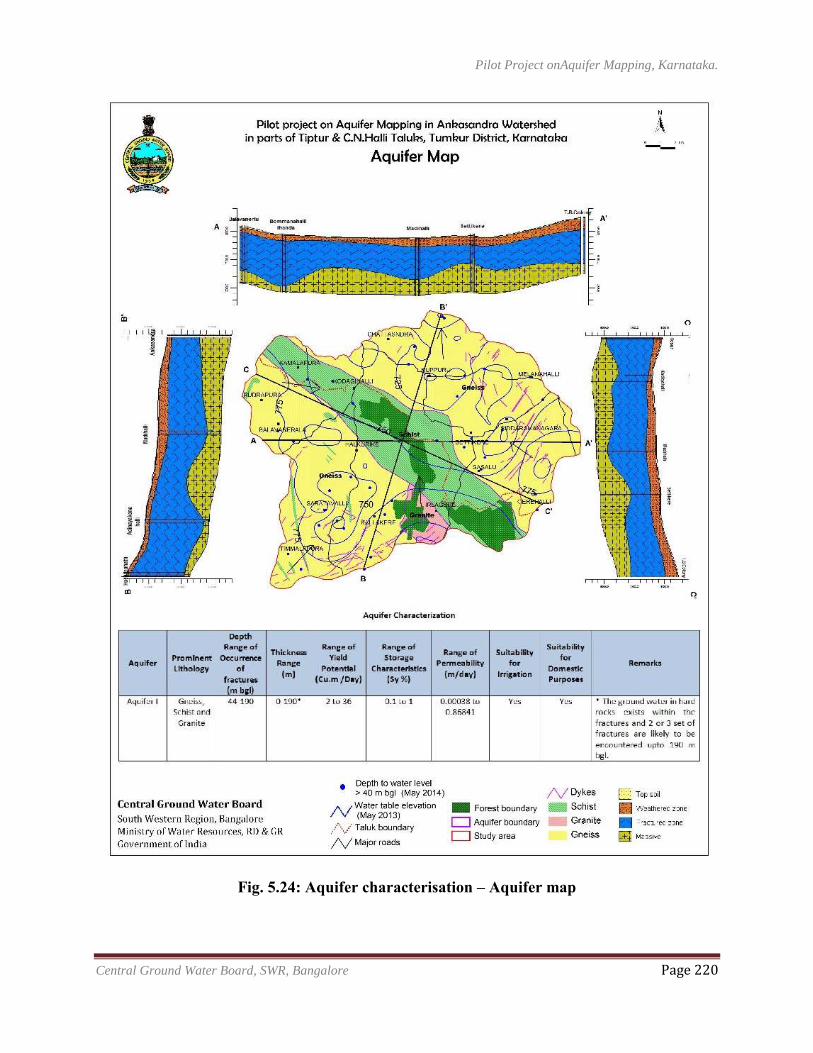
Pilot Project onAquifer Mapping, Karnataka.
Central Ground Water Board, SWR, Bangalore Page 220
Fig. 5.24: Aquifer characterisation – Aquifer map
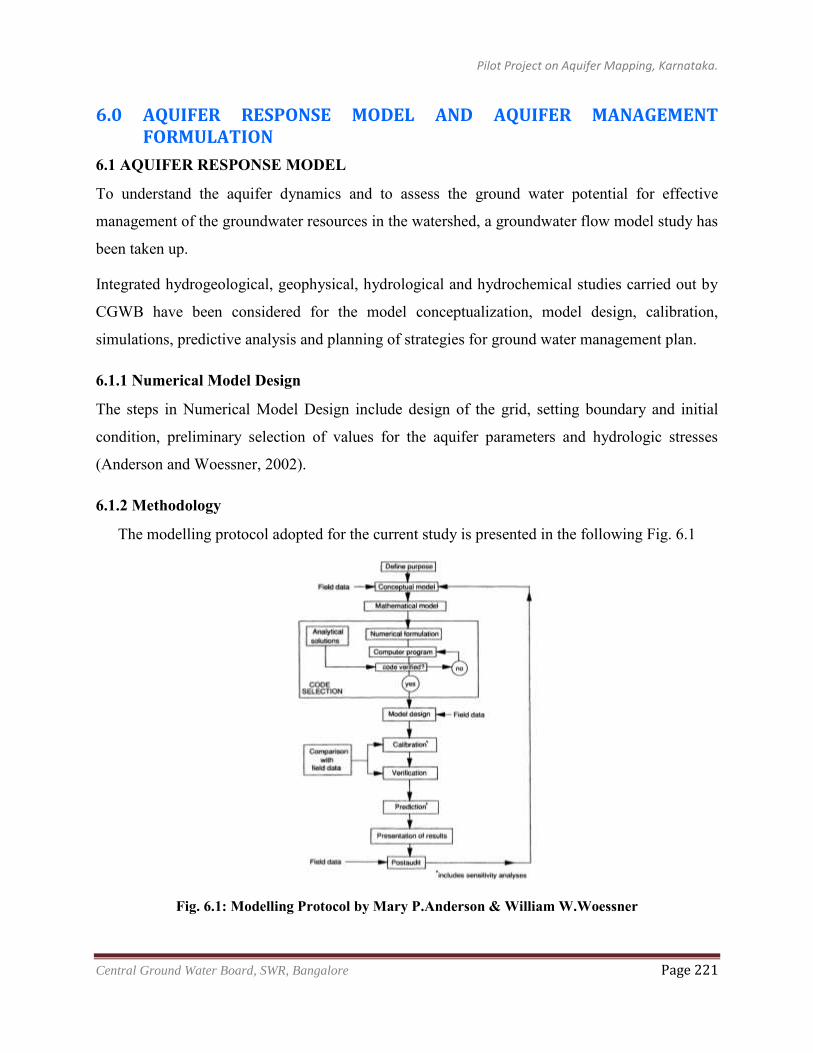
Pilot Project on Aquifer Mapping, Karnataka.
Central Ground Water Board, SWR, Bangalore Page 221
6.0 AQUIFER RESPONSE MODEL AND AQUIFER MANAGEMENT FORMULATION
6.1 AQUIFER RESPONSE MODEL
To understand the aquifer dynamics and to assess the ground water potential for effective
management of the groundwater resources in the watershed, a groundwater flow model study has
been taken up.
Integrated hydrogeological, geophysical, hydrological and hydrochemical studies carried out by
CGWB have been considered for the model conceptualization, model design, calibration,
simulations, predictive analysis and planning of strategies for ground water management plan.
6.1.1 Numerical Model Design
The steps in Numerical Model Design include design of the grid, setting boundary and initial
condition, preliminary selection of values for the aquifer parameters and hydrologic stresses
(Anderson and Woessner, 2002).
6.1.2 Methodology
The modelling protocol adopted for the current study is presented in the following Fig. 6.1
Fig. 6.1: Modelling Protocol by Mary P.Anderson & William W.Woessner
Pilot Project on Aquifer Mapping, Karnataka.
Central Ground Water Board, SWR, Bangalore Page 222
6.1.3 Visual MODFLOW
MODFLOW is a versatile code to simulate groundwater flow in multi-layered porous aquifer.
The model simulates flow in three dimensions using a block centred finite difference approach.
The groundwater flow in the aquifer may be simulated as confined/unconfined or the
combination of both. MODFLOW consists of a major program and a number of sub-routines
called modules. These modules are grouped in various packages viz. basic, river, recharge, block
centred flow, evapotranspiration, wells, general heads boundaries, drain.
MODFLOW is a computer program that numerically solves the three-dimensional ground-water
flow equation for a porous medium by using a finite-difference method (Waterloo
Hydrogeologic Inc. 2006). In the finite difference method (FDM), a continuous medium is
replaced by a discrete set of points called nodes and various hydrogeological parameters are
assigned to each of these nodes.
6.1.4 Conceptualisation of model
To design and to conceptualise ground water flow model of the area, following points are
considered. A figure showing the 2D conceptual model of the area is prepared and presented as
Fig. 6.2
The model area is underlain by Archaean group of rocks which includes mostly Gneisses,
Schists and Granites etc. which are hardrocks and devoid of primary porosity. Large numbers
of dolerite dykes are observed in the south western part of the study area.
These rocks are subjected to weathering near the surface and the depth of weathering varies
from negligible to as high as around 40 m.
Ground water occurs and moves in weathered residuum as phreatic aquifer in most part of
the study area. Most of the southern part of the watershed the phreatic aquifer is desaturated
and the ground water occurs in fractured aquifer, where the thickness of the fractures
(aquifer) is around a few centimetres.
Ground water contour map shows that flow of ground water is towards south-west to north-
east and south-east to north-east.
The depth of weathering ranges from 20 to 30 m bgl and rarely 30 to 40 m bgl.
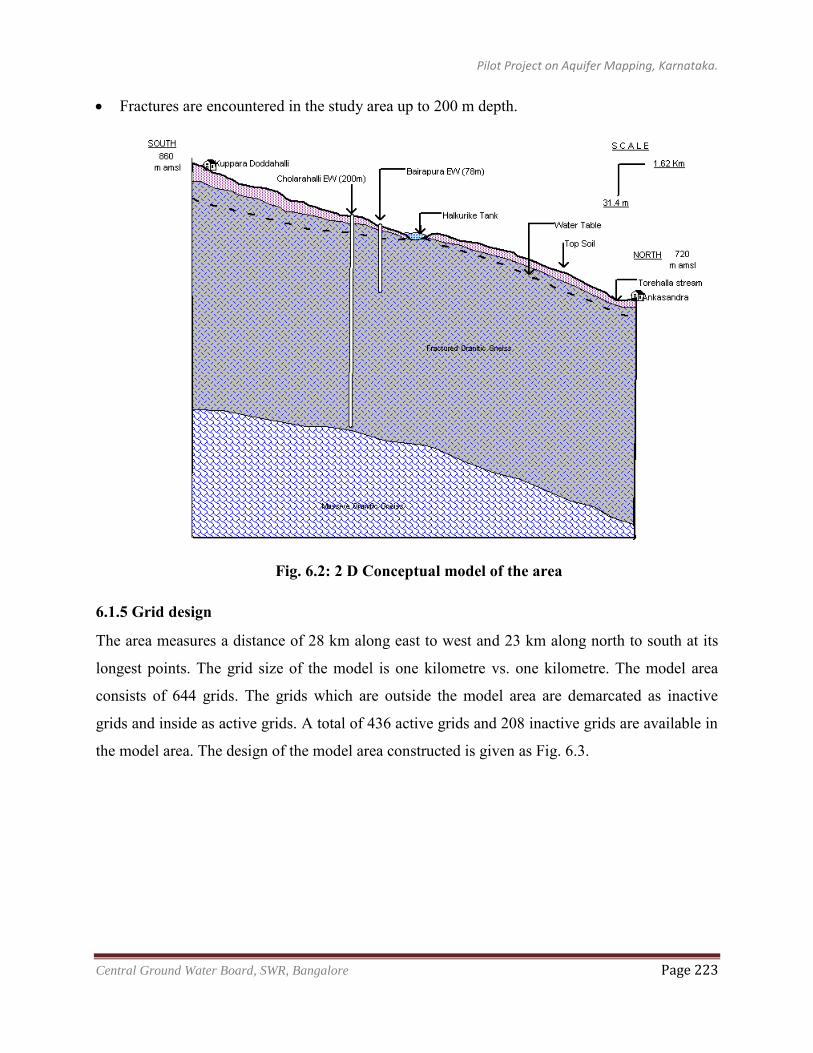
Pilot Project on Aquifer Mapping, Karnataka.
Central Ground Water Board, SWR, Bangalore Page 223
Fractures are encountered in the study area up to 200 m depth.
Fig. 6.2: 2 D Conceptual model of the area
6.1.5 Grid design
The area measures a distance of 28 km along east to west and 23 km along north to south at its
longest points. The grid size of the model is one kilometre vs. one kilometre. The model area
consists of 644 grids. The grids which are outside the model area are demarcated as inactive
grids and inside as active grids. A total of 436 active grids and 208 inactive grids are available in
the model area. The design of the model area constructed is given as Fig. 6.3.
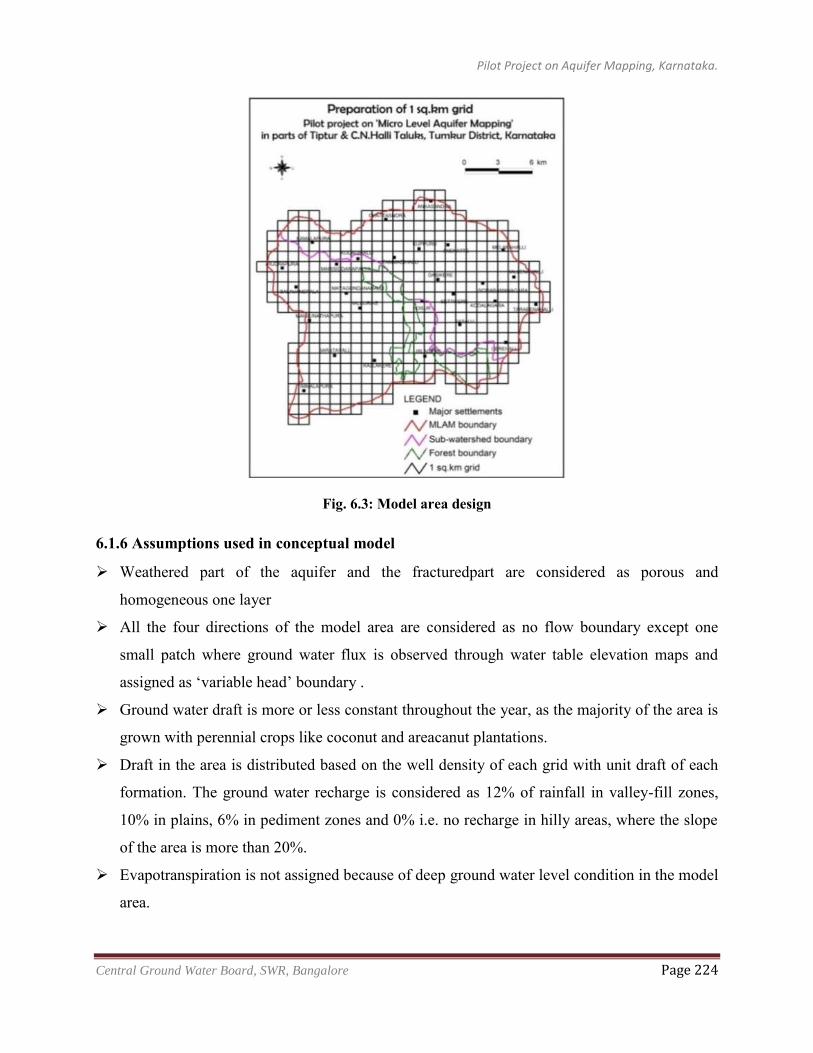
Pilot Project on Aquifer Mapping, Karnataka.
Central Ground Water Board, SWR, Bangalore Page 224
Fig. 6.3: Model area design
6.1.6 Assumptions used in conceptual model
Weathered part of the aquifer and the fracturedpart are considered as porous and
homogeneous one layer
All the four directions of the model area are considered as no flow boundary except one
small patch where ground water flux is observed through water table elevation maps and
assigned as ‘variable head’ boundary .
Ground water draft is more or less constant throughout the year, as the majority of the area is
grown with perennial crops like coconut and areacanut plantations.
Draft in the area is distributed based on the well density of each grid with unit draft of each
formation. The ground water recharge is considered as 12% of rainfall in valley-fill zones,
10% in plains, 6% in pediment zones and 0% i.e. no recharge in hilly areas, where the slope
of the area is more than 20%.
Evapotranspiration is not assigned because of deep ground water level condition in the model
area.
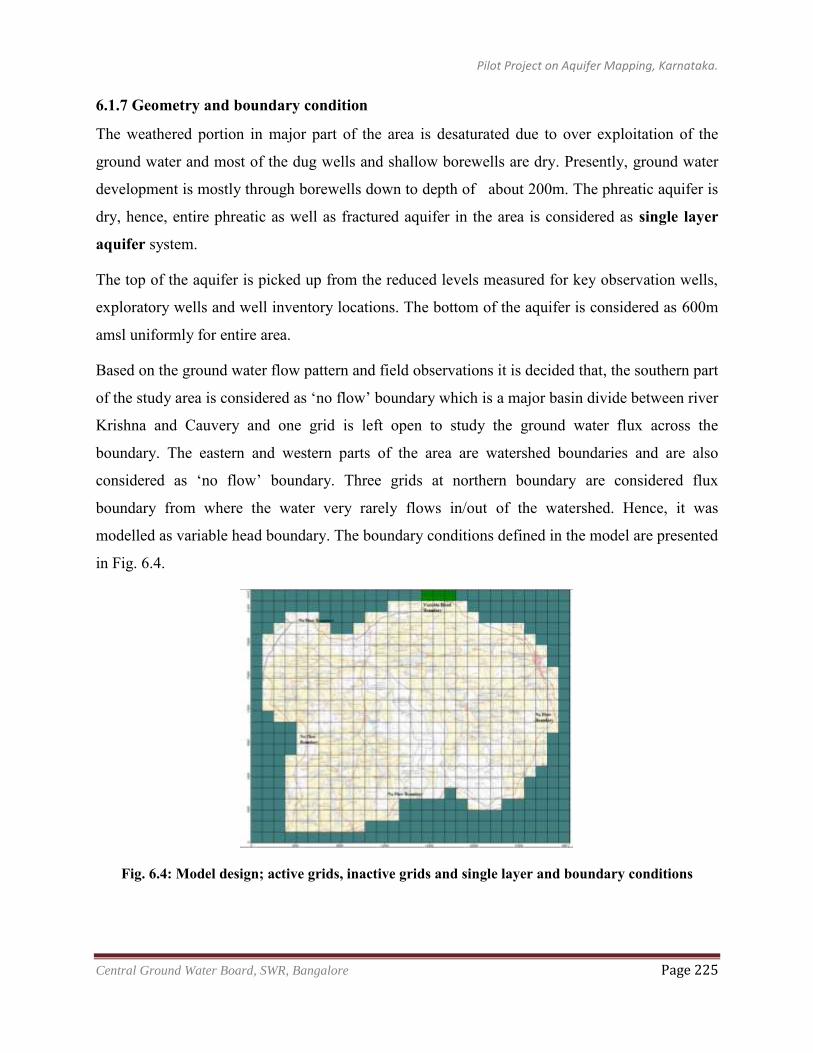
Pilot Project on Aquifer Mapping, Karnataka.
Central Ground Water Board, SWR, Bangalore Page 225
6.1.7 Geometry and boundary condition
The weathered portion in major part of the area is desaturated due to over exploitation of the
ground water and most of the dug wells and shallow borewells are dry. Presently, ground water
development is mostly through borewells down to depth of about 200m. The phreatic aquifer is
dry, hence, entire phreatic as well as fractured aquifer in the area is considered as single layer
aquifer system.
The top of the aquifer is picked up from the reduced levels measured for key observation wells,
exploratory wells and well inventory locations. The bottom of the aquifer is considered as 600m
amsl uniformly for entire area.
Based on the ground water flow pattern and field observations it is decided that, the southern part
of the study area is considered as ‘no flow’ boundary which is a major basin divide between river
Krishna and Cauvery and one grid is left open to study the ground water flux across the
boundary. The eastern and western parts of the area are watershed boundaries and are also
considered as ‘no flow’ boundary. Three grids at northern boundary are considered flux
boundary from where the water very rarely flows in/out of the watershed. Hence, it was
modelled as variable head boundary. The boundary conditions defined in the model are presented
in Fig. 6.4.
Fig. 6.4: Model design; active grids, inactive grids and single layer and boundary conditions
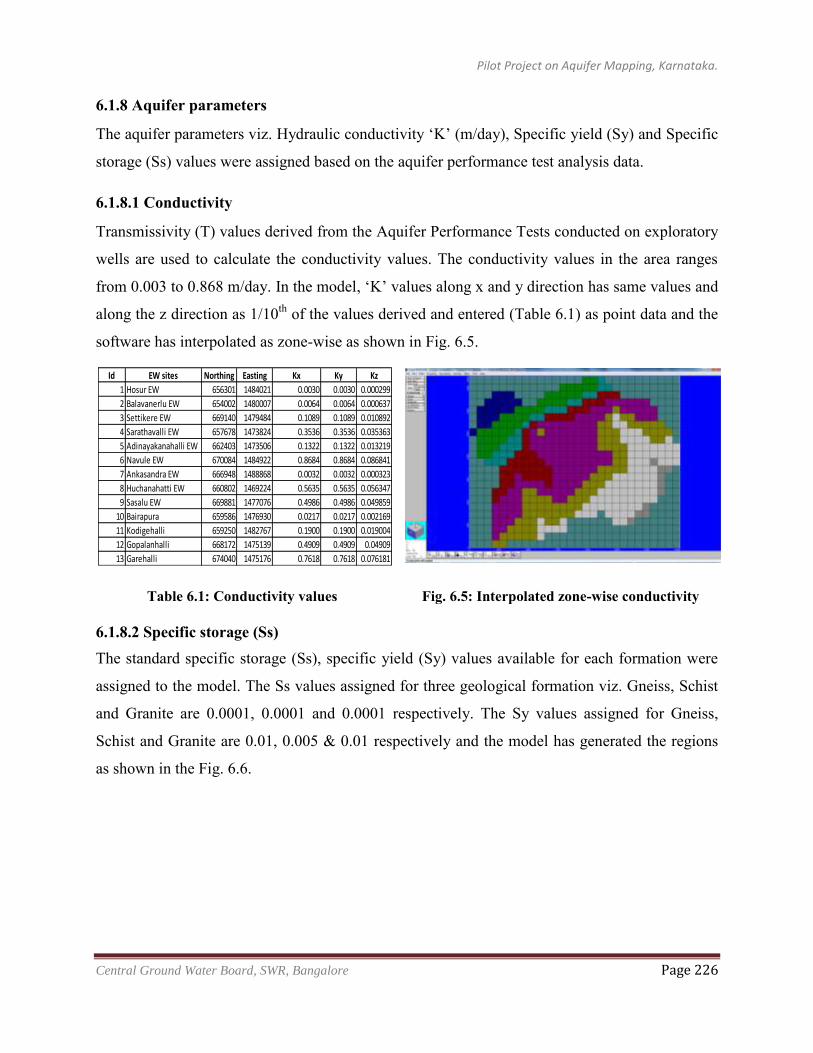
Pilot Project on Aquifer Mapping, Karnataka.
Central Ground Water Board, SWR, Bangalore Page 226
6.1.8 Aquifer parameters
The aquifer parameters viz. Hydraulic conductivity ‘K’ (m/day), Specific yield (Sy) and Specific
storage (Ss) values were assigned based on the aquifer performance test analysis data.
6.1.8.1 Conductivity
Transmissivity (T) values derived from the Aquifer Performance Tests conducted on exploratory
wells are used to calculate the conductivity values. The conductivity values in the area ranges
from 0.003 to 0.868 m/day. In the model, ‘K’ values along x and y direction has same values and
along the z direction as 1/10th of the values derived and entered (Table 6.1) as point data and the
software has interpolated as zone-wise as shown in Fig. 6.5.
Table 6.1: Conductivity values Fig. 6.5: Interpolated zone-wise conductivity 6.1.8.2 Specific storage (Ss) The standard specific storage (Ss), specific yield (Sy) values available for each formation were
assigned to the model. The Ss values assigned for three geological formation viz. Gneiss, Schist
and Granite are 0.0001, 0.0001 and 0.0001 respectively. The Sy values assigned for Gneiss,
Schist and Granite are 0.01, 0.005 & 0.01 respectively and the model has generated the regions
as shown in the Fig. 6.6.
Id EW sites Northing Easting Kx Ky Kz
1 Hosur EW 656301 1484021 0.0030 0.0030 0.000299
2 Balavanerlu EW 654002 1480007 0.0064 0.0064 0.000637
3 Settikere EW 669140 1479484 0.1089 0.1089 0.010892
4 Sarathavalli EW 657678 1473824 0.3536 0.3536 0.035363
5 Adinayakanahalli EW 662403 1473506 0.1322 0.1322 0.013219
6 Navule EW 670084 1484922 0.8684 0.8684 0.086841
7 Ankasandra EW 666948 1488868 0.0032 0.0032 0.000323
8 Huchanahatti EW 660802 1469224 0.5635 0.5635 0.056347
9 Sasalu EW 669881 1477076 0.4986 0.4986 0.049859
10 Bairapura 659586 1476930 0.0217 0.0217 0.002169
11 Kodigehalli 659250 1482767 0.1900 0.1900 0.019004
12 Gopalanhalli 668172 1475139 0.4909 0.4909 0.04909
13 Garehalli 674040 1475176 0.7618 0.7618 0.076181
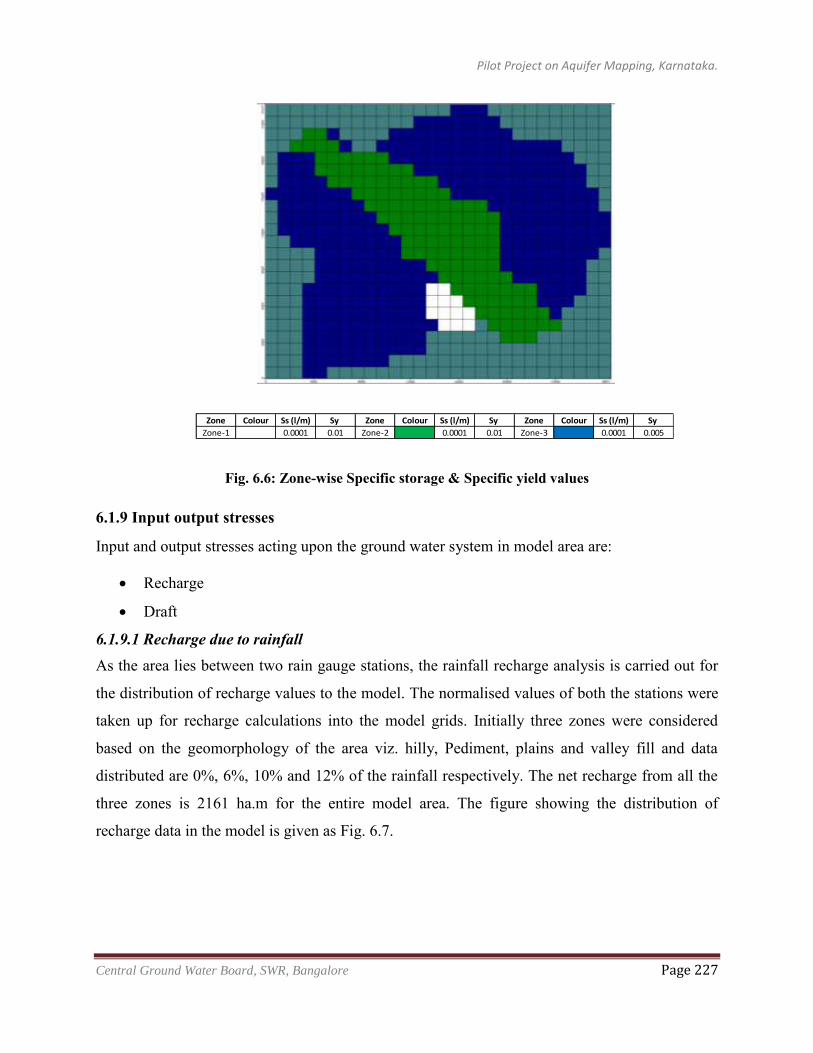
Pilot Project on Aquifer Mapping, Karnataka.
Central Ground Water Board, SWR, Bangalore Page 227
Fig. 6.6: Zone-wise Specific storage & Specific yield values
6.1.9 Input output stresses
Input and output stresses acting upon the ground water system in model area are:
Recharge
Draft
6.1.9.1 Recharge due to rainfall As the area lies between two rain gauge stations, the rainfall recharge analysis is carried out for
the distribution of recharge values to the model. The normalised values of both the stations were
taken up for recharge calculations into the model grids. Initially three zones were considered
based on the geomorphology of the area viz. hilly, Pediment, plains and valley fill and data
distributed are 0%, 6%, 10% and 12% of the rainfall respectively. The net recharge from all the
three zones is 2161 ha.m for the entire model area. The figure showing the distribution of
recharge data in the model is given as Fig. 6.7.
Zone Colour Ss (l/m) Sy Zone Colour Ss (l/m) Sy Zone Colour Ss (l/m) Sy
Zone-1 0.0001 0.01 Zone-2 0.0001 0.01 Zone-3 0.0001 0.005
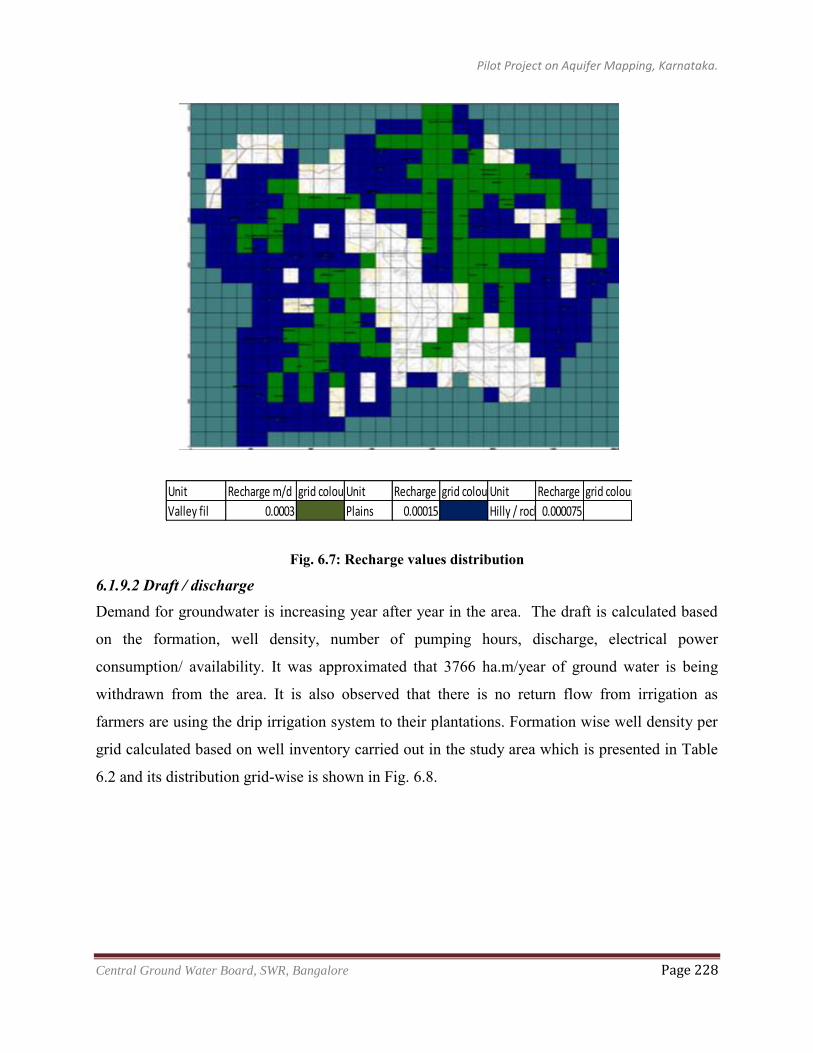
Pilot Project on Aquifer Mapping, Karnataka.
Central Ground Water Board, SWR, Bangalore Page 228
Fig. 6.7: Recharge values distribution
6.1.9.2 Draft / discharge Demand for groundwater is increasing year after year in the area. The draft is calculated based
on the formation, well density, number of pumping hours, discharge, electrical power
consumption/ availability. It was approximated that 3766 ha.m/year of ground water is being
withdrawn from the area. It is also observed that there is no return flow from irrigation as
farmers are using the drip irrigation system to their plantations. Formation wise well density per
grid calculated based on well inventory carried out in the study area which is presented in Table
6.2 and its distribution grid-wise is shown in Fig. 6.8.
Unit Recharge m/d grid colourUnit Recharge m/dgrid colourUnit Recharge m/dgrid colour
Valley fil 0.0003 Plains 0.00015 Hilly / rocky0.000075
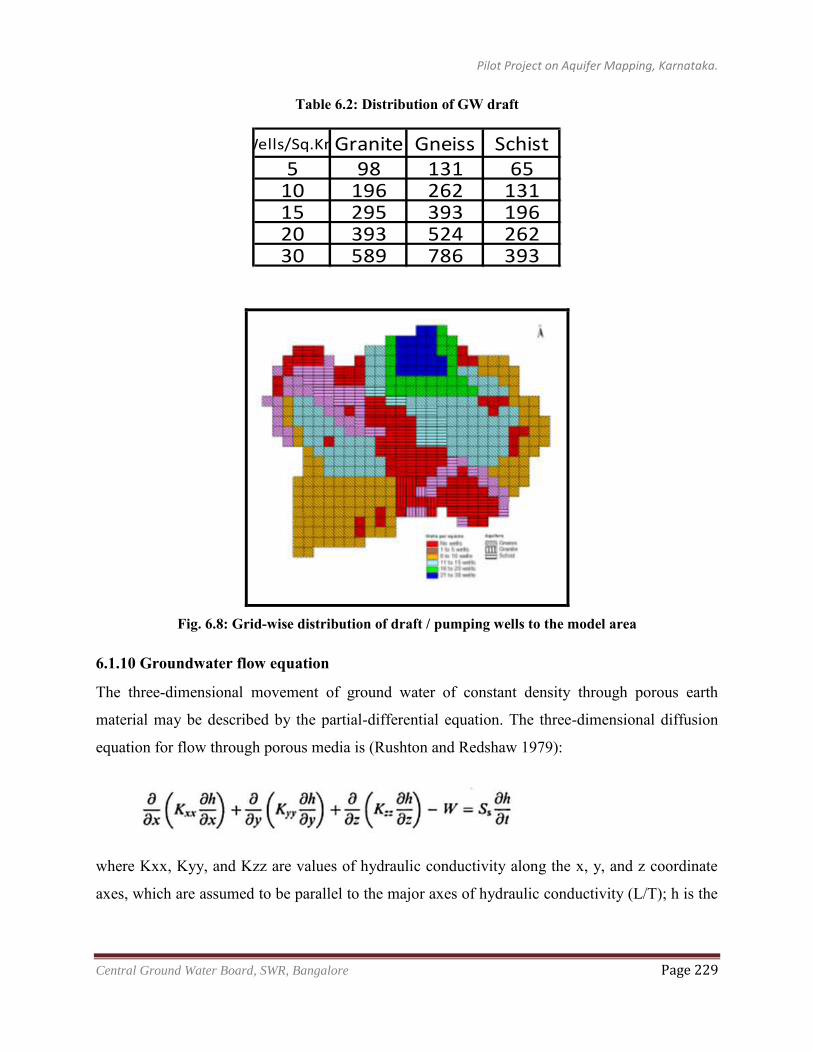
Pilot Project on Aquifer Mapping, Karnataka.
Central Ground Water Board, SWR, Bangalore Page 229
Table 6.2: Distribution of GW draft
Fig. 6.8: Grid-wise distribution of draft / pumping wells to the model area
6.1.10 Groundwater flow equation
The three-dimensional movement of ground water of constant density through porous earth
material may be described by the partial-differential equation. The three-dimensional diffusion
equation for flow through porous media is (Rushton and Redshaw 1979):
where Kxx, Kyy, and Kzz are values of hydraulic conductivity along the x, y, and z coordinate
axes, which are assumed to be parallel to the major axes of hydraulic conductivity (L/T); h is the
Wells/Sq.Km.Granite Gneiss Schist5 98 131 65
10 196 262 13115 295 393 19620 393 524 26230 589 786 393
Pilot Project on Aquifer Mapping, Karnataka.
Central Ground Water Board, SWR, Bangalore Page 230
potentiometric head (L); W is a volumetric flux per unit volume representing sources and/or
sinks of water; SS is the specific storage of the porous material (L-1); and t is time (T).
6.1.11 Model calibration
An important part of any groundwater modelling exercise is the model calibration process. In
order for a groundwater model to be used in any type of predictive role, it must be demonstrated
that the model can successfully simulate observed aquifer behaviour. Calibration is a process
wherein certain parameters of the model such as recharge and hydraulic conductivity are altered
in a systematic fashion and the model is repeatedly run until the computed solution matches
field-observed values within an acceptable level of accuracy.
The purpose of model calibration is to establish that the model can reproduce field measured
heads and flows. Calibration is carried out by trial and error adjustment of parameters or by
using an automated parameter estimation code. In this study, trial and error adjustment has been
used.
6.1.11.1 Steady state calibration The aquifer condition of September 2011 is considered as initial condition for the steady state
model calibration. The model calibration started by matching the computed and the field ground
water level hydrographs. The plots of computed steady state model are shown in Fig. 6.9.
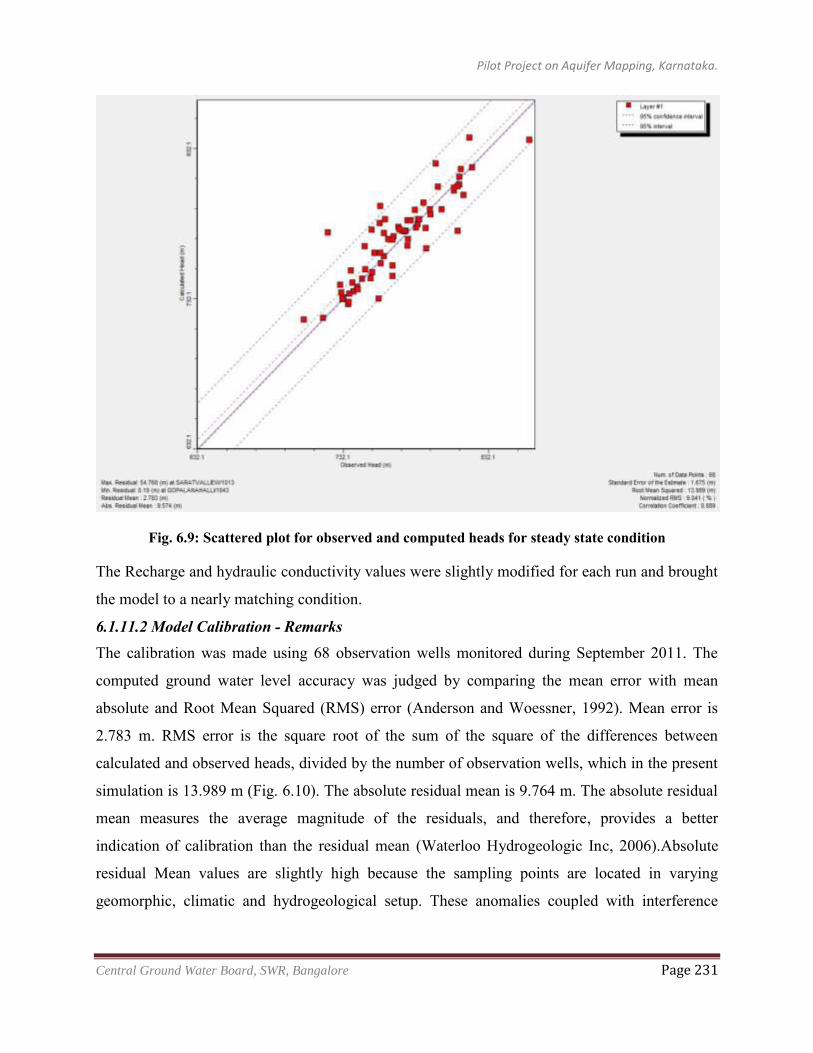
Pilot Project on Aquifer Mapping, Karnataka.
Central Ground Water Board, SWR, Bangalore Page 231
Fig. 6.9: Scattered plot for observed and computed heads for steady state condition
The Recharge and hydraulic conductivity values were slightly modified for each run and brought
the model to a nearly matching condition.
6.1.11.2 Model Calibration - Remarks The calibration was made using 68 observation wells monitored during September 2011. The
computed ground water level accuracy was judged by comparing the mean error with mean
absolute and Root Mean Squared (RMS) error (Anderson and Woessner, 1992). Mean error is
2.783 m. RMS error is the square root of the sum of the square of the differences between
calculated and observed heads, divided by the number of observation wells, which in the present
simulation is 13.989 m (Fig. 6.10). The absolute residual mean is 9.764 m. The absolute residual
mean measures the average magnitude of the residuals, and therefore, provides a better
indication of calibration than the residual mean (Waterloo Hydrogeologic Inc, 2006).Absolute
residual Mean values are slightly high because the sampling points are located in varying
geomorphic, climatic and hydrogeological setup. These anomalies coupled with interference
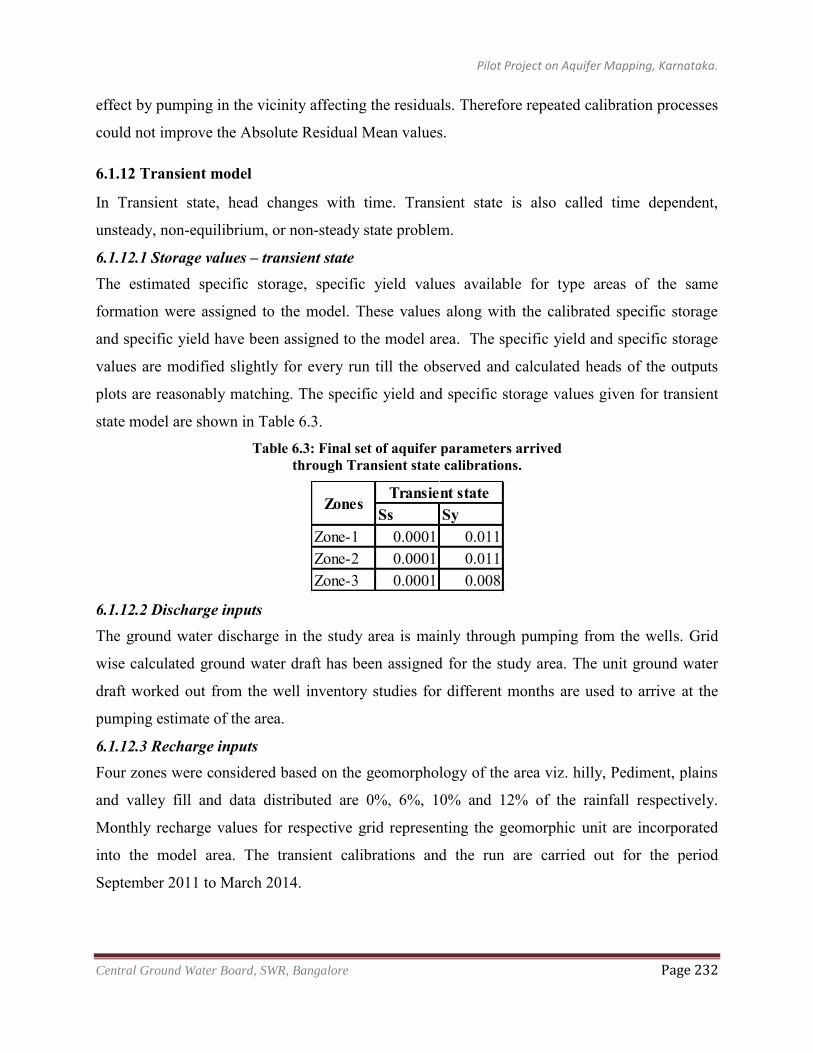
Pilot Project on Aquifer Mapping, Karnataka.
Central Ground Water Board, SWR, Bangalore Page 232
effect by pumping in the vicinity affecting the residuals. Therefore repeated calibration processes
could not improve the Absolute Residual Mean values.
6.1.12 Transient model
In Transient state, head changes with time. Transient state is also called time dependent,
unsteady, non-equilibrium, or non-steady state problem.
6.1.12.1 Storage values – transient state The estimated specific storage, specific yield values available for type areas of the same
formation were assigned to the model. These values along with the calibrated specific storage
and specific yield have been assigned to the model area. The specific yield and specific storage
values are modified slightly for every run till the observed and calculated heads of the outputs
plots are reasonably matching. The specific yield and specific storage values given for transient
state model are shown in Table 6.3.
Table 6.3: Final set of aquifer parameters arrived through Transient state calibrations.
6.1.12.2 Discharge inputs The ground water discharge in the study area is mainly through pumping from the wells. Grid
wise calculated ground water draft has been assigned for the study area. The unit ground water
draft worked out from the well inventory studies for different months are used to arrive at the
pumping estimate of the area.
6.1.12.3 Recharge inputs Four zones were considered based on the geomorphology of the area viz. hilly, Pediment, plains
and valley fill and data distributed are 0%, 6%, 10% and 12% of the rainfall respectively.
Monthly recharge values for respective grid representing the geomorphic unit are incorporated
into the model area. The transient calibrations and the run are carried out for the period
September 2011 to March 2014.
Ss SyZone-1 0.0001 0.011Zone-2 0.0001 0.011Zone-3 0.0001 0.008
ZonesTransient state
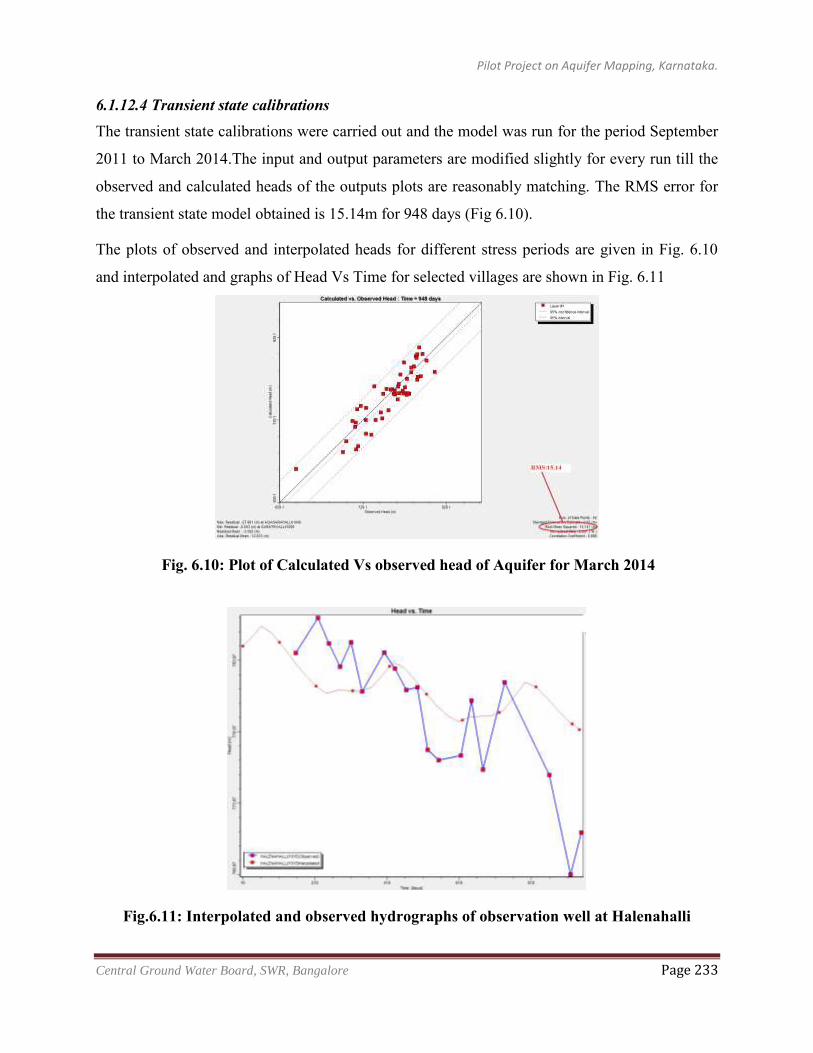
Pilot Project on Aquifer Mapping, Karnataka.
Central Ground Water Board, SWR, Bangalore Page 233
6.1.12.4 Transient state calibrations The transient state calibrations were carried out and the model was run for the period September
2011 to March 2014.The input and output parameters are modified slightly for every run till the
observed and calculated heads of the outputs plots are reasonably matching. The RMS error for
the transient state model obtained is 15.14m for 948 days (Fig 6.10).
The plots of observed and interpolated heads for different stress periods are given in Fig. 6.10
and interpolated and graphs of Head Vs Time for selected villages are shown in Fig. 6.11
Fig. 6.10: Plot of Calculated Vs observed head of Aquifer for March 2014
Fig.6.11: Interpolated and observed hydrographs of observation well at Halenahalli
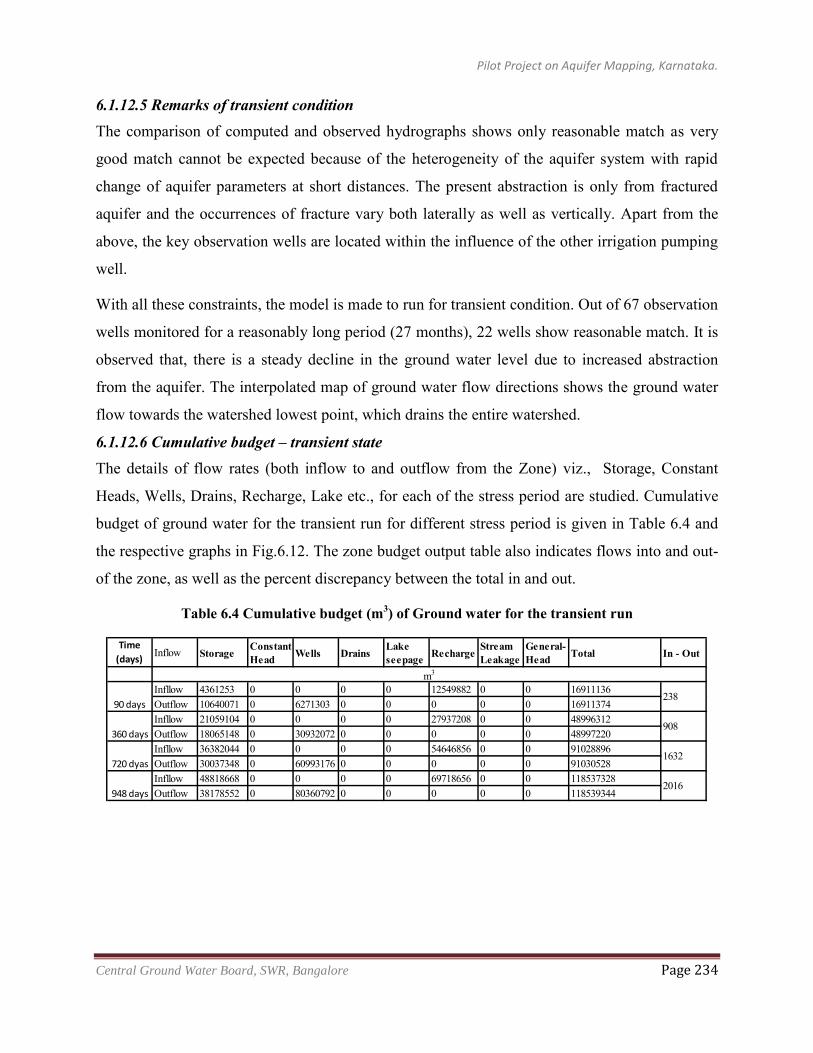
Pilot Project on Aquifer Mapping, Karnataka.
Central Ground Water Board, SWR, Bangalore Page 234
6.1.12.5 Remarks of transient condition The comparison of computed and observed hydrographs shows only reasonable match as very
good match cannot be expected because of the heterogeneity of the aquifer system with rapid
change of aquifer parameters at short distances. The present abstraction is only from fractured
aquifer and the occurrences of fracture vary both laterally as well as vertically. Apart from the
above, the key observation wells are located within the influence of the other irrigation pumping
well.
With all these constraints, the model is made to run for transient condition. Out of 67 observation
wells monitored for a reasonably long period (27 months), 22 wells show reasonable match. It is
observed that, there is a steady decline in the ground water level due to increased abstraction
from the aquifer. The interpolated map of ground water flow directions shows the ground water
flow towards the watershed lowest point, which drains the entire watershed.
6.1.12.6 Cumulative budget – transient state The details of flow rates (both inflow to and outflow from the Zone) viz., Storage, Constant
Heads, Wells, Drains, Recharge, Lake etc., for each of the stress period are studied. Cumulative
budget of ground water for the transient run for different stress period is given in Table 6.4 and
the respective graphs in Fig.6.12. The zone budget output table also indicates flows into and out-
of the zone, as well as the percent discrepancy between the total in and out.
Table 6.4 Cumulative budget (m3) of Ground water for the transient run
Time
(days)Inflow Storage
Constant Head Wells Drains
Lake seepage Recharge
Stream Leakage
General-Head Total In - Out
Infllow 4361253 0 0 0 0 12549882 0 0 16911136Outflow 10640071 0 6271303 0 0 0 0 0 16911374Infllow 21059104 0 0 0 0 27937208 0 0 48996312Outflow 18065148 0 30932072 0 0 0 0 0 48997220Infllow 36382044 0 0 0 0 54646856 0 0 91028896Outflow 30037348 0 60993176 0 0 0 0 0 91030528Infllow 48818668 0 0 0 0 69718656 0 0 118537328Outflow 38178552 0 80360792 0 0 0 0 0 118539344948 days
2016
m3
238
908
1632
90 days
360 days
720 dyas
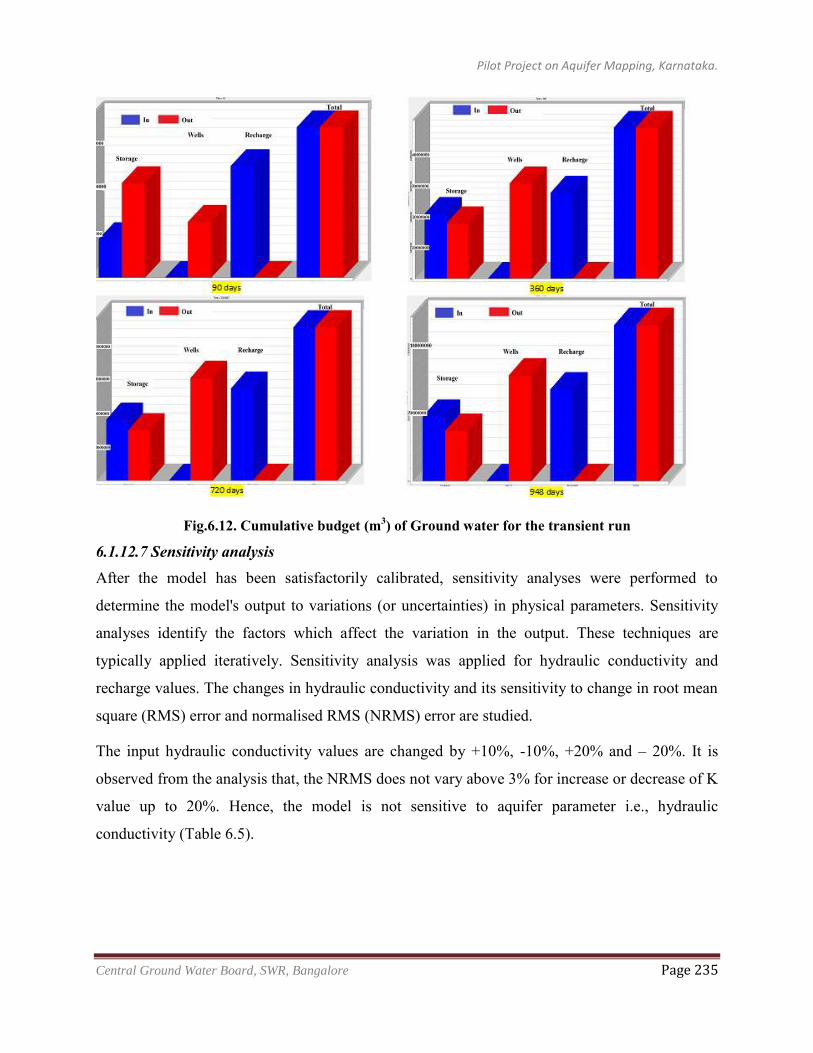
Pilot Project on Aquifer Mapping, Karnataka.
Central Ground Water Board, SWR, Bangalore Page 235
Fig.6.12. Cumulative budget (m3) of Ground water for the transient run
6.1.12.7 Sensitivity analysis After the model has been satisfactorily calibrated, sensitivity analyses were performed to
determine the model's output to variations (or uncertainties) in physical parameters. Sensitivity
analyses identify the factors which affect the variation in the output. These techniques are
typically applied iteratively. Sensitivity analysis was applied for hydraulic conductivity and
recharge values. The changes in hydraulic conductivity and its sensitivity to change in root mean
square (RMS) error and normalised RMS (NRMS) error are studied.
The input hydraulic conductivity values are changed by +10%, -10%, +20% and – 20%. It is
observed from the analysis that, the NRMS does not vary above 3% for increase or decrease of K
value up to 20%. Hence, the model is not sensitive to aquifer parameter i.e., hydraulic
conductivity (Table 6.5).
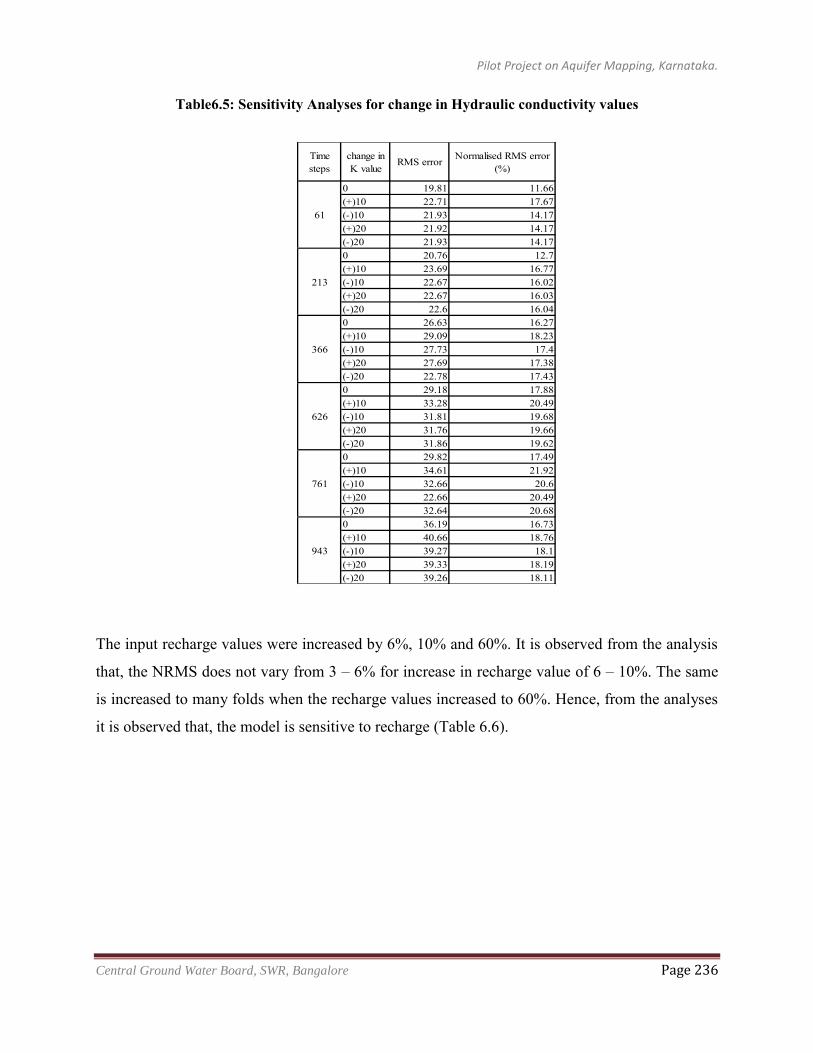
Pilot Project on Aquifer Mapping, Karnataka.
Central Ground Water Board, SWR, Bangalore Page 236
Table6.5: Sensitivity Analyses for change in Hydraulic conductivity values
The input recharge values were increased by 6%, 10% and 60%. It is observed from the analysis
that, the NRMS does not vary from 3 – 6% for increase in recharge value of 6 – 10%. The same
is increased to many folds when the recharge values increased to 60%. Hence, from the analyses
it is observed that, the model is sensitive to recharge (Table 6.6).
Time steps
change in K value
RMS error Normalised RMS error (%)
0 19.81 11.66(+)10 22.71 17.67(-)10 21.93 14.17(+)20 21.92 14.17(-)20 21.93 14.170 20.76 12.7(+)10 23.69 16.77(-)10 22.67 16.02(+)20 22.67 16.03(-)20 22.6 16.040 26.63 16.27(+)10 29.09 18.23(-)10 27.73 17.4(+)20 27.69 17.38(-)20 22.78 17.430 29.18 17.88(+)10 33.28 20.49(-)10 31.81 19.68(+)20 31.76 19.66(-)20 31.86 19.620 29.82 17.49(+)10 34.61 21.92(-)10 32.66 20.6(+)20 22.66 20.49(-)20 32.64 20.680 36.19 16.73(+)10 40.66 18.76(-)10 39.27 18.1(+)20 39.33 18.19(-)20 39.26 18.11
943
61
213
366
626
761
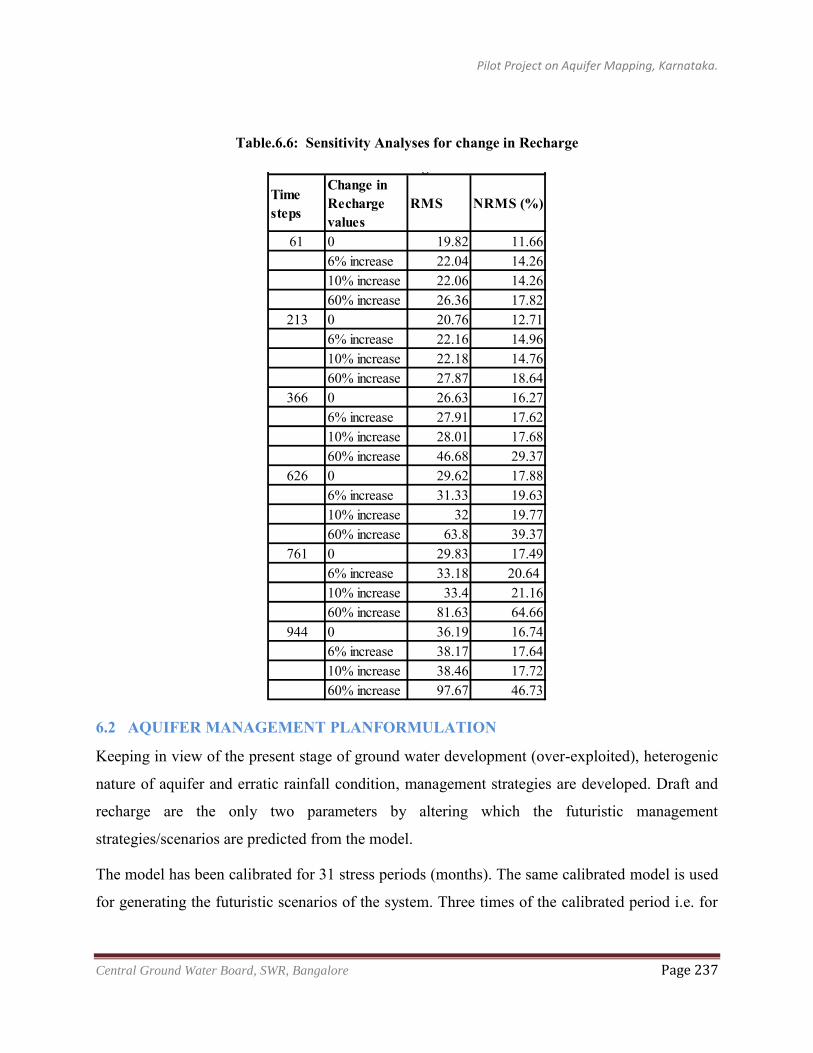
Pilot Project on Aquifer Mapping, Karnataka.
Central Ground Water Board, SWR, Bangalore Page 237
Table.6.6: Sensitivity Analyses for change in Recharge
6.2 AQUIFER MANAGEMENT PLANFORMULATION
Keeping in view of the present stage of ground water development (over-exploited), heterogenic
nature of aquifer and erratic rainfall condition, management strategies are developed. Draft and
recharge are the only two parameters by altering which the futuristic management
strategies/scenarios are predicted from the model.
The model has been calibrated for 31 stress periods (months). The same calibrated model is used
for generating the futuristic scenarios of the system. Three times of the calibrated period i.e. for
Time steps
Change in Recharge values
RMS NRMS (%)
61 0 19.82 11.666% increase 22.04 14.2610% increase 22.06 14.2660% increase 26.36 17.82
213 0 20.76 12.716% increase 22.16 14.9610% increase 22.18 14.7660% increase 27.87 18.64
366 0 26.63 16.276% increase 27.91 17.6210% increase 28.01 17.6860% increase 46.68 29.37
626 0 29.62 17.886% increase 31.33 19.6310% increase 32 19.7760% increase 63.8 39.37
761 0 29.83 17.496% increase 33.18 20.64 10% increase 33.4 21.1660% increase 81.63 64.66
944 0 36.19 16.746% increase 38.17 17.6410% increase 38.46 17.7260% increase 97.67 46.73
Table.6.6. Sensitivity Analysis for change in Recharge
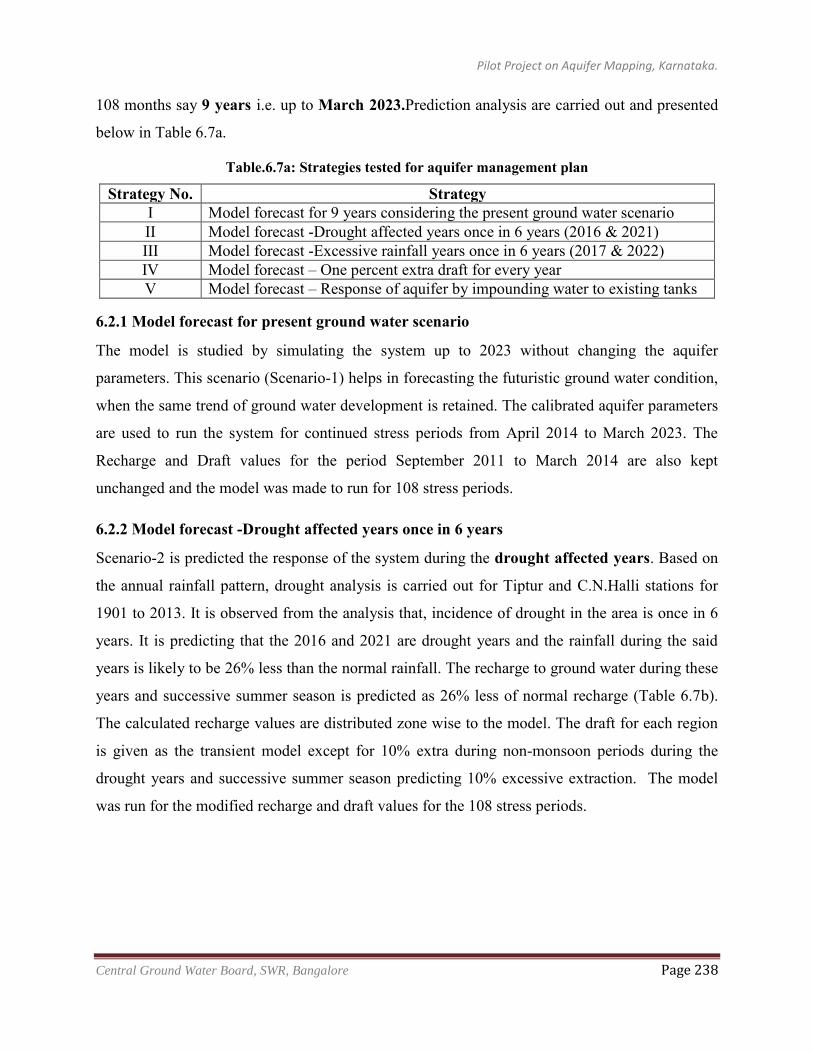
Pilot Project on Aquifer Mapping, Karnataka.
Central Ground Water Board, SWR, Bangalore Page 238
108 months say 9 years i.e. up to March 2023.Prediction analysis are carried out and presented
below in Table 6.7a.
Table.6.7a: Strategies tested for aquifer management plan
Strategy No. Strategy I Model forecast for 9 years considering the present ground water scenario II Model forecast -Drought affected years once in 6 years (2016 & 2021) III Model forecast -Excessive rainfall years once in 6 years (2017 & 2022) IV Model forecast – One percent extra draft for every year V Model forecast – Response of aquifer by impounding water to existing tanks
6.2.1 Model forecast for present ground water scenario
The model is studied by simulating the system up to 2023 without changing the aquifer
parameters. This scenario (Scenario-1) helps in forecasting the futuristic ground water condition,
when the same trend of ground water development is retained. The calibrated aquifer parameters
are used to run the system for continued stress periods from April 2014 to March 2023. The
Recharge and Draft values for the period September 2011 to March 2014 are also kept
unchanged and the model was made to run for 108 stress periods.
6.2.2 Model forecast -Drought affected years once in 6 years
Scenario-2 is predicted the response of the system during the drought affected years. Based on
the annual rainfall pattern, drought analysis is carried out for Tiptur and C.N.Halli stations for
1901 to 2013. It is observed from the analysis that, incidence of drought in the area is once in 6
years. It is predicting that the 2016 and 2021 are drought years and the rainfall during the said
years is likely to be 26% less than the normal rainfall. The recharge to ground water during these
years and successive summer season is predicted as 26% less of normal recharge (Table 6.7b).
The calculated recharge values are distributed zone wise to the model. The draft for each region
is given as the transient model except for 10% extra during non-monsoon periods during the
drought years and successive summer season predicting 10% excessive extraction. The model
was run for the modified recharge and draft values for the 108 stress periods.
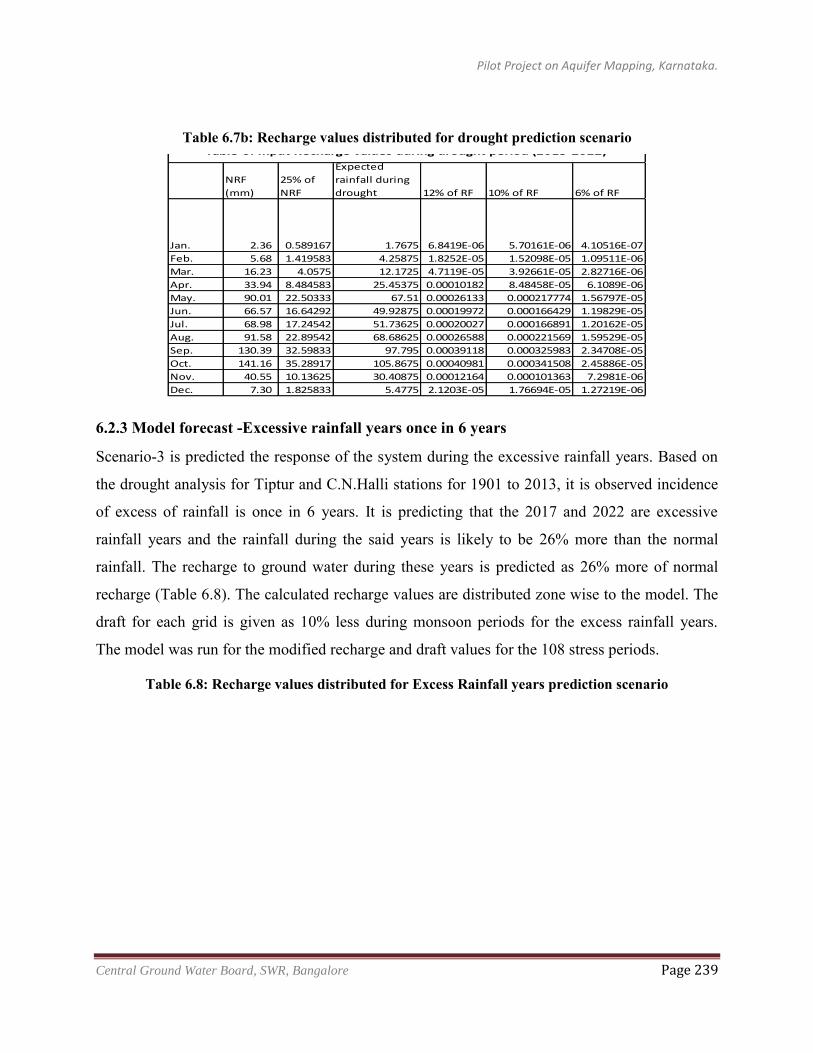
Pilot Project on Aquifer Mapping, Karnataka.
Central Ground Water Board, SWR, Bangalore Page 239
Table 6.7b: Recharge values distributed for drought prediction scenario
6.2.3 Model forecast -Excessive rainfall years once in 6 years
Scenario-3 is predicted the response of the system during the excessive rainfall years. Based on
the drought analysis for Tiptur and C.N.Halli stations for 1901 to 2013, it is observed incidence
of excess of rainfall is once in 6 years. It is predicting that the 2017 and 2022 are excessive
rainfall years and the rainfall during the said years is likely to be 26% more than the normal
rainfall. The recharge to ground water during these years is predicted as 26% more of normal
recharge (Table 6.8). The calculated recharge values are distributed zone wise to the model. The
draft for each grid is given as 10% less during monsoon periods for the excess rainfall years.
The model was run for the modified recharge and draft values for the 108 stress periods.
Table 6.8: Recharge values distributed for Excess Rainfall years prediction scenario
NRF
(mm)
25% of
NRF
Expected
rainfall during
drought 12% of RF 10% of RF 6% of RF
Jan. 2.36 0.589167 1.7675 6.8419E-06 5.70161E-06 4.10516E-07
Feb. 5.68 1.419583 4.25875 1.8252E-05 1.52098E-05 1.09511E-06
Mar. 16.23 4.0575 12.1725 4.7119E-05 3.92661E-05 2.82716E-06
Apr. 33.94 8.484583 25.45375 0.00010182 8.48458E-05 6.1089E-06
May. 90.01 22.50333 67.51 0.00026133 0.000217774 1.56797E-05
Jun. 66.57 16.64292 49.92875 0.00019972 0.000166429 1.19829E-05
Jul. 68.98 17.24542 51.73625 0.00020027 0.000166891 1.20162E-05
Aug. 91.58 22.89542 68.68625 0.00026588 0.000221569 1.59529E-05
Sep. 130.39 32.59833 97.795 0.00039118 0.000325983 2.34708E-05
Oct. 141.16 35.28917 105.8675 0.00040981 0.000341508 2.45886E-05
Nov. 40.55 10.13625 30.40875 0.00012164 0.000101363 7.2981E-06
Dec. 7.30 1.825833 5.4775 2.1203E-05 1.76694E-05 1.27219E-06
Table-6: Input Recharge values during drought period (2015-2022)
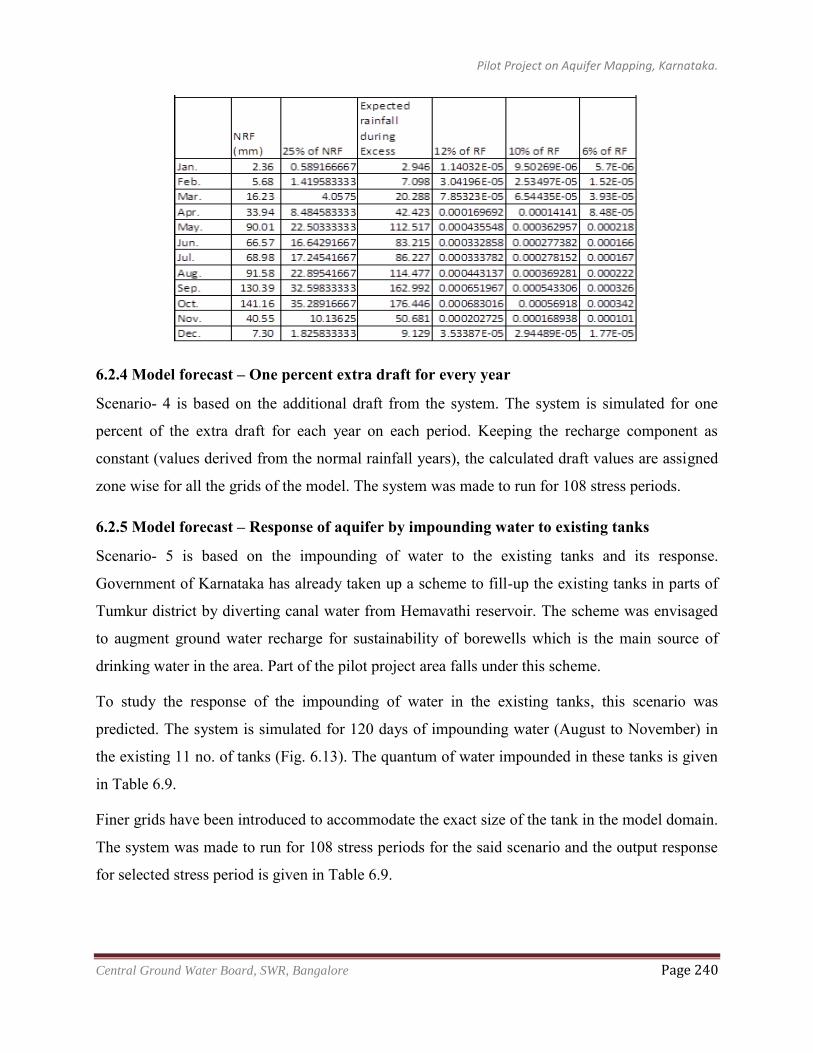
Pilot Project on Aquifer Mapping, Karnataka.
Central Ground Water Board, SWR, Bangalore Page 240
6.2.4 Model forecast – One percent extra draft for every year
Scenario- 4 is based on the additional draft from the system. The system is simulated for one
percent of the extra draft for each year on each period. Keeping the recharge component as
constant (values derived from the normal rainfall years), the calculated draft values are assigned
zone wise for all the grids of the model. The system was made to run for 108 stress periods.
6.2.5 Model forecast – Response of aquifer by impounding water to existing tanks
Scenario- 5 is based on the impounding of water to the existing tanks and its response.
Government of Karnataka has already taken up a scheme to fill-up the existing tanks in parts of
Tumkur district by diverting canal water from Hemavathi reservoir. The scheme was envisaged
to augment ground water recharge for sustainability of borewells which is the main source of
drinking water in the area. Part of the pilot project area falls under this scheme.
To study the response of the impounding of water in the existing tanks, this scenario was
predicted. The system is simulated for 120 days of impounding water (August to November) in
the existing 11 no. of tanks (Fig. 6.13). The quantum of water impounded in these tanks is given
in Table 6.9.
Finer grids have been introduced to accommodate the exact size of the tank in the model domain.
The system was made to run for 108 stress periods for the said scenario and the output response
for selected stress period is given in Table 6.9.
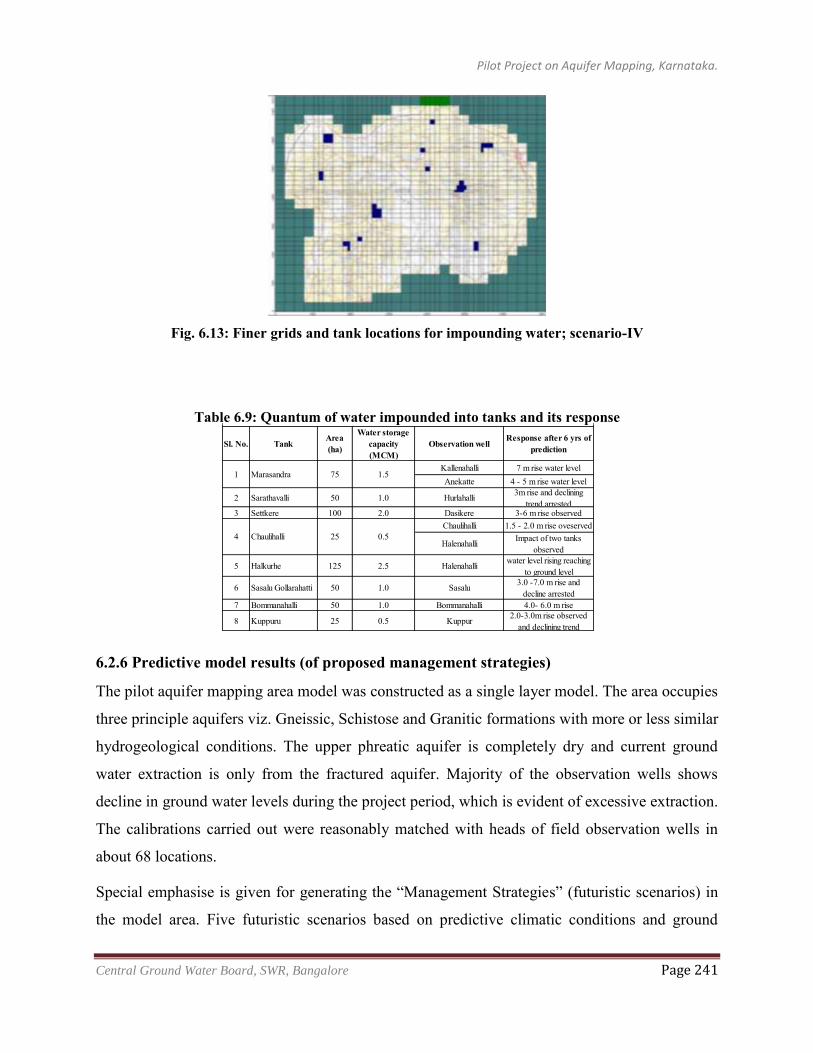
Pilot Project on Aquifer Mapping, Karnataka.
Central Ground Water Board, SWR, Bangalore Page 241
Fig. 6.13: Finer grids and tank locations for impounding water; scenario-IV
Table 6.9: Quantum of water impounded into tanks and its response
6.2.6 Predictive model results (of proposed management strategies)
The pilot aquifer mapping area model was constructed as a single layer model. The area occupies
three principle aquifers viz. Gneissic, Schistose and Granitic formations with more or less similar
hydrogeological conditions. The upper phreatic aquifer is completely dry and current ground
water extraction is only from the fractured aquifer. Majority of the observation wells shows
decline in ground water levels during the project period, which is evident of excessive extraction.
The calibrations carried out were reasonably matched with heads of field observation wells in
about 68 locations.
Special emphasise is given for generating the “Management Strategies” (futuristic scenarios) in
the model area. Five futuristic scenarios based on predictive climatic conditions and ground
Sl. No. TankArea (ha)
Water storage capacity (MCM)
Observation wellResponse after 6 yrs of
prediction
Kallenahalli 7 m rise water levelAnekatte 4 - 5 m rise water level
2 Sarathavalli 50 1.0 Hurlahalli 3m rise and declining trend arrested
3 Settkere 100 2.0 Dasikere 3-6 m rise observedChaulihalli 1.5 - 2.0 m rise oveserved
Halenahalli Impact of two tanks observed
5 Halkurhe 125 2.5 Halenahalli water level rising reaching to ground level
6 Sasalu Gollarahatti 50 1.0 Sasalu 3.0 -7.0 m rise and decline arrested
7 Bommanahalli 50 1.0 Bommanahalli 4.0- 6.0 m rise
8 Kuppuru 25 0.5 Kuppur 2.0-3.0m rise observed and declining trend
Chaulihalli4 25 0.5
Table-8.3: Response of the aquifer to impounding of water into the existing tanks for 120 days
Marasandra1 75 1.5
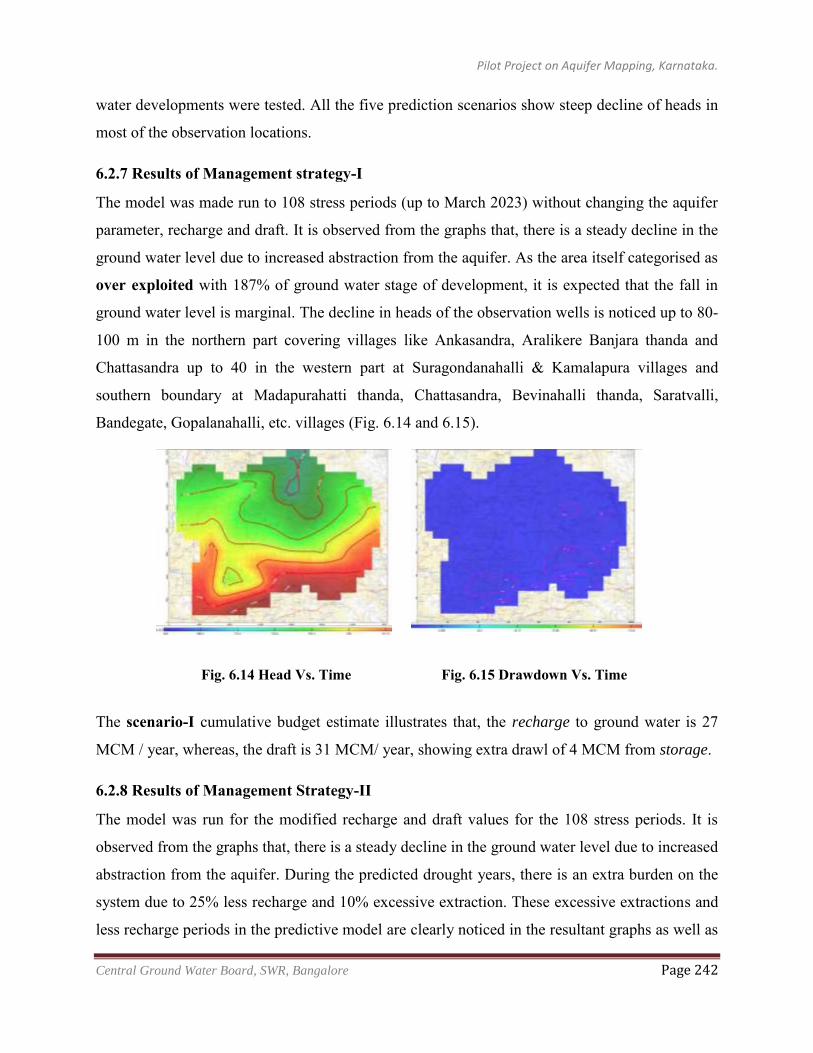
Pilot Project on Aquifer Mapping, Karnataka.
Central Ground Water Board, SWR, Bangalore Page 242
water developments were tested. All the five prediction scenarios show steep decline of heads in
most of the observation locations.
6.2.7 Results of Management strategy-I
The model was made run to 108 stress periods (up to March 2023) without changing the aquifer
parameter, recharge and draft. It is observed from the graphs that, there is a steady decline in the
ground water level due to increased abstraction from the aquifer. As the area itself categorised as
over exploited with 187% of ground water stage of development, it is expected that the fall in
ground water level is marginal. The decline in heads of the observation wells is noticed up to 80-
100 m in the northern part covering villages like Ankasandra, Aralikere Banjara thanda and
Chattasandra up to 40 in the western part at Suragondanahalli & Kamalapura villages and
southern boundary at Madapurahatti thanda, Chattasandra, Bevinahalli thanda, Saratvalli,
Bandegate, Gopalanahalli, etc. villages (Fig. 6.14 and 6.15).
Fig. 6.14 Head Vs. Time Fig. 6.15 Drawdown Vs. Time
The scenario-I cumulative budget estimate illustrates that, the recharge to ground water is 27
MCM / year, whereas, the draft is 31 MCM/ year, showing extra drawl of 4 MCM from storage.
6.2.8 Results of Management Strategy-II
The model was run for the modified recharge and draft values for the 108 stress periods. It is
observed from the graphs that, there is a steady decline in the ground water level due to increased
abstraction from the aquifer. During the predicted drought years, there is an extra burden on the
system due to 25% less recharge and 10% excessive extraction. These excessive extractions and
less recharge periods in the predictive model are clearly noticed in the resultant graphs as well as
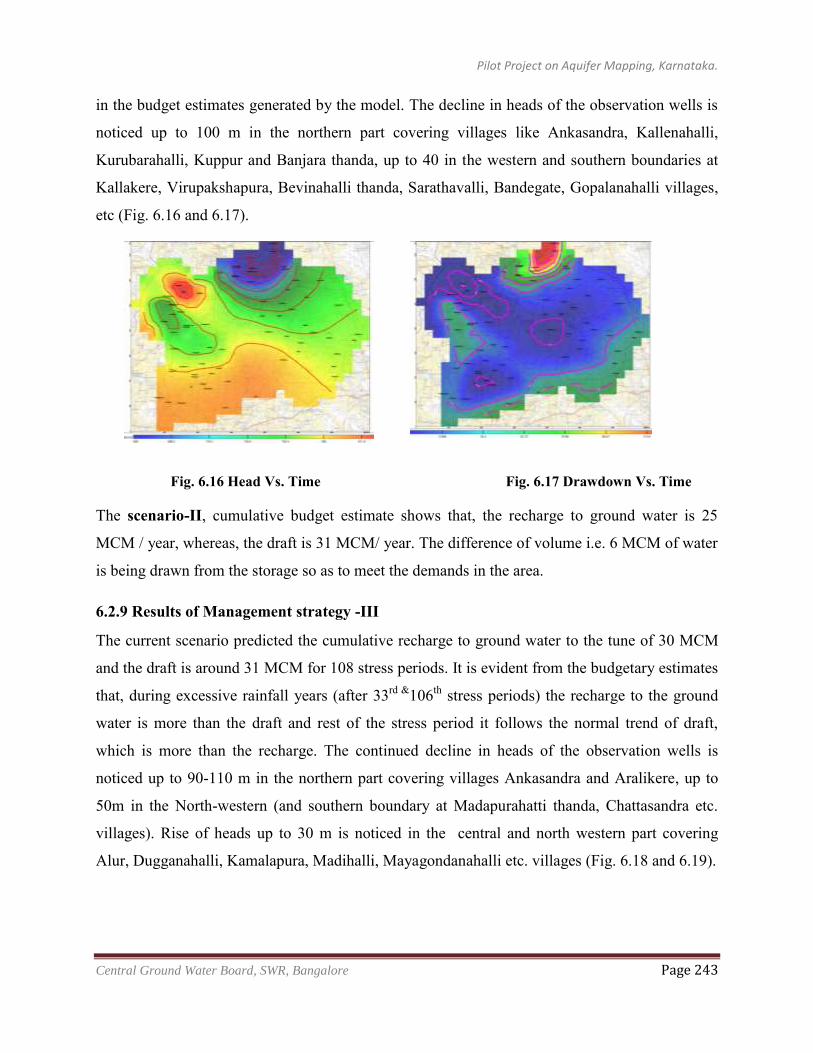
Pilot Project on Aquifer Mapping, Karnataka.
Central Ground Water Board, SWR, Bangalore Page 243
in the budget estimates generated by the model. The decline in heads of the observation wells is
noticed up to 100 m in the northern part covering villages like Ankasandra, Kallenahalli,
Kurubarahalli, Kuppur and Banjara thanda, up to 40 in the western and southern boundaries at
Kallakere, Virupakshapura, Bevinahalli thanda, Sarathavalli, Bandegate, Gopalanahalli villages,
etc (Fig. 6.16 and 6.17).
Fig. 6.16 Head Vs. Time Fig. 6.17 Drawdown Vs. Time
The scenario-II, cumulative budget estimate shows that, the recharge to ground water is 25
MCM / year, whereas, the draft is 31 MCM/ year. The difference of volume i.e. 6 MCM of water
is being drawn from the storage so as to meet the demands in the area.
6.2.9 Results of Management strategy -III
The current scenario predicted the cumulative recharge to ground water to the tune of 30 MCM
and the draft is around 31 MCM for 108 stress periods. It is evident from the budgetary estimates
that, during excessive rainfall years (after 33rd &106th stress periods) the recharge to the ground
water is more than the draft and rest of the stress period it follows the normal trend of draft,
which is more than the recharge. The continued decline in heads of the observation wells is
noticed up to 90-110 m in the northern part covering villages Ankasandra and Aralikere, up to
50m in the North-western (and southern boundary at Madapurahatti thanda, Chattasandra etc.
villages). Rise of heads up to 30 m is noticed in the central and north western part covering
Alur, Dugganahalli, Kamalapura, Madihalli, Mayagondanahalli etc. villages (Fig. 6.18 and 6.19).
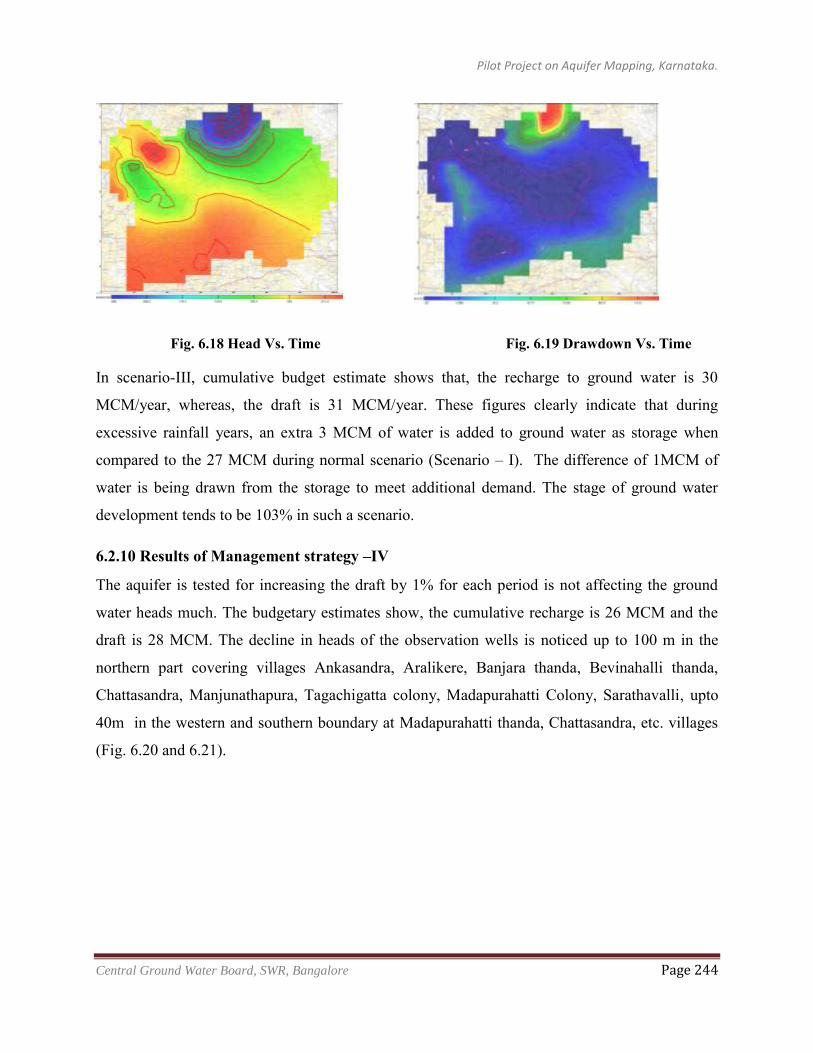
Pilot Project on Aquifer Mapping, Karnataka.
Central Ground Water Board, SWR, Bangalore Page 244
Fig. 6.18 Head Vs. Time Fig. 6.19 Drawdown Vs. Time
In scenario-III, cumulative budget estimate shows that, the recharge to ground water is 30
MCM/year, whereas, the draft is 31 MCM/year. These figures clearly indicate that during
excessive rainfall years, an extra 3 MCM of water is added to ground water as storage when
compared to the 27 MCM during normal scenario (Scenario – I). The difference of 1MCM of
water is being drawn from the storage to meet additional demand. The stage of ground water
development tends to be 103% in such a scenario.
6.2.10 Results of Management strategy –IV
The aquifer is tested for increasing the draft by 1% for each period is not affecting the ground
water heads much. The budgetary estimates show, the cumulative recharge is 26 MCM and the
draft is 28 MCM. The decline in heads of the observation wells is noticed up to 100 m in the
northern part covering villages Ankasandra, Aralikere, Banjara thanda, Bevinahalli thanda,
Chattasandra, Manjunathapura, Tagachigatta colony, Madapurahatti Colony, Sarathavalli, upto
40m in the western and southern boundary at Madapurahatti thanda, Chattasandra, etc. villages
(Fig. 6.20 and 6.21).
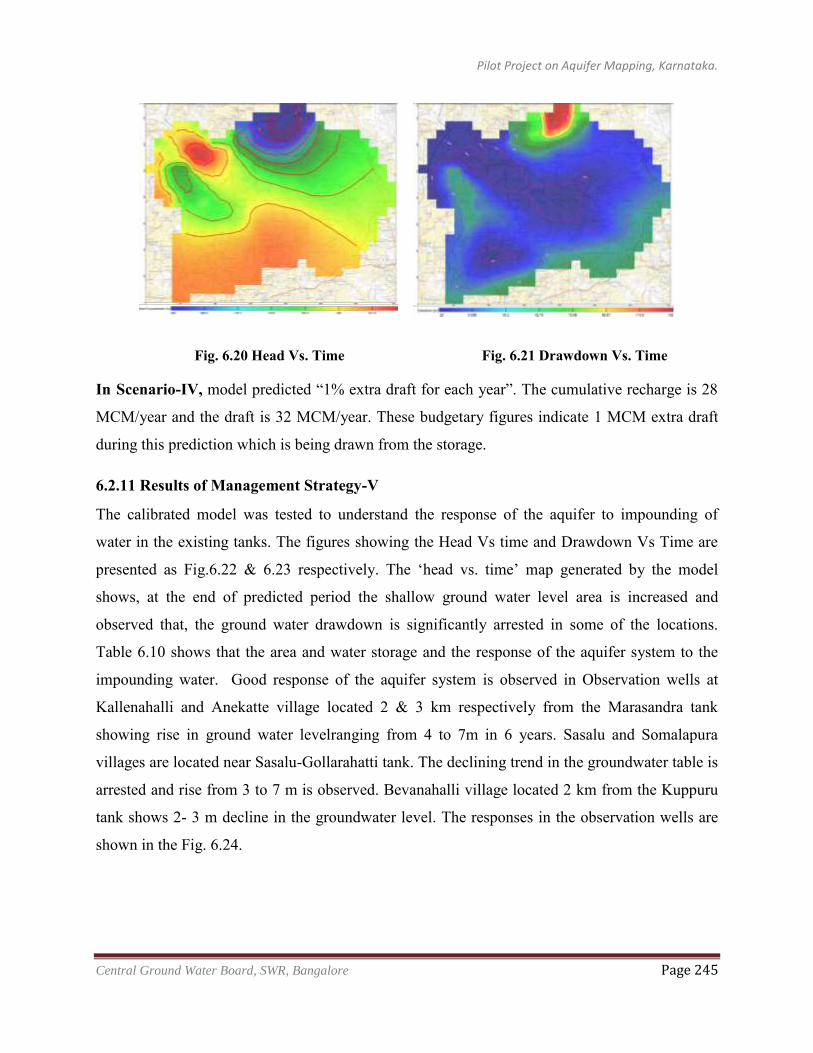
Pilot Project on Aquifer Mapping, Karnataka.
Central Ground Water Board, SWR, Bangalore Page 245
Fig. 6.20 Head Vs. Time Fig. 6.21 Drawdown Vs. Time
In Scenario-IV, model predicted “1% extra draft for each year”. The cumulative recharge is 28
MCM/year and the draft is 32 MCM/year. These budgetary figures indicate 1 MCM extra draft
during this prediction which is being drawn from the storage.
6.2.11 Results of Management Strategy-V
The calibrated model was tested to understand the response of the aquifer to impounding of
water in the existing tanks. The figures showing the Head Vs time and Drawdown Vs Time are
presented as Fig.6.22 & 6.23 respectively. The ‘head vs. time’ map generated by the model
shows, at the end of predicted period the shallow ground water level area is increased and
observed that, the ground water drawdown is significantly arrested in some of the locations.
Table 6.10 shows that the area and water storage and the response of the aquifer system to the
impounding water. Good response of the aquifer system is observed in Observation wells at
Kallenahalli and Anekatte village located 2 & 3 km respectively from the Marasandra tank
showing rise in ground water levelranging from 4 to 7m in 6 years. Sasalu and Somalapura
villages are located near Sasalu-Gollarahatti tank. The declining trend in the groundwater table is
arrested and rise from 3 to 7 m is observed. Bevanahalli village located 2 km from the Kuppuru
tank shows 2- 3 m decline in the groundwater level. The responses in the observation wells are
shown in the Fig. 6.24.
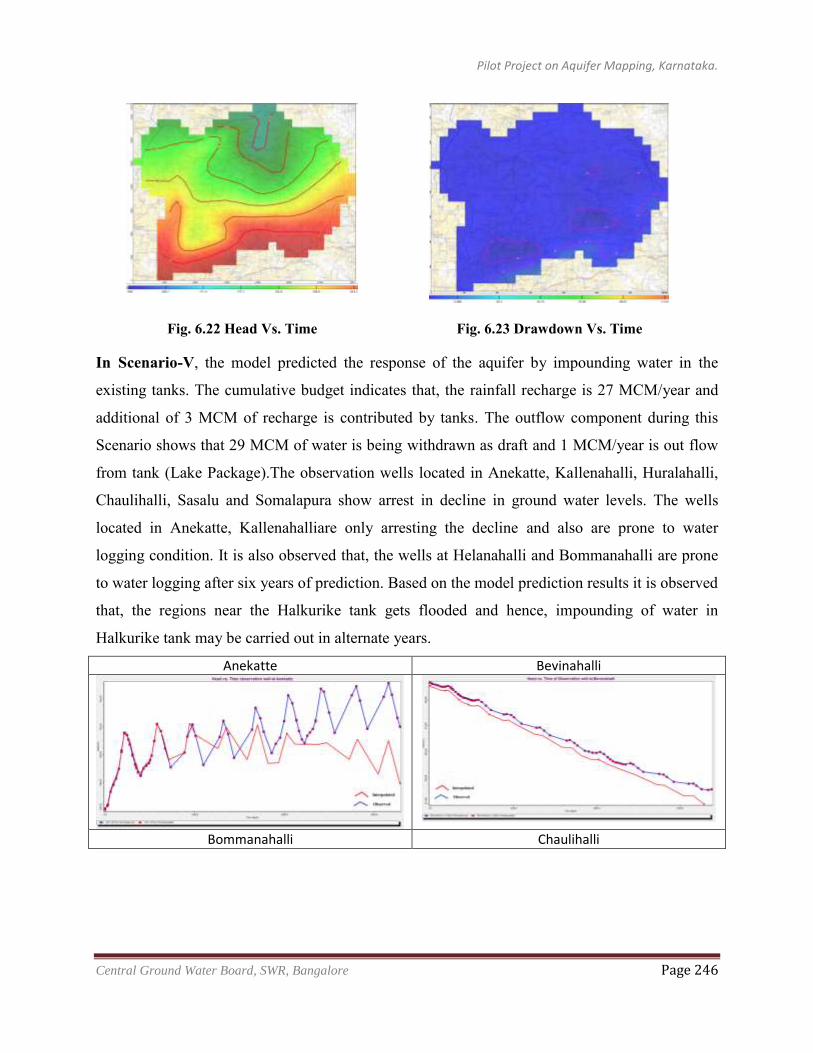
Pilot Project on Aquifer Mapping, Karnataka.
Central Ground Water Board, SWR, Bangalore Page 246
Fig. 6.22 Head Vs. Time Fig. 6.23 Drawdown Vs. Time
In Scenario-V, the model predicted the response of the aquifer by impounding water in the
existing tanks. The cumulative budget indicates that, the rainfall recharge is 27 MCM/year and
additional of 3 MCM of recharge is contributed by tanks. The outflow component during this
Scenario shows that 29 MCM of water is being withdrawn as draft and 1 MCM/year is out flow
from tank (Lake Package).The observation wells located in Anekatte, Kallenahalli, Huralahalli,
Chaulihalli, Sasalu and Somalapura show arrest in decline in ground water levels. The wells
located in Anekatte, Kallenahalliare only arresting the decline and also are prone to water
logging condition. It is also observed that, the wells at Helanahalli and Bommanahalli are prone
to water logging after six years of prediction. Based on the model prediction results it is observed
that, the regions near the Halkurike tank gets flooded and hence, impounding of water in
Halkurike tank may be carried out in alternate years.
Anekatte Bevinahalli
Bommanahalli Chaulihalli
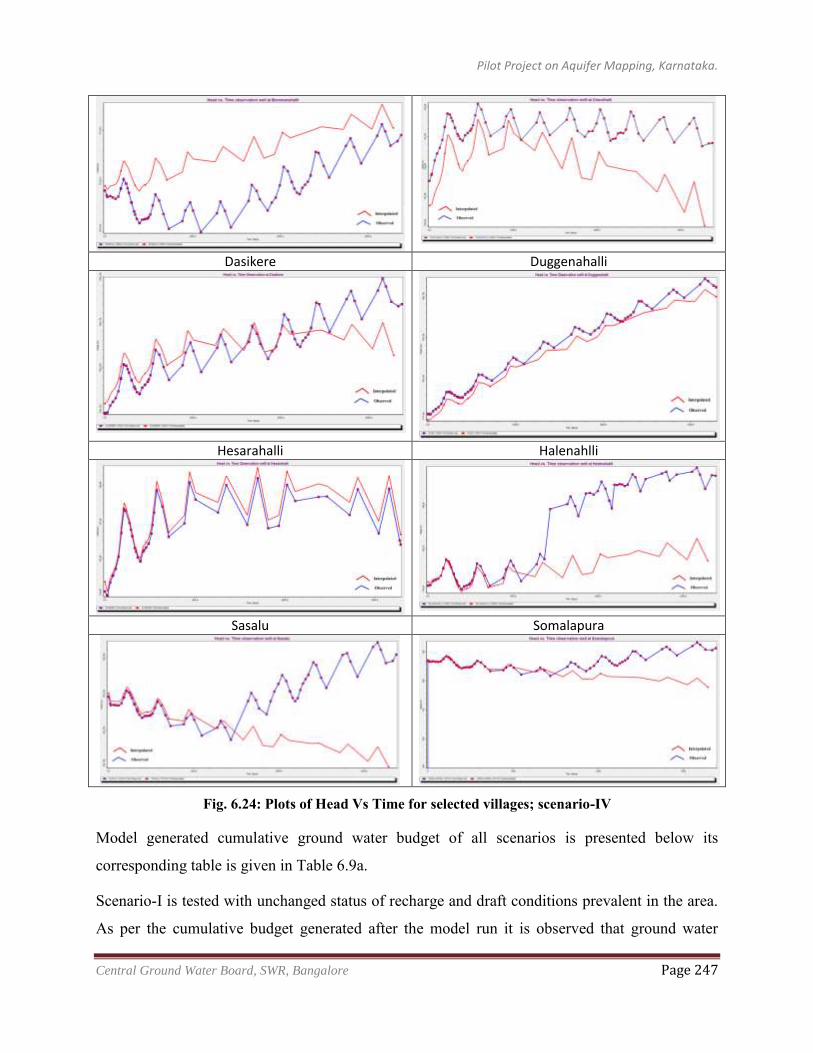
Pilot Project on Aquifer Mapping, Karnataka.
Central Ground Water Board, SWR, Bangalore Page 247
Dasikere Duggenahalli
Hesarahalli Halenahlli
Sasalu Somalapura
Fig. 6.24: Plots of Head Vs Time for selected villages; scenario-IV
Model generated cumulative ground water budget of all scenarios is presented below its
corresponding table is given in Table 6.9a.
Scenario-I is tested with unchanged status of recharge and draft conditions prevalent in the area.
As per the cumulative budget generated after the model run it is observed that ground water
Pilot Project on Aquifer Mapping, Karnataka.
Central Ground Water Board, SWR, Bangalore Page 248
recharge is 27 MCM/year and draft (wells) 31 MCM / year. The overall water budget is balanced
by taking in 15 MCM of water from the storage and giving out 12 MCM from the system. This
almost coincides with the ground water development trend calculated for the region.
Scenario-II is tested with drought prevalent years during the prediction period (2016 & 2022).
Drought is predicted once in 6 years and the reduced recharge is projected during these years
against the same draft. After the successful run, the cumulative budget shows that an amount of
25 MCM is getting recharged and 31 MCM draft. This indicates that during the drought affected
years the system is taking less 2 MCM when it is compared with projected normal ground water
development.
In scenario-III, which made to run with excessive rainfall during the period indicates recharge to
the ground water is 30MCM and the draft is 31 MCM/year. It appears that excess recharge of 3
MCM is contributed from the excessive rainfall pattern. The overall draft quantity is unchanged
with 31 MCM/year. 45 MCM of water is entering in to the system and 45 MCM is going out
from the system, which is maximum utilisation, when compared with other scenarios.
Scenario-IV, model tested with 1% extra draft/year. The cumulative budget shows that an
amount of 28 MCM is getting recharged and 32 MCM is draft. This budget indicates that the
recharge is continued with the same trend as it is observed during the normal period. An extra
1MCM of draft is observed during this scenario and the system is taking less 2 MCM recharge.
This clearly indicates that during such a situation, the extra burden on the system is balanced by
withdrawing water from the storage.
In scenario-V, impounding water into existing tanks, the cumulative budget shows that there is
extra input into the ground water by means of Lake (ponds) Recharge other than the regular
recharge. Lake contributes 3 MCM of water to the system apart from regular 27 MCM of
recharge whereas the ground water draft from the system is 29 MCM /year which is less than the
regular draft. This indicates that there is less usage of ground water when surface water facilities
are available.
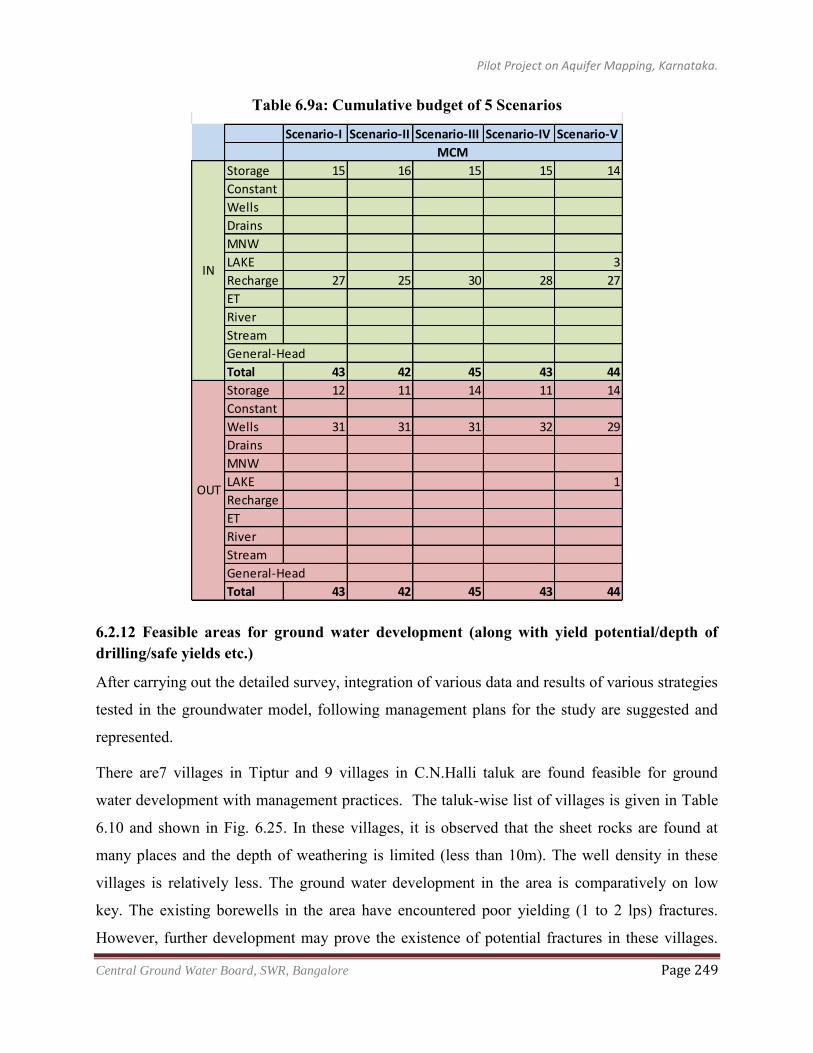
Pilot Project on Aquifer Mapping, Karnataka.
Central Ground Water Board, SWR, Bangalore Page 249
Table 6.9a: Cumulative budget of 5 Scenarios
6.2.12 Feasible areas for ground water development (along with yield potential/depth of drilling/safe yields etc.)
After carrying out the detailed survey, integration of various data and results of various strategies
tested in the groundwater model, following management plans for the study are suggested and
represented.
There are7 villages in Tiptur and 9 villages in C.N.Halli taluk are found feasible for ground
water development with management practices. The taluk-wise list of villages is given in Table
6.10 and shown in Fig. 6.25. In these villages, it is observed that the sheet rocks are found at
many places and the depth of weathering is limited (less than 10m). The well density in these
villages is relatively less. The ground water development in the area is comparatively on low
key. The existing borewells in the area have encountered poor yielding (1 to 2 lps) fractures.
However, further development may prove the existence of potential fractures in these villages.
Scenario-I Scenario-II Scenario-III Scenario-IV Scenario-V
Storage 15 16 15 15 14
Constant
Wells
Drains
MNW
LAKE 3
Recharge 27 25 30 28 27
ET
River
Stream
General-Head
Total 43 42 45 43 44
Storage 12 11 14 11 14
Constant
Wells 31 31 31 32 29
Drains
MNW
LAKE 1
Recharge
ET
River
Stream
General-Head
Total 43 42 45 43 44
MCM
IN
OUT
Cumulative budget of 5 scenarios
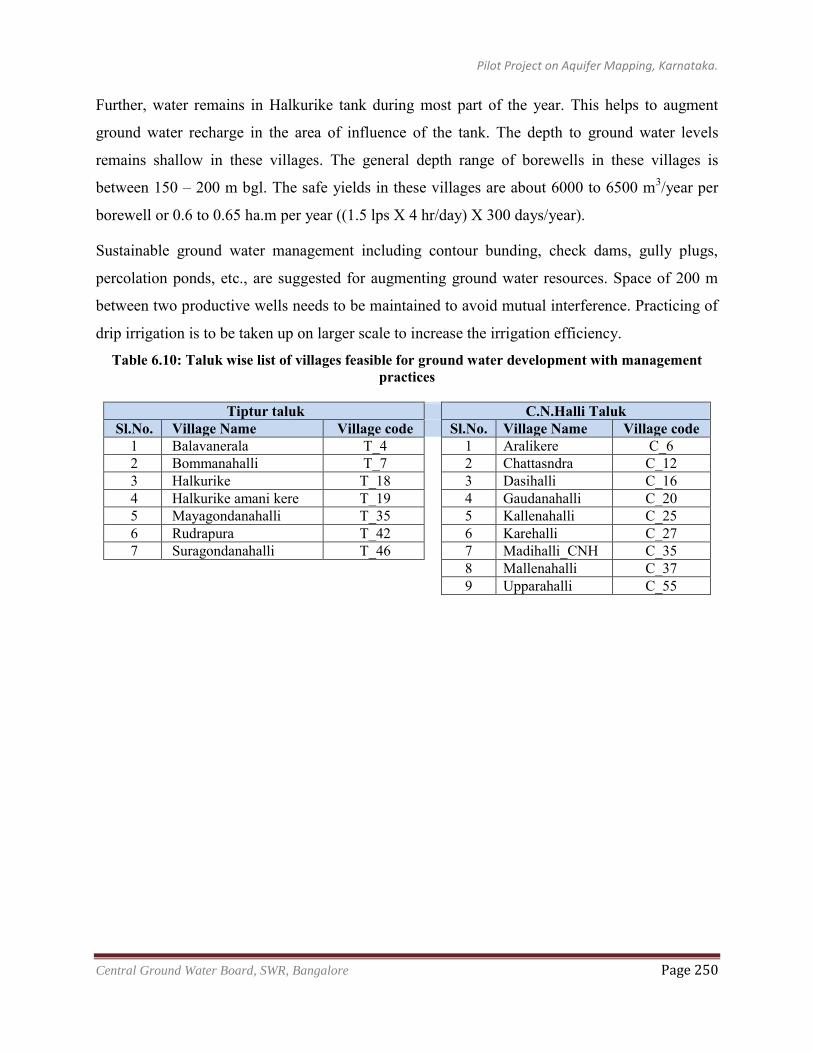
Pilot Project on Aquifer Mapping, Karnataka.
Central Ground Water Board, SWR, Bangalore Page 250
Further, water remains in Halkurike tank during most part of the year. This helps to augment
ground water recharge in the area of influence of the tank. The depth to ground water levels
remains shallow in these villages. The general depth range of borewells in these villages is
between 150 – 200 m bgl. The safe yields in these villages are about 6000 to 6500 m3/year per
borewell or 0.6 to 0.65 ha.m per year ((1.5 lps X 4 hr/day) X 300 days/year).
Sustainable ground water management including contour bunding, check dams, gully plugs,
percolation ponds, etc., are suggested for augmenting ground water resources. Space of 200 m
between two productive wells needs to be maintained to avoid mutual interference. Practicing of
drip irrigation is to be taken up on larger scale to increase the irrigation efficiency.
Table 6.10: Taluk wise list of villages feasible for ground water development with management practices
Tiptur taluk C.N.Halli Taluk
Sl.No. Village Name Village code
Sl.No. Village Name Village code 1 Balavanerala T_4
1 Aralikere C_6
2 Bommanahalli T_7
2 Chattasndra C_12 3 Halkurike T_18
3 Dasihalli C_16
4 Halkurike amani kere T_19
4 Gaudanahalli C_20 5 Mayagondanahalli T_35
5 Kallenahalli C_25
6 Rudrapura T_42
6 Karehalli C_27 7 Suragondanahalli T_46
7 Madihalli_CNH C_35
8 Mallenahalli C_37
9 Upparahalli C_55
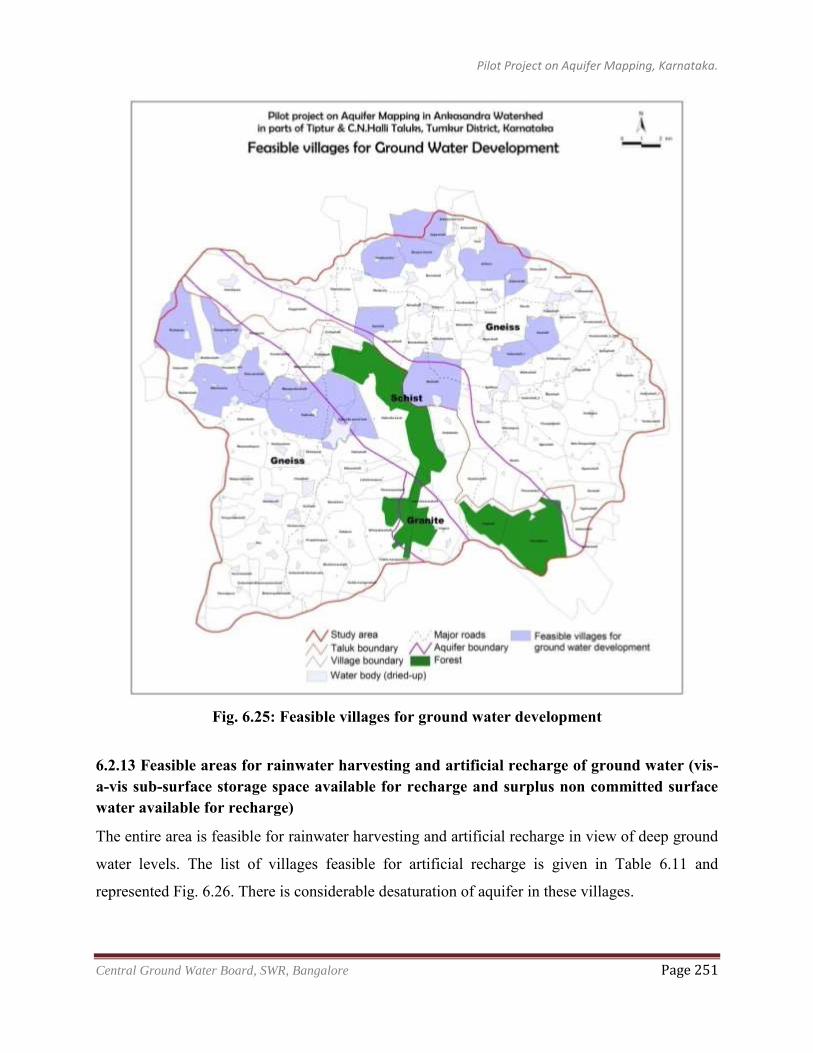
Pilot Project on Aquifer Mapping, Karnataka.
Central Ground Water Board, SWR, Bangalore Page 251
Fig. 6.25: Feasible villages for ground water development
6.2.13 Feasible areas for rainwater harvesting and artificial recharge of ground water (vis-a-vis sub-surface storage space available for recharge and surplus non committed surface water available for recharge)
The entire area is feasible for rainwater harvesting and artificial recharge in view of deep ground
water levels. The list of villages feasible for artificial recharge is given in Table 6.11 and
represented Fig. 6.26. There is considerable desaturation of aquifer in these villages.
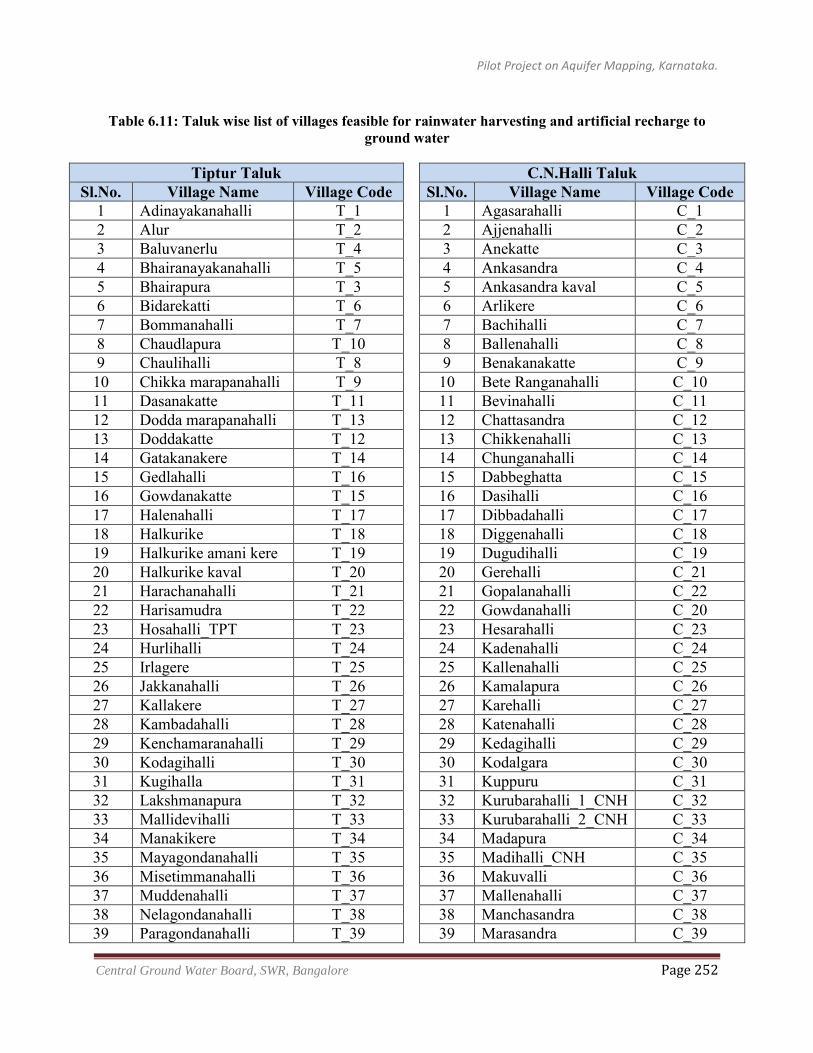
Pilot Project on Aquifer Mapping, Karnataka.
Central Ground Water Board, SWR, Bangalore Page 252
Table 6.11: Taluk wise list of villages feasible for rainwater harvesting and artificial recharge to
ground water
Tiptur Taluk C.N.Halli Taluk Sl.No. Village Name Village Code
Sl.No. Village Name Village Code
1 Adinayakanahalli T_1
1 Agasarahalli C_1 2 Alur T_2
2 Ajjenahalli C_2
3 Baluvanerlu T_4
3 Anekatte C_3 4 Bhairanayakanahalli T_5
4 Ankasandra C_4
5 Bhairapura T_3
5 Ankasandra kaval C_5 6 Bidarekatti T_6
6 Arlikere C_6
7 Bommanahalli T_7
7 Bachihalli C_7 8 Chaudlapura T_10
8 Ballenahalli C_8
9 Chaulihalli T_8
9 Benakanakatte C_9 10 Chikka marapanahalli T_9
10 Bete Ranganahalli C_10
11 Dasanakatte T_11
11 Bevinahalli C_11 12 Dodda marapanahalli T_13
12 Chattasandra C_12
13 Doddakatte T_12
13 Chikkenahalli C_13 14 Gatakanakere T_14
14 Chunganahalli C_14
15 Gedlahalli T_16
15 Dabbeghatta C_15 16 Gowdanakatte T_15
16 Dasihalli C_16
17 Halenahalli T_17
17 Dibbadahalli C_17 18 Halkurike T_18
18 Diggenahalli C_18
19 Halkurike amani kere T_19
19 Dugudihalli C_19 20 Halkurike kaval T_20
20 Gerehalli C_21
21 Harachanahalli T_21
21 Gopalanahalli C_22 22 Harisamudra T_22
22 Gowdanahalli C_20
23 Hosahalli_TPT T_23
23 Hesarahalli C_23 24 Hurlihalli T_24
24 Kadenahalli C_24
25 Irlagere T_25
25 Kallenahalli C_25 26 Jakkanahalli T_26
26 Kamalapura C_26
27 Kallakere T_27
27 Karehalli C_27 28 Kambadahalli T_28
28 Katenahalli C_28
29 Kenchamaranahalli T_29
29 Kedagihalli C_29 30 Kodagihalli T_30
30 Kodalgara C_30
31 Kugihalla T_31
31 Kuppuru C_31 32 Lakshmanapura T_32
32 Kurubarahalli_1_CNH C_32
33 Mallidevihalli T_33
33 Kurubarahalli_2_CNH C_33 34 Manakikere T_34
34 Madapura C_34
35 Mayagondanahalli T_35
35 Madihalli_CNH C_35 36 Misetimmanahalli T_36
36 Makuvalli C_36
37 Muddenahalli T_37
37 Mallenahalli C_37 38 Nelagondanahalli T_38
38 Manchasandra C_38
39 Paragondanahalli T_39
39 Marasandra C_39
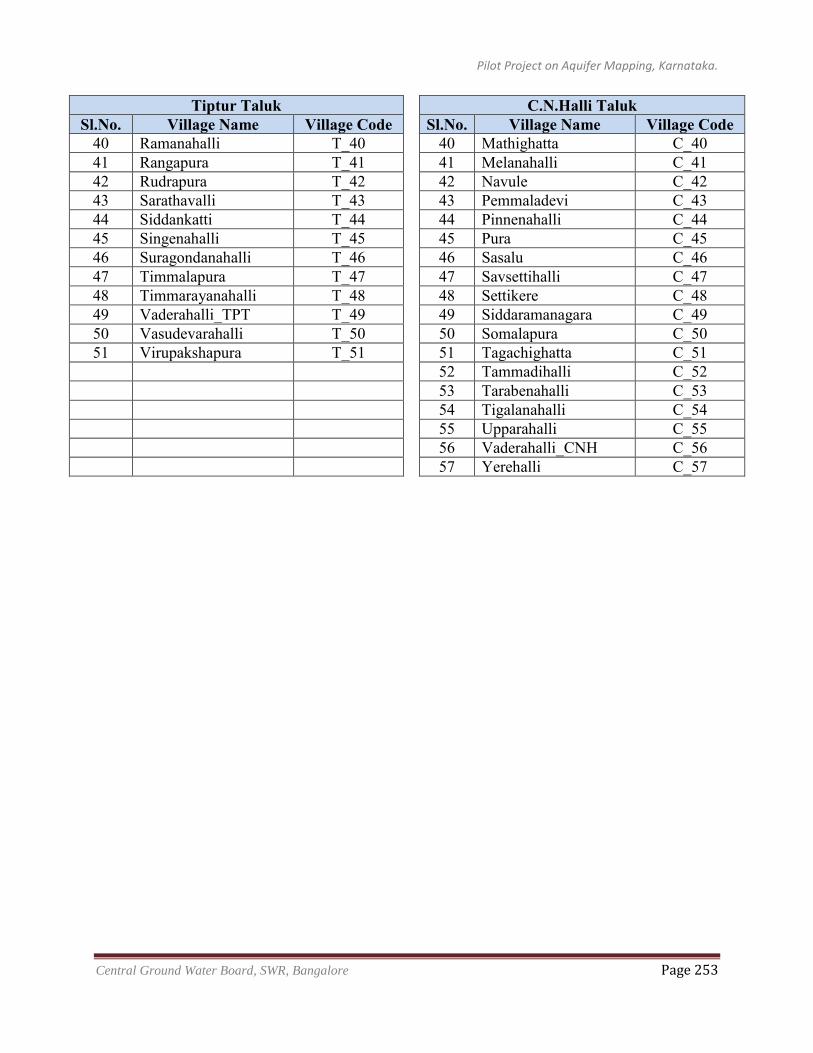
Pilot Project on Aquifer Mapping, Karnataka.
Central Ground Water Board, SWR, Bangalore Page 253
Tiptur Taluk C.N.Halli Taluk Sl.No. Village Name Village Code
Sl.No. Village Name Village Code
40 Ramanahalli T_40
40 Mathighatta C_40 41 Rangapura T_41
41 Melanahalli C_41
42 Rudrapura T_42
42 Navule C_42 43 Sarathavalli T_43
43 Pemmaladevi C_43
44 Siddankatti T_44
44 Pinnenahalli C_44 45 Singenahalli T_45
45 Pura C_45
46 Suragondanahalli T_46
46 Sasalu C_46 47 Timmalapura T_47
47 Savsettihalli C_47
48 Timmarayanahalli T_48
48 Settikere C_48 49 Vaderahalli_TPT T_49
49 Siddaramanagara C_49
50 Vasudevarahalli T_50
50 Somalapura C_50 51 Virupakshapura T_51
51 Tagachighatta C_51
52 Tammadihalli C_52
53 Tarabenahalli C_53
54 Tigalanahalli C_54
55 Upparahalli C_55
56 Vaderahalli_CNH C_56
57 Yerehalli C_57
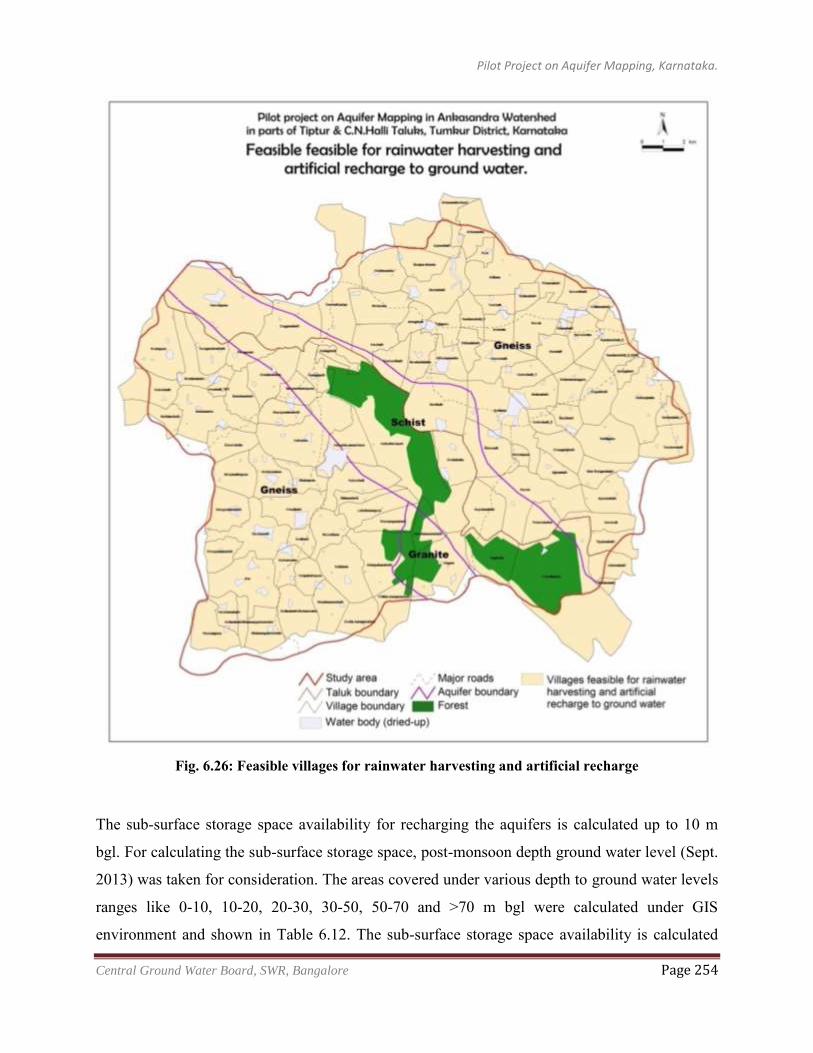
Pilot Project on Aquifer Mapping, Karnataka.
Central Ground Water Board, SWR, Bangalore Page 254
Fig. 6.26: Feasible villages for rainwater harvesting and artificial recharge
The sub-surface storage space availability for recharging the aquifers is calculated up to 10 m
bgl. For calculating the sub-surface storage space, post-monsoon depth ground water level (Sept.
2013) was taken for consideration. The areas covered under various depth to ground water levels
ranges like 0-10, 10-20, 20-30, 30-50, 50-70 and >70 m bgl were calculated under GIS
environment and shown in Table 6.12. The sub-surface storage space availability is calculated
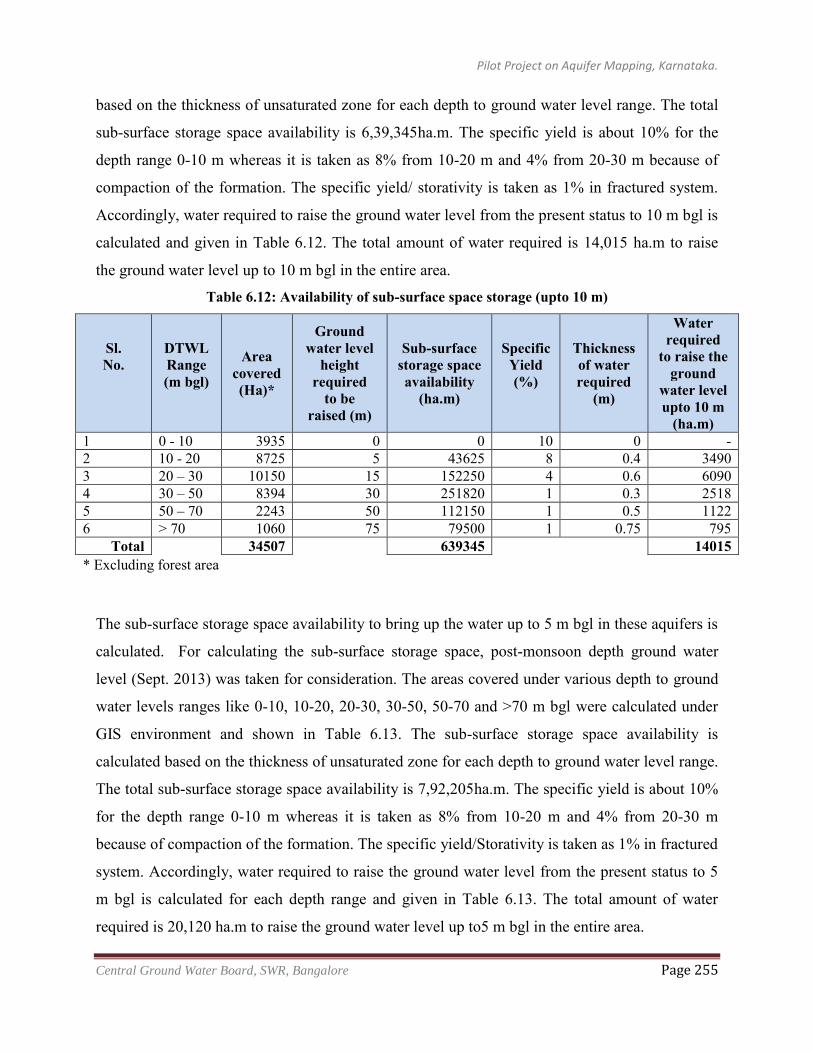
Pilot Project on Aquifer Mapping, Karnataka.
Central Ground Water Board, SWR, Bangalore Page 255
based on the thickness of unsaturated zone for each depth to ground water level range. The total
sub-surface storage space availability is 6,39,345ha.m. The specific yield is about 10% for the
depth range 0-10 m whereas it is taken as 8% from 10-20 m and 4% from 20-30 m because of
compaction of the formation. The specific yield/ storativity is taken as 1% in fractured system.
Accordingly, water required to raise the ground water level from the present status to 10 m bgl is
calculated and given in Table 6.12. The total amount of water required is 14,015 ha.m to raise
the ground water level up to 10 m bgl in the entire area.
Table 6.12: Availability of sub-surface space storage (upto 10 m)
Sl. No.
DTWL Range (m bgl)
Area covered (Ha)*
Ground water level
height required
to be raised (m)
Sub-surface storage space availability
(ha.m)
Specific Yield (%)
Thickness of water required
(m)
Water required
to raise the ground
water level upto 10 m
(ha.m) 1 0 - 10 3935 0 0 10 0 - 2 10 - 20 8725 5 43625 8 0.4 3490 3 20 – 30 10150 15 152250 4 0.6 6090 4 30 – 50 8394 30 251820 1 0.3 2518 5 50 – 70 2243 50 112150 1 0.5 1122 6 > 70 1060 75 79500 1 0.75 795
Total
34507
639345
14015 * Excluding forest area
The sub-surface storage space availability to bring up the water up to 5 m bgl in these aquifers is
calculated. For calculating the sub-surface storage space, post-monsoon depth ground water
level (Sept. 2013) was taken for consideration. The areas covered under various depth to ground
water levels ranges like 0-10, 10-20, 20-30, 30-50, 50-70 and >70 m bgl were calculated under
GIS environment and shown in Table 6.13. The sub-surface storage space availability is
calculated based on the thickness of unsaturated zone for each depth to ground water level range.
The total sub-surface storage space availability is 7,92,205ha.m. The specific yield is about 10%
for the depth range 0-10 m whereas it is taken as 8% from 10-20 m and 4% from 20-30 m
because of compaction of the formation. The specific yield/Storativity is taken as 1% in fractured
system. Accordingly, water required to raise the ground water level from the present status to 5
m bgl is calculated for each depth range and given in Table 6.13. The total amount of water
required is 20,120 ha.m to raise the ground water level up to5 m bgl in the entire area.
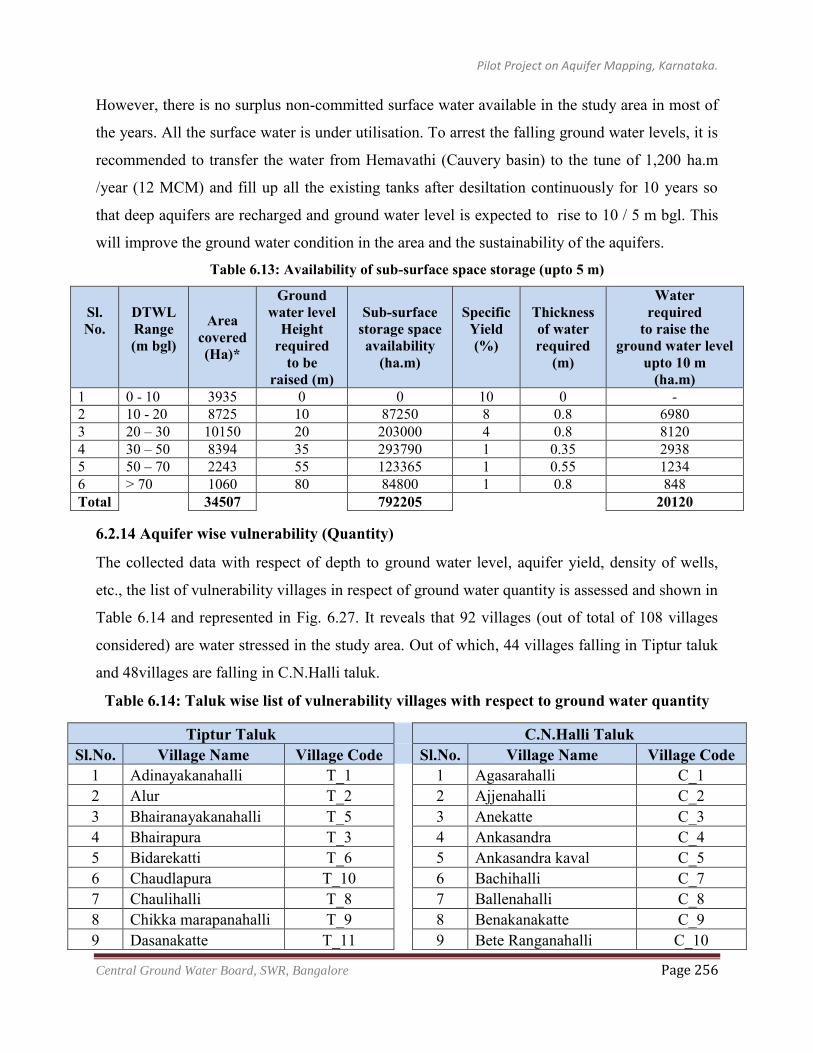
Pilot Project on Aquifer Mapping, Karnataka.
Central Ground Water Board, SWR, Bangalore Page 256
However, there is no surplus non-committed surface water available in the study area in most of
the years. All the surface water is under utilisation. To arrest the falling ground water levels, it is
recommended to transfer the water from Hemavathi (Cauvery basin) to the tune of 1,200 ha.m
/year (12 MCM) and fill up all the existing tanks after desiltation continuously for 10 years so
that deep aquifers are recharged and ground water level is expected to rise to 10 / 5 m bgl. This
will improve the ground water condition in the area and the sustainability of the aquifers.
Table 6.13: Availability of sub-surface space storage (upto 5 m)
Sl. No.
DTWL Range (m bgl)
Area covered (Ha)*
Ground water level
Height required
to be raised (m)
Sub-surface storage space availability
(ha.m)
Specific Yield (%)
Thickness of water required
(m)
Water required
to raise the ground water level
upto 10 m (ha.m)
1 0 - 10 3935 0 0 10 0 - 2 10 - 20 8725 10 87250 8 0.8 6980 3 20 – 30 10150 20 203000 4 0.8 8120 4 30 – 50 8394 35 293790 1 0.35 2938 5 50 – 70 2243 55 123365 1 0.55 1234 6 > 70 1060 80 84800 1 0.8 848 Total
34507
792205
20120
6.2.14 Aquifer wise vulnerability (Quantity)
The collected data with respect of depth to ground water level, aquifer yield, density of wells,
etc., the list of vulnerability villages in respect of ground water quantity is assessed and shown in
Table 6.14 and represented in Fig. 6.27. It reveals that 92 villages (out of total of 108 villages
considered) are water stressed in the study area. Out of which, 44 villages falling in Tiptur taluk
and 48villages are falling in C.N.Halli taluk.
Table 6.14: Taluk wise list of vulnerability villages with respect to ground water quantity
Tiptur Taluk
C.N.Halli Taluk Sl.No. Village Name Village Code
Sl.No. Village Name Village Code
1 Adinayakanahalli T_1
1 Agasarahalli C_1 2 Alur T_2
2 Ajjenahalli C_2
3 Bhairanayakanahalli T_5
3 Anekatte C_3 4 Bhairapura T_3
4 Ankasandra C_4
5 Bidarekatti T_6
5 Ankasandra kaval C_5 6 Chaudlapura T_10
6 Bachihalli C_7
7 Chaulihalli T_8
7 Ballenahalli C_8 8 Chikka marapanahalli T_9
8 Benakanakatte C_9
9 Dasanakatte T_11
9 Bete Ranganahalli C_10
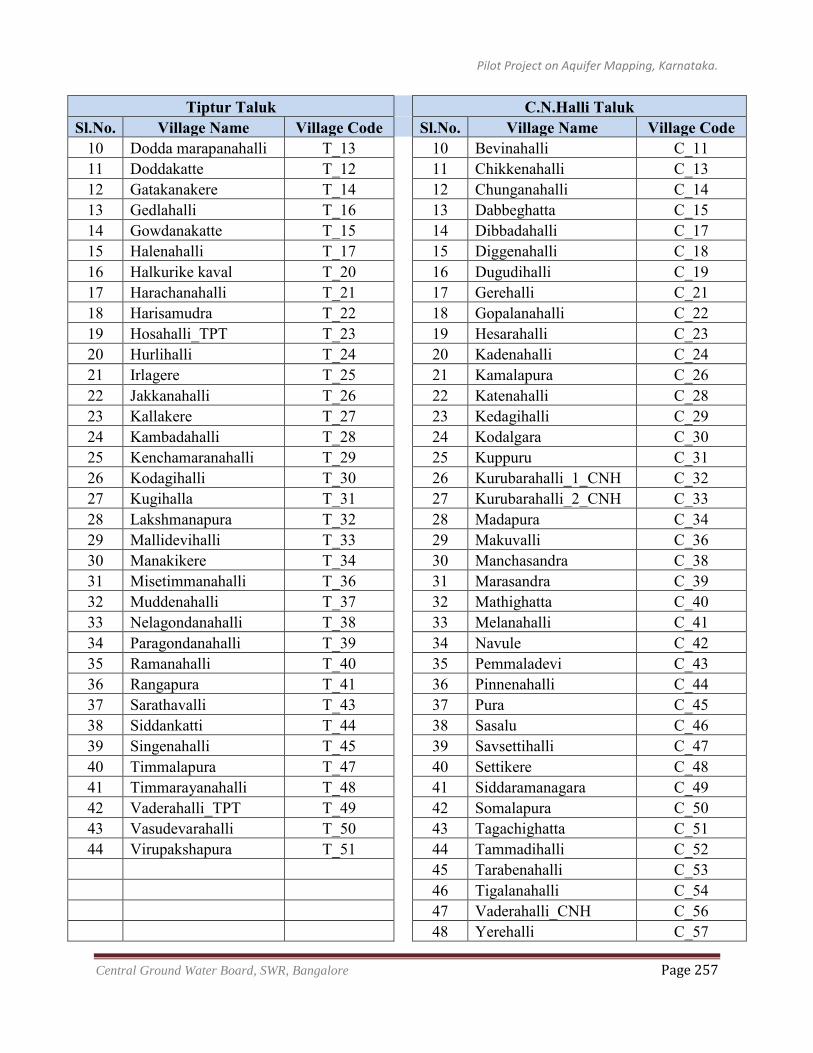
Pilot Project on Aquifer Mapping, Karnataka.
Central Ground Water Board, SWR, Bangalore Page 257
Tiptur Taluk
C.N.Halli Taluk Sl.No. Village Name Village Code
Sl.No. Village Name Village Code
10 Dodda marapanahalli T_13
10 Bevinahalli C_11 11 Doddakatte T_12
11 Chikkenahalli C_13
12 Gatakanakere T_14
12 Chunganahalli C_14 13 Gedlahalli T_16
13 Dabbeghatta C_15
14 Gowdanakatte T_15
14 Dibbadahalli C_17 15 Halenahalli T_17
15 Diggenahalli C_18
16 Halkurike kaval T_20
16 Dugudihalli C_19 17 Harachanahalli T_21
17 Gerehalli C_21
18 Harisamudra T_22
18 Gopalanahalli C_22 19 Hosahalli_TPT T_23
19 Hesarahalli C_23
20 Hurlihalli T_24
20 Kadenahalli C_24 21 Irlagere T_25
21 Kamalapura C_26
22 Jakkanahalli T_26
22 Katenahalli C_28 23 Kallakere T_27
23 Kedagihalli C_29
24 Kambadahalli T_28
24 Kodalgara C_30 25 Kenchamaranahalli T_29
25 Kuppuru C_31
26 Kodagihalli T_30
26 Kurubarahalli_1_CNH C_32 27 Kugihalla T_31
27 Kurubarahalli_2_CNH C_33
28 Lakshmanapura T_32
28 Madapura C_34 29 Mallidevihalli T_33
29 Makuvalli C_36
30 Manakikere T_34
30 Manchasandra C_38 31 Misetimmanahalli T_36
31 Marasandra C_39
32 Muddenahalli T_37
32 Mathighatta C_40 33 Nelagondanahalli T_38
33 Melanahalli C_41
34 Paragondanahalli T_39
34 Navule C_42 35 Ramanahalli T_40
35 Pemmaladevi C_43
36 Rangapura T_41
36 Pinnenahalli C_44 37 Sarathavalli T_43
37 Pura C_45
38 Siddankatti T_44
38 Sasalu C_46 39 Singenahalli T_45
39 Savsettihalli C_47
40 Timmalapura T_47
40 Settikere C_48 41 Timmarayanahalli T_48
41 Siddaramanagara C_49
42 Vaderahalli_TPT T_49
42 Somalapura C_50 43 Vasudevarahalli T_50
43 Tagachighatta C_51
44 Virupakshapura T_51
44 Tammadihalli C_52
45 Tarabenahalli C_53
46 Tigalanahalli C_54
47 Vaderahalli_CNH C_56
48 Yerehalli C_57
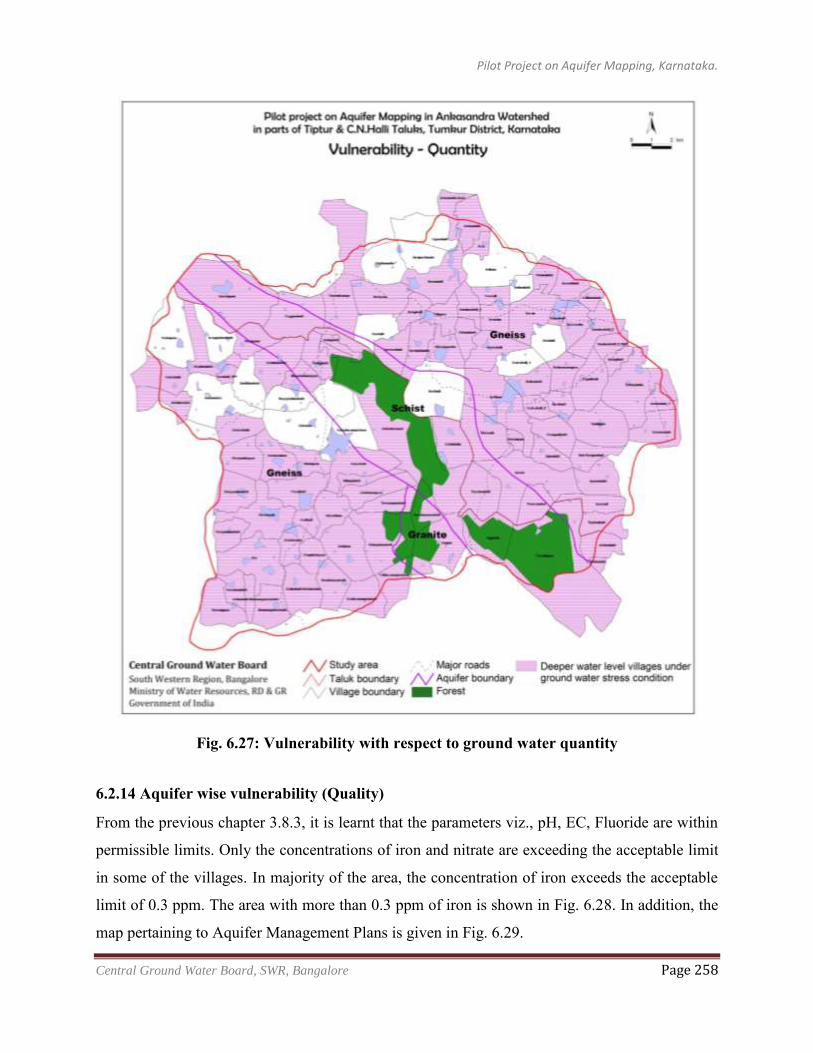
Pilot Project on Aquifer Mapping, Karnataka.
Central Ground Water Board, SWR, Bangalore Page 258
Fig. 6.27: Vulnerability with respect to ground water quantity
6.2.14 Aquifer wise vulnerability (Quality)
From the previous chapter 3.8.3, it is learnt that the parameters viz., pH, EC, Fluoride are within
permissible limits. Only the concentrations of iron and nitrate are exceeding the acceptable limit
in some of the villages. In majority of the area, the concentration of iron exceeds the acceptable
limit of 0.3 ppm. The area with more than 0.3 ppm of iron is shown in Fig. 6.28. In addition, the
map pertaining to Aquifer Management Plans is given in Fig. 6.29.
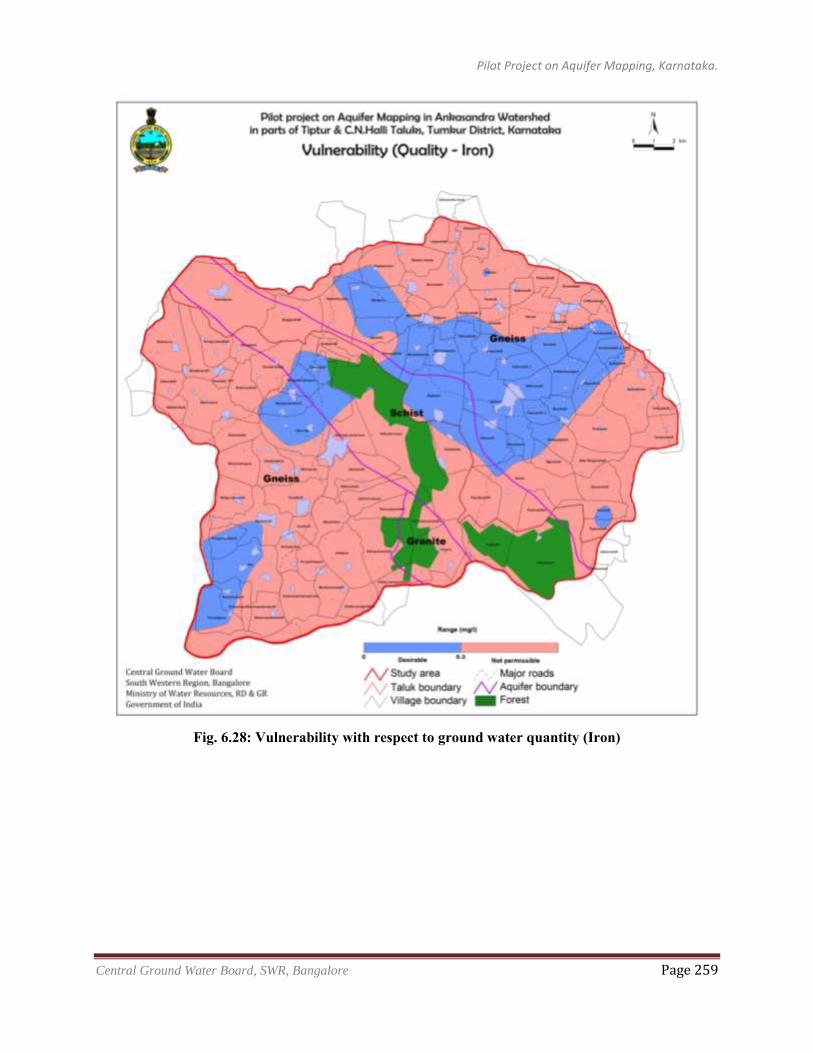
Pilot Project on Aquifer Mapping, Karnataka.
Central Ground Water Board, SWR, Bangalore Page 259
Fig. 6.28: Vulnerability with respect to ground water quantity (Iron)
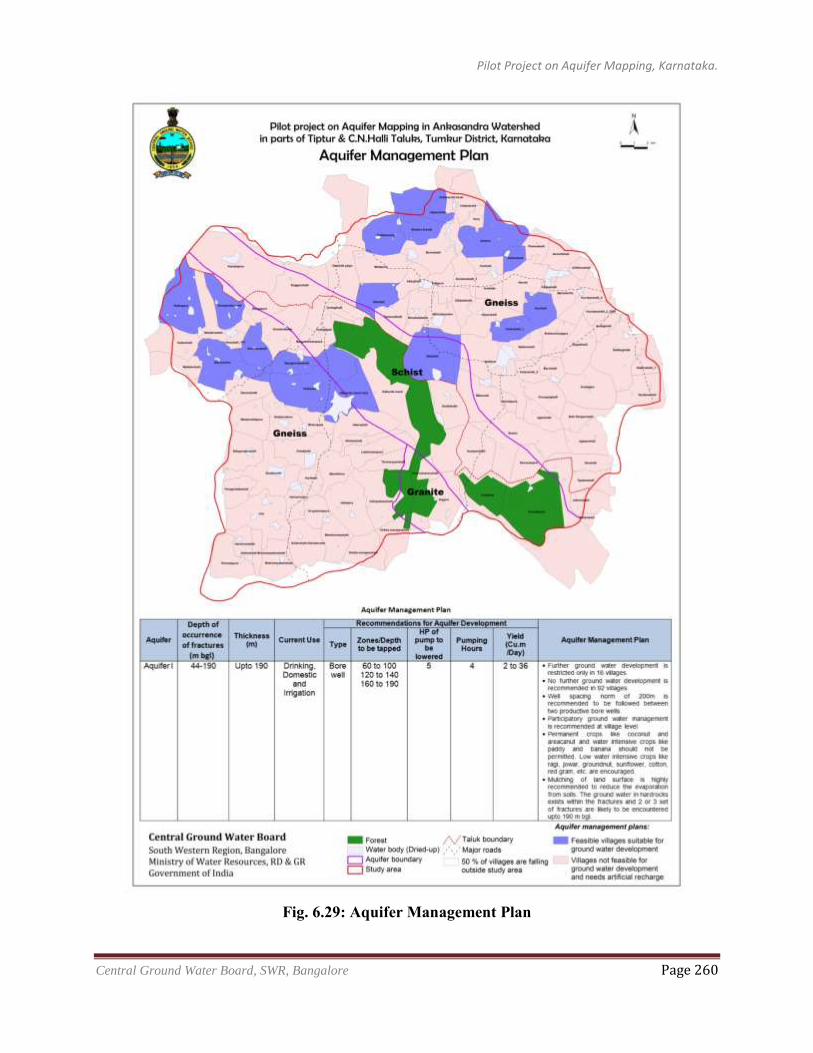
Pilot Project on Aquifer Mapping, Karnataka.
Central Ground Water Board, SWR, Bangalore Page 260
Fig. 6.29: Aquifer Management Plan
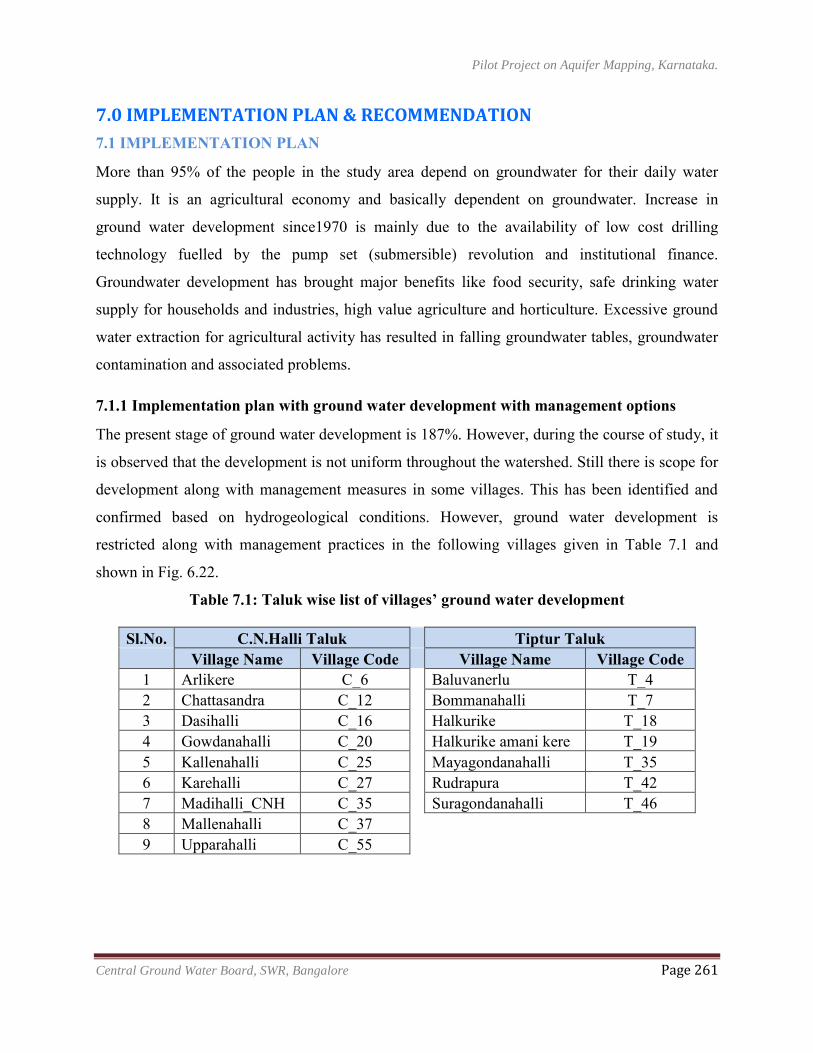
Pilot Project on Aquifer Mapping, Karnataka.
Central Ground Water Board, SWR, Bangalore Page 261
7.0 IMPLEMENTATION PLAN & RECOMMENDATION
7.1 IMPLEMENTATION PLAN
More than 95% of the people in the study area depend on groundwater for their daily water
supply. It is an agricultural economy and basically dependent on groundwater. Increase in
ground water development since1970 is mainly due to the availability of low cost drilling
technology fuelled by the pump set (submersible) revolution and institutional finance.
Groundwater development has brought major benefits like food security, safe drinking water
supply for households and industries, high value agriculture and horticulture. Excessive ground
water extraction for agricultural activity has resulted in falling groundwater tables, groundwater
contamination and associated problems.
7.1.1 Implementation plan with ground water development with management options
The present stage of ground water development is 187%. However, during the course of study, it
is observed that the development is not uniform throughout the watershed. Still there is scope for
development along with management measures in some villages. This has been identified and
confirmed based on hydrogeological conditions. However, ground water development is
restricted along with management practices in the following villages given in Table 7.1 and
shown in Fig. 6.22.
Table 7.1: Taluk wise list of villages’ ground water development
Sl.No. C.N.Halli Taluk
Tiptur Taluk Village Name Village Code
Village Name Village Code
1 Arlikere C_6
Baluvanerlu T_4 2 Chattasandra C_12
Bommanahalli T_7
3 Dasihalli C_16
Halkurike T_18 4 Gowdanahalli C_20
Halkurike amani kere T_19
5 Kallenahalli C_25
Mayagondanahalli T_35 6 Karehalli C_27
Rudrapura T_42
7 Madihalli_CNH C_35
Suragondanahalli T_46 8 Mallenahalli C_37
9 Upparahalli C_55
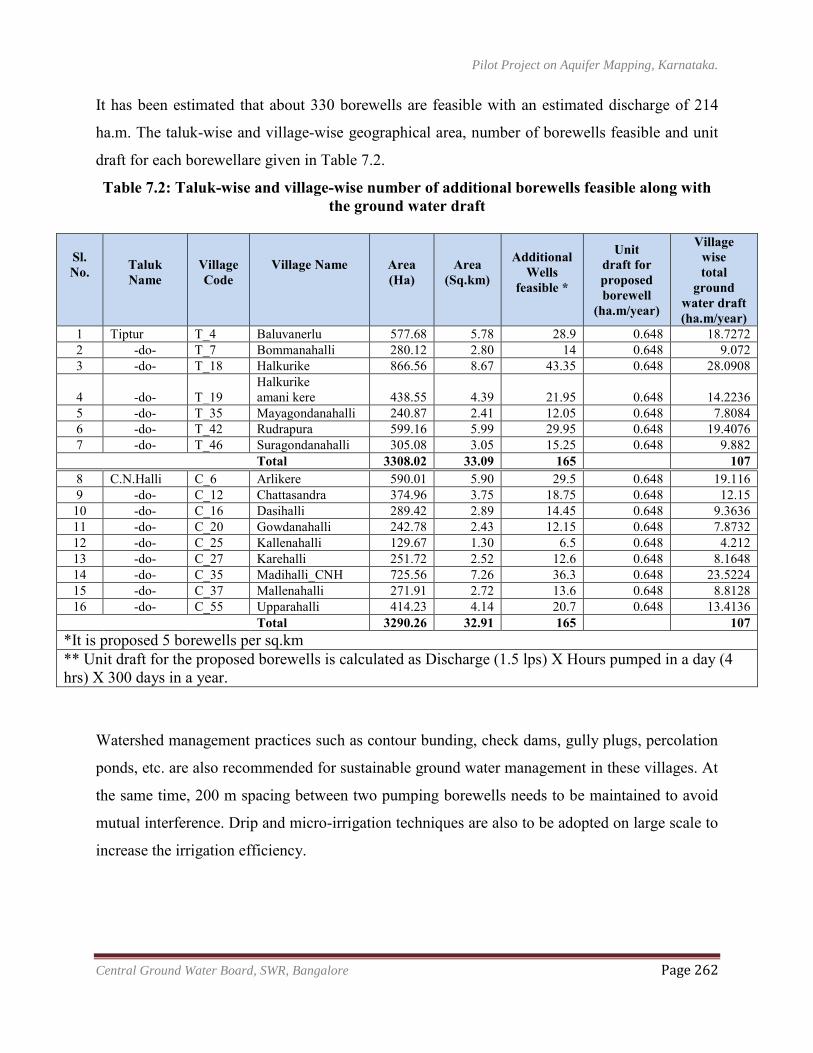
Pilot Project on Aquifer Mapping, Karnataka.
Central Ground Water Board, SWR, Bangalore Page 262
It has been estimated that about 330 borewells are feasible with an estimated discharge of 214
ha.m. The taluk-wise and village-wise geographical area, number of borewells feasible and unit
draft for each borewellare given in Table 7.2.
Table 7.2: Taluk-wise and village-wise number of additional borewells feasible along with the ground water draft
Sl. No.
Taluk Name
Village Code
Village Name
Area (Ha)
Area (Sq.km)
Additional Wells
feasible *
Unit draft for proposed borewell
(ha.m/year)
Village wise total
ground water draft (ha.m/year)
1 Tiptur T_4 Baluvanerlu 577.68 5.78 28.9 0.648 18.7272 2 -do- T_7 Bommanahalli 280.12 2.80 14 0.648 9.072 3 -do- T_18 Halkurike 866.56 8.67 43.35 0.648 28.0908
4 -do- T_19 Halkurike amani kere 438.55 4.39 21.95 0.648 14.2236
5 -do- T_35 Mayagondanahalli 240.87 2.41 12.05 0.648 7.8084 6 -do- T_42 Rudrapura 599.16 5.99 29.95 0.648 19.4076 7 -do- T_46 Suragondanahalli 305.08 3.05 15.25 0.648 9.882
Total 3308.02 33.09 165
107
8 C.N.Halli C_6 Arlikere 590.01 5.90 29.5 0.648 19.116 9 -do- C_12 Chattasandra 374.96 3.75 18.75 0.648 12.15 10 -do- C_16 Dasihalli 289.42 2.89 14.45 0.648 9.3636 11 -do- C_20 Gowdanahalli 242.78 2.43 12.15 0.648 7.8732 12 -do- C_25 Kallenahalli 129.67 1.30 6.5 0.648 4.212 13 -do- C_27 Karehalli 251.72 2.52 12.6 0.648 8.1648 14 -do- C_35 Madihalli_CNH 725.56 7.26 36.3 0.648 23.5224 15 -do- C_37 Mallenahalli 271.91 2.72 13.6 0.648 8.8128 16 -do- C_55 Upparahalli 414.23 4.14 20.7 0.648 13.4136
Total 3290.26 32.91 165
107
*It is proposed 5 borewells per sq.km ** Unit draft for the proposed borewells is calculated as Discharge (1.5 lps) X Hours pumped in a day (4 hrs) X 300 days in a year.
Watershed management practices such as contour bunding, check dams, gully plugs, percolation
ponds, etc. are also recommended for sustainable ground water management in these villages. At
the same time, 200 m spacing between two pumping borewells needs to be maintained to avoid
mutual interference. Drip and micro-irrigation techniques are also to be adopted on large scale to
increase the irrigation efficiency.
Pilot Project on Aquifer Mapping, Karnataka.
Central Ground Water Board, SWR, Bangalore Page 263
7.1.2 Implementation plan with no further ground water development and with management practices
It is observed that the depth to ground water levels at certain places is more than 100 m bgl. It
reflects the severe ground water stress conditions in those villages. The borewell yields also
havereduced over the years. These areas/villages need careful ground water use for
sustainability. The following mitigation measures are recommended.
7.1.2.1 Supply side measures
These are water harvesting measures, water retention measures and protection of natural
recharge.
Structures include recharge wells, percolation ponds, contour bunding, check dams, gully
plugs and sub-surface dams to get positive results. Maintenance of structures is very much
essential
Use of organic material improves the soil health and capacity of the soil to retain moisture.
The organic materials include cow-dung, compost, vermi-compost and green leaves, etc.
Water harvesting and water retention also reduces flooding risks.
Safeguarding natural recharge
It is observed that most of the minor irrigation tanks are silted up over the years. The
infiltration tests conducted in these tanks revealed a very poor infiltration rates. To safeguard
the natural recharge from these tanks, de-siltation of these tanks should be taken up on
priority.
Unscientific sand removal from stream courses and river beds are to be banned or regulated.
Sand removal lowers drainage lines in the area and induces more outflows from the aquifers.
It reduces the capacity to store water in the sand of the river bed and recharge local
groundwater resources.
7.1.2.2 Demand side measures Demand side measures reduce the demand for ground water and facilitate efficient water use
measures through land levelling, field bunding, drip irrigation, sprinkler irrigation, soil moisture
conservation, use of compost, mulching, ploughing, etc.
The drip irrigation is mostly used for horticulture crops in the area (Coconut and Areacanut). It
can be used for fertigation also (application of fertilizers in irrigation water). The drip irrigation
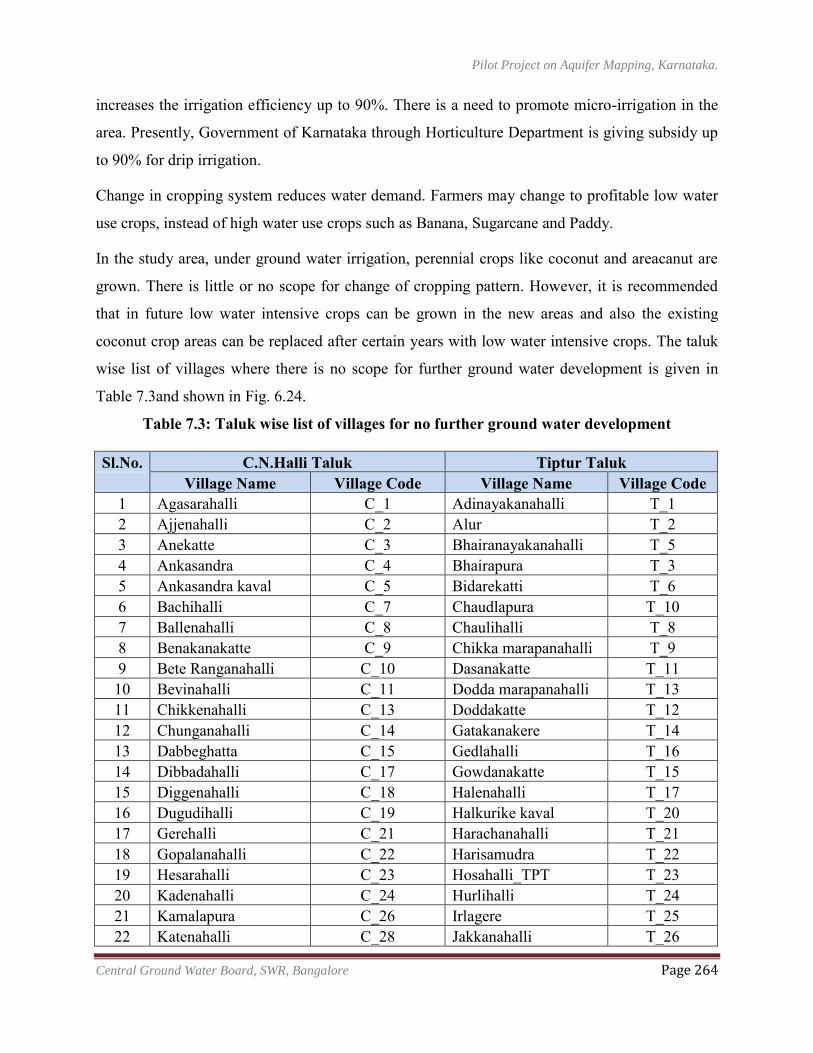
Pilot Project on Aquifer Mapping, Karnataka.
Central Ground Water Board, SWR, Bangalore Page 264
increases the irrigation efficiency up to 90%. There is a need to promote micro-irrigation in the
area. Presently, Government of Karnataka through Horticulture Department is giving subsidy up
to 90% for drip irrigation.
Change in cropping system reduces water demand. Farmers may change to profitable low water
use crops, instead of high water use crops such as Banana, Sugarcane and Paddy.
In the study area, under ground water irrigation, perennial crops like coconut and areacanut are
grown. There is little or no scope for change of cropping pattern. However, it is recommended
that in future low water intensive crops can be grown in the new areas and also the existing
coconut crop areas can be replaced after certain years with low water intensive crops. The taluk
wise list of villages where there is no scope for further ground water development is given in
Table 7.3and shown in Fig. 6.24.
Table 7.3: Taluk wise list of villages for no further ground water development
Sl.No. C.N.Halli Taluk Tiptur Taluk Village Name Village Code Village Name Village Code
1 Agasarahalli C_1 Adinayakanahalli T_1 2 Ajjenahalli C_2 Alur T_2 3 Anekatte C_3 Bhairanayakanahalli T_5 4 Ankasandra C_4 Bhairapura T_3 5 Ankasandra kaval C_5 Bidarekatti T_6 6 Bachihalli C_7 Chaudlapura T_10 7 Ballenahalli C_8 Chaulihalli T_8 8 Benakanakatte C_9 Chikka marapanahalli T_9 9 Bete Ranganahalli C_10 Dasanakatte T_11 10 Bevinahalli C_11 Dodda marapanahalli T_13 11 Chikkenahalli C_13 Doddakatte T_12 12 Chunganahalli C_14 Gatakanakere T_14 13 Dabbeghatta C_15 Gedlahalli T_16 14 Dibbadahalli C_17 Gowdanakatte T_15 15 Diggenahalli C_18 Halenahalli T_17 16 Dugudihalli C_19 Halkurike kaval T_20 17 Gerehalli C_21 Harachanahalli T_21 18 Gopalanahalli C_22 Harisamudra T_22 19 Hesarahalli C_23 Hosahalli_TPT T_23 20 Kadenahalli C_24 Hurlihalli T_24 21 Kamalapura C_26 Irlagere T_25 22 Katenahalli C_28 Jakkanahalli T_26
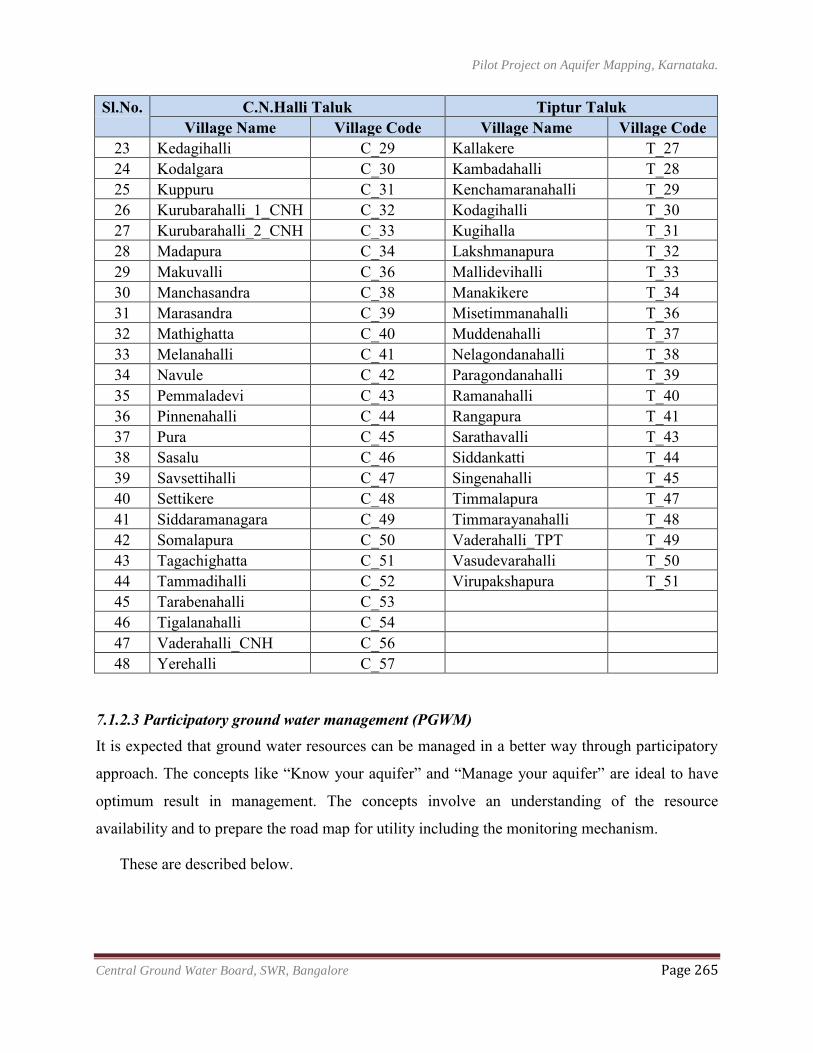
Pilot Project on Aquifer Mapping, Karnataka.
Central Ground Water Board, SWR, Bangalore Page 265
Sl.No. C.N.Halli Taluk Tiptur Taluk Village Name Village Code Village Name Village Code
23 Kedagihalli C_29 Kallakere T_27 24 Kodalgara C_30 Kambadahalli T_28 25 Kuppuru C_31 Kenchamaranahalli T_29 26 Kurubarahalli_1_CNH C_32 Kodagihalli T_30 27 Kurubarahalli_2_CNH C_33 Kugihalla T_31 28 Madapura C_34 Lakshmanapura T_32 29 Makuvalli C_36 Mallidevihalli T_33 30 Manchasandra C_38 Manakikere T_34 31 Marasandra C_39 Misetimmanahalli T_36 32 Mathighatta C_40 Muddenahalli T_37 33 Melanahalli C_41 Nelagondanahalli T_38 34 Navule C_42 Paragondanahalli T_39 35 Pemmaladevi C_43 Ramanahalli T_40 36 Pinnenahalli C_44 Rangapura T_41 37 Pura C_45 Sarathavalli T_43 38 Sasalu C_46 Siddankatti T_44 39 Savsettihalli C_47 Singenahalli T_45 40 Settikere C_48 Timmalapura T_47 41 Siddaramanagara C_49 Timmarayanahalli T_48 42 Somalapura C_50 Vaderahalli_TPT T_49 43 Tagachighatta C_51 Vasudevarahalli T_50 44 Tammadihalli C_52 Virupakshapura T_51 45 Tarabenahalli C_53
46 Tigalanahalli C_54 47 Vaderahalli_CNH C_56 48 Yerehalli C_57
7.1.2.3 Participatory ground water management (PGWM) It is expected that ground water resources can be managed in a better way through participatory
approach. The concepts like “Know your aquifer” and “Manage your aquifer” are ideal to have
optimum result in management. The concepts involve an understanding of the resource
availability and to prepare the road map for utility including the monitoring mechanism.
These are described below.
Pilot Project on Aquifer Mapping, Karnataka.
Central Ground Water Board, SWR, Bangalore Page 266
a) Introduction to the local ground water situation
In the study area due to increase in number of borewells, ground water is being over-exploited
from deeper aquifers upto 200 to 250m bgl. At certain places, the ground water level is more
than 100 m bgl. The ground water is under stress in the area.
b) Local Regulation in Groundwater Management
Groundwater users often have no idea how much groundwater is available. The common ‘belief’
is that the groundwater isinexhaustible. Most wells are owned by individual families or small
groups. The ground water resources are typically shared by many independent users. Local
regulation is necessary because, (i) there are large numbers of small ground water users and
makes it difficult to manage, (ii) required infra-structure for enforcing regulation does not exist
in these areas. Whatever enforcement is there, it needs to be routed in local acceptance and (iii)
there is no evidence that top down regulation (laws, well registration, user rights and ground
water pricing) have worked anywhere on their own.
The examples that exist are still few. They now mainly concern on (i) shallow aquifers (ii)
Management of water quantity – not water quality and (iii) management of small aquifer systems
– not of large unconfined aquifers. Most examples are ‘home-grown’. They have developed
‘against the odds’ without any outside support. Hence, promoting participatory groundwater
management (PGWM) is essential to promote sustainable management.
c) Wise Groundwater Use
Wise ground water use consists of mitigating measures. The mitigating measures are (i) Supply
measures and (ii) Demand measures.
Supply measures
These measures will augment ground water supply. These are water harvesting measures,
water retention measures and protection of the natural recharge.
The water harvesting measures includes recharge wells, percolation ponds, contour bunding,
check dams and gully plugs and sub-surface dams. These measures are to be implemented at
sufficient density so that the positive results are noticeable. Maintenance of structures is very
important which includes removal of silt from recharge beds.
Pilot Project on Aquifer Mapping, Karnataka.
Central Ground Water Board, SWR, Bangalore Page 267
Use of organic manure will improve the soil structure and capacity of the soil to retain
moisture. The organic materials include cow-dung, compost, vermin-compost and leaves, etc.
Water harvesting and water retention will reduce flooding risks but, may also affect
downstream availability of water. This impact needs to be considered.
Safeguarding natural recharge - It is observed that most of the minor irrigation tanks are silted
up over the years. The infiltration tests conducted in these tanks revealed that the infiltration
rates are generally poor due to siltation. To safeguard the natural recharge from these tanks,
desiltation of these tanks should be taken up on priority.
Also one need to make sure that the natural recharge is safeguarded by avoiding sand mining
in the area in streams and river beds. Indiscriminate sand and gravel mining affects
groundwater availability. It lowers drainage lines in the area and induces more outflows from
the aquifers. It reduces the capacity to store water in the sandy river bed .Retention of sand
bed also helps to prevent flooding in rivers. Sand and gravel mining therefore need to be
regulated
Demand measures
Demand side measures reduce the demand for ground water and facilitate efficient water use
measures through land levelling, field bunding, drip irrigation, sprinkler irrigation, soil
moisture conservation, use of compost, mulching, ploughing, etc.
The drip irrigation is mostly used for horticulture crops in the area (Coconut and Areacanut).
It can be used for fertigation also (application of fertilizers in irrigation water). The drip
irrigation increases the irrigation efficiency up to 90%. There is a need to promote micro-
irrigation in the area. Presently, Govt. of Karnataka through Horticulture Department is giving
subsidy up to 90% for drip irrigation.
Change in cropping system reduces water demand. Farmers may change to profitable low
water use crops, instead of high water use crops such as Banana, Sugarcane and Paddy.
In the study area, under ground water irrigation, perennial crops like coconut and areacanut
are grown. There is little or no scope for change of cropping pattern. However, it is
recommended that in future low water intensive crops can be grown in the new areas and also
the existing coconut crop areas can be replaced after certain years with low water intensive
crops.
Pilot Project on Aquifer Mapping, Karnataka.
Central Ground Water Board, SWR, Bangalore Page 268
d) Promoting Micro Planning
Micro planning is required to identify measure – both in local regulation and local investment
and to create peer efforts. Promoting micro planning needs raising awareness among stake
holders, preparing action plan and to create peer network. Raising awareness needs training,
problem analysis, discussion on legal and institution arrangements, etc. The micro planning
requires to identifying water related problems, how these problems are linked to one another,
their causes and effects. It also requires to identifying the solutions to the problems like types of
crops grown, type and number of borewells to be constructed, conditions of tanks, depth to water
table, quality of ground water, etc., in the village/area. The micro planning requires the
preparation of simple water balance of the area based on the rainfall, types of crops grown,
domestic water demand, etc. Micro planning should also include maintenance of water structures
which are to be endorsed by local Panchayats.
e) Participatory Groundwater Monitoring
The Participatory Hydrological Monitoring (PHM) refers to set of activities carried out to keep
track of the changes in a hydrological cycle by the users themselves with little input from
outsiders. The objectives of PHM are about rainfall, ground water draft, and depth to ground
water level relationships. Water use plans are evolved by the community, based on the utilizable
ground water resources and people managed ground water systems.
The stakeholders in ground water management are farmers (men and women), drinking water
users, other ground water users, government departments and local Panchayats. The PHM
process requires awareness raising, delineation of watershed/aquifer system, water resource
inventory. The water resources inventory includes inventory of surface water resources, number
of borewells drilled in the village /area, types of crops grown, number of acres irrigated, status of
ground water development, etc.
The PHM process includes setting up of the monitoring of rainfall (if rain gauge station
available), display of daily rainfall on board, identification of defunct dug well/borewell for
ground water level monitoring, display of ground water level on the board, etc. The PHC process
also requires the training of local people in monitoring of rainfall and ground water level and
display the same which requires farmer capacity building.
Pilot Project on Aquifer Mapping, Karnataka.
Central Ground Water Board, SWR, Bangalore Page 269
The PHM process also has to take up crop water budgeting which is the centre piece of PHM and
concerns the preparation of common crop plan in line with expected ground water availability.
The objective and expected outputs of Crop Water Budgeting (CWB) are (i) updated base line
resource inventory information, (ii) groundwater use in kharif quantified, (iii) groundwater need
for rabi crops quantified and (iv) groundwater balance for rabi projected based on PHM data,
resource inventory and crop plan.
The activities involved in Crop Water Budgeting (CWB) are (i) crop water budgeting workshop
– finalizing crop plans, (ii) support in agricultural extension (suggestion alternative less water
demanding crops) and (iii) adoption Survey and Groundwater Balance Estimation, using results
of crop adoption survey
Results for Andhra Pradesh, India
This methodology is being used in Andhra Pradesh, India and has reduced rice cultivation to less
than 7% and facilitated the introduction of new high productivity crops.
f) Making Use of Water Laws
The essentials of good ground water law are it should be implemented, which relates to other
processes such as surface water management, physical planning, pollution control and the
processes of monitoring linked to them. There are two main categories of ground water laws,
viz., enabling laws and regulatory laws. The enabling laws allow users to make rules and form
own organisations. These will comply with minimum requirement. The new wells should be
approved through procedures of committees. The regulatory laws determines well permits,
drillers licenses, rules on well spacing, zoning rules and pumping concessions, etc. If the law is
to be effective, it should be a fair and reasonable way to resolve the main water issue in the area.
The law should be widely known and acceptable to all.
g) Awareness Building in Water Management
The awareness raising is important in supporting participatory processes. It develops self-
regulating water institutions. Awareness building is to be given communities to establish and
improve local institutions for the management of water resources. Planning awareness campaigns
requires a good strategy which depends on sound knowledge of physical, social and cultural
Pilot Project on Aquifer Mapping, Karnataka.
Central Ground Water Board, SWR, Bangalore Page 270
circumstances of the target groups. Try using existing channels of communications to enhance
appeal and become the talk of the town. Awareness rising should be seen as an interactive
movement in which as many stockholders as possible are involved.
In addition, the following management practices/methods are recommended for sustainability of
ground water resources in the study area.
New Coconut/Aracanut crops should be discouraged: In future, perennial crops like
coconut and areacanut and water intensive crops like paddy and banana should not be
permitted to grow by the farmers. Alternate low water intensive crops like groundnut,
sunflower, cotton, red gram,etc. may be encouraged.
Mulching of land surface to reduce the evaporation from soils.
7.2 RECOMMENDATIONS
The following recommendations may be followed for better aquifer management.
It has been observed heterogeneity in the aquifer systems in the area. Variation in ground
water yield has been observed over very small distances.
For better understanding of the aquifer system, network density may be increased in similar
areas.
The stage of ground water development is 187% i.e., the area is over-exploited. However,
during the course of study, it is observed that the development is not uniform throughout the
watershed. There are stillsome pockets with scope for development, where depth to ground
water levels is less than 10 m bgl. In the following villages viz., Aralikere, Chattasndra,
Dasihalli, Gaudanahalli, Kallenahalli, Karehalli, Madihalli, Mallenahalli and Upparahalli in
C.N.Halli taluk and Balavanerala, Bommanahalli, Halkurike, Halkurikeamanikere,
Mayagondanahalli, Rudrapura and Suragondanahalli in Tiptur taluk are having some scope
for further development. In the above villages, it is estimated that the additional 330
borewells can be constructed with an average unit draft of 0.65 ha.m. However, while
constructing borewells minimum spacing norm of 200m between two productive borewells
may be followed. Simultaneously, the management practices should also be taken up for
sustainable development of ground water resources.
It is recommended to de-silt all the existing minor irrigation tanks so that their holding
Pilot Project on Aquifer Mapping, Karnataka.
Central Ground Water Board, SWR, Bangalore Page 271
capacity increase and increases the infiltration rates. Whenever water reaches these tanks it
will augment ground water.
There is no surplus surface water in the watershed. All the water is under utilisation. It is
observed that the area is having deep to very deep ground water levels. At some places, the
depth to ground water levels is more than 100 m bgl. The entire area is feasible for rainwater
harvesting and artificial recharge to ground water. The sub-surface storage space availability
for recharging the aquifers is 6,39,345 ha.m for raising the ground water level upto 10 m bgl.
Whereas, it is 7,92,205 ha.m for raising the water up to 5 m bgl. The total amount of water
required is 14,015 ha.m or 20,120 ha.m to raise the ground water levels upto 10 m bgl and 5
m bgl respectively.
The live capacity of the all the minor irrigation tanks in the study area is 1205 ha.m. Since
there is acute shortage of surface water in the study area, most of these tanks are dry
throughout the year. It is recommended to bring water from Hemavathi Reservoir (adjacent
basin) to the tune of 1200 ha.m/year to fill up these desilted tanks and it may be continued
for several years till depth to ground water levels in the study area raises upto satisfactory
level. It will improve the ground water recharge to the aquifer and facilitates the rise in
ground water levels and ultimately sustainability of the ground water system.
The deep to very deep ground water levels reflects the severe ground water stress conditions
in the area. These conditions demand wise ground water use for sustainable ground water
levels. The following mitigating measures – supply measures and demand measures are
recommended for sustainable development of ground water resources.
Participatory ground water management is recommended in the area for better understanding
of the aquifer system and managing the aquifer by user themselves.
In future, perennial crops like coconut, areacanut and water intensive crops like paddy and
banana should not be permitted to grow by the farmers. Alternate low water intensive crops
like groundnut, sunflower, cotton, red gram, etc. may be encouraged.
The majority of farmers are practicing drip irrigation in the area. It is recommended to
Pilot Project on Aquifer Mapping, Karnataka.
Central Ground Water Board, SWR, Bangalore Page 272
extend to all the farmers and to further increase the irrigation efficiency, sub-surface drip
irrigation is recommended.
Awareness may be created among farmers about the importance of mulching to reduce the
evaporation loss from the soils.
During MI Census, additional information of borewells on co-ordinates, total depth, casing
length lowered, fractures encountered at various depths, and correspondingyield, area
irrigated, crops grown, soil type, quality, geology, etc. are to be collected to create
comprehensive database and also for better management of the aquifers.
The current trend of chasing the declining water table in search of deeper water bearing
zones has entailed high risk of drilling dry or very low yielding wells in hardrocks. Some of
the farmers by drilling several borewells in their agricultural land in search of water with
loans from bank/finance institutions at high interest rates pushed to permanent bankruptcy.
To avoid farmers’ distress, Borewell Insurance Corporation may be initiated to help the
farmers.
Some of the borewells which are successful at the time of drilling, becoming seasonal
especially during summer season in drought years. To mitigate this situation, crop insurance
may be implemented.
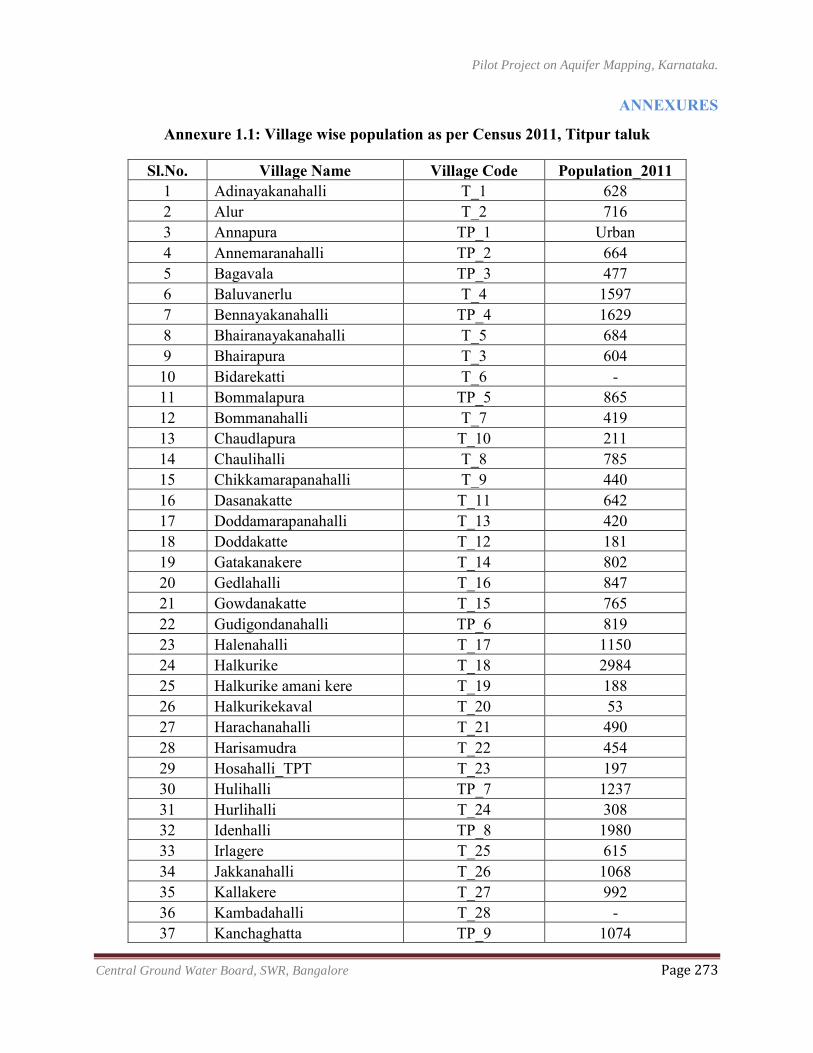
Pilot Project on Aquifer Mapping, Karnataka.
Central Ground Water Board, SWR, Bangalore Page 273
ANNEXURES
Annexure 1.1: Village wise population as per Census 2011, Titpur taluk
Sl.No. Village Name Village Code Population_2011 1 Adinayakanahalli T_1 628 2 Alur T_2 716 3 Annapura TP_1 Urban 4 Annemaranahalli TP_2 664 5 Bagavala TP_3 477 6 Baluvanerlu T_4 1597 7 Bennayakanahalli TP_4 1629 8 Bhairanayakanahalli T_5 684 9 Bhairapura T_3 604 10 Bidarekatti T_6 - 11 Bommalapura TP_5 865 12 Bommanahalli T_7 419 13 Chaudlapura T_10 211 14 Chaulihalli T_8 785 15 Chikkamarapanahalli T_9 440 16 Dasanakatte T_11 642 17 Doddamarapanahalli T_13 420 18 Doddakatte T_12 181 19 Gatakanakere T_14 802 20 Gedlahalli T_16 847 21 Gowdanakatte T_15 765 22 Gudigondanahalli TP_6 819 23 Halenahalli T_17 1150 24 Halkurike T_18 2984 25 Halkurike amani kere T_19 188 26 Halkurikekaval T_20 53 27 Harachanahalli T_21 490 28 Harisamudra T_22 454 29 Hosahalli_TPT T_23 197 30 Hulihalli TP_7 1237 31 Hurlihalli T_24 308 32 Idenhalli TP_8 1980 33 Irlagere T_25 615 34 Jakkanahalli T_26 1068 35 Kallakere T_27 992 36 Kambadahalli T_28 - 37 Kanchaghatta TP_9 1074
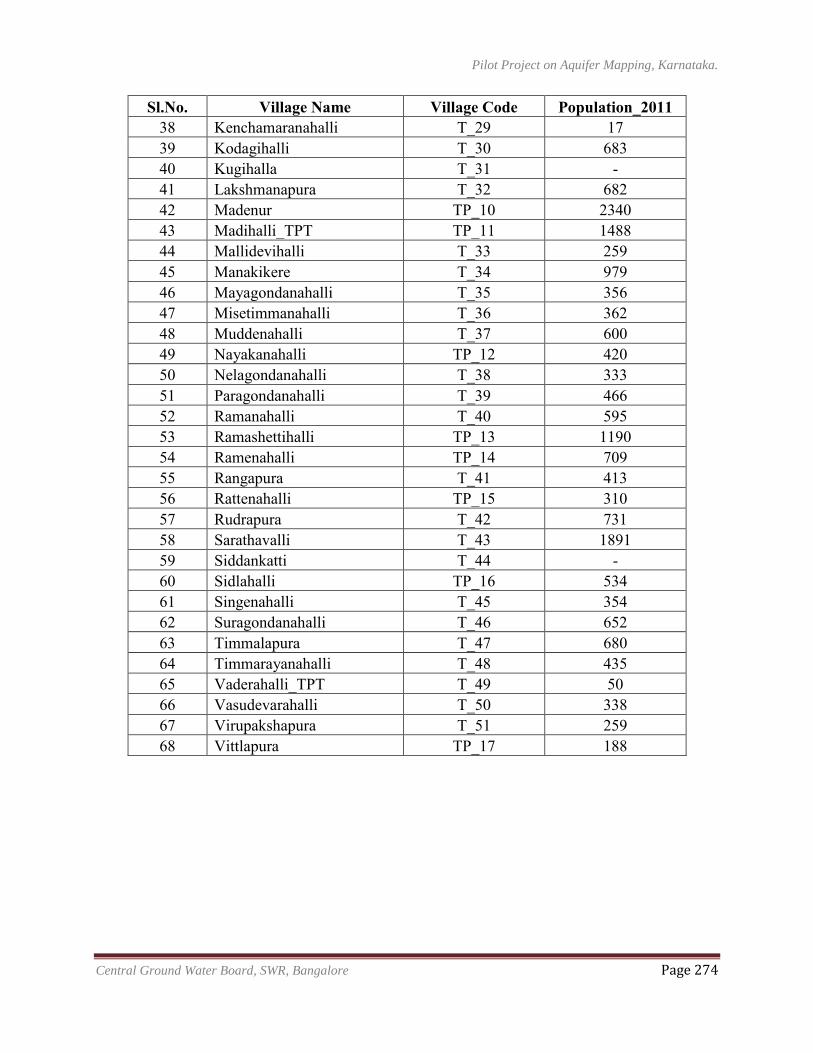
Pilot Project on Aquifer Mapping, Karnataka.
Central Ground Water Board, SWR, Bangalore Page 274
Sl.No. Village Name Village Code Population_2011 38 Kenchamaranahalli T_29 17 39 Kodagihalli T_30 683 40 Kugihalla T_31 - 41 Lakshmanapura T_32 682 42 Madenur TP_10 2340 43 Madihalli_TPT TP_11 1488 44 Mallidevihalli T_33 259 45 Manakikere T_34 979 46 Mayagondanahalli T_35 356 47 Misetimmanahalli T_36 362 48 Muddenahalli T_37 600 49 Nayakanahalli TP_12 420 50 Nelagondanahalli T_38 333 51 Paragondanahalli T_39 466 52 Ramanahalli T_40 595 53 Ramashettihalli TP_13 1190 54 Ramenahalli TP_14 709 55 Rangapura T_41 413 56 Rattenahalli TP_15 310 57 Rudrapura T_42 731 58 Sarathavalli T_43 1891 59 Siddankatti T_44 - 60 Sidlahalli TP_16 534 61 Singenahalli T_45 354 62 Suragondanahalli T_46 652 63 Timmalapura T_47 680 64 Timmarayanahalli T_48 435 65 Vaderahalli_TPT T_49 50 66 Vasudevarahalli T_50 338 67 Virupakshapura T_51 259 68 Vittlapura TP_17 188
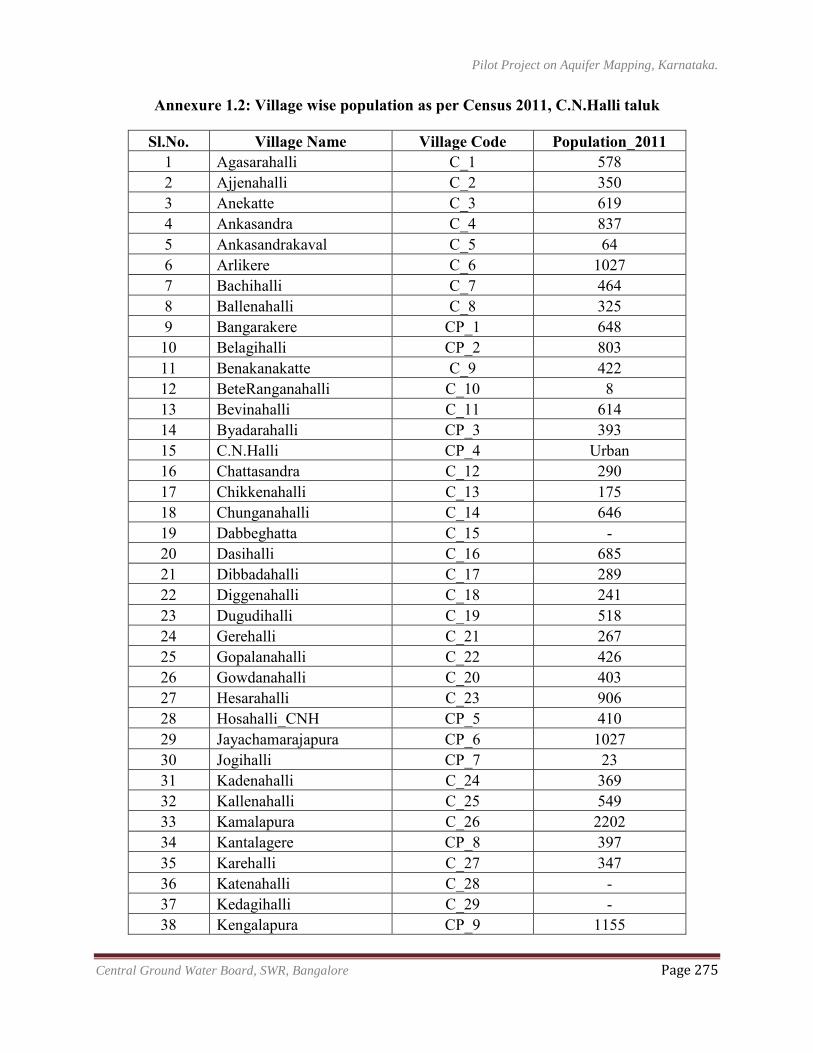
Pilot Project on Aquifer Mapping, Karnataka.
Central Ground Water Board, SWR, Bangalore Page 275
Annexure 1.2: Village wise population as per Census 2011, C.N.Halli taluk
Sl.No. Village Name Village Code Population_2011 1 Agasarahalli C_1 578 2 Ajjenahalli C_2 350 3 Anekatte C_3 619 4 Ankasandra C_4 837 5 Ankasandrakaval C_5 64 6 Arlikere C_6 1027 7 Bachihalli C_7 464 8 Ballenahalli C_8 325 9 Bangarakere CP_1 648 10 Belagihalli CP_2 803 11 Benakanakatte C_9 422 12 BeteRanganahalli C_10 8 13 Bevinahalli C_11 614 14 Byadarahalli CP_3 393 15 C.N.Halli CP_4 Urban 16 Chattasandra C_12 290 17 Chikkenahalli C_13 175 18 Chunganahalli C_14 646 19 Dabbeghatta C_15 - 20 Dasihalli C_16 685 21 Dibbadahalli C_17 289 22 Diggenahalli C_18 241 23 Dugudihalli C_19 518 24 Gerehalli C_21 267 25 Gopalanahalli C_22 426 26 Gowdanahalli C_20 403 27 Hesarahalli C_23 906 28 Hosahalli_CNH CP_5 410 29 Jayachamarajapura CP_6 1027 30 Jogihalli CP_7 23 31 Kadenahalli C_24 369 32 Kallenahalli C_25 549 33 Kamalapura C_26 2202 34 Kantalagere CP_8 397 35 Karehalli C_27 347 36 Katenahalli C_28 - 37 Kedagihalli C_29 - 38 Kengalapura CP_9 1155
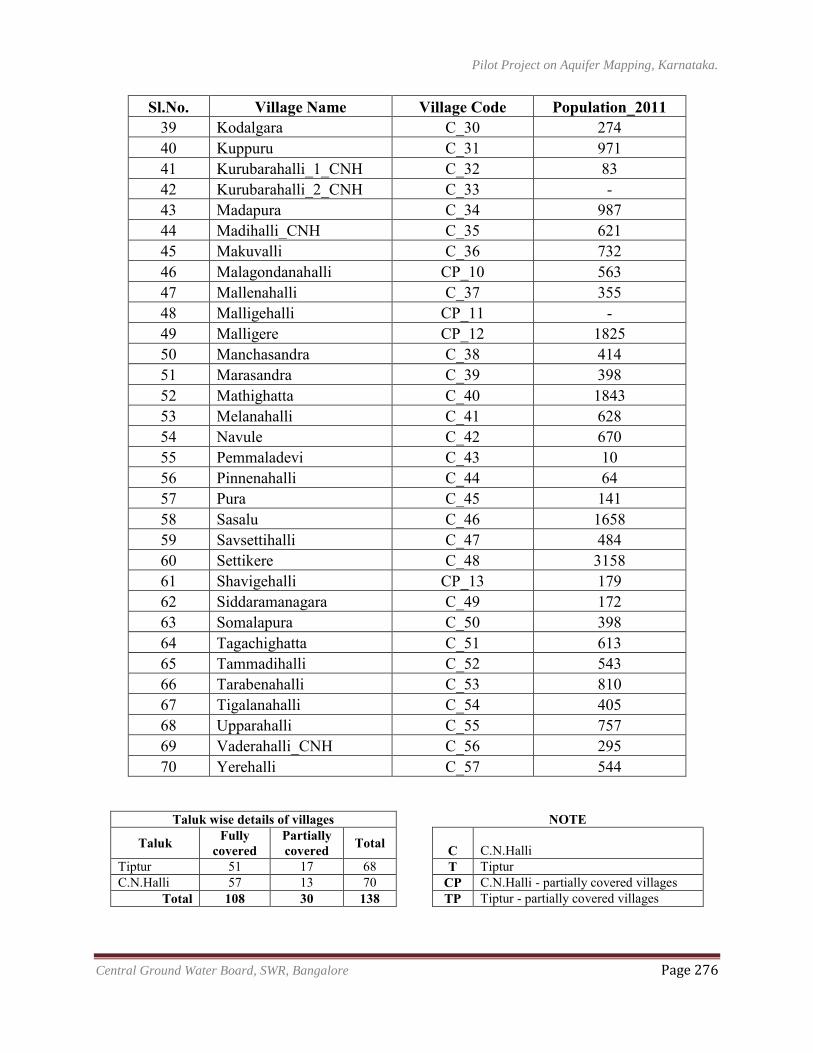
Pilot Project on Aquifer Mapping, Karnataka.
Central Ground Water Board, SWR, Bangalore Page 276
Sl.No. Village Name Village Code Population_2011 39 Kodalgara C_30 274 40 Kuppuru C_31 971 41 Kurubarahalli_1_CNH C_32 83 42 Kurubarahalli_2_CNH C_33 - 43 Madapura C_34 987 44 Madihalli_CNH C_35 621 45 Makuvalli C_36 732 46 Malagondanahalli CP_10 563 47 Mallenahalli C_37 355 48 Malligehalli CP_11 - 49 Malligere CP_12 1825 50 Manchasandra C_38 414 51 Marasandra C_39 398 52 Mathighatta C_40 1843 53 Melanahalli C_41 628 54 Navule C_42 670 55 Pemmaladevi C_43 10 56 Pinnenahalli C_44 64 57 Pura C_45 141 58 Sasalu C_46 1658 59 Savsettihalli C_47 484 60 Settikere C_48 3158 61 Shavigehalli CP_13 179 62 Siddaramanagara C_49 172 63 Somalapura C_50 398 64 Tagachighatta C_51 613 65 Tammadihalli C_52 543 66 Tarabenahalli C_53 810 67 Tigalanahalli C_54 405 68 Upparahalli C_55 757 69 Vaderahalli_CNH C_56 295 70 Yerehalli C_57 544
Taluk wise details of villages
NOTE
Taluk Fully covered
Partially covered Total
C C.N.Halli
Tiptur 51 17 68
T Tiptur C.N.Halli 57 13 70
CP C.N.Halli - partially covered villages
Total 108 30 138
TP Tiptur - partially covered villages
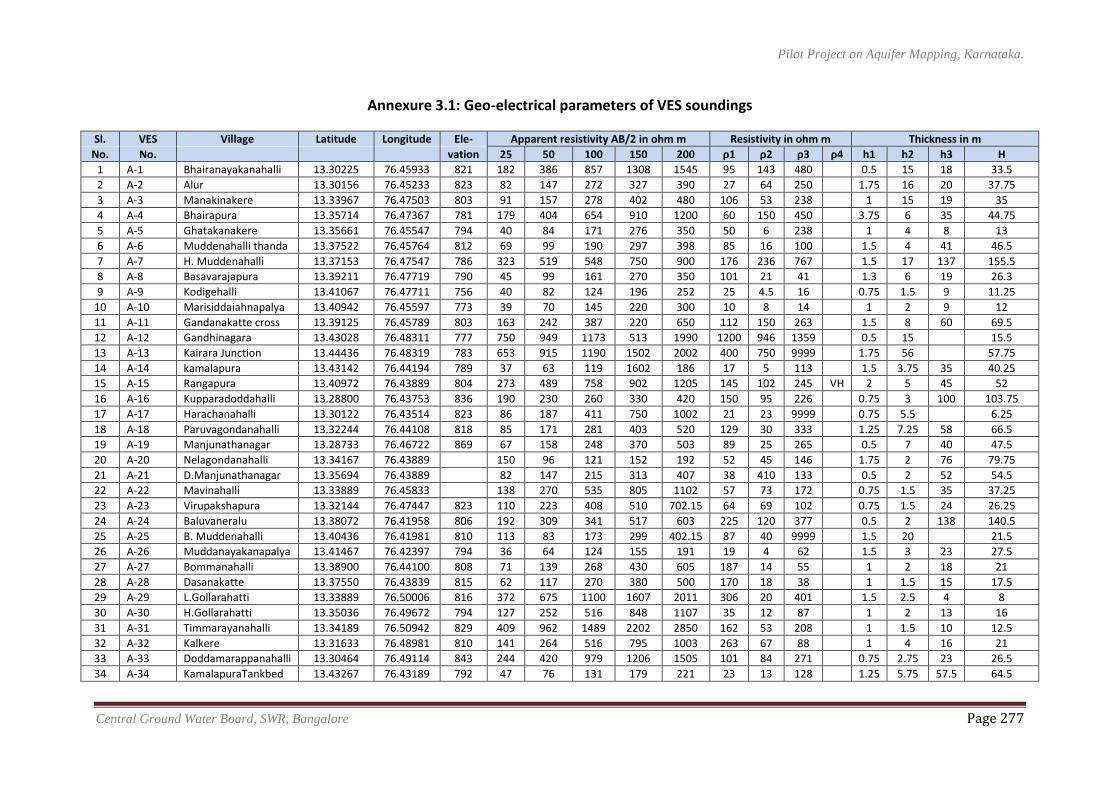
Pilot Project on Aquifer Mapping, Karnataka.
Central Ground Water Board, SWR, Bangalore Page 277
Annexure 3.1: Geo-electrical parameters of VES soundings
Sl. VES Village Latitude Longitude Ele- Apparent resistivity AB/2 in ohm m Resistivity in ohm m Thickness in m
No. No.
vation 25 50 100 150 200 ρ1 ρ2 ρ3 ρ4 h1 h2 h3 H
1 A-1 Bhairanayakanahalli 13.30225 76.45933 821 182 386 857 1308 1545 95 143 480 0.5 15 18 33.5
2 A-2 Alur 13.30156 76.45233 823 82 147 272 327 390 27 64 250 1.75 16 20 37.75
3 A-3 Manakinakere 13.33967 76.47503 803 91 157 278 402 480 106 53 238 1 15 19 35
4 A-4 Bhairapura 13.35714 76.47367 781 179 404 654 910 1200 60 150 450 3.75 6 35 44.75
5 A-5 Ghatakanakere 13.35661 76.45547 794 40 84 171 276 350 50 6 238 1 4 8 13
6 A-6 Muddenahalli thanda 13.37522 76.45764 812 69 99 190 297 398 85 16 100 1.5 4 41 46.5
7 A-7 H. Muddenahalli 13.37153 76.47547 786 323 519 548 750 900 176 236 767 1.5 17 137 155.5
8 A-8 Basavarajapura 13.39211 76.47719 790 45 99 161 270 350 101 21 41 1.3 6 19 26.3
9 A-9 Kodigehalli 13.41067 76.47711 756 40 82 124 196 252 25 4.5 16 0.75 1.5 9 11.25
10 A-10 Marisiddaiahnapalya 13.40942 76.45597 773 39 70 145 220 300 10 8 14 1 2 9 12
11 A-11 Gandanakatte cross 13.39125 76.45789 803 163 242 387 220 650 112 150 263 1.5 8 60 69.5
12 A-12 Gandhinagara 13.43028 76.48311 777 750 949 1173 513 1990 1200 946 1359 0.5 15 15.5
13 A-13 Kairara Junction 13.44436 76.48319 783 653 915 1190 1502 2002 400 750 9999 1.75 56 57.75
14 A-14 kamalapura 13.43142 76.44194 789 37 63 119 1602 186 17 5 113 1.5 3.75 35 40.25
15 A-15 Rangapura 13.40972 76.43889 804 273 489 758 902 1205 145 102 245 VH 2 5 45 52
16 A-16 Kupparadoddahalli 13.28800 76.43753 836 190 230 260 330 420 150 95 226 0.75 3 100 103.75
17 A-17 Harachanahalli 13.30122 76.43514 823 86 187 411 750 1002 21 23 9999 0.75 5.5 6.25
18 A-18 Paruvagondanahalli 13.32244 76.44108 818 85 171 281 403 520 129 30 333 1.25 7.25 58 66.5
19 A-19 Manjunathanagar 13.28733 76.46722 869 67 158 248 370 503 89 25 265 0.5 7 40 47.5
20 A-20 Nelagondanahalli 13.34167 76.43889 150 96 121 152 192 52 45 146 1.75 2 76 79.75
21 A-21 D.Manjunathanagar 13.35694 76.43889 82 147 215 313 407 38 410 133 0.5 2 52 54.5
22 A-22 Mavinahalli 13.33889 76.45833 138 270 535 805 1102 57 73 172 0.75 1.5 35 37.25
23 A-23 Virupakshapura 13.32144 76.47447 823 110 223 408 510 702.15 64 69 102 0.75 1.5 24 26.25
24 A-24 Baluvaneralu 13.38072 76.41958 806 192 309 341 517 603 225 120 377 0.5 2 138 140.5
25 A-25 B. Muddenahalli 13.40436 76.41981 810 113 83 173 299 402.15 87 40 9999 1.5 20 21.5
26 A-26 Muddanayakanapalya 13.41467 76.42397 794 36 64 124 155 191 19 4 62 1.5 3 23 27.5
27 A-27 Bommanahalli 13.38900 76.44100 808 71 139 268 430 605 187 14 55 1 2 18 21
28 A-28 Dasanakatte 13.37550 76.43839 815 62 117 270 380 500 170 18 38 1 1.5 15 17.5
29 A-29 L.Gollarahatti 13.33889 76.50006 816 372 675 1100 1607 2011 306 20 401 1.5 2.5 4 8
30 A-30 H.Gollarahatti 13.35036 76.49672 794 127 252 516 848 1107 35 12 87 1 2 13 16
31 A-31 Timmarayanahalli 13.34189 76.50942 829 409 962 1489 2202 2850 162 53 208 1 1.5 10 12.5
32 A-32 Kalkere 13.31633 76.48981 810 141 264 516 795 1003 263 67 88 1 4 16 21
33 A-33 Doddamarappanahalli 13.30464 76.49114 843 244 420 979 1206 1505 101 84 271 0.75 2.75 23 26.5
34 A-34 KamalapuraTankbed 13.43267 76.43189 792 47 76 131 179 221 23 13 128 1.25 5.75 57.5 64.5
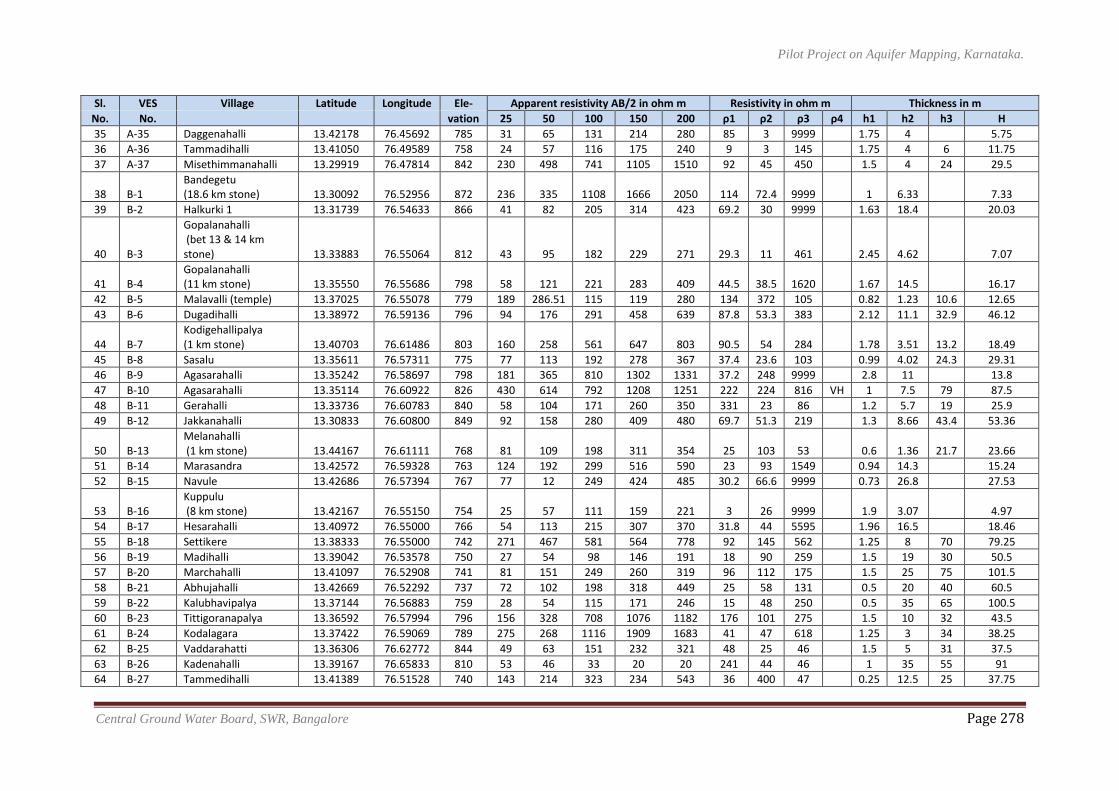
Pilot Project on Aquifer Mapping, Karnataka.
Central Ground Water Board, SWR, Bangalore Page 278
Sl. VES Village Latitude Longitude Ele- Apparent resistivity AB/2 in ohm m Resistivity in ohm m Thickness in m
No. No.
vation 25 50 100 150 200 ρ1 ρ2 ρ3 ρ4 h1 h2 h3 H
35 A-35 Daggenahalli 13.42178 76.45692 785 31 65 131 214 280 85 3 9999 1.75 4 5.75
36 A-36 Tammadihalli 13.41050 76.49589 758 24 57 116 175 240 9 3 145 1.75 4 6 11.75
37 A-37 Misethimmanahalli 13.29919 76.47814 842 230 498 741 1105 1510 92 45 450 1.5 4 24 29.5
38 B-1 Bandegetu (18.6 km stone) 13.30092 76.52956 872 236 335 1108 1666 2050 114 72.4 9999 1 6.33 7.33
39 B-2 Halkurki 1 13.31739 76.54633 866 41 82 205 314 423 69.2 30 9999 1.63 18.4 20.03
40 B-3
Gopalanahalli (bet 13 & 14 km stone) 13.33883 76.55064 812 43 95 182 229 271 29.3 11 461 2.45 4.62 7.07
41 B-4 Gopalanahalli (11 km stone) 13.35550 76.55686 798 58 121 221 283 409 44.5 38.5 1620 1.67 14.5 16.17
42 B-5 Malavalli (temple) 13.37025 76.55078 779 189 286.51 115 119 280 134 372 105 0.82 1.23 10.6 12.65
43 B-6 Dugadihalli 13.38972 76.59136 796 94 176 291 458 639 87.8 53.3 383 2.12 11.1 32.9 46.12
44 B-7 Kodigehallipalya (1 km stone) 13.40703 76.61486 803 160 258 561 647 803 90.5 54 284 1.78 3.51 13.2 18.49
45 B-8 Sasalu 13.35611 76.57311 775 77 113 192 278 367 37.4 23.6 103 0.99 4.02 24.3 29.31
46 B-9 Agasarahalli 13.35242 76.58697 798 181 365 810 1302 1331 37.2 248 9999 2.8 11 13.8
47 B-10 Agasarahalli 13.35114 76.60922 826 430 614 792 1208 1251 222 224 816 VH 1 7.5 79 87.5
48 B-11 Gerahalli 13.33736 76.60783 840 58 104 171 260 350 331 23 86 1.2 5.7 19 25.9
49 B-12 Jakkanahalli 13.30833 76.60800 849 92 158 280 409 480 69.7 51.3 219 1.3 8.66 43.4 53.36
50 B-13 Melanahalli (1 km stone) 13.44167 76.61111 768 81 109 198 311 354 25 103 53 0.6 1.36 21.7 23.66
51 B-14 Marasandra 13.42572 76.59328 763 124 192 299 516 590 23 93 1549 0.94 14.3 15.24
52 B-15 Navule 13.42686 76.57394 767 77 12 249 424 485 30.2 66.6 9999 0.73 26.8 27.53
53 B-16 Kuppulu (8 km stone) 13.42167 76.55150 754 25 57 111 159 221 3 26 9999 1.9 3.07 4.97
54 B-17 Hesarahalli 13.40972 76.55000 766 54 113 215 307 370 31.8 44 5595 1.96 16.5 18.46
55 B-18 Settikere 13.38333 76.55000 742 271 467 581 564 778 92 145 562 1.25 8 70 79.25
56 B-19 Madihalli 13.39042 76.53578 750 27 54 98 146 191 18 90 259 1.5 19 30 50.5
57 B-20 Marchahalli 13.41097 76.52908 741 81 151 249 260 319 96 112 175 1.5 25 75 101.5
58 B-21 Abhujahalli 13.42669 76.52292 737 72 102 198 318 449 25 58 131 0.5 20 40 60.5
59 B-22 Kalubhavipalya 13.37144 76.56883 759 28 54 115 171 246 15 48 250 0.5 35 65 100.5
60 B-23 Tittigoranapalya 13.36592 76.57994 796 156 328 708 1076 1182 176 101 275 1.5 10 32 43.5
61 B-24 Kodalagara 13.37422 76.59069 789 275 268 1116 1909 1683 41 47 618 1.25 3 34 38.25
62 B-25 Vaddarahatti 13.36306 76.62772 844 49 63 151 232 321 48 25 46 1.5 5 31 37.5
63 B-26 Kadenahalli 13.39167 76.65833 810 53 46 33 20 20 241 44 46 1 35 55 91
64 B-27 Tammedihalli 13.41389 76.51528 740 143 214 323 234 543 36 400 47 0.25 12.5 25 37.75
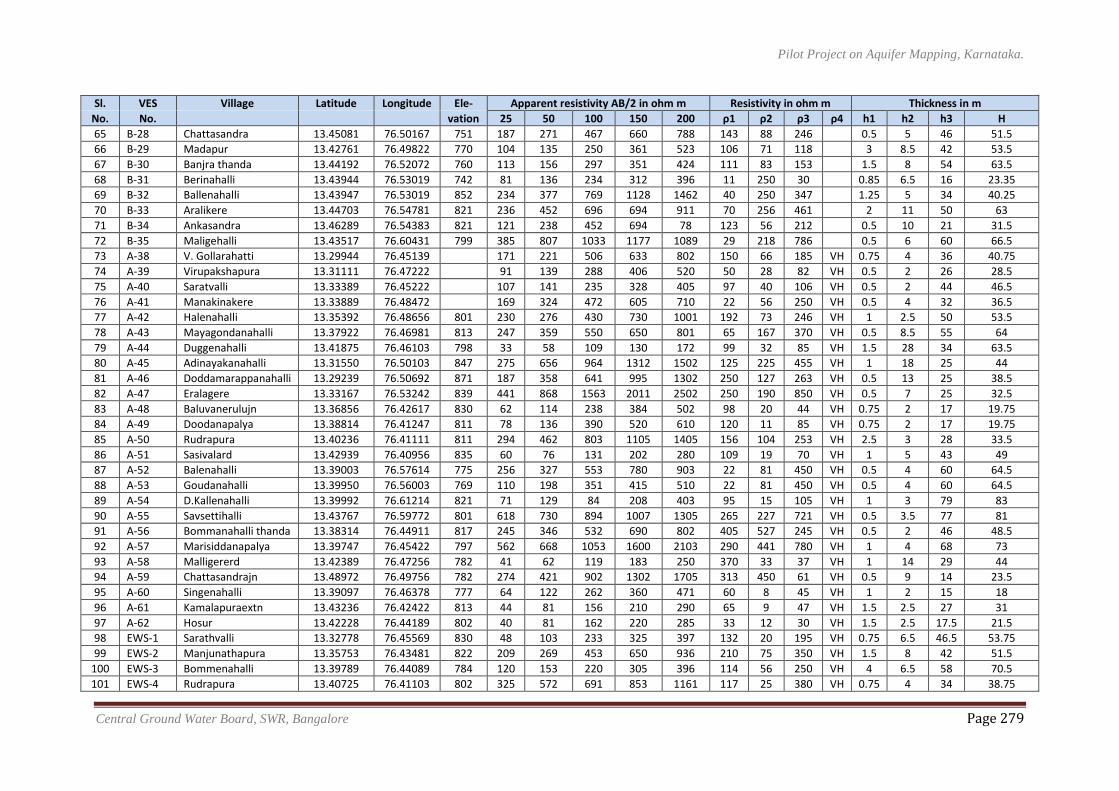
Pilot Project on Aquifer Mapping, Karnataka.
Central Ground Water Board, SWR, Bangalore Page 279
Sl. VES Village Latitude Longitude Ele- Apparent resistivity AB/2 in ohm m Resistivity in ohm m Thickness in m
No. No.
vation 25 50 100 150 200 ρ1 ρ2 ρ3 ρ4 h1 h2 h3 H
65 B-28 Chattasandra 13.45081 76.50167 751 187 271 467 660 788 143 88 246 0.5 5 46 51.5
66 B-29 Madapur 13.42761 76.49822 770 104 135 250 361 523 106 71 118 3 8.5 42 53.5
67 B-30 Banjra thanda 13.44192 76.52072 760 113 156 297 351 424 111 83 153 1.5 8 54 63.5
68 B-31 Berinahalli 13.43944 76.53019 742 81 136 234 312 396 11 250 30 0.85 6.5 16 23.35
69 B-32 Ballenahalli 13.43947 76.53019 852 234 377 769 1128 1462 40 250 347 1.25 5 34 40.25
70 B-33 Aralikere 13.44703 76.54781 821 236 452 696 694 911 70 256 461 2 11 50 63
71 B-34 Ankasandra 13.46289 76.54383 821 121 238 452 694 78 123 56 212 0.5 10 21 31.5
72 B-35 Maligehalli 13.43517 76.60431 799 385 807 1033 1177 1089 29 218 786 0.5 6 60 66.5
73 A-38 V. Gollarahatti 13.29944 76.45139 171 221 506 633 802 150 66 185 VH 0.75 4 36 40.75
74 A-39 Virupakshapura 13.31111 76.47222 91 139 288 406 520 50 28 82 VH 0.5 2 26 28.5
75 A-40 Saratvalli 13.33389 76.45222 107 141 235 328 405 97 40 106 VH 0.5 2 44 46.5
76 A-41 Manakinakere 13.33889 76.48472 169 324 472 605 710 22 56 250 VH 0.5 4 32 36.5
77 A-42 Halenahalli 13.35392 76.48656 801 230 276 430 730 1001 192 73 246 VH 1 2.5 50 53.5
78 A-43 Mayagondanahalli 13.37922 76.46981 813 247 359 550 650 801 65 167 370 VH 0.5 8.5 55 64
79 A-44 Duggenahalli 13.41875 76.46103 798 33 58 109 130 172 99 32 85 VH 1.5 28 34 63.5
80 A-45 Adinayakanahalli 13.31550 76.50103 847 275 656 964 1312 1502 125 225 455 VH 1 18 25 44
81 A-46 Doddamarappanahalli 13.29239 76.50692 871 187 358 641 995 1302 250 127 263 VH 0.5 13 25 38.5
82 A-47 Eralagere 13.33167 76.53242 839 441 868 1563 2011 2502 250 190 850 VH 0.5 7 25 32.5
83 A-48 Baluvanerulujn 13.36856 76.42617 830 62 114 238 384 502 98 20 44 VH 0.75 2 17 19.75
84 A-49 Doodanapalya 13.38814 76.41247 811 78 136 390 520 610 120 11 85 VH 0.75 2 17 19.75
85 A-50 Rudrapura 13.40236 76.41111 811 294 462 803 1105 1405 156 104 253 VH 2.5 3 28 33.5
86 A-51 Sasivalard 13.42939 76.40956 835 60 76 131 202 280 109 19 70 VH 1 5 43 49
87 A-52 Balenahalli 13.39003 76.57614 775 256 327 553 780 903 22 81 450 VH 0.5 4 60 64.5
88 A-53 Goudanahalli 13.39950 76.56003 769 110 198 351 415 510 22 81 450 VH 0.5 4 60 64.5
89 A-54 D.Kallenahalli 13.39992 76.61214 821 71 129 84 208 403 95 15 105 VH 1 3 79 83
90 A-55 Savsettihalli 13.43767 76.59772 801 618 730 894 1007 1305 265 227 721 VH 0.5 3.5 77 81
91 A-56 Bommanahalli thanda 13.38314 76.44911 817 245 346 532 690 802 405 527 245 VH 0.5 2 46 48.5
92 A-57 Marisiddanapalya 13.39747 76.45422 797 562 668 1053 1600 2103 290 441 780 VH 1 4 68 73
93 A-58 Malligererd 13.42389 76.47256 782 41 62 119 183 250 370 33 37 VH 1 14 29 44
94 A-59 Chattasandrajn 13.48972 76.49756 782 274 421 902 1302 1705 313 450 61 VH 0.5 9 14 23.5
95 A-60 Singenahalli 13.39097 76.46378 777 64 122 262 360 471 60 8 45 VH 1 2 15 18
96 A-61 Kamalapuraextn 13.43236 76.42422 813 44 81 156 210 290 65 9 47 VH 1.5 2.5 27 31
97 A-62 Hosur 13.42228 76.44189 802 40 81 162 220 285 33 12 30 VH 1.5 2.5 17.5 21.5
98 EWS-1 Sarathvalli 13.32778 76.45569 830 48 103 233 325 397 132 20 195 VH 0.75 6.5 46.5 53.75
99 EWS-2 Manjunathapura 13.35753 76.43481 822 209 269 453 650 936 210 75 350 VH 1.5 8 42 51.5
100 EWS-3 Bommenahalli 13.39789 76.44089 784 120 153 220 305 396 114 56 250 VH 4 6.5 58 70.5
101 EWS-4 Rudrapura 13.40725 76.41103 802 325 572 691 853 1161 117 25 380 VH 0.75 4 34 38.75
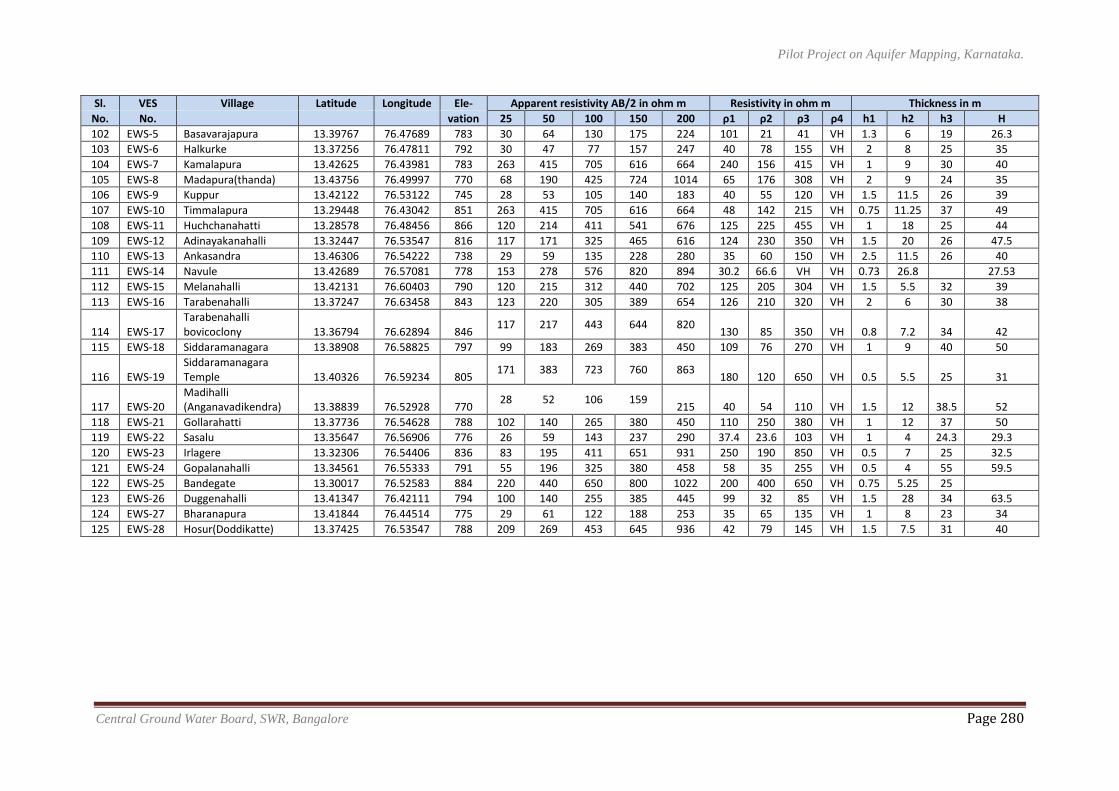
Pilot Project on Aquifer Mapping, Karnataka.
Central Ground Water Board, SWR, Bangalore Page 280
Sl. VES Village Latitude Longitude Ele- Apparent resistivity AB/2 in ohm m Resistivity in ohm m Thickness in m
No. No.
vation 25 50 100 150 200 ρ1 ρ2 ρ3 ρ4 h1 h2 h3 H
102 EWS-5 Basavarajapura 13.39767 76.47689 783 30 64 130 175 224 101 21 41 VH 1.3 6 19 26.3
103 EWS-6 Halkurke 13.37256 76.47811 792 30 47 77 157 247 40 78 155 VH 2 8 25 35
104 EWS-7 Kamalapura 13.42625 76.43981 783 263 415 705 616 664 240 156 415 VH 1 9 30 40
105 EWS-8 Madapura(thanda) 13.43756 76.49997 770 68 190 425 724 1014 65 176 308 VH 2 9 24 35
106 EWS-9 Kuppur 13.42122 76.53122 745 28 53 105 140 183 40 55 120 VH 1.5 11.5 26 39
107 EWS-10 Timmalapura 13.29448 76.43042 851 263 415 705 616 664 48 142 215 VH 0.75 11.25 37 49
108 EWS-11 Huchchanahatti 13.28578 76.48456 866 120 214 411 541 676 125 225 455 VH 1 18 25 44
109 EWS-12 Adinayakanahalli 13.32447 76.53547 816 117 171 325 465 616 124 230 350 VH 1.5 20 26 47.5
110 EWS-13 Ankasandra 13.46306 76.54222 738 29 59 135 228 280 35 60 150 VH 2.5 11.5 26 40
111 EWS-14 Navule 13.42689 76.57081 778 153 278 576 820 894 30.2 66.6 VH VH 0.73 26.8 27.53
112 EWS-15 Melanahalli 13.42131 76.60403 790 120 215 312 440 702 125 205 304 VH 1.5 5.5 32 39
113 EWS-16 Tarabenahalli 13.37247 76.63458 843 123 220 305 389 654 126 210 320 VH 2 6 30 38
114 EWS-17 Tarabenahalli bovicoclony 13.36794 76.62894 846
117 217 443 644 820 130 85 350 VH 0.8 7.2 34 42
115 EWS-18 Siddaramanagara 13.38908 76.58825 797 99 183 269 383 450 109 76 270 VH 1 9 40 50
116 EWS-19 Siddaramanagara Temple 13.40326 76.59234 805
171 383 723 760 863 180 120 650 VH 0.5 5.5 25 31
117 EWS-20 Madihalli (Anganavadikendra) 13.38839 76.52928 770
28 52 106 159 215 40 54 110 VH 1.5 12 38.5 52
118 EWS-21 Gollarahatti 13.37736 76.54628 788 102 140 265 380 450 110 250 380 VH 1 12 37 50
119 EWS-22 Sasalu 13.35647 76.56906 776 26 59 143 237 290 37.4 23.6 103 VH 1 4 24.3 29.3
120 EWS-23 Irlagere 13.32306 76.54406 836 83 195 411 651 931 250 190 850 VH 0.5 7 25 32.5
121 EWS-24 Gopalanahalli 13.34561 76.55333 791 55 196 325 380 458 58 35 255 VH 0.5 4 55 59.5
122 EWS-25 Bandegate 13.30017 76.52583 884 220 440 650 800 1022 200 400 650 VH 0.75 5.25 25
123 EWS-26 Duggenahalli 13.41347 76.42111 794 100 140 255 385 445 99 32 85 VH 1.5 28 34 63.5
124 EWS-27 Bharanapura 13.41844 76.44514 775 29 61 122 188 253 35 65 135 VH 1 8 23 34
125 EWS-28 Hosur(Doddikatte) 13.37425 76.53547 788 209 269 453 645 936 42 79 145 VH 1.5 7.5 31 40
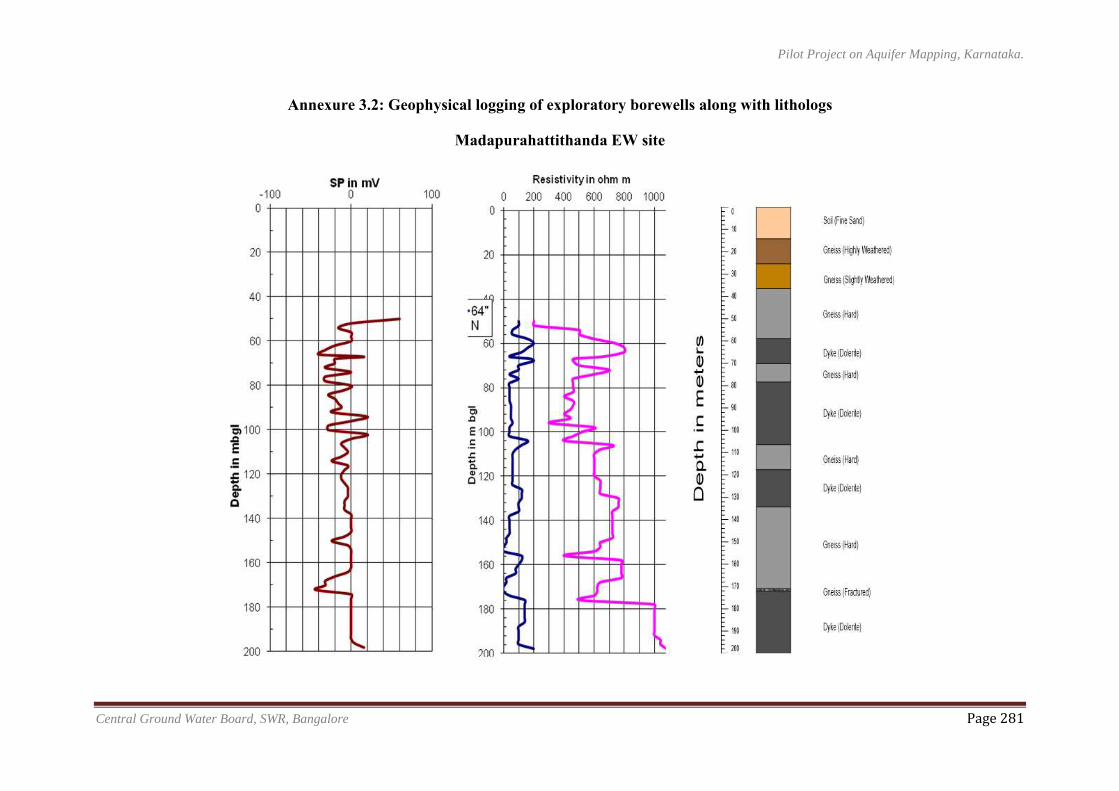
Pilot Project on Aquifer Mapping, Karnataka.
Central Ground Water Board, SWR, Bangalore Page 281
Annexure 3.2: Geophysical logging of exploratory borewells along with lithologs
Madapurahattithanda EW site
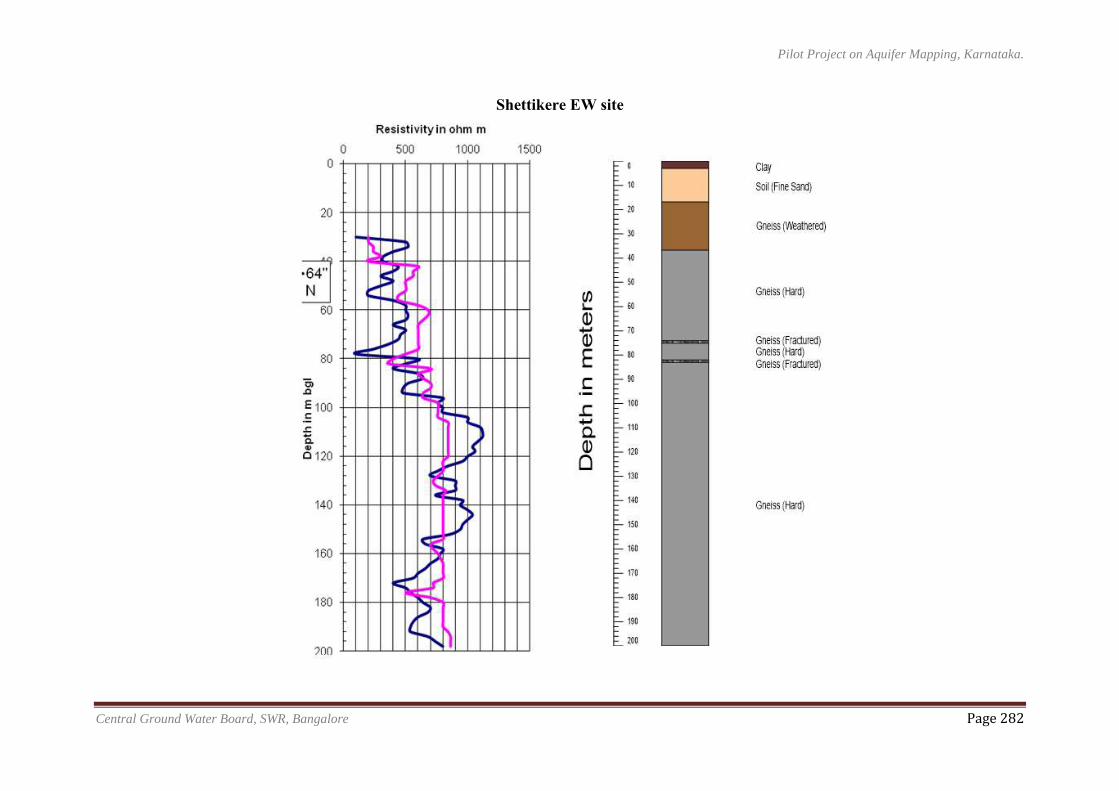
Pilot Project on Aquifer Mapping, Karnataka.
Central Ground Water Board, SWR, Bangalore Page 282
Shettikere EW site
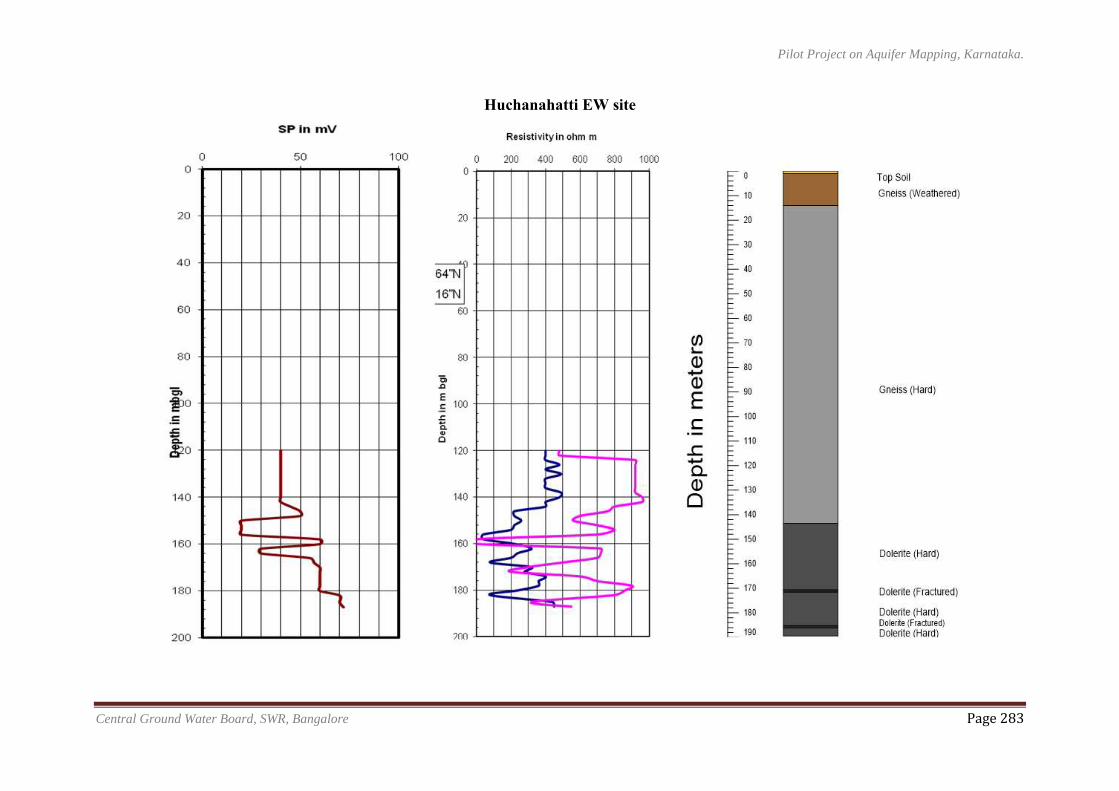
Pilot Project on Aquifer Mapping, Karnataka.
Central Ground Water Board, SWR, Bangalore Page 283
Huchanahatti EW site
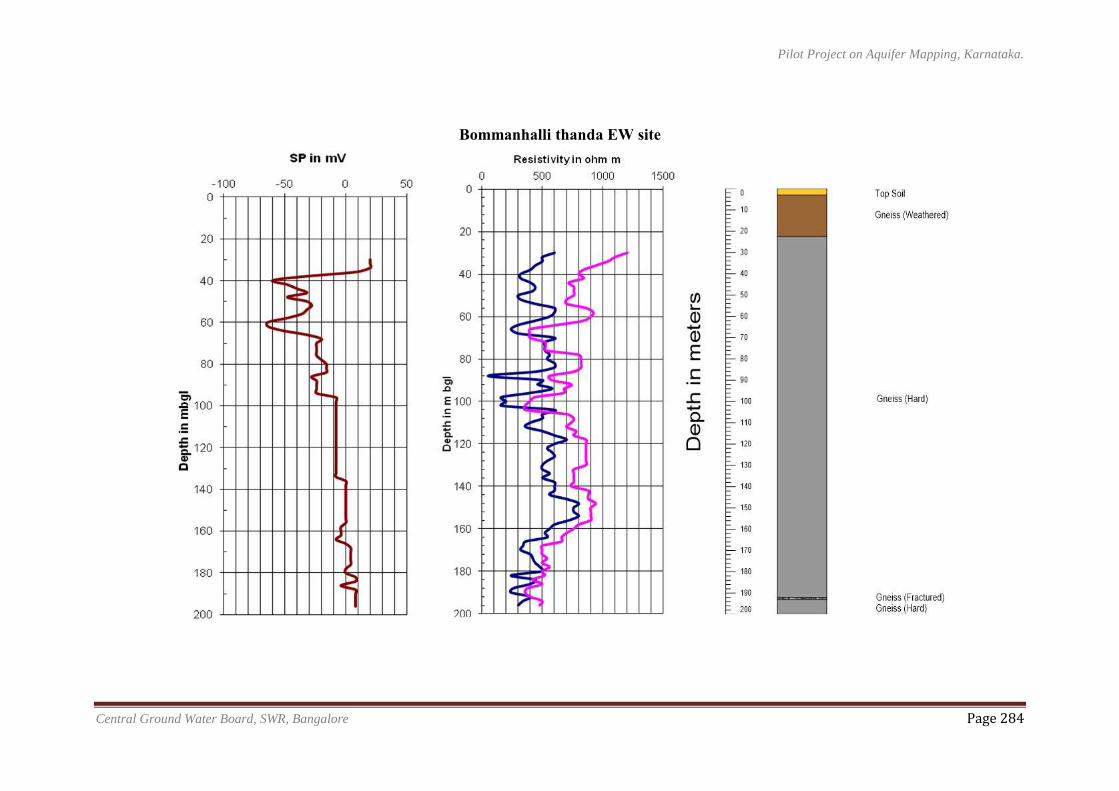
Pilot Project on Aquifer Mapping, Karnataka.
Central Ground Water Board, SWR, Bangalore Page 284
Bommanhalli thanda EW site
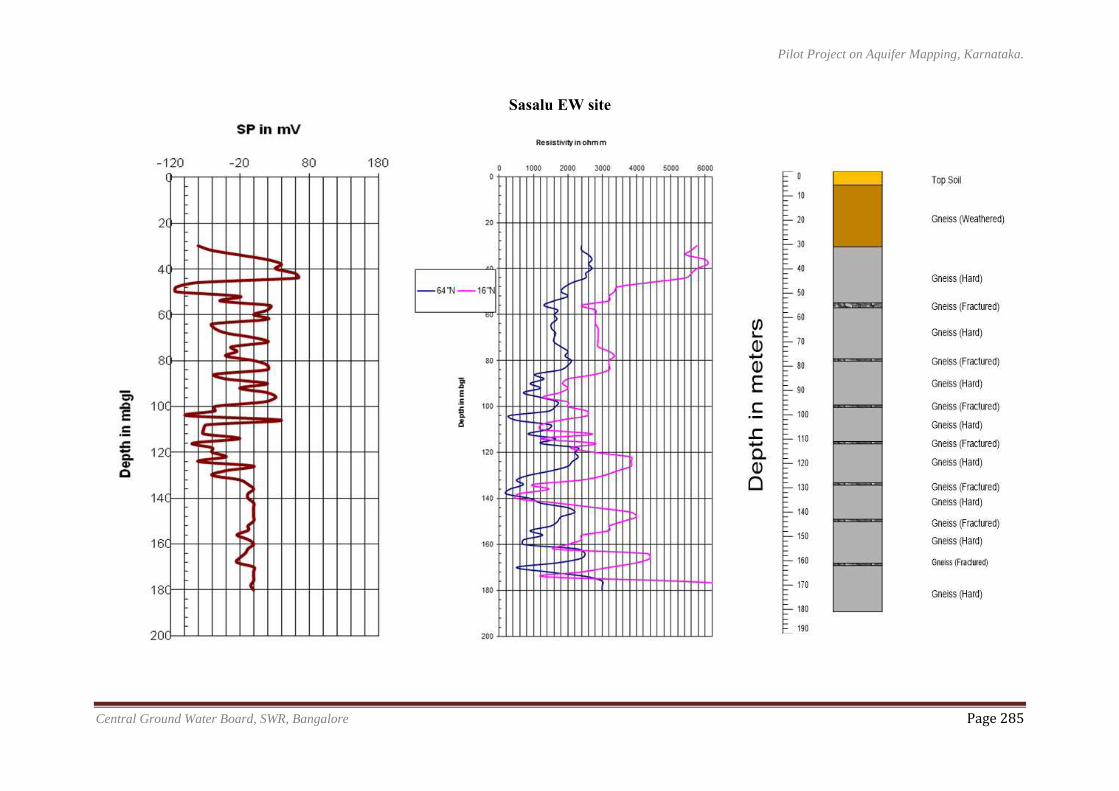
Pilot Project on Aquifer Mapping, Karnataka.
Central Ground Water Board, SWR, Bangalore Page 285
Sasalu EW site
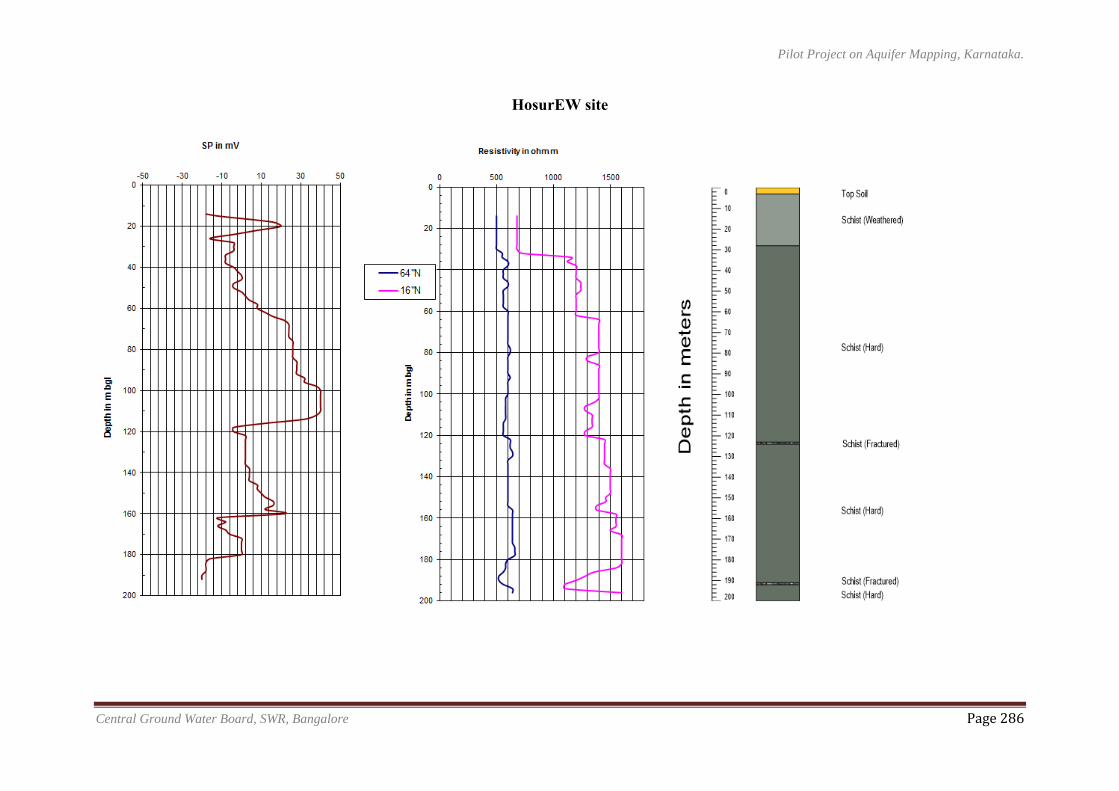
Pilot Project on Aquifer Mapping, Karnataka.
Central Ground Water Board, SWR, Bangalore Page 286
HosurEW site
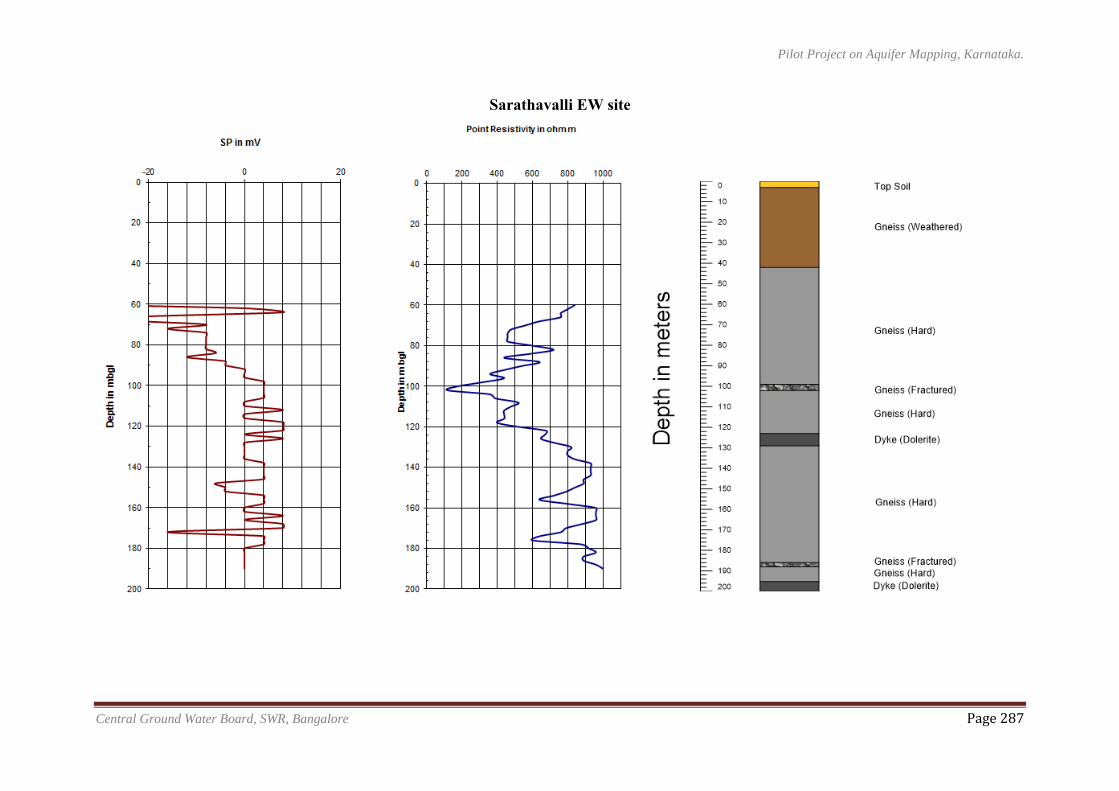
Pilot Project on Aquifer Mapping, Karnataka.
Central Ground Water Board, SWR, Bangalore Page 287
Sarathavalli EW site
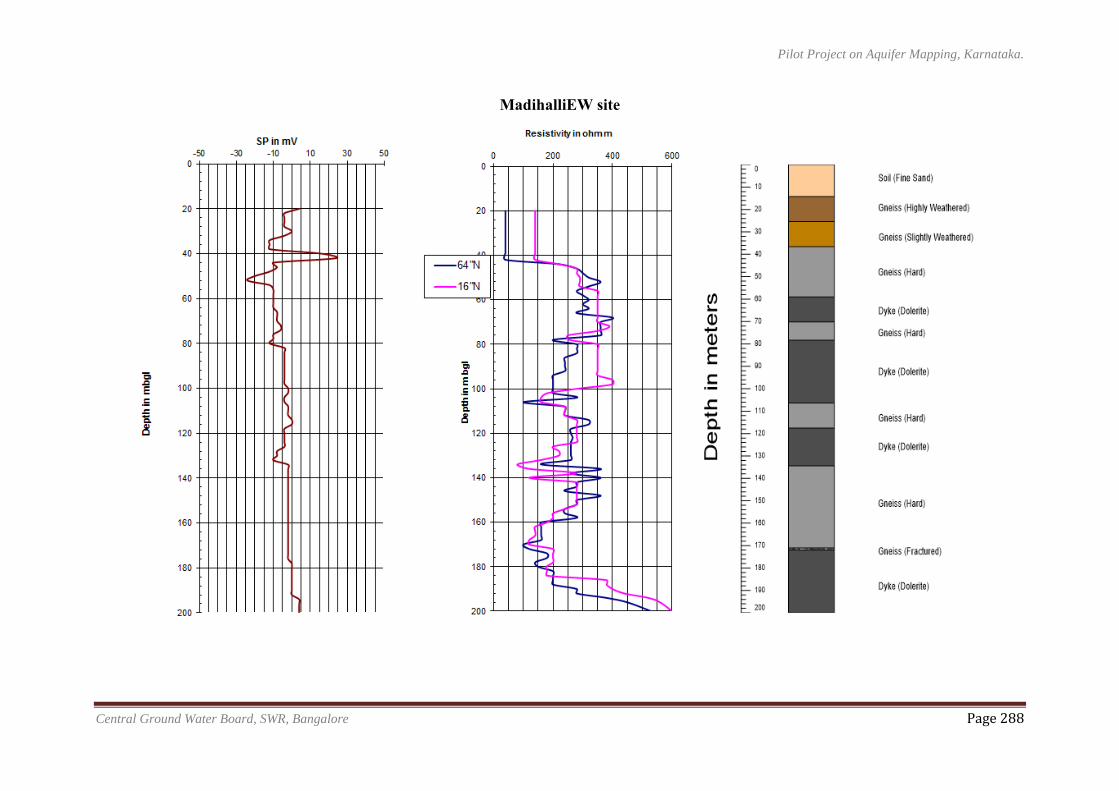
Pilot Project on Aquifer Mapping, Karnataka.
Central Ground Water Board, SWR, Bangalore Page 288
MadihalliEW site
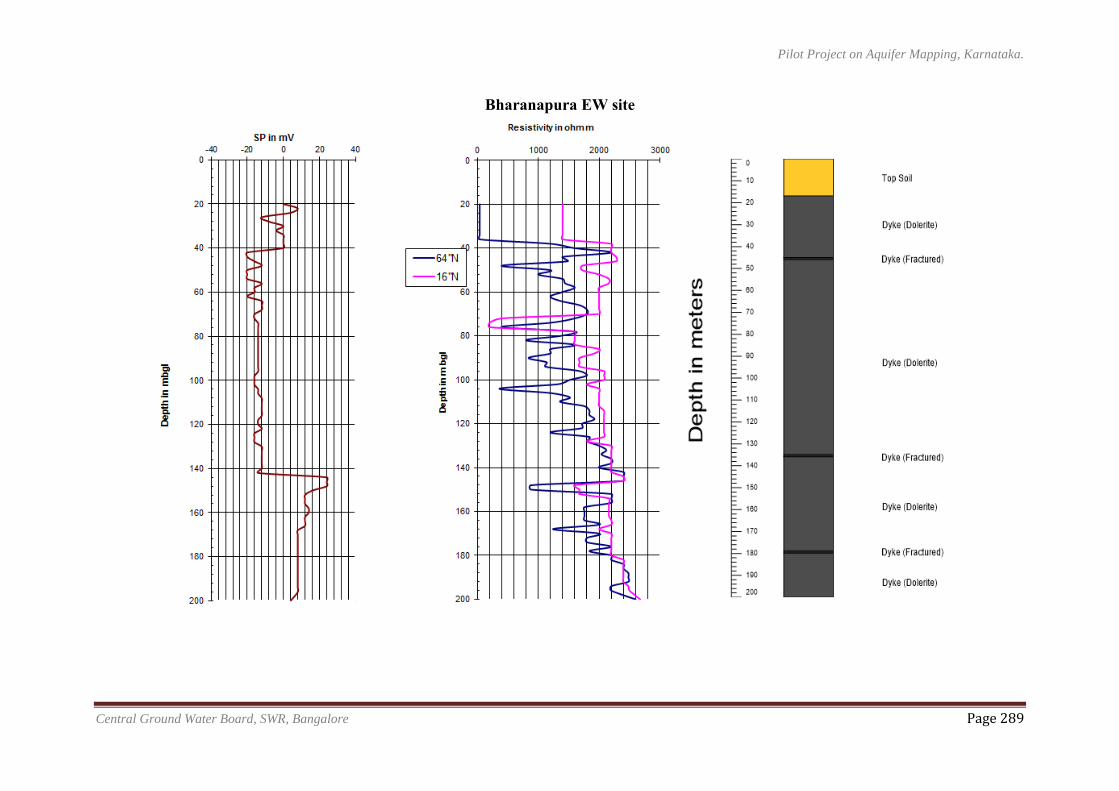
Pilot Project on Aquifer Mapping, Karnataka.
Central Ground Water Board, SWR, Bangalore Page 289
Bharanapura EW site
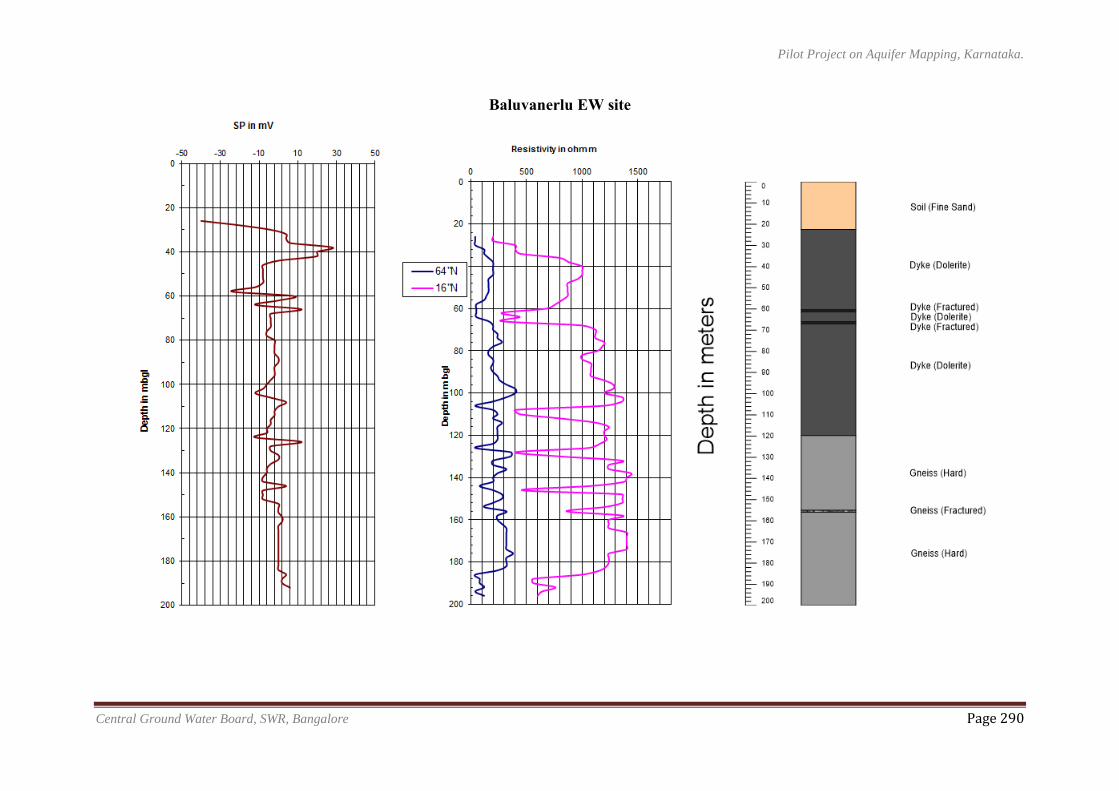
Pilot Project on Aquifer Mapping, Karnataka.
Central Ground Water Board, SWR, Bangalore Page 290
Baluvanerlu EW site
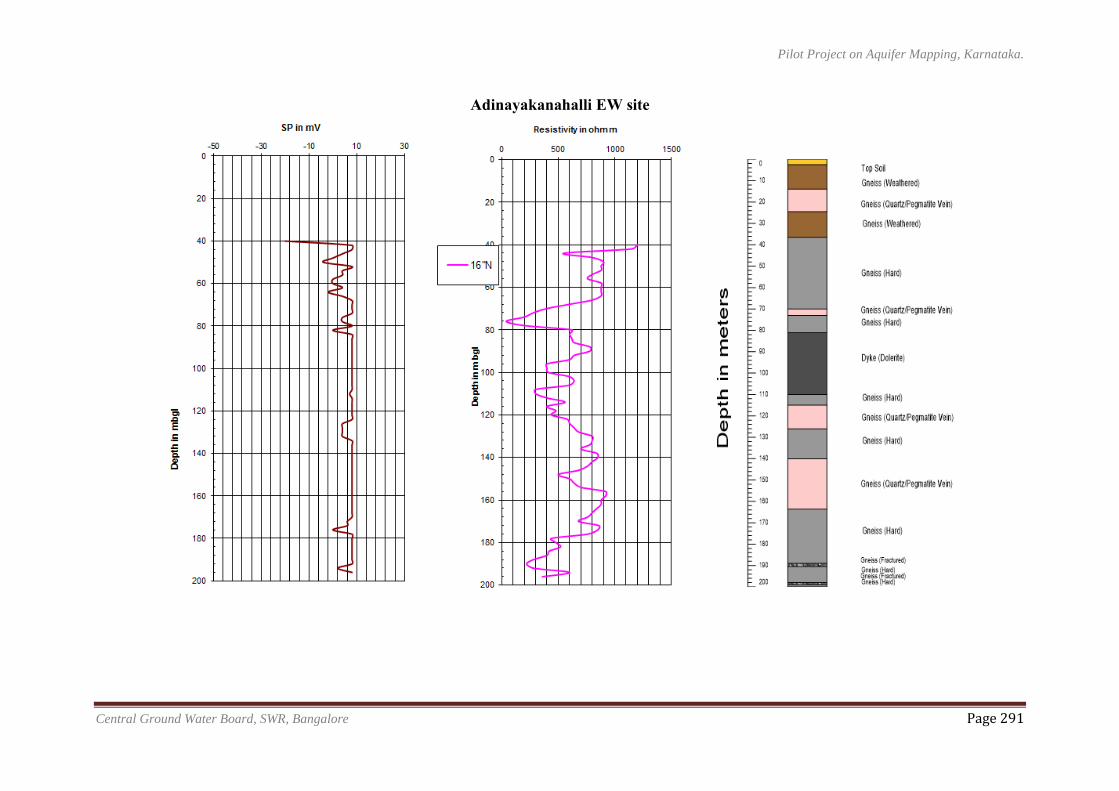
Pilot Project on Aquifer Mapping, Karnataka.
Central Ground Water Board, SWR, Bangalore Page 291
Adinayakanahalli EW site
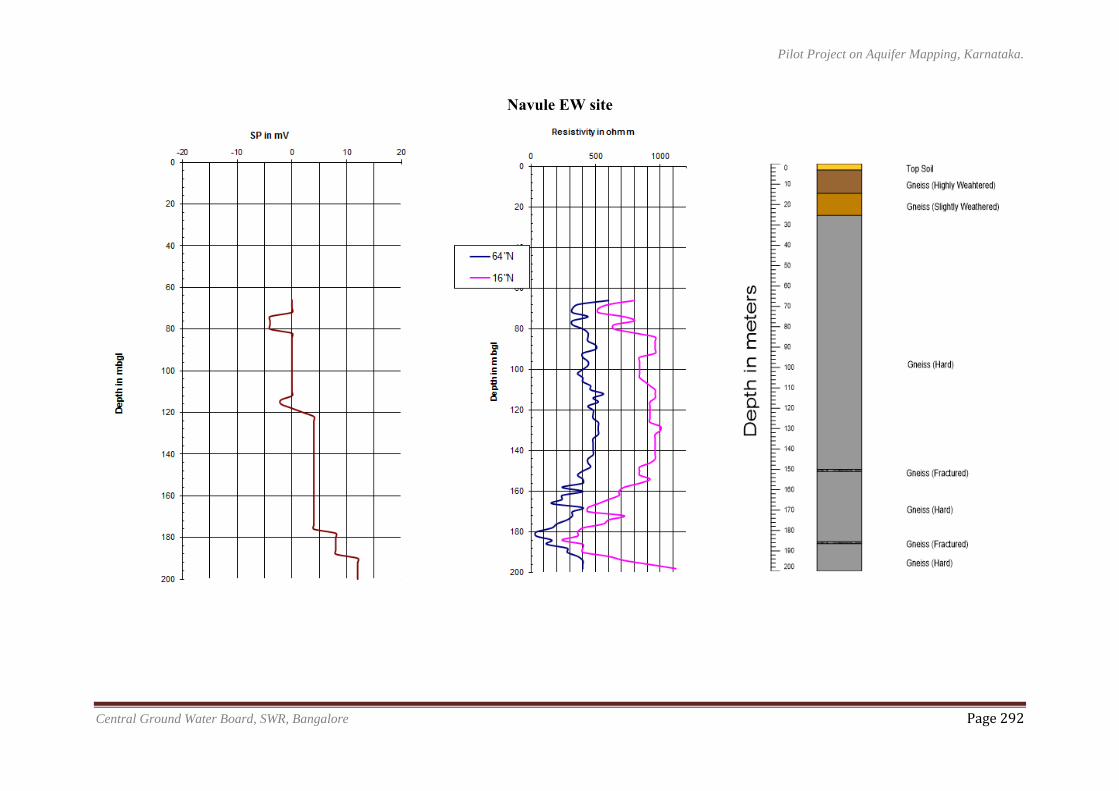
Pilot Project on Aquifer Mapping, Karnataka.
Central Ground Water Board, SWR, Bangalore Page 292
Navule EW site
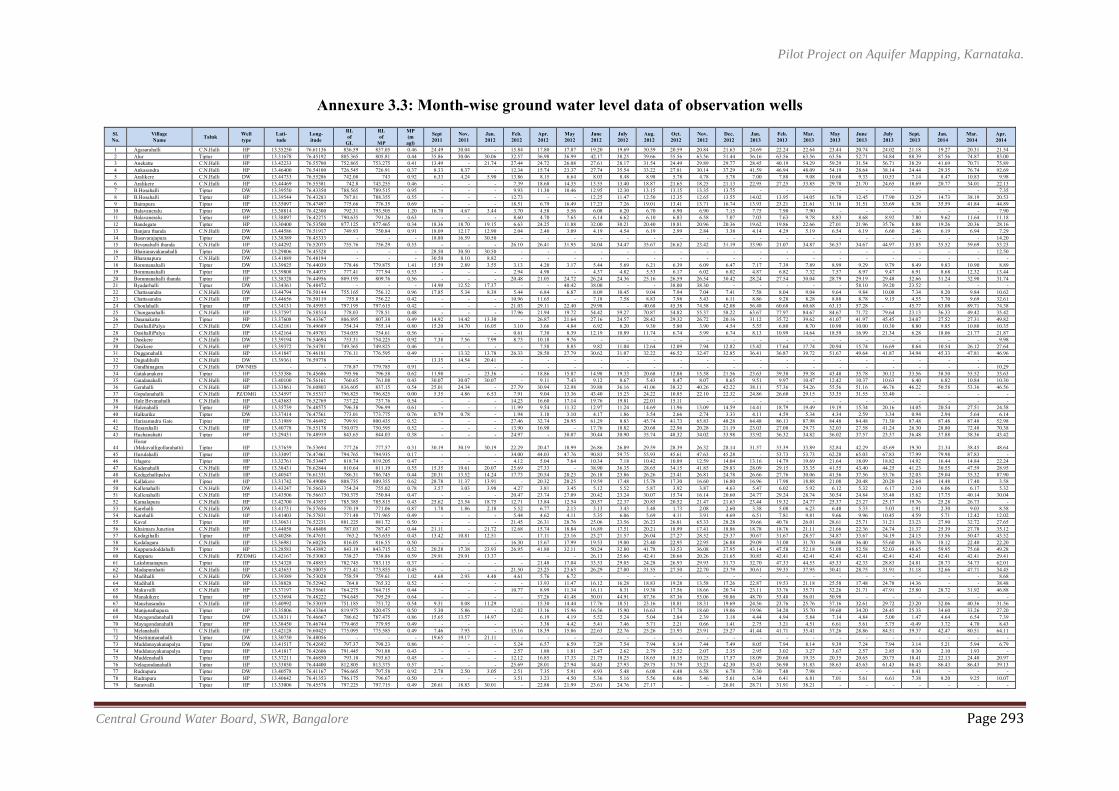
Pilot Project on Aquifer Mapping, Karnataka.
Central Ground Water Board, SWR, Bangalore Page 293
Annexure 3.3: Month-wise ground water level data of observation wells Sl. No.
Village Name Taluk Well
type Lati- tude
Long- itude
RL of
GL
RL of
MP
MP (m agl)
Sept 2011
Nov. 2011
Jan. 2012
Feb. 2012
Apr. 2012
May 2012
June 2012
July 2012
Aug. 2012
Oct. 2012
Nov. 2012
Dec. 2012
Jan. 2013
Feb. 2013
Mar. 2013
May 2013
June 2013
July 2013
Sept. 2013
Jan. 2014
Mar. 2014
Apr. 2014
1 Agasarahalli C.N.Halli HP 13.35250 76.61136 836.59 837.05 0.46 24.49 30.04 - 15.84 17.80 17.87 19.20 19.69 30.59 20.59 20.84 21.63 24.69 22.24 22.64 23.44 20.74 24.02 21.18 19.27 20.31 21.54 2 Alur Tiptur HP 13.31678 76.45192 805.365 805.81 0.44 35.86 30.06 30.06 32.57 36.98 36.99 42.17 38.25 39.66 55.56 63.56 51.44 56.16 63.56 63.56 63.56 52.71 54.84 88.39 87.56 74.87 83.00 3 Anekatte C.N.Halli HP 13.42233 76.55700 752.865 753.275 0.41 13.49 - 21.74 27.44 24.72 26.08 27.61 28.17 31.54 24.49 29.89 29.77 28.45 40.19 54.29 59.29 31.54 56.71 38.29 41.69 70.71 75.89 4 Ankasandra C.N.Halli HP 13.46400 76.54100 726.545 726.91 0.37 8.33 8.37 - 12.34 15.74 23.37 27.74 35.54 33.22 27.81 30.14 37.29 41.59 46.94 48.09 54.19 28.64 38.14 24.44 29.35 76.74 92.69 5 Aralikere C.N.Halli DW 13.44733 76.55286 742.08 743 0.92 6.33 4.24 5.90 13.86 8.15 6.64 8.03 8.48 8.98 5.78 4.78 5.78 7.00 7.88 9.08 10.68 9.33 10.53 7.14 8.47 10.83 9.98 6 Aralikere C.N.Halli HP 13.44469 76.55381 742.8 743.255 0.46 - - - 7.39 18.68 14.35 13.55 13.40 18.87 21.65 18.25 21.13 22.95 27.25 33.85 29.70 21.70 24.65 18.69 20.77 34.01 22.13 7 B.Hosahalli Tiptur DW 13.39550 76.43350 788.565 789.515 0.95 - - - 9.93 11.30 10.46 12.95 12.30 13.15 13.15 13.35 13.75 - - - - - - - - - 7.35 8 B.Hosahalli Tiptur HP 13.39544 76.43283 787.81 788.355 0.55 - - - 12.73 - - 12.25 11.47 12.50 12.35 12.65 13.55 14.02 13.95 14.05 16.70 12.45 17.90 13.29 14.73 38.19 20.53 9 Bairapura Tiptur HP 13.35097 76.47497 775.66 776.35 0.69 - - - 18.51 6.79 16.49 17.23 7.26 19.01 13.41 13.71 16.74 13.93 23.21 21.61 31.16 31.51 33.69 6.38 35.59 41.84 44.89 10 Balavaneralu Tiptur DW 13.38814 76.42300 792.31 793.505 1.20 16.70 4.67 3.44 3.70 4.58 5.56 6.08 6.20 6.70 6.90 6.90 7.15 7.75 7.90 7.90 - - - - - - 7.90 11 Balavaneralu Tiptur HP 13.38897 76.42275 790.635 791.26 0.63 - - - 8.60 4.70 7.65 6.14 6.62 6.10 6.83 6.58 7.07 7.03 7.63 9.78 8.83 8.68 8.92 7.80 9.62 11.64 11.18 12 Bandegate Tiptur HP 13.30400 76.53500 877.125 877.465 0.34 18.36 18.70 19.15 6.63 24.25 11.88 32.00 30.21 20.40 18.81 20.96 20.36 19.62 19.86 22.66 27.01 21.96 35.76 8.88 19.26 20.36 28.16 13 Banjara thanda C.N.Halli DW 13.44586 76.51917 749.93 750.84 0.91 18.09 12.17 12.90 2.04 2.40 3.09 4.19 4.54 6.19 2.99 2.84 3.38 4.14 4.29 5.19 6.54 6.19 6.60 2.46 6.19 6.94 7.29 14 Basavarajapura Tiptur DW 13.38389 76.45333 - - - 18.80 16.59 30.50 - - - - - - - - - - - - - - - - - - 14.20 15 Bevanahalli thanda C.N.Halli HP 13.44292 76.52075 755.76 756.29 0.53 - - - 26.10 26.41 31.95 34.04 34.47 35.67 26.62 23.42 31.19 33.90 21.07 34.87 36.57 34.67 44.97 33.85 35.52 59.69 53.23 16 Bhairanayakanahalli Tiptur DW 13.29806 76.45528 - - - 28.50 30.50 30.50 - - - - - - - - - - - - - - - - - - 12.50 17 Bharanapura C.N.Halli DW 13.41889 76.48194 - - - 30.50 8.10 8.82 - - - - - - - - - - - - - - - - - - - 18 Bommanahalli Tiptur DW 13.39825 76.44039 778.46 779.875 1.41 15.59 2.89 3.55 3.13 4.20 3.17 5.44 5.69 6.21 6.39 6.09 6.47 7.17 7.39 7.89 8.99 9.29 9.79 8.49 9.83 10.90 8.89 19 Bommanahalli Tiptur HP 13.39808 76.44075 777.41 777.94 0.53 - - - 2.94 4.98 - 4.37 4.82 5.53 6.17 6.02 6.02 4.87 6.82 7.32 7.57 8.97 9.47 6.91 8.68 12.32 13.44 20 Bommanahalli thanda Tiptur HP 13.38328 76.44956 809.195 809.76 0.56 - - - 20.48 21.05 24.72 26.24 24.36 25.16 26.59 26.54 30.42 28.24 27.54 30.04 28.79 29.19 29.48 32.66 31.24 32.90 31.74 21 Byadarhalli Tiptur DW 13.34361 76.48472 - - - 14.90 12.52 17.37 - - 40.42 38.00 - - 38.00 38.30 - - - - - 58.10 39.20 23.52 - - - 22 Chattasandra C.N.Halli DW 13.44794 76.50144 755.165 756.12 0.96 17.85 5.34 8.39 5.44 6.84 6.87 8.09 10.45 9.04 7.94 7.04 7.41 7.58 8.04 9.04 9.64 9.84 10.08 7.34 8.20 9.84 10.62 23 Chattasandra C.N.Halli HP 13.44656 76.50119 755.8 756.22 0.42 - - - 10.96 11.65 - 7.18 7.58 8.83 7.98 5.43 6.11 8.86 9.28 8.28 8.88 8.78 9.15 4.55 7.70 9.69 32.61 24 Choulahalli Tiptur HP 13.34131 76.45953 797.195 797.615 0.42 - - - 21.03 29.11 22.40 29.98 - 40.68 45.38 74.58 42.08 56.48 60.68 60.68 63.13 57.28 - 45.77 83.08 89.71 74.38 25 Chunganahalli C.N.Halli HP 13.37597 76.58514 778.03 778.51 0.48 - - - 17.96 21.94 19.72 54.42 59.27 70.87 54.82 55.37 58.22 63.67 77.97 84.67 84.67 71.72 79.64 23.13 36.33 49.42 35.42 26 Dasanakatte Tiptur HP 13.37608 76.43367 806.895 807.38 0.49 14.92 14.42 13.30 - 26.87 21.64 27.16 24.57 28.42 29.32 26.72 20.16 31.12 35.72 39.62 41.07 41.97 45.45 24.07 27.52 27.31 49.82 27 DasihalliPalya C.N.Halli DW 13.42181 76.49689 754.34 755.14 0.80 15.20 14.70 16.05 3.10 3.66 4.84 6.92 8.20 9.30 5.80 3.90 4.54 5.55 6.80 8.70 10.90 10.00 10.30 8.80 9.85 10.80 10.35 28 DasihalliPalya C.N.Halli HP 13.42164 76.49703 754.055 754.61 0.56 - - - 0.61 7.30 8.39 12.19 10.89 11.74 6.74 5.99 6.74 8.13 10.99 14.64 18.59 16.99 21.34 6.28 18.06 21.77 21.87 29 Dasikere C.N.Halli DW 13.39194 76.54694 753.31 754.225 0.92 7.38 7.56 7.99 8.73 10.18 9.76 - - - - - - - - - - - - - - - 9.98 30 Dasikere C.N.Halli HP 13.39372 76.54781 749.365 749.825 0.46 - - - - 7.58 8.85 9.82 11.04 12.64 12.09 7.94 12.82 15.42 17.64 17.74 20.94 15.74 16.69 8.64 10.54 26.12 27.64 31 Dugganahalli C.N.Halli HP 13.41847 76.46181 776.11 776.595 0.49 - 13.32 13.78 26.33 28.50 27.79 30.62 31.07 32.22 46.52 32.47 32.85 36.41 36.87 39.72 51.67 49.64 41.87 34.94 45.33 47.81 46.96 32 Dugudihalli C.N.Halli DW 13.39361 76.59778 - - - 13.35 14.54 20.41 - - - - - - - - - - - - - - - - - - - 33 Gandhinagara C.N.Halli DW/NHS - - 778.87 779.785 0.91 - - - - - - - - - - - - - - - - - - - - - 10.29 34 Gatakanakere Tiptur HP 13.35386 76.45686 795.96 796.58 0.62 11.98 - 23.36 - 18.86 15.87 14.98 19.33 20.68 12.88 15.58 21.56 23.63 39.38 39.38 43.48 35.78 30.12 33.56 38.50 55.52 33.63 35 Gaudanahalli C.N.Halli HP 13.40100 76.56161 760.65 761.08 0.43 30.07 30.07 30.07 - 9.11 7.43 9.12 8.67 5.43 8.47 8.07 8.65 9.51 9.97 10.47 12.42 10.37 10.63 6.40 6.82 10.84 10.30 36 Gerahalli C.N.Halli HP 13.33861 76.60803 836.605 837.15 0.54 25.01 24.34 - 27.79 30.94 32.98 39.88 36.16 41.06 38.32 40.26 42.22 38.11 57.36 54.26 55.56 51.16 46.76 46.22 50.58 53.36 46.56 37 Gopalanahalli C.N.Halli PZ/DMG 13.34597 76.55317 796.825 796.825 0.00 5.35 4.86 6.53 7.91 9.04 13.36 43.40 15.23 24.22 10.85 22.10 22.32 24.86 26.60 29.15 33.35 31.55 33.40 - - - - 38 Hale Bevanahalli C.N.Halli HP 13.43683 76.52769 737.22 737.76 0.54 - - - 14.23 16.60 17.14 19.76 19.81 22.01 15.11 - - - - - - - - - - - - 39 Halenahalli Tiptur HP 13.35739 76.48575 796.38 796.99 0.61 - - - 11.99 9.54 11.32 12.97 11.24 14.69 11.96 13.09 14.59 14.41 18.79 19.49 19.19 15.34 20.16 14.05 20.54 27.51 24.58 40 Halkurike Tiptur DW 13.37414 76.47561 773.01 773.775 0.76 0.79 0.78 - 1.94 3.18 3.10 4.17 1.86 3.54 2.66 2.74 3.33 4.11 4.59 5.34 4.34 2.59 3.34 0.94 2.94 5.64 6.14 41 Harisamudra Gate Tiptur HP 13.31989 76.46492 799.91 800.435 0.52 - - - 27.46 32.74 28.95 61.29 8.83 45.74 41.73 65.83 48.28 64.48 86.13 87.98 84.48 84.48 71.30 87.48 87.48 87.48 52.98 42 Hesarahalli C.N.Halli HP 13.40778 76.55178 750.075 750.595 0.52 - - - 13.90 16.90 - 17.76 18.82 20.68 22.96 20.28 21.19 23.03 27.08 29.73 32.03 27.58 41.24 26.30 28.80 72.48 70.38 43 Huchanahatti Tiptur HP 13.29431 76.48919 843.65 844.03 0.38 - - - 24.97 - 30.07 30.44 30.90 35.74 48.32 34.02 33.98 33.92 36.32 34.82 36.02 37.57 23.37 36.48 37.88 38.36 43.42
44 Hosur (Makuvalligollarahatti) Tiptur HP 13.37639 76.53694 777.26 777.57 0.31 30.19 30.19 30.19 22.29 20.47 18.99 26.86 26.89 29.59 28.39 26.32 28.14 31.57 33.39 33.89 52.84 42.29 45.69 19.30 21.34 38.45 48.64
45 Hurulahalli Tiptur HP 13.33097 76.47461 794.765 794.935 0.17 - - - 34.00 44.03 47.76 90.83 59.75 55.93 45.61 47.63 45.28 - 53.73 53.73 62.28 65.03 67.83 77.99 79.98 87.83 - 46 Irlagere Tiptur HP 13.32761 76.53447 818.74 819.205 0.47 - - - 4.12 5.04 7.64 10.34 7.18 10.42 10.89 12.59 14.04 13.16 14.79 19.69 21.64 18.09 18.82 14.92 16.44 14.84 22.24 47 Kadenahalli C.N.Halli HP 13.38431 76.62844 810.64 811.19 0.55 15.35 19.61 20.07 25.69 27.33 - 38.90 36.35 28.65 34.15 41.85 29.83 28.09 29.15 35.35 41.55 43.40 44.25 41.23 30.55 47.59 28.95 48 Kedigehallipalya C.N.Halli HP 13.40547 76.61331 786.31 786.745 0.44 20.31 13.52 14.24 17.73 20.54 20.23 26.18 23.86 26.26 23.41 26.81 24.78 26.66 27.76 30.06 41.56 37.56 53.76 32.03 29.04 35.32 87.90 49 Kallakere Tiptur HP 13.31742 76.49006 808.735 809.355 0.62 28.78 11.37 13.91 - 20.32 20.25 19.59 17.48 15.78 17.30 16.60 16.80 16.96 17.98 18.88 21.08 20.48 20.20 12.64 14.48 17.40 3.58 50 Kallenahalli C.N.Halli DW 13.43247 76.56633 754.24 755.02 0.78 3.57 3.03 3.98 4.27 3.81 3.45 5.12 5.52 5.87 3.92 3.87 4.63 5.47 6.02 5.92 6.12 5.32 6.17 2.10 6.06 6.17 5.32 51 Kallenahalli C.N.Halli HP 13.43506 76.56617 750.375 750.84 0.47 - - - 20.47 23.74 27.09 20.42 23.24 30.07 15.74 16.14 20.60 24.77 29.24 28.74 30.54 24.84 35.48 15.62 17.75 40.14 30.04 52 Kamalapura C.N.Halli HP 13.42700 76.43853 785.385 785.815 0.43 25.62 23.54 18.75 12.71 13.84 12.54 20.57 22.37 20.85 20.52 21.47 21.63 23.44 19.32 24.77 25.37 23.27 25.17 19.76 25.28 26.73 - 53 Karehalli C.N.Halli DW 13.41731 76.57656 770.19 771.06 0.87 1.78 1.86 2.18 5.52 6.77 2.13 3.13 3.43 3.48 1.73 2.08 2.60 3.38 5.08 6.23 6.48 5.33 5.03 1.91 2.30 9.03 8.58 54 Karehalli C.N.Halli HP 13.41403 76.57831 771.48 771.965 0.49 - - - 5.44 4.62 4.11 5.35 6.06 5.69 4.11 3.91 4.69 6.51 7.81 9.81 9.66 9.96 10.45 4.59 5.71 12.42 12.02 55 Kaval Tiptur HP 13.30631 76.52231 881.225 881.72 0.50 - - - 21.45 26.31 28.76 25.06 23.56 26.23 26.81 65.33 28.28 39.66 40.76 26.01 28.61 25.71 31.21 23.23 27.90 32.72 27.65 56 Khaimara Junction C.N.Halli HP 13.44058 76.48408 787.03 787.47 0.44 21.11 - 21.72 12.68 15.74 18.84 16.89 17.51 20.21 18.99 17.41 18.86 18.78 18.76 21.11 21.66 22.36 24.74 21.37 25.39 27.78 35.12 57 Kodagihalli Tiptur HP 13.40286 76.47631 763.2 763.635 0.43 13.42 10.81 12.51 - 17.11 23.16 23.27 21.57 26.04 27.27 28.52 25.37 30.67 31.67 28.57 34.87 33.67 34.19 24.15 33.56 50.47 43.52 58 Kodalagara C.N.Halli HP 13.36981 76.60236 816.05 816.55 0.50 - - - 16.30 15.67 17.99 19.53 19.00 23.40 22.95 22.95 26.88 29.09 31.00 31.70 36.00 36.40 55.60 10.76 18.12 22.40 22.20 59 Kuppuradoddahalli Tiptur HP 13.28583 76.43892 843.19 843.715 0.52 20.28 17.38 23.93 26.95 41.80 32.11 50.24 32.80 41.78 33.53 36.08 37.95 43.14 47.58 52.18 51.08 52.58 52.03 48.65 59.95 75.60 49.28 60 Kuppuru C.N.Halli PZ/DMG 13.42167 76.53083 738.27 738.86 0.59 29.91 29.91 13.37 - - - 26.13 25.66 42.41 20.66 20.26 21.65 30.85 42.41 42.41 42.41 42.41 42.41 42.41 42.41 42.41 29.41 61 Lakshmanapura Tiptur HP 13.34328 76.48853 782.745 783.115 0.37 - - - - 21.48 17.04 33.53 29.05 24.28 26.93 29.93 31.73 32.70 47.33 44.53 45.33 42.33 28.83 24.81 28.73 34.73 62.01 62 Madapurahatti C.N.Halli HP 13.43653 76.50075 773.41 773.855 0.45 - - - 21.50 23.25 23.63 26.29 27.00 31.55 27.50 22.70 23.79 30.61 39.35 37.95 30.41 28.75 31.91 31.18 32.66 47.71 34.45 63 Madihalli C.N.Halli DW 13.39389 76.53028 758.59 759.61 1.02 4.68 2.93 4.48 4.61 5.76 6.72 - - - - - - - - - - - - - - - 8.68 64 Madihalli C.N.Halli HP 13.38828 76.52942 764.8 765.32 0.52 - - - - 13.93 11.47 16.12 16.28 18.83 19.28 13.58 17.26 22.87 19.53 21.18 25.58 17.48 24.78 14.36 - - 38.48 65 Makuvalli C.N.Halli HP 13.37197 76.55661 764.275 764.715 0.44 - - - 10.77 8.99 11.34 16.11 8.31 19.38 17.56 18.66 20.74 23.11 33.76 35.71 32.26 21.71 47.91 25.80 28.72 31.92 46.88 66 Manakikere Tiptur HP 13.33694 76.48222 794.645 795.29 0.64 - - - - 37.26 41.48 50.01 44.91 87.36 87.36 53.06 50.86 48.70 53.48 56.01 50.98 - - - - - - 67 Manchasandra C.N.Halli HP 13.40992 76.53019 751.185 751.72 0.54 9.31 8.08 11.29 - 15.30 14.44 17.76 18.51 23.16 18.81 18.31 19.69 24.56 23.76 25.76 37.16 32.61 29.72 23.20 32.06 40.36 31.56 68 Manjunathapura Tiptur HP 13.35806 76.43364 819.975 820.475 0.50 5.30 5.86 - 12.02 13.16 15.96 16.56 15.90 16.63 17.78 18.60 19.06 19.96 34.20 35.70 39.60 34.20 24.45 25.33 34.60 33.26 27.20 69 Mayagondanahalli Tiptur DW 13.38311 76.46667 786.62 787.475 0.86 15.65 13.57 14.97 - 6.19 4.19 5.52 5.24 5.04 2.84 2.39 3.18 4.44 4.94 5.84 7.14 4.84 5.00 1.47 4.64 6.54 7.39 70 Mayagondanahalli Tiptur HP 13.38450 76.46744 779.465 779.95 0.49 - - - - 3.38 4.42 5.41 7.46 5.71 2.21 0.66 1.41 2.75 3.21 4.51 6.61 5.61 5.75 -0.49 3.72 4.70 8.43 71 Melanahalli C.N.Halli HP 13.42128 76.60425 775.095 775.585 0.49 7.46 7.93 - 15.16 18.39 15.86 22.63 22.76 25.26 21.93 23.91 25.27 41.44 41.71 35.41 37.26 28.86 84.51 39.37 42.47 80.51 64.11 72 Misetimmanahalli Tiptur DW 13.30750 76.48056 - - - 19.65 19.17 21.11 - - - - - - - - - - - - - - - - - - - 73 Muddanayakanapalya Tiptur DW 13.41517 76.42692 797.37 798.23 0.86 - - - 5.24 6.57 6.59 7.29 7.54 7.94 8.14 7.44 7.49 8.05 7.94 8.14 9.39 7.24 7.94 3.14 5.21 5.94 6.79 74 Muddanayakanapalya Tiptur HP 13.41817 76.42606 791.445 791.88 0.43 - - - 2.57 1.80 1.81 2.47 2.62 2.79 2.52 2.07 2.35 2.95 3.02 3.27 3.67 2.57 2.85 0.30 2.10 1.93 - 75 Muddenahalli Tiptur HP 13.37211 76.46850 793.18 793.63 0.45 - - - 12.12 16.85 17.33 21.75 18.25 18.65 18.15 10.25 17.57 18.09 20.60 19.35 20.35 20.65 20.75 18.41 22.13 24.40 20.97 76 Nelagondanahalli Tiptur HP 13.33850 76.44400 812.805 813.375 0.57 - - - 25.69 28.01 27.94 34.43 27.93 29.75 31.79 33.23 42.30 35.43 36.98 51.83 58.63 45.63 61.43 86.43 86.43 86.43 39.13 77 Rudrapura Tiptur DW 13.40578 76.41167 796.665 797.58 0.92 2.78 2.50 3.05 2.51 7.35 5.91 4.93 5.48 6.08 6.48 6.58 6.78 7.30 7.48 7.98 - - - 8.41 - - - 78 Rudrapura Tiptur HP 13.40642 76.41353 796.175 796.67 0.50 - - - 3.51 3.23 4.50 5.36 5.16 5.56 6.06 5.46 5.61 6.34 6.41 6.81 7.01 5.61 6.61 7.38 8.20 9.25 10.07 79 Saratvalli Tiptur HP 13.33006 76.45578 797.225 797.715 0.49 20.61 18.83 30.01 - 22.88 21.99 23.61 24.76 27.17 - - 26.01 28.71 31.91 38.21 - - - - - - -
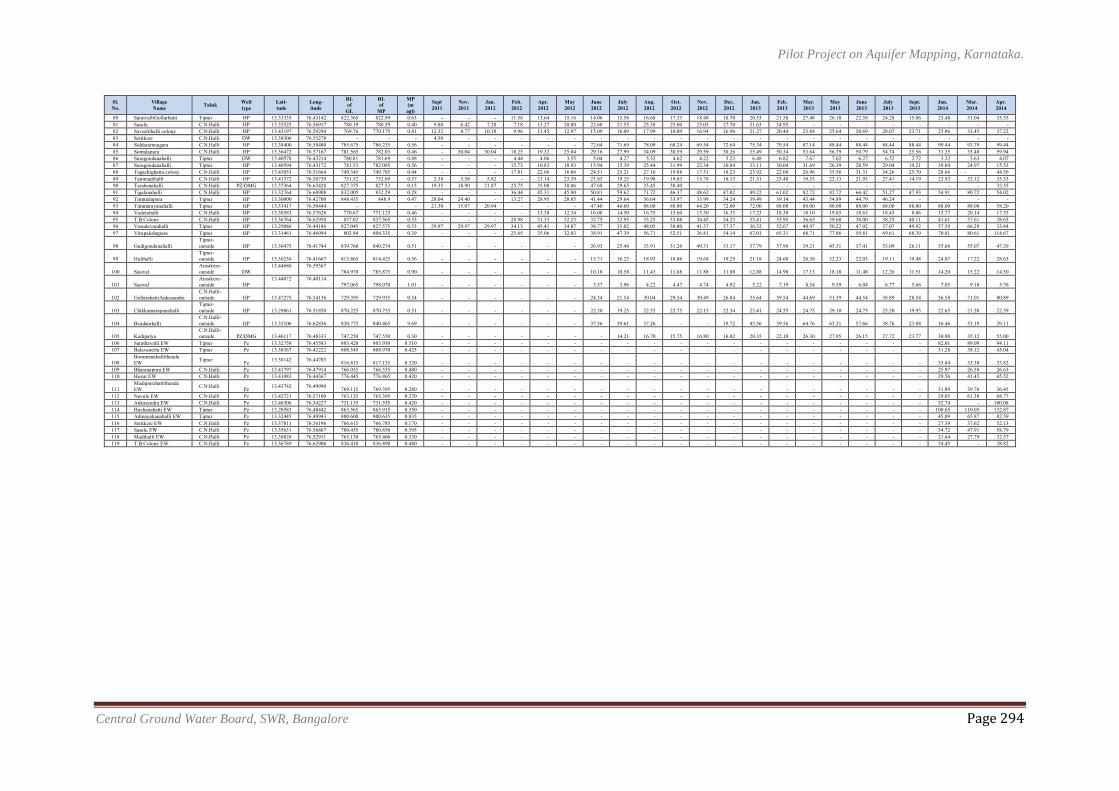
Pilot Project on Aquifer Mapping, Karnataka.
Central Ground Water Board, SWR, Bangalore Page 294
Sl. No.
Village Name Taluk Well
type Lati- tude
Long- itude
RL of
GL
RL of
MP
MP (m agl)
Sept 2011
Nov. 2011
Jan. 2012
Feb. 2012
Apr. 2012
May 2012
June 2012
July 2012
Aug. 2012
Oct. 2012
Nov. 2012
Dec. 2012
Jan. 2013
Feb. 2013
Mar. 2013
May 2013
June 2013
July 2013
Sept. 2013
Jan. 2014
Mar. 2014
Apr. 2014
80 SaratvalliGollarhatti Tiptur HP 13.33335 76.43142 822.365 822.99 0.63 - - - 11.58 13.64 15.16 14.06 15.58 16.68 17.33 18.48 18.70 20.53 21.58 27.48 26.18 22.58 24.28 15.06 23.48 31.04 35.35 81 Sasalu C.N.Halli HP 13.35525 76.56917 780.19 780.59 0.40 9.80 6.42 7.28 7.18 15.27 20.80 22.68 21.55 25.38 25.00 25.05 27.70 31.63 34.95 - - - - - - - - 82 Savsettihalli colony C.N.Halli HP 13.43197 76.59294 769.76 770.175 0.41 12.32 8.77 10.18 9.96 13.45 12.97 15.09 16.09 17.99 10.09 16.94 16.96 21.27 20.44 23.84 25.64 20.69 28.07 23.71 25.96 33.45 37.22 83 Settikere C.N.Halli DW 13.38306 76.55278 - - - 4.50 - - - - - - - - - - - - - - - - - - - - - 84 Siddaramnagara C.N.Halli HP 13.38400 76.58400 785.675 786.235 0.56 - - - - - - 72.64 71.69 78.09 68.24 69.54 72.64 75.34 79.54 87.14 88.44 88.44 88.44 88.44 99.44 93.79 99.44 85 Somalapura C.N.Halli HP 13.36472 76.57167 781.565 782.03 0.46 - 30.04 30.04 18.25 19.32 25.04 29.16 27.99 34.09 30.59 29.59 30.26 35.49 50.34 53.64 56.79 50.79 54.74 25.56 31.35 35.40 59.94 86 Suragondanahalli Tiptur DW 13.40578 76.43214 780.81 781.69 0.88 - - - 4.44 4.06 3.55 5.04 4.27 5.32 4.62 4.22 5.22 6.48 6.82 7.67 7.02 6.27 6.52 2.72 3.32 3.63 4.07 87 Suragondanahalli Tiptur HP 13.40594 76.43172 781.53 782.085 0.56 - - - 15.73 10.83 18.93 15.94 15.39 25.44 31.99 22.34 30.84 33.11 30.04 31.69 26.39 28.59 29.04 19.21 39.04 24.97 15.53 88 Tagachighatta colony C.N.Halli HP 13.43053 76.51664 749.345 749.785 0.44 - - - 17.81 22.66 16.66 24.51 25.21 27.16 19.88 17.51 18.23 23.92 22.06 26.96 35.56 31.31 34.26 25.70 28.66 - 44.56 89 Tammadihalli C.N.Halli HP 13.41372 76.50739 751.52 752.09 0.57 2.38 5.58 5.82 - 21.14 23.39 21.83 19.25 19.98 19.03 15.78 18.13 21.31 23.48 19.53 22.13 21.93 27.41 14.19 23.93 32.12 35.33 90 Tarabenahalli C.N.Halli PZ/DMG 13.37364 76.63428 827.375 827.53 0.15 19.35 18.90 21.87 25.75 35.08 30.06 47.68 29.65 33.45 30.40 - - - - - - - - - - - 32.55 91 Tigalanahalli C.N.Halli HP 13.32764 76.60908 832.005 832.29 0.28 - - - 36.44 45.31 45.90 50.81 59.62 71.72 46.37 48.62 47.02 49.22 61.02 82.72 82.72 66.42 51.27 47.93 54.91 80.72 54.02 92 Timmalapura Tiptur HP 13.30000 76.42700 848.435 848.9 0.47 28.04 24.40 - 13.27 28.95 28.05 41.44 29.64 36.64 33.97 33.99 34.24 39.49 39.14 43.44 54.89 44.79 46.24 - - - - 93 Timmarayanahalli Tiptur HP 13.33417 76.50444 - - - 21.30 15.07 20.94 - - - 47.40 46.60 88.00 88.00 64.20 72.00 72.00 88.00 88.00 88.00 88.00 88.00 88.00 88.00 88.00 58.20 94 Vaderahalli C.N.Halli HP 13.38583 76.57628 770.67 771.125 0.46 - - - - 13.38 12.34 16.08 14.50 16.75 15.60 15.30 16.35 17.23 18.30 18.10 19.85 18.65 18.45 8.06 15.77 20.14 17.55 95 T.B.Colony C.N.Halli HP 13.36764 76.62950 837.02 837.565 0.55 - - - 28.98 31.33 32.23 32.75 32.95 33.25 33.08 34.45 34.23 35.41 35.95 36.65 39.60 38.00 38.25 40.11 41.61 37.61 38.65 96 Vasudevarahalli Tiptur HP 13.29886 76.44186 827.045 827.575 0.53 29.97 29.97 29.97 34.13 45.41 34.87 38.77 35.02 48.05 38.00 41.37 37.37 36.52 52.67 40.97 50.22 47.02 37.07 49.92 57.59 66.29 33.84 97 Virupakshapura Tiptur HP 13.31461 76.46994 803.94 804.335 0.39 - - - 25.65 35.06 32.03 38.91 47.39 56.71 52.51 36.81 54.14 67.01 65.31 68.71 77.86 59.81 69.61 68.39 70.81 80.61 114.67
98 Gudigondanahalli Tiptur-outside HP 13.30475 76.41744 839.760 840.274 0.51 - - - - - - 26.93 25.48 33.91 31.26 49.31 33.17 37.79 37.96 39.21 45.31 37.41 53.09 26.11 35.66 55.07 47.29
99 Hulihalli Tiptur-outside HP 13.36236 76.41667 813.865 814.425 0.56 - - - - - - 15.71 16.23 18.93 18.86 19.68 19.29 21.18 24.68 26.38 32.33 22.03 19.11 19.48 24.07 17.22 28.63
100 Sasival Arasikere-outside DW
13.44686 76.39367 784.970 785.875 0.90 - - - - - - 10.18 10.58 11.43 11.68 11.88 11.88 12.88 14.98 17.13 18.18 11.48 12.26 11.51 14.20 15.22 14.50
101 Sasival Arasikere-outside HP
13.44072 76.40114 797.065 798.070 1.01 - - - - - - 3.57 3.96 4.22 4.47 4.74 4.92 5.22 7.19 8.54 9.59 6.04 6.77 5.66 7.05 9.18 5.76
102 GollarahattiAnkasandra C.N.Halli-outside HP 13.47275 76.54136 729.395 729.935 0.54 - - - - - - 24.34 21.54 30.04 29.54 30.49 26.84 35.64 39.54 44.69 51.39 44.54 38.89 28.54 36.58 71.01 80.89
103 Chikkamarapanahalli Tiptur-outside HP 13.29861 76.51850 870.225 870.735 0.51 - - - - - - 22.30 19.25 22.55 22.75 22.15 22.34 23.41 24.55 24.75 29.10 24.75 25.20 19.93 22.65 21.58 22.59
104 Byadarahalli C.N.Halli-outside HP 13.35106 76.62836 830.775 840.465 9.69 - - - - - - 37.56 39.61 37.26 - - 39.72 43.56 39.56 64.76 63.31 57.66 38.76 23.08 16.46 53.19 39.11
105 Kodipalya C.N.Halli-outside PZ/DMG 13.46117 76.48333 747.250 747.550 0.30 - - - - - - - 14.21 16.70 15.75 16.80 16.02 20.35 22.10 26.30 27.95 26.15 27.72 23.77 30.90 35.12 55.00
106 Sarathavalli EW Tiptur Pz 13.32758 76.45583 803.420 803.930 0.510 - - - - - - - - - - - - - - - - - - - 82.01 89.09 94.11 107 Balavanerlu EW Tiptur Pz 13.38367 76.42222 808.545 808.970 0.425 - - - - - - - - - - - - - - - - - - - 31.28 38.12 45.04
108 Bommanahallithanda EW Tiptur Pz 13.38142 76.44703 816.815 817.135 0.320 - - - - - - - - - - - - - - - - - - - 33.84 33.30 33.82
109 Bharanapura EW C.N.Halli Pz 13.41797 76.47914 766.055 766.535 0.480 - - - - - - - - - - - - - - - - - - - 25.97 26.58 26.63 110 Hosur EW C.N.Halli Pz 13.41983 76.44367 776.445 776.865 0.420 - - - - - - - - - - - - - - - - - - - 29.56 41.45 45.52
111 Madapurahattithanda EW C.N.Halli Pz 13.43742 76.49990 769.115 769.395 0.280 - - - - - - - - - - - - - - - - - - - 31.89 39.76 36.45
112 Navule EW C.N.Halli Pz 13.42721 76.57100 763.125 763.395 0.270 - - - - - - - - - - - - - - - - - - - 29.85 61.38 68.77 113 Ankasandra EW C.N.Halli Pz 13.46306 76.54227 731.135 731.555 0.420 - - - - - - - - - - - - - - - - - - - 52.74 - 100.08 114 Huchanahatti EW Tiptur Pz 13.28583 76.48442 863.565 863.915 0.350 - - - - - - - - - - - - - - - - - - - 100.65 110.05 132.87 115 Adinayakanahalli EW Tiptur Pz 13.32445 76.49943 800.600 800.635 0.035 - - - - - - - - - - - - - - - - - - - 45.09 65.87 82.59 116 Settikere EW C.N.Halli Pz 13.37811 76.56196 766.615 766.785 0.170 - - - - - - - - - - - - - - - - - - - 27.39 37.62 52.13 117 Sasalu EW C.N.Halli Pz 13.35631 76.56867 780.455 780.850 0.395 - - - - - - - - - - - - - - - - - - - 34.72 47.91 58.79 118 Madihalli EW C.N.Halli Pz 13.38828 76.52911 765.130 765.460 0.330 - - - - - - - - - - - - - - - - - - - 21.64 27.79 32.57 119 T.B.Colony EW C.N.Halli Pz 13.36789 76.62906 836.410 836.890 0.480 - - - - - - - - - - - - - - - - - - - 34.45 - 38.82
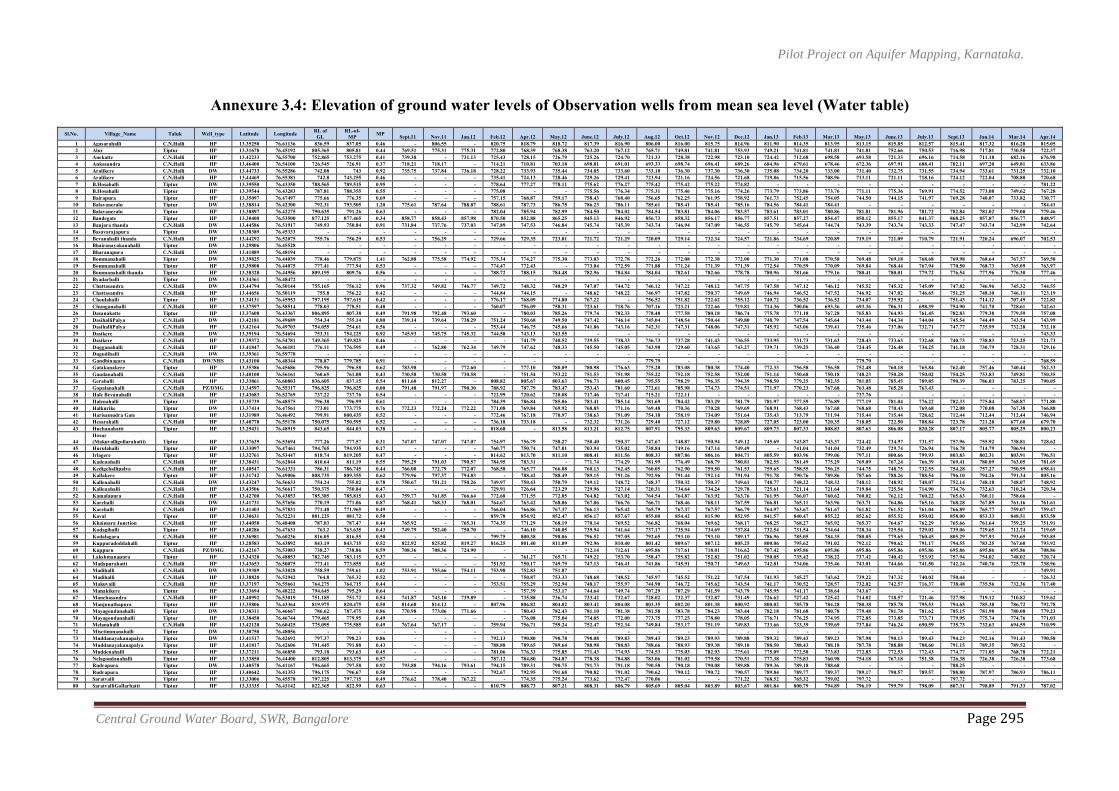
Pilot Project on Aquifer Mapping, Karnataka.
Central Ground Water Board, SWR, Bangalore Page 295
Annexure 3.4: Elevation of ground water levels of Observation wells from mean sea level (Water table) Sl.No. Village_Name Taluk Well_type Latitude Longitude RL of
GL RL-of-
MP MP Sept.11 Nov.11 Jan.12 Feb.12 Apr.12 May.12 June.12 July.12 Aug.12 Oct.12 Nov.12 Dec.12 Jan.13 Feb.13 Mar.13 May.13 June.13 July.13 Sept.13 Jan.14 Mar.14 Apr.14 1 Agasarahalli C.N.Halli HP 13.35250 76.61136 836.59 837.05 0.46 - 806.55 - 820.75 818.79 818.72 817.39 816.90 806.00 816.00 815.75 814.96 811.90 814.35 813.95 813.15 815.85 812.57 815.41 817.32 816.28 815.05 2 Alur Tiptur HP 13.31678 76.45192 805.365 805.81 0.44 769.51 775.31 775.31 772.80 768.39 768.38 763.20 767.12 765.71 749.81 741.81 753.93 749.21 741.81 741.81 741.81 752.66 750.53 716.98 717.81 730.50 722.37 3 Anekatte C.N.Halli HP 13.42233 76.55700 752.865 753.275 0.41 739.38 - 731.13 725.43 728.15 726.79 725.26 724.70 721.33 728.38 722.98 723.10 724.42 712.68 698.58 693.58 721.33 696.16 714.58 711.18 682.16 676.98 4 Ankasandra C.N.Halli HP 13.46400 76.54100 726.545 726.91 0.37 718.21 718.17 - 714.21 710.81 703.18 698.81 691.01 693.33 698.74 696.41 689.26 684.96 679.61 678.46 672.36 697.91 688.41 702.11 697.20 649.81 633.86 5 Aralikere C.N.Halli DW 13.44733 76.55286 742.08 743 0.92 735.75 737.84 736.18 728.22 733.93 735.44 734.05 733.60 733.10 736.30 737.30 736.30 735.08 734.20 733.00 731.40 732.75 731.55 734.94 733.61 731.25 732.10 6 Aralikere C.N.Halli HP 13.44469 76.55381 742.8 743.255 0.46 - - - 735.41 724.13 728.46 729.26 729.41 723.94 721.16 724.56 721.68 719.86 715.56 708.96 713.11 721.11 718.16 724.12 722.04 708.80 720.68 7 B.Hosahalli Tiptur DW 13.39550 76.43350 788.565 789.515 0.95 - - - 778.64 777.27 778.11 775.62 776.27 775.42 775.42 775.22 774.82 - - - - - - - - - 781.22 8 B.Hosahalli Tiptur HP 13.39544 76.43283 787.81 788.355 0.55 - - - 775.08 - - 775.56 776.34 775.31 775.46 775.16 774.26 773.79 773.86 773.76 771.11 775.36 769.91 774.52 773.08 749.62 767.28 9 Bairapura Tiptur HP 13.35097 76.47497 775.66 776.35 0.69 - - - 757.15 768.87 759.17 758.43 768.40 756.65 762.25 761.95 758.92 761.73 752.45 754.05 744.50 744.15 741.97 769.28 740.07 733.82 730.77
10 Balavaneralu Tiptur DW 13.38814 76.42300 792.31 793.505 1.20 775.61 787.64 788.87 788.61 787.73 786.75 786.23 786.11 785.61 785.41 785.41 785.16 784.56 784.41 784.41 - - - - - - 784.41 11 Balavaneralu Tiptur HP 13.38897 76.42275 790.635 791.26 0.63 - - - 782.04 785.94 782.99 784.50 784.02 784.54 783.81 784.06 783.57 783.61 783.01 780.86 781.81 781.96 781.72 782.84 781.02 779.00 779.46 12 Bandegate Tiptur HP 13.30400 76.53500 877.125 877.465 0.34 858.77 858.43 857.98 870.50 852.88 865.25 845.13 846.92 856.73 858.32 856.17 856.77 857.51 857.27 854.47 850.12 855.17 841.37 868.25 857.87 856.77 848.97 13 Banjara thanda C.N.Halli DW 13.44586 76.51917 749.93 750.84 0.91 731.84 737.76 737.03 747.89 747.53 746.84 745.74 745.39 743.74 746.94 747.09 746.55 745.79 745.64 744.74 743.39 743.74 743.33 747.47 743.74 742.99 742.64 14 Basavarajapura Tiptur DW 13.38389 76.45333 - - - - - - - - - - - - - - - - - - - - - - - - - 15 Bevanahalli thanda C.N.Halli HP 13.44292 76.52075 755.76 756.29 0.53 - 756.29 - 729.66 729.35 723.81 721.72 721.29 720.09 729.14 732.34 724.57 721.86 734.69 720.89 719.19 721.09 710.79 721.91 720.24 696.07 702.53 16 Bhairanayakanahalli Tiptur DW 13.29806 76.45528 - - - - - - - - - - - - - - - - - - - - - - - - - 17 Bharanapura C.N.Halli DW 13.41889 76.48194 - - - - - - - - - - - - - - - - - - - - - - - - - 18 Bommanahalli Tiptur DW 13.39825 76.44039 778.46 779.875 1.41 762.88 775.58 774.92 775.34 774.27 775.30 773.03 772.78 772.26 772.08 772.38 772.00 771.30 771.08 770.58 769.48 769.18 768.68 769.98 768.64 767.57 769.58 19 Bommanahalli Tiptur HP 13.39808 76.44075 777.41 777.94 0.53 - - - 774.47 772.43 - 773.04 772.59 771.88 771.24 771.39 771.39 772.54 770.59 770.09 769.84 768.44 767.94 770.50 768.73 765.09 763.97 20 Bommanahalli thanda Tiptur HP 13.38328 76.44956 809.195 809.76 0.56 - - - 788.72 788.15 784.48 782.96 784.84 784.04 782.61 782.66 778.78 780.96 781.66 779.16 780.41 780.01 779.72 776.54 777.96 776.30 777.46 21 Byadarhalli Tiptur DW 13.34361 76.48472 - - - - - - - - - - - - - - - - - - - - - - - - - 22 Chattasandra C.N.Halli DW 13.44794 76.50144 755.165 756.12 0.96 737.32 749.82 746.77 749.72 748.32 748.29 747.07 744.72 746.12 747.22 748.12 747.75 747.58 747.12 746.12 745.52 745.32 745.09 747.82 746.96 745.32 744.55 23 Chattasandra C.N.Halli HP 13.44656 76.50119 755.8 756.22 0.42 - - - 744.84 744.15 - 748.62 748.22 746.97 747.82 750.37 749.69 746.94 746.52 747.52 746.92 747.02 746.65 751.25 748.10 746.11 723.19 24 Choulahalli Tiptur HP 13.34131 76.45953 797.195 797.615 0.42 - - - 776.17 768.09 774.80 767.22 - 756.52 751.82 722.62 755.12 740.72 736.52 736.52 734.07 739.92 - 751.43 714.12 707.49 722.82 25 Chunganahalli C.N.Halli HP 13.37597 76.58514 778.03 778.51 0.48 - - - 760.07 756.09 758.31 723.61 718.76 707.16 723.21 722.66 719.81 714.36 700.06 693.36 693.36 706.31 698.39 754.90 741.70 728.61 742.61 26 Dasanakatte Tiptur HP 13.37608 76.43367 806.895 807.38 0.49 791.98 792.48 793.60 - 780.03 785.26 779.74 782.33 778.48 777.58 780.18 786.74 775.78 771.18 767.28 765.83 764.93 761.45 782.83 779.38 779.59 757.08 27 DasihalliPalya C.N.Halli DW 13.42181 76.49689 754.34 755.14 0.80 739.14 739.64 738.29 751.24 750.68 749.50 747.42 746.14 745.04 748.54 750.44 749.80 748.79 747.54 745.64 743.44 744.34 744.04 745.54 744.49 743.54 743.99 28 DasihalliPalya C.N.Halli HP 13.42164 76.49703 754.055 754.61 0.56 - - - 753.44 746.75 745.66 741.86 743.16 742.31 747.31 748.06 747.31 745.92 743.06 739.41 735.46 737.06 732.71 747.77 735.99 732.28 732.18 29 Dasikere C.N.Halli DW 13.39194 76.54694 753.31 754.225 0.92 745.93 745.75 745.32 744.58 743.13 743.55 - - - - - - - - - - - - - - - 743.33 30 Dasikere C.N.Halli HP 13.39372 76.54781 749.365 749.825 0.46 - - - - 741.79 740.52 739.55 738.33 736.73 737.28 741.43 736.55 733.95 731.73 731.63 728.43 733.63 732.68 740.73 738.83 723.25 721.73 31 Dugganahalli C.N.Halli HP 13.41847 76.46181 776.11 776.595 0.49 - 762.80 762.34 749.79 747.62 748.33 745.50 745.05 743.90 729.60 743.65 743.27 739.71 739.25 736.40 724.45 726.48 734.25 741.18 730.79 728.31 729.16 32 Dugudihalli C.N.Halli DW 13.39361 76.59778 - - - - - - - - - - - - - - - - - - - - - - - - - 33 Gandhinagara C.N.Halli DW/NHS 13.43100 76.48344 778.87 779.785 0.91 - - - - - - - - 779.79 - - - - - - 779.79 - - - - - 768.59 34 Gatakanakere Tiptur HP 13.35386 76.45686 795.96 796.58 0.62 783.98 - 772.60 - 777.10 780.09 780.98 776.63 775.28 783.08 780.38 774.40 772.33 756.58 756.58 752.48 760.18 765.84 762.40 757.46 740.44 762.33 35 Gaudanahalli C.N.Halli HP 13.40100 76.56161 760.65 761.08 0.43 730.58 730.58 730.58 - 751.54 753.22 751.53 751.98 755.22 752.18 752.58 752.00 751.14 750.68 750.18 748.23 750.28 750.02 754.25 753.83 749.81 750.35 36 Gerahalli C.N.Halli HP 13.33861 76.60803 836.605 837.15 0.54 811.60 812.27 - 808.82 805.67 803.63 796.73 800.45 795.55 798.29 796.35 794.39 798.50 779.25 782.35 781.05 785.45 789.85 790.39 786.03 783.25 790.05 37 Gopalanahalli C.N.Halli PZ/DMG 13.34597 76.55317 796.825 796.825 0.00 791.48 791.97 790.30 788.92 787.79 783.47 753.43 781.60 772.61 785.98 774.73 774.51 771.97 770.23 767.68 763.48 765.28 763.43 - - - - 38 Hale Bevanahalli C.N.Halli HP 13.43683 76.52769 737.22 737.76 0.54 - - - 722.99 720.62 720.08 717.46 717.41 715.21 722.11 - - - - - 737.76 - - - - - - 39 Halenahalli Tiptur HP 13.35739 76.48575 796.38 796.99 0.61 - - - 784.39 786.84 785.06 783.41 785.14 781.69 784.42 783.29 781.79 781.97 777.59 776.89 777.19 781.04 776.22 782.33 775.84 768.87 771.80 40 Halkurike Tiptur DW 13.37414 76.47561 773.01 773.775 0.76 772.23 772.24 772.22 771.08 769.84 769.92 768.85 771.16 769.48 770.36 770.28 769.69 768.91 768.43 767.68 768.68 770.43 769.68 772.08 770.08 767.38 766.88 41 Harisamudra Gate Tiptur HP 13.31989 76.46492 799.91 800.435 0.52 - - - 772.46 767.18 770.97 738.63 791.09 754.18 758.19 734.09 751.64 735.43 713.79 711.94 715.44 715.44 728.62 712.44 712.44 712.44 746.94 42 Hesarahalli C.N.Halli HP 13.40778 76.55178 750.075 750.595 0.52 - - - 736.18 733.18 - 732.32 731.26 729.40 727.12 729.80 728.89 727.05 723.00 720.35 718.05 722.50 708.84 723.78 721.28 677.60 679.70 43 Huchanahatti Tiptur HP 13.29431 76.48919 843.65 844.03 0.38 - - - 818.68 - 813.58 813.21 812.75 807.91 795.33 809.63 809.67 809.73 807.33 808.83 807.63 806.08 820.28 807.17 805.77 805.29 800.23
44 Hosur (Makuvalligollarahatti) Tiptur HP 13.37639 76.53694 777.26 777.57 0.31 747.07 747.07 747.07 754.97 756.79 758.27 750.40 750.37 747.67 748.87 750.94 749.12 745.69 743.87 743.37 724.42 734.97 731.57 757.96 755.92 738.81 728.62
45 Hurulahalli Tiptur HP 13.33097 76.47461 794.765 794.935 0.17 - - - 760.77 750.74 747.01 703.94 735.02 738.84 749.16 747.14 749.49 - 741.04 741.04 732.49 729.74 726.94 716.78 714.79 706.94 - 46 Irlagere Tiptur HP 13.32761 76.53447 818.74 819.205 0.47 - - - 814.62 813.70 811.10 808.41 811.56 808.33 807.86 806.16 804.71 805.59 803.96 799.06 797.11 800.66 799.93 803.83 802.31 803.91 796.51 47 Kadenahalli C.N.Halli HP 13.38431 76.62844 810.64 811.19 0.55 795.29 791.03 790.57 784.95 783.31 - 771.74 774.29 781.99 776.49 768.79 780.81 782.55 781.49 775.29 769.09 767.24 766.39 769.41 780.09 763.05 781.69 48 Kedigehallipalya C.N.Halli HP 13.40547 76.61331 786.31 786.745 0.44 766.00 772.79 772.07 768.58 765.77 766.08 760.13 762.45 760.05 762.90 759.50 761.53 759.65 758.55 756.25 744.75 748.75 732.55 754.28 757.27 750.99 698.41 49 Kallakere Tiptur HP 13.31742 76.49006 808.735 809.355 0.62 779.96 797.37 794.83 - 788.42 788.49 789.15 791.26 792.96 791.44 792.14 791.94 791.78 790.76 789.86 787.66 788.26 788.54 796.10 794.26 791.34 805.16 50 Kallenahalli C.N.Halli DW 13.43247 76.56633 754.24 755.02 0.78 750.67 751.21 750.26 749.97 750.43 750.79 749.12 748.72 748.37 750.32 750.37 749.61 748.77 748.22 748.32 748.12 748.92 748.07 752.14 748.18 748.07 748.92 51 Kallenahalli C.N.Halli HP 13.43506 76.56617 750.375 750.84 0.47 - - - 729.91 726.64 723.29 729.96 727.14 720.31 734.64 734.24 729.78 725.61 721.14 721.64 719.84 725.54 714.90 734.76 732.63 710.24 720.34 52 Kamalapura C.N.Halli HP 13.42700 76.43853 785.385 785.815 0.43 759.77 761.85 766.64 772.68 771.55 772.85 764.82 763.02 764.54 764.87 763.92 763.76 761.95 766.07 760.62 760.02 762.12 760.22 765.63 760.11 758.66 - 53 Karehalli C.N.Halli DW 13.41731 76.57656 770.19 771.06 0.87 768.41 768.33 768.01 764.67 763.42 768.06 767.06 766.76 766.71 768.46 768.11 767.59 766.81 765.11 763.96 763.71 764.86 765.16 768.28 767.89 761.16 761.61 54 Karehalli C.N.Halli HP 13.41403 76.57831 771.48 771.965 0.49 - - - 766.04 766.86 767.37 766.13 765.42 765.79 767.37 767.57 766.79 764.97 763.67 761.67 761.82 761.52 761.04 766.89 765.77 759.07 759.47 55 Kaval Tiptur HP 13.30631 76.52231 881.225 881.72 0.50 - - - 859.78 854.92 852.47 856.17 857.67 855.00 854.42 815.90 852.95 841.57 840.47 855.22 852.62 855.52 850.02 858.00 853.33 848.51 853.58 56 Khaimara Junction C.N.Halli HP 13.44058 76.48408 787.03 787.47 0.44 765.92 - 765.31 774.35 771.29 768.19 770.14 769.52 766.82 768.04 769.62 768.17 768.25 768.27 765.92 765.37 764.67 762.29 765.66 761.64 759.25 751.91 57 Kodagihalli Tiptur HP 13.40286 76.47631 763.2 763.635 0.43 749.79 752.40 750.70 - 746.10 740.05 739.94 741.64 737.17 735.94 734.69 737.84 732.54 731.54 734.64 728.34 729.54 729.02 739.06 729.65 712.74 719.69 58 Kodalagara C.N.Halli HP 13.36981 76.60236 816.05 816.55 0.50 - - - 799.75 800.38 798.06 796.52 797.05 792.65 793.10 793.10 789.17 786.96 785.05 784.35 780.05 779.65 760.45 805.29 797.93 793.65 793.85 59 Kuppuradoddahalli Tiptur HP 13.28583 76.43892 843.19 843.715 0.52 822.92 825.82 819.27 816.25 801.40 811.09 792.96 810.40 801.42 809.67 807.12 805.25 800.06 795.62 791.02 792.12 790.62 791.17 794.55 783.25 767.60 793.92 60 Kuppuru C.N.Halli PZ/DMG 13.42167 76.53083 738.27 738.86 0.59 708.36 708.36 724.90 - - - 712.14 712.61 695.86 717.61 718.01 716.62 707.42 695.86 695.86 695.86 695.86 695.86 695.86 695.86 695.86 708.86 61 Lakshmanapura Tiptur HP 13.34328 76.48853 782.745 783.115 0.37 - - - - 761.27 765.71 749.22 753.70 758.47 755.82 752.82 751.02 750.05 735.42 738.22 737.42 740.42 753.92 757.94 754.02 748.02 720.74 62 Madapurahatti C.N.Halli HP 13.43653 76.50075 773.41 773.855 0.45 - - - 751.92 750.17 749.79 747.13 746.41 741.86 745.91 750.71 749.63 742.81 734.06 735.46 743.01 744.66 741.50 742.24 740.76 725.70 738.96 63 Madihalli C.N.Halli DW 13.39389 76.53028 758.59 759.61 1.02 753.91 755.66 754.11 753.98 752.83 751.87 - - - - - - - - - - - - - - - 749.91 64 Madihalli C.N.Halli HP 13.38828 76.52942 764.8 765.32 0.52 - - - - 750.87 753.33 748.68 748.52 745.97 745.52 751.22 747.54 741.93 745.27 743.62 739.22 747.32 740.02 750.44 - - 726.32 65 Makuvalli C.N.Halli HP 13.37197 76.55661 764.275 764.715 0.44 - - - 753.51 755.29 752.94 748.17 755.97 744.90 746.72 745.62 743.54 741.17 730.52 728.57 732.02 742.57 716.37 738.48 735.56 732.36 717.40 66 Manakikere Tiptur HP 13.33694 76.48222 794.645 795.29 0.64 - - - - 757.39 753.17 744.64 749.74 707.29 707.29 741.59 743.79 745.95 741.17 738.64 743.67 - - - - - - 67 Manchasandra C.N.Halli HP 13.40992 76.53019 751.185 751.72 0.54 741.87 743.10 739.89 - 735.88 736.74 733.42 732.67 728.02 732.37 732.87 731.49 726.62 727.42 725.42 714.02 718.57 721.46 727.98 719.12 710.82 719.62 68 Manjunathapura Tiptur HP 13.35806 76.43364 819.975 820.475 0.50 814.68 814.12 - 807.96 806.82 804.02 803.42 804.08 803.35 802.20 801.38 800.92 800.02 785.78 784.28 780.38 785.78 795.53 794.65 785.38 786.72 792.78 69 Mayagondanahalli Tiptur DW 13.38311 76.46667 786.62 787.475 0.86 770.98 773.06 771.66 - 780.43 782.43 781.10 781.38 781.58 783.78 784.23 783.44 782.18 781.68 780.78 779.48 781.78 781.62 785.15 781.98 780.08 779.23 70 Mayagondanahalli Tiptur HP 13.38450 76.46744 779.465 779.95 0.49 - - - - 776.08 775.04 774.05 772.00 773.75 777.25 778.80 778.05 776.71 776.25 774.95 772.85 773.85 773.71 779.95 775.74 774.76 771.03 71 Melanahalli C.N.Halli HP 13.42128 76.60425 775.095 775.585 0.49 767.64 767.17 - 759.94 756.71 759.24 752.47 752.34 749.84 753.17 751.19 749.83 733.66 733.39 739.69 737.84 746.24 690.59 735.73 732.63 694.59 710.99 72 Misetimmanahalli Tiptur DW 13.30750 76.48056 - - - - - - - - - - - - - - - - - - - - - - - - - 73 Muddanayakanapalya Tiptur DW 13.41517 76.42692 797.37 798.23 0.86 - - - 792.13 790.80 790.78 790.08 789.83 789.43 789.23 789.93 789.88 789.32 789.43 789.23 787.98 790.13 789.43 794.23 792.16 791.43 790.58 74 Muddanayakanapalya Tiptur HP 13.41817 76.42606 791.445 791.88 0.43 - - - 788.88 789.65 789.64 788.98 788.83 788.66 788.93 789.38 789.10 788.50 788.43 788.18 787.78 788.88 788.60 791.15 789.35 789.52 - 75 Muddenahalli Tiptur HP 13.37211 76.46850 793.18 793.63 0.45 - - - 781.06 776.33 775.85 771.43 774.93 774.53 775.03 782.93 775.61 775.09 772.58 773.83 772.83 772.53 772.43 774.77 771.05 768.78 772.21 76 Nelagondanahalli Tiptur HP 13.33850 76.44400 812.805 813.375 0.57 - - - 787.12 784.80 784.87 778.38 784.88 783.06 781.02 779.58 770.51 777.38 775.83 760.98 754.18 767.18 751.38 726.38 726.38 726.38 773.68 77 Rudrapura Tiptur DW 13.40578 76.41167 796.665 797.58 0.92 793.88 794.16 793.61 794.15 789.31 790.75 791.73 791.18 790.58 790.18 790.08 789.88 789.36 789.18 788.68 - - - 788.25 - - - 78 Rudrapura Tiptur HP 13.40642 76.41353 796.175 796.67 0.50 - - - 792.67 792.95 791.68 790.82 791.02 790.62 790.12 790.72 790.57 789.84 789.77 789.37 789.17 790.57 789.57 788.80 787.97 786.93 786.11 79 Saratvalli Tiptur HP 13.33006 76.45578 797.225 797.715 0.49 776.62 778.40 767.22 - 774.35 775.24 773.62 772.47 770.06 - - 771.22 768.52 765.32 759.02 797.72 - - 797.72 - - - 80 SaratvalliGollarhatti Tiptur HP 13.33335 76.43142 822.365 822.99 0.63 - - - 810.79 808.73 807.21 808.31 806.79 805.69 805.04 803.89 803.67 801.84 800.79 794.89 796.19 799.79 798.09 807.31 798.89 791.33 787.02
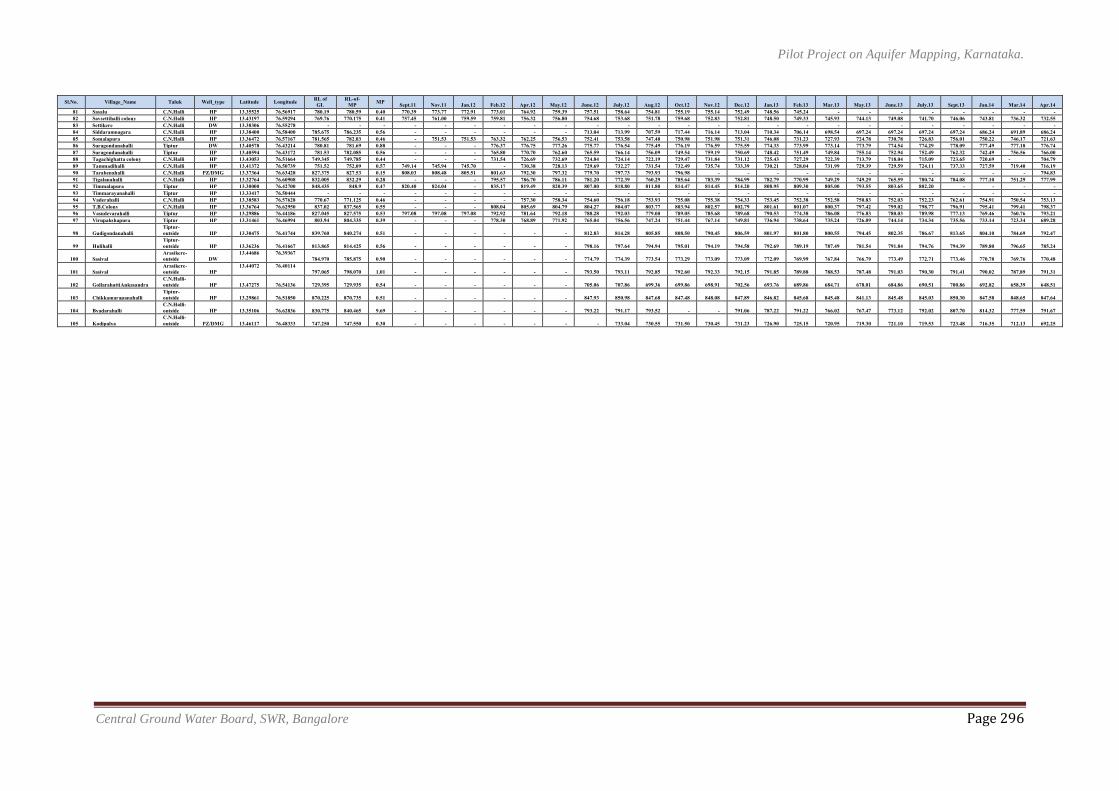
Pilot Project on Aquifer Mapping, Karnataka.
Central Ground Water Board, SWR, Bangalore Page 296
Sl.No. Village_Name Taluk Well_type Latitude Longitude RL of GL
RL-of-MP MP Sept.11 Nov.11 Jan.12 Feb.12 Apr.12 May.12 June.12 July.12 Aug.12 Oct.12 Nov.12 Dec.12 Jan.13 Feb.13 Mar.13 May.13 June.13 July.13 Sept.13 Jan.14 Mar.14 Apr.14
81 Sasalu C.N.Halli HP 13.35525 76.56917 780.19 780.59 0.40 770.39 773.77 772.91 773.01 764.92 759.39 757.51 758.64 754.81 755.19 755.14 752.49 748.56 745.24 - - - - - - - - 82 Savsettihalli colony C.N.Halli HP 13.43197 76.59294 769.76 770.175 0.41 757.45 761.00 759.59 759.81 756.32 756.80 754.68 753.68 751.78 759.68 752.83 752.81 748.50 749.33 745.93 744.13 749.08 741.70 746.06 743.81 736.32 732.55 83 Settikere C.N.Halli DW 13.38306 76.55278 - - - - - - - - - - - - - - - - - - - - - - - - - 84 Siddaramnagara C.N.Halli HP 13.38400 76.58400 785.675 786.235 0.56 - - - - - - 713.04 713.99 707.59 717.44 716.14 713.04 710.34 706.14 698.54 697.24 697.24 697.24 697.24 686.24 691.89 686.24 85 Somalapura C.N.Halli HP 13.36472 76.57167 781.565 782.03 0.46 - 751.53 751.53 763.32 762.25 756.53 752.41 753.58 747.48 750.98 751.98 751.31 746.08 731.23 727.93 724.78 730.78 726.83 756.01 750.22 746.17 721.63 86 Suragondanahalli Tiptur DW 13.40578 76.43214 780.81 781.69 0.88 - - - 776.37 776.75 777.26 775.77 776.54 775.49 776.19 776.59 775.59 774.33 773.99 773.14 773.79 774.54 774.29 778.09 777.49 777.18 776.74 87 Suragondanahalli Tiptur HP 13.40594 76.43172 781.53 782.085 0.56 - - - 765.80 770.70 762.60 765.59 766.14 756.09 749.54 759.19 750.69 748.42 751.49 749.84 755.14 752.94 752.49 762.32 742.49 756.56 766.00 88 Tagachighatta colony C.N.Halli HP 13.43053 76.51664 749.345 749.785 0.44 - - - 731.54 726.69 732.69 724.84 724.14 722.19 729.47 731.84 731.12 725.43 727.29 722.39 713.79 718.04 715.09 723.65 720.69 - 704.79 89 Tammadihalli C.N.Halli HP 13.41372 76.50739 751.52 752.09 0.57 749.14 745.94 745.70 - 730.38 728.13 729.69 732.27 731.54 732.49 735.74 733.39 730.21 728.04 731.99 729.39 729.59 724.11 737.33 727.59 719.40 716.19 90 Tarabenahalli C.N.Halli PZ/DMG 13.37364 76.63428 827.375 827.53 0.15 808.03 808.48 805.51 801.63 792.30 797.32 779.70 797.73 793.93 796.98 - - - - - - - - - - - 794.83 91 Tigalanahalli C.N.Halli HP 13.32764 76.60908 832.005 832.29 0.28 - - - 795.57 786.70 786.11 781.20 772.39 760.29 785.64 783.39 784.99 782.79 770.99 749.29 749.29 765.59 780.74 784.08 777.10 751.29 777.99 92 Timmalapura Tiptur HP 13.30000 76.42700 848.435 848.9 0.47 820.40 824.04 - 835.17 819.49 820.39 807.00 818.80 811.80 814.47 814.45 814.20 808.95 809.30 805.00 793.55 803.65 802.20 - - - - 93 Timmarayanahalli Tiptur HP 13.33417 76.50444 - - - - - - - - - - - - - - - - - - - - - - - - - 94 Vaderahalli C.N.Halli HP 13.38583 76.57628 770.67 771.125 0.46 - - - - 757.30 758.34 754.60 756.18 753.93 755.08 755.38 754.33 753.45 752.38 752.58 750.83 752.03 752.23 762.61 754.91 750.54 753.13 95 T.B.Colony C.N.Halli HP 13.36764 76.62950 837.02 837.565 0.55 - - - 808.04 805.69 804.79 804.27 804.07 803.77 803.94 802.57 802.79 801.61 801.07 800.37 797.42 799.02 798.77 796.91 795.41 799.41 798.37 96 Vasudevarahalli Tiptur HP 13.29886 76.44186 827.045 827.575 0.53 797.08 797.08 797.08 792.92 781.64 792.18 788.28 792.03 779.00 789.05 785.68 789.68 790.53 774.38 786.08 776.83 780.03 789.98 777.13 769.46 760.76 793.21 97 Virupakshapura Tiptur HP 13.31461 76.46994 803.94 804.335 0.39 - - - 778.30 768.89 771.92 765.04 756.56 747.24 751.44 767.14 749.81 736.94 738.64 735.24 726.09 744.14 734.34 735.56 733.14 723.34 689.28
98 Gudigondanahalli Tiptur-outside HP 13.30475 76.41744 839.760 840.274 0.51 - - - - - - 812.83 814.28 805.85 808.50 790.45 806.59 801.97 801.80 800.55 794.45 802.35 786.67 813.65 804.10 784.69 792.47
99 Hulihalli Tiptur-outside HP 13.36236 76.41667 813.865 814.425 0.56 - - - - - - 798.16 797.64 794.94 795.01 794.19 794.58 792.69 789.19 787.49 781.54 791.84 794.76 794.39 789.80 796.65 785.24
100 Sasival Arasikere-outside DW
13.44686 76.39367 784.970 785.875 0.90 - - - - - - 774.79 774.39 773.54 773.29 773.09 773.09 772.09 769.99 767.84 766.79 773.49 772.71 773.46 770.78 769.76 770.48
101 Sasival Arasikere-outside HP
13.44072 76.40114 797.065 798.070 1.01 - - - - - - 793.50 793.11 792.85 792.60 792.33 792.15 791.85 789.88 788.53 787.48 791.03 790.30 791.41 790.02 787.89 791.31
102 GollarahattiAnkasandra C.N.Halli-outside HP 13.47275 76.54136 729.395 729.935 0.54 - - - - - - 705.06 707.86 699.36 699.86 698.91 702.56 693.76 689.86 684.71 678.01 684.86 690.51 700.86 692.82 658.39 648.51
103 Chikkamarapanahalli Tiptur-outside HP 13.29861 76.51850 870.225 870.735 0.51 - - - - - - 847.93 850.98 847.68 847.48 848.08 847.89 846.82 845.68 845.48 841.13 845.48 845.03 850.30 847.58 848.65 847.64
104 Byadarahalli C.N.Halli-outside HP 13.35106 76.62836 830.775 840.465 9.69 - - - - - - 793.22 791.17 793.52 - - 791.06 787.22 791.22 766.02 767.47 773.12 792.02 807.70 814.32 777.59 791.67
105 Kodipalya C.N.Halli-outside PZ/DMG 13.46117 76.48333 747.250 747.550 0.30 - - - - - - - 733.04 730.55 731.50 730.45 731.23 726.90 725.15 720.95 719.30 721.10 719.53 723.48 716.35 712.13 692.25
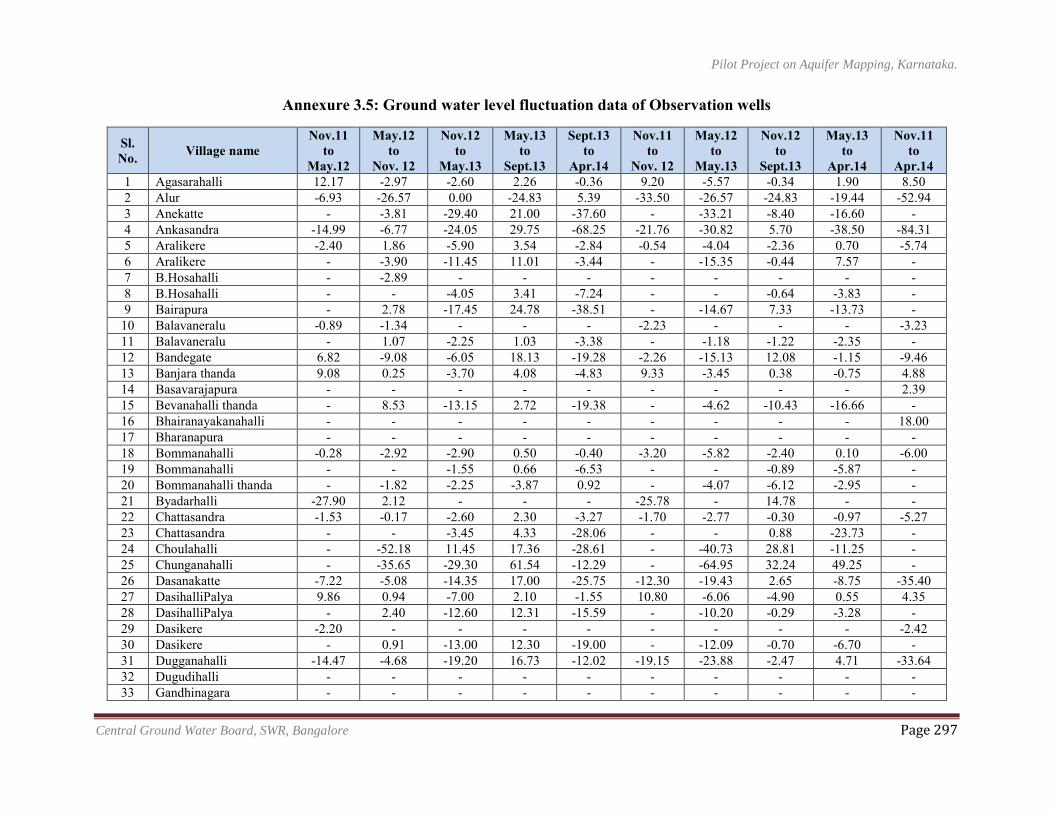
Pilot Project on Aquifer Mapping, Karnataka.
Central Ground Water Board, SWR, Bangalore Page 297
Annexure 3.5: Ground water level fluctuation data of Observation wells
Sl. No. Village name
Nov.11 to
May.12
May.12 to
Nov. 12
Nov.12 to
May.13
May.13 to
Sept.13
Sept.13 to
Apr.14
Nov.11 to
Nov. 12
May.12 to
May.13
Nov.12 to
Sept.13
May.13 to
Apr.14
Nov.11 to
Apr.14 1 Agasarahalli 12.17 -2.97 -2.60 2.26 -0.36 9.20 -5.57 -0.34 1.90 8.50 2 Alur -6.93 -26.57 0.00 -24.83 5.39 -33.50 -26.57 -24.83 -19.44 -52.94 3 Anekatte - -3.81 -29.40 21.00 -37.60 - -33.21 -8.40 -16.60 - 4 Ankasandra -14.99 -6.77 -24.05 29.75 -68.25 -21.76 -30.82 5.70 -38.50 -84.31 5 Aralikere -2.40 1.86 -5.90 3.54 -2.84 -0.54 -4.04 -2.36 0.70 -5.74 6 Aralikere - -3.90 -11.45 11.01 -3.44 - -15.35 -0.44 7.57 - 7 B.Hosahalli - -2.89 - - - - - - - - 8 B.Hosahalli - - -4.05 3.41 -7.24 - - -0.64 -3.83 - 9 Bairapura - 2.78 -17.45 24.78 -38.51 - -14.67 7.33 -13.73 -
10 Balavaneralu -0.89 -1.34 - - - -2.23 - - - -3.23 11 Balavaneralu - 1.07 -2.25 1.03 -3.38 - -1.18 -1.22 -2.35 - 12 Bandegate 6.82 -9.08 -6.05 18.13 -19.28 -2.26 -15.13 12.08 -1.15 -9.46 13 Banjara thanda 9.08 0.25 -3.70 4.08 -4.83 9.33 -3.45 0.38 -0.75 4.88 14 Basavarajapura - - - - - - - - - 2.39 15 Bevanahalli thanda - 8.53 -13.15 2.72 -19.38 - -4.62 -10.43 -16.66 - 16 Bhairanayakanahalli - - - - - - - - - 18.00 17 Bharanapura - - - - - - - - - - 18 Bommanahalli -0.28 -2.92 -2.90 0.50 -0.40 -3.20 -5.82 -2.40 0.10 -6.00 19 Bommanahalli - - -1.55 0.66 -6.53 - - -0.89 -5.87 - 20 Bommanahalli thanda - -1.82 -2.25 -3.87 0.92 - -4.07 -6.12 -2.95 - 21 Byadarhalli -27.90 2.12 - - - -25.78 - 14.78 - - 22 Chattasandra -1.53 -0.17 -2.60 2.30 -3.27 -1.70 -2.77 -0.30 -0.97 -5.27 23 Chattasandra - - -3.45 4.33 -28.06 - - 0.88 -23.73 - 24 Choulahalli - -52.18 11.45 17.36 -28.61 - -40.73 28.81 -11.25 - 25 Chunganahalli - -35.65 -29.30 61.54 -12.29 - -64.95 32.24 49.25 - 26 Dasanakatte -7.22 -5.08 -14.35 17.00 -25.75 -12.30 -19.43 2.65 -8.75 -35.40 27 DasihalliPalya 9.86 0.94 -7.00 2.10 -1.55 10.80 -6.06 -4.90 0.55 4.35 28 DasihalliPalya - 2.40 -12.60 12.31 -15.59 - -10.20 -0.29 -3.28 - 29 Dasikere -2.20 - - - - - - - - -2.42 30 Dasikere - 0.91 -13.00 12.30 -19.00 - -12.09 -0.70 -6.70 - 31 Dugganahalli -14.47 -4.68 -19.20 16.73 -12.02 -19.15 -23.88 -2.47 4.71 -33.64 32 Dugudihalli - - - - - - - - - - 33 Gandhinagara - - - - - - - - - -
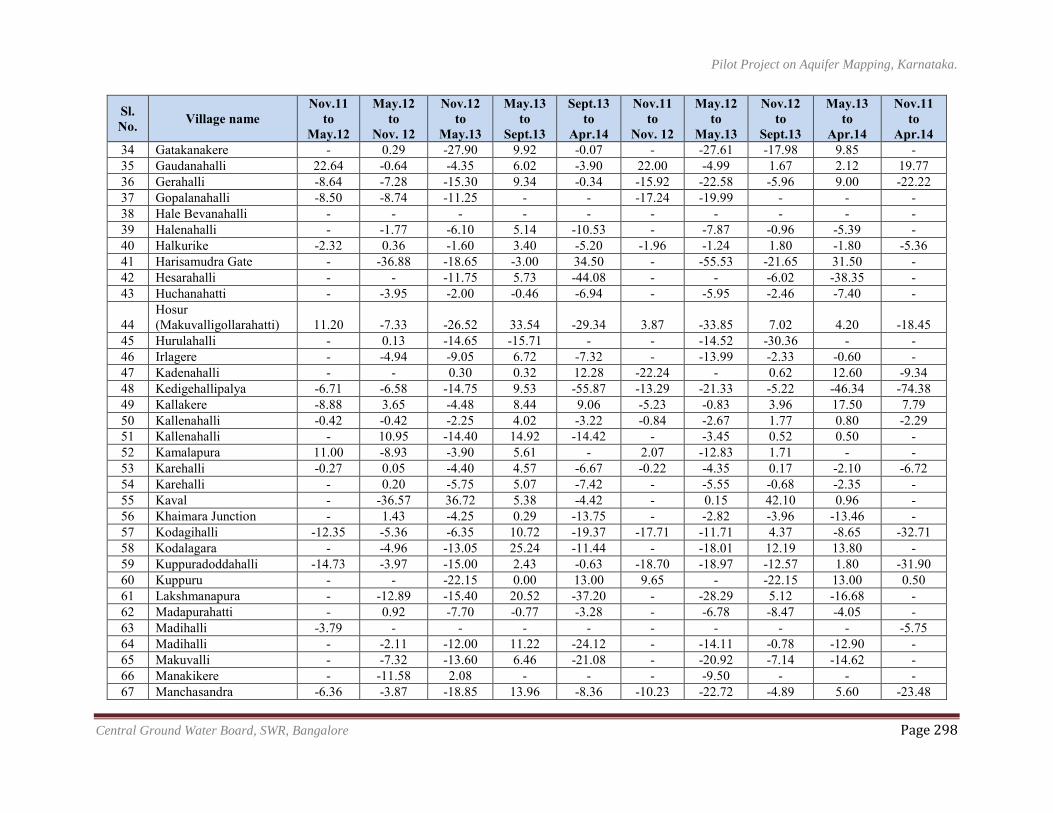
Pilot Project on Aquifer Mapping, Karnataka.
Central Ground Water Board, SWR, Bangalore Page 298
Sl. No. Village name
Nov.11 to
May.12
May.12 to
Nov. 12
Nov.12 to
May.13
May.13 to
Sept.13
Sept.13 to
Apr.14
Nov.11 to
Nov. 12
May.12 to
May.13
Nov.12 to
Sept.13
May.13 to
Apr.14
Nov.11 to
Apr.14 34 Gatakanakere - 0.29 -27.90 9.92 -0.07 - -27.61 -17.98 9.85 - 35 Gaudanahalli 22.64 -0.64 -4.35 6.02 -3.90 22.00 -4.99 1.67 2.12 19.77 36 Gerahalli -8.64 -7.28 -15.30 9.34 -0.34 -15.92 -22.58 -5.96 9.00 -22.22 37 Gopalanahalli -8.50 -8.74 -11.25 - - -17.24 -19.99 - - - 38 Hale Bevanahalli - - - - - - - - - - 39 Halenahalli - -1.77 -6.10 5.14 -10.53 - -7.87 -0.96 -5.39 - 40 Halkurike -2.32 0.36 -1.60 3.40 -5.20 -1.96 -1.24 1.80 -1.80 -5.36 41 Harisamudra Gate - -36.88 -18.65 -3.00 34.50 - -55.53 -21.65 31.50 - 42 Hesarahalli - - -11.75 5.73 -44.08 - - -6.02 -38.35 - 43 Huchanahatti - -3.95 -2.00 -0.46 -6.94 - -5.95 -2.46 -7.40 -
44 Hosur (Makuvalligollarahatti) 11.20 -7.33 -26.52 33.54 -29.34 3.87 -33.85 7.02 4.20 -18.45
45 Hurulahalli - 0.13 -14.65 -15.71 - - -14.52 -30.36 - - 46 Irlagere - -4.94 -9.05 6.72 -7.32 - -13.99 -2.33 -0.60 - 47 Kadenahalli - - 0.30 0.32 12.28 -22.24 - 0.62 12.60 -9.34 48 Kedigehallipalya -6.71 -6.58 -14.75 9.53 -55.87 -13.29 -21.33 -5.22 -46.34 -74.38 49 Kallakere -8.88 3.65 -4.48 8.44 9.06 -5.23 -0.83 3.96 17.50 7.79 50 Kallenahalli -0.42 -0.42 -2.25 4.02 -3.22 -0.84 -2.67 1.77 0.80 -2.29 51 Kallenahalli - 10.95 -14.40 14.92 -14.42 - -3.45 0.52 0.50 - 52 Kamalapura 11.00 -8.93 -3.90 5.61 - 2.07 -12.83 1.71 - - 53 Karehalli -0.27 0.05 -4.40 4.57 -6.67 -0.22 -4.35 0.17 -2.10 -6.72 54 Karehalli - 0.20 -5.75 5.07 -7.42 - -5.55 -0.68 -2.35 - 55 Kaval - -36.57 36.72 5.38 -4.42 - 0.15 42.10 0.96 - 56 Khaimara Junction - 1.43 -4.25 0.29 -13.75 - -2.82 -3.96 -13.46 - 57 Kodagihalli -12.35 -5.36 -6.35 10.72 -19.37 -17.71 -11.71 4.37 -8.65 -32.71 58 Kodalagara - -4.96 -13.05 25.24 -11.44 - -18.01 12.19 13.80 - 59 Kuppuradoddahalli -14.73 -3.97 -15.00 2.43 -0.63 -18.70 -18.97 -12.57 1.80 -31.90 60 Kuppuru - - -22.15 0.00 13.00 9.65 - -22.15 13.00 0.50 61 Lakshmanapura - -12.89 -15.40 20.52 -37.20 - -28.29 5.12 -16.68 - 62 Madapurahatti - 0.92 -7.70 -0.77 -3.28 - -6.78 -8.47 -4.05 - 63 Madihalli -3.79 - - - - - - - - -5.75 64 Madihalli - -2.11 -12.00 11.22 -24.12 - -14.11 -0.78 -12.90 - 65 Makuvalli - -7.32 -13.60 6.46 -21.08 - -20.92 -7.14 -14.62 - 66 Manakikere - -11.58 2.08 - - - -9.50 - - - 67 Manchasandra -6.36 -3.87 -18.85 13.96 -8.36 -10.23 -22.72 -4.89 5.60 -23.48
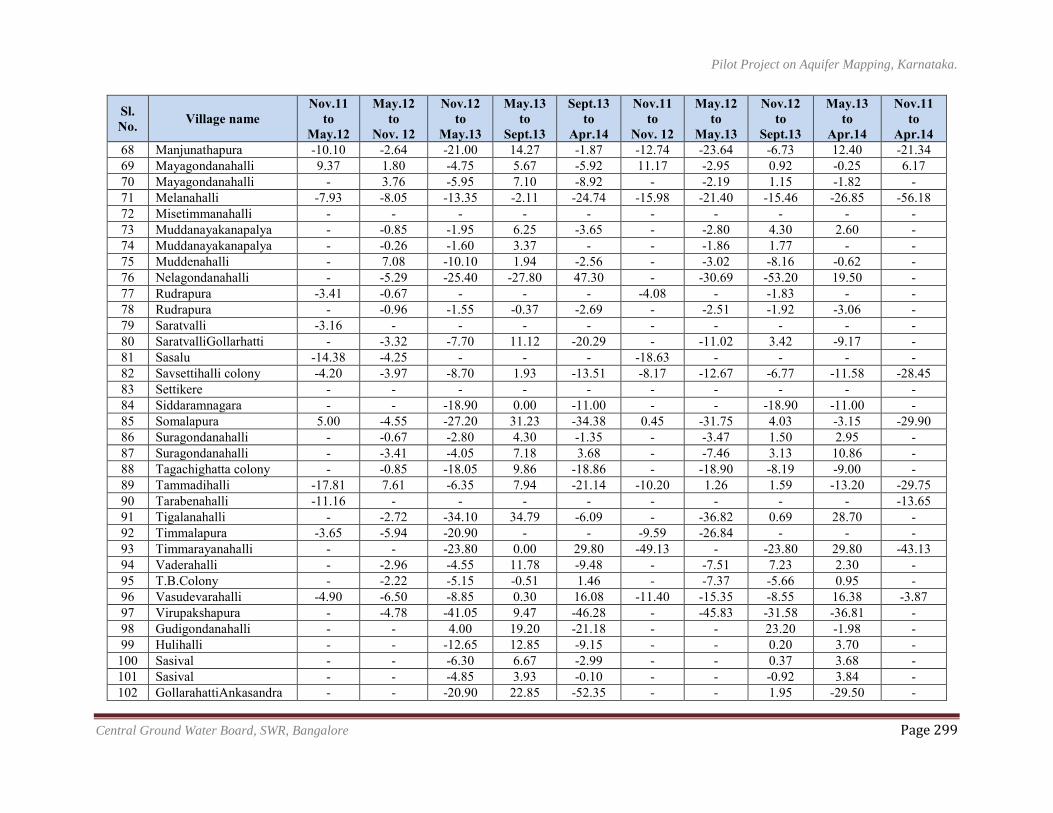
Pilot Project on Aquifer Mapping, Karnataka.
Central Ground Water Board, SWR, Bangalore Page 299
Sl. No. Village name
Nov.11 to
May.12
May.12 to
Nov. 12
Nov.12 to
May.13
May.13 to
Sept.13
Sept.13 to
Apr.14
Nov.11 to
Nov. 12
May.12 to
May.13
Nov.12 to
Sept.13
May.13 to
Apr.14
Nov.11 to
Apr.14 68 Manjunathapura -10.10 -2.64 -21.00 14.27 -1.87 -12.74 -23.64 -6.73 12.40 -21.34 69 Mayagondanahalli 9.37 1.80 -4.75 5.67 -5.92 11.17 -2.95 0.92 -0.25 6.17 70 Mayagondanahalli - 3.76 -5.95 7.10 -8.92 - -2.19 1.15 -1.82 - 71 Melanahalli -7.93 -8.05 -13.35 -2.11 -24.74 -15.98 -21.40 -15.46 -26.85 -56.18 72 Misetimmanahalli - - - - - - - - - - 73 Muddanayakanapalya - -0.85 -1.95 6.25 -3.65 - -2.80 4.30 2.60 - 74 Muddanayakanapalya - -0.26 -1.60 3.37 - - -1.86 1.77 - - 75 Muddenahalli - 7.08 -10.10 1.94 -2.56 - -3.02 -8.16 -0.62 - 76 Nelagondanahalli - -5.29 -25.40 -27.80 47.30 - -30.69 -53.20 19.50 - 77 Rudrapura -3.41 -0.67 - - - -4.08 - -1.83 - - 78 Rudrapura - -0.96 -1.55 -0.37 -2.69 - -2.51 -1.92 -3.06 - 79 Saratvalli -3.16 - - - - - - - - - 80 SaratvalliGollarhatti - -3.32 -7.70 11.12 -20.29 - -11.02 3.42 -9.17 - 81 Sasalu -14.38 -4.25 - - - -18.63 - - - - 82 Savsettihalli colony -4.20 -3.97 -8.70 1.93 -13.51 -8.17 -12.67 -6.77 -11.58 -28.45 83 Settikere - - - - - - - - - - 84 Siddaramnagara - - -18.90 0.00 -11.00 - - -18.90 -11.00 - 85 Somalapura 5.00 -4.55 -27.20 31.23 -34.38 0.45 -31.75 4.03 -3.15 -29.90 86 Suragondanahalli - -0.67 -2.80 4.30 -1.35 - -3.47 1.50 2.95 - 87 Suragondanahalli - -3.41 -4.05 7.18 3.68 - -7.46 3.13 10.86 - 88 Tagachighatta colony - -0.85 -18.05 9.86 -18.86 - -18.90 -8.19 -9.00 - 89 Tammadihalli -17.81 7.61 -6.35 7.94 -21.14 -10.20 1.26 1.59 -13.20 -29.75 90 Tarabenahalli -11.16 - - - - - - - - -13.65 91 Tigalanahalli - -2.72 -34.10 34.79 -6.09 - -36.82 0.69 28.70 - 92 Timmalapura -3.65 -5.94 -20.90 - - -9.59 -26.84 - - - 93 Timmarayanahalli - - -23.80 0.00 29.80 -49.13 - -23.80 29.80 -43.13 94 Vaderahalli - -2.96 -4.55 11.78 -9.48 - -7.51 7.23 2.30 - 95 T.B.Colony - -2.22 -5.15 -0.51 1.46 - -7.37 -5.66 0.95 - 96 Vasudevarahalli -4.90 -6.50 -8.85 0.30 16.08 -11.40 -15.35 -8.55 16.38 -3.87 97 Virupakshapura - -4.78 -41.05 9.47 -46.28 - -45.83 -31.58 -36.81 - 98 Gudigondanahalli - - 4.00 19.20 -21.18 - - 23.20 -1.98 - 99 Hulihalli - - -12.65 12.85 -9.15 - - 0.20 3.70 -
100 Sasival - - -6.30 6.67 -2.99 - - 0.37 3.68 - 101 Sasival - - -4.85 3.93 -0.10 - - -0.92 3.84 - 102 GollarahattiAnkasandra - - -20.90 22.85 -52.35 - - 1.95 -29.50 -
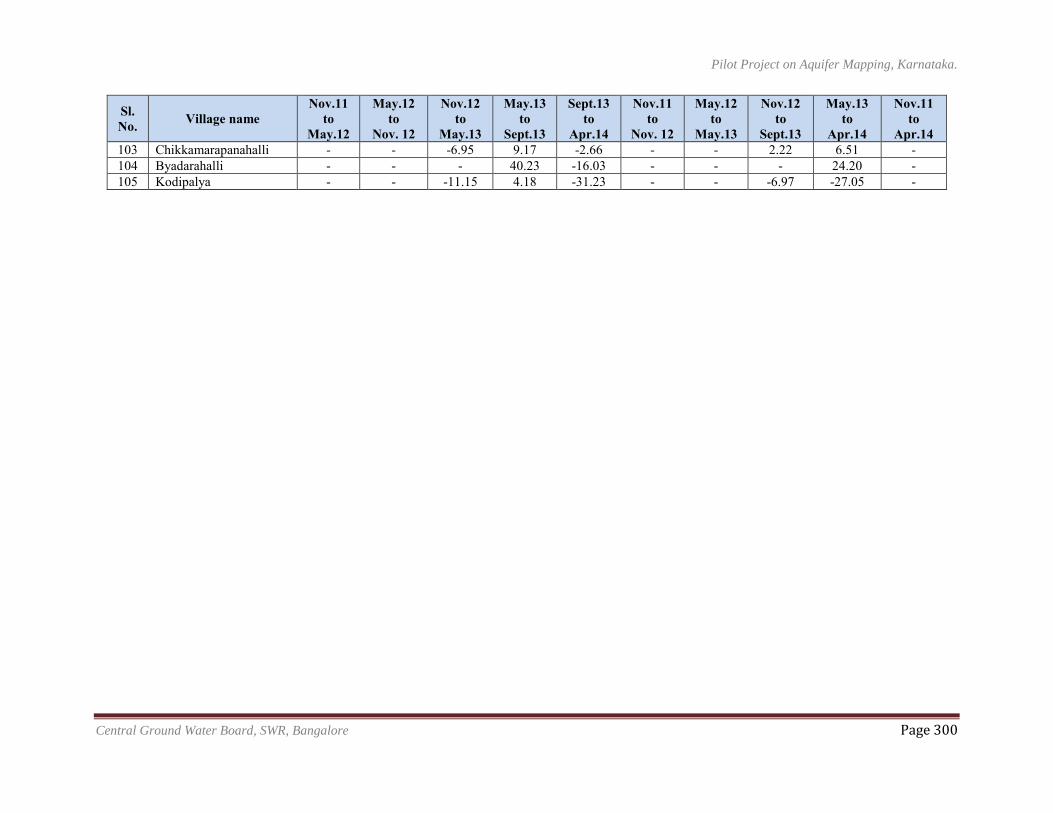
Pilot Project on Aquifer Mapping, Karnataka.
Central Ground Water Board, SWR, Bangalore Page 300
Sl. No. Village name
Nov.11 to
May.12
May.12 to
Nov. 12
Nov.12 to
May.13
May.13 to
Sept.13
Sept.13 to
Apr.14
Nov.11 to
Nov. 12
May.12 to
May.13
Nov.12 to
Sept.13
May.13 to
Apr.14
Nov.11 to
Apr.14 103 Chikkamarapanahalli - - -6.95 9.17 -2.66 - - 2.22 6.51 - 104 Byadarahalli - - - 40.23 -16.03 - - - 24.20 - 105 Kodipalya - - -11.15 4.18 -31.23 - - -6.97 -27.05 -
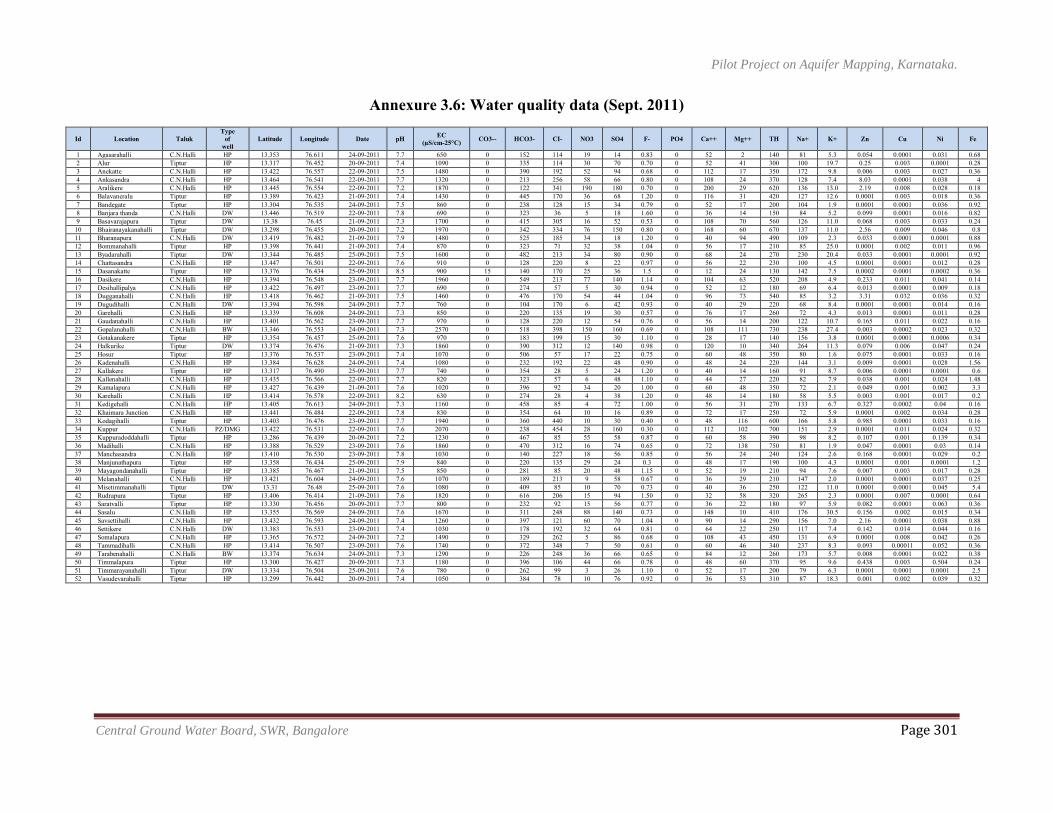
Pilot Project on Aquifer Mapping, Karnataka.
Central Ground Water Board, SWR, Bangalore Page 301
Annexure 3.6: Water quality data (Sept. 2011)
Id Location Taluk Type
of well
Latitude Longitude Date pH EC (µS/cm-25°C) CO3-- HCO3- CI- NO3 SO4 F- PO4 Ca++ Mg++ TH Na+ K+ Zn Cu Ni Fe
1 Agasarahalli C.N.Halli HP 13.353 76.611 24-09-2011 7.7 650 0 152 114 19 14 0.83 0 52 2 140 81 5.3 0.054 0.0001 0.031 0.68 2 Alur Tiptur HP 13.317 76.452 20-09-2011 7.4 1090 0 335 114 30 70 0.70 0 52 41 300 100 19.7 0.25 0.003 0.0001 0.28 3 Anekatte C.N.Halli HP 13.422 76.557 22-09-2011 7.5 1480 0 390 192 52 94 0.68 0 112 17 350 172 9.8 0.006 0.003 0.027 0.36 4 Ankasandra C.N.Halli HP 13.464 76.541 22-09-2011 7.7 1320 0 213 256 58 66 0.80 0 108 24 370 128 7.4 8.03 0.0001 0.038 4 5 Aralikere C.N.Halli HP 13.445 76.554 22-09-2011 7.2 1870 0 122 341 190 180 0.70 0 200 29 620 136 13.0 2.19 0.008 0.028 0.18 6 Balavaneralu Tiptur HP 13.389 76.423 21-09-2011 7.4 1430 0 445 170 36 68 1.20 0 116 31 420 127 12.6 0.0001 0.003 0.018 0.36 7 Bandegate Tiptur HP 13.304 76.535 24-09-2011 7.5 860 0 238 128 15 34 0.79 0 52 17 200 104 1.9 0.0001 0.0001 0.036 0.92 8 Banjara thanda C.N.Halli DW 13.446 76.519 22-09-2011 7.8 690 0 323 36 5 18 1.60 0 36 14 150 84 5.2 0.099 0.0001 0.016 0.82 9 Basavarajapura Tiptur DW 13.38 76.45 21-09-2011 7.3 1700 0 415 305 16 52 0.53 0 108 70 560 126 11.0 0.068 0.003 0.033 0.24
10 Bhairanayakanahalli Tiptur DW 13.298 76.455 20-09-2011 7.2 1970 0 342 334 76 150 0.80 0 168 60 670 137 11.0 2.56 0.009 0.046 0.8 11 Bharanapura C.N.Halli DW 13.419 76.482 21-09-2011 7.9 1480 0 525 185 34 18 1.20 0 40 94 490 109 2.3 0.033 0.0001 0.0001 0.88 12 Bommanahalli Tiptur HP 13.398 76.441 21-09-2011 7.4 870 0 323 71 32 38 1.04 0 56 17 210 85 25.0 0.0001 0.002 0.011 0.96 13 Byadarahalli Tiptur DW 13.344 76.485 25-09-2011 7.5 1600 0 482 213 34 80 0.90 0 68 24 270 230 20.4 0.033 0.0001 0.0001 0.92 14 Chattasandra C.N.Halli HP 13.447 76.501 22-09-2011 7.6 910 0 128 220 8 22 0.97 0 56 22 230 100 4.5 0.0001 0.0001 0.012 0.28 15 Dasanakatte Tiptur HP 13.376 76.434 25-09-2011 8.5 900 15 140 170 25 36 1.5 0 12 24 130 142 7.5 0.0002 0.0001 0.0002 0.36 16 Dasikere C.N.Halli HP 13.394 76.548 23-09-2011 7.7 1960 0 549 213 77 140 1.14 0 104 63 520 208 4.9 0.233 0.011 0.041 0.14 17 Desihallipalya C.N.Halli HP 13.422 76.497 23-09-2011 7.7 690 0 274 57 5 30 0.94 0 52 12 180 69 6.4 0.013 0.0001 0.009 0.18 18 Dugganahalli C.N.Halli HP 13.418 76.462 21-09-2011 7.5 1460 0 476 170 54 44 1.04 0 96 73 540 85 3.2 3.31 0.032 0.036 0.32 19 Dugudihalli C.N.Halli DW 13.394 76.598 24-09-2011 7.7 760 0 104 170 6 42 0.93 0 40 29 220 68 8.4 0.0001 0.0001 0.014 0.16 20 Garehalli C.N.Halli HP 13.339 76.608 24-09-2011 7.3 850 0 220 135 19 30 0.57 0 76 17 260 72 4.3 0.013 0.0001 0.011 0.28 21 Gaudanahalli C.N.Halli HP 13.401 76.562 23-09-2011 7.7 970 0 128 220 12 54 0.76 0 56 14 200 122 10.7 0.165 0.011 0.022 0.16 22 Gopalanahalli C.N.Halli BW 13.346 76.553 24-09-2011 7.3 2570 0 518 398 150 160 0.69 0 108 111 730 238 27.4 0.003 0.0002 0.023 0.32 23 Gotakanakere Tiptur HP 13.354 76.457 25-09-2011 7.6 970 0 183 199 15 30 1.10 0 28 17 140 156 3.8 0.0001 0.0001 0.0006 0.34 24 Halkurike Tiptur DW 13.374 76.476 21-09-2011 7.3 1860 0 390 312 12 140 0.98 0 120 10 340 264 11.3 0.079 0.006 0.047 0.24 25 Hosur Tiptur HP 13.376 76.537 23-09-2011 7.4 1070 0 506 57 17 22 0.75 0 60 48 350 80 1.6 0.075 0.0001 0.033 0.16 26 Kadenahalli C.N.Halli HP 13.384 76.628 24-09-2011 7.4 1080 0 232 192 22 48 0.90 0 48 24 220 144 3.1 0.009 0.0001 0.028 1.56 27 Kallakere Tiptur HP 13.317 76.490 25-09-2011 7.7 740 0 354 28 5 24 1.20 0 40 14 160 91 8.7 0.006 0.0001 0.0001 0.6 28 Kallenahalli C.N.Halli HP 13.435 76.566 22-09-2011 7.7 820 0 323 57 6 48 1.10 0 44 27 220 82 7.9 0.038 0.001 0.024 1.48 29 Kamalapura C.N.Halli HP 13.427 76.439 21-09-2011 7.6 1020 0 396 92 34 20 1.00 0 60 48 350 72 2.1 0.049 0.001 0.002 3.3 30 Karehalli C.N.Halli HP 13.414 76.578 22-09-2011 8.2 630 0 274 28 4 38 1.20 0 48 14 180 58 5.5 0.003 0.001 0.017 0.2 31 Kedigehalli C.N.Halli HP 13.405 76.613 24-09-2011 7.3 1160 0 458 85 4 72 1.00 0 56 31 270 133 6.7 0.327 0.0002 0.04 0.16 32 Khaimara Junction C.N.Halli HP 13.441 76.484 22-09-2011 7.8 830 0 354 64 10 16 0.89 0 72 17 250 72 5.9 0.0001 0.002 0.034 0.28 33 Kodagihalli Tiptur HP 13.403 76.476 23-09-2011 7.7 1940 0 360 440 10 30 0.40 0 48 116 600 166 5.8 0.985 0.0001 0.033 0.16 34 Kuppur C.N.Halli PZ/DMG 13.422 76.531 22-09-2011 7.6 2070 0 238 454 28 160 0.30 0 112 102 700 151 2.9 0.0001 0.011 0.024 0.32 35 Kuppuradoddahalli Tiptur HP 13.286 76.439 20-09-2011 7.2 1230 0 467 85 55 58 0.87 0 60 58 390 98 8.2 0.107 0.001 0.139 0.34 36 Madihalli C.N.Halli HP 13.388 76.529 23-09-2011 7.6 1860 0 470 312 16 74 0.65 0 72 138 750 81 1.9 0.047 0.0001 0.03 0.14 37 Manchasandra C.N.Halli HP 13.410 76.530 23-09-2011 7.8 1030 0 140 227 18 56 0.85 0 56 24 240 124 2.6 0.168 0.0001 0.029 0.2 38 Manjunathapura Tiptur HP 13.358 76.434 25-09-2011 7.9 840 0 220 135 29 24 0.3 0 48 17 190 100 4.3 0.0001 0.001 0.0001 1.2 39 Mayagondanahalli Tiptur HP 13.385 76.467 21-09-2011 7.5 850 0 281 85 20 48 1.15 0 52 19 210 94 7.6 0.007 0.003 0.017 0.28 40 Melanahalli C.N.Halli HP 13.421 76.604 24-09-2011 7.6 1070 0 189 213 9 58 0.67 0 36 29 210 147 2.0 0.0001 0.0001 0.037 0.25 41 Misetimmanahalli Tiptur DW 13.31 76.48 25-09-2011 7.6 1080 0 409 85 10 70 0.73 0 40 36 250 122 11.0 0.0001 0.0001 0.045 5.4 42 Rudrapura Tiptur HP 13.406 76.414 21-09-2011 7.6 1820 0 616 206 15 94 1.50 0 32 58 320 265 2.3 0.0001 0.007 0.0001 0.64 43 Saratvalli Tiptur HP 13.330 76.456 20-09-2011 7.7 800 0 232 92 15 56 0.77 0 36 22 180 97 5.9 0.082 0.0001 0.063 0.36 44 Sasalu C.N.Halli HP 13.355 76.569 24-09-2011 7.6 1670 0 311 248 88 140 0.73 0 148 10 410 176 30.5 0.156 0.002 0.015 0.34 45 Savsettihalli C.N.Halli HP 13.432 76.593 24-09-2011 7.4 1260 0 397 121 60 70 1.04 0 90 14 290 156 7.0 2.16 0.0001 0.038 0.88 46 Settikere C.N.Halli DW 13.383 76.553 23-09-2011 7.4 1030 0 178 192 32 64 0.81 0 64 22 250 117 7.4 0.142 0.014 0.044 0.16 47 Somalapura C.N.Halli HP 13.365 76.572 24-09-2011 7.2 1490 0 329 262 5 86 0.68 0 108 43 450 131 6.9 0.0001 0.008 0.042 0.26 48 Tammadihalli C.N.Halli HP 13.414 76.507 23-09-2011 7.6 1740 0 372 348 7 50 0.61 0 60 46 340 237 8.3 0.093 0.00011 0.052 0.36 49 Tarabenahalli C.N.Halli BW 13.374 76.634 24-09-2011 7.3 1290 0 226 248 36 66 0.65 0 84 12 260 173 5.7 0.008 0.0001 0.022 0.38 50 Timmalapura Tiptur HP 13.300 76.427 20-09-2011 7.3 1180 0 396 106 44 66 0.78 0 48 60 370 95 9.6 0.438 0.003 0.504 0.24 51 Timmarayanahalli Tiptur DW 13.334 76.504 25-09-2011 7.6 780 0 262 99 3 26 1.10 0 52 17 200 79 6.3 0.0001 0.0001 0.0001 2.5 52 Vasudevarahalli Tiptur HP 13.299 76.442 20-09-2011 7.4 1050 0 384 78 10 76 0.92 0 36 53 310 87 18.3 0.001 0.002 0.039 0.32
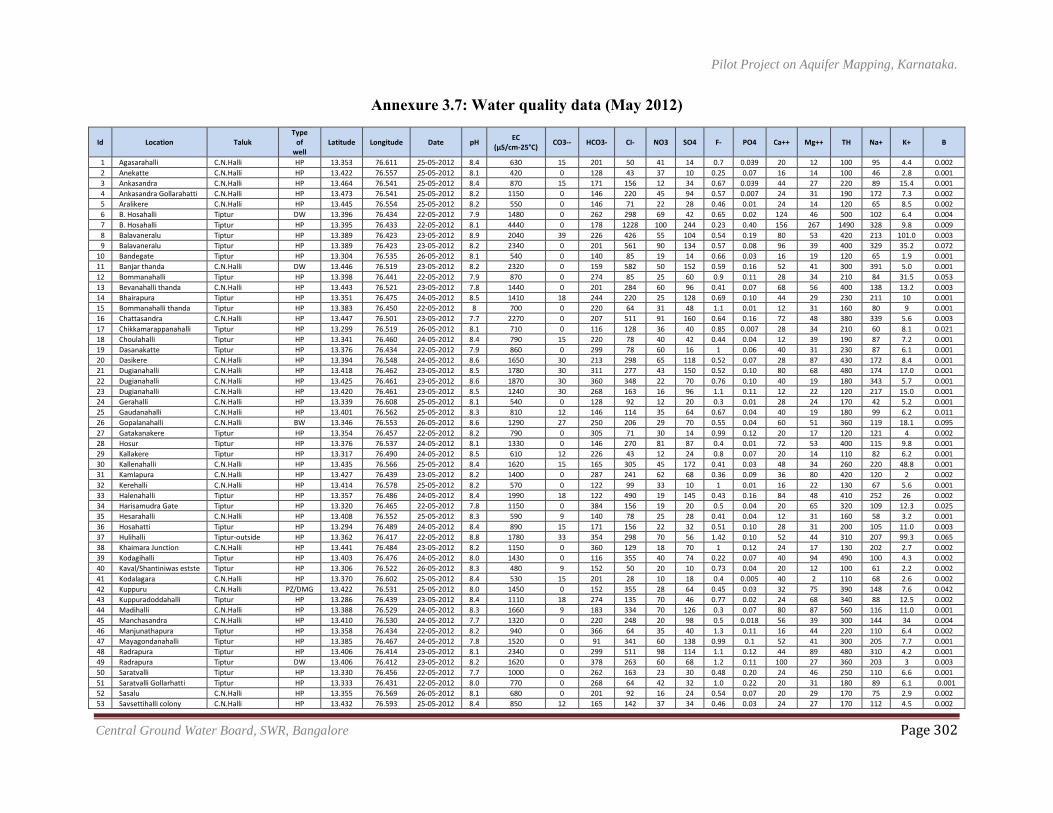
Pilot Project on Aquifer Mapping, Karnataka.
Central Ground Water Board, SWR, Bangalore Page 302
Annexure 3.7: Water quality data (May 2012)
Id Location Taluk Type
of well
Latitude Longitude Date pH EC
(µS/cm-25°C) CO3-- HCO3- CI- NO3 SO4 F- PO4 Ca++ Mg++ TH Na+ K+ B
1 Agasarahalli C.N.Halli HP 13.353 76.611 25-05-2012 8.4 630 15 201 50 41 14 0.7 0.039 20 12 100 95 4.4 0.002
2 Anekatte C.N.Halli HP 13.422 76.557 25-05-2012 8.1 420 0 128 43 37 10 0.25 0.07 16 14 100 46 2.8 0.001
3 Ankasandra C.N.Halli HP 13.464 76.541 25-05-2012 8.4 870 15 171 156 12 34 0.67 0.039 44 27 220 89 15.4 0.001
4 Ankasandra Gollarahatti C.N.Halli HP 13.473 76.541 25-05-2012 8.2 1150 0 146 220 45 94 0.57 0.007 24 31 190 172 7.3 0.002
5 Aralikere C.N.Halli HP 13.445 76.554 25-05-2012 8.2 550 0 146 71 22 28 0.46 0.01 24 14 120 65 8.5 0.002
6 B. Hosahalli Tiptur DW 13.396 76.434 22-05-2012 7.9 1480 0 262 298 69 42 0.65 0.02 124 46 500 102 6.4 0.004
7 B. Hosahalli Tiptur HP 13.395 76.433 22-05-2012 8.1 4440 0 178 1228 100 244 0.23 0.40 156 267 1490 328 9.8 0.009
8 Balavaneralu Tiptur HP 13.389 76.423 23-05-2012 8.9 2040 39 226 426 55 104 0.54 0.19 80 53 420 213 101.0 0.003
9 Balavaneralu Tiptur HP 13.389 76.423 23-05-2012 8.2 2340 0 201 561 90 134 0.57 0.08 96 39 400 329 35.2 0.072
10 Bandegate Tiptur HP 13.304 76.535 26-05-2012 8.1 540 0 140 85 19 14 0.66 0.03 16 19 120 65 1.9 0.001
11 Banjar thanda C.N.Halli DW 13.446 76.519 23-05-2012 8.2 2320 0 159 582 50 152 0.59 0.16 52 41 300 391 5.0 0.001
12 Bommanahalli Tiptur HP 13.398 76.441 22-05-2012 7.9 870 0 274 85 25 60 0.9 0.11 28 34 210 84 31.5 0.053
13 Bevanahalli thanda C.N.Halli HP 13.443 76.521 23-05-2012 7.8 1440 0 201 284 60 96 0.41 0.07 68 56 400 138 13.2 0.003
14 Bhairapura Tiptur HP 13.351 76.475 24-05-2012 8.5 1410 18 244 220 25 128 0.69 0.10 44 29 230 211 10 0.001
15 Bommanahalli thanda Tiptur HP 13.383 76.450 22-05-2012 8 700 0 220 64 31 48 1.1 0.01 12 31 160 80 9 0.001
16 Chattasandra C.N.Halli HP 13.447 76.501 23-05-2012 7.7 2270 0 207 511 91 160 0.64 0.16 72 48 380 339 5.6 0.003
17 Chikkamarappanahalli Tiptur HP 13.299 76.519 26-05-2012 8.1 710 0 116 128 36 40 0.85 0.007 28 34 210 60 8.1 0.021
18 Choulahalli Tiptur HP 13.341 76.460 24-05-2012 8.4 790 15 220 78 40 42 0.44 0.04 12 39 190 87 7.2 0.001
19 Dasanakatte Tiptur HP 13.376 76.434 22-05-2012 7.9 860 0 299 78 60 16 1 0.06 40 31 230 87 6.1 0.001
20 Dasikere C.N.Halli HP 13.394 76.548 24-05-2012 8.6 1650 30 213 298 65 118 0.52 0.07 28 87 430 172 8.4 0.001
21 Dugianahalli C.N.Halli HP 13.418 76.462 23-05-2012 8.5 1780 30 311 277 43 150 0.52 0.10 80 68 480 174 17.0 0.001
22 Dugianahalli C.N.Halli HP 13.425 76.461 23-05-2012 8.6 1870 30 360 348 22 70 0.76 0.10 40 19 180 343 5.7 0.001
23 Dugianahalli C.N.Halli HP 13.420 76.461 23-05-2012 8.5 1240 30 268 163 16 96 1.1 0.11 12 22 120 217 15.0 0.001
24 Gerahalli C.N.Halli HP 13.339 76.608 25-05-2012 8.1 540 0 128 92 12 20 0.3 0.01 28 24 170 42 5.2 0.001
25 Gaudanahalli C.N.Halli HP 13.401 76.562 25-05-2012 8.3 810 12 146 114 35 64 0.67 0.04 40 19 180 99 6.2 0.011
26 Gopalanahalli C.N.Halli BW 13.346 76.553 26-05-2012 8.6 1290 27 250 206 29 70 0.55 0.04 60 51 360 119 18.1 0.095
27 Gatakanakere Tiptur HP 13.354 76.457 22-05-2012 8.2 790 0 305 71 30 14 0.99 0.12 20 17 120 121 4 0.002
28 Hosur Tiptur HP 13.376 76.537 24-05-2012 8.1 1330 0 146 270 81 87 0.4 0.01 72 53 400 115 9.8 0.001
29 Kallakere Tiptur HP 13.317 76.490 24-05-2012 8.5 610 12 226 43 12 24 0.8 0.07 20 14 110 82 6.2 0.001
30 Kallenahalli C.N.Halli HP 13.435 76.566 25-05-2012 8.4 1620 15 165 305 45 172 0.41 0.03 48 34 260 220 48.8 0.001
31 Kamlapura C.N.Halli HP 13.427 76.439 23-05-2012 8.2 1400 0 287 241 62 68 0.36 0.09 36 80 420 120 2 0.002
32 Kerehalli C.N.Halli HP 13.414 76.578 25-05-2012 8.2 570 0 122 99 33 10 1 0.01 16 22 130 67 5.6 0.001
33 Halenahalli Tiptur HP 13.357 76.486 24-05-2012 8.4 1990 18 122 490 19 145 0.43 0.16 84 48 410 252 26 0.002
34 Harisamudra Gate Tiptur HP 13.320 76.465 22-05-2012 7.8 1150 0 384 156 19 20 0.5 0.04 20 65 320 109 12.3 0.025
35 Hesarahalli C.N.Halli HP 13.408 76.552 25-05-2012 8.3 590 9 140 78 25 28 0.41 0.04 12 31 160 58 3.2 0.001
36 Hosahatti Tiptur HP 13.294 76.489 24-05-2012 8.4 890 15 171 156 22 32 0.51 0.10 28 31 200 105 11.0 0.003
37 Hulihalli Tiptur-outside HP 13.362 76.417 22-05-2012 8.8 1780 33 354 298 70 56 1.42 0.10 52 44 310 207 99.3 0.065
38 Khaimara Junction C.N.Halli HP 13.441 76.484 23-05-2012 8.2 1150 0 360 129 18 70 1 0.12 24 17 130 202 2.7 0.002
39 Kodagihalli Tiptur HP 13.403 76.476 24-05-2012 8.0 1430 0 116 355 40 74 0.22 0.07 40 94 490 100 4.3 0.002
40 Kaval/Shantiniwas estste Tiptur HP 13.306 76.522 26-05-2012 8.3 480 9 152 50 20 10 0.73 0.04 20 12 100 61 2.2 0.002
41 Kodalagara C.N.Halli HP 13.370 76.602 25-05-2012 8.4 530 15 201 28 10 18 0.4 0.005 40 2 110 68 2.6 0.002
42 Kuppuru C.N.Halli PZ/DMG 13.422 76.531 25-05-2012 8.0 1450 0 152 355 28 64 0.45 0.03 32 75 390 148 7.6 0.042
43 Kuppuradoddahalli Tiptur HP 13.286 76.439 23-05-2012 8.4 1110 18 274 135 70 46 0.77 0.02 24 68 340 88 12.5 0.002
44 Madihalli C.N.Halli HP 13.388 76.529 24-05-2012 8.3 1660 9 183 334 70 126 0.3 0.07 80 87 560 116 11.0 0.001
45 Manchasandra C.N.Halli HP 13.410 76.530 24-05-2012 7.7 1320 0 220 248 20 98 0.5 0.018 56 39 300 144 34 0.004
46 Manjunathapura Tiptur HP 13.358 76.434 22-05-2012 8.2 940 0 366 64 35 40 1.3 0.11 16 44 220 110 6.4 0.002
47 Mayagondanahalli Tiptur HP 13.385 76.467 24-05-2012 7.8 1520 0 91 341 60 138 0.99 0.1 52 41 300 205 7.7 0.001
48 Radrapura Tiptur HP 13.406 76.414 23-05-2012 8.1 2340 0 299 511 98 114 1.1 0.12 44 89 480 310 4.2 0.001
49 Radrapura Tiptur DW 13.406 76.412 23-05-2012 8.2 1620 0 378 263 60 68 1.2 0.11 100 27 360 203 3 0.003
50 Saratvalli Tiptur HP 13.330 76.456 22-05-2012 7.7 1000 0 262 163 23 30 0.48 0.20 24 46 250 110 6.6 0.001
51 Saratvalli Gollarhatti Tiptur HP 13.333 76.431 22-05-2012 8.0 770 0 268 64 42 32 1.0 0.22 20 31 180 89 6.1 0.001
52 Sasalu C.N.Halli HP 13.355 76.569 26-05-2012 8.1 680 0 201 92 16 24 0.54 0.07 20 29 170 75 2.9 0.002
53 Savsettihalli colony C.N.Halli HP 13.432 76.593 25-05-2012 8.4 850 12 165 142 37 34 0.46 0.03 24 27 170 112 4.5 0.002
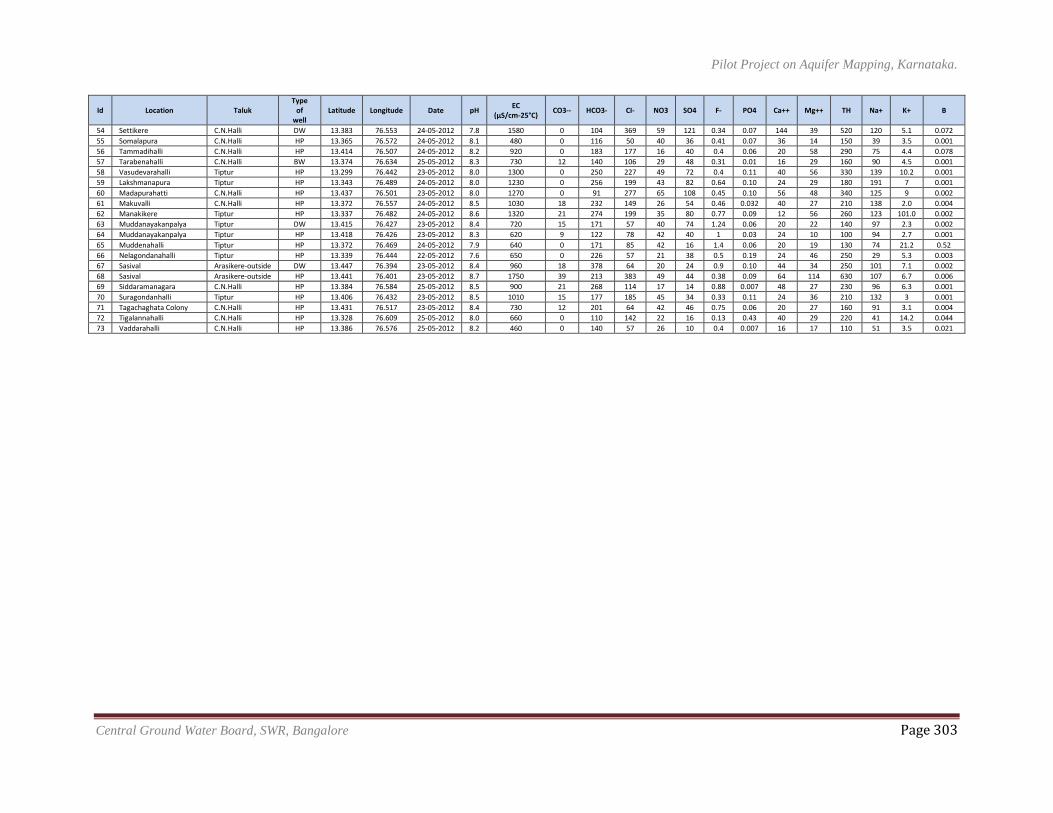
Pilot Project on Aquifer Mapping, Karnataka.
Central Ground Water Board, SWR, Bangalore Page 303
Id Location Taluk Type
of well
Latitude Longitude Date pH EC
(µS/cm-25°C) CO3-- HCO3- CI- NO3 SO4 F- PO4 Ca++ Mg++ TH Na+ K+ B
54 Settikere C.N.Halli DW 13.383 76.553 24-05-2012 7.8 1580 0 104 369 59 121 0.34 0.07 144 39 520 120 5.1 0.072
55 Somalapura C.N.Halli HP 13.365 76.572 24-05-2012 8.1 480 0 116 50 40 36 0.41 0.07 36 14 150 39 3.5 0.001
56 Tammadihalli C.N.Halli HP 13.414 76.507 24-05-2012 8.2 920 0 183 177 16 40 0.4 0.06 20 58 290 75 4.4 0.078
57 Tarabenahalli C.N.Halli BW 13.374 76.634 25-05-2012 8.3 730 12 140 106 29 48 0.31 0.01 16 29 160 90 4.5 0.001
58 Vasudevarahalli Tiptur HP 13.299 76.442 23-05-2012 8.0 1300 0 250 227 49 72 0.4 0.11 40 56 330 139 10.2 0.001
59 Lakshmanapura Tiptur HP 13.343 76.489 24-05-2012 8.0 1230 0 256 199 43 82 0.64 0.10 24 29 180 191 7 0.001
60 Madapurahatti C.N.Halli HP 13.437 76.501 23-05-2012 8.0 1270 0 91 277 65 108 0.45 0.10 56 48 340 125 9 0.002
61 Makuvalli C.N.Halli HP 13.372 76.557 24-05-2012 8.5 1030 18 232 149 26 54 0.46 0.032 40 27 210 138 2.0 0.004
62 Manakikere Tiptur HP 13.337 76.482 24-05-2012 8.6 1320 21 274 199 35 80 0.77 0.09 12 56 260 123 101.0 0.002
63 Muddanayakanpalya Tiptur DW 13.415 76.427 23-05-2012 8.4 720 15 171 57 40 74 1.24 0.06 20 22 140 97 2.3 0.002
64 Muddanayakanpalya Tiptur HP 13.418 76.426 23-05-2012 8.3 620 9 122 78 42 40 1 0.03 24 10 100 94 2.7 0.001
65 Muddenahalli Tiptur HP 13.372 76.469 24-05-2012 7.9 640 0 171 85 42 16 1.4 0.06 20 19 130 74 21.2 0.52
66 Nelagondanahalli Tiptur HP 13.339 76.444 22-05-2012 7.6 650 0 226 57 21 38 0.5 0.19 24 46 250 29 5.3 0.003
67 Sasival Arasikere-outside DW 13.447 76.394 23-05-2012 8.4 960 18 378 64 20 24 0.9 0.10 44 34 250 101 7.1 0.002
68 Sasival Arasikere-outside HP 13.441 76.401 23-05-2012 8.7 1750 39 213 383 49 44 0.38 0.09 64 114 630 107 6.7 0.006
69 Siddaramanagara C.N.Halli HP 13.384 76.584 25-05-2012 8.5 900 21 268 114 17 14 0.88 0.007 48 27 230 96 6.3 0.001
70 Suragondanhalli Tiptur HP 13.406 76.432 23-05-2012 8.5 1010 15 177 185 45 34 0.33 0.11 24 36 210 132 3 0.001
71 Tagachaghata Colony C.N.Halli HP 13.431 76.517 23-05-2012 8.4 730 12 201 64 42 46 0.75 0.06 20 27 160 91 3.1 0.004
72 Tigalannahalli C.N.Halli HP 13.328 76.609 25-05-2012 8.0 660 0 110 142 22 16 0.13 0.43 40 29 220 41 14.2 0.044
73 Vaddarahalli C.N.Halli HP 13.386 76.576 25-05-2012 8.2 460 0 140 57 26 10 0.4 0.007 16 17 110 51 3.5 0.021
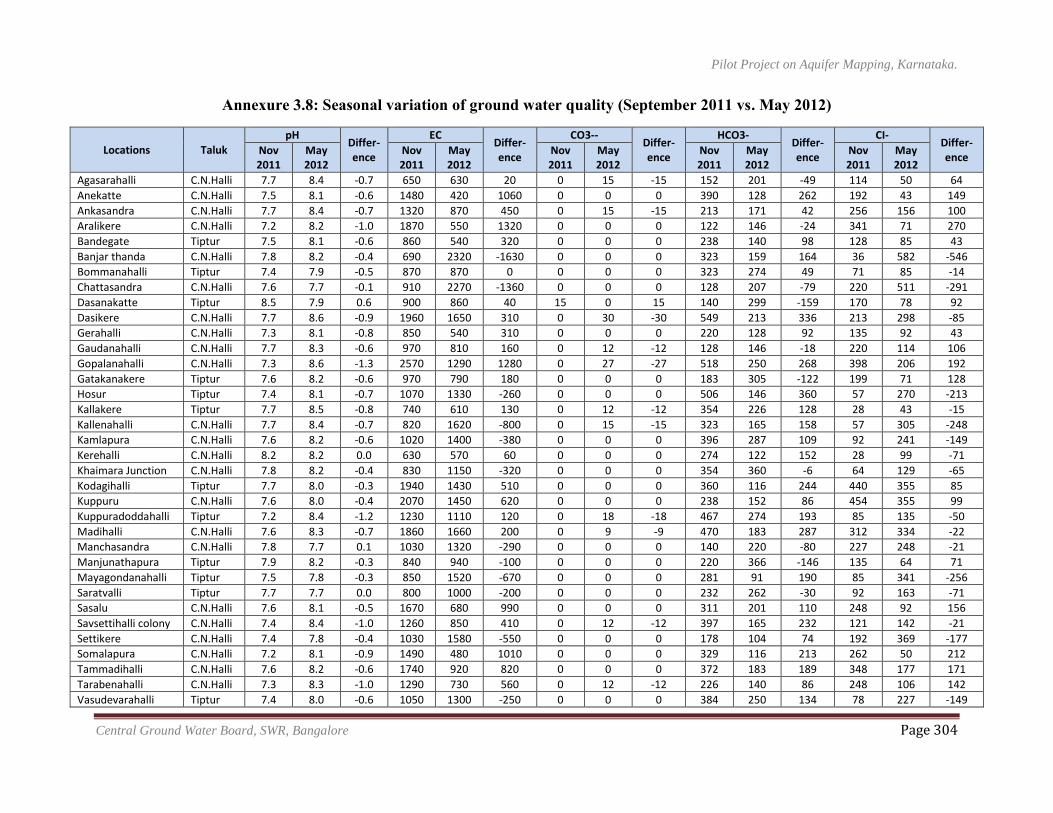
Pilot Project on Aquifer Mapping, Karnataka.
Central Ground Water Board, SWR, Bangalore Page 304
Annexure 3.8: Seasonal variation of ground water quality (September 2011 vs. May 2012)
Locations Taluk
pH Differ- ence
EC Differ- ence
CO3-- Differ- ence
HCO3- Differ- ence
CI- Differ- ence
Nov 2011
May 2012
Nov 2011
May 2012
Nov 2011
May 2012
Nov 2011
May 2012
Nov 2011
May 2012
Agasarahalli C.N.Halli 7.7 8.4 -0.7 650 630 20 0 15 -15 152 201 -49 114 50 64
Anekatte C.N.Halli 7.5 8.1 -0.6 1480 420 1060 0 0 0 390 128 262 192 43 149
Ankasandra C.N.Halli 7.7 8.4 -0.7 1320 870 450 0 15 -15 213 171 42 256 156 100
Aralikere C.N.Halli 7.2 8.2 -1.0 1870 550 1320 0 0 0 122 146 -24 341 71 270
Bandegate Tiptur 7.5 8.1 -0.6 860 540 320 0 0 0 238 140 98 128 85 43
Banjar thanda C.N.Halli 7.8 8.2 -0.4 690 2320 -1630 0 0 0 323 159 164 36 582 -546
Bommanahalli Tiptur 7.4 7.9 -0.5 870 870 0 0 0 0 323 274 49 71 85 -14
Chattasandra C.N.Halli 7.6 7.7 -0.1 910 2270 -1360 0 0 0 128 207 -79 220 511 -291
Dasanakatte Tiptur 8.5 7.9 0.6 900 860 40 15 0 15 140 299 -159 170 78 92
Dasikere C.N.Halli 7.7 8.6 -0.9 1960 1650 310 0 30 -30 549 213 336 213 298 -85
Gerahalli C.N.Halli 7.3 8.1 -0.8 850 540 310 0 0 0 220 128 92 135 92 43
Gaudanahalli C.N.Halli 7.7 8.3 -0.6 970 810 160 0 12 -12 128 146 -18 220 114 106
Gopalanahalli C.N.Halli 7.3 8.6 -1.3 2570 1290 1280 0 27 -27 518 250 268 398 206 192
Gatakanakere Tiptur 7.6 8.2 -0.6 970 790 180 0 0 0 183 305 -122 199 71 128
Hosur Tiptur 7.4 8.1 -0.7 1070 1330 -260 0 0 0 506 146 360 57 270 -213
Kallakere Tiptur 7.7 8.5 -0.8 740 610 130 0 12 -12 354 226 128 28 43 -15
Kallenahalli C.N.Halli 7.7 8.4 -0.7 820 1620 -800 0 15 -15 323 165 158 57 305 -248
Kamlapura C.N.Halli 7.6 8.2 -0.6 1020 1400 -380 0 0 0 396 287 109 92 241 -149
Kerehalli C.N.Halli 8.2 8.2 0.0 630 570 60 0 0 0 274 122 152 28 99 -71
Khaimara Junction C.N.Halli 7.8 8.2 -0.4 830 1150 -320 0 0 0 354 360 -6 64 129 -65
Kodagihalli Tiptur 7.7 8.0 -0.3 1940 1430 510 0 0 0 360 116 244 440 355 85
Kuppuru C.N.Halli 7.6 8.0 -0.4 2070 1450 620 0 0 0 238 152 86 454 355 99
Kuppuradoddahalli Tiptur 7.2 8.4 -1.2 1230 1110 120 0 18 -18 467 274 193 85 135 -50
Madihalli C.N.Halli 7.6 8.3 -0.7 1860 1660 200 0 9 -9 470 183 287 312 334 -22
Manchasandra C.N.Halli 7.8 7.7 0.1 1030 1320 -290 0 0 0 140 220 -80 227 248 -21
Manjunathapura Tiptur 7.9 8.2 -0.3 840 940 -100 0 0 0 220 366 -146 135 64 71
Mayagondanahalli Tiptur 7.5 7.8 -0.3 850 1520 -670 0 0 0 281 91 190 85 341 -256
Saratvalli Tiptur 7.7 7.7 0.0 800 1000 -200 0 0 0 232 262 -30 92 163 -71
Sasalu C.N.Halli 7.6 8.1 -0.5 1670 680 990 0 0 0 311 201 110 248 92 156
Savsettihalli colony C.N.Halli 7.4 8.4 -1.0 1260 850 410 0 12 -12 397 165 232 121 142 -21
Settikere C.N.Halli 7.4 7.8 -0.4 1030 1580 -550 0 0 0 178 104 74 192 369 -177
Somalapura C.N.Halli 7.2 8.1 -0.9 1490 480 1010 0 0 0 329 116 213 262 50 212
Tammadihalli C.N.Halli 7.6 8.2 -0.6 1740 920 820 0 0 0 372 183 189 348 177 171
Tarabenahalli C.N.Halli 7.3 8.3 -1.0 1290 730 560 0 12 -12 226 140 86 248 106 142
Vasudevarahalli Tiptur 7.4 8.0 -0.6 1050 1300 -250 0 0 0 384 250 134 78 227 -149
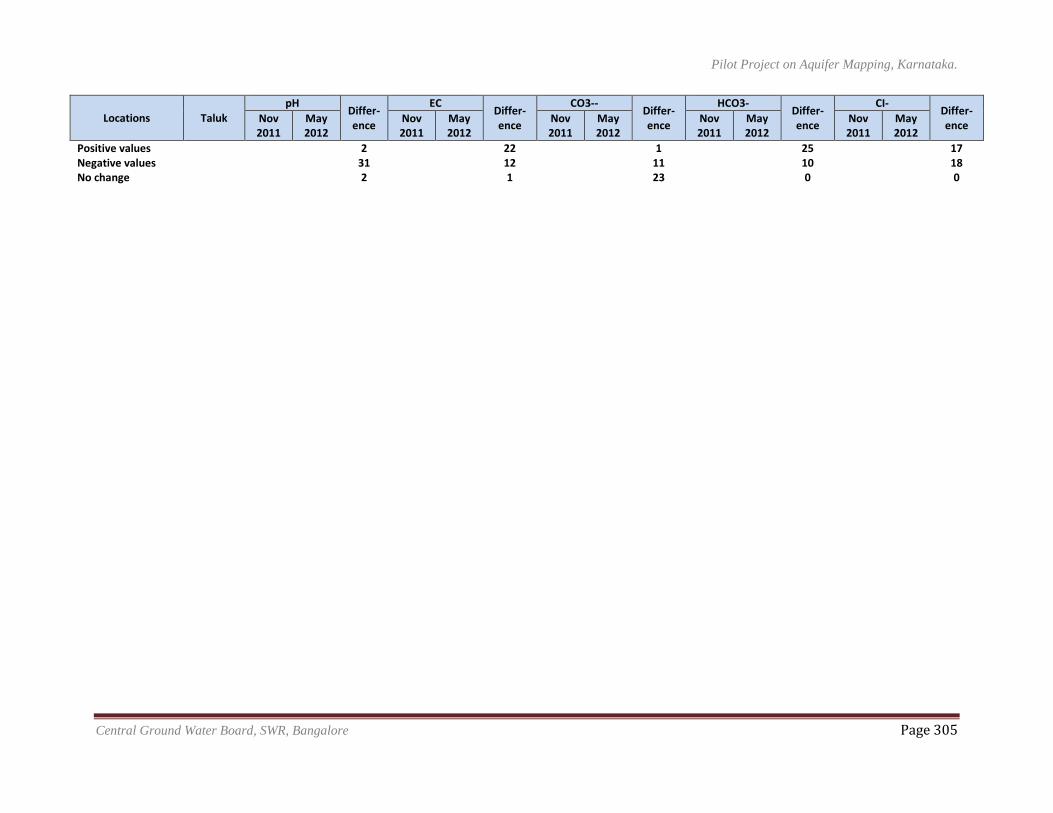
Pilot Project on Aquifer Mapping, Karnataka.
Central Ground Water Board, SWR, Bangalore Page 305
Locations Taluk
pH Differ- ence
EC Differ- ence
CO3-- Differ- ence
HCO3- Differ- ence
CI- Differ- ence
Nov 2011
May 2012
Nov 2011
May 2012
Nov 2011
May 2012
Nov 2011
May 2012
Nov 2011
May 2012
Positive values
2
22
1
25
17 Negative values
31
12
11
10
18
No change
2
1
23
0
0
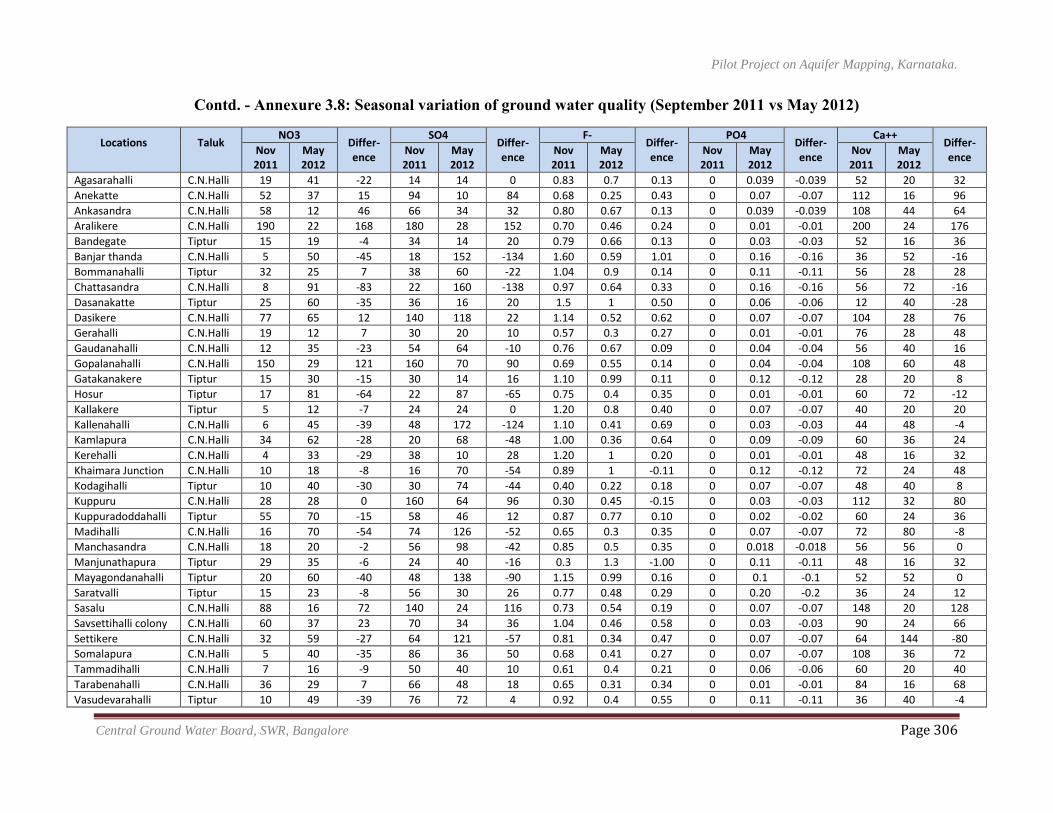
Pilot Project on Aquifer Mapping, Karnataka.
Central Ground Water Board, SWR, Bangalore Page 306
Contd. - Annexure 3.8: Seasonal variation of ground water quality (September 2011 vs May 2012)
Locations
Taluk
NO3 Differ- ence
SO4 Differ- ence
F- Differ- ence
PO4 Differ- ence
Ca++ Differ- ence
Nov 2011
May 2012
Nov 2011
May 2012
Nov 2011
May 2012
Nov 2011
May 2012
Nov 2011
May 2012
Agasarahalli C.N.Halli 19 41 -22 14 14 0 0.83 0.7 0.13 0 0.039 -0.039 52 20 32
Anekatte C.N.Halli 52 37 15 94 10 84 0.68 0.25 0.43 0 0.07 -0.07 112 16 96
Ankasandra C.N.Halli 58 12 46 66 34 32 0.80 0.67 0.13 0 0.039 -0.039 108 44 64
Aralikere C.N.Halli 190 22 168 180 28 152 0.70 0.46 0.24 0 0.01 -0.01 200 24 176
Bandegate Tiptur 15 19 -4 34 14 20 0.79 0.66 0.13 0 0.03 -0.03 52 16 36
Banjar thanda C.N.Halli 5 50 -45 18 152 -134 1.60 0.59 1.01 0 0.16 -0.16 36 52 -16
Bommanahalli Tiptur 32 25 7 38 60 -22 1.04 0.9 0.14 0 0.11 -0.11 56 28 28
Chattasandra C.N.Halli 8 91 -83 22 160 -138 0.97 0.64 0.33 0 0.16 -0.16 56 72 -16
Dasanakatte Tiptur 25 60 -35 36 16 20 1.5 1 0.50 0 0.06 -0.06 12 40 -28
Dasikere C.N.Halli 77 65 12 140 118 22 1.14 0.52 0.62 0 0.07 -0.07 104 28 76
Gerahalli C.N.Halli 19 12 7 30 20 10 0.57 0.3 0.27 0 0.01 -0.01 76 28 48
Gaudanahalli C.N.Halli 12 35 -23 54 64 -10 0.76 0.67 0.09 0 0.04 -0.04 56 40 16
Gopalanahalli C.N.Halli 150 29 121 160 70 90 0.69 0.55 0.14 0 0.04 -0.04 108 60 48
Gatakanakere Tiptur 15 30 -15 30 14 16 1.10 0.99 0.11 0 0.12 -0.12 28 20 8
Hosur Tiptur 17 81 -64 22 87 -65 0.75 0.4 0.35 0 0.01 -0.01 60 72 -12
Kallakere Tiptur 5 12 -7 24 24 0 1.20 0.8 0.40 0 0.07 -0.07 40 20 20
Kallenahalli C.N.Halli 6 45 -39 48 172 -124 1.10 0.41 0.69 0 0.03 -0.03 44 48 -4
Kamlapura C.N.Halli 34 62 -28 20 68 -48 1.00 0.36 0.64 0 0.09 -0.09 60 36 24
Kerehalli C.N.Halli 4 33 -29 38 10 28 1.20 1 0.20 0 0.01 -0.01 48 16 32
Khaimara Junction C.N.Halli 10 18 -8 16 70 -54 0.89 1 -0.11 0 0.12 -0.12 72 24 48
Kodagihalli Tiptur 10 40 -30 30 74 -44 0.40 0.22 0.18 0 0.07 -0.07 48 40 8
Kuppuru C.N.Halli 28 28 0 160 64 96 0.30 0.45 -0.15 0 0.03 -0.03 112 32 80
Kuppuradoddahalli Tiptur 55 70 -15 58 46 12 0.87 0.77 0.10 0 0.02 -0.02 60 24 36
Madihalli C.N.Halli 16 70 -54 74 126 -52 0.65 0.3 0.35 0 0.07 -0.07 72 80 -8
Manchasandra C.N.Halli 18 20 -2 56 98 -42 0.85 0.5 0.35 0 0.018 -0.018 56 56 0
Manjunathapura Tiptur 29 35 -6 24 40 -16 0.3 1.3 -1.00 0 0.11 -0.11 48 16 32
Mayagondanahalli Tiptur 20 60 -40 48 138 -90 1.15 0.99 0.16 0 0.1 -0.1 52 52 0
Saratvalli Tiptur 15 23 -8 56 30 26 0.77 0.48 0.29 0 0.20 -0.2 36 24 12
Sasalu C.N.Halli 88 16 72 140 24 116 0.73 0.54 0.19 0 0.07 -0.07 148 20 128
Savsettihalli colony C.N.Halli 60 37 23 70 34 36 1.04 0.46 0.58 0 0.03 -0.03 90 24 66
Settikere C.N.Halli 32 59 -27 64 121 -57 0.81 0.34 0.47 0 0.07 -0.07 64 144 -80
Somalapura C.N.Halli 5 40 -35 86 36 50 0.68 0.41 0.27 0 0.07 -0.07 108 36 72
Tammadihalli C.N.Halli 7 16 -9 50 40 10 0.61 0.4 0.21 0 0.06 -0.06 60 20 40
Tarabenahalli C.N.Halli 36 29 7 66 48 18 0.65 0.31 0.34 0 0.01 -0.01 84 16 68
Vasudevarahalli Tiptur 10 49 -39 76 72 4 0.92 0.4 0.55 0 0.11 -0.11 36 40 -4
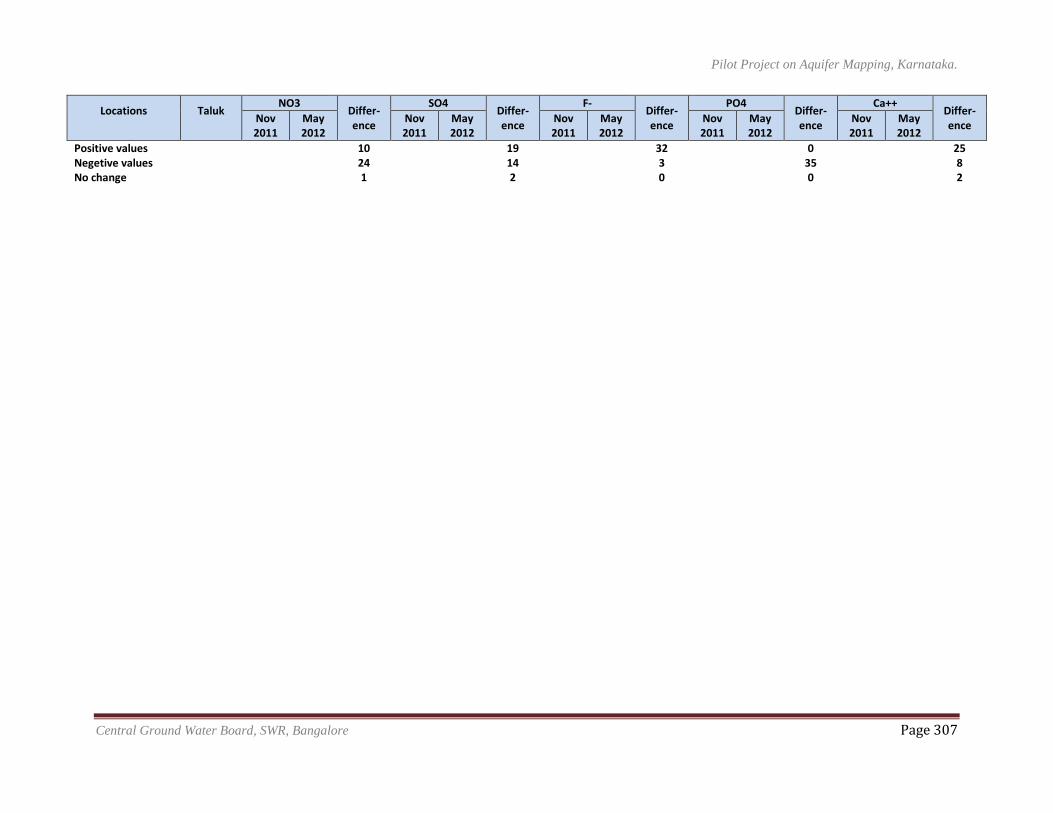
Pilot Project on Aquifer Mapping, Karnataka.
Central Ground Water Board, SWR, Bangalore Page 307
Locations
Taluk
NO3 Differ- ence
SO4 Differ- ence
F- Differ- ence
PO4 Differ- ence
Ca++ Differ- ence
Nov 2011
May 2012
Nov 2011
May 2012
Nov 2011
May 2012
Nov 2011
May 2012
Nov 2011
May 2012
Positive values
10
19
32
0
25 Negetive values
24
14
3
35
8
No change
1
2
0
0
2
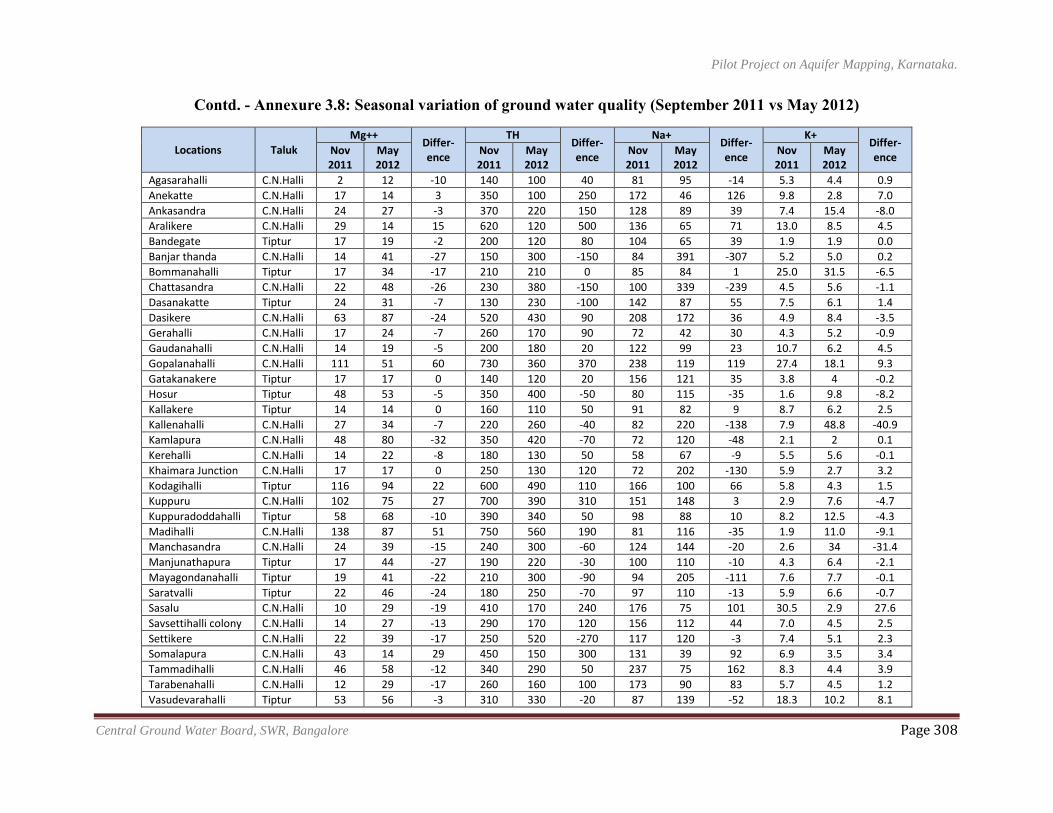
Pilot Project on Aquifer Mapping, Karnataka.
Central Ground Water Board, SWR, Bangalore Page 308
Contd. - Annexure 3.8: Seasonal variation of ground water quality (September 2011 vs May 2012)
Locations Taluk
Mg++ Differ- ence
TH Differ- ence
Na+ Differ- ence
K+ Differ- ence
Nov 2011
May 2012
Nov 2011
May 2012
Nov 2011
May 2012
Nov 2011
May 2012
Agasarahalli C.N.Halli 2 12 -10 140 100 40 81 95 -14 5.3 4.4 0.9
Anekatte C.N.Halli 17 14 3 350 100 250 172 46 126 9.8 2.8 7.0
Ankasandra C.N.Halli 24 27 -3 370 220 150 128 89 39 7.4 15.4 -8.0
Aralikere C.N.Halli 29 14 15 620 120 500 136 65 71 13.0 8.5 4.5
Bandegate Tiptur 17 19 -2 200 120 80 104 65 39 1.9 1.9 0.0
Banjar thanda C.N.Halli 14 41 -27 150 300 -150 84 391 -307 5.2 5.0 0.2
Bommanahalli Tiptur 17 34 -17 210 210 0 85 84 1 25.0 31.5 -6.5
Chattasandra C.N.Halli 22 48 -26 230 380 -150 100 339 -239 4.5 5.6 -1.1
Dasanakatte Tiptur 24 31 -7 130 230 -100 142 87 55 7.5 6.1 1.4
Dasikere C.N.Halli 63 87 -24 520 430 90 208 172 36 4.9 8.4 -3.5
Gerahalli C.N.Halli 17 24 -7 260 170 90 72 42 30 4.3 5.2 -0.9
Gaudanahalli C.N.Halli 14 19 -5 200 180 20 122 99 23 10.7 6.2 4.5
Gopalanahalli C.N.Halli 111 51 60 730 360 370 238 119 119 27.4 18.1 9.3
Gatakanakere Tiptur 17 17 0 140 120 20 156 121 35 3.8 4 -0.2
Hosur Tiptur 48 53 -5 350 400 -50 80 115 -35 1.6 9.8 -8.2
Kallakere Tiptur 14 14 0 160 110 50 91 82 9 8.7 6.2 2.5
Kallenahalli C.N.Halli 27 34 -7 220 260 -40 82 220 -138 7.9 48.8 -40.9
Kamlapura C.N.Halli 48 80 -32 350 420 -70 72 120 -48 2.1 2 0.1
Kerehalli C.N.Halli 14 22 -8 180 130 50 58 67 -9 5.5 5.6 -0.1
Khaimara Junction C.N.Halli 17 17 0 250 130 120 72 202 -130 5.9 2.7 3.2
Kodagihalli Tiptur 116 94 22 600 490 110 166 100 66 5.8 4.3 1.5
Kuppuru C.N.Halli 102 75 27 700 390 310 151 148 3 2.9 7.6 -4.7
Kuppuradoddahalli Tiptur 58 68 -10 390 340 50 98 88 10 8.2 12.5 -4.3
Madihalli C.N.Halli 138 87 51 750 560 190 81 116 -35 1.9 11.0 -9.1
Manchasandra C.N.Halli 24 39 -15 240 300 -60 124 144 -20 2.6 34 -31.4
Manjunathapura Tiptur 17 44 -27 190 220 -30 100 110 -10 4.3 6.4 -2.1
Mayagondanahalli Tiptur 19 41 -22 210 300 -90 94 205 -111 7.6 7.7 -0.1
Saratvalli Tiptur 22 46 -24 180 250 -70 97 110 -13 5.9 6.6 -0.7
Sasalu C.N.Halli 10 29 -19 410 170 240 176 75 101 30.5 2.9 27.6
Savsettihalli colony C.N.Halli 14 27 -13 290 170 120 156 112 44 7.0 4.5 2.5
Settikere C.N.Halli 22 39 -17 250 520 -270 117 120 -3 7.4 5.1 2.3
Somalapura C.N.Halli 43 14 29 450 150 300 131 39 92 6.9 3.5 3.4
Tammadihalli C.N.Halli 46 58 -12 340 290 50 237 75 162 8.3 4.4 3.9
Tarabenahalli C.N.Halli 12 29 -17 260 160 100 173 90 83 5.7 4.5 1.2
Vasudevarahalli Tiptur 53 56 -3 310 330 -20 87 139 -52 18.3 10.2 8.1
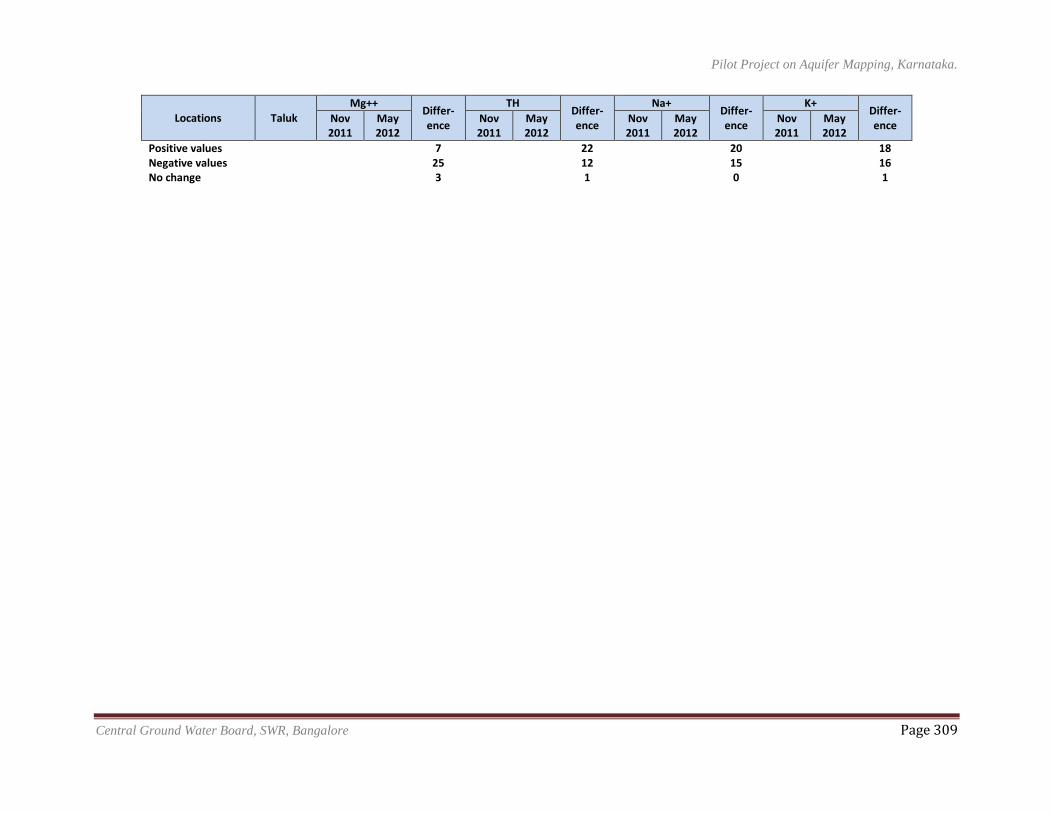
Pilot Project on Aquifer Mapping, Karnataka.
Central Ground Water Board, SWR, Bangalore Page 309
Locations Taluk
Mg++ Differ- ence
TH Differ- ence
Na+ Differ- ence
K+ Differ- ence
Nov 2011
May 2012
Nov 2011
May 2012
Nov 2011
May 2012
Nov 2011
May 2012
Positive values
7
22
20
18 Negative values
25
12
15
16
No change
3
1
0
1
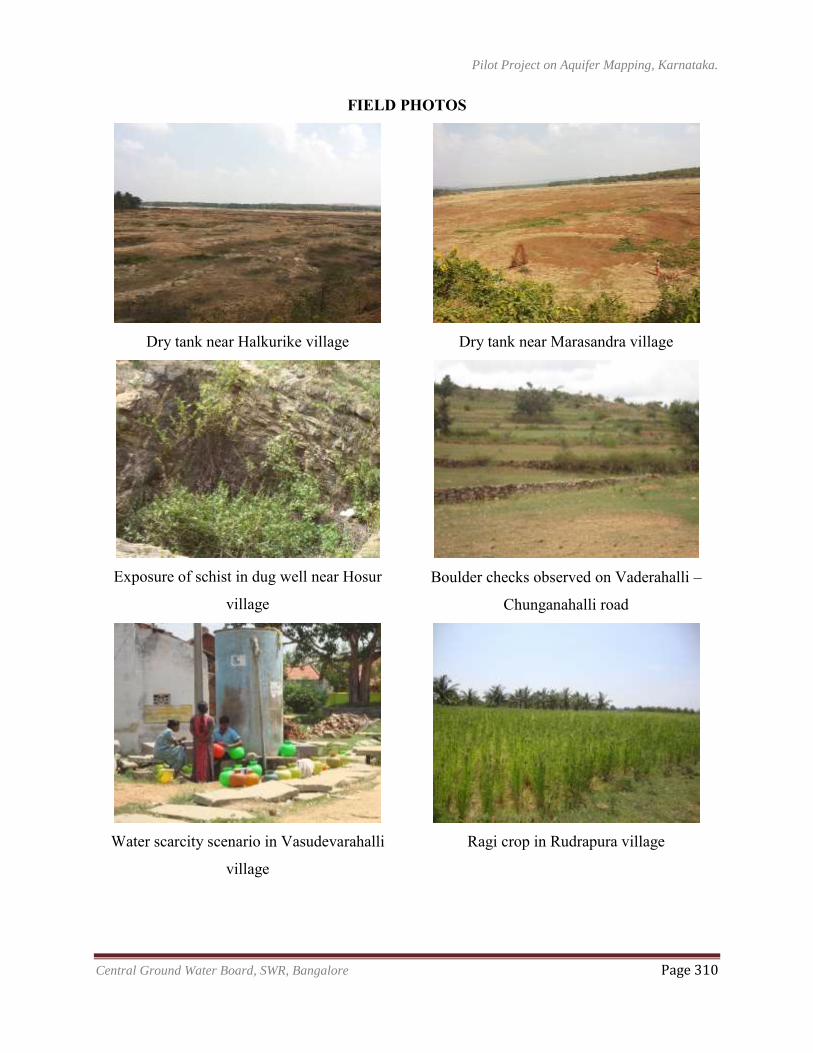
Pilot Project on Aquifer Mapping, Karnataka.
Central Ground Water Board, SWR, Bangalore Page 310
FIELD PHOTOS
Dry tank near Halkurike village
Dry tank near Marasandra village
Exposure of schist in dug well near Hosur
village
Boulder checks observed on Vaderahalli –
Chunganahalli road
Water scarcity scenario in Vasudevarahalli
village
Ragi crop in Rudrapura village
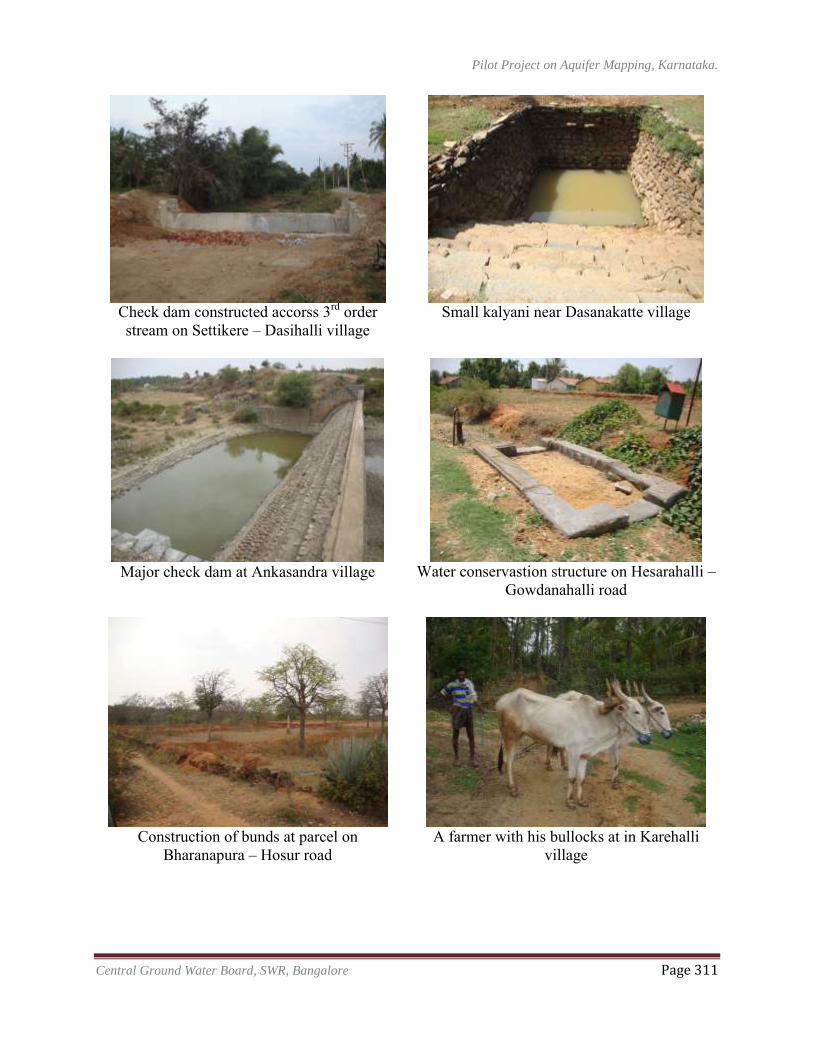
Pilot Project on Aquifer Mapping, Karnataka.
Central Ground Water Board, SWR, Bangalore Page 311
Check dam constructed accorss 3rd order stream on Settikere – Dasihalli village
Small kalyani near Dasanakatte village
Major check dam at Ankasandra village
Water conservastion structure on Hesarahalli –
Gowdanahalli road
Construction of bunds at parcel on
Bharanapura – Hosur road
A farmer with his bullocks at in Karehalli
village
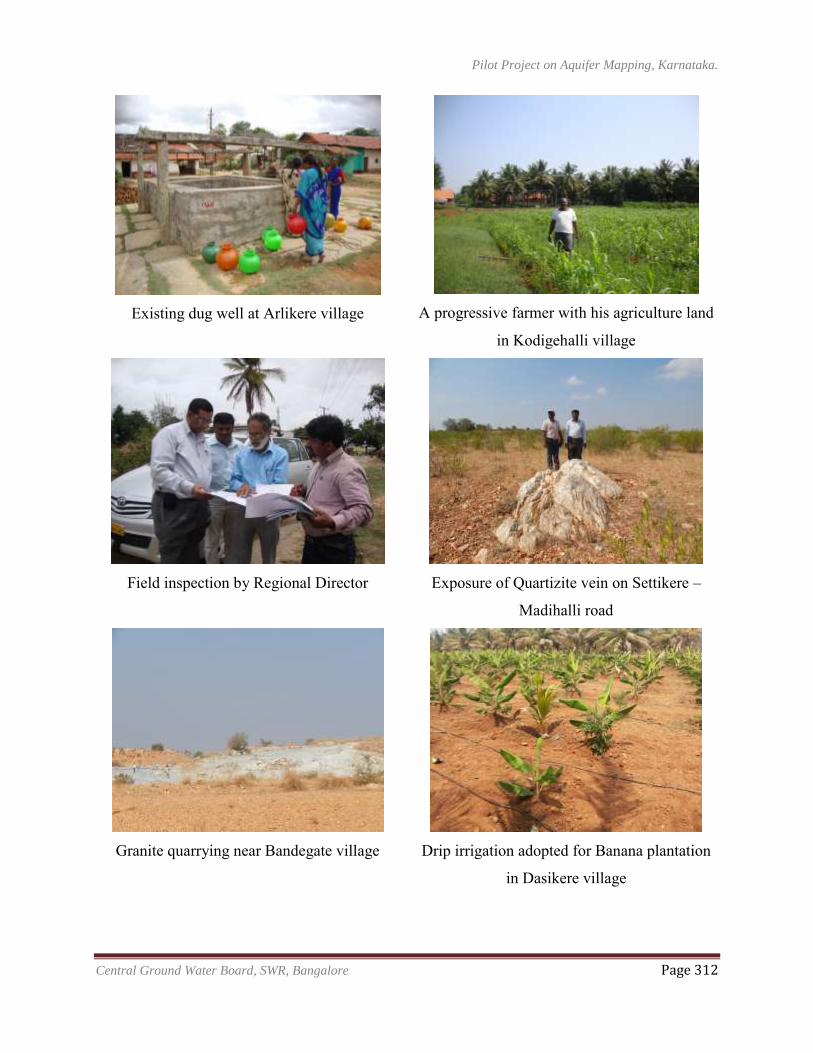
Pilot Project on Aquifer Mapping, Karnataka.
Central Ground Water Board, SWR, Bangalore Page 312
Existing dug well at Arlikere village
A progressive farmer with his agriculture land
in Kodigehalli village
Field inspection by Regional Director
Exposure of Quartizite vein on Settikere –
Madihalli road
Granite quarrying near Bandegate village
Drip irrigation adopted for Banana plantation
in Dasikere village
Pilot Project on Aquifer Mapping, Karnataka.
Central Ground Water Board, SWR, Bangalore Page 313
CONTRIBUTORS’ PAGE
Principal Authors
G.R.C.Reddy, Scientist - D Dr.S.Srinivasa Vittala, Asst.Hydrogeologist
Hydrogeology G.R.C.Reddy, Scientist - D
Dr.S.Srinivasa Vittala, Asst.Hydrogeologist A.Sakthivel, Asst. Hydrogeologist
Geophysics G.Krishna Murthy, Sc - C (Geophysics) B.V.Chinnagudi, Sc - B (Geophysics) Veena Achucha, Asst. Geophysicist
Hydrometeorology & Ground Water Modeling H.P.Jayaprakash, Sc - C (Hydrology)
Chemical Analysis T.Murthy, Asst. Chemist
Rahul Vashista, STA (Chem.)
Survey P.S.Prasad, Sr.Surveyor P.Narahari, Sr.Surveyor
N.Ravikumar, Sr.Surveyor
Related Documents