TRENDS IN ASYLUM DECISIONS IN 38 COUNTRIES, 1999-2000 A COMPARATIVE ANALYSIS OF ASYLUM STATISTICS AND INDICATORS IN 38, MOSTLY INDUSTRIALIZED, COUNTRIES 22 JUNE 2001 POPULATION DATA UNIT POPULATION AND GEOGRAPHICAL DATA SECTION UNITED NATIONS HIGH COMMISSIONER FOR REFUGEES GENEVA ALSO AVAILABLE AT: http://www.unhcr.org CONTACT: HQCS00@unhcr.org

Welcome message from author
This document is posted to help you gain knowledge. Please leave a comment to let me know what you think about it! Share it to your friends and learn new things together.
Transcript
TRENDS IN ASYLUM DECISIONS IN 38 COUNTRIES,
1999-2000
A COMPARATIVE ANALYSIS OF ASYLUM STATISTICS AND INDICATORS IN 38, MOSTLY INDUSTRIALIZED, COUNTRIES
22 JUNE 2001
POPULATION DATA UNIT POPULATION AND GEOGRAPHICAL DATA SECTION
UNITED NATIONS HIGH COMMISSIONER FOR REFUGEES GENEVA
ALSO AVAILABLE AT: http://www.unhcr.org
CONTACT: [email protected]
TRENDS IN ASYLUM DECISIONS IN 38 COUNTRIES, 1999-2000 UNHCR GENEVA
Introduction 1. Each year, the United Nations High Commissioner for Refugees (UNHCR) carries out a comprehensive statistical survey on asylum-seekers, refugees and others of concern to the Office. This study focuses on the refugee status determination statistics reported by 38, mostly industrialized, countries during 1999 and 2000. The countries have been selected on the basis of two major criteria. First, the report analyzes and compares the asylum experience of countries with developed asylum systems. Second, an effort has been made to include as many European countries as possible. With a few exceptions, this survey covers the adjudication of asylum applications by Governments under the 1951 United Nations Convention relating to the Status of Refugees and/or its 1967 Protocol. This report provides only an overview of main trends. Additional information can be made available upon request. 2. For most countries, the data was provided by Governments and is based on their own registration and data collection methods. In a few countries (Cyprus and Turkey), UNHCR carries out refugee status determination under its Mandate and/or on behalf of the Government and is the source of the data. For Japan and the Republic of Korea, official Government data was supplemented with information provided by UNHCR. 3. Although this study mostly reflects official data, the information presented here may differ in two substantial ways from information presented by national authorities. First, the classifications presented here do not reflect the full range of national asylum decision-making, but presents the information according to a simplified, standardized model. A summary comparison between the main national categories and UNHCR’s classification has been provided in the Technical Notes (see below). The indicators presented in this document are a second potential source of differences. To allow for a meaningful comparison of state practice, all rates and indicators in this report have been calculated by UNHCR in a standardized fashion (see Technical Notes). 4. Due to retroactive adjustments, data reported here may differ from information reported earlier by Governments or by UNHCR. All statistics pertaining to 2000 should be considered provisional and subject to change. 5. The report contains three sections. In the first section, the annual number of applications, decisions and pending cases is provided by country of asylum (Table 1 and 2), by country of asylum and type of procedure (Table 3 and 4) and by nationality (Table 5 and 6). The second section covers the 10 largest nationalities of asylum applications lodged during 2000 by country of asylum and type of decision (Table 7 through 16). Lastly, the third section compares for each asylum country the 10 main nationalities of asylum applications decided during 1999 and 2000. 6. In the countries considered here, a significant number of applications is not decided in the same year as they have been lodged. As the annual number of applications cannot be compared with the annual number of decisions, the current data do not allow calculating the proportion of applications, which has been granted refugee status. In stead, the recognition rate is calculated comparing the number of positive decisions with the total number of applications decided during the year.
PAGE 2/46
TRENDS IN ASYLUM DECISIONS IN 38 COUNTRIES, 1999-2000 UNHCR GENEVA
Main trends
7. During 2000, some 714,600 asylum cases were decided in the 38 asylum countries included in this report, 19% more than in 1999, when 601,000 decisions were made. The number of cases granted Convention refugee status during 2000 increased with 7%, whereas the number of cases granted humanitarian status (or complementary form of protection) augmented with 11%. In the 15 countries of the European Union, the number of asylum-seekers granted refugee status rose with 10%, those granted a humanitarian status with 41%, whereas 35% more asylum applications were decided during 2000 compared to 1999.
T
RHRO
RT% rS
Asylum decisions in 38 countries, 1999 and 2000
ype of Total Europe European Uniondecision 1999 2000 1999 2000 1999 2000
efugee status 79,466 85,390 38,141 42,048 32,386 35,702um. Status 60,911 67,689 60,879 67,093 32,445 45,711ejected 269,547 335,980 201,240 267,589 150,403 215,776therw. closed 216,055 229,980 148,368 172,823 107,220 139,272
Total decisions 600,980 714,743 423,629 545,210 320,298 432,104ef. rec. rate 13% 12% 9% 8% 10% 8%otal rec. rate 23% 21% 23% 20% 20% 19%
ef. in tot. rec. 57% 56% 39% 39% 50% 44%ource: See Table 1 and 2
8. UNHCR estimates that the Convention refugee recognition rate in the 38 asylum countries fell from 13% in 1999 to 12% in 2000, whereas the total recognition rate (that is, including those granted complementary forms of protection) fell from 23 to 21%. In the European Union, the proportion of asylum decisions resulting in Convention refugee status fell from 10% in 1999 to 8% in 2000, whereas the Total recognition rate decreased from 20% to 19%. 9. Protection under the 1951 United Nations Convention relating to the Status of Refugees also fell in comparison to the number of asylum-seekers granted a humanitarian status. In the 15 countries of the European Union, the proportion of asylum-seekers granted refugee status compared to the total number of asylum-seekers granted refugee or another form of complementary protection fell from 50% in 1999 to 44% in 2000. In all countries considered here, some 56% of the asylum-seekers receiving a positive decision in 2000 were granted refugee status, compared to 57% in 1999. 10. In 2000, the largest number of asylum applications was decided in the USA (112,000), followed by the United Kingdom (110,000), Germany (106,000), the Netherlands (76,800) and Switzerland (68,400). Together, these five countries accounted for two-third of all asylum decisions made in the countries considered here. 11. During 2000, some 70% of all refugee status decisions were made in four countries, namely the USA (24,000), Canada (14,000), Germany (11,400) and the UK (10,200). The main countries granting a humanitarian status to asylum-seekers were the United Kingdom (21,700), Switzerland (17,000), Sweden (8,600) and the Netherlands (7,900). Together, these four countries accounted for 81% of all grants of humanitarian status in the 38 countries considered here. 12. On average, some 12% of all asylum decisions made during 2000 resulted in refugee status. Countries where the refugee recognition rate was more than twice the average included Canada (49%), Turkey (48%), and Australia (25%). Countries where the refugee recognition rate was less than half the average included Austria (5%), Ireland (5%), Switzerland (4%), Czech Rep. (2%), Hungary 2%), the Netherlands (2%),
PAGE 3/46
TRENDS IN ASYLUM DECISIONS IN 38 COUNTRIES, 1999-2000 UNHCR GENEVA
Top-10 nationalities granted refugee status in 38 countries, 1990-2000
-
2,000
4,000
6,000
8,000
10,000
12,000
14,000
IRQ YUG SOM IRN TUR AFG LKA COD CHI PAK
1999 2000
Top-10 nationalities granted humanitarian status in 38 countries, 1990-2000
25,000
30,0001999 2000
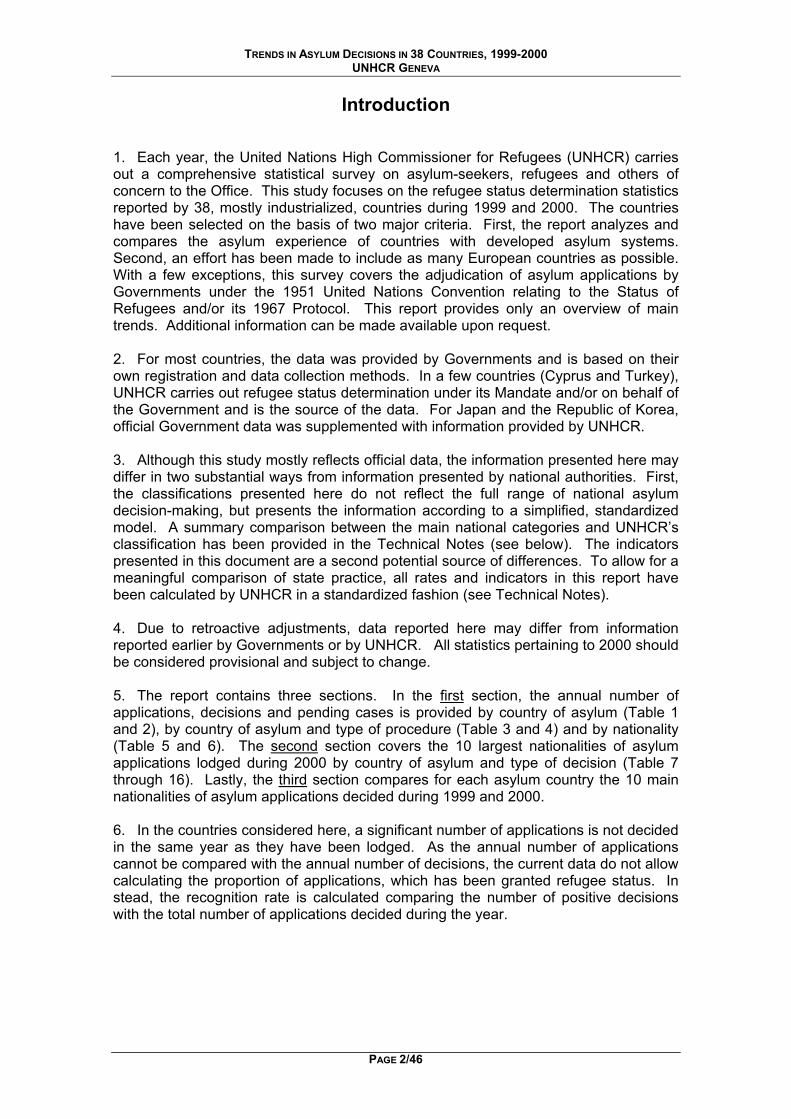
seekers (18,500 or 11%), followed by citizens from FR Yugoslavia (14,700 or 9%) and Somali nationals (12,600 or 8%). An annual increase in Convention refugee recognition was registered for most major asylum-seeker nationalities, except for FR Yugoslavia and the Democratic Republic of the Congo (see chart).
-
5,000
10,000
15,000
20,000
YUG IRQ AFG SOM LKA TUR BSN COD SLE ANG
Poland (2%), Sweden (2%), Finland (1%) and Norway (1%). As explained in the Technical Notes, the data presented here do not include asylum-seekers who have not been admitted to the asylum procedure. The recognition rate in countries with a pre-screening or admissibility procedure may differ significantly from those without. 13. In 2000, 21 of the 38 countries included in this report granted a humanitarian status to asylum-seekers in addition to refugee status. In 15 of these 21 countries, the number of asylum-seekers granted a humanitarian status outnumbered the number of persons granted refugee status. The share of refugee status in the total number of recognized persons was the lowest in Finland (3%), Norway (3%) and Sweden (5%). 14. The annual number of asylum-seekers granted refugee status in the 38 countries considered here increased with 7%, from 79,500 in 1999 to 85,400 in 2000. During these two years, nationals from Iraq constituted the largest group of recognized asylum-
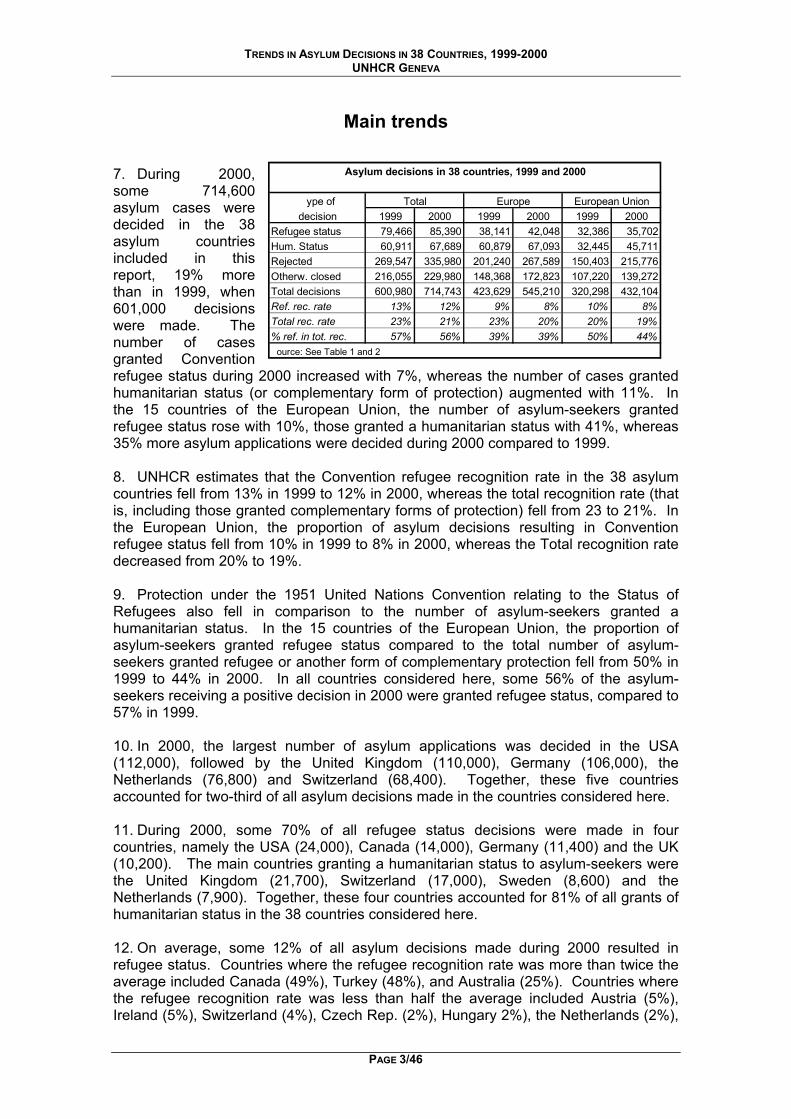
15. In the countries considered here, grants of humanitarian status other forms of complementary protection increased from 79,500 in 1999 to 85,400 in 2000 (7%). About one quarter (34,700 or 27%) of these decisions concerned asylum-seekers from FR Yugoslavia. Iraqi nationalities were second largest group receiving humanitarian status (15,200 or 12%), followed by asylum-seekers from Afghanistan (12,300 or 10%), Somalia (10,400 or 8%) and Sri Lanka (10,300 or 8%) (see chart).
Technical notes 16. As regards data availability, complete data sets were available for most countries. However, information for the following countries was only partially available: Portugal (2000 asylum decisions not available), United Kingdom (2000 asylum decisions by nationality for January to March 2000 not available), Sweden (1999 decisions in review not available), Italy (Otherwise closed decisions categorized differently in 1999 and 2000), Luxembourg (no data on decisions available for 1999; breakdown of decisions by nationality lacking in 2000) and New Zealand (no nationality breakdown available for
PAGE 4/46
TRENDS IN ASYLUM DECISIONS IN 38 COUNTRIES, 1999-2000 UNHCR GENEVA
decisions, except for grants of refugee status). In a few instances, the data have been reported by fiscal year (e.g. USA) rather than calendar year. 17. Special attention should be drawn to the nature of the data discussed in this study. Refugee status determination statistics reflect administrative decisions, rather than the number of persons covered by these procedures. Although there is a strong link between a positive decision in the asylum procedure and the number of asylum-seekers legally admitted, these two are not necessarily similar. For instance, a considerable time difference may exist between the formal asylum decision and the actual data of issuance of a visa. Second, the definition of a case for the purpose of the asylum procedure differs significantly between countries. Sometimes, a case covers all adults within one family who arrived as a group, whereas in other instances all adults are registered separately (despite the fact the asylum decision may be linked between members of the same family). Third, a growing number of countries report statistics for different stages in the asylum procedure, leading to a significant double count as cases which are being rejected in the first instance, but considered again in review are effectively counted twice. In brief, the data presented here reflect administrative decisions, often at different stages in the procedure, rather than the final number of persons accepted or rejected as refugees. 18. In the tables, the following terminology has been used.
• Country of asylum. The country where the asylum claim has been filed. • Level of procedure (L). A number of countries report their data by stage in the
asylum procedure. The following levels (types) are distinguished here:
- First Instance (FI) - Administrative review (appeal) (AR) - Judicial review (JR) - Backlog procedure (BL, United Kingdom only) - Repeat applications (RA, Germany only) - New applications (NA, Germany only) - Immigration and Naturalization Service (IN, US only) - Executive Office of Immigration Review (EO, US only) - Government procedure (G) (only indicated if UNHCR data are also provided) - UNHCR mandate procedure (U)
• Origin (or Nationality). This generally refers to the nationality (country of
citizenship) of the asylum applicant. • Pending cases as at 1 Jan. The number of applications, which had been
submitted, but not yet decided, at 1 January. In principle, this should equal the number of pending cases at the end of the previous year.
• Applied during year. The number of applications submitted during the year. • The following types of decisions have been distinguished.
- Refugee status. This generally refers to the annual number of persons
granted refugee status on the basis of the 1951 United Nations Convention relating to the Status of Refugees or its 1967 Protocol.
PAGE 5/46
TRENDS IN ASYLUM DECISIONS IN 38 COUNTRIES, 1999-2000 UNHCR GENEVA
- Hum. status. This refers to humanitarian status granted to asylum-seekers during the year. This category includes may include other forms of complementary protection, but does generally not include short-term delays in the removal of rejected asylum-seekers.
- Rejected. This refers to the number of applications, which was rejected during
the year. - Otherwise closed. This generally refers to applications, which were closed
during the year for other than substantive reasons. - Total. The total number of decisions generally concerns the total of the above
four types of asylum decisions.
• Pending cases as at 31 Dec. The number of asylum applications, which had been submitted, but not yet decided, at 31 December. In general, the number of pending cases as at 31 December should equal the number of pending cases at the beginning of the following year. Additionally, the number of pending cases as at 31 December should equal the number of pending cases as at 1 January, plus the number of new applications minus the total number of decisions.
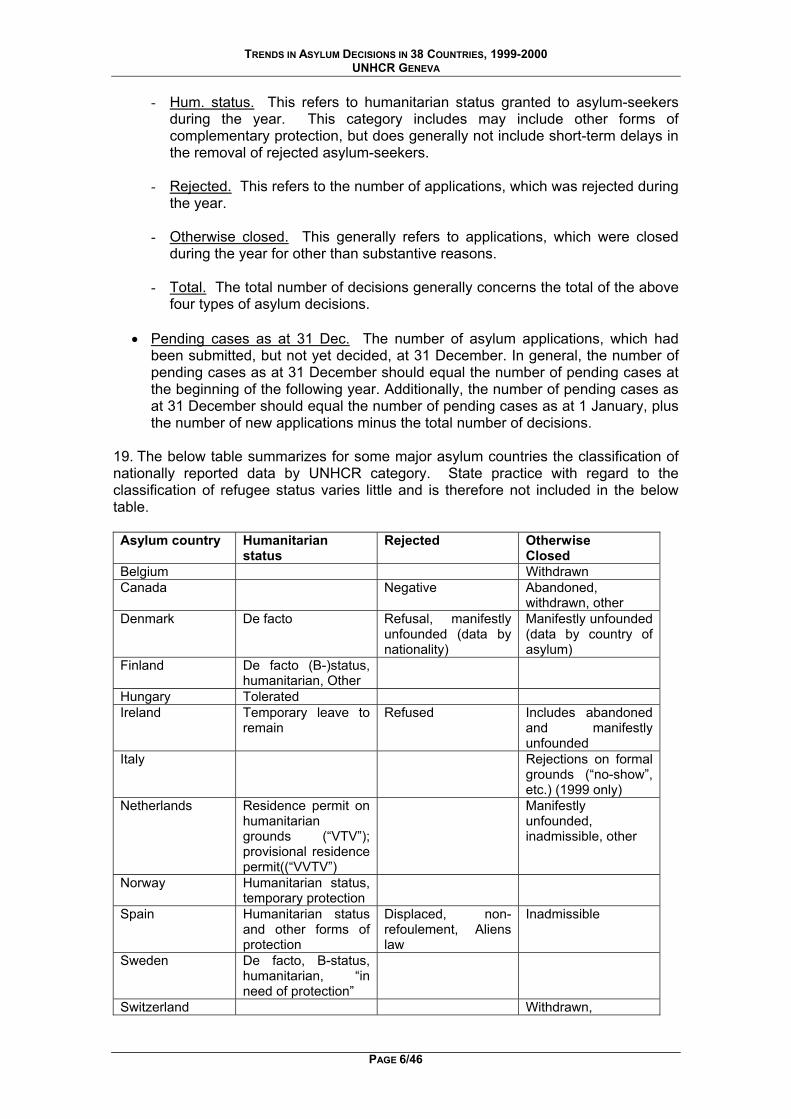
19. The below table summarizes for some major asylum countries the classification of nationally reported data by UNHCR category. State practice with regard to the classification of refugee status varies little and is therefore not included in the below table. Asylum country Humanitarian
status Rejected Otherwise
Closed Belgium Withdrawn Canada Negative Abandoned,
withdrawn, other Denmark De facto Refusal, manifestly
unfounded (data by nationality)
Manifestly unfounded (data by country of asylum)
Finland De facto (B-)status, humanitarian, Other
Hungary Tolerated Ireland Temporary leave to
remain Refused Includes abandoned
and manifestly unfounded
Italy Rejections on formal grounds (“no-show”, etc.) (1999 only)
Netherlands Residence permit on humanitarian grounds (“VTV”); provisional residence permit((“VVTV”)
Manifestly unfounded, inadmissible, other
Norway Humanitarian status, temporary protection
Spain Humanitarian status and other forms of protection
Displaced, non-refoulement, Aliens law
Inadmissible
Sweden De facto, B-status, humanitarian, “in need of protection”
Switzerland Withdrawn,
PAGE 6/46
TRENDS IN ASYLUM DECISIONS IN 38 COUNTRIES, 1999-2000 UNHCR GENEVA
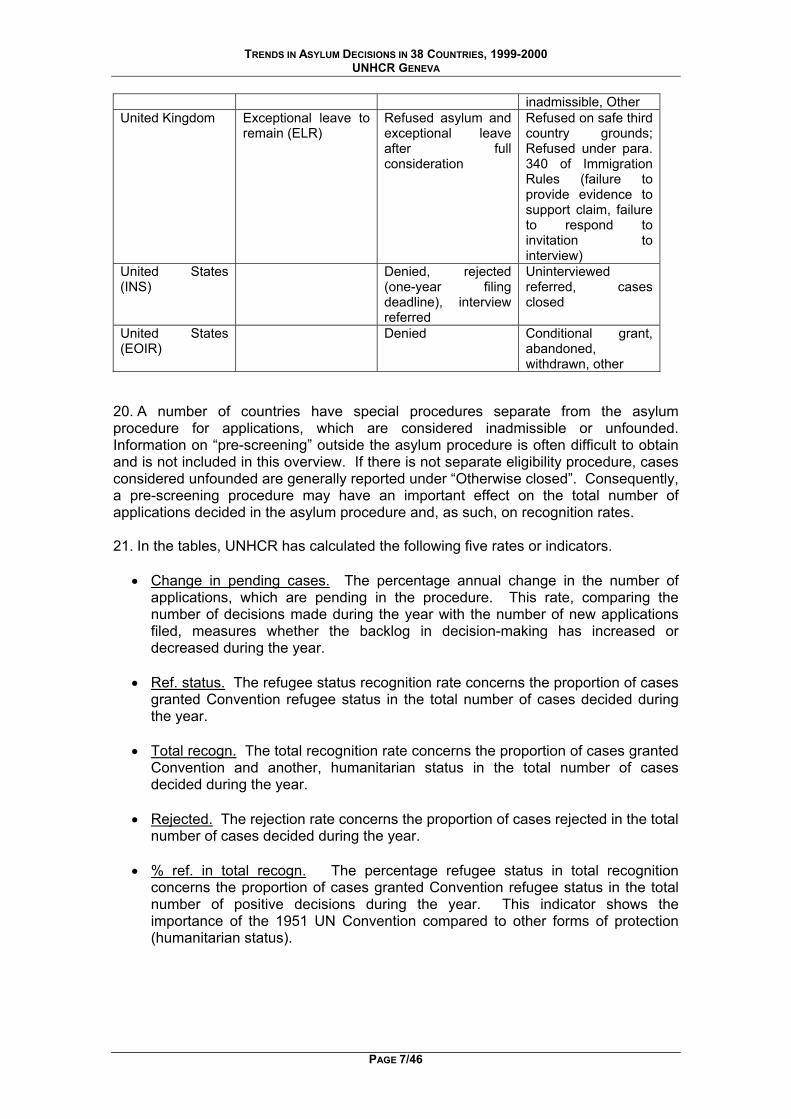
inadmissible, Other United Kingdom Exceptional leave to
remain (ELR) Refused asylum and exceptional leave after full consideration
Refused on safe third country grounds; Refused under para. 340 of Immigration Rules (failure to provide evidence to support claim, failure to respond to invitation to interview)
United States (INS)
Denied, rejected (one-year filing deadline), interview referred
Uninterviewed referred, cases closed
United States (EOIR)
Denied Conditional grant, abandoned, withdrawn, other
20. A number of countries have special procedures separate from the asylum procedure for applications, which are considered inadmissible or unfounded. Information on “pre-screening” outside the asylum procedure is often difficult to obtain and is not included in this overview. If there is not separate eligibility procedure, cases considered unfounded are generally reported under “Otherwise closed”. Consequently, a pre-screening procedure may have an important effect on the total number of applications decided in the asylum procedure and, as such, on recognition rates. 21. In the tables, UNHCR has calculated the following five rates or indicators.
• Change in pending cases. The percentage annual change in the number of applications, which are pending in the procedure. This rate, comparing the number of decisions made during the year with the number of new applications filed, measures whether the backlog in decision-making has increased or decreased during the year.
• Ref. status. The refugee status recognition rate concerns the proportion of cases
granted Convention refugee status in the total number of cases decided during the year.
• Total recogn. The total recognition rate concerns the proportion of cases granted
Convention and another, humanitarian status in the total number of cases decided during the year.
• Rejected. The rejection rate concerns the proportion of cases rejected in the total
number of cases decided during the year. • % ref. in total recogn. The percentage refugee status in total recognition
concerns the proportion of cases granted Convention refugee status in the total number of positive decisions during the year. This indicator shows the importance of the 1951 UN Convention compared to other forms of protection (humanitarian status).
PAGE 7/46
TRENDS IN ASYLUM DECISIONS IN 38 COUNTRIES, 1999-2000 UNHCR GENEVA
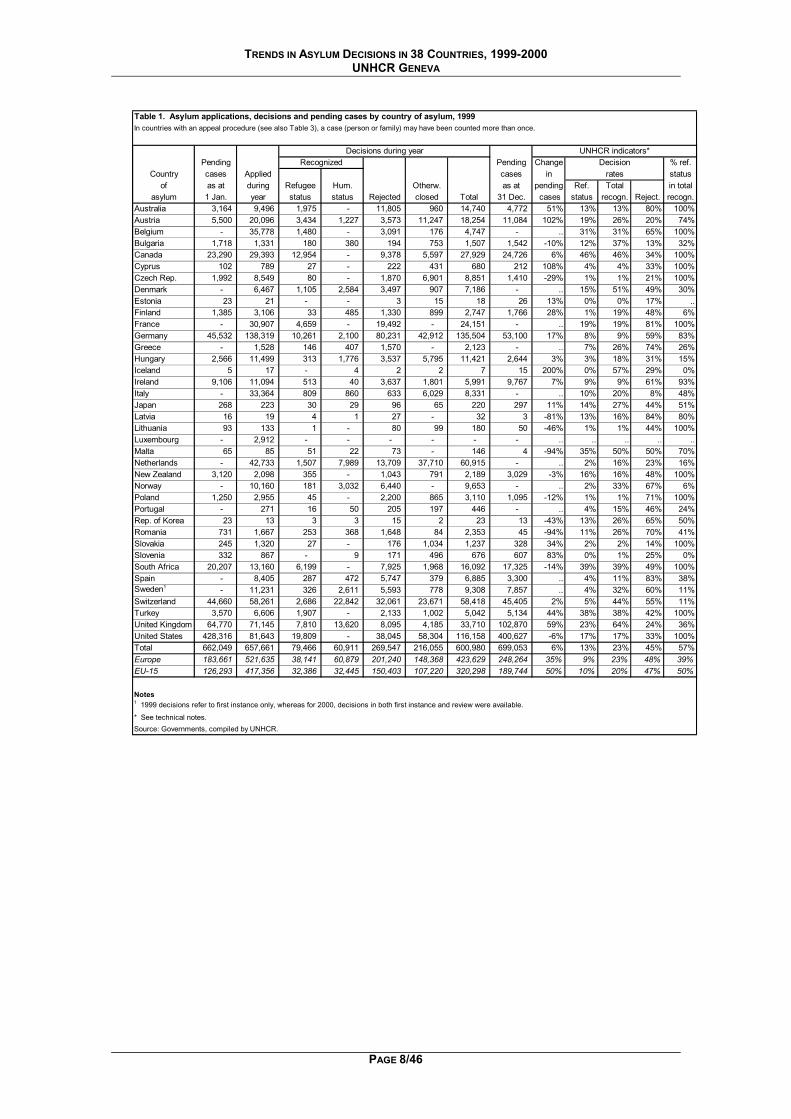
Table 1. Asylum applications, decisions and pending cases by country of asylum, 1999In countries with an appeal procedure (see also Table 3), a case (person or family) may have been counted more than once.
Decisions during year UNHCR indicators*Pending Recognized Pending Change Decision % ref.
Country cases Applied cases in rates statusof as at during Refugee Hum. Otherw. as at pending Ref. Total in total
asylum 1 Jan. year status status Rejected closed Total 31 Dec. cases status recogn. Reject. recogn.Australia 3,164 9,496 1,975 - 11,805 960 14,740 4,772 51% 13% 13% 80% 100%Austria 5,500 20,096 3,434 1,227 3,573 11,247 18,254 11,084 102% 19% 26% 20% 74%Belgium - 35,778 1,480 - 3,091 176 4,747 - .. 31% 31% 65% 100%Bulgaria 1,718 1,331 180 380 194 753 1,507 1,542 -10% 12% 37% 13% 32%Canada 23,290 29,393 12,954 - 9,378 5,597 27,929 24,726 6% 46% 46% 34% 100%Cyprus 102 789 27 - 222 431 680 212 108% 4% 4% 33% 100%Czech Rep. 1,992 8,549 80 - 1,870 6,901 8,851 1,410 -29% 1% 1% 21% 100%Denmark - 6,467 1,105 2,584 3,497 907 7,186 - .. 15% 51% 49% 30%Estonia 23 21 - - 3 15 18 26 13% 0% 0% 17% ..Finland 1,385 3,106 33 485 1,330 899 2,747 1,766 28% 1% 19% 48% 6%France - 30,907 4,659 - 19,492 - 24,151 - .. 19% 19% 81% 100%Germany 45,532 138,319 10,261 2,100 80,231 42,912 135,504 53,100 17% 8% 9% 59% 83%Greece - 1,528 146 407 1,570 - 2,123 - .. 7% 26% 74% 26%Hungary 2,566 11,499 313 1,776 3,537 5,795 11,421 2,644 3% 3% 18% 31% 15%Iceland 5 17 - 4 2 2 7 15 200% 0% 57% 29% 0%Ireland 9,106 11,094 513 40 3,637 1,801 5,991 9,767 7% 9% 9% 61% 93%Italy - 33,364 809 860 633 6,029 8,331 - .. 10% 20% 8% 48%Japan 268 223 30 29 96 65 220 297 11% 14% 27% 44% 51%Latvia 16 19 4 1 27 - 32 3 -81% 13% 16% 84% 80%Lithuania 93 133 1 - 80 99 180 50 -46% 1% 1% 44% 100%Luxembourg - 2,912 - - - - - - .. .. .. .. ..Malta 65 85 51 22 73 - 146 4 -94% 35% 50% 50% 70%Netherlands - 42,733 1,507 7,989 13,709 37,710 60,915 - .. 2% 16% 23% 16%New Zealand 3,120 2,098 355 - 1,043 791 2,189 3,029 -3% 16% 16% 48% 100%Norway - 10,160 181 3,032 6,440 - 9,653 - .. 2% 33% 67% 6%Poland 1,250 2,955 45 - 2,200 865 3,110 1,095 -12% 1% 1% 71% 100%Portugal - 271 16 50 205 197 446 - .. 4% 15% 46% 24%Rep. of Korea 23 13 3 3 15 2 23 13 -43% 13% 26% 65% 50%Romania 731 1,667 253 368 1,648 84 2,353 45 -94% 11% 26% 70% 41%Slovakia 245 1,320 27 - 176 1,034 1,237 328 34% 2% 2% 14% 100%Slovenia 332 867 - 9 171 496 676 607 83% 0% 1% 25% 0%South Africa 20,207 13,160 6,199 - 7,925 1,968 16,092 17,325 -14% 39% 39% 49% 100%Spain - 8,405 287 472 5,747 379 6,885 3,300 .. 4% 11% 83% 38%Sweden1 - 11,231 326 2,611 5,593 778 9,308 7,857 .. 4% 32% 60% 11%Switzerland 44,660 58,261 2,686 22,842 32,061 23,671 58,418 45,405 2% 5% 44% 55% 11%Turkey 3,570 6,606 1,907 - 2,133 1,002 5,042 5,134 44% 38% 38% 42% 100%United Kingdom 64,770 71,145 7,810 13,620 8,095 4,185 33,710 102,870 59% 23% 64% 24% 36%United States 428,316 81,643 19,809 - 38,045 58,304 116,158 400,627 -6% 17% 17% 33% 100%Total 662,049 657,661 79,466 60,911 269,547 216,055 600,980 699,053 6% 13% 23% 45% 57%Europe 183,661 521,635 38,141 60,879 201,240 148,368 423,629 248,264 35% 9% 23% 48% 39%EU-15 126,293 417,356 32,386 32,445 150,403 107,220 320,298 189,744 50% 10% 20% 47% 50%
Notes1 1999 decisions refer to first instance only, whereas for 2000, decisions in both first instance and review were available.
* See technical notes.Source: Governments, compiled by UNHCR.
PAGE 8/46
TRENDS IN ASYLUM DECISIONS IN 38 COUNTRIES, 1999-2000 UNHCR GENEVA
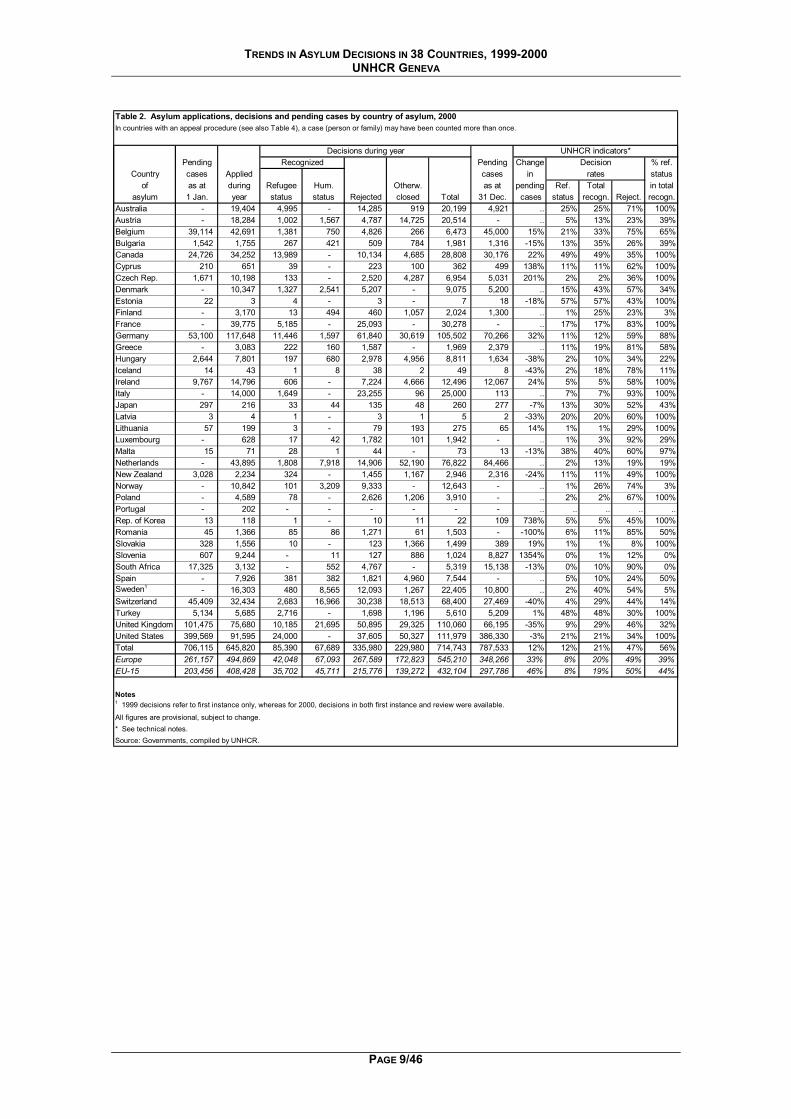
Table 2. Asylum applications, decisions and pending cases by country of asylum, 2000In countries with an appeal procedure (see also Table 4), a case (person or family) may have been counted more than once.
Decisions during year UNHCR indicators*Pending Recognized Pending Change Decision % ref.
Country cases Applied cases in rates statusof as at during Refugee Hum. Otherw. as at pending Ref. Total in total
asylum 1 Jan. year status status Rejected closed Total 31 Dec. cases status recogn. Reject. recogn.Australia - 19,404 4,995 - 14,285 919 20,199 4,921 .. 25% 25% 71% 100%Austria - 18,284 1,002 1,567 4,787 14,725 20,514 - .. 5% 13% 23% 39%Belgium 39,114 42,691 1,381 750 4,826 266 6,473 45,000 15% 21% 33% 75% 65%Bulgaria 1,542 1,755 267 421 509 784 1,981 1,316 -15% 13% 35% 26% 39%Canada 24,726 34,252 13,989 - 10,134 4,685 28,808 30,176 22% 49% 49% 35% 100%Cyprus 210 651 39 - 223 100 362 499 138% 11% 11% 62% 100%Czech Rep. 1,671 10,198 133 - 2,520 4,287 6,954 5,031 201% 2% 2% 36% 100%Denmark - 10,347 1,327 2,541 5,207 - 9,075 5,200 .. 15% 43% 57% 34%Estonia 22 3 4 - 3 - 7 18 -18% 57% 57% 43% 100%Finland - 3,170 13 494 460 1,057 2,024 1,300 .. 1% 25% 23% 3%France - 39,775 5,185 - 25,093 - 30,278 - .. 17% 17% 83% 100%Germany 53,100 117,648 11,446 1,597 61,840 30,619 105,502 70,266 32% 11% 12% 59% 88%Greece - 3,083 222 160 1,587 - 1,969 2,379 .. 11% 19% 81% 58%Hungary 2,644 7,801 197 680 2,978 4,956 8,811 1,634 -38% 2% 10% 34% 22%Iceland 14 43 1 8 38 2 49 8 -43% 2% 18% 78% 11%Ireland 9,767 14,796 606 - 7,224 4,666 12,496 12,067 24% 5% 5% 58% 100%Italy - 14,000 1,649 - 23,255 96 25,000 113 .. 7% 7% 93% 100%Japan 297 216 33 44 135 48 260 277 -7% 13% 30% 52% 43%Latvia 3 4 1 - 3 1 5 2 -33% 20% 20% 60% 100%Lithuania 57 199 3 - 79 193 275 65 14% 1% 1% 29% 100%Luxembourg - 628 17 42 1,782 101 1,942 - .. 1% 3% 92% 29%Malta 15 71 28 1 44 - 73 13 -13% 38% 40% 60% 97%Netherlands - 43,895 1,808 7,918 14,906 52,190 76,822 84,466 .. 2% 13% 19% 19%New Zealand 3,028 2,234 324 - 1,455 1,167 2,946 2,316 -24% 11% 11% 49% 100%Norway - 10,842 101 3,209 9,333 - 12,643 - .. 1% 26% 74% 3%Poland - 4,589 78 - 2,626 1,206 3,910 - .. 2% 2% 67% 100%Portugal - 202 - - - - - - .. .. .. .. ..Rep. of Korea 13 118 1 - 10 11 22 109 738% 5% 5% 45% 100%Romania 45 1,366 85 86 1,271 61 1,503 - -100% 6% 11% 85% 50%Slovakia 328 1,556 10 - 123 1,366 1,499 389 19% 1% 1% 8% 100%Slovenia 607 9,244 - 11 127 886 1,024 8,827 1354% 0% 1% 12% 0%South Africa 17,325 3,132 - 552 4,767 - 5,319 15,138 -13% 0% 10% 90% 0%Spain - 7,926 381 382 1,821 4,960 7,544 - .. 5% 10% 24% 50%Sweden1 - 16,303 480 8,565 12,093 1,267 22,405 10,800 .. 2% 40% 54% 5%Switzerland 45,409 32,434 2,683 16,966 30,238 18,513 68,400 27,469 -40% 4% 29% 44% 14%Turkey 5,134 5,685 2,716 - 1,698 1,196 5,610 5,209 1% 48% 48% 30% 100%United Kingdom 101,475 75,680 10,185 21,695 50,895 29,325 110,060 66,195 -35% 9% 29% 46% 32%United States 399,569 91,595 24,000 - 37,605 50,327 111,979 386,330 -3% 21% 21% 34% 100%Total 706,115 645,820 85,390 67,689 335,980 229,980 714,743 787,533 12% 12% 21% 47% 56%Europe 261,157 494,869 42,048 67,093 267,589 172,823 545,210 348,266 33% 8% 20% 49% 39%EU-15 203,456 408,428 35,702 45,711 215,776 139,272 432,104 297,786 46% 8% 19% 50% 44%
Notes1 1999 decisions refer to first instance only, whereas for 2000, decisions in both first instance and review were available.
All figures are provisional, subject to change.* See technical notes.Source: Governments, compiled by UNHCR.
PAGE 9/46
TRENDS IN ASYLUM DECISIONS IN 38 COUNTRIES, 1999-2000 UNHCR GENEVA
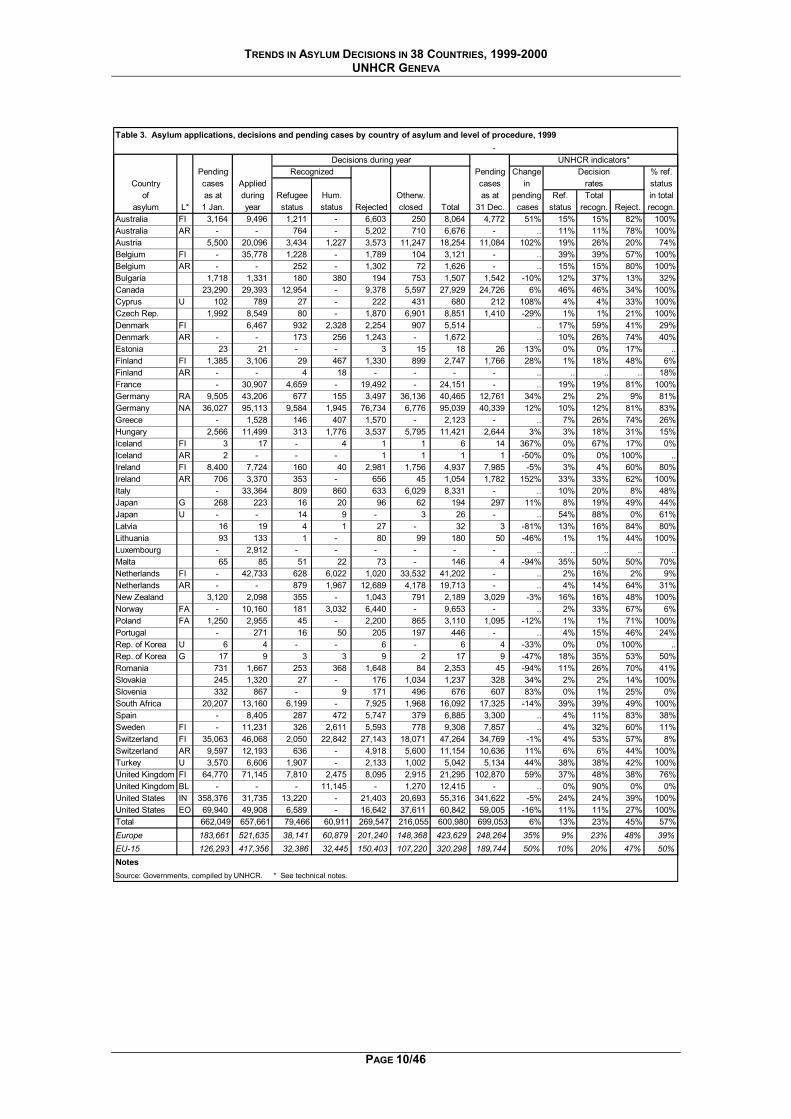
Table 3. Asylum applications, decisions and pending cases by country of asylum and level of procedure, 1999
- Decisions during year UNHCR indicators*
Pending Recognized Pending Change Decision % ref.Country cases Applied cases in rates status
of as at during Refugee Hum. Otherw. as at pending Ref. Total in totalasylum L* 1 Jan. year status status Rejected closed Total 31 Dec. cases status recogn. Reject. recogn.
Australia FI 3,164 9,496 1,211 - 6,603 250 8,064 4,772 51% 15% 15% 82% 100%Australia AR - - 764 - 5,202 710 6,676 - .. 11% 11% 78% 100%Austria 5,500 20,096 3,434 1,227 3,573 11,247 18,254 11,084 102% 19% 26% 20% 74%Belgium FI - 35,778 1,228 - 1,789 104 3,121 - .. 39% 39% 57% 100%Belgium AR - - 252 - 1,302 72 1,626 - .. 15% 15% 80% 100%Bulgaria 1,718 1,331 180 380 194 753 1,507 1,542 -10% 12% 37% 13% 32%Canada 23,290 29,393 12,954 - 9,378 5,597 27,929 24,726 6% 46% 46% 34% 100%Cyprus U 102 789 27 - 222 431 680 212 108% 4% 4% 33% 100%Czech Rep. 1,992 8,549 80 - 1,870 6,901 8,851 1,410 -29% 1% 1% 21% 100%Denmark FI 6,467 932 2,328 2,254 907 5,514 .. 17% 59% 41% 29%Denmark AR - - 173 256 1,243 - 1,672 .. 10% 26% 74% 40%Estonia 23 21 - - 3 15 18 26 13% 0% 0% 17% ..Finland FI 1,385 3,106 29 467 1,330 899 2,747 1,766 28% 1% 18% 48% 6%Finland AR - - 4 18 - - - - .. .. .. .. 18%France - 30,907 4,659 - 19,492 - 24,151 - .. 19% 19% 81% 100%Germany RA 9,505 43,206 677 155 3,497 36,136 40,465 12,761 34% 2% 2% 9% 81%Germany NA 36,027 95,113 9,584 1,945 76,734 6,776 95,039 40,339 12% 10% 12% 81% 83%Greece - 1,528 146 407 1,570 - 2,123 - .. 7% 26% 74% 26%Hungary 2,566 11,499 313 1,776 3,537 5,795 11,421 2,644 3% 3% 18% 31% 15%Iceland FI 3 17 - 4 1 1 6 14 367% 0% 67% 17% 0%Iceland AR 2 - - - 1 1 1 1 -50% 0% 0% 100% ..Ireland FI 8,400 7,724 160 40 2,981 1,756 4,937 7,985 -5% 3% 4% 60% 80%Ireland AR 706 3,370 353 - 656 45 1,054 1,782 152% 33% 33% 62% 100%Italy - 33,364 809 860 633 6,029 8,331 - .. 10% 20% 8% 48%Japan G 268 223 16 20 96 62 194 297 11% 8% 19% 49% 44%Japan U - - 14 9 - 3 26 - .. 54% 88% 0% 61%Latvia 16 19 4 1 27 - 32 3 -81% 13% 16% 84% 80%Lithuania 93 133 1 - 80 99 180 50 -46% 1% 1% 44% 100%Luxembourg - 2,912 - - - - - - .. .. .. .. ..Malta 65 85 51 22 73 - 146 4 -94% 35% 50% 50% 70%Netherlands FI - 42,733 628 6,022 1,020 33,532 41,202 - .. 2% 16% 2% 9%Netherlands AR - - 879 1,967 12,689 4,178 19,713 - .. 4% 14% 64% 31%New Zealand 3,120 2,098 355 - 1,043 791 2,189 3,029 -3% 16% 16% 48% 100%Norway FA - 10,160 181 3,032 6,440 - 9,653 - .. 2% 33% 67% 6%Poland FA 1,250 2,955 45 - 2,200 865 3,110 1,095 -12% 1% 1% 71% 100%Portugal - 271 16 50 205 197 446 - .. 4% 15% 46% 24%Rep. of Korea U 6 4 - - 6 - 6 4 -33% 0% 0% 100% ..Rep. of Korea G 17 9 3 3 9 2 17 9 -47% 18% 35% 53% 50%Romania 731 1,667 253 368 1,648 84 2,353 45 -94% 11% 26% 70% 41%Slovakia 245 1,320 27 - 176 1,034 1,237 328 34% 2% 2% 14% 100%Slovenia 332 867 - 9 171 496 676 607 83% 0% 1% 25% 0%South Africa 20,207 13,160 6,199 - 7,925 1,968 16,092 17,325 -14% 39% 39% 49% 100%Spain - 8,405 287 472 5,747 379 6,885 3,300 .. 4% 11% 83% 38%Sweden FI - 11,231 326 2,611 5,593 778 9,308 7,857 .. 4% 32% 60% 11%Switzerland FI 35,063 46,068 2,050 22,842 27,143 18,071 47,264 34,769 -1% 4% 53% 57% 8%Switzerland AR 9,597 12,193 636 - 4,918 5,600 11,154 10,636 11% 6% 6% 44% 100%Turkey U 3,570 6,606 1,907 - 2,133 1,002 5,042 5,134 44% 38% 38% 42% 100%United Kingdom FI 64,770 71,145 7,810 2,475 8,095 2,915 21,295 102,870 59% 37% 48% 38% 76%United Kingdom BL - - - 11,145 - 1,270 12,415 - .. 0% 90% 0% 0%United States IN 358,376 31,735 13,220 - 21,403 20,693 55,316 341,622 -5% 24% 24% 39% 100%United States EO 69,940 49,908 6,589 - 16,642 37,611 60,842 59,005 -16% 11% 11% 27% 100%Total 662,049 657,661 79,466 60,911 269,547 216,055 600,980 699,053 6% 13% 23% 45% 57%Europe 183,661 521,635 38,141 60,879 201,240 148,368 423,629 248,264 35% 9% 23% 48% 39%EU-15 126,293 417,356 32,386 32,445 150,403 107,220 320,298 189,744 50% 10% 20% 47% 50%NotesSource: Governments, compiled by UNHCR. * See technical notes.
PAGE 10/46
TRENDS IN ASYLUM DECISIONS IN 38 COUNTRIES, 1999-2000 UNHCR GENEVA
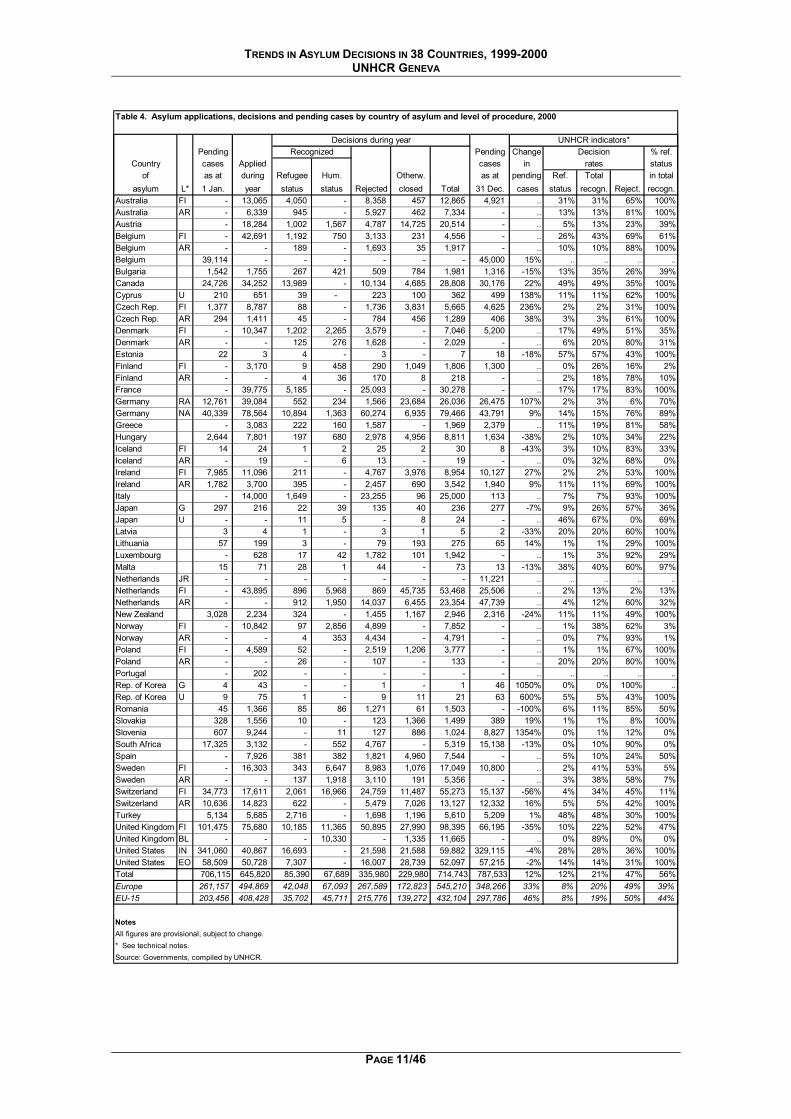
Table 4. Asylum applications, decisions and pending cases by country of asylum and level of procedure, 2000
Decisions during year UNHCR indicators*Pending Recognized Pending Change Decision % ref.
Country cases Applied cases in rates statusof as at during Refugee Hum. Otherw. as at pending Ref. Total in total
asylum L* 1 Jan. year status status Rejected closed Total 31 Dec. cases status recogn. Reject. recogn.Australia FI - 13,065 4,050 - 8,358 457 12,865 4,921 .. 31% 31% 65% 100%Australia AR - 6,339 945 - 5,927 462 7,334 - .. 13% 13% 81% 100%Austria - 18,284 1,002 1,567 4,787 14,725 20,514 - .. 5% 13% 23% 39%Belgium FI - 42,691 1,192 750 3,133 231 4,556 - .. 26% 43% 69% 61%Belgium AR - - 189 - 1,693 35 1,917 - .. 10% 10% 88% 100%Belgium 39,114 - - - - - - 45,000 15% .. .. .. ..Bulgaria 1,542 1,755 267 421 509 784 1,981 1,316 -15% 13% 35% 26% 39%Canada 24,726 34,252 13,989 - 10,134 4,685 28,808 30,176 22% 49% 49% 35% 100%Cyprus U 210 651 39 - 223 100 362 499 138% 11% 11% 62% 100%Czech Rep. FI 1,377 8,787 88 - 1,736 3,831 5,665 4,625 236% 2% 2% 31% 100%Czech Rep. AR 294 1,411 45 - 784 456 1,289 406 38% 3% 3% 61% 100%Denmark FI - 10,347 1,202 2,265 3,579 - 7,046 5,200 .. 17% 49% 51% 35%Denmark AR - - 125 276 1,628 - 2,029 - .. 6% 20% 80% 31%Estonia 22 3 4 - 3 - 7 18 -18% 57% 57% 43% 100%Finland FI - 3,170 9 458 290 1,049 1,806 1,300 .. 0% 26% 16% 2%Finland AR - - 4 36 170 8 218 - .. 2% 18% 78% 10%France - 39,775 5,185 - 25,093 - 30,278 - .. 17% 17% 83% 100%Germany RA 12,761 39,084 552 234 1,566 23,684 26,036 26,475 107% 2% 3% 6% 70%Germany NA 40,339 78,564 10,894 1,363 60,274 6,935 79,466 43,791 9% 14% 15% 76% 89%Greece - 3,083 222 160 1,587 - 1,969 2,379 .. 11% 19% 81% 58%Hungary 2,644 7,801 197 680 2,978 4,956 8,811 1,634 -38% 2% 10% 34% 22%Iceland FI 14 24 1 2 25 2 30 8 -43% 3% 10% 83% 33%Iceland AR - 19 - 6 13 - 19 - .. 0% 32% 68% 0%Ireland FI 7,985 11,096 211 - 4,767 3,976 8,954 10,127 27% 2% 2% 53% 100%Ireland AR 1,782 3,700 395 - 2,457 690 3,542 1,940 9% 11% 11% 69% 100%Italy - 14,000 1,649 - 23,255 96 25,000 113 .. 7% 7% 93% 100%Japan G 297 216 22 39 135 40 236 277 -7% 9% 26% 57% 36%Japan U - - 11 5 - 8 24 - .. 46% 67% 0% 69%Latvia 3 4 1 - 3 1 5 2 -33% 20% 20% 60% 100%Lithuania 57 199 3 - 79 193 275 65 14% 1% 1% 29% 100%Luxembourg - 628 17 42 1,782 101 1,942 - .. 1% 3% 92% 29%Malta 15 71 28 1 44 - 73 13 -13% 38% 40% 60% 97%Netherlands JR - - - - - - - 11,221 .. .. .. .. ..Netherlands FI - 43,895 896 5,968 869 45,735 53,468 25,506 .. 2% 13% 2% 13%Netherlands AR - - 912 1,950 14,037 6,455 23,354 47,739 .. 4% 12% 60% 32%New Zealand 3,028 2,234 324 - 1,455 1,167 2,946 2,316 -24% 11% 11% 49% 100%Norway FI - 10,842 97 2,856 4,899 - 7,852 - .. 1% 38% 62% 3%Norway AR - - 4 353 4,434 - 4,791 - .. 0% 7% 93% 1%Poland FI - 4,589 52 - 2,519 1,206 3,777 - .. 1% 1% 67% 100%Poland AR - - 26 - 107 - 133 - .. 20% 20% 80% 100%Portugal - 202 - - - - - - .. .. .. .. ..Rep. of Korea G 4 43 - - 1 - 1 46 1050% 0% 0% 100% ..Rep. of Korea U 9 75 1 - 9 11 21 63 600% 5% 5% 43% 100%Romania 45 1,366 85 86 1,271 61 1,503 - -100% 6% 11% 85% 50%Slovakia 328 1,556 10 - 123 1,366 1,499 389 19% 1% 1% 8% 100%Slovenia 607 9,244 - 11 127 886 1,024 8,827 1354% 0% 1% 12% 0%South Africa 17,325 3,132 - 552 4,767 - 5,319 15,138 -13% 0% 10% 90% 0%Spain - 7,926 381 382 1,821 4,960 7,544 - .. 5% 10% 24% 50%Sweden FI - 16,303 343 6,647 8,983 1,076 17,049 10,800 .. 2% 41% 53% 5%Sweden AR - - 137 1,918 3,110 191 5,356 - .. 3% 38% 58% 7%Switzerland FI 34,773 17,611 2,061 16,966 24,759 11,487 55,273 15,137 -56% 4% 34% 45% 11%Switzerland AR 10,636 14,823 622 - 5,479 7,026 13,127 12,332 16% 5% 5% 42% 100%Turkey 5,134 5,685 2,716 - 1,698 1,196 5,610 5,209 1% 48% 48% 30% 100%United Kingdom FI 101,475 75,680 10,185 11,365 50,895 27,990 98,395 66,195 -35% 10% 22% 52% 47%United Kingdom BL - - - 10,330 - 1,335 11,665 - .. 0% 89% 0% 0%United States IN 341,060 40,867 16,693 - 21,598 21,588 59,882 329,115 -4% 28% 28% 36% 100%United States EO 58,509 50,728 7,307 - 16,007 28,739 52,097 57,215 -2% 14% 14% 31% 100%Total 706,115 645,820 85,390 67,689 335,980 229,980 714,743 787,533 12% 12% 21% 47% 56%Europe 261,157 494,869 42,048 67,093 267,589 172,823 545,210 348,266 33% 8% 20% 49% 39%EU-15 203,456 408,428 35,702 45,711 215,776 139,272 432,104 297,786 46% 8% 19% 50% 44%
NotesAll figures are provisional, subject to change.* See technical notes.Source: Governments, compiled by UNHCR.
PAGE 11/46
TRENDS IN ASYLUM DECISIONS IN 38 COUNTRIES, 1999-2000 UNHCR GENEVA
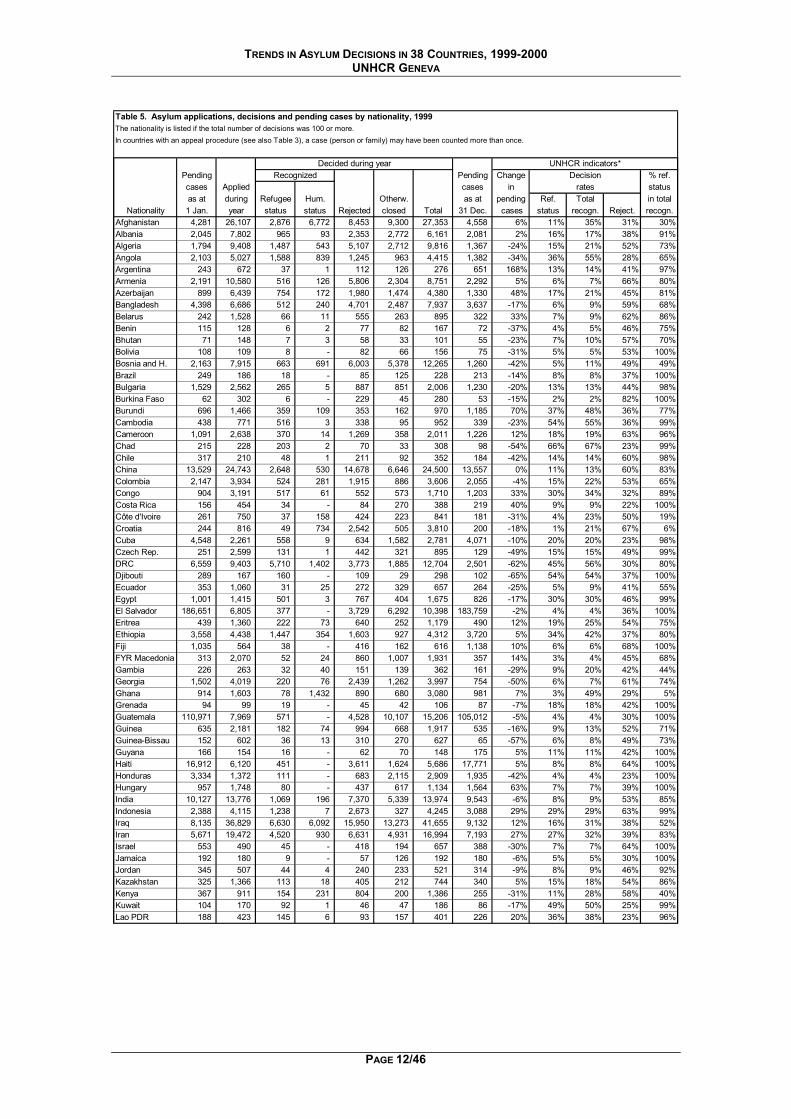
Table 5. Asylum applications, decisions and pending cases by nationality, 1999The nationality is listed if the total number of decisions was 100 or more.In countries with an appeal procedure (see also Table 3), a case (person or family) may have been counted more than once.
Decided during year UNHCR indicators*Pending Recognized Pending Change Decision % ref.cases Applied cases in rates statusas at during Refugee Hum. Otherw. as at pending Ref. Total in total
Nationality 1 Jan. year status status Rejected closed Total 31 Dec. cases status recogn. Reject. recogn.Afghanistan 4,281 26,107 2,876 6,772 8,453 9,300 27,353 4,558 6% 11% 35% 31% 30%Albania 2,045 7,802 965 93 2,353 2,772 6,161 2,081 2% 16% 17% 38% 91%Algeria 1,794 9,408 1,487 543 5,107 2,712 9,816 1,367 -24% 15% 21% 52% 73%Angola 2,103 5,027 1,588 839 1,245 963 4,415 1,382 -34% 36% 55% 28% 65%Argentina 243 672 37 1 112 126 276 651 168% 13% 14% 41% 97%Armenia 2,191 10,580 516 126 5,806 2,304 8,751 2,292 5% 6% 7% 66% 80%Azerbaijan 899 6,439 754 172 1,980 1,474 4,380 1,330 48% 17% 21% 45% 81%Bangladesh 4,398 6,686 512 240 4,701 2,487 7,937 3,637 -17% 6% 9% 59% 68%Belarus 242 1,528 66 11 555 263 895 322 33% 7% 9% 62% 86%Benin 115 128 6 2 77 82 167 72 -37% 4% 5% 46% 75%Bhutan 71 148 7 3 58 33 101 55 -23% 7% 10% 57% 70%Bolivia 108 109 8 - 82 66 156 75 -31% 5% 5% 53% 100%Bosnia and H. 2,163 7,915 663 691 6,003 5,378 12,265 1,260 -42% 5% 11% 49% 49%Brazil 249 186 18 - 85 125 228 213 -14% 8% 8% 37% 100%Bulgaria 1,529 2,562 265 5 887 851 2,006 1,230 -20% 13% 13% 44% 98%Burkina Faso 62 302 6 - 229 45 280 53 -15% 2% 2% 82% 100%Burundi 696 1,466 359 109 353 162 970 1,185 70% 37% 48% 36% 77%Cambodia 438 771 516 3 338 95 952 339 -23% 54% 55% 36% 99%Cameroon 1,091 2,638 370 14 1,269 358 2,011 1,226 12% 18% 19% 63% 96%Chad 215 228 203 2 70 33 308 98 -54% 66% 67% 23% 99%Chile 317 210 48 1 211 92 352 184 -42% 14% 14% 60% 98%China 13,529 24,743 2,648 530 14,678 6,646 24,500 13,557 0% 11% 13% 60% 83%Colombia 2,147 3,934 524 281 1,915 886 3,606 2,055 -4% 15% 22% 53% 65%Congo 904 3,191 517 61 552 573 1,710 1,203 33% 30% 34% 32% 89%Costa Rica 156 454 34 - 84 270 388 219 40% 9% 9% 22% 100%Côte d'Ivoire 261 750 37 158 424 223 841 181 -31% 4% 23% 50% 19%Croatia 244 816 49 734 2,542 505 3,810 200 -18% 1% 21% 67% 6%Cuba 4,548 2,261 558 9 634 1,582 2,781 4,071 -10% 20% 20% 23% 98%Czech Rep. 251 2,599 131 1 442 321 895 129 -49% 15% 15% 49% 99%DRC 6,559 9,403 5,710 1,402 3,773 1,885 12,704 2,501 -62% 45% 56% 30% 80%Djibouti 289 167 160 - 109 29 298 102 -65% 54% 54% 37% 100%Ecuador 353 1,060 31 25 272 329 657 264 -25% 5% 9% 41% 55%Egypt 1,001 1,415 501 3 767 404 1,675 826 -17% 30% 30% 46% 99%El Salvador 186,651 6,805 377 - 3,729 6,292 10,398 183,759 -2% 4% 4% 36% 100%Eritrea 439 1,360 222 73 640 252 1,179 490 12% 19% 25% 54% 75%Ethiopia 3,558 4,438 1,447 354 1,603 927 4,312 3,720 5% 34% 42% 37% 80%Fiji 1,035 564 38 - 416 162 616 1,138 10% 6% 6% 68% 100%FYR Macedonia 313 2,070 52 24 860 1,007 1,931 357 14% 3% 4% 45% 68%Gambia 226 263 32 40 151 139 362 161 -29% 9% 20% 42% 44%Georgia 1,502 4,019 220 76 2,439 1,262 3,997 754 -50% 6% 7% 61% 74%Ghana 914 1,603 78 1,432 890 680 3,080 981 7% 3% 49% 29% 5%Grenada 94 99 19 - 45 42 106 87 -7% 18% 18% 42% 100%Guatemala 110,971 7,969 571 - 4,528 10,107 15,206 105,012 -5% 4% 4% 30% 100%Guinea 635 2,181 182 74 994 668 1,917 535 -16% 9% 13% 52% 71%Guinea-Bissau 152 602 36 13 310 270 627 65 -57% 6% 8% 49% 73%Guyana 166 154 16 - 62 70 148 175 5% 11% 11% 42% 100%Haiti 16,912 6,120 451 - 3,611 1,624 5,686 17,771 5% 8% 8% 64% 100%Honduras 3,334 1,372 111 - 683 2,115 2,909 1,935 -42% 4% 4% 23% 100%Hungary 957 1,748 80 - 437 617 1,134 1,564 63% 7% 7% 39% 100%India 10,127 13,776 1,069 196 7,370 5,339 13,974 9,543 -6% 8% 9% 53% 85Indonesia 2,388 4,115 1,238 7 2,673 327 4,245 3,088 29% 29% 29% 63% 99%Iraq 8,135 36,829 6,630 6,092 15,950 13,273 41,655 9,132 12% 16% 31% 38% 52%Iran 5,671 19,472 4,520 930 6,631 4,931 16,994 7,193 27% 27% 32% 39% 83%Israel 553 490 45 - 418 194 657 388 -30% 7% 7% 64% 100%Jamaica 192 180 9 - 57 126 192 180 -6% 5% 5% 30% 100%Jordan 345 507 44 4 240 233 521 314 -9% 8% 9% 46% 92%Kazakhstan 325 1,366 113 18 405 212 744 340 5% 15% 18% 54% 86%Kenya 367 911 154 231 804 200 1,386 255 -31% 11% 28% 58% 40%Kuwait 104 170 92 1 46 47 186 86 -17% 49% 50% 25% 99%Lao PDR 188 423 145 6 93 157 401 226 20% 36% 38% 23% 96%
%
PAGE 12/46
TRENDS IN ASYLUM DECISIONS IN 38 COUNTRIES, 1999-2000 UNHCR GENEVA
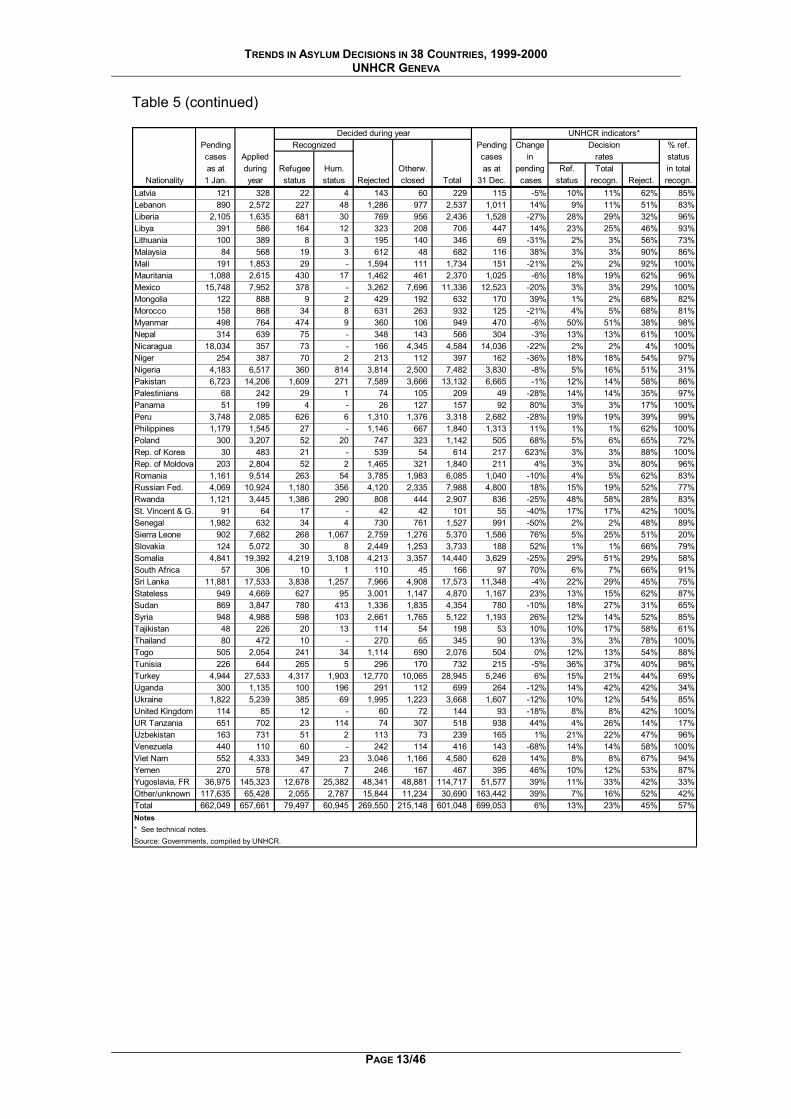
Table 5 (continued)
Decided during year UNHCR indicators*Pending Recognized Pending Change Decision % ref.cases Applied cases in rates statusas at during Refugee Hum. Otherw. as at pending Ref. Total in total
Nationality 1 Jan. year status status Rejected closed Total 31 Dec. cases status recogn. Reject. recogn. Latvia 121 328 22 4 143 60 229 115 -5% 10% 11% 62% 85%Lebanon 890 2,572 227 48 1,286 977 2,537 1,011 14% 9% 11% 51% 83%Liberia 2,105 1,635 681 30 769 956 2,436 1,528 -27% 28% 29% 32% 96%Libya 391 586 164 12 323 208 706 447 14% 23% 25% 46% 93%Lithuania 100 389 8 3 195 140 346 69 -31% 2% 3% 56% 73%Malaysia 84 568 19 3 612 48 682 116 38% 3% 3% 90% 86%Mali 191 1,853 29 - 1,594 111 1,734 151 -21% 2% 2% 92% 100%Mauritania 1,088 2,615 430 17 1,462 461 2,370 1,025 -6% 18% 19% 62% 96%Mexico 15,748 7,952 378 - 3,262 7,696 11,336 12,523 -20% 3% 3% 29% 100%Mongolia 122 888 9 2 429 192 632 170 39% 1% 2% 68% 82%Morocco 158 868 34 8 631 263 932 125 -21% 4% 5% 68% 81%Myanmar 498 764 474 9 360 106 949 470 -6% 50% 51% 38% 98%Nepal 314 639 75 - 348 143 566 304 -3% 13% 13% 61% 100%Nicaragua 18,034 357 73 - 166 4,345 4,584 14,036 -22% 2% 2% 4% 100%Niger 254 387 70 2 213 112 397 162 -36% 18% 18% 54% 97%Nigeria 4,183 6,517 360 814 3,814 2,500 7,482 3,830 -8% 5% 16% 51% 31%Pakistan 6,723 14,206 1,609 271 7,589 3,666 13,132 6,665 -1% 12% 14% 58% 86%Palestinians 68 242 29 1 74 105 209 49 -28% 14% 14% 35% 97%Panama 51 199 4 - 26 127 157 92 80% 3% 3% 17% 100%Peru 3,748 2,085 626 6 1,310 1,376 3,318 2,682 -28% 19% 19% 39% 99%Philippines 1,179 1,545 27 - 1,146 667 1,840 1,313 11% 1% 1% 62% 100%Poland 300 3,207 52 20 747 323 1,142 505 68% 5% 6% 65% 72%Rep. of Korea 30 483 21 - 539 54 614 217 623% 3% 3% 88% 100%Rep. of Moldova 203 2,804 52 2 1,465 321 1,840 211 4% 3% 3% 80% 96%Romania 1,161 9,514 263 54 3,785 1,983 6,085 1,040 -10% 4% 5% 62% 83%Russian Fed. 4,069 10,924 1,180 356 4,120 2,335 7,988 4,800 18% 15% 19% 52% 77%Rwanda 1,121 3,445 1,386 290 808 444 2,907 836 -25% 48% 58% 28% 83%St. Vincent & G. 91 64 17 - 42 42 101 55 -40% 17% 17% 42% 100%Senegal 1,982 632 34 4 730 761 1,527 991 -50% 2% 2% 48% 89%Sierra Leone 902 7,682 268 1,067 2,759 1,276 5,370 1,586 76% 5% 25% 51% 20%Slovakia 124 5,072 30 8 2,449 1,253 3,733 188 52% 1% 1% 66% 79%Somalia 4,841 19,392 4,219 3,108 4,213 3,357 14,440 3,629 -25% 29% 51% 29% 58%South Africa 57 306 10 1 110 45 166 97 70% 6% 7% 66% 91%Sri Lanka 11,881 17,533 3,838 1,257 7,966 4,908 17,573 11,348 -4% 22% 29% 45% 75%Stateless 949 4,669 627 95 3,001 1,147 4,870 1,167 23% 13% 15% 62% 87%Sudan 869 3,847 780 413 1,336 1,835 4,354 780 -10% 18% 27% 31% 65%Syria 948 4,988 598 103 2,661 1,765 5,122 1,193 26% 12% 14% 52% 85%Tajikistan 48 226 20 13 114 54 198 53 10% 10% 17% 58% 61%Thailand 80 472 10 - 270 65 345 90 13% 3% 3% 78% 100%Togo 505 2,054 241 34 1,114 690 2,076 504 0% 12% 13% 54% 88%Tunisia 226 644 265 5 296 170 732 215 -5% 36% 37% 40% 98%Turkey 4,944 27,533 4,317 1,903 12,770 10,065 28,945 5,246 6% 15% 21% 44% 69%Uganda 300 1,135 100 196 291 112 699 264 -12% 14% 42% 42% 34%Ukraine 1,822 5,239 385 69 1,995 1,223 3,668 1,607 -12% 10% 12% 54% 85%United Kingdom 114 85 12 - 60 72 144 93 -18% 8% 8% 42% 100%UR Tanzania 651 702 23 114 74 307 518 938 44% 4% 26% 14% 17%Uzbekistan 163 731 51 2 113 73 239 165 1% 21% 22% 47% 96%Venezuela 440 110 60 - 242 114 416 143 -68% 14% 14% 58% 100%Viet Nam 552 4,333 349 23 3,046 1,166 4,580 628 14% 8% 8% 67% 94%Yemen 270 578 47 7 246 167 467 395 46% 10% 12% 53% 87%Yugoslavia, FR 36,975 145,323 12,678 25,382 48,341 48,881 114,717 51,577 39% 11% 33% 42% 33%Other/unknown 117,635 65,428 2,055 2,787 15,844 11,234 30,690 163,442 39% 7% 16% 52% 42%Total 662,049 657,661 79,497 60,945 269,550 215,148 601,048 699,053 6% 13% 23% 45% 57%Notes* See technical notes.Source: Governments, compiled by UNHCR.
PAGE 13/46
TRENDS IN ASYLUM DECISIONS IN 38 COUNTRIES, 1999-2000 UNHCR GENEVA
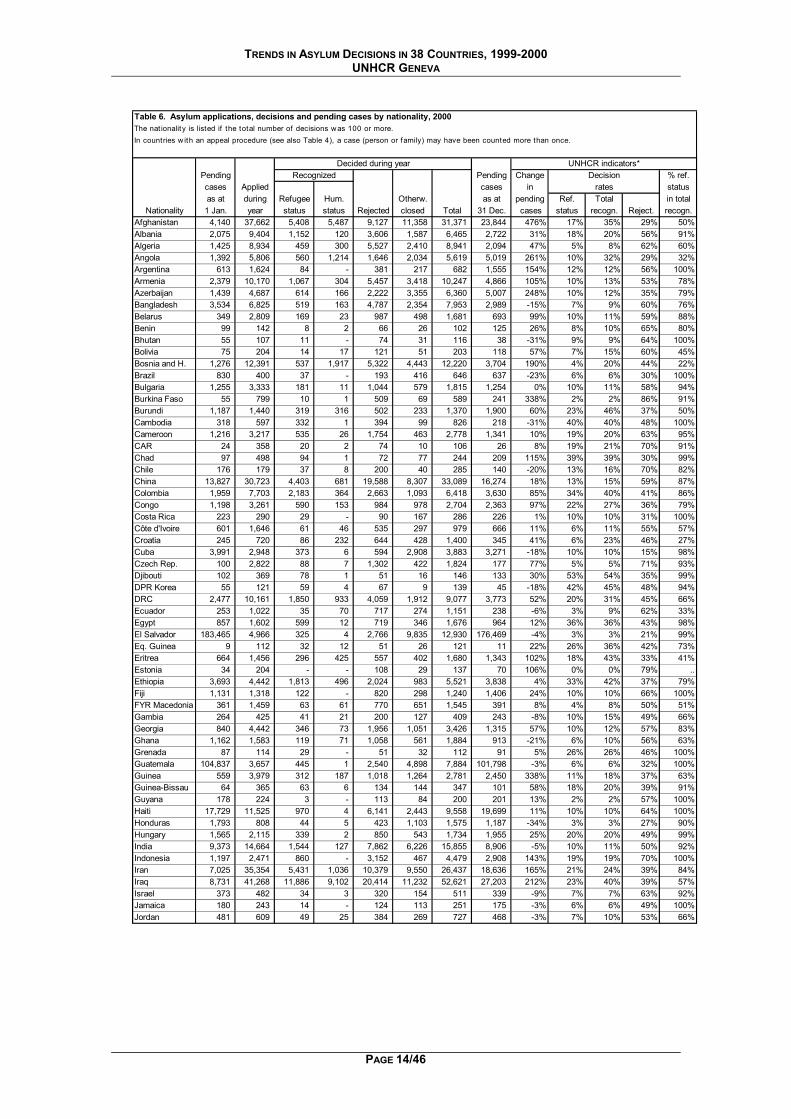
Table 6. Asylum applications, decisions and pending cases by nationality, 2000The nat ionality is listed if the total number of decisions was 100 or more.In countries w ith an appeal procedure (see also Table 4), a case (person or family) may have been counted more than once.
Decided during year UNHCR indicators*Pending Recognized Pending Change Decision % ref.cases Applied cases in rates statusas at during Refugee Hum. Otherw. as at pending Ref. Total in total
Nationality 1 Jan. year status status Rejected closed Total 31 Dec. cases status recogn. Reject. recogn.Afghanistan 4,140 37,662 5,408 5,487 9,127 11,358 31,371 23,844 476% 17% 35% 29% 50%Albania 2,075 9,404 1,152 120 3,606 1,587 6,465 2,722 31% 18% 20% 56% 91%Algeria 1,425 8,934 459 300 5,527 2,410 8,941 2,094 47% 5% 8% 62% 60%Angola 1,392 5,806 560 1,214 1,646 2,034 5,619 5,019 261% 10% 32% 29% 32%Argentina 613 1,624 84 - 381 217 682 1,555 154% 12% 12% 56% 100%Armenia 2,379 10,170 1,067 304 5,457 3,418 10,247 4,866 105% 10% 13% 53% 78%Azerbaijan 1,439 4,687 614 166 2,222 3,355 6,360 5,007 248% 10% 12% 35% 79%Bangladesh 3,534 6,825 519 163 4,787 2,354 7,953 2,989 -15% 7% 9% 60% 76%Belarus 349 2,809 169 23 987 498 1,681 693 99% 10% 11% 59% 88%Benin 99 142 8 2 66 26 102 125 26% 8% 10% 65% 80%Bhutan 55 107 11 - 74 31 116 38 -31% 9% 9% 64% 100%Bolivia 75 204 14 17 121 51 203 118 57% 7% 15% 60% 45%Bosnia and H. 1,276 12,391 537 1,917 5,322 4,443 12,220 3,704 190% 4% 20% 44% 22%Brazil 830 400 37 - 193 416 646 637 -23% 6% 6% 30% 100%Bulgaria 1,255 3,333 181 11 1,044 579 1,815 1,254 0% 10% 11% 58% 94%Burkina Faso 55 799 10 1 509 69 589 241 338% 2% 2% 86% 91%Burundi 1,187 1,440 319 316 502 233 1,370 1,900 60% 23% 46% 37% 50%Cambodia 318 597 332 1 394 99 826 218 -31% 40% 40% 48% 100%Cameroon 1,216 3,217 535 26 1,754 463 2,778 1,341 10% 19% 20% 63% 95%CAR 24 358 20 2 74 10 106 26 8% 19% 21% 70% 91%Chad 97 498 94 1 72 77 244 209 115% 39% 39% 30% 99%Chile 176 179 37 8 200 40 285 140 -20% 13% 16% 70% 82%China 13,827 30,723 4,403 681 19,588 8,307 33,089 16,274 18% 13% 15% 59% 87%Colombia 1,959 7,703 2,183 364 2,663 1,093 6,418 3,630 85% 34% 40% 41% 86%Congo 1,198 3,261 590 153 984 978 2,704 2,363 97% 22% 27% 36% 79%Costa Rica 223 290 29 - 90 167 286 226 1% 10% 10% 31% 100%Côte d'Ivoire 601 1,646 61 46 535 297 979 666 11% 6% 11% 55% 57%Croatia 245 720 86 232 644 428 1,400 345 41% 6% 23% 46% 27%Cuba 3,991 2,948 373 6 594 2,908 3,883 3,271 -18% 10% 10% 15% 98%Czech Rep. 100 2,822 88 7 1,302 422 1,824 177 77% 5% 5% 71% 93%Djibouti 102 369 78 1 51 16 146 133 30% 53% 54% 35% 99%DPR Korea 55 121 59 4 67 9 139 45 -18% 42% 45% 48% 94%DRC 2,477 10,161 1,850 933 4,059 1,912 9,077 3,773 52% 20% 31% 45% 66%Ecuador 253 1,022 35 70 717 274 1,151 238 -6% 3% 9% 62% 33%Egypt 857 1,602 599 12 719 346 1,676 964 12% 36% 36% 43% 98%El Salvador 183,465 4,966 325 4 2,766 9,835 12,930 176,469 -4% 3% 3% 21% 99Eq. Guinea 9 112 32 12 51 26 121 11 22% 26% 36% 42% 73%Eritrea 664 1,456 296 425 557 402 1,680 1,343 102% 18% 43% 33% 41%Estonia 34 204 - - 108 29 137 70 106% 0% 0% 79% ..Ethiopia 3,693 4,442 1,813 496 2,024 983 5,521 3,838 4% 33% 42% 37% 79%Fiji 1,131 1,318 122 - 820 298 1,240 1,406 24% 10% 10% 66% 100%FYR Macedonia 361 1,459 63 61 770 651 1,545 391 8% 4% 8% 50% 51%Gambia 264 425 41 21 200 127 409 243 -8% 10% 15% 49% 66%Georgia 840 4,442 346 73 1,956 1,051 3,426 1,315 57% 10% 12% 57% 83%Ghana 1,162 1,583 119 71 1,058 561 1,884 913 -21% 6% 10% 56% 63%Grenada 87 114 29 - 51 32 112 91 5% 26% 26% 46% 100%Guatemala 104,837 3,657 445 1 2,540 4,898 7,884 101,798 -3% 6% 6% 32% 100%Guinea 559 3,979 312 187 1,018 1,264 2,781 2,450 338% 11% 18% 37% 63%Guinea-Bissau 64 365 63 6 134 144 347 101 58% 18% 20% 39% 91%Guyana 178 224 3 - 113 84 200 201 13% 2% 2% 57% 100%Haiti 17,729 11,525 970 4 6,141 2,443 9,558 19,699 11% 10% 10% 64% 100%Honduras 1,793 808 44 5 423 1,103 1,575 1,187 -34% 3% 3% 27% 90%Hungary 1,565 2,115 339 2 850 543 1,734 1,955 25% 20% 20% 49% 99%India 9,373 14,664 1,544 127 7,862 6,226 15,855 8,906 -5% 10% 11% 50% 92%Indonesia 1,197 2,471 860 - 3,152 467 4,479 2,908 143% 19% 19% 70% 100%Iran 7,025 35,354 5,431 1,036 10,379 9,550 26,437 18,636 165% 21% 24% 39% 84%Iraq 8,731 41,268 11,886 9,102 20,414 11,232 52,621 27,203 212% 23% 40% 39% 57%Israel 373 482 34 3 320 154 511 339 -9% 7% 7% 63% 92%Jamaica 180 243 14 - 124 113 251 175 -3% 6% 6% 49% 100%Jordan 481 609 49 25 384 269 727 468 -3% 7% 10% 53% 66%
%
PAGE 14/46
TRENDS IN ASYLUM DECISIONS IN 38 COUNTRIES, 1999-2000 UNHCR GENEVA
Table 6 (continued)
Decided during year UNHCR indicators*Pending Recognized Pending Change Decision % ref.cases Applied cases in rates statusas at during Refugee Hum. Otherw. as at pending Ref. Total in total
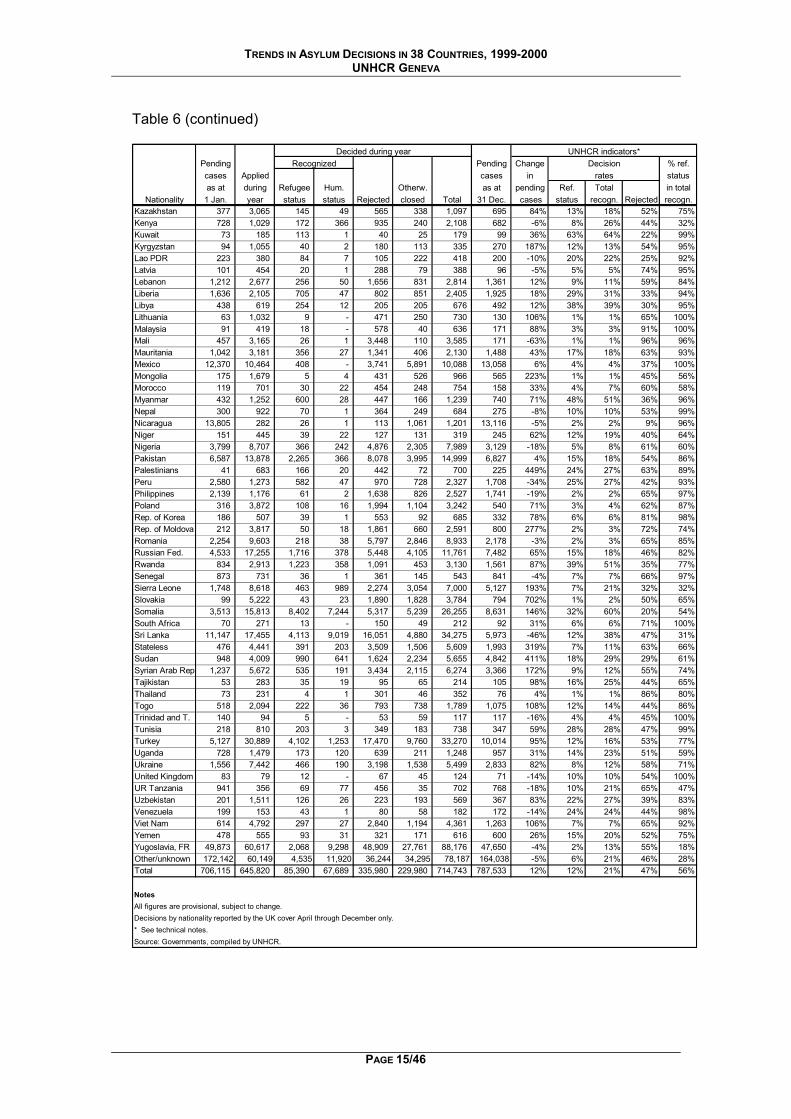
Nationality 1 Jan. year status status Rejected closed Total 31 Dec. cases status recogn. Rejected recogn. Kazakhstan 377 3,065 145 49 565 338 1,097 695 84% 13% 18% 52% 75%Kenya 728 1,029 172 366 935 240 2,108 682 -6% 8% 26% 44% 32%Kuwait 73 185 113 1 40 25 179 99 36% 63% 64% 22% 99%Kyrgyzstan 94 1,055 40 2 180 113 335 270 187% 12% 13% 54% 95%Lao PDR 223 380 84 7 105 222 418 200 -10% 20% 22% 25% 92%Latvia 101 454 20 1 288 79 388 96 -5% 5% 5% 74% 95%Lebanon 1,212 2,677 256 50 1,656 831 2,814 1,361 12% 9% 11% 59% 84%Liberia 1,636 2,105 705 47 802 851 2,405 1,925 18% 29% 31% 33% 94%Libya 438 619 254 12 205 205 676 492 12% 38% 39% 30% 95%Lithuania 63 1,032 9 - 471 250 730 130 106% 1% 1% 65% 100%Malaysia 91 419 18 - 578 40 636 171 88% 3% 3% 91% 100%Mali 457 3,165 26 1 3,448 110 3,585 171 -63% 1% 1% 96% 96%Mauritania 1,042 3,181 356 27 1,341 406 2,130 1,488 43% 17% 18% 63% 93%Mexico 12,370 10,464 408 - 3,741 5,891 10,088 13,058 6% 4% 4% 37% 100%Mongolia 175 1,679 5 4 431 526 966 565 223% 1% 1% 45% 56%Morocco 119 701 30 22 454 248 754 158 33% 4% 7% 60% 58%Myanmar 432 1,252 600 28 447 166 1,239 740 71% 48% 51% 36% 96%Nepal 300 922 70 1 364 249 684 275 -8% 10% 10% 53% 99%Nicaragua 13,805 282 26 1 113 1,061 1,201 13,116 -5% 2% 2% 9% 96Niger 151 445 39 22 127 131 319 245 62% 12% 19% 40% 64%Nigeria 3,799 8,707 366 242 4,876 2,305 7,989 3,129 -18% 5% 8% 61% 60%Pakistan 6,587 13,878 2,265 366 8,078 3,995 14,999 6,827 4% 15% 18% 54% 86%Palestinians 41 683 166 20 442 72 700 225 449% 24% 27% 63% 89%Peru 2,580 1,273 582 47 970 728 2,327 1,708 -34% 25% 27% 42% 93%Philippines 2,139 1,176 61 2 1,638 826 2,527 1,741 -19% 2% 2% 65% 97%Poland 316 3,872 108 16 1,994 1,104 3,242 540 71% 3% 4% 62% 87%Rep. of Korea 186 507 39 1 553 92 685 332 78% 6% 6% 81% 98%Rep. of Moldova 212 3,817 50 18 1,861 660 2,591 800 277% 2% 3% 72% 74%Romania 2,254 9,603 218 38 5,797 2,846 8,933 2,178 -3% 2% 3% 65% 85Russian Fed. 4,533 17,255 1,716 378 5,448 4,105 11,761 7,482 65% 15% 18% 46% 82%Rwanda 834 2,913 1,223 358 1,091 453 3,130 1,561 87% 39% 51% 35% 77%Senegal 873 731 36 1 361 145 543 841 -4% 7% 7% 66% 97%Sierra Leone 1,748 8,618 463 989 2,274 3,054 7,000 5,127 193% 7% 21% 32% 32%Slovakia 99 5,222 43 23 1,890 1,828 3,784 794 702% 1% 2% 50% 65%Somalia 3,513 15,813 8,402 7,244 5,317 5,239 26,255 8,631 146% 32% 60% 20% 54%South Africa 70 271 13 - 150 49 212 92 31% 6% 6% 71% 100%Sri Lanka 11,147 17,455 4,113 9,019 16,051 4,880 34,275 5,973 -46% 12% 38% 47% 31%Stateless 476 4,441 391 203 3,509 1,506 5,609 1,993 319% 7% 11% 63% 66%Sudan 948 4,009 990 641 1,624 2,234 5,655 4,842 411% 18% 29% 29% 61%Syrian Arab Rep 1,237 5,672 535 191 3,434 2,115 6,274 3,366 172% 9% 12% 55% 74%Tajikistan 53 283 35 19 95 65 214 105 98% 16% 25% 44% 65%Thailand 73 231 4 1 301 46 352 76 4% 1% 1% 86% 80%Togo 518 2,094 222 36 793 738 1,789 1,075 108% 12% 14% 44% 86%Trinidad and T. 140 94 5 - 53 59 117 117 -16% 4% 4% 45% 100%Tunisia 218 810 203 3 349 183 738 347 59% 28% 28% 47% 99%Turkey 5,127 30,889 4,102 1,253 17,470 9,760 33,270 10,014 95% 12% 16% 53% 77%Uganda 728 1,479 173 120 639 211 1,248 957 31% 14% 23% 51% 59%Ukraine 1,556 7,442 466 190 3,198 1,538 5,499 2,833 82% 8% 12% 58% 71%United Kingdom 83 79 12 - 67 45 124 71 -14% 10% 10% 54% 100%UR Tanzania 941 356 69 77 456 35 702 768 -18% 10% 21% 65% 47%Uzbekistan 201 1,511 126 26 223 193 569 367 83% 22% 27% 39% 83%Venezuela 199 153 43 1 80 58 182 172 -14% 24% 24% 44% 98%Viet Nam 614 4,792 297 27 2,840 1,194 4,361 1,263 106% 7% 7% 65% 92%Yemen 478 555 93 31 321 171 616 600 26% 15% 20% 52% 75%Yugoslavia, FR 49,873 60,617 2,068 9,298 48,909 27,761 88,176 47,650 -4% 2% 13% 55% 18%Other/unknown 172,142 60,149 4,535 11,920 36,244 34,295 78,187 164,038 -5% 6% 21% 46% 28%Total 706,115 645,820 85,390 67,689 335,980 229,980 714,743 787,533 12% 12% 21% 47% 56%
NotesAll figures are provisional, subject to change.Decisions by nationality reported by the UK cover April through December only.* See technical notes.Source: Governments, compiled by UNHCR.
%
%
PAGE 15/46
TRENDS IN ASYLUM DECISIONS IN 38 COUNTRIES, 1999-2000 UNHCR GENEVA
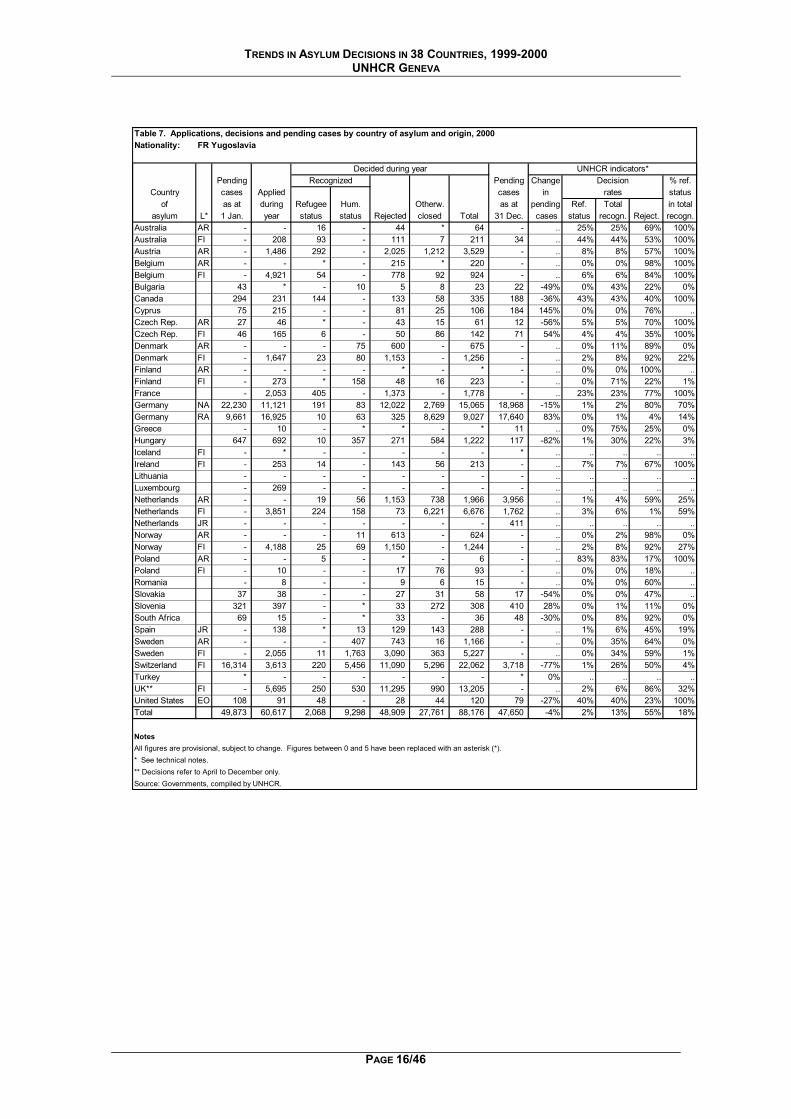
Table 7. Applications, decisions and pending cases by country of asylum and origin, 2000Nationality: FR Yugoslavia
Decided during year UNHCR indicators*Pending Recognized Pending Change Decision % ref.
Country cases Applied cases in rates statusof as at during Refugee Hum. Otherw. as at pending Ref. Total in total
asylum L* 1 Jan. year status status Rejected closed Total 31 Dec. cases status recogn. Reject. recogn.Australia AR - - 16 - 44 * 64 - .. 25% 25% 69% 100%Australia FI - 208 93 - 111 7 211 34 .. 44% 44% 53% 100%Austria AR - 1,486 292 - 2,025 1,212 3,529 - .. 8% 8% 57% 100%Belgium AR - - * - 215 * 220 - .. 0% 0% 98% 100%Belgium FI - 4,921 54 - 778 92 924 - .. 6% 6% 84% 100%Bulgaria 43 * - 10 5 8 23 22 -49% 0% 43% 22% 0%Canada 294 231 144 - 133 58 335 188 -36% 43% 43% 40% 100%Cyprus 75 215 - - 81 25 106 184 145% 0% 0% 76% ..Czech Rep. AR 27 46 * - 43 15 61 12 -56% 5% 5% 70% 100%Czech Rep. FI 46 165 6 - 50 86 142 71 54% 4% 4% 35% 100%Denmark AR - - - 75 600 - 675 - .. 0% 11% 89% 0%Denmark FI - 1,647 23 80 1,153 - 1,256 - .. 2% 8% 92% 22%Finland AR - - - - * - * - .. 0% 0% 100% ..Finland FI - 273 * 158 48 16 223 - .. 0% 71% 22% 1%France - 2,053 405 - 1,373 - 1,778 - .. 23% 23% 77% 100%Germany NA 22,230 11,121 191 83 12,022 2,769 15,065 18,968 -15% 1% 2% 80% 70%Germany RA 9,661 16,925 10 63 325 8,629 9,027 17,640 83% 0% 1% 4% 14%Greece - 10 - * * - * 11 .. 0% 75% 25% 0%Hungary 647 692 10 357 271 584 1,222 117 -82% 1% 30% 22% 3%Iceland FI - * - - - - - * .. .. .. .. ..Ireland FI - 253 14 - 143 56 213 - .. 7% 7% 67% 100%Lithuania - - - - - - - - .. .. .. .. ..Luxembourg - 269 - - - - - - .. .. .. .. ..Netherlands AR - - 19 56 1,153 738 1,966 3,956 .. 1% 4% 59% 25%Netherlands FI - 3,851 224 158 73 6,221 6,676 1,762 .. 3% 6% 1% 59%Netherlands JR - - - - - - - 411 .. .. .. .. ..Norway AR - - - 11 613 - 624 - .. 0% 2% 98% 0%Norway FI - 4,188 25 69 1,150 - 1,244 - .. 2% 8% 92% 27%Poland AR - - 5 - * - 6 - .. 83% 83% 17% 100%Poland FI - 10 - - 17 76 93 - .. 0% 0% 18% ..Romania - 8 - - 9 6 15 - .. 0% 0% 60% ..Slovakia 37 38 - - 27 31 58 17 -54% 0% 0% 47% ..Slovenia 321 397 - * 33 272 308 410 28% 0% 1% 11% 0%South Africa 69 15 - * 33 - 36 48 -30% 0% 8% 92% 0%Spain JR - 138 * 13 129 143 288 - .. 1% 6% 45% 19%Sweden AR - - - 407 743 16 1,166 - .. 0% 35% 64% 0%Sweden FI - 2,055 11 1,763 3,090 363 5,227 - .. 0% 34% 59% 1%Switzerland FI 16,314 3,613 220 5,456 11,090 5,296 22,062 3,718 -77% 1% 26% 50% 4%Turkey * - - - - - - * 0% .. .. .. ..UK** FI - 5,695 250 530 11,295 990 13,205 - .. 2% 6% 86% 32%United States EO 108 91 48 - 28 44 120 79 -27% 40% 40% 23% 100%Total 49,873 60,617 2,068 9,298 48,909 27,761 88,176 47,650 -4% 2% 13% 55% 18%
NotesAll figures are provisional, subject to change. Figures between 0 and 5 have been replaced with an asterisk (*).* See technical notes.** Decisions refer to April to December only.Source: Governments, compiled by UNHCR.
PAGE 16/46
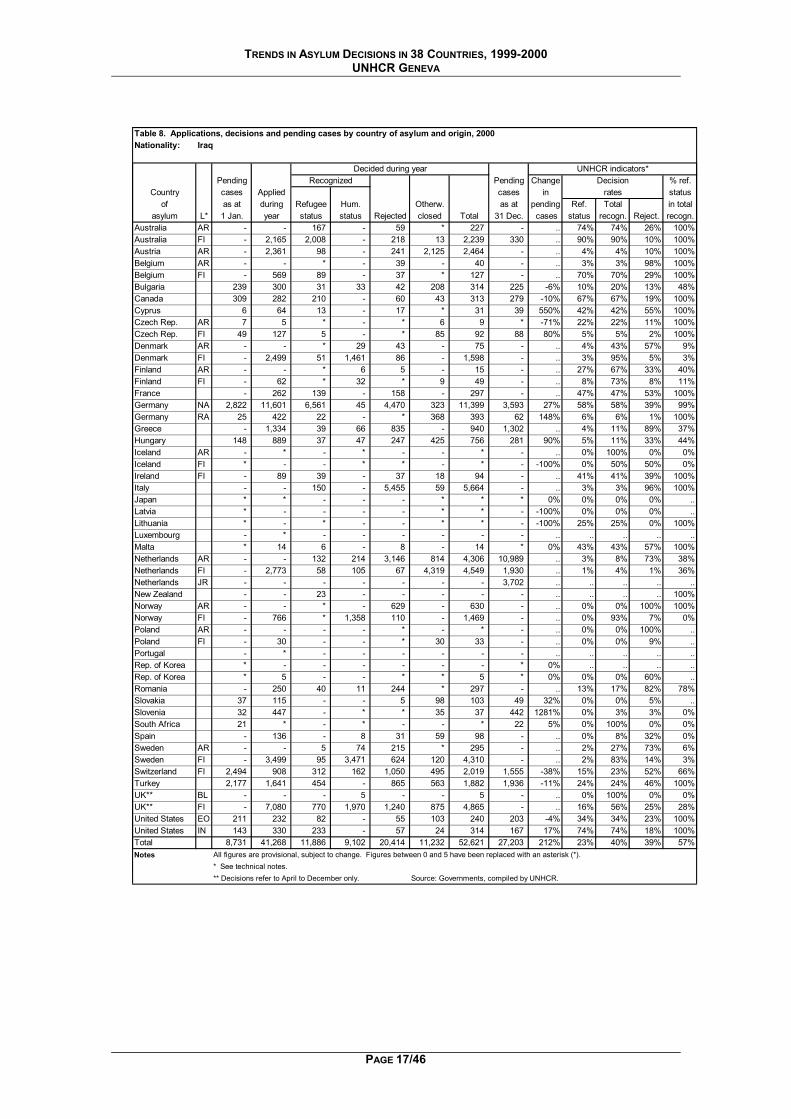
TRENDS IN ASYLUM DECISIONS IN 38 COUNTRIES, 1999-2000 UNHCR GENEVA
Table 8. Applications, decisions and pending cases by country of asylum and origin, 2000Nationality: Iraq
Decided during year UNHCR indicators*Pending Recognized Pending Change Decision % ref.
Country cases Applied cases in rates statusof as at during Refugee Hum. Otherw. as at pending Ref. Total in total
asylum L* 1 Jan. year status status Rejected closed Total 31 Dec. cases status recogn. Reject. recogn.Australia AR - - 167 - 59 * 227 - .. 74% 74% 26% 100%Australia FI - 2,165 2,008 - 218 13 2,239 330 .. 90% 90% 10% 100%Austria AR - 2,361 98 - 241 2,125 2,464 - .. 4% 4% 10% 100%Belgium AR - - * - 39 - 40 - .. 3% 3% 98% 100%Belgium FI - 569 89 - 37 * 127 - .. 70% 70% 29% 100%Bulgaria 239 300 31 33 42 208 314 225 -6% 10% 20% 13% 48%Canada 309 282 210 - 60 43 313 279 -10% 67% 67% 19% 100%Cyprus 6 64 13 - 17 * 31 39 550% 42% 42% 55% 100%Czech Rep. AR 7 5 * - * 6 9 * -71% 22% 22% 11% 100%Czech Rep. FI 49 127 5 - * 85 92 88 80% 5% 5% 2% 100%Denmark AR - - * 29 43 - 75 - .. 4% 43% 57% 9%Denmark FI - 2,499 51 1,461 86 - 1,598 - .. 3% 95% 5% 3%Finland AR - - * 6 5 - 15 - .. 27% 67% 33% 40%Finland FI - 62 * 32 * 9 49 - .. 8% 73% 8% 11%France - 262 139 - 158 - 297 - .. 47% 47% 53% 100%Germany NA 2,822 11,601 6,561 45 4,470 323 11,399 3,593 27% 58% 58% 39% 99%Germany RA 25 422 22 - * 368 393 62 148% 6% 6% 1% 100%Greece - 1,334 39 66 835 - 940 1,302 .. 4% 11% 89% 37%Hungary 148 889 37 47 247 425 756 281 90% 5% 11% 33% 44%Iceland AR - * - * - - * - .. 0% 100% 0% 0%Iceland FI * - - * * - * - -100% 0% 50% 50% 0%Ireland FI - 89 39 - 37 18 94 - .. 41% 41% 39% 100%Italy - - 150 - 5,455 59 5,664 - .. 3% 3% 96% 100%Japan * * - - - * * * 0% 0% 0% 0% ..Latvia * - - - - * * - -100% 0% 0% 0% ..Lithuania * - * - - * * - -100% 25% 25% 0% 100%Luxembourg - * - - - - - - .. .. .. .. ..Malta * 14 6 - 8 - 14 * 0% 43% 43% 57% 100%Netherlands AR - - 132 214 3,146 814 4,306 10,989 .. 3% 8% 73% 38%Netherlands FI - 2,773 58 105 67 4,319 4,549 1,930 .. 1% 4% 1% 36%Netherlands JR - - - - - - - 3,702 .. .. .. .. ..New Zealand - - 23 - - - - - .. .. .. .. 100%Norway AR - - * - 629 - 630 - .. 0% 0% 100% 100%Norway FI - 766 * 1,358 110 - 1,469 - .. 0% 93% 7% 0%Poland AR - - - - * - * - .. 0% 0% 100% ..Poland FI - 30 - - * 30 33 - .. 0% 0% 9% ..Portugal - * - - - - - - .. .. .. .. ..Rep. of Korea * - - - - - - * 0% .. .. .. ..Rep. of Korea * 5 - - * * 5 * 0% 0% 0% 60% ..Romania - 250 40 11 244 * 297 - .. 13% 17% 82% 78%Slovakia 37 115 - - 5 98 103 49 32% 0% 0% 5% ..Slovenia 32 447 - * * 35 37 442 1281% 0% 3% 3% 0%South Africa 21 * - * - - * 22 5% 0% 100% 0% 0%Spain - 136 - 8 31 59 98 - .. 0% 8% 32% 0%Sweden AR - - 5 74 215 * 295 - .. 2% 27% 73% 6%Sweden FI - 3,499 95 3,471 624 120 4,310 - .. 2% 83% 14% 3%Switzerland FI 2,494 908 312 162 1,050 495 2,019 1,555 -38% 15% 23% 52% 66%Turkey 2,177 1,641 454 - 865 563 1,882 1,936 -11% 24% 24% 46% 100%UK** BL - - - 5 - - 5 - .. 0% 100% 0% 0%UK** FI - 7,080 770 1,970 1,240 875 4,865 - .. 16% 56% 25% 28%United States EO 211 232 82 - 55 103 240 203 -4% 34% 34% 23% 100%United States IN 143 330 233 - 57 24 314 167 17% 74% 74% 18% 100%Total 8,731 41,268 11,886 9,102 20,414 11,232 52,621 27,203 212% 23% 40% 39% 57%Notes All figures are provisional, subject to change. Figures between 0 and 5 have been replaced with an asterisk (*).
* See technical notes.** Decisions refer to April to December only. Source: Governments, compiled by UNHCR.
PAGE 17/46
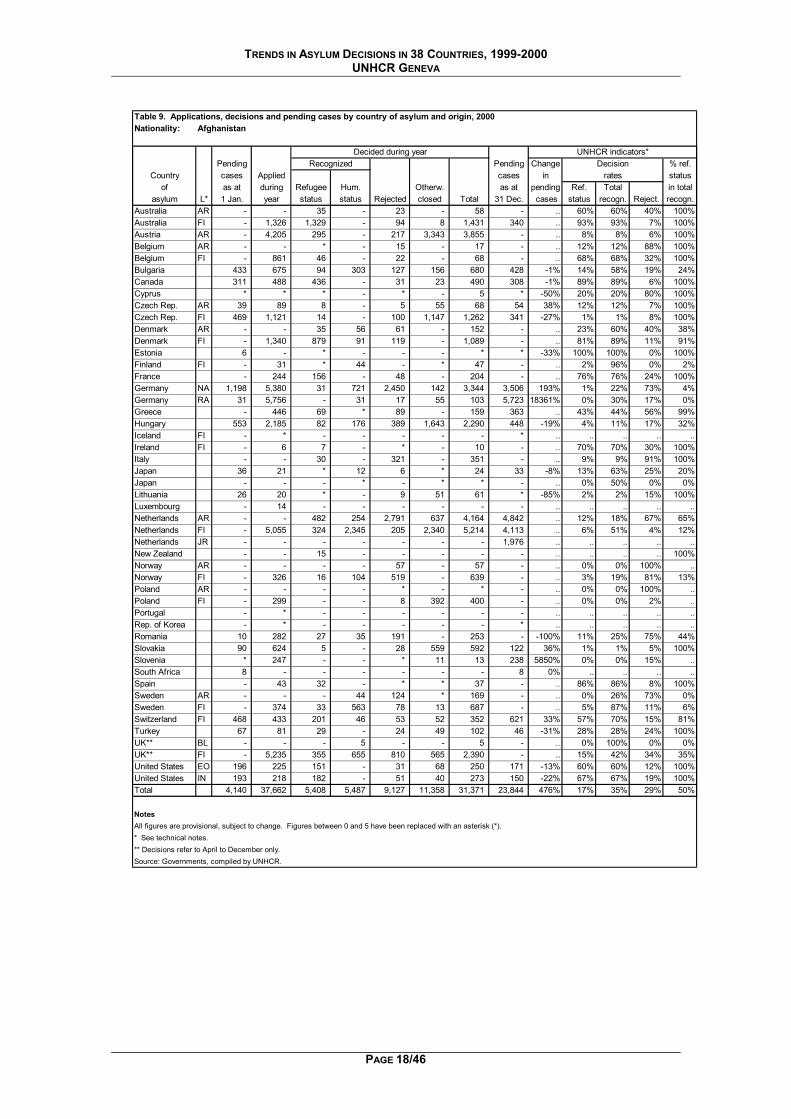
TRENDS IN ASYLUM DECISIONS IN 38 COUNTRIES, 1999-2000 UNHCR GENEVA
Table 9. Applications, decisions and pending cases by country of asylum and origin, 2000Nationality: Afghanistan
Decided during year UNHCR indicators*Pending Recognized Pending Change Decision % ref.
Country cases Applied cases in rates statusof as at during Refugee Hum. Otherw. as at pending Ref. Total in total
asylum L* 1 Jan. year status status Rejected closed Total 31 Dec. cases status recogn. Reject. recogn.Australia AR - - 35 - 23 - 58 - .. 60% 60% 40% 100%Australia FI - 1,326 1,329 - 94 8 1,431 340 .. 93% 93% 7% 100%Austria AR - 4,205 295 - 217 3,343 3,855 - .. 8% 8% 6% 100%Belgium AR - - * - 15 - 17 - .. 12% 12% 88% 100%Belgium FI - 861 46 - 22 - 68 - .. 68% 68% 32% 100%Bulgaria 433 675 94 303 127 156 680 428 -1% 14% 58% 19% 24%Canada 311 488 436 - 31 23 490 308 -1% 89% 89% 6% 100%Cyprus * * * - * - 5 * -50% 20% 20% 80% 100%Czech Rep. AR 39 89 8 - 5 55 68 54 38% 12% 12% 7% 100%Czech Rep. FI 469 1,121 14 - 100 1,147 1,262 341 -27% 1% 1% 8% 100%Denmark AR - - 35 56 61 - 152 - .. 23% 60% 40% 38%Denmark FI - 1,340 879 91 119 - 1,089 - .. 81% 89% 11% 91%Estonia 6 - * - - - * * -33% 100% 100% 0% 100%Finland FI - 31 * 44 - * 47 - .. 2% 96% 0% 2%France - 244 156 - 48 - 204 - .. 76% 76% 24% 100%Germany NA 1,198 5,380 31 721 2,450 142 3,344 3,506 193% 1% 22% 73% 4%Germany RA 31 5,756 - 31 17 55 103 5,723 18361% 0% 30% 17% 0%Greece - 446 69 * 89 - 159 363 .. 43% 44% 56% 99%Hungary 553 2,185 82 176 389 1,643 2,290 448 -19% 4% 11% 17% 32%Iceland FI - * - - - - - * .. .. .. .. ..Ireland FI - 6 7 - * - 10 - .. 70% 70% 30% 100%Italy - - 30 - 321 - 351 - .. 9% 9% 91% 100%Japan 36 21 * 12 6 * 24 33 -8% 13% 63% 25% 20%Japan - - - * - * * - .. 0% 50% 0% 0%Lithuania 26 20 * - 9 51 61 * -85% 2% 2% 15% 100%Luxembourg - 14 - - - - - - .. .. .. .. ..Netherlands AR - - 482 254 2,791 637 4,164 4,842 .. 12% 18% 67% 65%Netherlands FI - 5,055 324 2,345 205 2,340 5,214 4,113 .. 6% 51% 4% 12%Netherlands JR - - - - - - - 1,976 .. .. .. .. ..New Zealand - - 15 - - - - - .. .. .. .. 100%Norway AR - - - - 57 - 57 - .. 0% 0% 100% ..Norway FI - 326 16 104 519 - 639 - .. 3% 19% 81% 13%Poland AR - - - - * - * - .. 0% 0% 100% ..Poland FI - 299 - - 8 392 400 - .. 0% 0% 2% ..Portugal - * - - - - - - .. .. .. .. ..Rep. of Korea - * - - - - - * .. .. .. .. ..Romania 10 282 27 35 191 - 253 - -100% 11% 25% 75% 44%Slovakia 90 624 5 - 28 559 592 122 36% 1% 1% 5% 100%Slovenia * 247 - - * 11 13 238 5850% 0% 0% 15% ..South Africa 8 - - - - - - 8 0% .. .. .. ..Spain - 43 32 - * * 37 - .. 86% 86% 8% 100%Sweden AR - - - 44 124 * 169 - .. 0% 26% 73% 0%Sweden FI - 374 33 563 78 13 687 - .. 5% 87% 11% 6%Switzerland FI 468 433 201 46 53 52 352 621 33% 57% 70% 15% 81%Turkey 67 81 29 - 24 49 102 46 -31% 28% 28% 24% 100%UK** BL - - - 5 - - 5 - .. 0% 100% 0% 0%UK** FI - 5,235 355 655 810 565 2,390 - .. 15% 42% 34% 35%United States EO 196 225 151 - 31 68 250 171 -13% 60% 60% 12% 100%United States IN 193 218 182 - 51 40 273 150 -22% 67% 67% 19% 100%Total 4,140 37,662 5,408 5,487 9,127 11,358 31,371 23,844 476% 17% 35% 29% 50%
NotesAll figures are provisional, subject to change. Figures between 0 and 5 have been replaced with an asterisk (*).* See technical notes.** Decisions refer to April to December only.Source: Governments, compiled by UNHCR.
PAGE 18/46
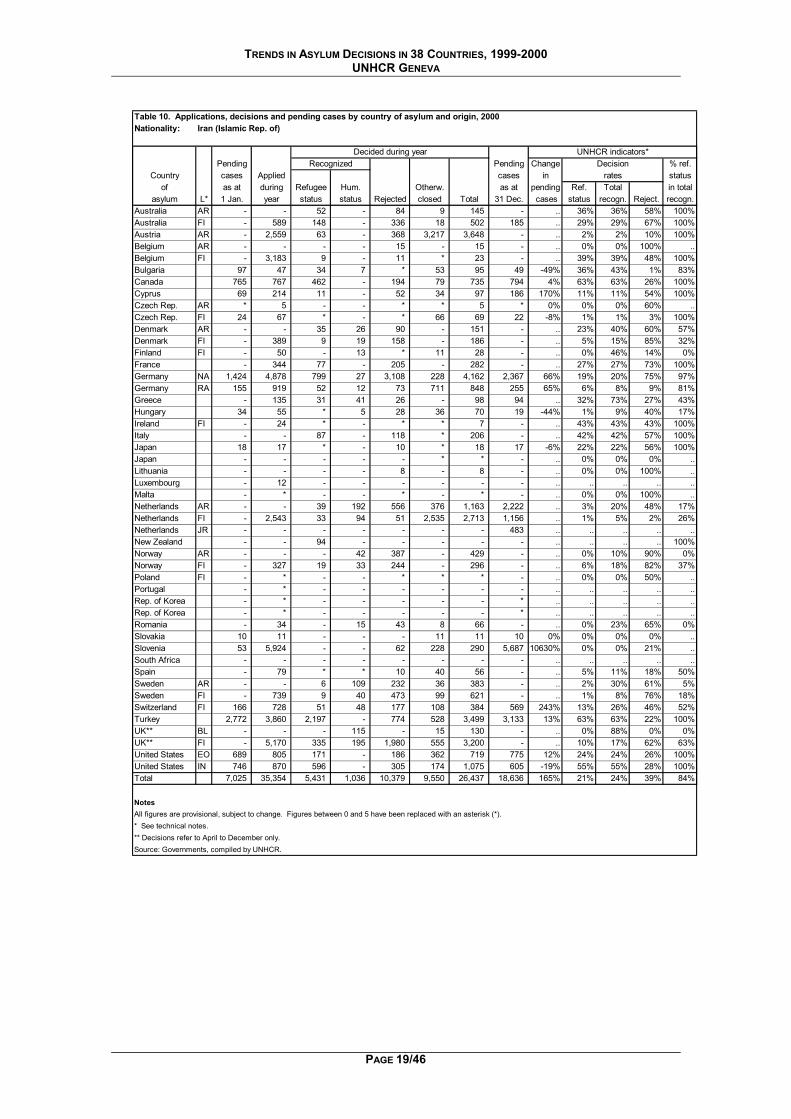
TRENDS IN ASYLUM DECISIONS IN 38 COUNTRIES, 1999-2000 UNHCR GENEVA
Table 10. Applications, decisions and pending cases by country of asylum and origin, 2000Nationality: Iran (Islamic Rep. of)
Decided during year UNHCR indicators*Pending Recognized Pending Change Decision % ref.
Country cases Applied cases in rates statusof as at during Refugee Hum. Otherw. as at pending Ref. Total in total
asylum L* 1 Jan. year status status Rejected closed Total 31 Dec. cases status recogn. Reject. recogn.Australia AR - - 52 - 84 9 145 - .. 36% 36% 58% 100%Australia FI - 589 148 - 336 18 502 185 .. 29% 29% 67% 100%Austria AR - 2,559 63 - 368 3,217 3,648 - .. 2% 2% 10% 100%Belgium AR - - - - 15 - 15 - .. 0% 0% 100% ..Belgium FI - 3,183 9 - 11 * 23 - .. 39% 39% 48% 100%Bulgaria 97 47 34 7 * 53 95 49 -49% 36% 43% 1% 83%Canada 765 767 462 - 194 79 735 794 4% 63% 63% 26% 100%Cyprus 69 214 11 - 52 34 97 186 170% 11% 11% 54% 100%Czech Rep. AR * 5 - - * * 5 * 0% 0% 0% 60% ..Czech Rep. FI 24 67 * - * 66 69 22 -8% 1% 1% 3% 100%Denmark AR - - 35 26 90 - 151 - .. 23% 40% 60% 57%Denmark FI - 389 9 19 158 - 186 - .. 5% 15% 85% 32%Finland FI - 50 - 13 * 11 28 - .. 0% 46% 14% 0%France - 344 77 - 205 - 282 - .. 27% 27% 73% 100%Germany NA 1,424 4,878 799 27 3,108 228 4,162 2,367 66% 19% 20% 75% 97%Germany RA 155 919 52 12 73 711 848 255 65% 6% 8% 9% 81%Greece - 135 31 41 26 - 98 94 .. 32% 73% 27% 43%Hungary 34 55 * 5 28 36 70 19 -44% 1% 9% 40% 17%Ireland FI - 24 * - * * 7 - .. 43% 43% 43% 100%Italy - - 87 - 118 * 206 - .. 42% 42% 57% 100%Japan 18 17 * - 10 * 18 17 -6% 22% 22% 56% 100%Japan - - - - - * * - .. 0% 0% 0% ..Lithuania - - - - 8 - 8 - .. 0% 0% 100% ..Luxembourg - 12 - - - - - - .. .. .. .. ..Malta - * - - * - * - .. 0% 0% 100% ..Netherlands AR - - 39 192 556 376 1,163 2,222 .. 3% 20% 48% 17%Netherlands FI - 2,543 33 94 51 2,535 2,713 1,156 .. 1% 5% 2% 26%Netherlands JR - - - - - - - 483 .. .. .. .. ..New Zealand - - 94 - - - - - .. .. .. .. 100%Norway AR - - - 42 387 - 429 - .. 0% 10% 90% 0%Norway FI - 327 19 33 244 - 296 - .. 6% 18% 82% 37%Poland FI - * - - * * * - .. 0% 0% 50% ..Portugal - * - - - - - - .. .. .. .. ..Rep. of Korea - * - - - - - * .. .. .. .. ..Rep. of Korea - * - - - - - * .. .. .. .. ..Romania - 34 - 15 43 8 66 - .. 0% 23% 65% 0%Slovakia 10 11 - - - 11 11 10 0% 0% 0% 0% ..Slovenia 53 5,924 - - 62 228 290 5,687 10630% 0% 0% 21% ..South Africa - - - - - - - - .. .. .. .. ..Spain - 79 * * 10 40 56 - .. 5% 11% 18% 50%Sweden AR - - 6 109 232 36 383 - .. 2% 30% 61% 5%Sweden FI - 739 9 40 473 99 621 - .. 1% 8% 76% 18%Switzerland FI 166 728 51 48 177 108 384 569 243% 13% 26% 46% 52%Turkey 2,772 3,860 2,197 - 774 528 3,499 3,133 13% 63% 63% 22% 100%UK** BL - - - 115 - 15 130 - .. 0% 88% 0% 0%UK** FI - 5,170 335 195 1,980 555 3,200 - .. 10% 17% 62% 63%United States EO 689 805 171 - 186 362 719 775 12% 24% 24% 26% 100%United States IN 746 870 596 - 305 174 1,075 605 -19% 55% 55% 28% 100%Total 7,025 35,354 5,431 1,036 10,379 9,550 26,437 18,636 165% 21% 24% 39% 84%
NotesAll figures are provisional, subject to change. Figures between 0 and 5 have been replaced with an asterisk (*).* See technical notes.** Decisions refer to April to December only.Source: Governments, compiled by UNHCR.
PAGE 19/46
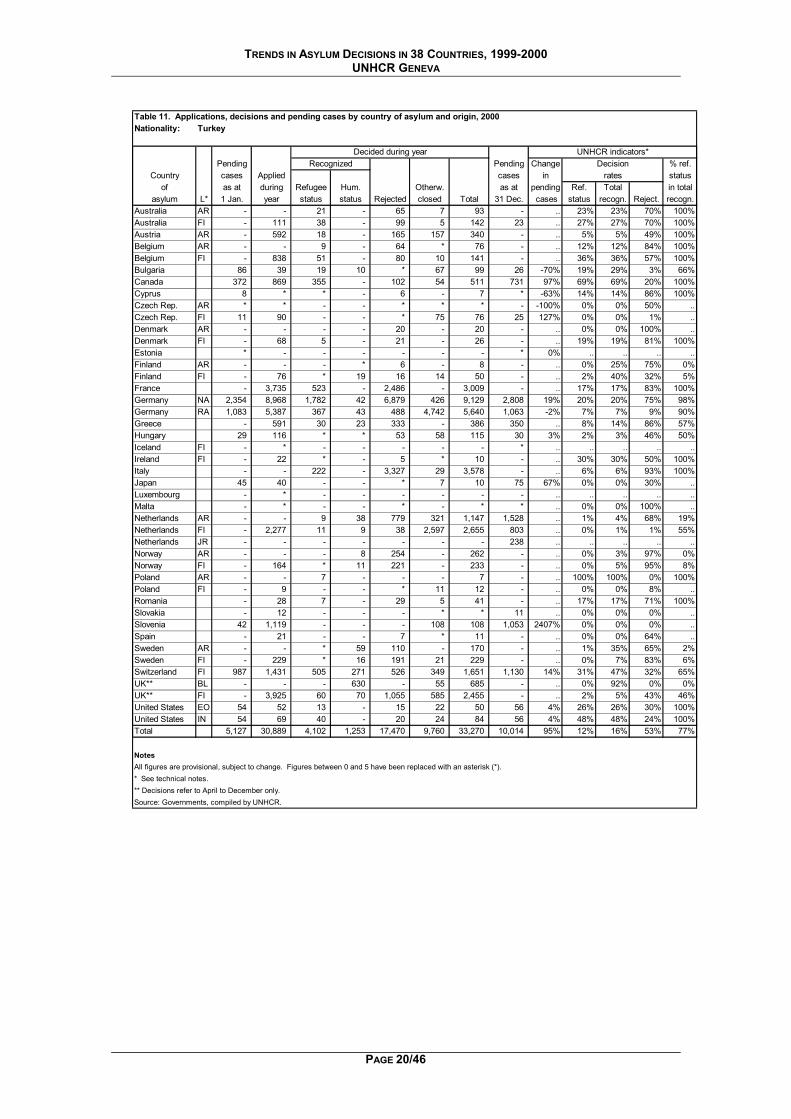
TRENDS IN ASYLUM DECISIONS IN 38 COUNTRIES, 1999-2000 UNHCR GENEVA
Table 11. Applications, decisions and pending cases by country of asylum and origin, 2000Nationality: Turkey
Decided during year UNHCR indicators*Pending Recognized Pending Change Decision % ref.
Country cases Applied cases in rates statusof as at during Refugee Hum. Otherw. as at pending Ref. Total in total
asylum L* 1 Jan. year status status Rejected closed Total 31 Dec. cases status recogn. Reject. recogn.Australia AR - - 21 - 65 7 93 - .. 23% 23% 70% 100%Australia FI - 111 38 - 99 5 142 23 .. 27% 27% 70% 100%Austria AR - 592 18 - 165 157 340 - .. 5% 5% 49% 100%Belgium AR - - 9 - 64 * 76 - .. 12% 12% 84% 100%Belgium FI - 838 51 - 80 10 141 - .. 36% 36% 57% 100%Bulgaria 86 39 19 10 * 67 99 26 -70% 19% 29% 3% 66%Canada 372 869 355 - 102 54 511 731 97% 69% 69% 20% 100%Cyprus 8 * * - 6 - 7 * -63% 14% 14% 86% 100%Czech Rep. AR * * - - * * * - -100% 0% 0% 50% ..Czech Rep. FI 11 90 - - * 75 76 25 127% 0% 0% 1% ..Denmark AR - - - - 20 - 20 - .. 0% 0% 100% ..Denmark FI - 68 5 - 21 - 26 - .. 19% 19% 81% 100%Estonia * - - - - - - * 0% .. .. .. ..Finland AR - - - * 6 - 8 - .. 0% 25% 75% 0%Finland FI - 76 * 19 16 14 50 - .. 2% 40% 32% 5%France - 3,735 523 - 2,486 - 3,009 - .. 17% 17% 83% 100%Germany NA 2,354 8,968 1,782 42 6,879 426 9,129 2,808 19% 20% 20% 75% 98%Germany RA 1,083 5,387 367 43 488 4,742 5,640 1,063 -2% 7% 7% 9% 90Greece - 591 30 23 333 - 386 350 .. 8% 14% 86% 57%Hungary 29 116 * * 53 58 115 30 3% 2% 3% 46% 50%Iceland FI - * - - - - - * .. .. .. .. ..Ireland FI - 22 * - 5 * 10 - .. 30% 30% 50% 100%Italy - - 222 - 3,327 29 3,578 - .. 6% 6% 93% 100%Japan 45 40 - - * 7 10 75 67% 0% 0% 30% ..Luxembourg - * - - - - - - .. .. .. .. ..Malta - * - - * - * * .. 0% 0% 100% ..Netherlands AR - - 9 38 779 321 1,147 1,528 .. 1% 4% 68% 19%Netherlands FI - 2,277 11 9 38 2,597 2,655 803 .. 0% 1% 1% 55%Netherlands JR - - - - - - - 238 .. .. .. .. ..Norway AR - - - 8 254 - 262 - .. 0% 3% 97% 0%Norway FI - 164 * 11 221 - 233 - .. 0% 5% 95% 8%Poland AR - - 7 - - - 7 - .. 100% 100% 0% 100%Poland FI - 9 - - * 11 12 - .. 0% 0% 8% ..Romania - 28 7 - 29 5 41 - .. 17% 17% 71% 100%Slovakia - 12 - - - * * 11 .. 0% 0% 0% ..Slovenia 42 1,119 - - - 108 108 1,053 2407% 0% 0% 0% ..Spain - 21 - - 7 * 11 - .. 0% 0% 64% ..Sweden AR - - * 59 110 - 170 - .. 1% 35% 65% 2%Sweden FI - 229 * 16 191 21 229 - .. 0% 7% 83% 6%Switzerland FI 987 1,431 505 271 526 349 1,651 1,130 14% 31% 47% 32% 65%UK** BL - - - 630 - 55 685 - .. 0% 92% 0% 0%UK** FI - 3,925 60 70 1,055 585 2,455 - .. 2% 5% 43% 46%United States EO 54 52 13 - 15 22 50 56 4% 26% 26% 30% 100%United States IN 54 69 40 - 20 24 84 56 4% 48% 48% 24% 100%Total 5,127 30,889 4,102 1,253 17,470 9,760 33,270 10,014 95% 12% 16% 53% 77%
NotesAll figures are provisional, subject to change. Figures between 0 and 5 have been replaced with an asterisk (*).* See technical notes.** Decisions refer to April to December only.Source: Governments, compiled by UNHCR.
%
PAGE 20/46
TRENDS IN ASYLUM DECISIONS IN 38 COUNTRIES, 1999-2000 UNHCR GENEVA
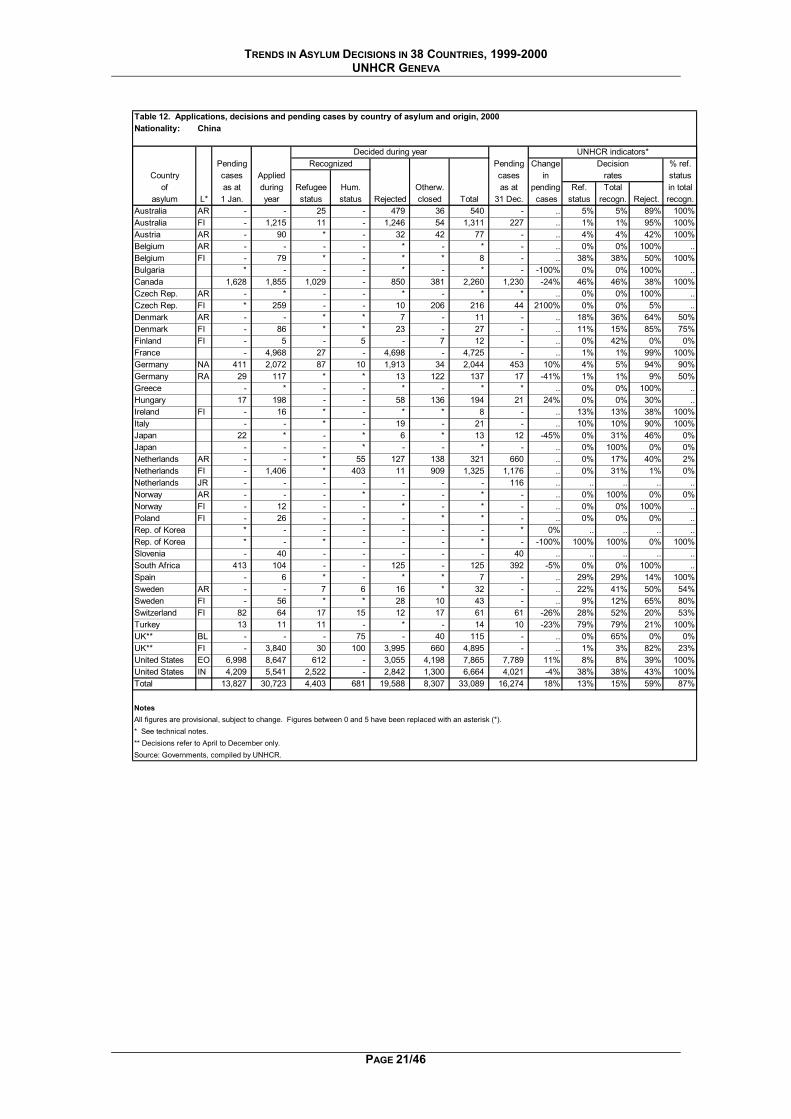
Table 12. Applications, decisions and pending cases by country of asylum and origin, 2000Nationality: China
Decided during year UNHCR indicators*Pending Recognized Pending Change Decision % ref.
Country cases Applied cases in rates statusof as at during Refugee Hum. Otherw. as at pending Ref. Total in total
asylum L* 1 Jan. year status status Rejected closed Total 31 Dec. cases status recogn. Reject. recogn.Australia AR - - 25 - 479 36 540 - .. 5% 5% 89% 100%Australia FI - 1,215 11 - 1,246 54 1,311 227 .. 1% 1% 95% 100%Austria AR - 90 * - 32 42 77 - .. 4% 4% 42% 100%Belgium AR - - - - * - * - .. 0% 0% 100% ..Belgium FI - 79 * - * * 8 - .. 38% 38% 50% 100%Bulgaria * - - - * - * - -100% 0% 0% 100% ..Canada 1,628 1,855 1,029 - 850 381 2,260 1,230 -24% 46% 46% 38% 100%Czech Rep. AR - * - - * - * * .. 0% 0% 100% ..Czech Rep. FI * 259 - - 10 206 216 44 2100% 0% 0% 5% ..Denmark AR - - * * 7 - 11 - .. 18% 36% 64% 50%Denmark FI - 86 * * 23 - 27 - .. 11% 15% 85% 75%Finland FI - 5 - 5 - 7 12 - .. 0% 42% 0% 0%France - 4,968 27 - 4,698 - 4,725 - .. 1% 1% 99% 100%Germany NA 411 2,072 87 10 1,913 34 2,044 453 10% 4% 5% 94% 90%Germany RA 29 117 * * 13 122 137 17 -41% 1% 1% 9% 50%Greece - * - - * - * * .. 0% 0% 100% ..Hungary 17 198 - - 58 136 194 21 24% 0% 0% 30% ..Ireland FI - 16 * - * * 8 - .. 13% 13% 38% 100%Italy - - * - 19 - 21 - .. 10% 10% 90% 100%Japan 22 * - * 6 * 13 12 -45% 0% 31% 46% 0%Japan - - - * - - * - .. 0% 100% 0% 0%Netherlands AR - - * 55 127 138 321 660 .. 0% 17% 40% 2%Netherlands FI - 1,406 * 403 11 909 1,325 1,176 .. 0% 31% 1% 0%Netherlands JR - - - - - - - 116 .. .. .. .. ..Norway AR - - - * - - * - .. 0% 100% 0% 0%Norway FI - 12 - - * - * - .. 0% 0% 100% ..Poland FI - 26 - - - * * - .. 0% 0% 0% ..Rep. of Korea * - - - - - - * 0% .. .. .. ..Rep. of Korea * - * - - - * - -100% 100% 100% 0% 100%Slovenia - 40 - - - - - 40 .. .. .. .. ..South Africa 413 104 - - 125 - 125 392 -5% 0% 0% 100% ..Spain - 6 * - * * 7 - .. 29% 29% 14% 100%Sweden AR - - 7 6 16 * 32 - .. 22% 41% 50% 54%Sweden FI - 56 * * 28 10 43 - .. 9% 12% 65% 80%Switzerland FI 82 64 17 15 12 17 61 61 -26% 28% 52% 20% 53%Turkey 13 11 11 - * - 14 10 -23% 79% 79% 21% 100%UK** BL - - - 75 - 40 115 - .. 0% 65% 0% 0%UK** FI - 3,840 30 100 3,995 660 4,895 - .. 1% 3% 82% 23%United States EO 6,998 8,647 612 - 3,055 4,198 7,865 7,789 11% 8% 8% 39% 100%United States IN 4,209 5,541 2,522 - 2,842 1,300 6,664 4,021 -4% 38% 38% 43% 100%Total 13,827 30,723 4,403 681 19,588 8,307 33,089 16,274 18% 13% 15% 59% 87%
NotesAll figures are provisional, subject to change. Figures between 0 and 5 have been replaced with an asterisk (*).* See technical notes.** Decisions refer to April to December only.Source: Governments, compiled by UNHCR.
PAGE 21/46
TRENDS IN ASYLUM DECISIONS IN 38 COUNTRIES, 1999-2000 UNHCR GENEVA
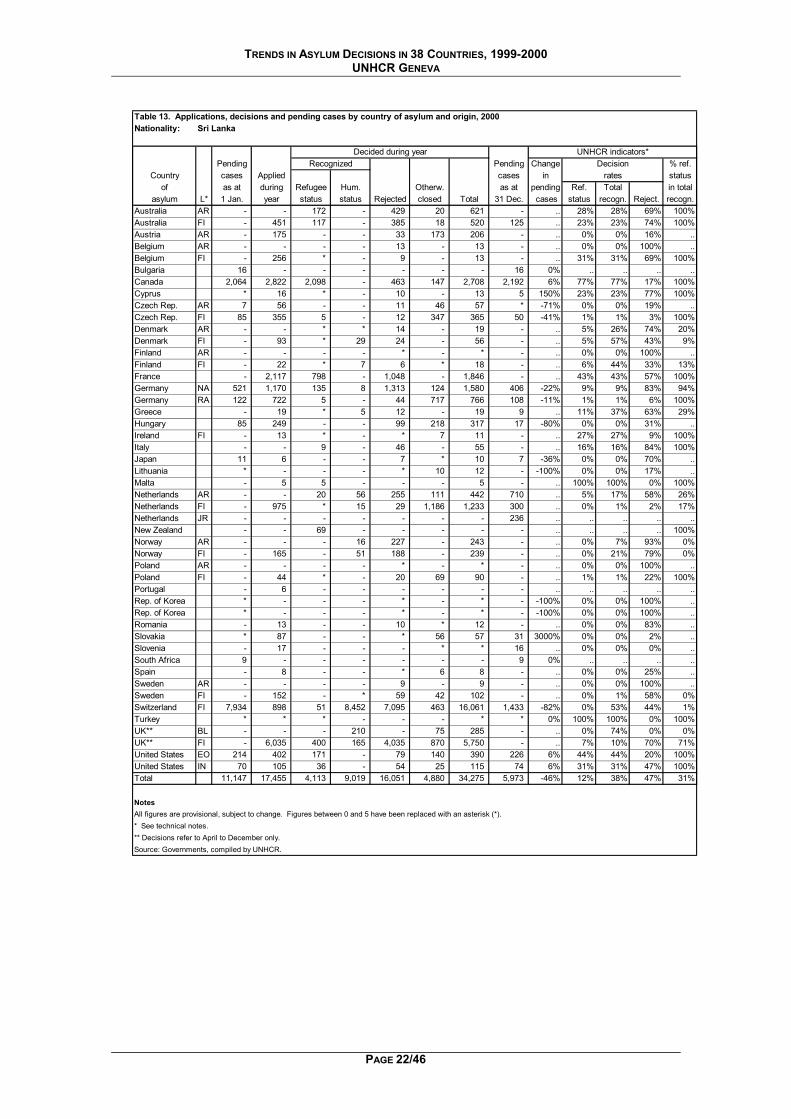
Table 13. Applications, decisions and pending cases by country of asylum and origin, 2000Nationality: Sri Lanka
Decided during year UNHCR indicators*Pending Recognized Pending Change Decision % ref.
Country cases Applied cases in rates statusof as at during Refugee Hum. Otherw. as at pending Ref. Total in total
asylum L* 1 Jan. year status status Rejected closed Total 31 Dec. cases status recogn. Reject. recogn.Australia AR - - 172 - 429 20 621 - .. 28% 28% 69% 100%Australia FI - 451 117 - 385 18 520 125 .. 23% 23% 74% 100%Austria AR - 175 - - 33 173 206 - .. 0% 0% 16% ..Belgium AR - - - - 13 - 13 - .. 0% 0% 100% ..Belgium FI - 256 * - 9 - 13 - .. 31% 31% 69% 100%Bulgaria 16 - - - - - - 16 0% .. .. .. ..Canada 2,064 2,822 2,098 - 463 147 2,708 2,192 6% 77% 77% 17% 100%Cyprus * 16 * - 10 - 13 5 150% 23% 23% 77% 100%Czech Rep. AR 7 56 - - 11 46 57 * -71% 0% 0% 19% ..Czech Rep. FI 85 355 5 - 12 347 365 50 -41% 1% 1% 3% 100%Denmark AR - - * * 14 - 19 - .. 5% 26% 74% 20%Denmark FI - 93 * 29 24 - 56 - .. 5% 57% 43% 9%Finland AR - - - - * - * - .. 0% 0% 100% ..Finland FI - 22 * 7 6 * 18 - .. 6% 44% 33% 13%France - 2,117 798 - 1,048 - 1,846 - .. 43% 43% 57% 100%Germany NA 521 1,170 135 8 1,313 124 1,580 406 -22% 9% 9% 83% 94%Germany RA 122 722 5 - 44 717 766 108 -11% 1% 1% 6% 100%Greece - 19 * 5 12 - 19 9 .. 11% 37% 63% 29%Hungary 85 249 - - 99 218 317 17 -80% 0% 0% 31% ..Ireland FI - 13 * - * 7 11 - .. 27% 27% 9% 100%Italy - - 9 - 46 - 55 - .. 16% 16% 84% 100%Japan 11 6 - - 7 * 10 7 -36% 0% 0% 70% ..Lithuania * - - - * 10 12 - -100% 0% 0% 17% ..Malta - 5 5 - - - 5 - .. 100% 100% 0% 100%Netherlands AR - - 20 56 255 111 442 710 .. 5% 17% 58% 26%Netherlands FI - 975 * 15 29 1,186 1,233 300 .. 0% 1% 2% 17%Netherlands JR - - - - - - - 236 .. .. .. .. ..New Zealand - - 69 - - - - - .. .. .. .. 100%Norway AR - - - 16 227 - 243 - .. 0% 7% 93% 0%Norway FI - 165 - 51 188 - 239 - .. 0% 21% 79% 0%Poland AR - - - - * - * - .. 0% 0% 100% ..Poland FI - 44 * - 20 69 90 - .. 1% 1% 22% 100%Portugal - 6 - - - - - - .. .. .. .. ..Rep. of Korea * - - - * - * - -100% 0% 0% 100% ..Rep. of Korea * - - - * - * - -100% 0% 0% 100% ..Romania - 13 - - 10 * 12 - .. 0% 0% 83% ..Slovakia * 87 - - * 56 57 31 3000% 0% 0% 2% ..Slovenia - 17 - - - * * 16 .. 0% 0% 0% ..South Africa 9 - - - - - - 9 0% .. .. .. ..Spain - 8 - - * 6 8 - .. 0% 0% 25% ..Sweden AR - - - - 9 - 9 - .. 0% 0% 100% ..Sweden FI - 152 - * 59 42 102 - .. 0% 1% 58% 0%Switzerland FI 7,934 898 51 8,452 7,095 463 16,061 1,433 -82% 0% 53% 44% 1%Turkey * * * - - - * * 0% 100% 100% 0% 100%UK** BL - - - 210 - 75 285 - .. 0% 74% 0% 0%UK** FI - 6,035 400 165 4,035 870 5,750 - .. 7% 10% 70% 71%United States EO 214 402 171 - 79 140 390 226 6% 44% 44% 20% 100%United States IN 70 105 36 - 54 25 115 74 6% 31% 31% 47% 100%Total 11,147 17,455 4,113 9,019 16,051 4,880 34,275 5,973 -46% 12% 38% 47% 31%
NotesAll figures are provisional, subject to change. Figures between 0 and 5 have been replaced with an asterisk (*).* See technical notes.** Decisions refer to April to December only.Source: Governments, compiled by UNHCR.
PAGE 22/46
TRENDS IN ASYLUM DECISIONS IN 38 COUNTRIES, 1999-2000 UNHCR GENEVA
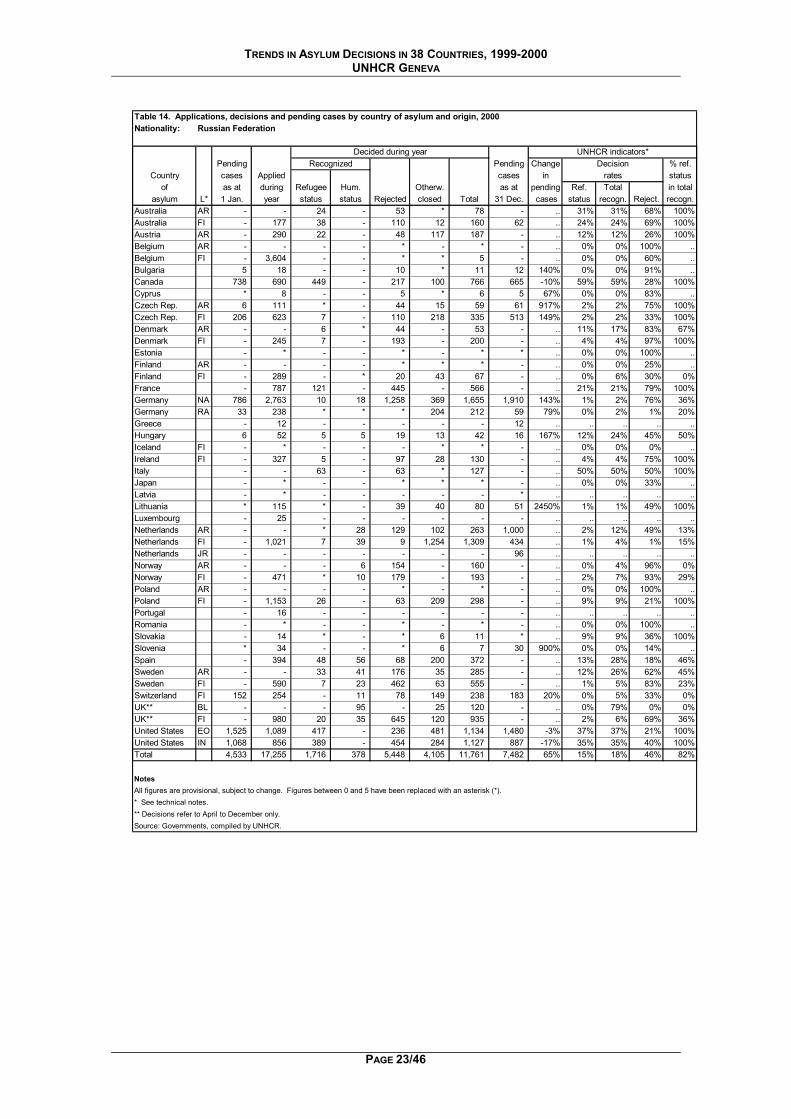
Table 14. Applications, decisions and pending cases by country of asylum and origin, 2000Nationality: Russian Federation
Decided during year UNHCR indicators*Pending Recognized Pending Change Decision % ref.
Country cases Applied cases in rates statusof as at during Refugee Hum. Otherw. as at pending Ref. Total in total
asylum L* 1 Jan. year status status Rejected closed Total 31 Dec. cases status recogn. Reject. recogn.Australia AR - - 24 - 53 * 78 - .. 31% 31% 68% 100%Australia FI - 177 38 - 110 12 160 62 .. 24% 24% 69% 100%Austria AR - 290 22 - 48 117 187 - .. 12% 12% 26% 100%Belgium AR - - - - * - * - .. 0% 0% 100% ..Belgium FI - 3,604 - - * * 5 - .. 0% 0% 60% ..Bulgaria 5 18 - - 10 * 11 12 140% 0% 0% 91% ..Canada 738 690 449 - 217 100 766 665 -10% 59% 59% 28% 100%Cyprus * 8 - - 5 * 6 5 67% 0% 0% 83% ..Czech Rep. AR 6 111 * - 44 15 59 61 917% 2% 2% 75% 100%Czech Rep. FI 206 623 7 - 110 218 335 513 149% 2% 2% 33% 100%Denmark AR - - 6 * 44 - 53 - .. 11% 17% 83% 67%Denmark FI - 245 7 - 193 - 200 - .. 4% 4% 97% 100%Estonia - * - - * - * * .. 0% 0% 100% ..Finland AR - - - - * * * - .. 0% 0% 25% ..Finland FI - 289 - * 20 43 67 - .. 0% 6% 30% 0%France - 787 121 - 445 - 566 - .. 21% 21% 79% 100%Germany NA 786 2,763 10 18 1,258 369 1,655 1,910 143% 1% 2% 76% 36%Germany RA 33 238 * * * 204 212 59 79% 0% 2% 1% 20%Greece - 12 - - - - - 12 .. .. .. .. ..Hungary 6 52 5 5 19 13 42 16 167% 12% 24% 45% 50%Iceland FI - * - - - * * - .. 0% 0% 0% ..Ireland FI - 327 5 - 97 28 130 - .. 4% 4% 75% 100%Italy - - 63 - 63 * 127 - .. 50% 50% 50% 100%Japan - * - - * * * - .. 0% 0% 33% ..Latvia - * - - - - - * .. .. .. .. ..Lithuania * 115 * - 39 40 80 51 2450% 1% 1% 49% 100%Luxembourg - 25 - - - - - - .. .. .. .. ..Netherlands AR - - * 28 129 102 263 1,000 .. 2% 12% 49% 13%Netherlands FI - 1,021 7 39 9 1,254 1,309 434 .. 1% 4% 1% 15%Netherlands JR - - - - - - - 96 .. .. .. .. ..Norway AR - - - 6 154 - 160 - .. 0% 4% 96% 0%Norway FI - 471 * 10 179 - 193 - .. 2% 7% 93% 29%Poland AR - - - - * - * - .. 0% 0% 100% ..Poland FI - 1,153 26 - 63 209 298 - .. 9% 9% 21% 100%Portugal - 16 - - - - - - .. .. .. .. ..Romania - * - - * - * - .. 0% 0% 100% ..Slovakia - 14 * - * 6 11 * .. 9% 9% 36% 100%Slovenia * 34 - - * 6 7 30 900% 0% 0% 14% ..Spain - 394 48 56 68 200 372 - .. 13% 28% 18% 46%Sweden AR - - 33 41 176 35 285 - .. 12% 26% 62% 45%Sweden FI - 590 7 23 462 63 555 - .. 1% 5% 83% 23%Switzerland FI 152 254 - 11 78 149 238 183 20% 0% 5% 33% 0%UK** BL - - - 95 - 25 120 - .. 0% 79% 0% 0%UK** FI - 980 20 35 645 120 935 - .. 2% 6% 69% 36%United States EO 1,525 1,089 417 - 236 481 1,134 1,480 -3% 37% 37% 21% 100%United States IN 1,068 856 389 - 454 284 1,127 887 -17% 35% 35% 40% 100%Total 4,533 17,255 1,716 378 5,448 4,105 11,761 7,482 65% 15% 18% 46% 82%
NotesAll figures are provisional, subject to change. Figures between 0 and 5 have been replaced with an asterisk (*).* See technical notes.** Decisions refer to April to December only.Source: Governments, compiled by UNHCR.
PAGE 23/46
TRENDS IN ASYLUM DECISIONS IN 38 COUNTRIES, 1999-2000 UNHCR GENEVA
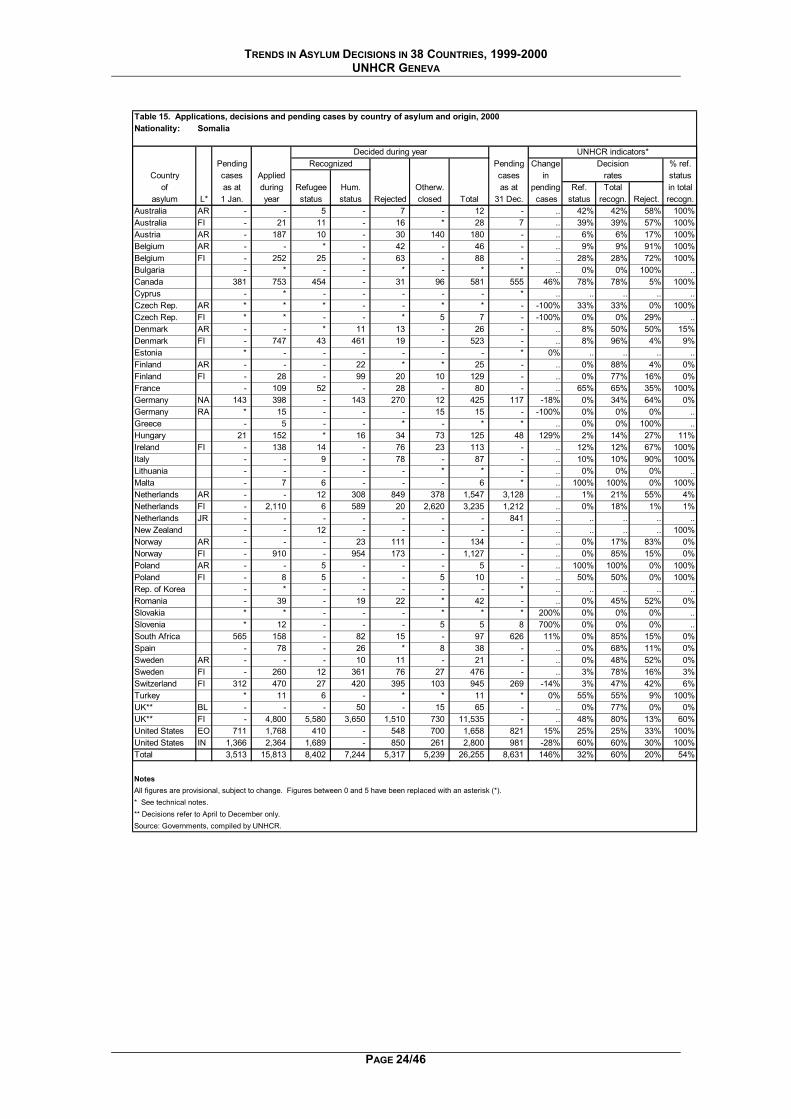
Table 15. Applications, decisions and pending cases by country of asylum and origin, 2000Nationality: Somalia
Decided during year UNHCR indicators*Pending Recognized Pending Change Decision % ref.
Country cases Applied cases in rates statusof as at during Refugee Hum. Otherw. as at pending Ref. Total in total
asylum L* 1 Jan. year status status Rejected closed Total 31 Dec. cases status recogn. Reject. recogn.Australia AR - - 5 - 7 - 12 - .. 42% 42% 58% 100%Australia FI - 21 11 - 16 * 28 7 .. 39% 39% 57% 100%Austria AR - 187 10 - 30 140 180 - .. 6% 6% 17% 100%Belgium AR - - * - 42 - 46 - .. 9% 9% 91% 100%Belgium FI - 252 25 - 63 - 88 - .. 28% 28% 72% 100%Bulgaria - * - - * - * * .. 0% 0% 100% ..Canada 381 753 454 - 31 96 581 555 46% 78% 78% 5% 100%Cyprus - * - - - - - * .. .. .. .. ..Czech Rep. AR * * * - - * * - -100% 33% 33% 0% 100%Czech Rep. FI * * - - * 5 7 - -100% 0% 0% 29% ..Denmark AR - - * 11 13 - 26 - .. 8% 50% 50% 15%Denmark FI - 747 43 461 19 - 523 - .. 8% 96% 4% 9%Estonia * - - - - - - * 0% .. .. .. ..Finland AR - - - 22 * * 25 - .. 0% 88% 4% 0%Finland FI - 28 - 99 20 10 129 - .. 0% 77% 16% 0%France - 109 52 - 28 - 80 - .. 65% 65% 35% 100%Germany NA 143 398 - 143 270 12 425 117 -18% 0% 34% 64% 0%Germany RA * 15 - - - 15 15 - -100% 0% 0% 0% ..Greece - 5 - - * - * * .. 0% 0% 100% ..Hungary 21 152 * 16 34 73 125 48 129% 2% 14% 27% 11%Ireland FI - 138 14 - 76 23 113 - .. 12% 12% 67% 100%Italy - - 9 - 78 - 87 - .. 10% 10% 90% 100%Lithuania - - - - - * * - .. 0% 0% 0% ..Malta - 7 6 - - - 6 * .. 100% 100% 0% 100%Netherlands AR - - 12 308 849 378 1,547 3,128 .. 1% 21% 55% 4%Netherlands FI - 2,110 6 589 20 2,620 3,235 1,212 .. 0% 18% 1% 1%Netherlands JR - - - - - - - 841 .. .. .. .. ..New Zealand - - 12 - - - - - .. .. .. .. 100%Norway AR - - - 23 111 - 134 - .. 0% 17% 83% 0%Norway FI - 910 - 954 173 - 1,127 - .. 0% 85% 15% 0%Poland AR - - 5 - - - 5 - .. 100% 100% 0% 100%Poland FI - 8 5 - - 5 10 - .. 50% 50% 0% 100%Rep. of Korea - * - - - - - * .. .. .. .. ..Romania - 39 - 19 22 * 42 - .. 0% 45% 52% 0%Slovakia * * - - - * * * 200% 0% 0% 0% ..Slovenia * 12 - - - 5 5 8 700% 0% 0% 0% ..South Africa 565 158 - 82 15 - 97 626 11% 0% 85% 15% 0%Spain - 78 - 26 * 8 38 - .. 0% 68% 11% 0%Sweden AR - - - 10 11 - 21 - .. 0% 48% 52% 0%Sweden FI - 260 12 361 76 27 476 - .. 3% 78% 16% 3%Switzerland FI 312 470 27 420 395 103 945 269 -14% 3% 47% 42% 6%Turkey * 11 6 - * * 11 * 0% 55% 55% 9% 100%UK** BL - - - 50 - 15 65 - .. 0% 77% 0% 0%UK** FI - 4,800 5,580 3,650 1,510 730 11,535 - .. 48% 80% 13% 60%United States EO 711 1,768 410 - 548 700 1,658 821 15% 25% 25% 33% 100%United States IN 1,366 2,364 1,689 - 850 261 2,800 981 -28% 60% 60% 30% 100%Total 3,513 15,813 8,402 7,244 5,317 5,239 26,255 8,631 146% 32% 60% 20% 54%
NotesAll figures are provisional, subject to change. Figures between 0 and 5 have been replaced with an asterisk (*).* See technical notes.** Decisions refer to April to December only.Source: Governments, compiled by UNHCR.
PAGE 24/46
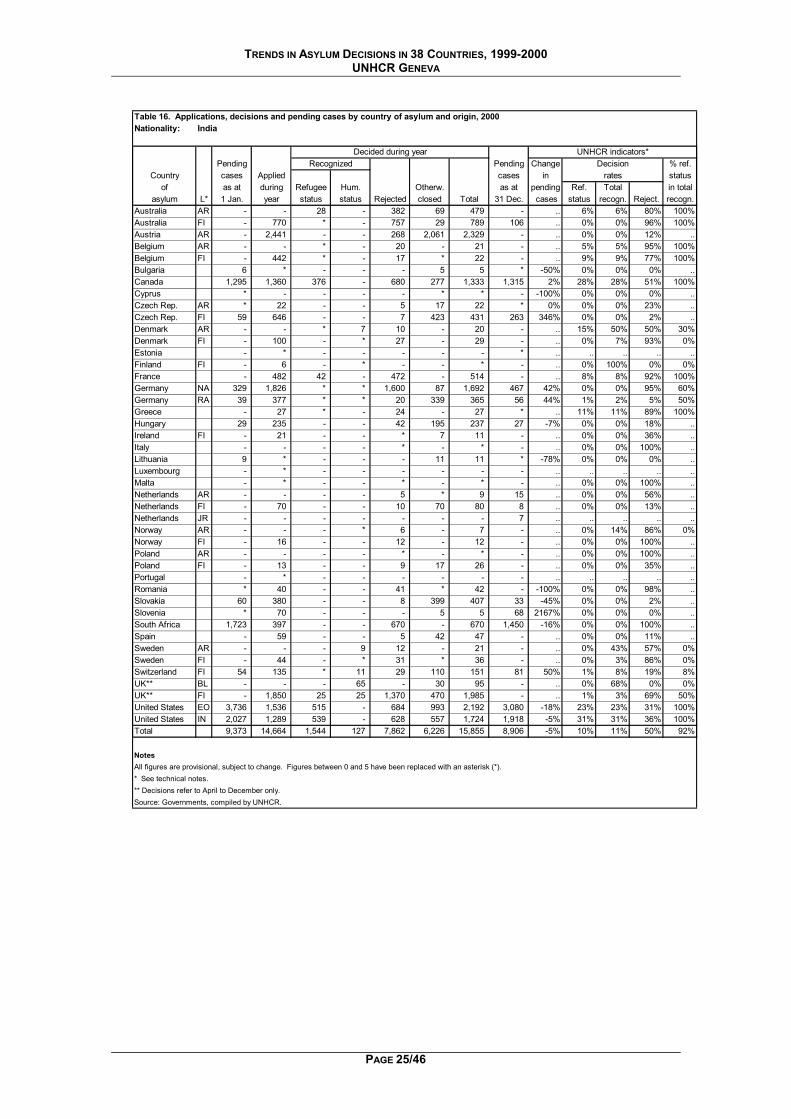
TRENDS IN ASYLUM DECISIONS IN 38 COUNTRIES, 1999-2000 UNHCR GENEVA
Table 16. Applications, decisions and pending cases by country of asylum and origin, 2000Nationality: India
Decided during year UNHCR indicators*Pending Recognized Pending Change Decision % ref.
Country cases Applied cases in rates statusof as at during Refugee Hum. Otherw. as at pending Ref. Total in total
asylum L* 1 Jan. year status status Rejected closed Total 31 Dec. cases status recogn. Reject. recogn.Australia AR - - 28 - 382 69 479 - .. 6% 6% 80% 100%Australia FI - 770 * - 757 29 789 106 .. 0% 0% 96% 100%Austria AR - 2,441 - - 268 2,061 2,329 - .. 0% 0% 12% ..Belgium AR - - * - 20 - 21 - .. 5% 5% 95% 100%Belgium FI - 442 * - 17 * 22 - .. 9% 9% 77% 100%Bulgaria 6 * - - - 5 5 * -50% 0% 0% 0% ..Canada 1,295 1,360 376 - 680 277 1,333 1,315 2% 28% 28% 51% 100%Cyprus * - - - - * * - -100% 0% 0% 0% ..Czech Rep. AR * 22 - - 5 17 22 * 0% 0% 0% 23% ..Czech Rep. FI 59 646 - - 7 423 431 263 346% 0% 0% 2% ..Denmark AR - - * 7 10 - 20 - .. 15% 50% 50% 30%Denmark FI - 100 - * 27 - 29 - .. 0% 7% 93% 0%Estonia - * - - - - - * .. .. .. .. ..Finland FI - 6 - * - - * - .. 0% 100% 0% 0%France - 482 42 - 472 - 514 - .. 8% 8% 92% 100%Germany NA 329 1,826 * * 1,600 87 1,692 467 42% 0% 0% 95% 60%Germany RA 39 377 * * 20 339 365 56 44% 1% 2% 5% 50%Greece - 27 * - 24 - 27 * .. 11% 11% 89% 100%Hungary 29 235 - - 42 195 237 27 -7% 0% 0% 18% ..Ireland FI - 21 - - * 7 11 - .. 0% 0% 36% ..Italy - - - - * - * - .. 0% 0% 100% ..Lithuania 9 * - - - 11 11 * -78% 0% 0% 0% ..Luxembourg - * - - - - - - .. .. .. .. ..Malta - * - - * - * - .. 0% 0% 100% ..Netherlands AR - - - - 5 * 9 15 .. 0% 0% 56% ..Netherlands FI - 70 - - 10 70 80 8 .. 0% 0% 13% ..Netherlands JR - - - - - - - 7 .. .. .. .. ..Norway AR - - - * 6 - 7 - .. 0% 14% 86% 0%Norway FI - 16 - - 12 - 12 - .. 0% 0% 100% ..Poland AR - - - - * - * - .. 0% 0% 100% ..Poland FI - 13 - - 9 17 26 - .. 0% 0% 35% ..Portugal - * - - - - - - .. .. .. .. ..Romania * 40 - - 41 * 42 - -100% 0% 0% 98% ..Slovakia 60 380 - - 8 399 407 33 -45% 0% 0% 2% ..Slovenia * 70 - - - 5 5 68 2167% 0% 0% 0% ..South Africa 1,723 397 - - 670 - 670 1,450 -16% 0% 0% 100% ..Spain - 59 - - 5 42 47 - .. 0% 0% 11% ..Sweden AR - - - 9 12 - 21 - .. 0% 43% 57% 0%Sweden FI - 44 - * 31 * 36 - .. 0% 3% 86% 0%Switzerland FI 54 135 * 11 29 110 151 81 50% 1% 8% 19% 8%UK** BL - - - 65 - 30 95 - .. 0% 68% 0% 0%UK** FI - 1,850 25 25 1,370 470 1,985 - .. 1% 3% 69% 50%United States EO 3,736 1,536 515 - 684 993 2,192 3,080 -18% 23% 23% 31% 100%United States IN 2,027 1,289 539 - 628 557 1,724 1,918 -5% 31% 31% 36% 100%Total 9,373 14,664 1,544 127 7,862 6,226 15,855 8,906 -5% 10% 11% 50% 92%
NotesAll figures are provisional, subject to change. Figures between 0 and 5 have been replaced with an asterisk (*).* See technical notes.** Decisions refer to April to December only.Source: Governments, compiled by UNHCR.
PAGE 25/46
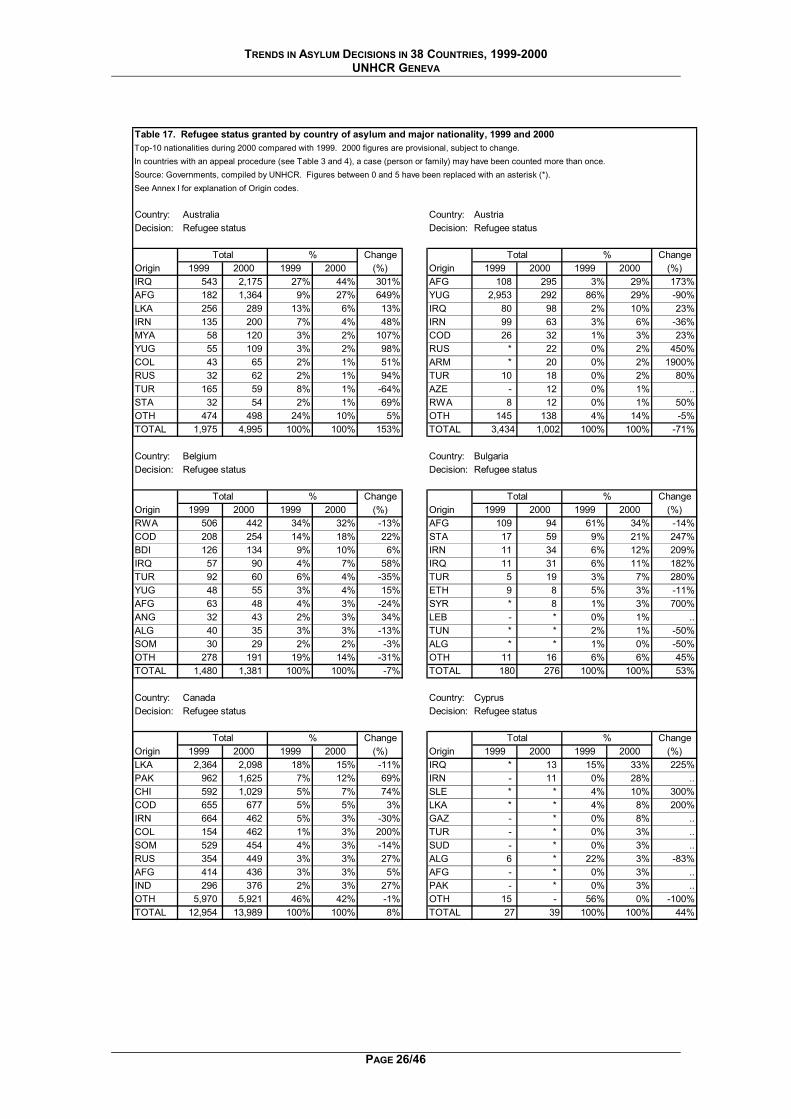
TRENDS IN ASYLUM DECISIONS IN 38 COUNTRIES, 1999-2000 UNHCR GENEVA
Table 17. Refugee status granted by country of asylum and major nationality, 1999 and 2000Top-10 nationalities during 2000 compared with 1999. 2000 figures are provisional, subject to change.In countries with an appeal procedure (see Table 3 and 4), a case (person or family) may have been counted more than once.Source: Governments, compiled by UNHCR. Figures between 0 and 5 have been replaced with an asterisk (*).See Annex I for explanation of Origin codes.
Country: Australia Country: AustriaDecision: Refugee status Decision: Refugee status
Total % Change Total % ChangeOrigin 1999 2000 1999 2000 (%) Origin 1999 2000 1999 2000 (%)IRQ 543 2,175 27% 44% 301% AFG 108 295 3% 29% 173%AFG 182 1,364 9% 27% 649% YUG 2,953 292 86% 29% -90%LKA 256 289 13% 6% 13% IRQ 80 98 2% 10% 23%IRN 135 200 7% 4% 48% IRN 99 63 3% 6% -36%MYA 58 120 3% 2% 107% COD 26 32 1% 3% 23%YUG 55 109 3% 2% 98% RUS * 22 0% 2% 450%COL 43 65 2% 1% 51% ARM * 20 0% 2% 1900%RUS 32 62 2% 1% 94% TUR 10 18 0% 2% 80%TUR 165 59 8% 1% -64% AZE - 12 0% 1% ..STA 32 54 2% 1% 69% RWA 8 12 0% 1% 50%OTH 474 498 24% 10% 5% OTH 145 138 4% 14% -5%TOTAL 1,975 4,995 100% 100% 153% TOTAL 3,434 1,002 100% 100% -71%
Country: Belgium Country: BulgariaDecision: Refugee status Decision: Refugee status
Total % Change Total % ChangeOrigin 1999 2000 1999 2000 (%) Origin 1999 2000 1999 2000 (%)RWA 506 442 34% 32% -13% AFG 109 94 61% 34% -14%COD 208 254 14% 18% 22% STA 17 59 9% 21% 247%BDI 126 134 9% 10% 6% IRN 11 34 6% 12% 209%IRQ 57 90 4% 7% 58% IRQ 11 31 6% 11% 182%TUR 92 60 6% 4% -35% TUR 5 19 3% 7% 280%YUG 48 55 3% 4% 15% ETH 9 8 5% 3% -11%AFG 63 48 4% 3% -24% SYR * 8 1% 3% 700%ANG 32 43 2% 3% 34% LEB - * 0% 1% ..ALG 40 35 3% 3% -13% TUN * * 2% 1% -50%SOM 30 29 2% 2% -3% ALG * * 1% 0% -50%OTH 278 191 19% 14% -31% OTH 11 16 6% 6% 45%TOTAL 1,480 1,381 100% 100% -7% TOTAL 180 276 100% 100% 53%
Country: Canada Country: CyprusDecision: Refugee status Decision: Refugee status
Total % Change Total % ChangeOrigin 1999 2000 1999 2000 (%) Origin 1999 2000 1999 2000 (%)LKA 2,364 2,098 18% 15% -11% IRQ * 13 15% 33% 225%PAK 962 1,625 7% 12% 69% IRN - 11 0% 28% ..CHI 592 1,029 5% 7% 74% SLE * * 4% 10% 300%COD 655 677 5% 5% 3% LKA * * 4% 8% 200%IRN 664 462 5% 3% -30% GAZ - * 0% 8% ..COL 154 462 1% 3% 200% TUR - * 0% 3% ..SOM 529 454 4% 3% -14% SUD - * 0% 3% ..RUS 354 449 3% 3% 27% ALG 6 * 22% 3% -83%AFG 414 436 3% 3% 5% AFG - * 0% 3% ..IND 296 376 2% 3% 27% PAK - * 0% 3% ..OTH 5,970 5,921 46% 42% -1% OTH 15 - 56% 0% -100%TOTAL 12,954 13,989 100% 100% 8% TOTAL 27 39 100% 100% 44%
PAGE 26/46
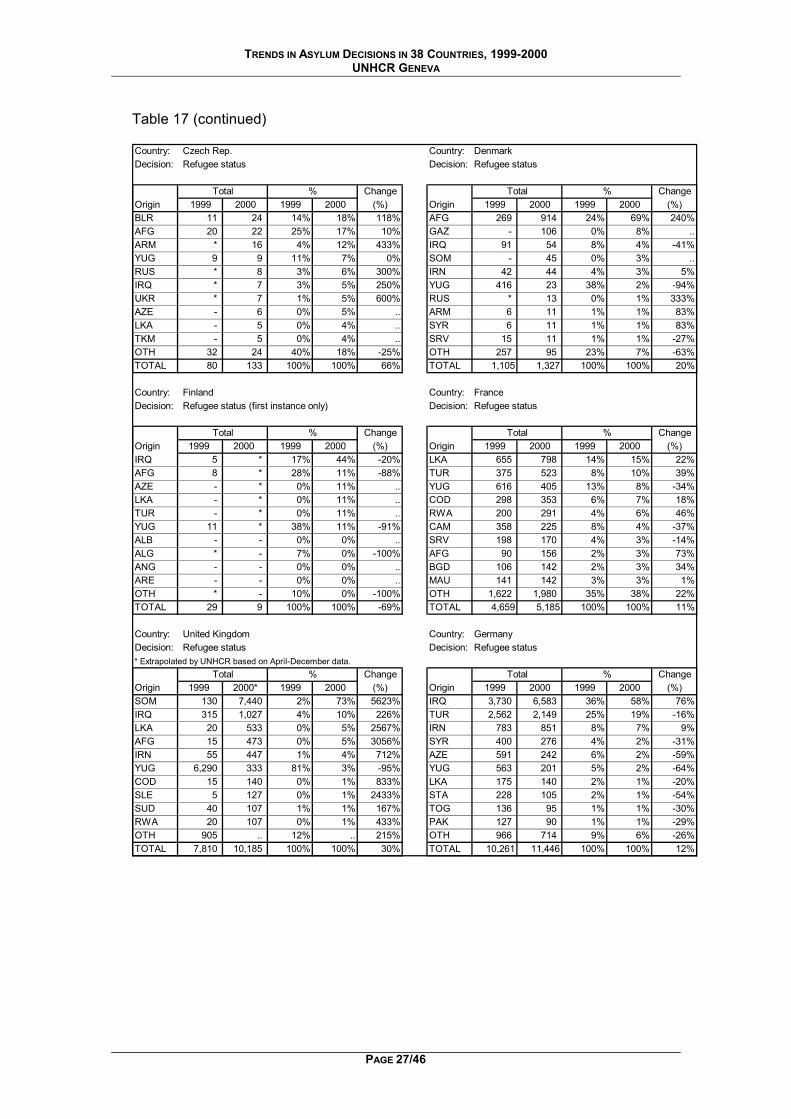
TRENDS IN ASYLUM DECISIONS IN 38 COUNTRIES, 1999-2000 UNHCR GENEVA
Table 17 (continued) Country: Czech Rep. Country: DenmarkDecision: Refugee status Decision: Refugee status
Total % Change Total % ChangeOrigin 1999 2000 1999 2000 (%) Origin 1999 2000 1999 2000 (%)BLR 11 24 14% 18% 118% AFG 269 914 24% 69% 240%AFG 20 22 25% 17% 10% GAZ - 106 0% 8% ..ARM * 16 4% 12% 433% IRQ 91 54 8% 4% -41%YUG 9 9 11% 7% 0% SOM - 45 0% 3% ..RUS * 8 3% 6% 300% IRN 42 44 4% 3% 5%IRQ * 7 3% 5% 250% YUG 416 23 38% 2% -94%UKR * 7 1% 5% 600% RUS * 13 0% 1% 333%AZE - 6 0% 5% .. ARM 6 11 1% 1% 83%LKA - 5 0% 4% .. SYR 6 11 1% 1% 83%TKM - 5 0% 4% .. SRV 15 11 1% 1% -27%OTH 32 24 40% 18% -25% OTH 257 95 23% 7% -63%TOTAL 80 133 100% 100% 66% TOTAL 1,105 1,327 100% 100% 20%
Country: Finland Country: FranceDecision: Refugee status (first instance only) Decision: Refugee status
Total % Change Total % ChangeOrigin 1999 2000 1999 2000 (%) Origin 1999 2000 1999 2000 (%)IRQ 5 * 17% 44% -20% LKA 655 798 14% 15% 22%AFG 8 * 28% 11% -88% TUR 375 523 8% 10% 39%AZE - * 0% 11% .. YUG 616 405 13% 8% -34%LKA - * 0% 11% .. COD 298 353 6% 7% 18%TUR - * 0% 11% .. RWA 200 291 4% 6% 46%YUG 11 * 38% 11% -91% CAM 358 225 8% 4% -37%ALB - - 0% 0% .. SRV 198 170 4% 3% -14%ALG * - 7% 0% -100% AFG 90 156 2% 3% 73%ANG - - 0% 0% .. BGD 106 142 2% 3% 34%ARE - - 0% 0% .. MAU 141 142 3% 3% 1%OTH * - 10% 0% -100% OTH 1,622 1,980 35% 38% 22%TOTAL 29 9 100% 100% -69% TOTAL 4,659 5,185 100% 100% 11%
Country: United Kingdom Country: GermanyDecision: Refugee status Decision: Refugee status* Extrapolated by UNHCR based on April-December data.
Total % Change Total % ChangeOrigin 1999 2000* 1999 2000 (%) Origin 1999 2000 1999 2000 (%)SOM 130 7,440 2% 73% 5623% IRQ 3,730 6,583 36% 58% 76%IRQ 315 1,027 4% 10% 226% TUR 2,562 2,149 25% 19% -16%LKA 20 533 0% 5% 2567% IRN 783 851 8% 7% 9%AFG 15 473 0% 5% 3056% SYR 400 276 4% 2% -31%IRN 55 447 1% 4% 712% AZE 591 242 6% 2% -59%YUG 6,290 333 81% 3% -95% YUG 563 201 5% 2% -64%COD 15 140 0% 1% 833% LKA 175 140 2% 1% -20%SLE 5 127 0% 1% 2433% STA 228 105 2% 1% -54%SUD 40 107 1% 1% 167% TOG 136 95 1% 1% -30%RWA 20 107 0% 1% 433% PAK 127 90 1% 1% -29%OTH 905 .. 12% .. 215% OTH 966 714 9% 6% -26%TOTAL 7,810 10,185 100% 100% 30% TOTAL 10,261 11,446 100% 100% 12%
PAGE 27/46
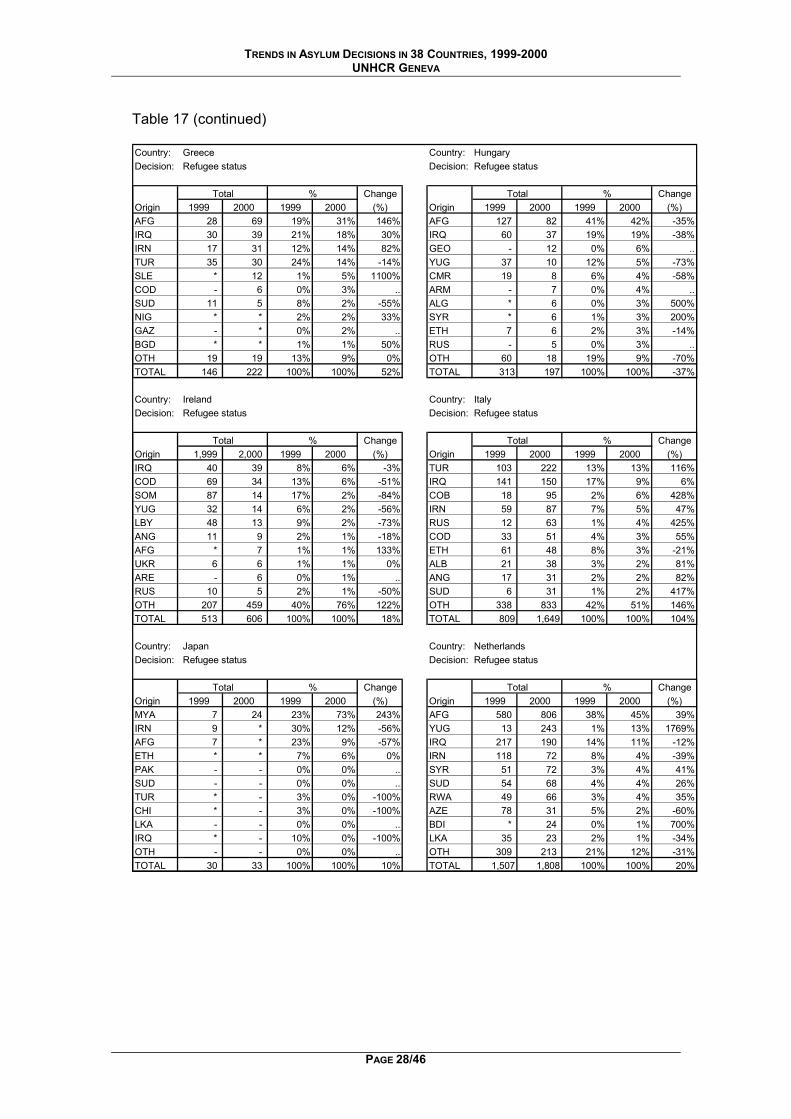
TRENDS IN ASYLUM DECISIONS IN 38 COUNTRIES, 1999-2000 UNHCR GENEVA
Table 17 (continued) Country: Greece Country: HungaryDecision: Refugee status Decision: Refugee status
Total % Change Total % ChangeOrigin 1999 2000 1999 2000 (%) Origin 1999 2000 1999 2000 (%)AFG 28 69 19% 31% 146% AFG 127 82 41% 42% -35%IRQ 30 39 21% 18% 30% IRQ 60 37 19% 19% -38%IRN 17 31 12% 14% 82% GEO - 12 0% 6% ..TUR 35 30 24% 14% -14% YUG 37 10 12% 5% -73%SLE * 12 1% 5% 1100% CMR 19 8 6% 4% -58%COD - 6 0% 3% .. ARM - 7 0% 4% ..SUD 11 5 8% 2% -55% ALG * 6 0% 3% 500%NIG * * 2% 2% 33% SYR * 6 1% 3% 200%GAZ - * 0% 2% .. ETH 7 6 2% 3% -14%BGD * * 1% 1% 50% RUS - 5 0% 3% ..OTH 19 19 13% 9% 0% OTH 60 18 19% 9% -70%TOTAL 146 222 100% 100% 52% TOTAL 313 197 100% 100% -37%
Country: Ireland Country: ItalyDecision: Refugee status Decision: Refugee status
Total % Change Total % ChangeOrigin 1,999 2,000 1999 2000 (%) Origin 1999 2000 1999 2000 (%)IRQ 40 39 8% 6% -3% TUR 103 222 13% 13% 116%COD 69 34 13% 6% -51% IRQ 141 150 17% 9% 6%SOM 87 14 17% 2% -84% COB 18 95 2% 6% 428%YUG 32 14 6% 2% -56% IRN 59 87 7% 5% 47%LBY 48 13 9% 2% -73% RUS 12 63 1% 4% 425%ANG 11 9 2% 1% -18% COD 33 51 4% 3% 55%AFG * 7 1% 1% 133% ETH 61 48 8% 3% -21%UKR 6 6 1% 1% 0% ALB 21 38 3% 2% 81%ARE - 6 0% 1% .. ANG 17 31 2% 2% 82%RUS 10 5 2% 1% -50% SUD 6 31 1% 2% 417%OTH 207 459 40% 76% 122% OTH 338 833 42% 51% 146%TOTAL 513 606 100% 100% 18% TOTAL 809 1,649 100% 100% 104%
Country: Japan Country: NetherlandsDecision: Refugee status Decision: Refugee status
Total % Change Total % ChangeOrigin 1999 2000 1999 2000 (%) Origin 1999 2000 1999 2000 (%)MYA 7 24 23% 73% 243% AFG 580 806 38% 45% 39%IRN 9 * 30% 12% -56% YUG 13 243 1% 13% 1769%AFG 7 * 23% 9% -57% IRQ 217 190 14% 11% -12%ETH * * 7% 6% 0% IRN 118 72 8% 4% -39%PAK - - 0% 0% .. SYR 51 72 3% 4% 41%SUD - - 0% 0% .. SUD 54 68 4% 4% 26%TUR * - 3% 0% -100% RWA 49 66 3% 4% 35%CHI * - 3% 0% -100% AZE 78 31 5% 2% -60%LKA - - 0% 0% .. BDI * 24 0% 1% 700%IRQ * - 10% 0% -100% LKA 35 23 2% 1% -34%OTH - - 0% 0% .. OTH 309 213 21% 12% -31%TOTAL 30 33 100% 100% 10% TOTAL 1,507 1,808 100% 100% 20%
PAGE 28/46
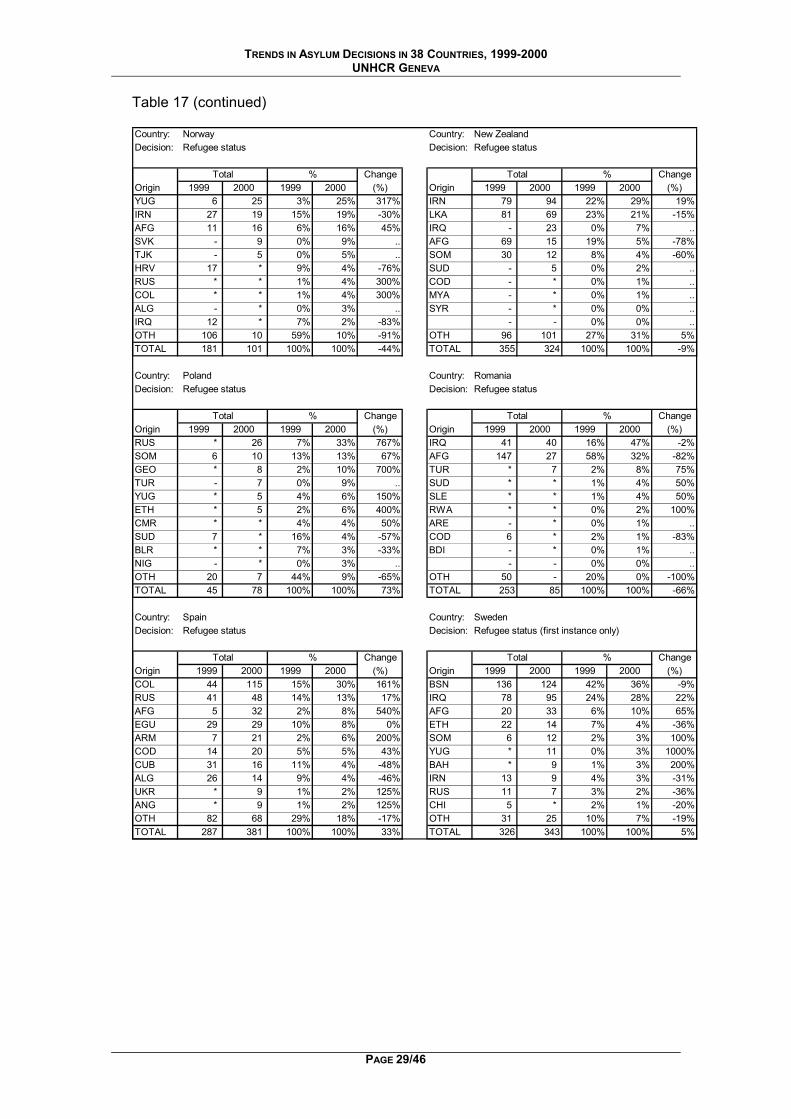
TRENDS IN ASYLUM DECISIONS IN 38 COUNTRIES, 1999-2000 UNHCR GENEVA
Table 17 (continued) Country: Norway Country: New ZealandDecision: Refugee status Decision: Refugee status
Total % Change Total % ChangeOrigin 1999 2000 1999 2000 (%) Origin 1999 2000 1999 2000 (%)YUG 6 25 3% 25% 317% IRN 79 94 22% 29% 19%IRN 27 19 15% 19% -30% LKA 81 69 23% 21% -15%AFG 11 16 6% 16% 45% IRQ - 23 0% 7% ..SVK - 9 0% 9% .. AFG 69 15 19% 5% -78%TJK - 5 0% 5% .. SOM 30 12 8% 4% -60%HRV 17 * 9% 4% -76% SUD - 5 0% 2% ..RUS * * 1% 4% 300% COD - * 0% 1% ..COL * * 1% 4% 300% MYA - * 0% 1% ..ALG - * 0% 3% .. SYR - * 0% 0% ..IRQ 12 * 7% 2% -83% - - 0% 0% ..OTH 106 10 59% 10% -91% OTH 96 101 27% 31% 5%TOTAL 181 101 100% 100% -44% TOTAL 355 324 100% 100% -9%
Country: Poland Country: RomaniaDecision: Refugee status Decision: Refugee status
Total % Change Total % ChangeOrigin 1999 2000 1999 2000 (%) Origin 1999 2000 1999 2000 (%)RUS * 26 7% 33% 767% IRQ 41 40 16% 47% -2%SOM 6 10 13% 13% 67% AFG 147 27 58% 32% -82%GEO * 8 2% 10% 700% TUR * 7 2% 8% 75%TUR - 7 0% 9% .. SUD * * 1% 4% 50%YUG * 5 4% 6% 150% SLE * * 1% 4% 50%ETH * 5 2% 6% 400% RWA * * 0% 2% 100%CMR * * 4% 4% 50% ARE - * 0% 1% ..SUD 7 * 16% 4% -57% COD 6 * 2% 1% -83%BLR * * 7% 3% -33% BDI - * 0% 1% ..NIG - * 0% 3% .. - - 0% 0% ..OTH 20 7 44% 9% -65% OTH 50 - 20% 0% -100%TOTAL 45 78 100% 100% 73% TOTAL 253 85 100% 100% -66%
Country: Spain Country: SwedenDecision: Refugee status Decision: Refugee status (first instance only)
Total % Change Total % ChangeOrigin 1999 2000 1999 2000 (%) Origin 1999 2000 1999 2000 (%)COL 44 115 15% 30% 161% BSN 136 124 42% 36% -9%RUS 41 48 14% 13% 17% IRQ 78 95 24% 28% 22%AFG 5 32 2% 8% 540% AFG 20 33 6% 10% 65%EGU 29 29 10% 8% 0% ETH 22 14 7% 4% -36%ARM 7 21 2% 6% 200% SOM 6 12 2% 3% 100%COD 14 20 5% 5% 43% YUG * 11 0% 3% 1000%CUB 31 16 11% 4% -48% BAH * 9 1% 3% 200%ALG 26 14 9% 4% -46% IRN 13 9 4% 3% -31%UKR * 9 1% 2% 125% RUS 11 7 3% 2% -36%ANG * 9 1% 2% 125% CHI 5 * 2% 1% -20%OTH 82 68 29% 18% -17% OTH 31 25 10% 7% -19%TOTAL 287 381 100% 100% 33% TOTAL 326 343 100% 100% 5%
PAGE 29/46
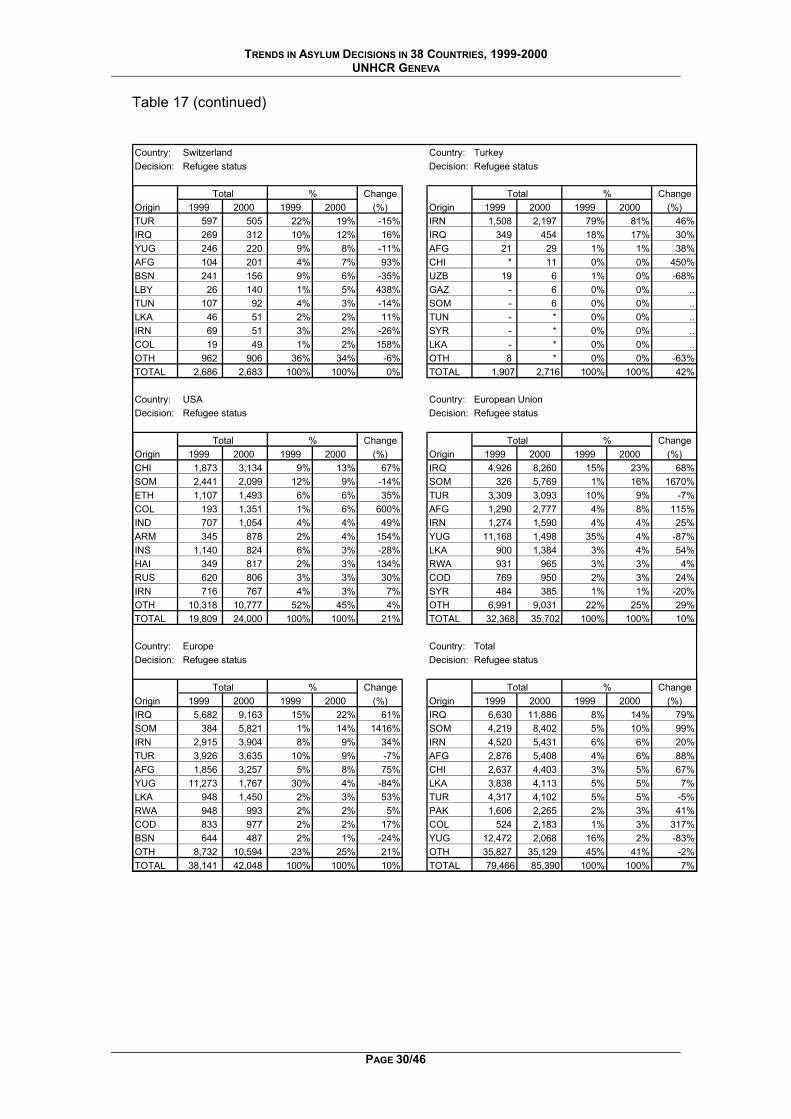
TRENDS IN ASYLUM DECISIONS IN 38 COUNTRIES, 1999-2000 UNHCR GENEVA
Table 17 (continued) Country: Switzerland Country: TurkeyDecision: Refugee status Decision: Refugee status
Total % Change Total % ChangeOrigin 1999 2000 1999 2000 (%) Origin 1999 2000 1999 2000 (%)TUR 597 505 22% 19% -15% IRN 1,508 2,197 79% 81% 46%IRQ 269 312 10% 12% 16% IRQ 349 454 18% 17% 30%YUG 246 220 9% 8% -11% AFG 21 29 1% 1% 38%AFG 104 201 4% 7% 93% CHI * 11 0% 0% 450%BSN 241 156 9% 6% -35% UZB 19 6 1% 0% -68%LBY 26 140 1% 5% 438% GAZ - 6 0% 0% ..TUN 107 92 4% 3% -14% SOM - 6 0% 0% ..LKA 46 51 2% 2% 11% TUN - * 0% 0% ..IRN 69 51 3% 2% -26% SYR - * 0% 0% ..COL 19 49 1% 2% 158% LKA - * 0% 0% ..OTH 962 906 36% 34% -6% OTH 8 * 0% 0% -63%TOTAL 2,686 2,683 100% 100% 0% TOTAL 1,907 2,716 100% 100% 42%
Country: USA Country: European UnionDecision: Refugee status Decision: Refugee status
Total % Change Total % ChangeOrigin 1999 2000 1999 2000 (%) Origin 1999 2000 1999 2000 (%)CHI 1,873 3,134 9% 13% 67% IRQ 4,926 8,260 15% 23% 68%SOM 2,441 2,099 12% 9% -14% SOM 326 5,769 1% 16% 1670%ETH 1,107 1,493 6% 6% 35% TUR 3,309 3,093 10% 9% -7%COL 193 1,351 1% 6% 600% AFG 1,290 2,777 4% 8% 115%IND 707 1,054 4% 4% 49% IRN 1,274 1,590 4% 4% 25%ARM 345 878 2% 4% 154% YUG 11,168 1,498 35% 4% -87%INS 1,140 824 6% 3% -28% LKA 900 1,384 3% 4% 54%HAI 349 817 2% 3% 134% RWA 931 965 3% 3% 4%RUS 620 806 3% 3% 30% COD 769 950 2% 3% 24%IRN 716 767 4% 3% 7% SYR 484 385 1% 1% -20%OTH 10,318 10,777 52% 45% 4% OTH 6,991 9,031 22% 25% 29%TOTAL 19,809 24,000 100% 100% 21% TOTAL 32,368 35,702 100% 100% 10%
Country: Europe Country: TotalDecision: Refugee status Decision: Refugee status
Total % Change Total % ChangeOrigin 1999 2000 1999 2000 (%) Origin 1999 2000 1999 2000 (%)IRQ 5,682 9,163 15% 22% 61% IRQ 6,630 11,886 8% 14% 79%SOM 384 5,821 1% 14% 1416% SOM 4,219 8,402 5% 10% 99%IRN 2,915 3,904 8% 9% 34% IRN 4,520 5,431 6% 6% 20%TUR 3,926 3,635 10% 9% -7% AFG 2,876 5,408 4% 6% 88%AFG 1,856 3,257 5% 8% 75% CHI 2,637 4,403 3% 5% 67%YUG 11,273 1,767 30% 4% -84% LKA 3,838 4,113 5% 5% 7%LKA 948 1,450 2% 3% 53% TUR 4,317 4,102 5% 5% -5%RWA 948 993 2% 2% 5% PAK 1,606 2,265 2% 3% 41%COD 833 977 2% 2% 17% COL 524 2,183 1% 3% 317%BSN 644 487 2% 1% -24% YUG 12,472 2,068 16% 2% -83%OTH 8,732 10,594 23% 25% 21% OTH 35,827 35,129 45% 41% -2%TOTAL 38,141 42,048 100% 100% 10% TOTAL 79,466 85,390 100% 100% 7%
PAGE 30/46
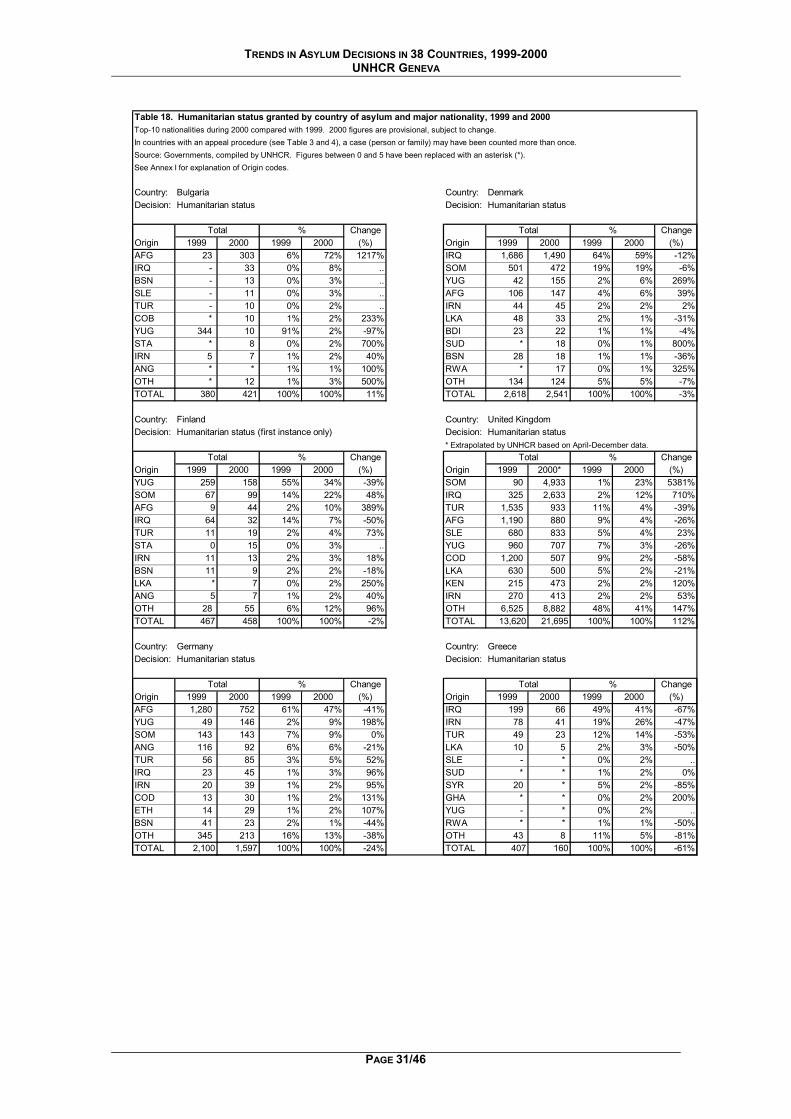
TRENDS IN ASYLUM DECISIONS IN 38 COUNTRIES, 1999-2000 UNHCR GENEVA
Table 18. Humanitarian status granted by country of asylum and major nationality, 1999 and 2000Top-10 nationalities during 2000 compared with 1999. 2000 figures are provisional, subject to change.In countries with an appeal procedure (see Table 3 and 4), a case (person or family) may have been counted more than once.Source: Governments, compiled by UNHCR. Figures between 0 and 5 have been replaced with an asterisk (*).See Annex I for explanation of Origin codes.
Country: Bulgaria Country: DenmarkDecision: Humanitarian status Decision: Humanitarian status
Total % Change Total % ChangeOrigin 1999 2000 1999 2000 (%) Origin 1999 2000 1999 2000 (%)AFG 23 303 6% 72% 1217% IRQ 1,686 1,490 64% 59% -12%IRQ - 33 0% 8% .. SOM 501 472 19% 19% -6%BSN - 13 0% 3% .. YUG 42 155 2% 6% 269%SLE - 11 0% 3% .. AFG 106 147 4% 6% 39%TUR - 10 0% 2% .. IRN 44 45 2% 2% 2%COB * 10 1% 2% 233% LKA 48 33 2% 1% -31%YUG 344 10 91% 2% -97% BDI 23 22 1% 1% -4%STA * 8 0% 2% 700% SUD * 18 0% 1% 800%IRN 5 7 1% 2% 40% BSN 28 18 1% 1% -36%ANG * * 1% 1% 100% RWA * 17 0% 1% 325%OTH * 12 1% 3% 500% OTH 134 124 5% 5% -7%TOTAL 380 421 100% 100% 11% TOTAL 2,618 2,541 100% 100% -3%
Country: Finland Country: United KingdomDecision: Humanitarian status (first instance only) Decision: Humanitarian status
* Extrapolated by UNHCR based on April-December data.Total % Change Total % Change
Origin 1999 2000 1999 2000 (%) Origin 1999 2000* 1999 2000 (%)YUG 259 158 55% 34% -39% SOM 90 4,933 1% 23% 5381%SOM 67 99 14% 22% 48% IRQ 325 2,633 2% 12% 710%AFG 9 44 2% 10% 389% TUR 1,535 933 11% 4% -39%IRQ 64 32 14% 7% -50% AFG 1,190 880 9% 4% -26%TUR 11 19 2% 4% 73% SLE 680 833 5% 4% 23%STA 0 15 0% 3% .. YUG 960 707 7% 3% -26%IRN 11 13 2% 3% 18% COD 1,200 507 9% 2% -58%BSN 11 9 2% 2% -18% LKA 630 500 5% 2% -21%LKA * 7 0% 2% 250% KEN 215 473 2% 2% 120%ANG 5 7 1% 2% 40% IRN 270 413 2% 2% 53%OTH 28 55 6% 12% 96% OTH 6,525 8,882 48% 41% 147%TOTAL 467 458 100% 100% -2% TOTAL 13,620 21,695 100% 100% 112%
Country: Germany Country: GreeceDecision: Humanitarian status Decision: Humanitarian status
Total % Change Total % ChangeOrigin 1999 2000 1999 2000 (%) Origin 1999 2000 1999 2000 (%)AFG 1,280 752 61% 47% -41% IRQ 199 66 49% 41% -67%YUG 49 146 2% 9% 198% IRN 78 41 19% 26% -47%SOM 143 143 7% 9% 0% TUR 49 23 12% 14% -53%ANG 116 92 6% 6% -21% LKA 10 5 2% 3% -50%TUR 56 85 3% 5% 52% SLE - * 0% 2% ..IRQ 23 45 1% 3% 96% SUD * * 1% 2% 0%IRN 20 39 1% 2% 95% SYR 20 * 5% 2% -85%COD 13 30 1% 2% 131% GHA * * 0% 2% 200%ETH 14 29 1% 2% 107% YUG - * 0% 2% ..BSN 41 23 2% 1% -44% RWA * * 1% 1% -50%OTH 345 213 16% 13% -38% OTH 43 8 11% 5% -81%TOTAL 2,100 1,597 100% 100% -24% TOTAL 407 160 100% 100% -61%
PAGE 31/46
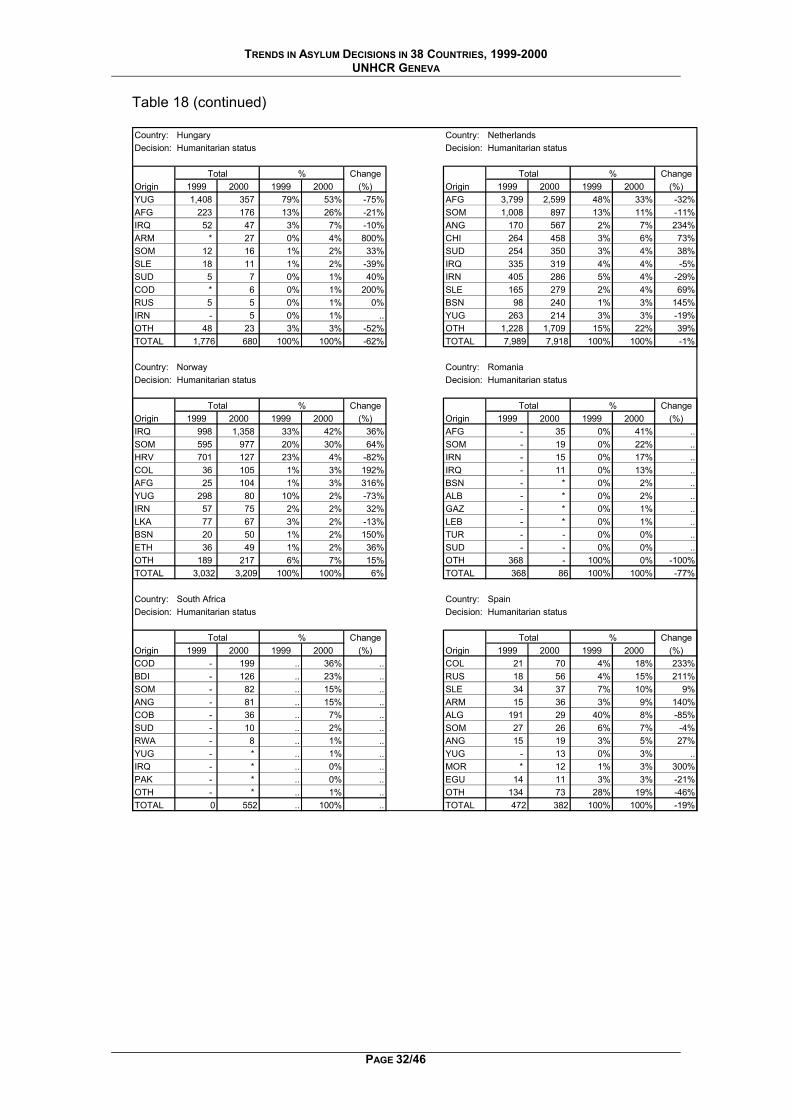
TRENDS IN ASYLUM DECISIONS IN 38 COUNTRIES, 1999-2000 UNHCR GENEVA
Table 18 (continued) Country: Hungary Country: NetherlandsDecision: Humanitarian status Decision: Humanitarian status
Total % Change Total % ChangeOrigin 1999 2000 1999 2000 (%) Origin 1999 2000 1999 2000 (%)YUG 1,408 357 79% 53% -75% AFG 3,799 2,599 48% 33% -32%AFG 223 176 13% 26% -21% SOM 1,008 897 13% 11% -11%IRQ 52 47 3% 7% -10% ANG 170 567 2% 7% 234%ARM * 27 0% 4% 800% CHI 264 458 3% 6% 73%SOM 12 16 1% 2% 33% SUD 254 350 3% 4% 38%SLE 18 11 1% 2% -39% IRQ 335 319 4% 4% -5%SUD 5 7 0% 1% 40% IRN 405 286 5% 4% -29%COD * 6 0% 1% 200% SLE 165 279 2% 4% 69%RUS 5 5 0% 1% 0% BSN 98 240 1% 3% 145%IRN - 5 0% 1% .. YUG 263 214 3% 3% -19%OTH 48 23 3% 3% -52% OTH 1,228 1,709 15% 22% 39%TOTAL 1,776 680 100% 100% -62% TOTAL 7,989 7,918 100% 100% -1%
Country: Norway Country: RomaniaDecision: Humanitarian status Decision: Humanitarian status
Total % Change Total % ChangeOrigin 1999 2000 1999 2000 (%) Origin 1999 2000 1999 2000 (%)IRQ 998 1,358 33% 42% 36% AFG - 35 0% 41% ..SOM 595 977 20% 30% 64% SOM - 19 0% 22% ..HRV 701 127 23% 4% -82% IRN - 15 0% 17% ..COL 36 105 1% 3% 192% IRQ - 11 0% 13% ..AFG 25 104 1% 3% 316% BSN - * 0% 2% ..YUG 298 80 10% 2% -73% ALB - * 0% 2% ..IRN 57 75 2% 2% 32% GAZ - * 0% 1% ..LKA 77 67 3% 2% -13% LEB - * 0% 1% ..BSN 20 50 1% 2% 150% TUR - - 0% 0% ..ETH 36 49 1% 2% 36% SUD - - 0% 0% ..OTH 189 217 6% 7% 15% OTH 368 - 100% 0% -100%TOTAL 3,032 3,209 100% 100% 6% TOTAL 368 86 100% 100% -77%
Country: South Africa Country: SpainDecision: Humanitarian status Decision: Humanitarian status
Total % Change Total % ChangeOrigin 1999 2000 1999 2000 (%) Origin 1999 2000 1999 2000 (%)COD - 199 .. 36% .. COL 21 70 4% 18% 233%BDI - 126 .. 23% .. RUS 18 56 4% 15% 211%SOM - 82 .. 15% .. SLE 34 37 7% 10% 9%ANG - 81 .. 15% .. ARM 15 36 3% 9% 140%COB - 36 .. 7% .. ALG 191 29 40% 8% -85%SUD - 10 .. 2% .. SOM 27 26 6% 7% -4%RWA - 8 .. 1% .. ANG 15 19 3% 5% 27%YUG - * .. 1% .. YUG - 13 0% 3% ..IRQ - * .. 0% .. MOR * 12 1% 3% 300%PAK - * .. 0% .. EGU 14 11 3% 3% -21%OTH - * .. 1% .. OTH 134 73 28% 19% -46%TOTAL 0 552 .. 100% .. TOTAL 472 382 100% 100% -19%
PAGE 32/46
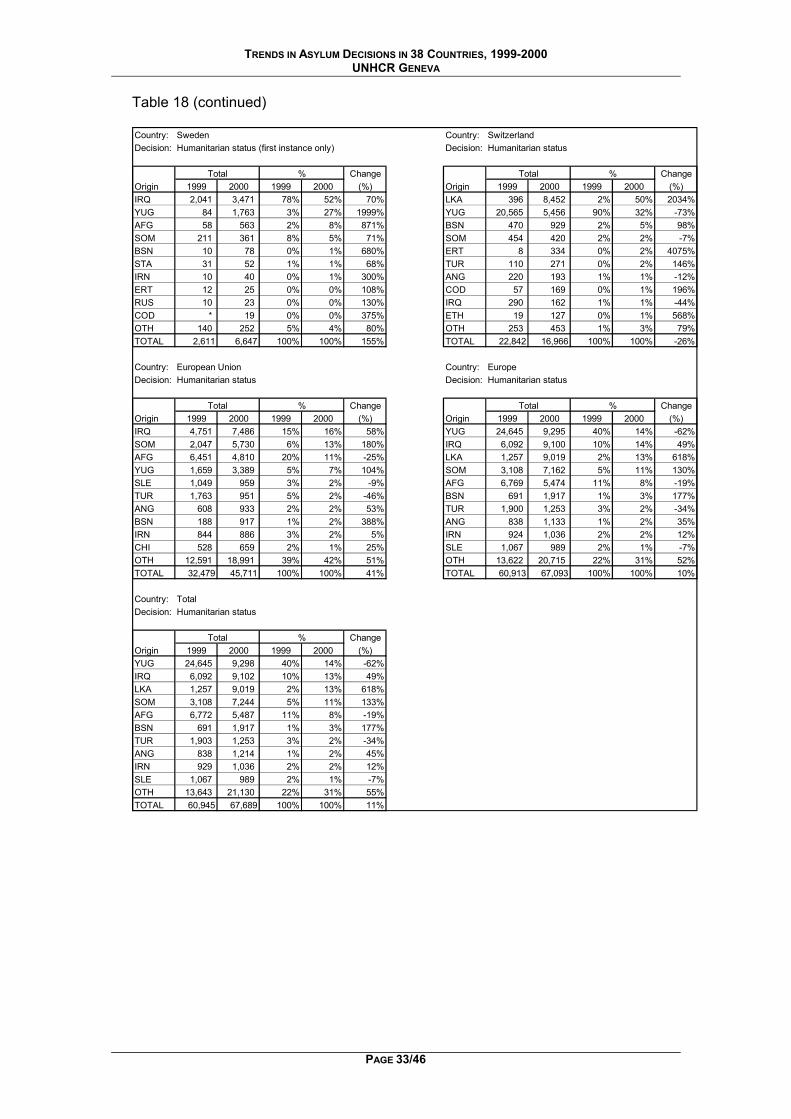
TRENDS IN ASYLUM DECISIONS IN 38 COUNTRIES, 1999-2000 UNHCR GENEVA
Table 18 (continued) Country: Sweden Country: SwitzerlandDecision: Humanitarian status (first instance only) Decision: Humanitarian status
Total % Change Total % ChangeOrigin 1999 2000 1999 2000 (%) Origin 1999 2000 1999 2000 (%)IRQ 2,041 3,471 78% 52% 70% LKA 396 8,452 2% 50% 2034%YUG 84 1,763 3% 27% 1999% YUG 20,565 5,456 90% 32% -73%AFG 58 563 2% 8% 871% BSN 470 929 2% 5% 98%SOM 211 361 8% 5% 71% SOM 454 420 2% 2% -7%BSN 10 78 0% 1% 680% ERT 8 334 0% 2% 4075%STA 31 52 1% 1% 68% TUR 110 271 0% 2% 146%IRN 10 40 0% 1% 300% ANG 220 193 1% 1% -12%ERT 12 25 0% 0% 108% COD 57 169 0% 1% 196%RUS 10 23 0% 0% 130% IRQ 290 162 1% 1% -44%COD * 19 0% 0% 375% ETH 19 127 0% 1% 568%OTH 140 252 5% 4% 80% OTH 253 453 1% 3% 79%TOTAL 2,611 6,647 100% 100% 155% TOTAL 22,842 16,966 100% 100% -26%
Country: European Union Country: EuropeDecision: Humanitarian status Decision: Humanitarian status
Total % Change Total % ChangeOrigin 1999 2000 1999 2000 (%) Origin 1999 2000 1999 2000 (%)IRQ 4,751 7,486 15% 16% 58% YUG 24,645 9,295 40% 14% -62%SOM 2,047 5,730 6% 13% 180% IRQ 6,092 9,100 10% 14% 49%AFG 6,451 4,810 20% 11% -25% LKA 1,257 9,019 2% 13% 618%YUG 1,659 3,389 5% 7% 104% SOM 3,108 7,162 5% 11% 130%SLE 1,049 959 3% 2% -9% AFG 6,769 5,474 11% 8% -19%TUR 1,763 951 5% 2% -46% BSN 691 1,917 1% 3% 177%ANG 608 933 2% 2% 53% TUR 1,900 1,253 3% 2% -34%BSN 188 917 1% 2% 388% ANG 838 1,133 1% 2% 35%IRN 844 886 3% 2% 5% IRN 924 1,036 2% 2% 12%CHI 528 659 2% 1% 25% SLE 1,067 989 2% 1% -7%OTH 12,591 18,991 39% 42% 51% OTH 13,622 20,715 22% 31% 52%TOTAL 32,479 45,711 100% 100% 41% TOTAL 60,913 67,093 100% 100% 10%
Country: TotalDecision: Humanitarian status
Total % ChangeOrigin 1999 2000 1999 2000 (%)YUG 24,645 9,298 40% 14% -62%IRQ 6,092 9,102 10% 13% 49%LKA 1,257 9,019 2% 13% 618%SOM 3,108 7,244 5% 11% 133%AFG 6,772 5,487 11% 8% -19%BSN 691 1,917 1% 3% 177%TUR 1,903 1,253 3% 2% -34%ANG 838 1,214 1% 2% 45%IRN 929 1,036 2% 2% 12%SLE 1,067 989 2% 1% -7%OTH 13,643 21,130 22% 31% 55%TOTAL 60,945 67,689 100% 100% 11%
PAGE 33/46
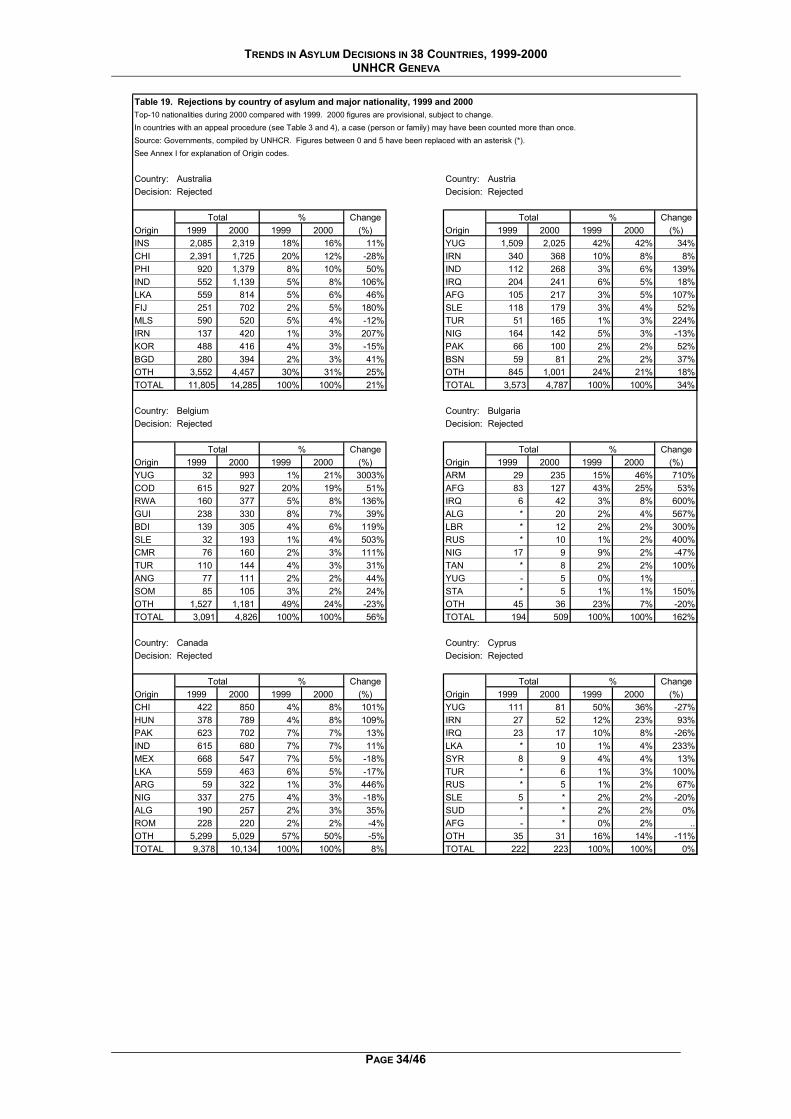
TRENDS IN ASYLUM DECISIONS IN 38 COUNTRIES, 1999-2000 UNHCR GENEVA
Table 19. Rejections by country of asylum and major nationality, 1999 and 2000Top-10 nationalities during 2000 compared with 1999. 2000 figures are provisional, subject to change.In countries with an appeal procedure (see Table 3 and 4), a case (person or family) may have been counted more than once.Source: Governments, compiled by UNHCR. Figures between 0 and 5 have been replaced with an asterisk (*).See Annex I for explanation of Origin codes.
Country: Australia Country: AustriaDecision: Rejected Decision: Rejected
Total % Change Total % ChangeOrigin 1999 2000 1999 2000 (%) Origin 1999 2000 1999 2000 (%)INS 2,085 2,319 18% 16% 11% YUG 1,509 2,025 42% 42% 34%CHI 2,391 1,725 20% 12% -28% IRN 340 368 10% 8% 8%PHI 920 1,379 8% 10% 50% IND 112 268 3% 6% 139%IND 552 1,139 5% 8% 106% IRQ 204 241 6% 5% 18%LKA 559 814 5% 6% 46% AFG 105 217 3% 5% 107%FIJ 251 702 2% 5% 180% SLE 118 179 3% 4% 52%MLS 590 520 5% 4% -12% TUR 51 165 1% 3% 224%IRN 137 420 1% 3% 207% NIG 164 142 5% 3% -13%KOR 488 416 4% 3% -15% PAK 66 100 2% 2% 52%BGD 280 394 2% 3% 41% BSN 59 81 2% 2% 37%OTH 3,552 4,457 30% 31% 25% OTH 845 1,001 24% 21% 18%TOTAL 11,805 14,285 100% 100% 21% TOTAL 3,573 4,787 100% 100% 34%
Country: Belgium Country: BulgariaDecision: Rejected Decision: Rejected
Total % Change Total % ChangeOrigin 1999 2000 1999 2000 (%) Origin 1999 2000 1999 2000 (%)YUG 32 993 1% 21% 3003% ARM 29 235 15% 46% 710%COD 615 927 20% 19% 51% AFG 83 127 43% 25% 53%RWA 160 377 5% 8% 136% IRQ 6 42 3% 8% 600%GUI 238 330 8% 7% 39% ALG * 20 2% 4% 567%BDI 139 305 4% 6% 119% LBR * 12 2% 2% 300%SLE 32 193 1% 4% 503% RUS * 10 1% 2% 400%CMR 76 160 2% 3% 111% NIG 17 9 9% 2% -47%TUR 110 144 4% 3% 31% TAN * 8 2% 2% 100%ANG 77 111 2% 2% 44% YUG - 5 0% 1% ..SOM 85 105 3% 2% 24% STA * 5 1% 1% 150%OTH 1,527 1,181 49% 24% -23% OTH 45 36 23% 7% -20%TOTAL 3,091 4,826 100% 100% 56% TOTAL 194 509 100% 100% 162%
Country: Canada Country: CyprusDecision: Rejected Decision: Rejected
Total % Change Total % ChangeOrigin 1999 2000 1999 2000 (%) Origin 1999 2000 1999 2000 (%)CHI 422 850 4% 8% 101% YUG 111 81 50% 36% -27%HUN 378 789 4% 8% 109% IRN 27 52 12% 23% 93%PAK 623 702 7% 7% 13% IRQ 23 17 10% 8% -26%IND 615 680 7% 7% 11% LKA * 10 1% 4% 233%MEX 668 547 7% 5% -18% SYR 8 9 4% 4% 13%LKA 559 463 6% 5% -17% TUR * 6 1% 3% 100%ARG 59 322 1% 3% 446% RUS * 5 1% 2% 67%NIG 337 275 4% 3% -18% SLE 5 * 2% 2% -20%ALG 190 257 2% 3% 35% SUD * * 2% 2% 0%ROM 228 220 2% 2% -4% AFG - * 0% 2% ..OTH 5,299 5,029 57% 50% -5% OTH 35 31 16% 14% -11%TOTAL 9,378 10,134 100% 100% 8% TOTAL 222 223 100% 100% 0%
PAGE 34/46
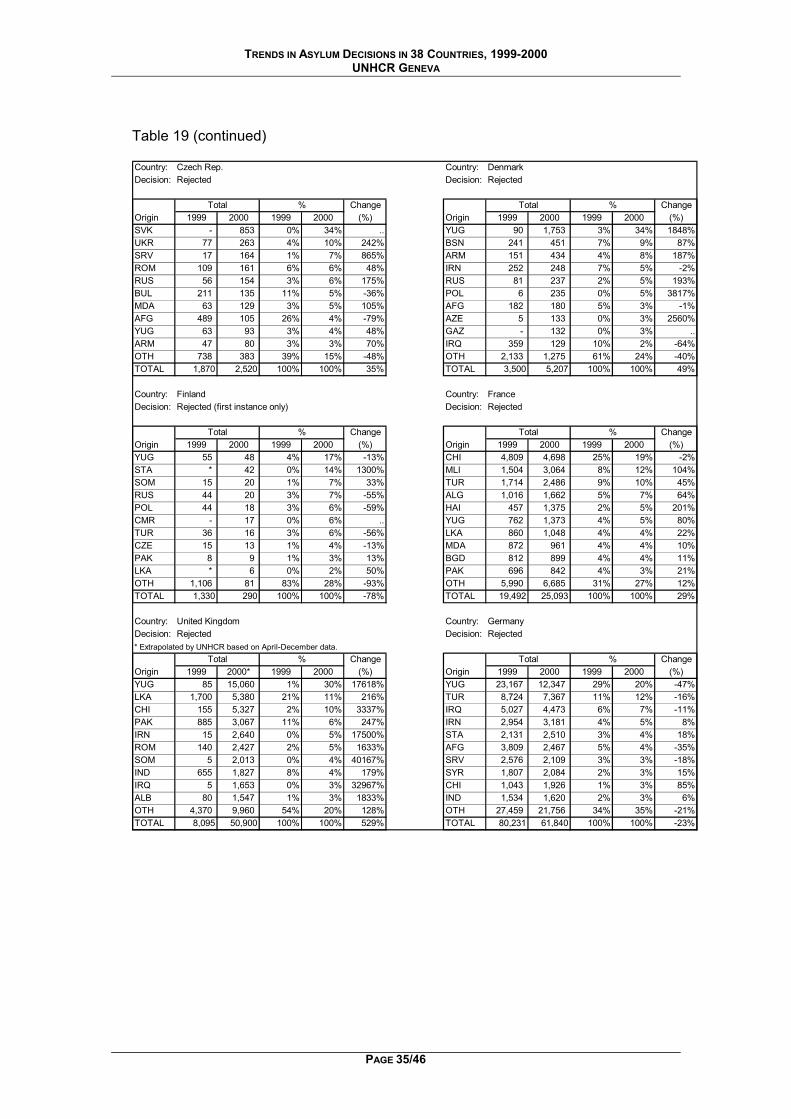
TRENDS IN ASYLUM DECISIONS IN 38 COUNTRIES, 1999-2000 UNHCR GENEVA
Table 19 (continued) Country: Czech Rep. Country: DenmarkDecision: Rejected Decision: Rejected
Total % Change Total % ChangeOrigin 1999 2000 1999 2000 (%) Origin 1999 2000 1999 2000 (%)SVK - 853 0% 34% .. YUG 90 1,753 3% 34% 1848%UKR 77 263 4% 10% 242% BSN 241 451 7% 9% 87%SRV 17 164 1% 7% 865% ARM 151 434 4% 8% 187%ROM 109 161 6% 6% 48% IRN 252 248 7% 5% -2%RUS 56 154 3% 6% 175% RUS 81 237 2% 5% 193%BUL 211 135 11% 5% -36% POL 6 235 0% 5% 3817%MDA 63 129 3% 5% 105% AFG 182 180 5% 3% -1%AFG 489 105 26% 4% -79% AZE 5 133 0% 3% 2560%YUG 63 93 3% 4% 48% GAZ - 132 0% 3% ..ARM 47 80 3% 3% 70% IRQ 359 129 10% 2% -64%OTH 738 383 39% 15% -48% OTH 2,133 1,275 61% 24% -40%TOTAL 1,870 2,520 100% 100% 35% TOTAL 3,500 5,207 100% 100% 49%
Country: Finland Country: FranceDecision: Rejected (first instance only) Decision: Rejected
Total % Change Total % ChangeOrigin 1999 2000 1999 2000 (%) Origin 1999 2000 1999 2000 (%)YUG 55 48 4% 17% -13% CHI 4,809 4,698 25% 19% -2%STA * 42 0% 14% 1300% MLI 1,504 3,064 8% 12% 104%SOM 15 20 1% 7% 33% TUR 1,714 2,486 9% 10% 45%RUS 44 20 3% 7% -55% ALG 1,016 1,662 5% 7% 64%POL 44 18 3% 6% -59% HAI 457 1,375 2% 5% 201%CMR - 17 0% 6% .. YUG 762 1,373 4% 5% 80%TUR 36 16 3% 6% -56% LKA 860 1,048 4% 4% 22%CZE 15 13 1% 4% -13% MDA 872 961 4% 4% 10%PAK 8 9 1% 3% 13% BGD 812 899 4% 4% 11%LKA * 6 0% 2% 50% PAK 696 842 4% 3% 21%OTH 1,106 81 83% 28% -93% OTH 5,990 6,685 31% 27% 12%TOTAL 1,330 290 100% 100% -78% TOTAL 19,492 25,093 100% 100% 29%
Country: United Kingdom Country: GermanyDecision: Rejected Decision: Rejected* Extrapolated by UNHCR based on April-December data.
Total % Change Total % ChangeOrigin 1999 2000* 1999 2000 (%) Origin 1999 2000 1999 2000 (%)YUG 85 15,060 1% 30% 17618% YUG 23,167 12,347 29% 20% -47%LKA 1,700 5,380 21% 11% 216% TUR 8,724 7,367 11% 12% -16%CHI 155 5,327 2% 10% 3337% IRQ 5,027 4,473 6% 7% -11%PAK 885 3,067 11% 6% 247% IRN 2,954 3,181 4% 5% 8%IRN 15 2,640 0% 5% 17500% STA 2,131 2,510 3% 4% 18%ROM 140 2,427 2% 5% 1633% AFG 3,809 2,467 5% 4% -35%SOM 5 2,013 0% 4% 40167% SRV 2,576 2,109 3% 3% -18%IND 655 1,827 8% 4% 179% SYR 1,807 2,084 2% 3% 15%IRQ 5 1,653 0% 3% 32967% CHI 1,043 1,926 1% 3% 85%ALB 80 1,547 1% 3% 1833% IND 1,534 1,620 2% 3% 6%OTH 4,370 9,960 54% 20% 128% OTH 27,459 21,756 34% 35% -21%TOTAL 8,095 50,900 100% 100% 529% TOTAL 80,231 61,840 100% 100% -23%
PAGE 35/46
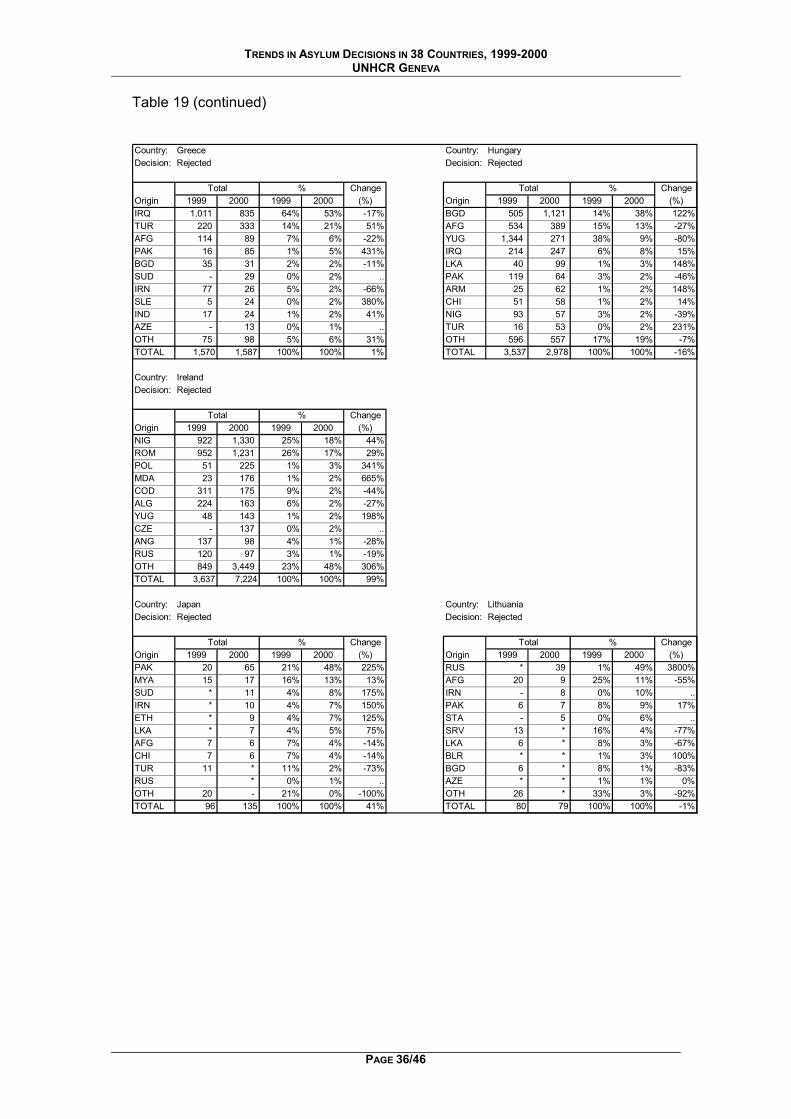
TRENDS IN ASYLUM DECISIONS IN 38 COUNTRIES, 1999-2000 UNHCR GENEVA
Table 19 (continued) Country: Greece Country: HungaryDecision: Rejected Decision: Rejected
Total % Change Total % ChangeOrigin 1999 2000 1999 2000 (%) Origin 1999 2000 1999 2000 (%)IRQ 1,011 835 64% 53% -17% BGD 505 1,121 14% 38% 122%TUR 220 333 14% 21% 51% AFG 534 389 15% 13% -27%AFG 114 89 7% 6% -22% YUG 1,344 271 38% 9% -80%PAK 16 85 1% 5% 431% IRQ 214 247 6% 8% 15%BGD 35 31 2% 2% -11% LKA 40 99 1% 3% 148%SUD - 29 0% 2% .. PAK 119 64 3% 2% -46%IRN 77 26 5% 2% -66% ARM 25 62 1% 2% 148%SLE 5 24 0% 2% 380% CHI 51 58 1% 2% 14%IND 17 24 1% 2% 41% NIG 93 57 3% 2% -39%AZE - 13 0% 1% .. TUR 16 53 0% 2% 231%OTH 75 98 5% 6% 31% OTH 596 557 17% 19% -7%TOTAL 1,570 1,587 100% 100% 1% TOTAL 3,537 2,978 100% 100% -16%
Country: IrelandDecision: Rejected
Total % ChangeOrigin 1999 2000 1999 2000 (%)NIG 922 1,330 25% 18% 44%ROM 952 1,231 26% 17% 29%POL 51 225 1% 3% 341%MDA 23 176 1% 2% 665%COD 311 175 9% 2% -44%ALG 224 163 6% 2% -27%YUG 48 143 1% 2% 198%CZE - 137 0% 2% ..ANG 137 98 4% 1% -28%RUS 120 97 3% 1% -19%OTH 849 3,449 23% 48% 306%TOTAL 3,637 7,224 100% 100% 99%
Country: Japan Country: LithuaniaDecision: Rejected Decision: Rejected
Total % Change Total % ChangeOrigin 1999 2000 1999 2000 (%) Origin 1999 2000 1999 2000 (%)PAK 20 65 21% 48% 225% RUS * 39 1% 49% 3800%MYA 15 17 16% 13% 13% AFG 20 9 25% 11% -55%SUD * 11 4% 8% 175% IRN - 8 0% 10% ..IRN * 10 4% 7% 150% PAK 6 7 8% 9% 17%ETH * 9 4% 7% 125% STA - 5 0% 6% ..LKA * 7 4% 5% 75% SRV 13 * 16% 4% -77%AFG 7 6 7% 4% -14% LKA 6 * 8% 3% -67%CHI 7 6 7% 4% -14% BLR * * 1% 3% 100%TUR 11 * 11% 2% -73% BGD 6 * 8% 1% -83%RUS * 0% 1% .. AZE * * 1% 1% 0%OTH 20 - 21% 0% -100% OTH 26 * 33% 3% -92%TOTAL 96 135 100% 100% 41% TOTAL 80 79 100% 100% -1%
PAGE 36/46
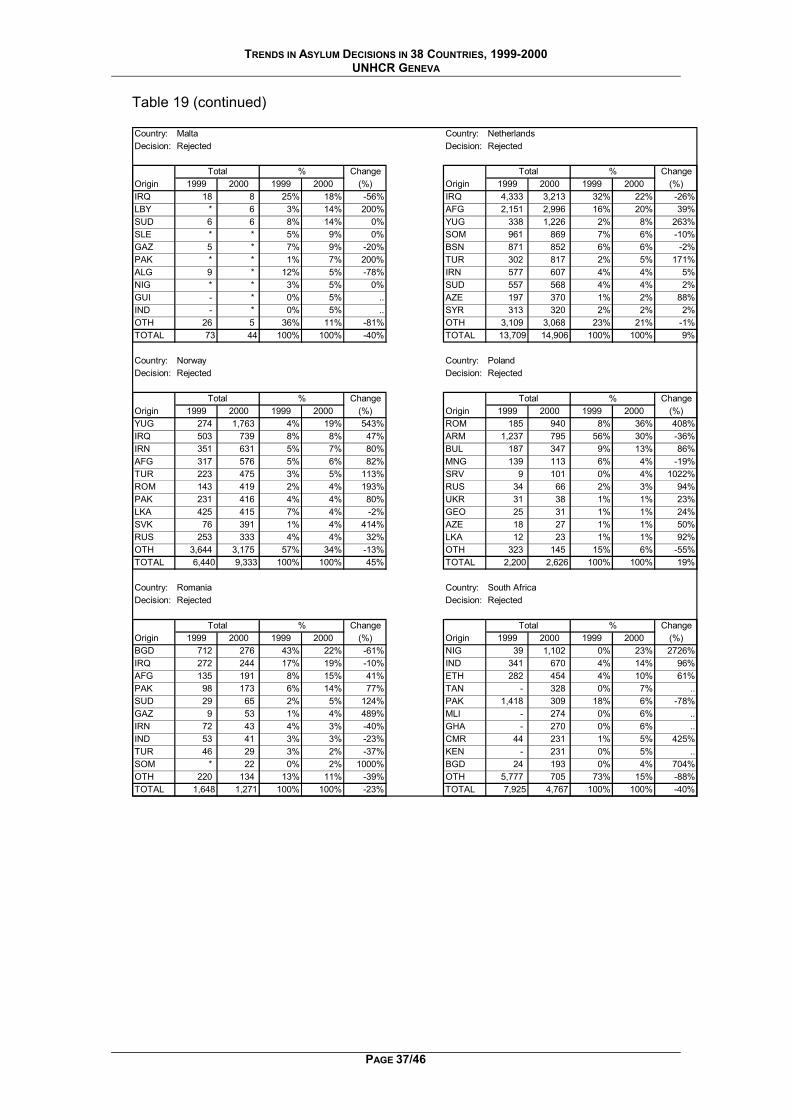
TRENDS IN ASYLUM DECISIONS IN 38 COUNTRIES, 1999-2000 UNHCR GENEVA
Table 19 (continued) Country: Malta Country: NetherlandsDecision: Rejected Decision: Rejected
Total % Change Total % ChangeOrigin 1999 2000 1999 2000 (%) Origin 1999 2000 1999 2000 (%)IRQ 18 8 25% 18% -56% IRQ 4,333 3,213 32% 22% -26%LBY * 6 3% 14% 200% AFG 2,151 2,996 16% 20% 39%SUD 6 6 8% 14% 0% YUG 338 1,226 2% 8% 263%SLE * * 5% 9% 0% SOM 961 869 7% 6% -10%GAZ 5 * 7% 9% -20% BSN 871 852 6% 6% -2%PAK * * 1% 7% 200% TUR 302 817 2% 5% 171%ALG 9 * 12% 5% -78% IRN 577 607 4% 4% 5%NIG * * 3% 5% 0% SUD 557 568 4% 4% 2%GUI - * 0% 5% .. AZE 197 370 1% 2% 88%IND - * 0% 5% .. SYR 313 320 2% 2% 2%OTH 26 5 36% 11% -81% OTH 3,109 3,068 23% 21% -1%TOTAL 73 44 100% 100% -40% TOTAL 13,709 14,906 100% 100% 9%
Country: Norway Country: PolandDecision: Rejected Decision: Rejected
Total % Change Total % ChangeOrigin 1999 2000 1999 2000 (%) Origin 1999 2000 1999 2000 (%)YUG 274 1,763 4% 19% 543% ROM 185 940 8% 36% 408%IRQ 503 739 8% 8% 47% ARM 1,237 795 56% 30% -36%IRN 351 631 5% 7% 80% BUL 187 347 9% 13% 86%AFG 317 576 5% 6% 82% MNG 139 113 6% 4% -19%TUR 223 475 3% 5% 113% SRV 9 101 0% 4% 1022%ROM 143 419 2% 4% 193% RUS 34 66 2% 3% 94%PAK 231 416 4% 4% 80% UKR 31 38 1% 1% 23%LKA 425 415 7% 4% -2% GEO 25 31 1% 1% 24%SVK 76 391 1% 4% 414% AZE 18 27 1% 1% 50%RUS 253 333 4% 4% 32% LKA 12 23 1% 1% 92%OTH 3,644 3,175 57% 34% -13% OTH 323 145 15% 6% -55%TOTAL 6,440 9,333 100% 100% 45% TOTAL 2,200 2,626 100% 100% 19%
Country: Romania Country: South AfricaDecision: Rejected Decision: Rejected
Total % Change Total % ChangeOrigin 1999 2000 1999 2000 (%) Origin 1999 2000 1999 2000 (%)BGD 712 276 43% 22% -61% NIG 39 1,102 0% 23% 2726%IRQ 272 244 17% 19% -10% IND 341 670 4% 14% 96%AFG 135 191 8% 15% 41% ETH 282 454 4% 10% 61%PAK 98 173 6% 14% 77% TAN - 328 0% 7% ..SUD 29 65 2% 5% 124% PAK 1,418 309 18% 6% -78%GAZ 9 53 1% 4% 489% MLI - 274 0% 6% ..IRN 72 43 4% 3% -40% GHA - 270 0% 6% ..IND 53 41 3% 3% -23% CMR 44 231 1% 5% 425%TUR 46 29 3% 2% -37% KEN - 231 0% 5% ..SOM * 22 0% 2% 1000% BGD 24 193 0% 4% 704%OTH 220 134 13% 11% -39% OTH 5,777 705 73% 15% -88%TOTAL 1,648 1,271 100% 100% -23% TOTAL 7,925 4,767 100% 100% -40%
PAGE 37/46
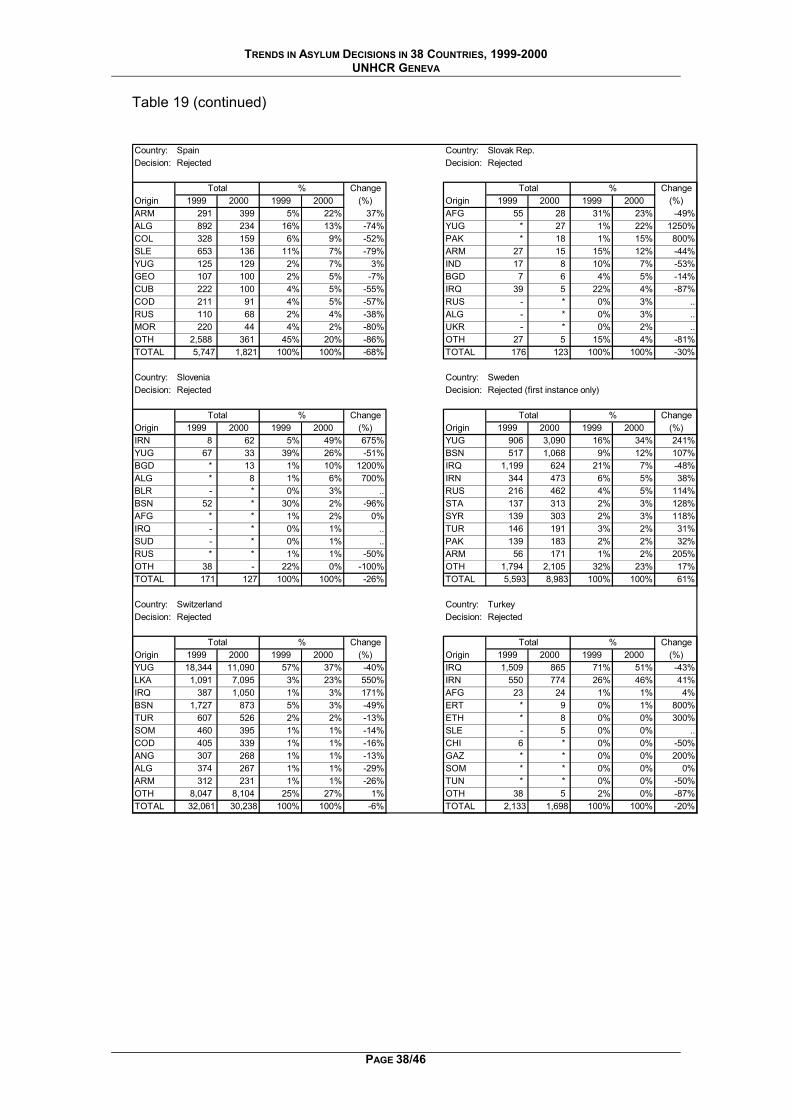
TRENDS IN ASYLUM DECISIONS IN 38 COUNTRIES, 1999-2000 UNHCR GENEVA
Table 19 (continued) Country: Spain Country: Slovak Rep.Decision: Rejected Decision: Rejected
Total % Change Total % ChangeOrigin 1999 2000 1999 2000 (%) Origin 1999 2000 1999 2000 (%)ARM 291 399 5% 22% 37% AFG 55 28 31% 23% -49%ALG 892 234 16% 13% -74% YUG * 27 1% 22% 1250%COL 328 159 6% 9% -52% PAK * 18 1% 15% 800%SLE 653 136 11% 7% -79% ARM 27 15 15% 12% -44%YUG 125 129 2% 7% 3% IND 17 8 10% 7% -53%GEO 107 100 2% 5% -7% BGD 7 6 4% 5% -14%CUB 222 100 4% 5% -55% IRQ 39 5 22% 4% -87%COD 211 91 4% 5% -57% RUS - * 0% 3% ..RUS 110 68 2% 4% -38% ALG - * 0% 3% ..MOR 220 44 4% 2% -80% UKR - * 0% 2% ..OTH 2,588 361 45% 20% -86% OTH 27 5 15% 4% -81%TOTAL 5,747 1,821 100% 100% -68% TOTAL 176 123 100% 100% -30%
Country: Slovenia Country: SwedenDecision: Rejected Decision: Rejected (first instance only)
Total % Change Total % ChangeOrigin 1999 2000 1999 2000 (%) Origin 1999 2000 1999 2000 (%)IRN 8 62 5% 49% 675% YUG 906 3,090 16% 34% 241%YUG 67 33 39% 26% -51% BSN 517 1,068 9% 12% 107%BGD * 13 1% 10% 1200% IRQ 1,199 624 21% 7% -48%ALG * 8 1% 6% 700% IRN 344 473 6% 5% 38%BLR - * 0% 3% .. RUS 216 462 4% 5% 114%BSN 52 * 30% 2% -96% STA 137 313 2% 3% 128%AFG * * 1% 2% 0% SYR 139 303 2% 3% 118%IRQ - * 0% 1% .. TUR 146 191 3% 2% 31%SUD - * 0% 1% .. PAK 139 183 2% 2% 32%RUS * * 1% 1% -50% ARM 56 171 1% 2% 205%OTH 38 - 22% 0% -100% OTH 1,794 2,105 32% 23% 17%TOTAL 171 127 100% 100% -26% TOTAL 5,593 8,983 100% 100% 61%
Country: Switzerland Country: TurkeyDecision: Rejected Decision: Rejected
Total % Change Total % ChangeOrigin 1999 2000 1999 2000 (%) Origin 1999 2000 1999 2000 (%)YUG 18,344 11,090 57% 37% -40% IRQ 1,509 865 71% 51% -43%LKA 1,091 7,095 3% 23% 550% IRN 550 774 26% 46% 41%IRQ 387 1,050 1% 3% 171% AFG 23 24 1% 1% 4%BSN 1,727 873 5% 3% -49% ERT * 9 0% 1% 800%TUR 607 526 2% 2% -13% ETH * 8 0% 0% 300%SOM 460 395 1% 1% -14% SLE - 5 0% 0% ..COD 405 339 1% 1% -16% CHI 6 * 0% 0% -50%ANG 307 268 1% 1% -13% GAZ * * 0% 0% 200%ALG 374 267 1% 1% -29% SOM * * 0% 0% 0%ARM 312 231 1% 1% -26% TUN * * 0% 0% -50%OTH 8,047 8,104 25% 27% 1% OTH 38 5 2% 0% -87%TOTAL 32,061 30,238 100% 100% -6% TOTAL 2,133 1,698 100% 100% -20%
PAGE 38/46
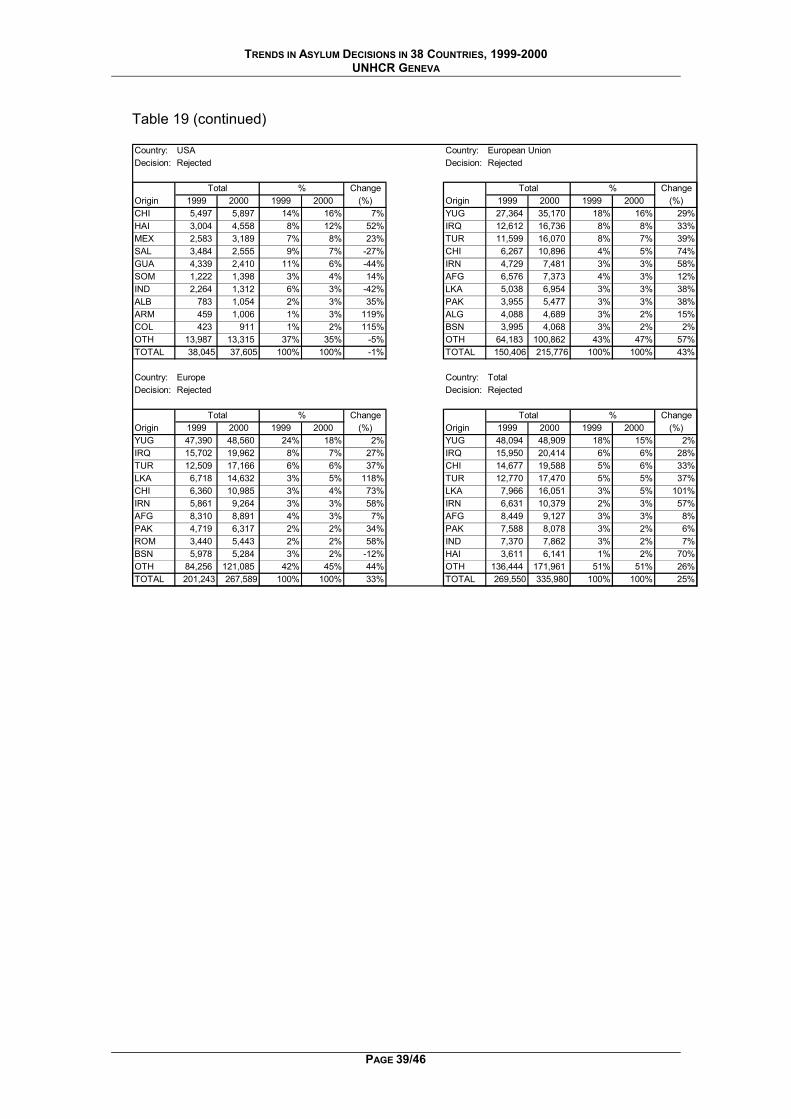
TRENDS IN ASYLUM DECISIONS IN 38 COUNTRIES, 1999-2000 UNHCR GENEVA
Table 19 (continued) Country: USA Country: European UnionDecision: Rejected Decision: Rejected
Total % Change Total % ChangeOrigin 1999 2000 1999 2000 (%) Origin 1999 2000 1999 2000 (%)CHI 5,497 5,897 14% 16% 7% YUG 27,364 35,170 18% 16% 29%HAI 3,004 4,558 8% 12% 52% IRQ 12,612 16,736 8% 8% 33%MEX 2,583 3,189 7% 8% 23% TUR 11,599 16,070 8% 7% 39%SAL 3,484 2,555 9% 7% -27% CHI 6,267 10,896 4% 5% 74%GUA 4,339 2,410 11% 6% -44% IRN 4,729 7,481 3% 3% 58%SOM 1,222 1,398 3% 4% 14% AFG 6,576 7,373 4% 3% 12%IND 2,264 1,312 6% 3% -42% LKA 5,038 6,954 3% 3% 38%ALB 783 1,054 2% 3% 35% PAK 3,955 5,477 3% 3% 38%ARM 459 1,006 1% 3% 119% ALG 4,088 4,689 3% 2% 15%COL 423 911 1% 2% 115% BSN 3,995 4,068 3% 2% 2%OTH 13,987 13,315 37% 35% -5% OTH 64,183 100,862 43% 47% 57%TOTAL 38,045 37,605 100% 100% -1% TOTAL 150,406 215,776 100% 100% 43%
Country: Europe Country: TotalDecision: Rejected Decision: Rejected
Total % Change Total % ChangeOrigin 1999 2000 1999 2000 (%) Origin 1999 2000 1999 2000 (%)YUG 47,390 48,560 24% 18% 2% YUG 48,094 48,909 18% 15% 2%IRQ 15,702 19,962 8% 7% 27% IRQ 15,950 20,414 6% 6% 28%TUR 12,509 17,166 6% 6% 37% CHI 14,677 19,588 5% 6% 33%LKA 6,718 14,632 3% 5% 118% TUR 12,770 17,470 5% 5% 37%CHI 6,360 10,985 3% 4% 73% LKA 7,966 16,051 3% 5% 101%IRN 5,861 9,264 3% 3% 58% IRN 6,631 10,379 2% 3% 57%AFG 8,310 8,891 4% 3% 7% AFG 8,449 9,127 3% 3% 8%PAK 4,719 6,317 2% 2% 34% PAK 7,588 8,078 3% 2% 6%ROM 3,440 5,443 2% 2% 58% IND 7,370 7,862 3% 2% 7%BSN 5,978 5,284 3% 2% -12% HAI 3,611 6,141 1% 2% 70%OTH 84,256 121,085 42% 45% 44% OTH 136,444 171,961 51% 51% 26%TOTAL 201,243 267,589 100% 100% 33% TOTAL 269,550 335,980 100% 100% 25%
PAGE 39/46
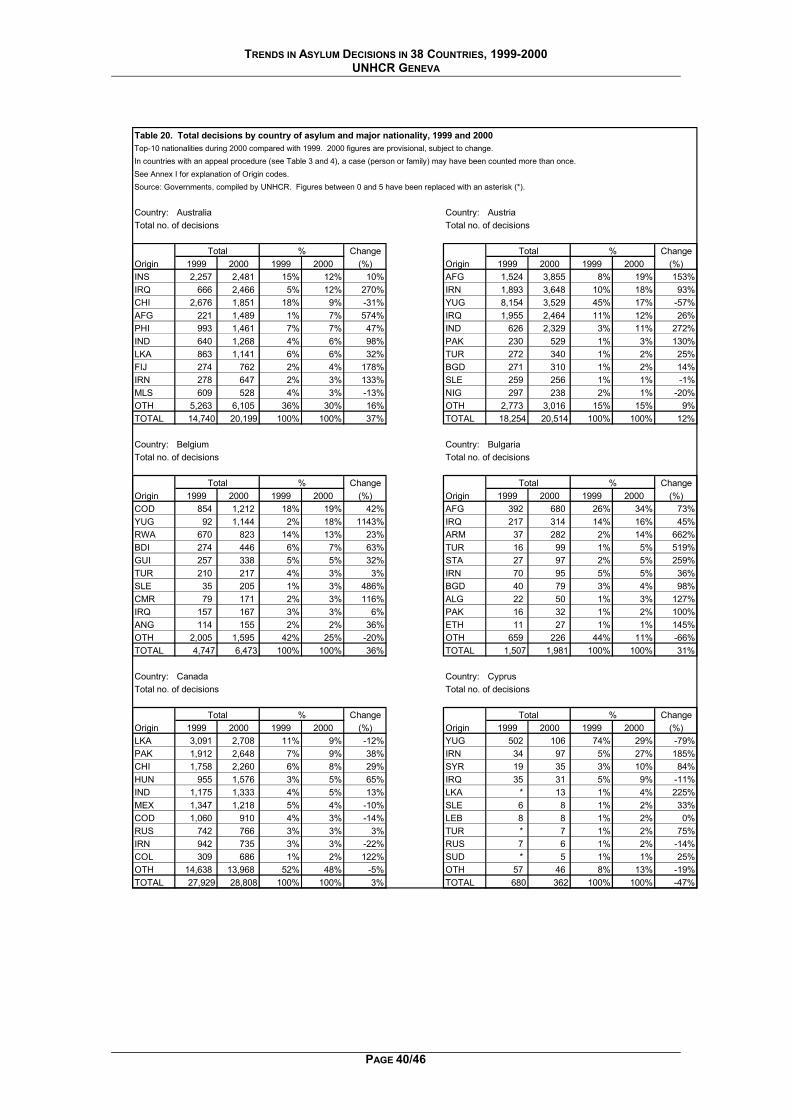
TRENDS IN ASYLUM DECISIONS IN 38 COUNTRIES, 1999-2000 UNHCR GENEVA
Table 20. Total decisions by country of asylum and major nationality, 1999 and 2000Top-10 nationalities during 2000 compared with 1999. 2000 figures are provisional, subject to change.In countries with an appeal procedure (see Table 3 and 4), a case (person or family) may have been counted more than once.See Annex I for explanation of Origin codes.Source: Governments, compiled by UNHCR. Figures between 0 and 5 have been replaced with an asterisk (*).
Country: Australia Country: AustriaTotal no. of decisions Total no. of decisions
Total % Change Total % ChangeOrigin 1999 2000 1999 2000 (%) Origin 1999 2000 1999 2000 (%)INS 2,257 2,481 15% 12% 10% AFG 1,524 3,855 8% 19% 153%IRQ 666 2,466 5% 12% 270% IRN 1,893 3,648 10% 18% 93%CHI 2,676 1,851 18% 9% -31% YUG 8,154 3,529 45% 17% -57%AFG 221 1,489 1% 7% 574% IRQ 1,955 2,464 11% 12% 26%PHI 993 1,461 7% 7% 47% IND 626 2,329 3% 11% 272%IND 640 1,268 4% 6% 98% PAK 230 529 1% 3% 130%LKA 863 1,141 6% 6% 32% TUR 272 340 1% 2% 25%FIJ 274 762 2% 4% 178% BGD 271 310 1% 2% 14%IRN 278 647 2% 3% 133% SLE 259 256 1% 1% -1%MLS 609 528 4% 3% -13% NIG 297 238 2% 1% -20%OTH 5,263 6,105 36% 30% 16% OTH 2,773 3,016 15% 15% 9%TOTAL 14,740 20,199 100% 100% 37% TOTAL 18,254 20,514 100% 100% 12%
Country: Belgium Country: BulgariaTotal no. of decisions Total no. of decisions
Total % Change Total % ChangeOrigin 1999 2000 1999 2000 (%) Origin 1999 2000 1999 2000 (%)COD 854 1,212 18% 19% 42% AFG 392 680 26% 34% 73%YUG 92 1,144 2% 18% 1143% IRQ 217 314 14% 16% 45%RWA 670 823 14% 13% 23% ARM 37 282 2% 14% 662%BDI 274 446 6% 7% 63% TUR 16 99 1% 5% 519%GUI 257 338 5% 5% 32% STA 27 97 2% 5% 259%TUR 210 217 4% 3% 3% IRN 70 95 5% 5% 36%SLE 35 205 1% 3% 486% BGD 40 79 3% 4% 98%CMR 79 171 2% 3% 116% ALG 22 50 1% 3% 127%IRQ 157 167 3% 3% 6% PAK 16 32 1% 2% 100%ANG 114 155 2% 2% 36% ETH 11 27 1% 1% 145%OTH 2,005 1,595 42% 25% -20% OTH 659 226 44% 11% -66%TOTAL 4,747 6,473 100% 100% 36% TOTAL 1,507 1,981 100% 100% 31%
Country: Canada Country: CyprusTotal no. of decisions Total no. of decisions
Total % Change Total % ChangeOrigin 1999 2000 1999 2000 (%) Origin 1999 2000 1999 2000 (%)LKA 3,091 2,708 11% 9% -12% YUG 502 106 74% 29% -79%PAK 1,912 2,648 7% 9% 38% IRN 34 97 5% 27% 185%CHI 1,758 2,260 6% 8% 29% SYR 19 35 3% 10% 84%HUN 955 1,576 3% 5% 65% IRQ 35 31 5% 9% -11%IND 1,175 1,333 4% 5% 13% LKA * 13 1% 4% 225%MEX 1,347 1,218 5% 4% -10% SLE 6 8 1% 2% 33%COD 1,060 910 4% 3% -14% LEB 8 8 1% 2% 0%RUS 742 766 3% 3% 3% TUR * 7 1% 2% 75%IRN 942 735 3% 3% -22% RUS 7 6 1% 2% -14%COL 309 686 1% 2% 122% SUD * 5 1% 1% 25%OTH 14,638 13,968 52% 48% -5% OTH 57 46 8% 13% -19%TOTAL 27,929 28,808 100% 100% 3% TOTAL 680 362 100% 100% -47%
PAGE 40/46
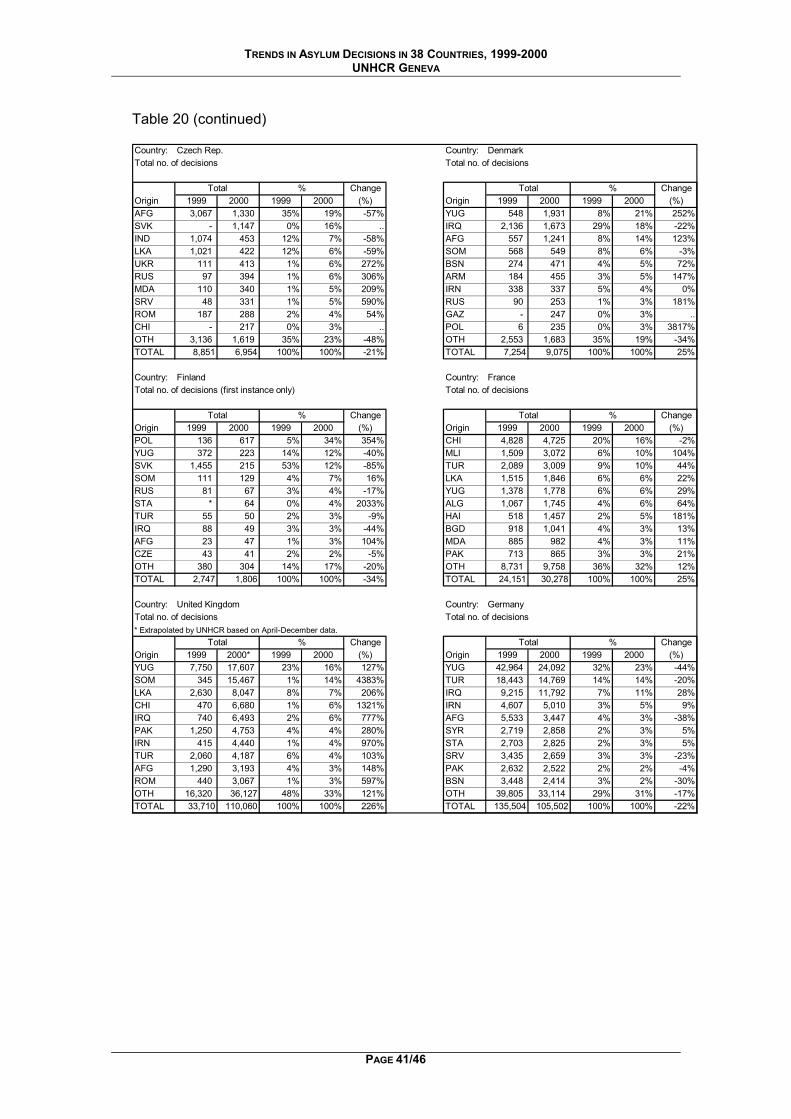
TRENDS IN ASYLUM DECISIONS IN 38 COUNTRIES, 1999-2000 UNHCR GENEVA
Table 20 (continued) Country: Czech Rep. Country: DenmarkTotal no. of decisions Total no. of decisions
Total % Change Total % ChangeOrigin 1999 2000 1999 2000 (%) Origin 1999 2000 1999 2000 (%)AFG 3,067 1,330 35% 19% -57% YUG 548 1,931 8% 21% 252%SVK - 1,147 0% 16% .. IRQ 2,136 1,673 29% 18% -22%IND 1,074 453 12% 7% -58% AFG 557 1,241 8% 14% 123%LKA 1,021 422 12% 6% -59% SOM 568 549 8% 6% -3%UKR 111 413 1% 6% 272% BSN 274 471 4% 5% 72%RUS 97 394 1% 6% 306% ARM 184 455 3% 5% 147%MDA 110 340 1% 5% 209% IRN 338 337 5% 4% 0%SRV 48 331 1% 5% 590% RUS 90 253 1% 3% 181%ROM 187 288 2% 4% 54% GAZ - 247 0% 3% ..CHI - 217 0% 3% .. POL 6 235 0% 3% 3817%OTH 3,136 1,619 35% 23% -48% OTH 2,553 1,683 35% 19% -34%TOTAL 8,851 6,954 100% 100% -21% TOTAL 7,254 9,075 100% 100% 25%
Country: Finland Country: FranceTotal no. of decisions (first instance only) Total no. of decisions
Total % Change Total % ChangeOrigin 1999 2000 1999 2000 (%) Origin 1999 2000 1999 2000 (%)POL 136 617 5% 34% 354% CHI 4,828 4,725 20% 16% -2%YUG 372 223 14% 12% -40% MLI 1,509 3,072 6% 10% 104%SVK 1,455 215 53% 12% -85% TUR 2,089 3,009 9% 10% 44%SOM 111 129 4% 7% 16% LKA 1,515 1,846 6% 6% 22%RUS 81 67 3% 4% -17% YUG 1,378 1,778 6% 6% 29%STA * 64 0% 4% 2033% ALG 1,067 1,745 4% 6% 64%TUR 55 50 2% 3% -9% HAI 518 1,457 2% 5% 181%IRQ 88 49 3% 3% -44% BGD 918 1,041 4% 3% 13%AFG 23 47 1% 3% 104% MDA 885 982 4% 3% 11%CZE 43 41 2% 2% -5% PAK 713 865 3% 3% 21%OTH 380 304 14% 17% -20% OTH 8,731 9,758 36% 32% 12%TOTAL 2,747 1,806 100% 100% -34% TOTAL 24,151 30,278 100% 100% 25%
Country: United Kingdom Country: GermanyTotal no. of decisions Total no. of decisions* Extrapolated by UNHCR based on April-December data.
Total % Change Total % ChangeOrigin 1999 2000* 1999 2000 (%) Origin 1999 2000 1999 2000 (%)YUG 7,750 17,607 23% 16% 127% YUG 42,964 24,092 32% 23% -44%SOM 345 15,467 1% 14% 4383% TUR 18,443 14,769 14% 14% -20%LKA 2,630 8,047 8% 7% 206% IRQ 9,215 11,792 7% 11% 28%CHI 470 6,680 1% 6% 1321% IRN 4,607 5,010 3% 5% 9%IRQ 740 6,493 2% 6% 777% AFG 5,533 3,447 4% 3% -38%PAK 1,250 4,753 4% 4% 280% SYR 2,719 2,858 2% 3% 5%IRN 415 4,440 1% 4% 970% STA 2,703 2,825 2% 3% 5%TUR 2,060 4,187 6% 4% 103% SRV 3,435 2,659 3% 3% -23%AFG 1,290 3,193 4% 3% 148% PAK 2,632 2,522 2% 2% -4%ROM 440 3,067 1% 3% 597% BSN 3,448 2,414 3% 2% -30%OTH 16,320 36,127 48% 33% 121% OTH 39,805 33,114 29% 31% -17%TOTAL 33,710 110,060 100% 100% 226% TOTAL 135,504 105,502 100% 100% -22%
PAGE 41/46
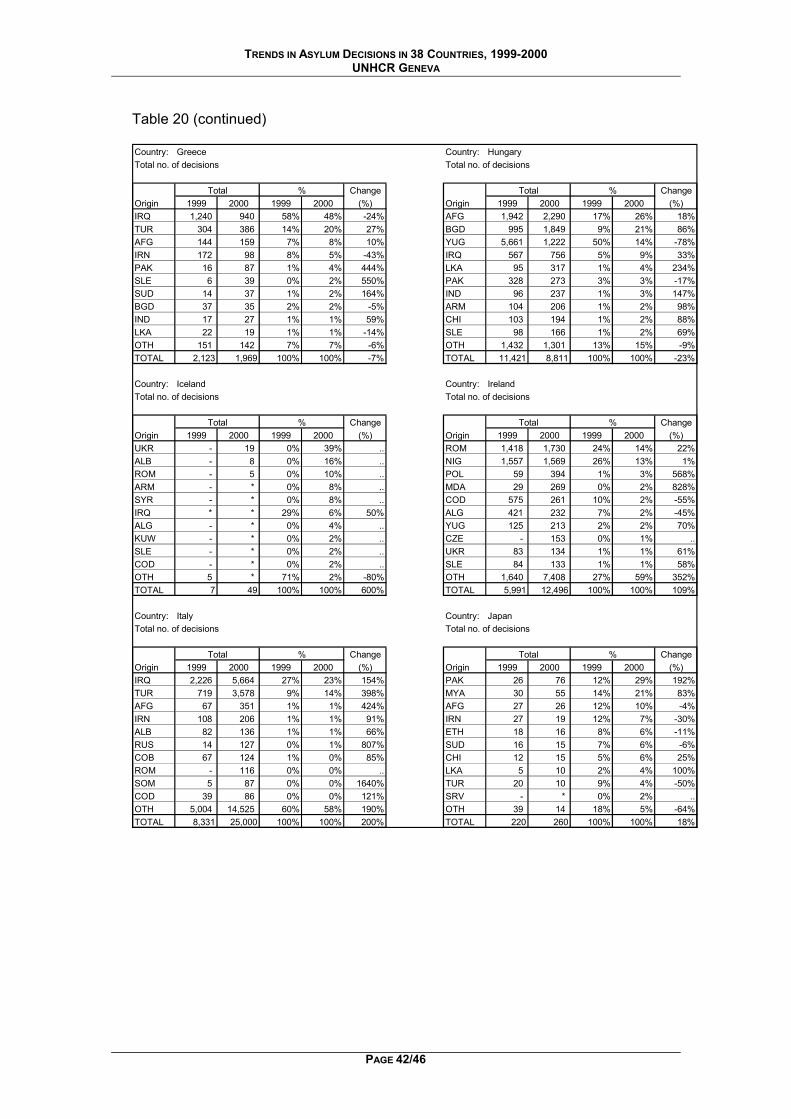
TRENDS IN ASYLUM DECISIONS IN 38 COUNTRIES, 1999-2000 UNHCR GENEVA
Table 20 (continued) Country: Greece Country: HungaryTotal no. of decisions Total no. of decisions
Total % Change Total % ChangeOrigin 1999 2000 1999 2000 (%) Origin 1999 2000 1999 2000 (%)IRQ 1,240 940 58% 48% -24% AFG 1,942 2,290 17% 26% 18%TUR 304 386 14% 20% 27% BGD 995 1,849 9% 21% 86%AFG 144 159 7% 8% 10% YUG 5,661 1,222 50% 14% -78%IRN 172 98 8% 5% -43% IRQ 567 756 5% 9% 33%PAK 16 87 1% 4% 444% LKA 95 317 1% 4% 234%SLE 6 39 0% 2% 550% PAK 328 273 3% 3% -17%SUD 14 37 1% 2% 164% IND 96 237 1% 3% 147%BGD 37 35 2% 2% -5% ARM 104 206 1% 2% 98%IND 17 27 1% 1% 59% CHI 103 194 1% 2% 88%LKA 22 19 1% 1% -14% SLE 98 166 1% 2% 69%OTH 151 142 7% 7% -6% OTH 1,432 1,301 13% 15% -9%TOTAL 2,123 1,969 100% 100% -7% TOTAL 11,421 8,811 100% 100% -23%
Country: Iceland Country: IrelandTotal no. of decisions Total no. of decisions
Total % Change Total % ChangeOrigin 1999 2000 1999 2000 (%) Origin 1999 2000 1999 2000 (%)UKR - 19 0% 39% .. ROM 1,418 1,730 24% 14% 22%ALB - 8 0% 16% .. NIG 1,557 1,569 26% 13% 1%ROM - 5 0% 10% .. POL 59 394 1% 3% 568%ARM - * 0% 8% .. MDA 29 269 0% 2% 828%SYR - * 0% 8% .. COD 575 261 10% 2% -55%IRQ * * 29% 6% 50% ALG 421 232 7% 2% -45%ALG - * 0% 4% .. YUG 125 213 2% 2% 70%KUW - * 0% 2% .. CZE - 153 0% 1% ..SLE - * 0% 2% .. UKR 83 134 1% 1% 61%COD - * 0% 2% .. SLE 84 133 1% 1% 58%OTH 5 * 71% 2% -80% OTH 1,640 7,408 27% 59% 352%TOTAL 7 49 100% 100% 600% TOTAL 5,991 12,496 100% 100% 109%
Country: Italy Country: JapanTotal no. of decisions Total no. of decisions
Total % Change Total % ChangeOrigin 1999 2000 1999 2000 (%) Origin 1999 2000 1999 2000 (%)IRQ 2,226 5,664 27% 23% 154% PAK 26 76 12% 29% 192%TUR 719 3,578 9% 14% 398% MYA 30 55 14% 21% 83%AFG 67 351 1% 1% 424% AFG 27 26 12% 10% -4%IRN 108 206 1% 1% 91% IRN 27 19 12% 7% -30%ALB 82 136 1% 1% 66% ETH 18 16 8% 6% -11%RUS 14 127 0% 1% 807% SUD 16 15 7% 6% -6%COB 67 124 1% 0% 85% CHI 12 15 5% 6% 25%ROM - 116 0% 0% .. LKA 5 10 2% 4% 100%SOM 5 87 0% 0% 1640% TUR 20 10 9% 4% -50%COD 39 86 0% 0% 121% SRV - * 0% 2% ..OTH 5,004 14,525 60% 58% 190% OTH 39 14 18% 5% -64%TOTAL 8,331 25,000 100% 100% 200% TOTAL 220 260 100% 100% 18%
PAGE 42/46
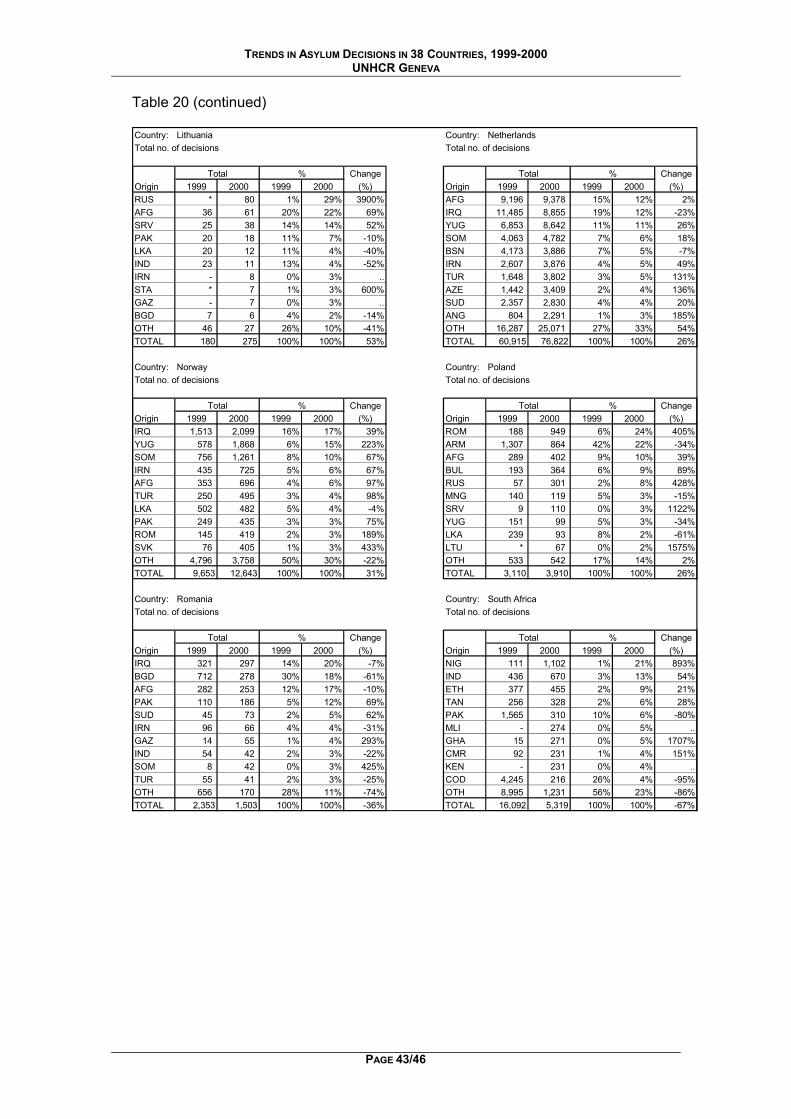
TRENDS IN ASYLUM DECISIONS IN 38 COUNTRIES, 1999-2000 UNHCR GENEVA
Table 20 (continued) Country: Lithuania Country: NetherlandsTotal no. of decisions Total no. of decisions
Total % Change Total % ChangeOrigin 1999 2000 1999 2000 (%) Origin 1999 2000 1999 2000 (%)RUS * 80 1% 29% 3900% AFG 9,196 9,378 15% 12% 2%AFG 36 61 20% 22% 69% IRQ 11,485 8,855 19% 12% -23%SRV 25 38 14% 14% 52% YUG 6,853 8,642 11% 11% 26%PAK 20 18 11% 7% -10% SOM 4,063 4,782 7% 6% 18%LKA 20 12 11% 4% -40% BSN 4,173 3,886 7% 5% -7%IND 23 11 13% 4% -52% IRN 2,607 3,876 4% 5% 49%IRN - 8 0% 3% .. TUR 1,648 3,802 3% 5% 131%STA * 7 1% 3% 600% AZE 1,442 3,409 2% 4% 136%GAZ - 7 0% 3% .. SUD 2,357 2,830 4% 4% 20%BGD 7 6 4% 2% -14% ANG 804 2,291 1% 3% 185%OTH 46 27 26% 10% -41% OTH 16,287 25,071 27% 33% 54%TOTAL 180 275 100% 100% 53% TOTAL 60,915 76,822 100% 100% 26%
Country: Norway Country: PolandTotal no. of decisions Total no. of decisions
Total % Change Total % ChangeOrigin 1999 2000 1999 2000 (%) Origin 1999 2000 1999 2000 (%)IRQ 1,513 2,099 16% 17% 39% ROM 188 949 6% 24% 405%YUG 578 1,868 6% 15% 223% ARM 1,307 864 42% 22% -34%SOM 756 1,261 8% 10% 67% AFG 289 402 9% 10% 39%IRN 435 725 5% 6% 67% BUL 193 364 6% 9% 89%AFG 353 696 4% 6% 97% RUS 57 301 2% 8% 428%TUR 250 495 3% 4% 98% MNG 140 119 5% 3% -15%LKA 502 482 5% 4% -4% SRV 9 110 0% 3% 1122%PAK 249 435 3% 3% 75% YUG 151 99 5% 3% -34%ROM 145 419 2% 3% 189% LKA 239 93 8% 2% -61%SVK 76 405 1% 3% 433% LTU * 67 0% 2% 1575%OTH 4,796 3,758 50% 30% -22% OTH 533 542 17% 14% 2%TOTAL 9,653 12,643 100% 100% 31% TOTAL 3,110 3,910 100% 100% 26%
Country: Romania Country: South AfricaTotal no. of decisions Total no. of decisions
Total % Change Total % ChangeOrigin 1999 2000 1999 2000 (%) Origin 1999 2000 1999 2000 (%)IRQ 321 297 14% 20% -7% NIG 111 1,102 1% 21% 893%BGD 712 278 30% 18% -61% IND 436 670 3% 13% 54%AFG 282 253 12% 17% -10% ETH 377 455 2% 9% 21%PAK 110 186 5% 12% 69% TAN 256 328 2% 6% 28%SUD 45 73 2% 5% 62% PAK 1,565 310 10% 6% -80%IRN 96 66 4% 4% -31% MLI - 274 0% 5% ..GAZ 14 55 1% 4% 293% GHA 15 271 0% 5% 1707%IND 54 42 2% 3% -22% CMR 92 231 1% 4% 151%SOM 8 42 0% 3% 425% KEN - 231 0% 4% ..TUR 55 41 2% 3% -25% COD 4,245 216 26% 4% -95%OTH 656 170 28% 11% -74% OTH 8,995 1,231 56% 23% -86%TOTAL 2,353 1,503 100% 100% -36% TOTAL 16,092 5,319 100% 100% -67%
PAGE 43/46
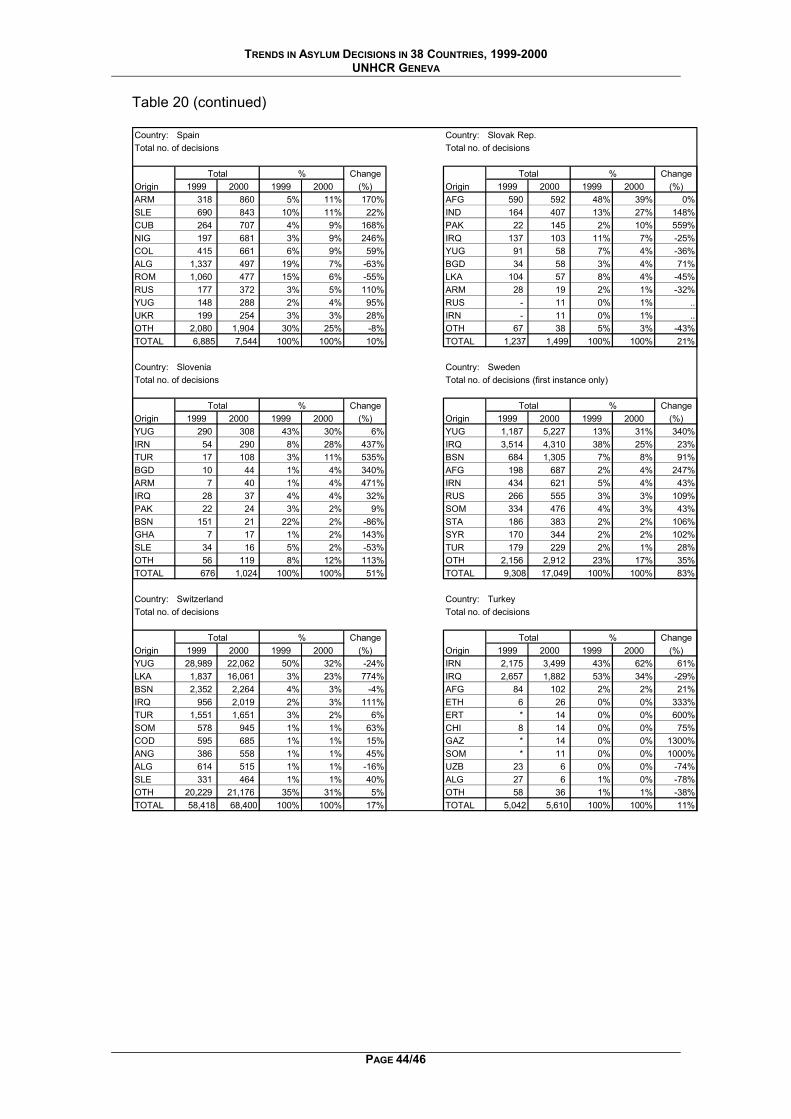
TRENDS IN ASYLUM DECISIONS IN 38 COUNTRIES, 1999-2000 UNHCR GENEVA
Table 20 (continued) Country: Spain Country: Slovak Rep.Total no. of decisions Total no. of decisions
Total % Change Total % ChangeOrigin 1999 2000 1999 2000 (%) Origin 1999 2000 1999 2000 (%)ARM 318 860 5% 11% 170% AFG 590 592 48% 39% 0%SLE 690 843 10% 11% 22% IND 164 407 13% 27% 148%CUB 264 707 4% 9% 168% PAK 22 145 2% 10% 559%NIG 197 681 3% 9% 246% IRQ 137 103 11% 7% -25%COL 415 661 6% 9% 59% YUG 91 58 7% 4% -36%ALG 1,337 497 19% 7% -63% BGD 34 58 3% 4% 71%ROM 1,060 477 15% 6% -55% LKA 104 57 8% 4% -45%RUS 177 372 3% 5% 110% ARM 28 19 2% 1% -32%YUG 148 288 2% 4% 95% RUS - 11 0% 1% ..UKR 199 254 3% 3% 28% IRN - 11 0% 1% ..OTH 2,080 1,904 30% 25% -8% OTH 67 38 5% 3% -43%TOTAL 6,885 7,544 100% 100% 10% TOTAL 1,237 1,499 100% 100% 21%
Country: Slovenia Country: SwedenTotal no. of decisions Total no. of decisions (first instance only)
Total % Change Total % ChangeOrigin 1999 2000 1999 2000 (%) Origin 1999 2000 1999 2000 (%)YUG 290 308 43% 30% 6% YUG 1,187 5,227 13% 31% 340%IRN 54 290 8% 28% 437% IRQ 3,514 4,310 38% 25% 23%TUR 17 108 3% 11% 535% BSN 684 1,305 7% 8% 91%BGD 10 44 1% 4% 340% AFG 198 687 2% 4% 247%ARM 7 40 1% 4% 471% IRN 434 621 5% 4% 43%IRQ 28 37 4% 4% 32% RUS 266 555 3% 3% 109%PAK 22 24 3% 2% 9% SOM 334 476 4% 3% 43%BSN 151 21 22% 2% -86% STA 186 383 2% 2% 106%GHA 7 17 1% 2% 143% SYR 170 344 2% 2% 102%SLE 34 16 5% 2% -53% TUR 179 229 2% 1% 28%OTH 56 119 8% 12% 113% OTH 2,156 2,912 23% 17% 35%TOTAL 676 1,024 100% 100% 51% TOTAL 9,308 17,049 100% 100% 83%
Country: Switzerland Country: TurkeyTotal no. of decisions Total no. of decisions
Total % Change Total % ChangeOrigin 1999 2000 1999 2000 (%) Origin 1999 2000 1999 2000 (%)YUG 28,989 22,062 50% 32% -24% IRN 2,175 3,499 43% 62% 61%LKA 1,837 16,061 3% 23% 774% IRQ 2,657 1,882 53% 34% -29%BSN 2,352 2,264 4% 3% -4% AFG 84 102 2% 2% 21%IRQ 956 2,019 2% 3% 111% ETH 6 26 0% 0% 333%TUR 1,551 1,651 3% 2% 6% ERT * 14 0% 0% 600%SOM 578 945 1% 1% 63% CHI 8 14 0% 0% 75%COD 595 685 1% 1% 15% GAZ * 14 0% 0% 1300%ANG 386 558 1% 1% 45% SOM * 11 0% 0% 1000%ALG 614 515 1% 1% -16% UZB 23 6 0% 0% -74%SLE 331 464 1% 1% 40% ALG 27 6 1% 0% -78%OTH 20,229 21,176 35% 31% 5% OTH 58 36 1% 1% -38%TOTAL 58,418 68,400 100% 100% 17% TOTAL 5,042 5,610 100% 100% 11%
PAGE 44/46
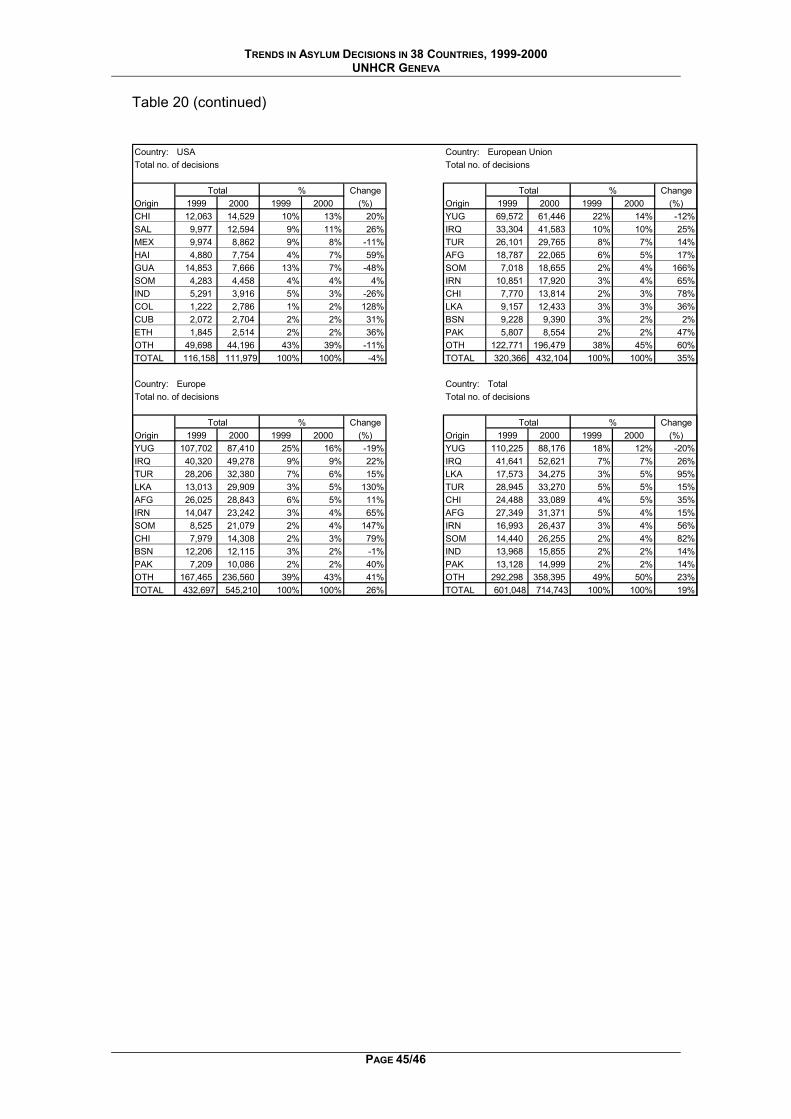
TRENDS IN ASYLUM DECISIONS IN 38 COUNTRIES, 1999-2000 UNHCR GENEVA
Table 20 (continued) Country: USA Country: European UnionTotal no. of decisions Total no. of decisions
Total % Change Total % ChangeOrigin 1999 2000 1999 2000 (%) Origin 1999 2000 1999 2000 (%)CHI 12,063 14,529 10% 13% 20% YUG 69,572 61,446 22% 14% -12%SAL 9,977 12,594 9% 11% 26% IRQ 33,304 41,583 10% 10% 25%MEX 9,974 8,862 9% 8% -11% TUR 26,101 29,765 8% 7% 14%HAI 4,880 7,754 4% 7% 59% AFG 18,787 22,065 6% 5% 17%GUA 14,853 7,666 13% 7% -48% SOM 7,018 18,655 2% 4% 166%SOM 4,283 4,458 4% 4% 4% IRN 10,851 17,920 3% 4% 65%IND 5,291 3,916 5% 3% -26% CHI 7,770 13,814 2% 3% 78%COL 1,222 2,786 1% 2% 128% LKA 9,157 12,433 3% 3% 36%CUB 2,072 2,704 2% 2% 31% BSN 9,228 9,390 3% 2% 2%ETH 1,845 2,514 2% 2% 36% PAK 5,807 8,554 2% 2% 47%OTH 49,698 44,196 43% 39% -11% OTH 122,771 196,479 38% 45% 60%TOTAL 116,158 111,979 100% 100% -4% TOTAL 320,366 432,104 100% 100% 35%
Country: Europe Country: TotalTotal no. of decisions Total no. of decisions
Total % Change Total % ChangeOrigin 1999 2000 1999 2000 (%) Origin 1999 2000 1999 2000 (%)YUG 107,702 87,410 25% 16% -19% YUG 110,225 88,176 18% 12% -20%IRQ 40,320 49,278 9% 9% 22% IRQ 41,641 52,621 7% 7% 26%TUR 28,206 32,380 7% 6% 15% LKA 17,573 34,275 3% 5% 95%LKA 13,013 29,909 3% 5% 130% TUR 28,945 33,270 5% 5% 15%AFG 26,025 28,843 6% 5% 11% CHI 24,488 33,089 4% 5% 35%IRN 14,047 23,242 3% 4% 65% AFG 27,349 31,371 5% 4% 15%SOM 8,525 21,079 2% 4% 147% IRN 16,993 26,437 3% 4% 56%CHI 7,979 14,308 2% 3% 79% SOM 14,440 26,255 2% 4% 82%BSN 12,206 12,115 3% 2% -1% IND 13,968 15,855 2% 2% 14%PAK 7,209 10,086 2% 2% 40% PAK 13,128 14,999 2% 2% 14%OTH 167,465 236,560 39% 43% 41% OTH 292,298 358,395 49% 50% 23%TOTAL 432,697 545,210 100% 100% 26% TOTAL 601,048 714,743 100% 100% 19%
PAGE 45/46
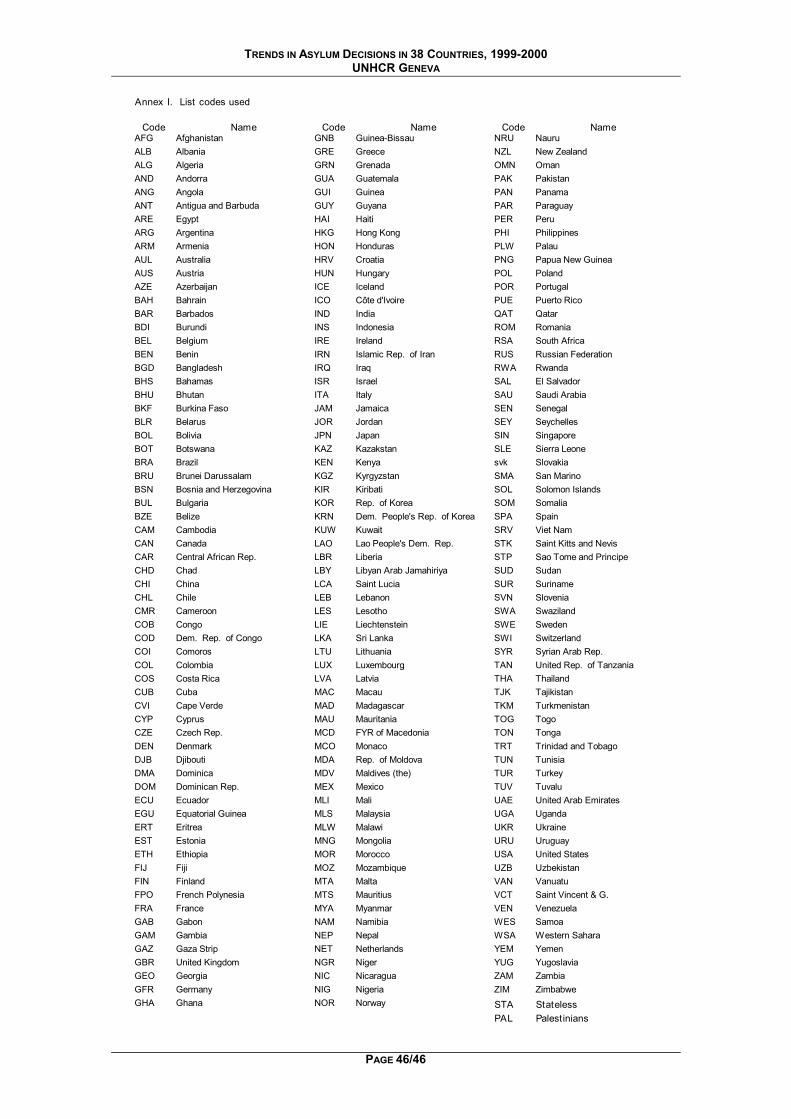
TRENDS IN ASYLUM DECISIONS IN 38 COUNTRIES, 1999-2000 UNHCR GENEVA
Annex I. List codes used
Code Name Code Name Code NameAFG Afghanistan GNB Guinea-Bissau NRU NauruALB Albania GRE Greece NZL New ZealandALG Algeria GRN Grenada OMN OmanAND Andorra GUA Guatemala PAK PakistanANG Angola GUI Guinea PAN PanamaANT Antigua and Barbuda GUY Guyana PAR ParaguayARE Egypt HAI Haiti PER PeruARG Argentina HKG Hong Kong PHI PhilippinesARM Armenia HON Honduras PLW PalauAUL Australia HRV Croatia PNG Papua New GuineaAUS Austria HUN Hungary POL PolandAZE Azerbaijan ICE Iceland POR PortugalBAH Bahrain ICO Côte d'Ivoire PUE Puerto RicoBAR Barbados IND India QAT QatarBDI Burundi INS Indonesia ROM RomaniaBEL Belgium IRE Ireland RSA South AfricaBEN Benin IRN Islamic Rep. of Iran RUS Russian FederationBGD Bangladesh IRQ Iraq RWA RwandaBHS Bahamas ISR Israel SAL El SalvadorBHU Bhutan ITA Italy SAU Saudi ArabiaBKF Burkina Faso JAM Jamaica SEN SenegalBLR Belarus JOR Jordan SEY SeychellesBOL Bolivia JPN Japan SIN SingaporeBOT Botswana KAZ Kazakstan SLE Sierra LeoneBRA Brazil KEN Kenya svk SlovakiaBRU Brunei Darussalam KGZ Kyrgyzstan SMA San MarinoBSN Bosnia and Herzegovina KIR Kiribati SOL Solomon IslandsBUL Bulgaria KOR Rep. of Korea SOM SomaliaBZE Belize KRN Dem. People's Rep. of Korea SPA SpainCAM Cambodia KUW Kuwait SRV Viet Nam CAN Canada LAO Lao People's Dem. Rep. STK Saint Kitts and NevisCAR Central African Rep. LBR Liberia STP Sao Tome and PrincipeCHD Chad LBY Libyan Arab Jamahiriya SUD SudanCHI China LCA Saint Lucia SUR SurinameCHL Chile LEB Lebanon SVN SloveniaCMR Cameroon LES Lesotho SWA SwazilandCOB Congo LIE Liechtenstein SWE SwedenCOD Dem. Rep. of Congo LKA Sri Lanka SWI SwitzerlandCOI Comoros LTU Lithuania SYR Syrian Arab Rep. COL Colombia LUX Luxembourg TAN United Rep. of TanzaniaCOS Costa Rica LVA Latvia THA ThailandCUB Cuba MAC Macau TJK TajikistanCVI Cape Verde MAD Madagascar TKM TurkmenistanCYP Cyprus MAU Mauritania TOG TogoCZE Czech Rep. MCD FYR of Macedonia TON TongaDEN Denmark MCO Monaco TRT Trinidad and TobagoDJB Djibouti MDA Rep. of Moldova TUN TunisiaDMA Dominica MDV Maldives (the) TUR TurkeyDOM Dominican Rep. MEX Mexico TUV TuvaluECU Ecuador MLI Mali UAE United Arab EmiratesEGU Equatorial Guinea MLS Malaysia UGA UgandaERT Eritrea MLW Malawi UKR UkraineEST Estonia MNG Mongolia URU UruguayETH Ethiopia MOR Morocco USA United StatesFIJ Fiji MOZ Mozambique UZB UzbekistanFIN Finland MTA Malta VAN VanuatuFPO French Polynesia MTS Mauritius VCT Saint Vincent & G.FRA France MYA Myanmar VEN VenezuelaGAB Gabon NAM Namibia WES SamoaGAM Gambia NEP Nepal WSA Western SaharaGAZ Gaza Strip NET Netherlands YEM YemenGBR United Kingdom NGR Niger YUG YugoslaviaGEO Georgia NIC Nicaragua ZAM ZambiaGFR Germany NIG Nigeria ZIM ZimbabweGHA Ghana NOR Norway STA Stateless
PAL Palestinians
PAGE 46/46
Related Documents