Kansas Kansas 2006 Travel & Tourism Trends 2006 Travel & Tourism Trends October,2006 October,2006

Travel & Tourism Trends
Mar 28, 2016
Travel and tourism trends.
Welcome message from author
This document is posted to help you gain knowledge. Please leave a comment to let me know what you think about it! Share it to your friends and learn new things together.
Transcript

KansasKansas2006 Travel & Tourism Trends 2006 Travel & Tourism Trends
October,2006October,2006

20062006
2006 will be good - - finally 2006 will be good - - finally outpacing 2000 levels - - but it outpacing 2000 levels - - but it is a completely different world*is a completely different world*
*major behavior change*major behavior change will affect our future will affect our future
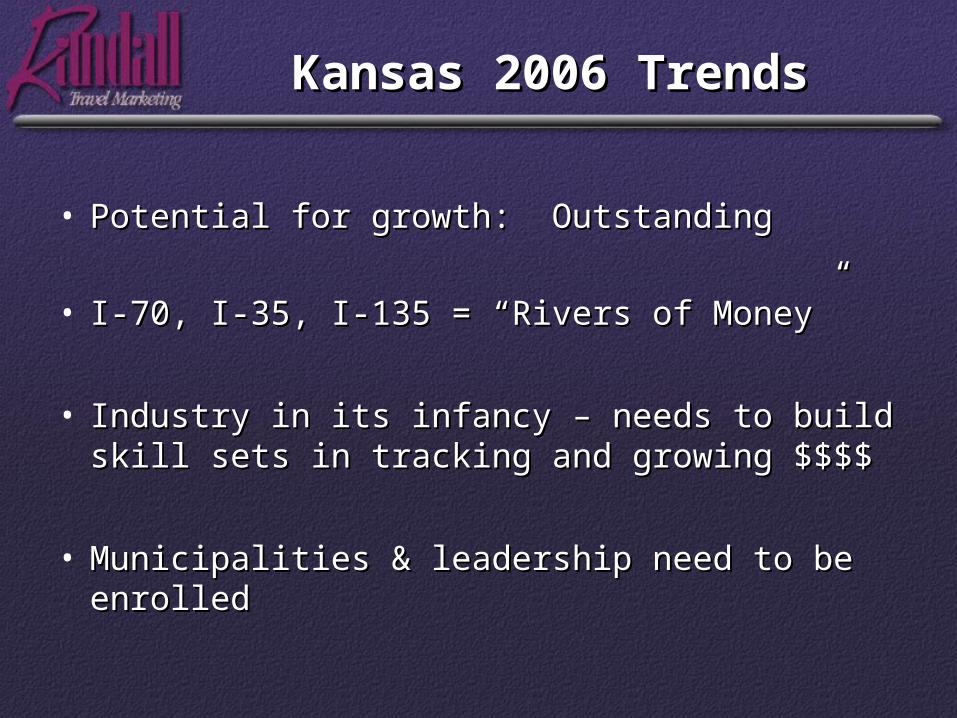
Kansas 2006 TrendsKansas 2006 Trends
• Potential for growth: OutstandingPotential for growth: Outstanding
• I-70, I-35, I-135 = “Rivers of Money”I-70, I-35, I-135 = “Rivers of Money”
• Industry in its infancy – needs to build skill Industry in its infancy – needs to build skill sets in tracking and growing $$$$sets in tracking and growing $$$$
• Municipalities & leadership need to be Municipalities & leadership need to be enrolledenrolled
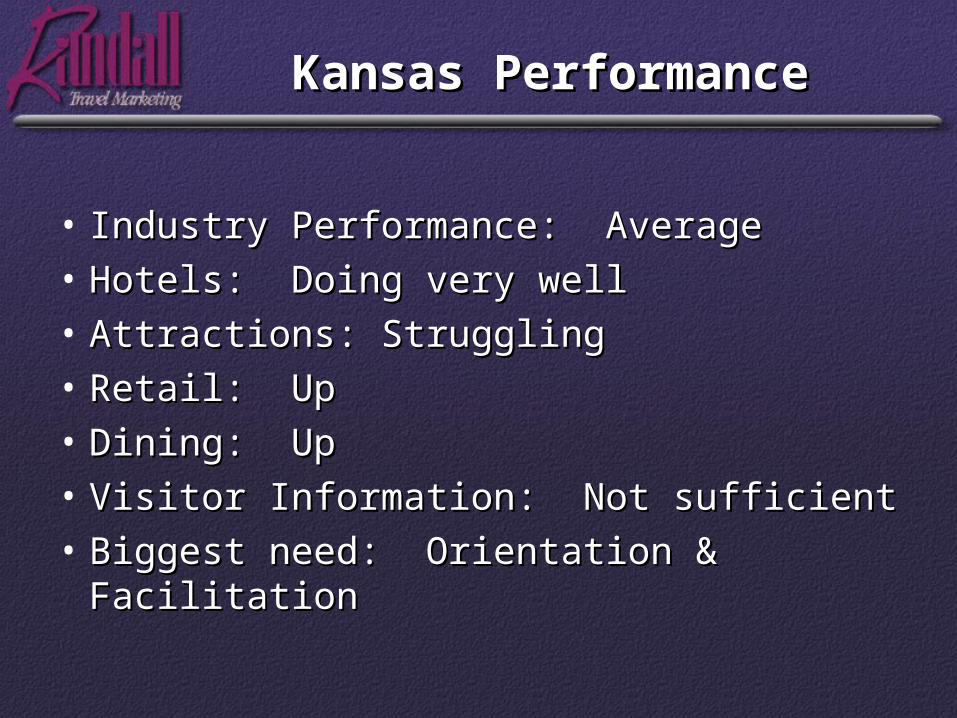
Kansas PerformanceKansas Performance
• Industry Performance: AverageIndustry Performance: Average• Hotels: Doing very wellHotels: Doing very well• Attractions: StrugglingAttractions: Struggling• Retail: UpRetail: Up• Dining: UpDining: Up• Visitor Information: Not sufficientVisitor Information: Not sufficient• Biggest need: Orientation & Biggest need: Orientation &
FacilitationFacilitation
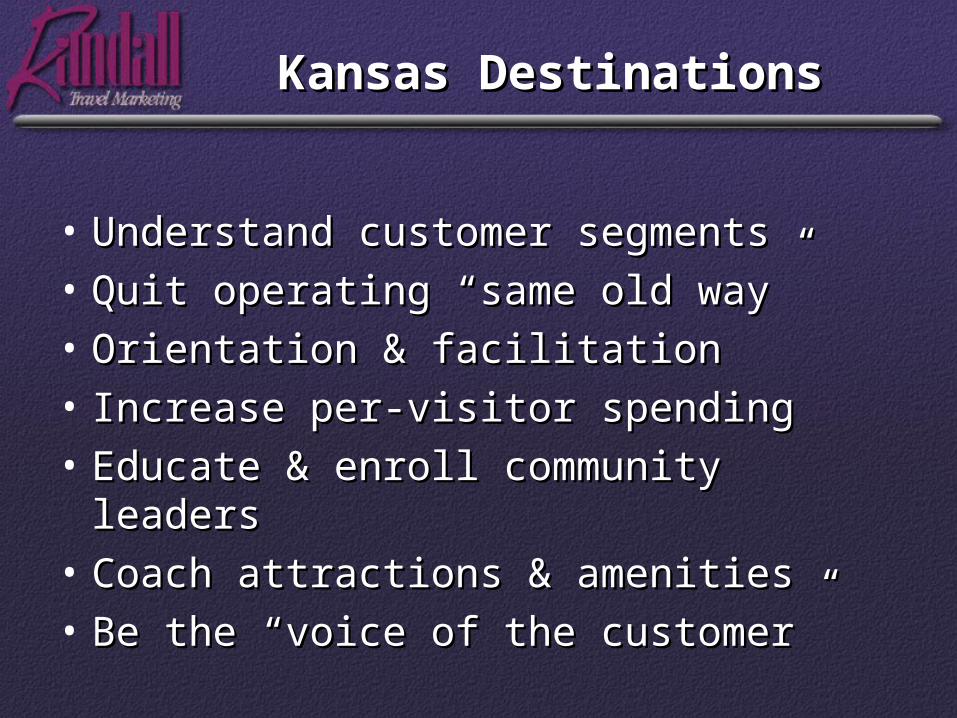
Kansas DestinationsKansas Destinations
• Understand customer segmentsUnderstand customer segments• Quit operating “same old way” Quit operating “same old way” • Orientation & facilitationOrientation & facilitation• Increase per-visitor spendingIncrease per-visitor spending• Educate & enroll community leadersEducate & enroll community leaders• Coach attractions & amenitiesCoach attractions & amenities• Be the “voice of the customer” Be the “voice of the customer”
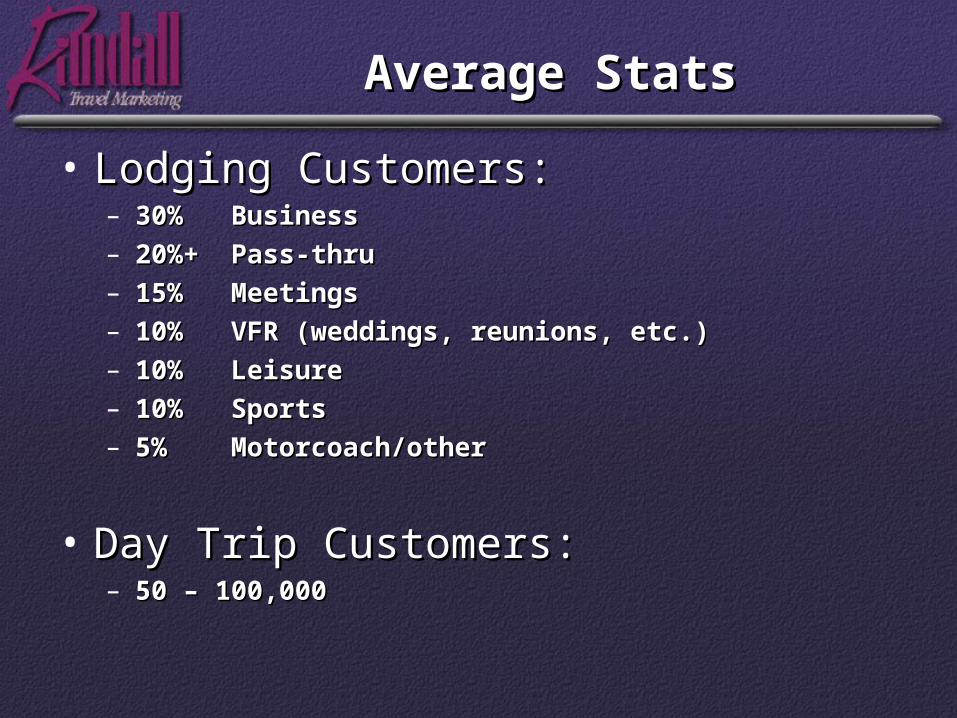
Average StatsAverage Stats• Lodging Customers: Lodging Customers:
– 30% 30% BusinessBusiness– 20%+ 20%+ Pass-thruPass-thru– 15%15% MeetingsMeetings– 10%10% VFR (weddings, reunions, etc.)VFR (weddings, reunions, etc.)– 10%10% LeisureLeisure– 10%10% SportsSports– 5%5% Motorcoach/other Motorcoach/other
• Day Trip Customers: Day Trip Customers: – 50 – 100,00050 – 100,000

Average StatsAverage Stats• Lodging Customers – Daily Expenditures: Lodging Customers – Daily Expenditures:
$ 60 $ 60 HotelHotel$ 50$ 50 FoodFood$ 30$ 30 Gas/TransportationGas/Transportation$ 50$ 50 RetailRetail$ 5$ 5 Attractions/AmusementsAttractions/Amusements$195$195 TOTALTOTAL
• Day Trip Customers - Daily Expenditures: Day Trip Customers - Daily Expenditures: $ 0$ 0 HotelHotel$ 30$ 30 Gas/TransportationGas/Transportation$ 20$ 20 FoodFood$ 30$ 30 RetailRetail$ 5$ 5 Attractions/AmusementsAttractions/Amusements$85$85 TOTALTOTAL

Average StatsAverage Stats
• Lodging: Average 600 rooms Lodging: Average 600 rooms 600 x 365 = 219,000 available rooms nights600 x 365 = 219,000 available rooms nightsx 60% = 131,000 sold rooms nightx 60% = 131,000 sold rooms nightx $195 = $25,623,000x $195 = $25,623,000
• Day Trip Customers - Daily Expenditures:Day Trip Customers - Daily Expenditures:100,000 total day trippers100,000 total day trippersx $85 = $8,500,000x $85 = $8,500,000
• $34,123,000 = Total Local Revenues $34,123,000 = Total Local Revenues
Tax ReliefTax Relief
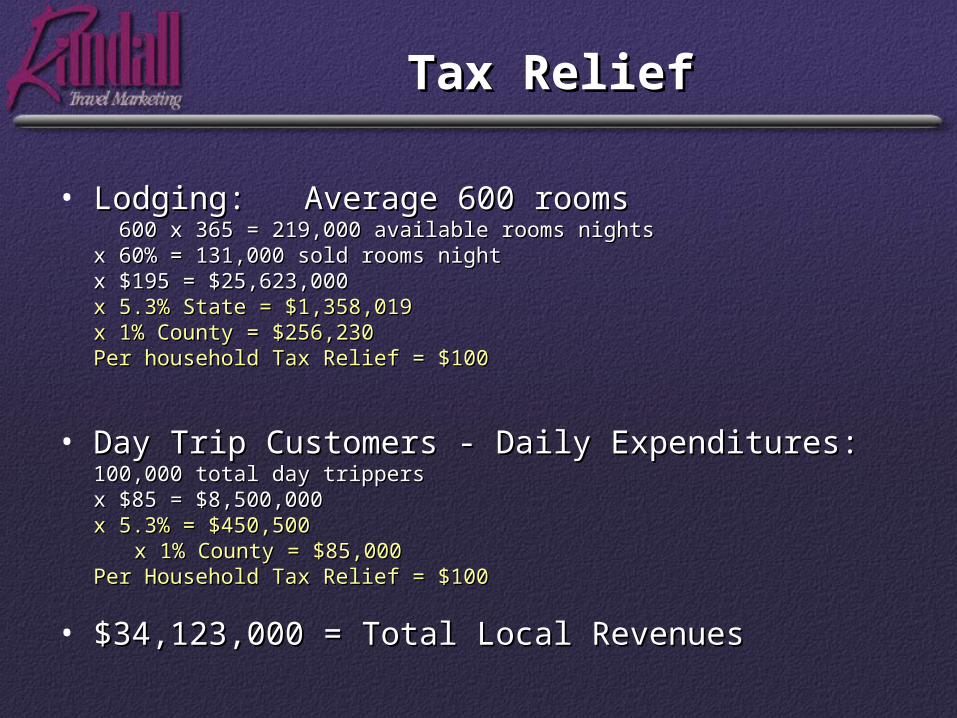
• Lodging: Average 600 rooms Lodging: Average 600 rooms 600 x 365 = 219,000 available rooms nights600 x 365 = 219,000 available rooms nightsx 60% = 131,000 sold rooms nightx 60% = 131,000 sold rooms nightx $195 = $25,623,000x $195 = $25,623,000x 5.3% State = $1,358,019x 5.3% State = $1,358,019x 1% County = $256,230x 1% County = $256,230Per household Tax Relief = $100Per household Tax Relief = $100
• Day Trip Customers - Daily Expenditures:Day Trip Customers - Daily Expenditures:100,000 total day trippers100,000 total day trippersx $85 = $8,500,000x $85 = $8,500,000x 5.3% = $450,500x 5.3% = $450,500
x 1% County = $85,000x 1% County = $85,000Per Household Tax Relief = $100Per Household Tax Relief = $100
• $34,123,000 = Total Local Revenues$34,123,000 = Total Local Revenues

Lodging Lodging
Data Source: Smith Travel Research STR Report
• RTM 2006 projection = 64.1% (plus growth in inventory)
2000 2001 2002 2003 2004 2005
USA Annual Occupancy
63.7%
60.3%59.1% 59.2%
61.3%
63.1%
56.0%
58.0%
60.0%
62.0%
64.0%
USA Annual Occupancy

Lodging - RevPARLodging - RevPAR
Source: Smith Travel Research STR Report
0.0%2.0%4.0%6.0%8.0%
10.0%12.0%14.0%
RevPAR Annual Growth
2004
2005
2006

Lodging in KansasLodging in Kansas
• % of local lodging by age & type% of local lodging by age & type• Management of aging inventoryManagement of aging inventory• Recruitment of high end propertiesRecruitment of high end properties• Day-to-day relationship with hoteliersDay-to-day relationship with hoteliers• Smith Travel Report STRSmith Travel Report STR• Know their businessKnow their business

Lodging TrendsLodging Trends

AirlinesAirlines
Source: Air Transport Association
• Prices still WAY below 2000 levels • Losses in 2005: $10 Billion
– U.S. Fleet 20% smaller – 160,000 jobs cut since 2000
• Perhaps break even in 2006
-10.0%-8.0%-6.0%-4.0%-2.0%0.0%2.0%4.0%6.0%
2000 2001 2002 2003 2004 2005
Passenger Volume Annual Growth/Loss

Kansas Air VisitorsKansas Air Visitors
• Know what % of your visitors include Know what % of your visitors include air air
• Know where they get information for Know where they get information for trip planningtrip planning
• Orientation & FacilitationOrientation & Facilitation
Cruise IndustryCruise Industry
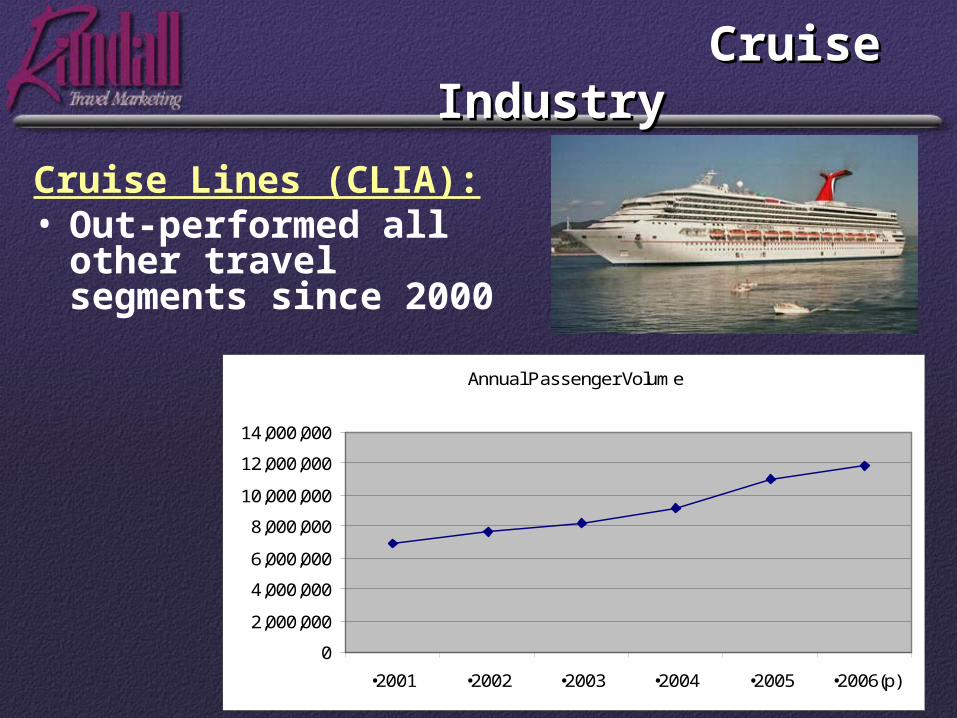
Cruise Lines (CLIA): • Out-performed all
other travel segments since 2000
Annual Passenger Volume
0
2,000,000
4,000,000
6,000,000
8,000,000
10,000,000
12,000,000
14,000,000
•2001 •2002 •2003 •2004 •2005 •2006(p)
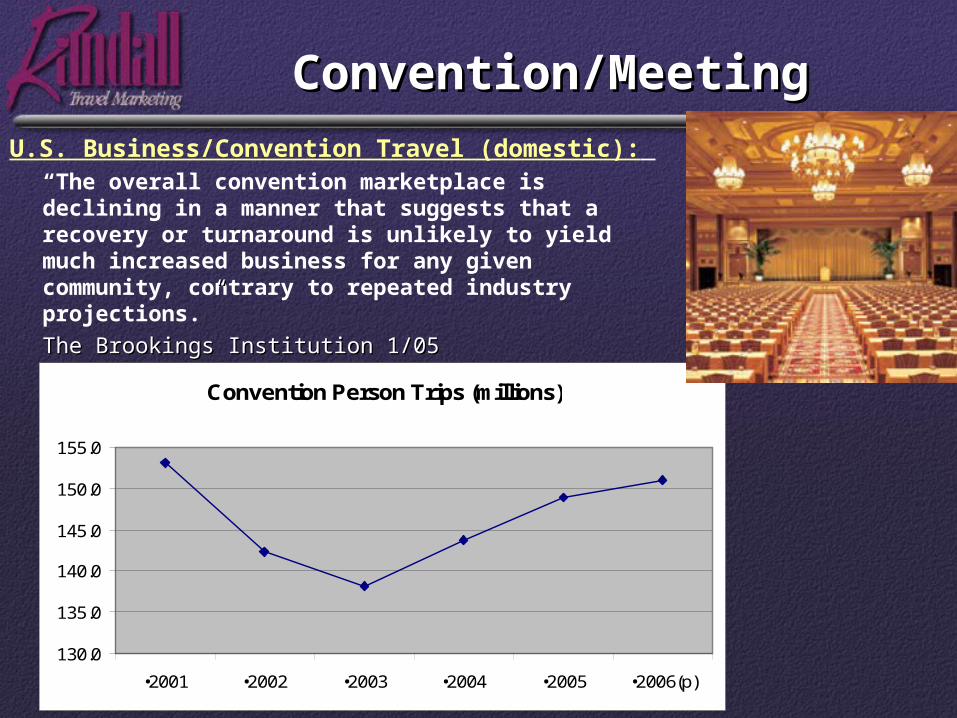
Convention/MeetingConvention/MeetingU.S. Business/Convention Travel (domestic):
“The overall convention marketplace is declining in a manner that suggests that a recovery or turnaround is unlikely to yield much increased business for any given community, contrary to repeated industry projections.” ” The Brookings Institution 1/05The Brookings Institution 1/05
Convention Person Trips (millions)
130.0
135.0
140.0
145.0
150.0
155.0
•2001 •2002 •2003 •2004 •2005 •2006(p)

Domestic LeisureDomestic LeisureU.S. Leisure Travel (domestic person trips)
(TIA): Increase has never faltered
Domestic Person Trips (millions)
840860880900920940960980
1,000
•2001 •2002 •2003 •2004 •2005 •2006(p)
Kansas Leisure Kansas Leisure TourismTourism
• “ “ Respite” …or part of longer trip….or Respite” …or part of longer trip….or shopping/dining/fun getaway shopping/dining/fun getaway
• Vacations demandedVacations demanded• Growth in family travelGrowth in family travel• Growth in affinity travelGrowth in affinity travel• Attendance to attractions downAttendance to attractions down• Shopping, dining, sightseeing Shopping, dining, sightseeing • Know your “Must Sees” and “Must Dos” Know your “Must Sees” and “Must Dos”

Kansas Leisure TripsKansas Leisure Trips
• Extend stay of passers-thruExtend stay of passers-thru• Increase per-visitor spendingIncrease per-visitor spending• Tell travelers the “Must Sees”Tell travelers the “Must Sees”• Attractions: Know your visitor Attractions: Know your visitor
segmentssegments• Target major feeder markets & pass-Target major feeder markets & pass-
thruthru• Be realistic Be realistic
AttractionsAttractions
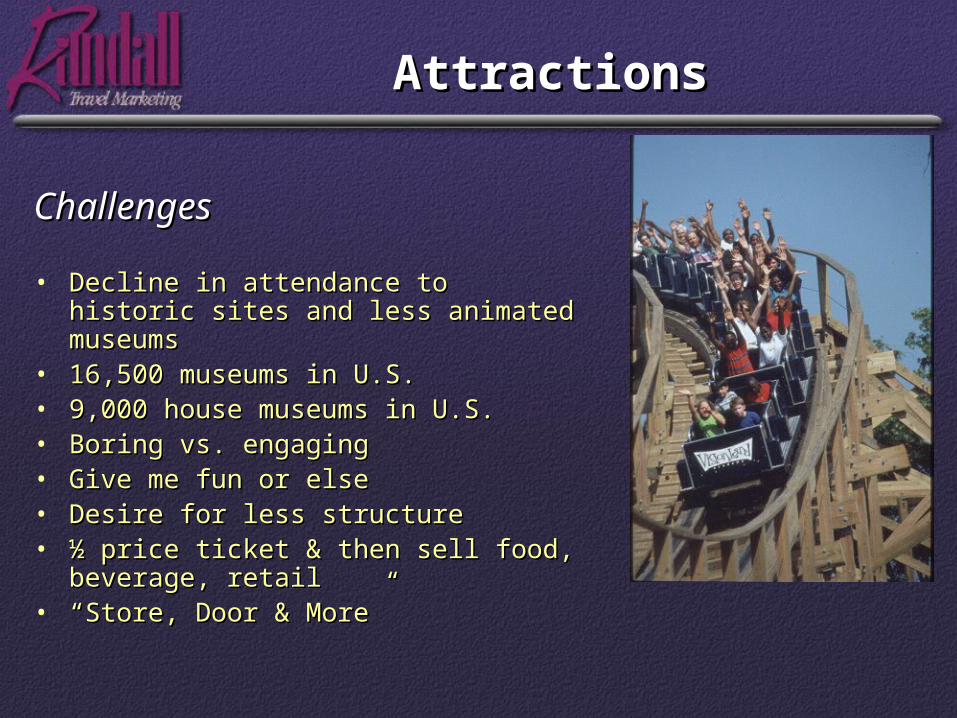
ChallengesChallenges • Decline in attendance to historic sites Decline in attendance to historic sites
and less animated museumsand less animated museums• 16,500 museums in U.S.16,500 museums in U.S.• 9,000 house museums in U.S.9,000 house museums in U.S.• Boring vs. engagingBoring vs. engaging• Give me fun or elseGive me fun or else• Desire for less structureDesire for less structure• ½ price ticket & then sell food, ½ price ticket & then sell food,
beverage, retailbeverage, retail• ““Store, Door & More” Store, Door & More”
AttractionsAttractions
• Expect decrease in attendance – track statsExpect decrease in attendance – track stats• Know your customer segments Know your customer segments • Orientation & FacilitationOrientation & Facilitation• Gift Shop $$$$Gift Shop $$$$• More connection with each visitor – rate their More connection with each visitor – rate their
satisfaction satisfaction • More $$$ per customerMore $$$ per customer• ““Store, Door & More” Store, Door & More” • Open in the evenings – unique programming Open in the evenings – unique programming
in evenings in evenings
Consumer Confidence Consumer Confidence IndexIndex
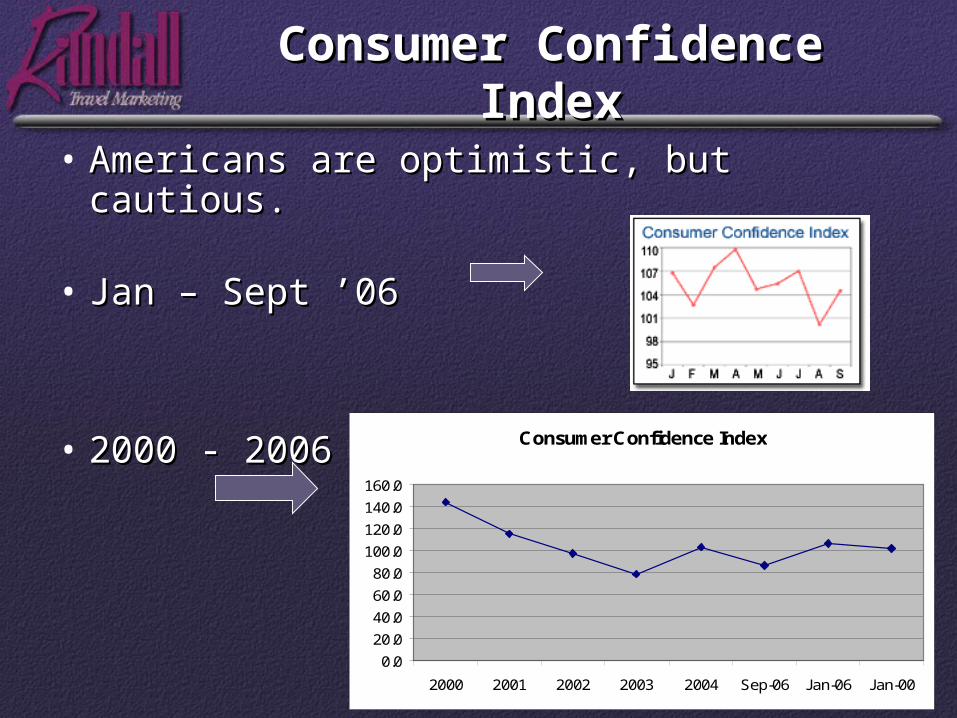
• Americans are optimistic, but cautious.Americans are optimistic, but cautious.
• Jan – Sept ’06Jan – Sept ’06
• 2000 - 20062000 - 2006 Consumer Confidence Index
0.020.040.060.080.0
100.0120.0140.0160.0
2000 2001 2002 2003 2004 Sep-06 Jan-06 Jan-00
Business TravelBusiness Travel
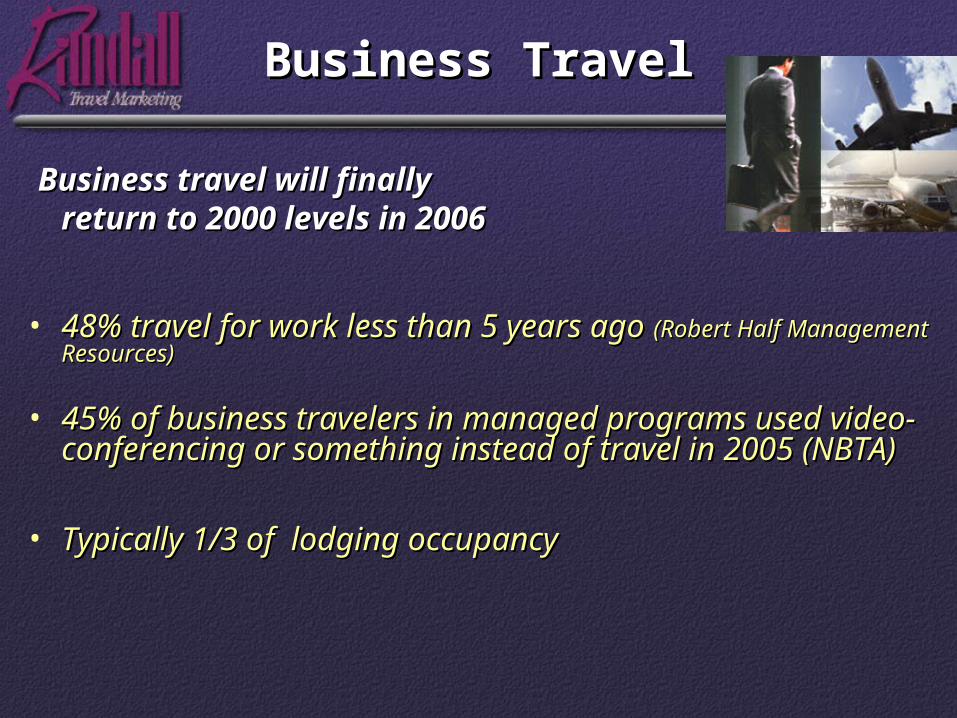
Business travel will finally Business travel will finally return to 2000 levels in 2006return to 2000 levels in 2006
• 48% travel for work less than 5 years ago 48% travel for work less than 5 years ago (Robert Half (Robert Half Management Resources)Management Resources)
• 45% of business travelers in managed programs used 45% of business travelers in managed programs used video-conferencing or something instead of travel in video-conferencing or something instead of travel in 2005 (NBTA)2005 (NBTA)
• Typically 1/3 of lodging occupancyTypically 1/3 of lodging occupancy
Kansas Business Kansas Business TravelTravel
• Know your statisticsKnow your statistics– % Men vs. Women% Men vs. Women
• What is open after 5:00PM? What is open after 5:00PM?
• What do they need to know? What do they need to know?
• How can you increase their spending?How can you increase their spending?

Group TourGroup Tour
Great PotentialGreat Potential • Affinity, affinity, affinity• Customized tours increased from 14% of biz to 56% in
2005 (USTOA)• “Gone are the days of the sold-out per capita tour”• Custom designed for Baby Boomers or other age
groups (Dr. on board)• Freedom without the hassle• Cruise ship on land• Something you can’t get any other way• Wireless on board & other tech• Huge growth in student travel – now 25% of
international travel (SYTA)

Kansas MotorcoachKansas Motorcoach
• Affinity, affinity, affinityAffinity, affinity, affinity
• Good, mid-priced mealGood, mid-priced meal
• Evening entertainmentEvening entertainment
• Part of longer trip Part of longer trip

TOP Ten Trends 2006TOP Ten Trends 2006
1. Growth in 20061. Growth in 2006 in overall travel & tourism in overall travel & tourism revenues revenues
• We must learn the new behavior patternsWe must learn the new behavior patterns

TOP Ten Trends 2006TOP Ten Trends 2006
2. Lodging: Setting new 2. Lodging: Setting new recordsrecords
Growth in high end Growth in high end out-paces growth out-paces growth in low end in low end
TOP Ten Trends 2006TOP Ten Trends 2006
3.3. Airlines: Light at the Airlines: Light at the end of end of
the tunnel the tunnel
TOP Ten Trends 2006TOP Ten Trends 2006
4. Business Travel: Controlled Growth
• Cost-contained travelCost-contained travel• Per-diem paid direct to employeePer-diem paid direct to employee• On-line deal searchingOn-line deal searching

TOP Ten Trends 2006TOP Ten Trends 2006
5. Demographics: Frontier of opportunity
• Develop “age-appeal” productsDevelop “age-appeal” products• Baby Boomers still best spendingBaby Boomers still best spending• Affinity groupsAffinity groups• Family groups Family groups

TOP Ten Trends 2006TOP Ten Trends 2006Changing demographics
Gen GroupGen Group 20002000 2005 2010 2020 2030 20402005 2010 2020 2030 2040War GenWar Gen 8080 85 85 90 90 95 95 100 100Silent GenSilent Gen 6565 70 70 75 75 85 85 95 95 105 105Baby BoomBaby Boom 4747 53 53 58 58 68 68 78 78 88 88
GenXGenX 2929 34 34 39 39 49 49 59 59 69 69Gen YGen Y 8 13 8 13 18 18 28 28 38 38 48 48
By 2010 ½ of all Americans will be over 40By 2010 ½ of all Americans will be over 40

TOP Ten Trends 2006TOP Ten Trends 2006
6.6. Consumers: Time Poverty Consumers: Time Poverty
• Over 30% expect to take fewer trips. Reason? Not able to Over 30% expect to take fewer trips. Reason? Not able to get away from work.get away from work.
• Nearly 50% of all Americans report “time poverty” - report Nearly 50% of all Americans report “time poverty” - report desire for all-inclusive to save time desire for all-inclusive to save time
(Yesawich, Pepperdine, Brown & Russell/Yankelovich)(Yesawich, Pepperdine, Brown & Russell/Yankelovich)
TOP Ten Trends 2006TOP Ten Trends 20067. Safety, personal comfort and
convenience are primary travel concerns
• Safety Safety • Less hassle / non-stressLess hassle / non-stress• Give me comfortableGive me comfortable• Up to 40% of decline in lodging Up to 40% of decline in lodging
occupancy related to safety and occupancy related to safety and convenienceconvenience (PricewaterhouseCoopers)(PricewaterhouseCoopers)

TOP Ten Trends 2006TOP Ten Trends 2006
8.8. Internet: Necessity Internet: Necessity
• 78% of Americans used the internet to 78% of Americans used the internet to find travel in 2005find travel in 2005
• By 2007 internet will account for 30% of By 2007 internet will account for 30% of total markettotal market
• Travel is #1 on-line purchase category Travel is #1 on-line purchase category
TOP Ten Trends 2005TOP Ten Trends 20059.9. Vacations: Vacations:
- Quick/short (4-5 day) - Quick/short (4-5 day) - PLUS Longer “sabbatical” - PLUS Longer “sabbatical”
vacations vacations • 4-5 short trips per year on avg.4-5 short trips per year on avg.• 2 weeks + But not every year 2 weeks + But not every year
• Traveler looking for products that simplify Traveler looking for products that simplify life or offer escape and luxury life or offer escape and luxury (Source: (Source: MarketResearch.com)MarketResearch.com)
TOP Ten Trends 2004TOP Ten Trends 2004
10. Custom-fitted travel
- Not a one-size fits all anymore
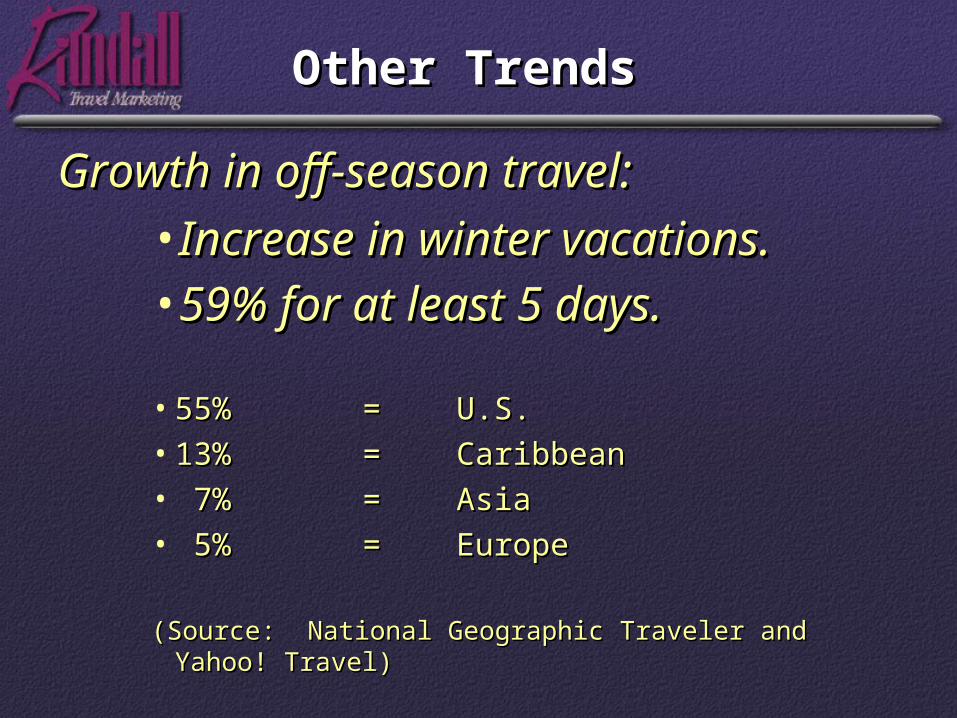
Other Trends Other Trends
Growth in off-season travel:Growth in off-season travel:•Increase in winter vacations. Increase in winter vacations. •59% for at least 5 days.59% for at least 5 days.
• 55%55% = = U.S.U.S.• 13%13% == CaribbeanCaribbean• 7%7% == AsiaAsia• 5%5% == EuropeEurope
(Source: National Geographic Traveler and Yahoo! (Source: National Geographic Traveler and Yahoo! Travel)Travel)

Other TrendsOther Trends
• Growth in RV market Growth in RV market (8 million Americans (8 million Americans
own RVs) own RVs)
• Traveling with pets –Traveling with pets –catering to petscatering to pets(14% of all Americans) (14% of all Americans)

Thriving in Thriving in 20062006
Research is the answer to grow with the new behavior patterns!
• Research as a foundationResearch as a foundation
• MUST know your MUST know your customer!customer!
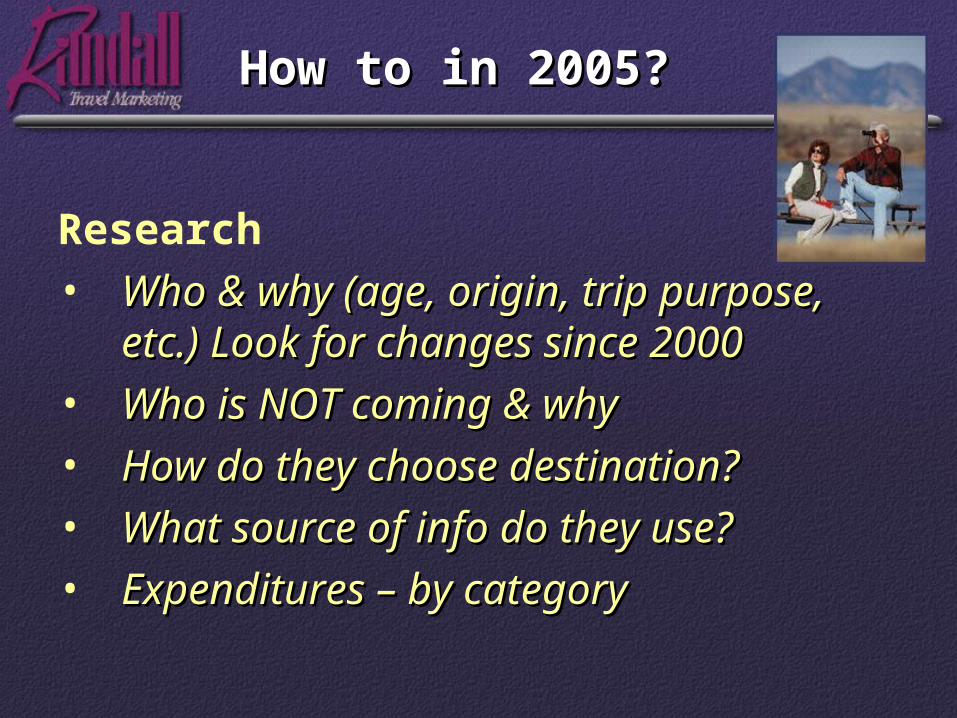
How to in 2005?How to in 2005?
Research• Who & why (age, origin, trip Who & why (age, origin, trip
purpose, etc.) Look for changes purpose, etc.) Look for changes since 2000since 2000
• Who is NOT coming & whyWho is NOT coming & why• How do they choose destination?How do they choose destination?• What source of info do they use?What source of info do they use?• Expenditures – by categoryExpenditures – by category

Critical Review Critical Review
Determine very strategically which Determine very strategically which market segments market segments
• you you cancan target target • that will that will reallyreally be satisfied be satisfied• and will and will spendspend the most. the most.
Kansas PrioritiesKansas Priorities
• Visitor GuideVisitor Guide• WebsiteWebsite• State travel guideState travel guide
• Print ads & billboards Print ads & billboards • PRPR• Maps Maps • In-room promotions In-room promotions
• ResearchResearch
• Drive product development (hotels, dining, Drive product development (hotels, dining, attractions, shopping)attractions, shopping)

Related Documents