Transition from Early Intervention to School Age Special Education: Data Report for FY11 Chapter 68 of the Acts of 2011, Line Item 7061-0012 November 2012 Massachusetts Department of Elementary and Secondary Education 75 Pleasant Street, Malden, MA 02148-4906 Phone 781-338-3000 TTY: N.E.T. Relay 800-439-2370 www.doe.mass.edu

Welcome message from author
This document is posted to help you gain knowledge. Please leave a comment to let me know what you think about it! Share it to your friends and learn new things together.
Transcript
Transition from Early Intervention to School Age Special Education: Data Report for FY11
Chapter 68 of the Acts of 2011, Line Item 7061-0012
November 2012
Massachusetts Department of Elementary and Secondary Education
75 Pleasant Street, Malden, MA 02148-4906
Phone 781-338-3000 TTY: N.E.T. Relay 800-439-2370
www.doe.mass.edu
This document was prepared by the
Massachusetts Department of Elementary and Secondary Education
Mitchell D. Chester, Ed.D.
Commissioner
Board of Elementary and Secondary Education Members
Ms. Maura Banta, Chair, Melrose
Ms. Beverly Holmes, Vice Chair, Springfield
Dr. Vanessa Calderón-Rosado, Milton
Ms. Harneen Chernow, Jamaica Plain
Mr. Gerald Chertavian, Cambridge
Mr. Matthew Gifford, Chair, Student Advisory Council, Brookline
Dr. Jeff Howard, Reading
Ms. Ruth Kaplan, Brookline
Dr. Dana Mohler-Faria, Bridgewater
Mr. Paul Reville, Secretary of Education, Worcester
Mr. David Roach, Sutton
Mitchell D. Chester, Ed.D., Commissioner and Secretary to the Board
The Massachusetts Department of Elementary and Secondary Education, an affirmative action employer, is committed to ensuring that
all of its programs and facilities are accessible to all members of the public.
We do not discriminate on the basis of age, color, disability, national origin, race, religion, sex or sexual orientation.
Inquiries regarding the Department’s compliance with Title IX and other civil rights laws may be directed to the
Human Resources Director, 75 Pleasant St., Malden, MA 02148-4906. Phone: 781-338-6105.
© 2012 Massachusetts Department of Elementary and Secondary Education
Permission is hereby granted to copy any or all parts of this document for non-commercial educational purposes. Please credit the
“Massachusetts Department of Elementary and Secondary Education.”
This document printed on recycled paper
Massachusetts Department of Elementary and Secondary Education
75 Pleasant Street, Malden, MA 02148-4906
Phone 781-338-3000 TTY: N.E.T. Relay 800-439-2370
www.doe.mass.edu
Massachusetts Department of Elementary and Secondary Education 75 Pleasant Street, Malden, Massachusetts 02148-4906 Telephone: (781) 338-3000 TTY: N.E.T. Relay 1-800-439-2370
Mitchell D. Chester, Ed.D. Commissioner
November 2012
Dear Members of the General Court:
I am pleased to submit this report, Transition from Early Intervention to School Age Special
Education: Data Report for FY11. In cooperation with the Massachusetts Department of Public
Health (DPH), the Department of Elementary and Secondary Education (the Department) is
required by Chapter 68 of the Acts of 2011, line item 7061-0012 to track and report on the
number of children receiving Early Intervention (EI) services and the number of those children
who later receive special education services.
At the time of this report, the confidentiality issues of two departments sharing student specific
information have precluded the Department from comparing child-specific information about
young children receiving EI services (from DPH data) and child-specific information about
young children after age three found eligible for special education (from the Department data).
Therefore, this report provides an overview of aggregate data from DPH and the Department
about the number of young children receiving early intervention (EI) services who exited from
EI in school year 2010-2011 (FY11); the number of those children who were determined to be
potentially eligible for special education services and referred by the EI program to the local
school districts for evaluation; and the number of young children who received an initial
evaluation to determine eligibility for special education services.
As new federal requirements for providing the Department with information about children
referred by EI programs to school districts for evaluation for special education eligibility are
implemented, the Department will be able to track and report this information with more
specificity.
If you have any questions about the report, please feel free to contact Marcia Mittnacht, State
Director for Special Education, at [email protected] or at 781-338-3375.
Sincerely,
Mitchell D. Chester, Ed.D.
Commissioner of Elementary and Secondary Education
Table of Contents
Introduction ................................................................................................................... 1
Federal Requirements for Early Intervention .............................................................. 2
FY11 Data ....................................................................................................................... 3
Appendix A .................................................................................................................... 8
1
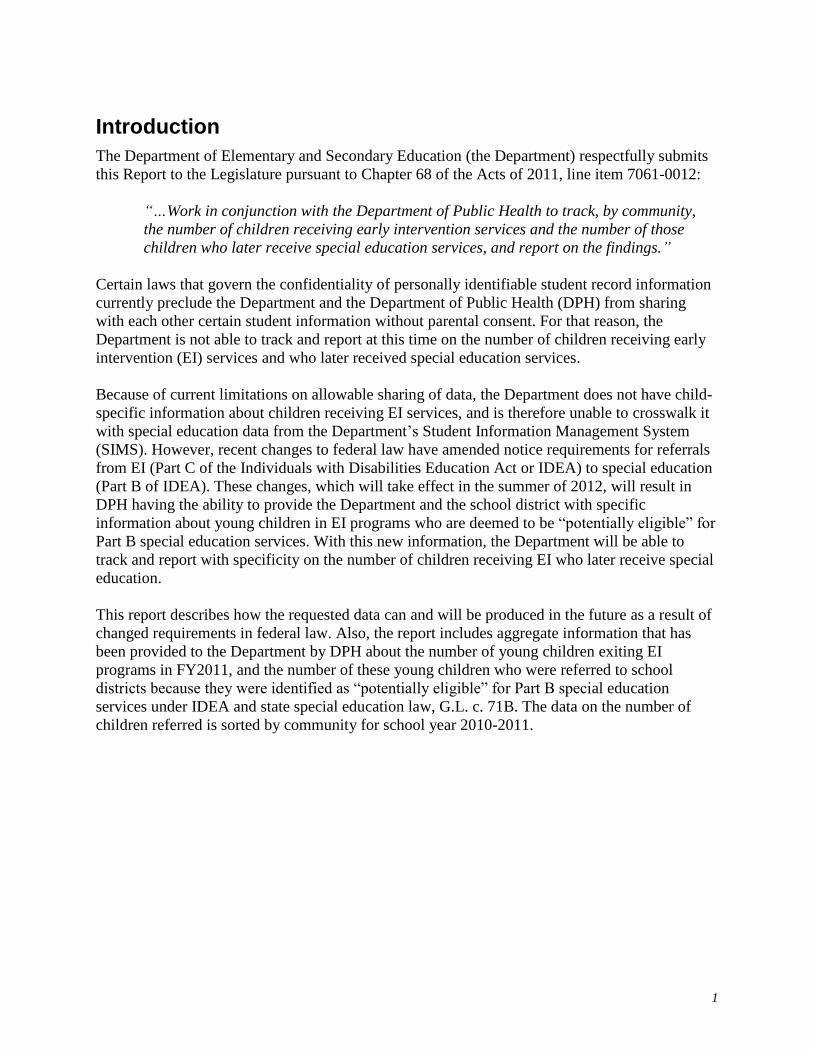
Introduction
The Department of Elementary and Secondary Education (the Department) respectfully submits
this Report to the Legislature pursuant to Chapter 68 of the Acts of 2011, line item 7061-0012:
“…Work in conjunction with the Department of Public Health to track, by community,
the number of children receiving early intervention services and the number of those
children who later receive special education services, and report on the findings.”
Certain laws that govern the confidentiality of personally identifiable student record information
currently preclude the Department and the Department of Public Health (DPH) from sharing
with each other certain student information without parental consent. For that reason, the
Department is not able to track and report at this time on the number of children receiving early
intervention (EI) services and who later received special education services.
Because of current limitations on allowable sharing of data, the Department does not have child-
specific information about children receiving EI services, and is therefore unable to crosswalk it
with special education data from the Department’s Student Information Management System
(SIMS). However, recent changes to federal law have amended notice requirements for referrals
from EI (Part C of the Individuals with Disabilities Education Act or IDEA) to special education
(Part B of IDEA). These changes, which will take effect in the summer of 2012, will result in
DPH having the ability to provide the Department and the school district with specific
information about young children in EI programs who are deemed to be “potentially eligible” for
Part B special education services. With this new information, the Department will be able to
track and report with specificity on the number of children receiving EI who later receive special
education.
This report describes how the requested data can and will be produced in the future as a result of
changed requirements in federal law. Also, the report includes aggregate information that has
been provided to the Department by DPH about the number of young children exiting EI
programs in FY2011, and the number of these young children who were referred to school
districts because they were identified as “potentially eligible” for Part B special education
services under IDEA and state special education law, G.L. c. 71B. The data on the number of
children referred is sorted by community for school year 2010-2011.
2
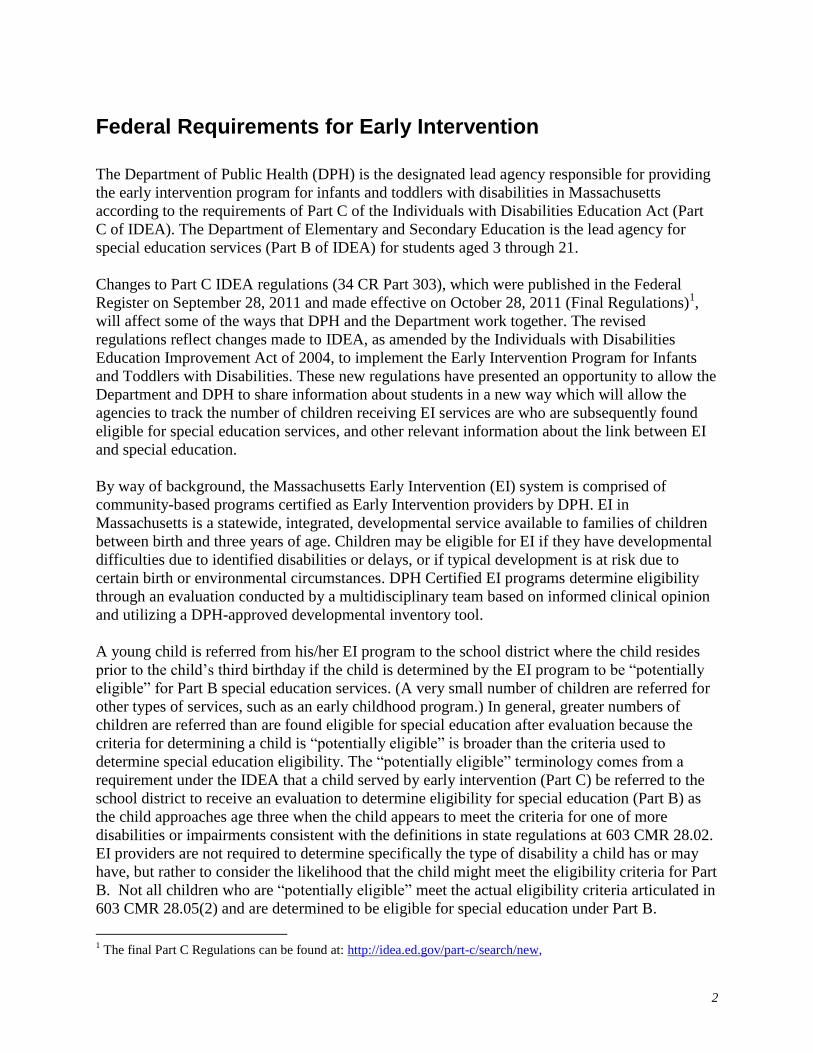
Federal Requirements for Early Intervention
The Department of Public Health (DPH) is the designated lead agency responsible for providing
the early intervention program for infants and toddlers with disabilities in Massachusetts
according to the requirements of Part C of the Individuals with Disabilities Education Act (Part
C of IDEA). The Department of Elementary and Secondary Education is the lead agency for
special education services (Part B of IDEA) for students aged 3 through 21.
Changes to Part C IDEA regulations (34 CR Part 303), which were published in the Federal
Register on September 28, 2011 and made effective on October 28, 2011 (Final Regulations)1,
will affect some of the ways that DPH and the Department work together. The revised
regulations reflect changes made to IDEA, as amended by the Individuals with Disabilities
Education Improvement Act of 2004, to implement the Early Intervention Program for Infants
and Toddlers with Disabilities. These new regulations have presented an opportunity to allow the
Department and DPH to share information about students in a new way which will allow the
agencies to track the number of children receiving EI services are who are subsequently found
eligible for special education services, and other relevant information about the link between EI
and special education.
By way of background, the Massachusetts Early Intervention (EI) system is comprised of
community-based programs certified as Early Intervention providers by DPH. EI in
Massachusetts is a statewide, integrated, developmental service available to families of children
between birth and three years of age. Children may be eligible for EI if they have developmental
difficulties due to identified disabilities or delays, or if typical development is at risk due to
certain birth or environmental circumstances. DPH Certified EI programs determine eligibility
through an evaluation conducted by a multidisciplinary team based on informed clinical opinion
and utilizing a DPH-approved developmental inventory tool.
A young child is referred from his/her EI program to the school district where the child resides
prior to the child’s third birthday if the child is determined by the EI program to be “potentially
eligible” for Part B special education services. (A very small number of children are referred for
other types of services, such as an early childhood program.) In general, greater numbers of
children are referred than are found eligible for special education after evaluation because the
criteria for determining a child is “potentially eligible” is broader than the criteria used to
determine special education eligibility. The “potentially eligible” terminology comes from a
requirement under the IDEA that a child served by early intervention (Part C) be referred to the
school district to receive an evaluation to determine eligibility for special education (Part B) as
the child approaches age three when the child appears to meet the criteria for one of more
disabilities or impairments consistent with the definitions in state regulations at 603 CMR 28.02.
EI providers are not required to determine specifically the type of disability a child has or may
have, but rather to consider the likelihood that the child might meet the eligibility criteria for Part
B. Not all children who are “potentially eligible” meet the actual eligibility criteria articulated in
603 CMR 28.05(2) and are determined to be eligible for special education under Part B.
1 The final Part C Regulations can be found at: http://idea.ed.gov/part-c/search/new,
3
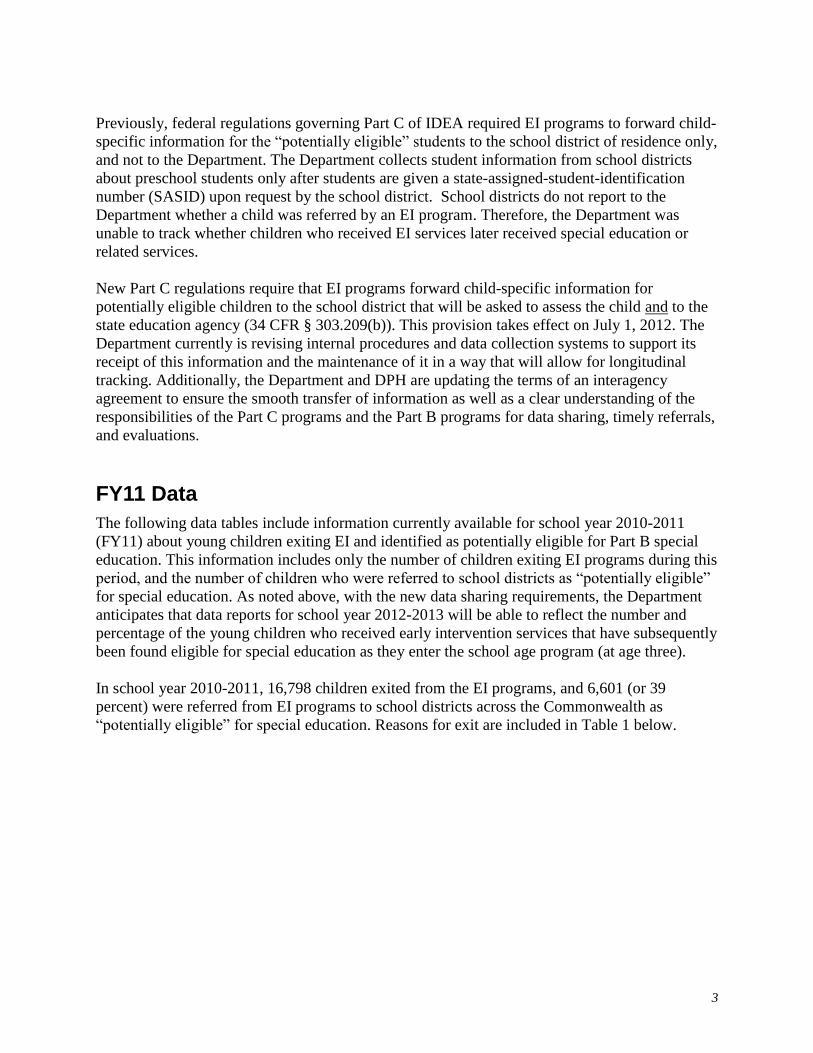
Previously, federal regulations governing Part C of IDEA required EI programs to forward child-
specific information for the “potentially eligible” students to the school district of residence only,
and not to the Department. The Department collects student information from school districts
about preschool students only after students are given a state-assigned-student-identification
number (SASID) upon request by the school district. School districts do not report to the
Department whether a child was referred by an EI program. Therefore, the Department was
unable to track whether children who received EI services later received special education or
related services.
New Part C regulations require that EI programs forward child-specific information for
potentially eligible children to the school district that will be asked to assess the child and to the
state education agency (34 CFR § 303.209(b)). This provision takes effect on July 1, 2012. The
Department currently is revising internal procedures and data collection systems to support its
receipt of this information and the maintenance of it in a way that will allow for longitudinal
tracking. Additionally, the Department and DPH are updating the terms of an interagency
agreement to ensure the smooth transfer of information as well as a clear understanding of the
responsibilities of the Part C programs and the Part B programs for data sharing, timely referrals,
and evaluations.
FY11 Data
The following data tables include information currently available for school year 2010-2011
(FY11) about young children exiting EI and identified as potentially eligible for Part B special
education. This information includes only the number of children exiting EI programs during this
period, and the number of children who were referred to school districts as “potentially eligible”
for special education. As noted above, with the new data sharing requirements, the Department
anticipates that data reports for school year 2012-2013 will be able to reflect the number and
percentage of the young children who received early intervention services that have subsequently
been found eligible for special education as they enter the school age program (at age three).
In school year 2010-2011, 16,798 children exited from the EI programs, and 6,601 (or 39
percent) were referred from EI programs to school districts across the Commonwealth as
“potentially eligible” for special education. Reasons for exit are included in Table 1 below.
4
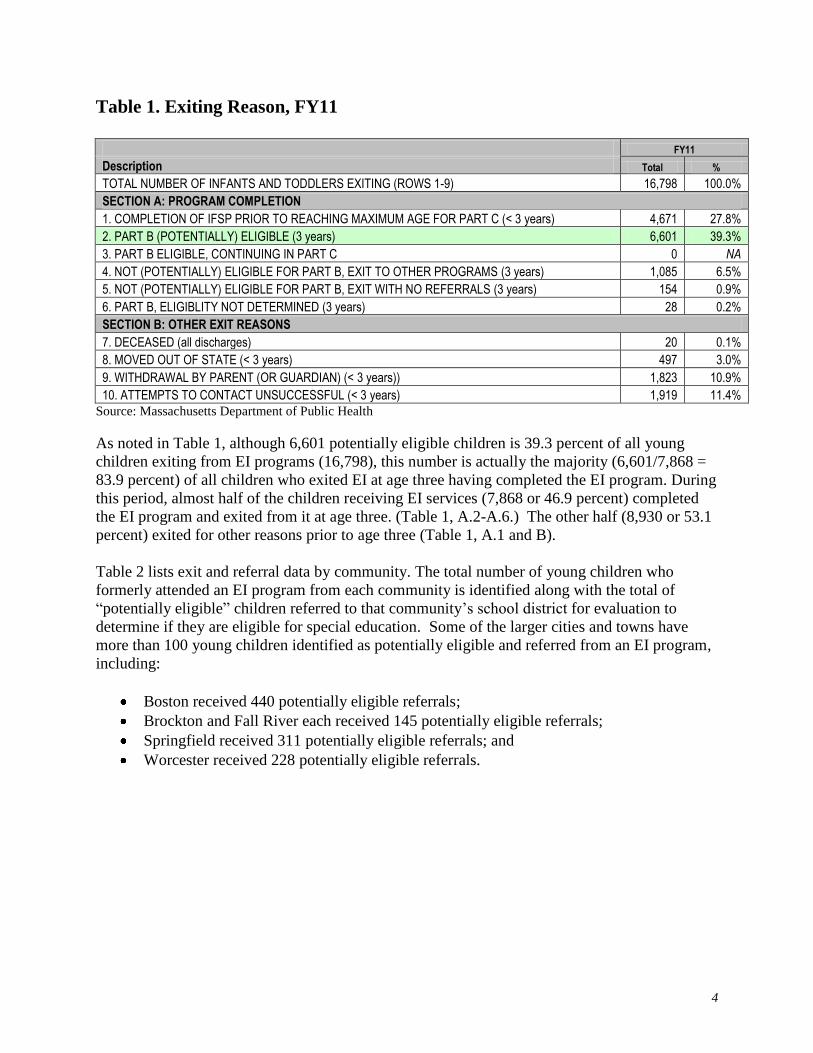
Table 1. Exiting Reason, FY11
FY11
Description Total %
TOTAL NUMBER OF INFANTS AND TODDLERS EXITING (ROWS 1-9) 16,798 100.0%
SECTION A: PROGRAM COMPLETION
1. COMPLETION OF IFSP PRIOR TO REACHING MAXIMUM AGE FOR PART C (< 3 years) 4,671 27.8%
2. PART B (POTENTIALLY) ELIGIBLE (3 years) 6,601 39.3%
3. PART B ELIGIBLE, CONTINUING IN PART C 0 NA
4. NOT (POTENTIALLY) ELIGIBLE FOR PART B, EXIT TO OTHER PROGRAMS (3 years) 1,085 6.5%
5. NOT (POTENTIALLY) ELIGIBLE FOR PART B, EXIT WITH NO REFERRALS (3 years) 154 0.9%
6. PART B, ELIGIBLITY NOT DETERMINED (3 years) 28 0.2%
SECTION B: OTHER EXIT REASONS
7. DECEASED (all discharges) 20 0.1%
8. MOVED OUT OF STATE (< 3 years) 497 3.0%
9. WITHDRAWAL BY PARENT (OR GUARDIAN) (< 3 years)) 1,823 10.9%
10. ATTEMPTS TO CONTACT UNSUCCESSFUL (< 3 years) 1,919 11.4%
Source: Massachusetts Department of Public Health
As noted in Table 1, although 6,601 potentially eligible children is 39.3 percent of all young
children exiting from EI programs (16,798), this number is actually the majority (6,601/7,868 =
83.9 percent) of all children who exited EI at age three having completed the EI program. During
this period, almost half of the children receiving EI services (7,868 or 46.9 percent) completed
the EI program and exited from it at age three. (Table 1, A.2-A.6.) The other half (8,930 or 53.1
percent) exited for other reasons prior to age three (Table 1, A.1 and B).
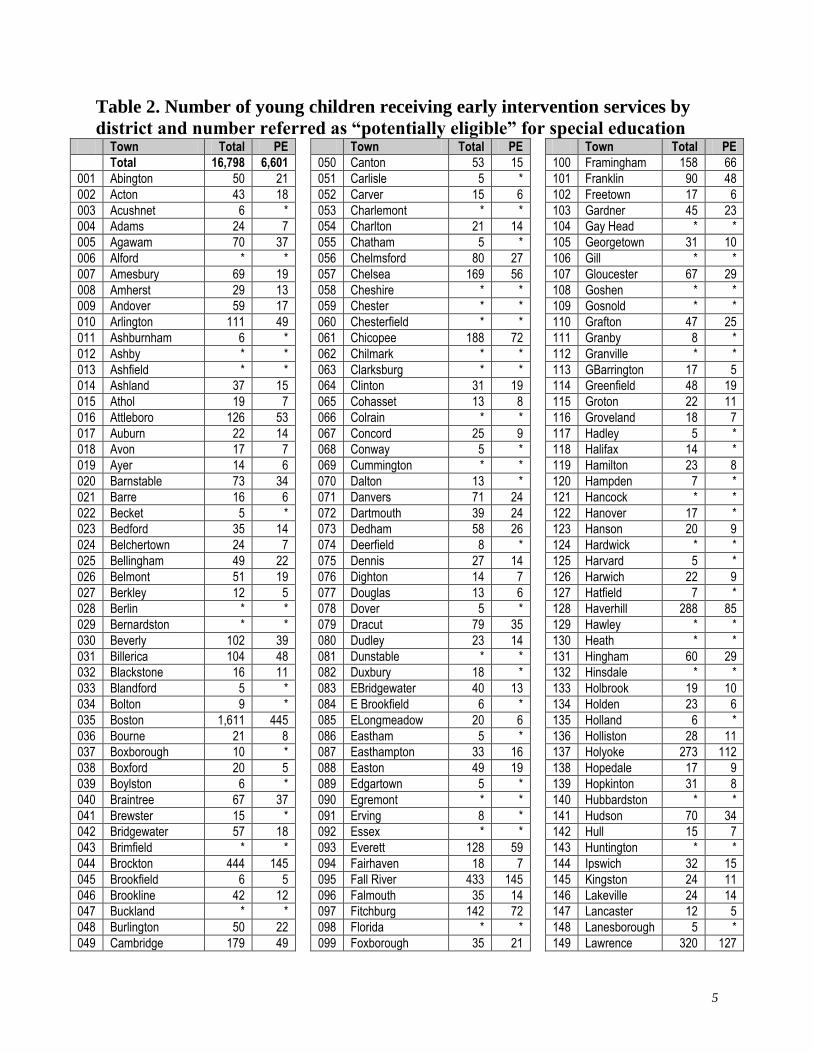
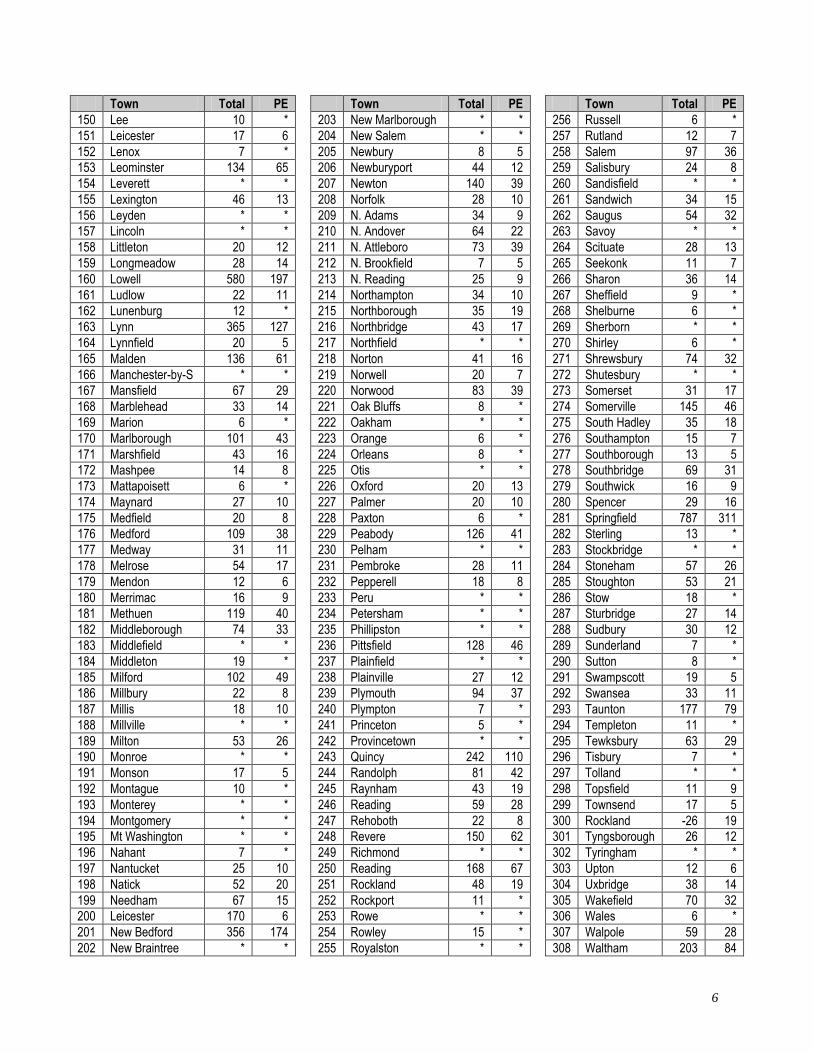
Table 2 lists exit and referral data by community. The total number of young children who
formerly attended an EI program from each community is identified along with the total of
“potentially eligible” children referred to that community’s school district for evaluation to
determine if they are eligible for special education. Some of the larger cities and towns have
more than 100 young children identified as potentially eligible and referred from an EI program,
including:
Boston received 440 potentially eligible referrals;
Brockton and Fall River each received 145 potentially eligible referrals;
Springfield received 311 potentially eligible referrals; and
Worcester received 228 potentially eligible referrals.
5
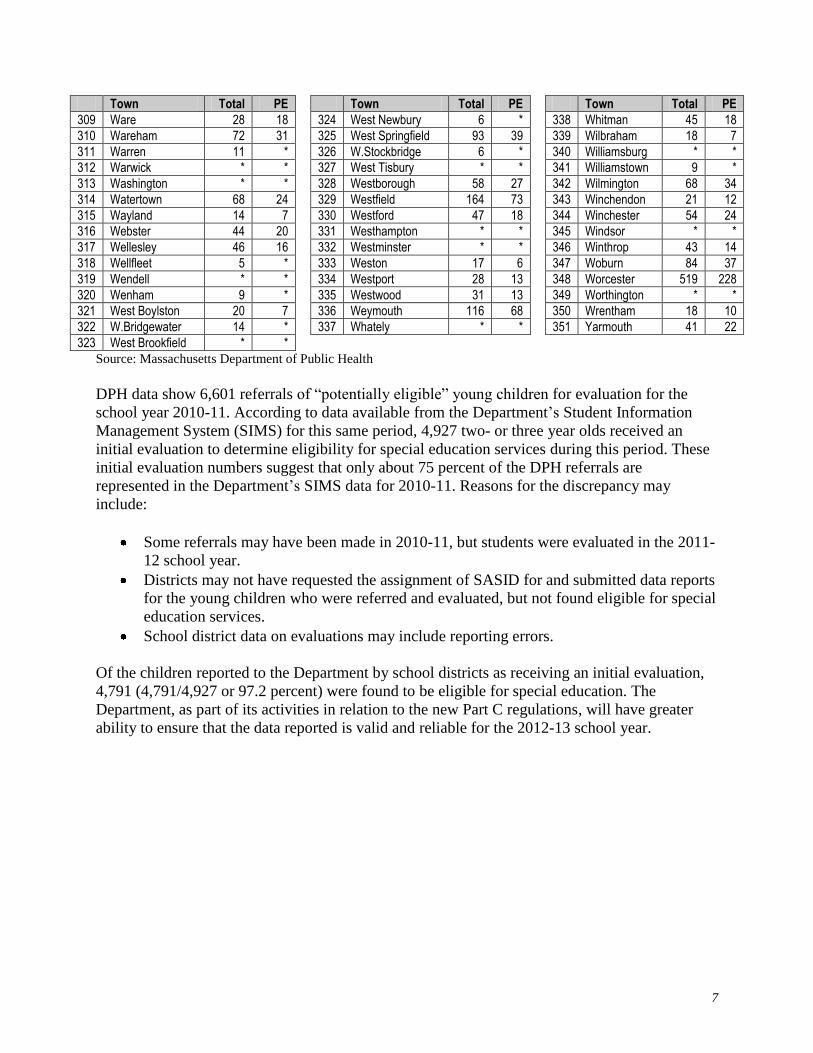
Table 2. Number of young children receiving early intervention services by
district and number referred as “potentially eligible” for special education Town Total PE Town Total PE Town Total PE
Total 16,798 6,601 050 Canton 53 15 100 Framingham 158 66
001 Abington 50 21 051 Carlisle 5 * 101 Franklin 90 48
002 Acton 43 18 052 Carver 15 6 102 Freetown 17 6
003 Acushnet 6 * 053 Charlemont * * 103 Gardner 45 23
004 Adams 24 7 054 Charlton 21 14 104 Gay Head * *
005 Agawam 70 37 055 Chatham 5 * 105 Georgetown 31 10
006 Alford * * 056 Chelmsford 80 27 106 Gill * *
007 Amesbury 69 19 057 Chelsea 169 56 107 Gloucester 67 29
008 Amherst 29 13 058 Cheshire * * 108 Goshen * *
009 Andover 59 17 059 Chester * * 109 Gosnold * *
010 Arlington 111 49 060 Chesterfield * * 110 Grafton 47 25
011 Ashburnham 6 * 061 Chicopee 188 72 111 Granby 8 *
012 Ashby * * 062 Chilmark * * 112 Granville * *
013 Ashfield * * 063 Clarksburg * * 113 GBarrington 17 5
014 Ashland 37 15 064 Clinton 31 19 114 Greenfield 48 19
015 Athol 19 7 065 Cohasset 13 8 115 Groton 22 11
016 Attleboro 126 53 066 Colrain * * 116 Groveland 18 7
017 Auburn 22 14 067 Concord 25 9 117 Hadley 5 *
018 Avon 17 7 068 Conway 5 * 118 Halifax 14 *
019 Ayer 14 6 069 Cummington * * 119 Hamilton 23 8
020 Barnstable 73 34 070 Dalton 13 * 120 Hampden 7 *
021 Barre 16 6 071 Danvers 71 24 121 Hancock * *
022 Becket 5 * 072 Dartmouth 39 24 122 Hanover 17 *
023 Bedford 35 14 073 Dedham 58 26 123 Hanson 20 9
024 Belchertown 24 7 074 Deerfield 8 * 124 Hardwick * *
025 Bellingham 49 22 075 Dennis 27 14 125 Harvard 5 *
026 Belmont 51 19 076 Dighton 14 7 126 Harwich 22 9
027 Berkley 12 5 077 Douglas 13 6 127 Hatfield 7 *
028 Berlin * * 078 Dover 5 * 128 Haverhill 288 85
029 Bernardston * * 079 Dracut 79 35 129 Hawley * *
030 Beverly 102 39 080 Dudley 23 14 130 Heath * *
031 Billerica 104 48 081 Dunstable * * 131 Hingham 60 29
032 Blackstone 16 11 082 Duxbury 18 * 132 Hinsdale * *
033 Blandford 5 * 083 EBridgewater 40 13 133 Holbrook 19 10
034 Bolton 9 * 084 E Brookfield 6 * 134 Holden 23 6
035 Boston 1,611 445 085 ELongmeadow 20 6 135 Holland 6 *
036 Bourne 21 8 086 Eastham 5 * 136 Holliston 28 11
037 Boxborough 10 * 087 Easthampton 33 16 137 Holyoke 273 112
038 Boxford 20 5 088 Easton 49 19 138 Hopedale 17 9
039 Boylston 6 * 089 Edgartown 5 * 139 Hopkinton 31 8
040 Braintree 67 37 090 Egremont * * 140 Hubbardston * *
041 Brewster 15 * 091 Erving 8 * 141 Hudson 70 34
042 Bridgewater 57 18 092 Essex * * 142 Hull 15 7
043 Brimfield * * 093 Everett 128 59 143 Huntington * *
044 Brockton 444 145 094 Fairhaven 18 7 144 Ipswich 32 15
045 Brookfield 6 5 095 Fall River 433 145 145 Kingston 24 11
046 Brookline 42 12 096 Falmouth 35 14 146 Lakeville 24 14
047 Buckland * * 097 Fitchburg 142 72 147 Lancaster 12 5
048 Burlington 50 22 098 Florida * * 148 Lanesborough 5 *
049 Cambridge 179 49 099 Foxborough 35 21 149 Lawrence 320 127
6
Town Total PE Town Total PE Town Total PE
150 Lee 10 * 203 New Marlborough * * 256 Russell 6 *
151 Leicester 17 6 204 New Salem * * 257 Rutland 12 7
152 Lenox 7 * 205 Newbury 8 5 258 Salem 97 36
153 Leominster 134 65 206 Newburyport 44 12 259 Salisbury 24 8
154 Leverett * * 207 Newton 140 39 260 Sandisfield * *
155 Lexington 46 13 208 Norfolk 28 10 261 Sandwich 34 15
156 Leyden * * 209 N. Adams 34 9 262 Saugus 54 32
157 Lincoln * * 210 N. Andover 64 22 263 Savoy * *
158 Littleton 20 12 211 N. Attleboro 73 39 264 Scituate 28 13
159 Longmeadow 28 14 212 N. Brookfield 7 5 265 Seekonk 11 7
160 Lowell 580 197 213 N. Reading 25 9 266 Sharon 36 14
161 Ludlow 22 11 214 Northampton 34 10 267 Sheffield 9 *
162 Lunenburg 12 * 215 Northborough 35 19 268 Shelburne 6 *
163 Lynn 365 127 216 Northbridge 43 17 269 Sherborn * *
164 Lynnfield 20 5 217 Northfield * * 270 Shirley 6 *
165 Malden 136 61 218 Norton 41 16 271 Shrewsbury 74 32
166 Manchester-by-S * * 219 Norwell 20 7 272 Shutesbury * *
167 Mansfield 67 29 220 Norwood 83 39 273 Somerset 31 17
168 Marblehead 33 14 221 Oak Bluffs 8 * 274 Somerville 145 46
169 Marion 6 * 222 Oakham * * 275 South Hadley 35 18
170 Marlborough 101 43 223 Orange 6 * 276 Southampton 15 7
171 Marshfield 43 16 224 Orleans 8 * 277 Southborough 13 5
172 Mashpee 14 8 225 Otis * * 278 Southbridge 69 31
173 Mattapoisett 6 * 226 Oxford 20 13 279 Southwick 16 9
174 Maynard 27 10 227 Palmer 20 10 280 Spencer 29 16
175 Medfield 20 8 228 Paxton 6 * 281 Springfield 787 311
176 Medford 109 38 229 Peabody 126 41 282 Sterling 13 *
177 Medway 31 11 230 Pelham * * 283 Stockbridge * *
178 Melrose 54 17 231 Pembroke 28 11 284 Stoneham 57 26
179 Mendon 12 6 232 Pepperell 18 8 285 Stoughton 53 21
180 Merrimac 16 9 233 Peru * * 286 Stow 18 *
181 Methuen 119 40 234 Petersham * * 287 Sturbridge 27 14
182 Middleborough 74 33 235 Phillipston * * 288 Sudbury 30 12
183 Middlefield * * 236 Pittsfield 128 46 289 Sunderland 7 *
184 Middleton 19 * 237 Plainfield * * 290 Sutton 8 *
185 Milford 102 49 238 Plainville 27 12 291 Swampscott 19 5
186 Millbury 22 8 239 Plymouth 94 37 292 Swansea 33 11
187 Millis 18 10 240 Plympton 7 * 293 Taunton 177 79
188 Millville * * 241 Princeton 5 * 294 Templeton 11 *
189 Milton 53 26 242 Provincetown * * 295 Tewksbury 63 29
190 Monroe * * 243 Quincy 242 110 296 Tisbury 7 *
191 Monson 17 5 244 Randolph 81 42 297 Tolland * *
192 Montague 10 * 245 Raynham 43 19 298 Topsfield 11 9
193 Monterey * * 246 Reading 59 28 299 Townsend 17 5
194 Montgomery * * 247 Rehoboth 22 8 300 Rockland -26 19
195 Mt Washington * * 248 Revere 150 62 301 Tyngsborough 26 12
196 Nahant 7 * 249 Richmond * * 302 Tyringham * *
197 Nantucket 25 10 250 Reading 168 67 303 Upton 12 6
198 Natick 52 20 251 Rockland 48 19 304 Uxbridge 38 14
199 Needham 67 15 252 Rockport 11 * 305 Wakefield 70 32
200 Leicester 170 6 253 Rowe * * 306 Wales 6 *
201 New Bedford 356 174 254 Rowley 15 * 307 Walpole 59 28
202 New Braintree * * 255 Royalston * * 308 Waltham 203 84
7
Town Total PE Town Total PE Town Total PE
309 Ware 28 18 324 West Newbury 6 * 338 Whitman 45 18
310 Wareham 72 31 325 West Springfield 93 39 339 Wilbraham 18 7
311 Warren 11 * 326 W.Stockbridge 6 * 340 Williamsburg * *
312 Warwick * * 327 West Tisbury * * 341 Williamstown 9 *
313 Washington * * 328 Westborough 58 27 342 Wilmington 68 34
314 Watertown 68 24 329 Westfield 164 73 343 Winchendon 21 12
315 Wayland 14 7 330 Westford 47 18 344 Winchester 54 24
316 Webster 44 20 331 Westhampton * * 345 Windsor * *
317 Wellesley 46 16 332 Westminster * * 346 Winthrop 43 14
318 Wellfleet 5 * 333 Weston 17 6 347 Woburn 84 37
319 Wendell * * 334 Westport 28 13 348 Worcester 519 228
320 Wenham 9 * 335 Westwood 31 13 349 Worthington * *
321 West Boylston 20 7 336 Weymouth 116 68 350 Wrentham 18 10
322 W.Bridgewater 14 * 337 Whately * * 351 Yarmouth 41 22
323 West Brookfield * *
Source: Massachusetts Department of Public Health
DPH data show 6,601 referrals of “potentially eligible” young children for evaluation for the
school year 2010-11. According to data available from the Department’s Student Information
Management System (SIMS) for this same period, 4,927 two- or three year olds received an
initial evaluation to determine eligibility for special education services during this period. These
initial evaluation numbers suggest that only about 75 percent of the DPH referrals are
represented in the Department’s SIMS data for 2010-11. Reasons for the discrepancy may
include:
Some referrals may have been made in 2010-11, but students were evaluated in the 2011-
12 school year.
Districts may not have requested the assignment of SASID for and submitted data reports
for the young children who were referred and evaluated, but not found eligible for special
education services.
School district data on evaluations may include reporting errors.
Of the children reported to the Department by school districts as receiving an initial evaluation,
4,791 (4,791/4,927 or 97.2 percent) were found to be eligible for special education. The
Department, as part of its activities in relation to the new Part C regulations, will have greater
ability to ensure that the data reported is valid and reliable for the 2012-13 school year.
8
Appendix A
Chapter 68 of the Acts of 2011
7061-0012
For the reimbursement of extraordinary special education costs under section 5A of chapter 71B
of the General Laws; provided, that reimbursements shall be prorated so that expenses of this
item do not exceed the amount appropriated in this item; provided further, that upon receipt by
the department of elementary and secondary education of required special education cost
reports from school districts, the department shall reimburse districts based on fiscal year 2011
claims; provided further, that the department may expend funds to continue and expand
voluntary residential placement prevention programs between the department of elementary and
secondary education and other departments within the executive office of health and human
services that develop community-based support services for children and their families; provided
further, that the department shall provide not less than $6,500,000 to the department of
developmental services for the voluntary residential placement prevention program; provided
further, that the department of elementary and secondary education shall fully cooperate in
providing information and assistance necessary for the department of developmental services to
maximize federal reimbursement and to effectively serve students in less restrictive settings;
provided further, that the department shall expend funds to provide books in accessible synthetic
audio format made available through the federal NIMAS-NIMAC book repository for the
outreach and training of teachers and students for the use of NIMAS-NIMAC and human speech
audio digital textbooks; provided further, that the department shall expend funds for the costs of
borrowing audio textbooks by special education students; provided further, that funds may be
expended for the monitoring and follow-up activities of the department’s complaint management
system, review and approval of local educational authority applications, and local school
districts’ compliance with the part B requirements of the federal Special Education Law, known
as the Individuals with Disabilities Education Act, in the provision of special education and
related services to children with disabilities; provided further, that funds may be expended to
administer the reimbursements funded herein; provided further, that funds may be expended to
reimburse districts for extraordinary increases in costs incurred during fiscal year 2012 which
would be reimbursable under said section 5A of said chapter 71B; provided further, that
reimbursements for current year costs shall be limited to school districts which experience
increases of greater than 25 per cent from costs reimbursable under said section 5A of said
chapter 71B and incurred during fiscal year 2011 to costs reimbursable under said section 5A of
said chapter 71B and incurred during fiscal year 2012 or other cases of extraordinary hardship
where special education costs increase in relationship to total district costs as the department
may define through regulation or guidelines; provided further, that reimbursements for current
year costs shall be allocated as one-time grants and shall not decrease reimbursements in the
following fiscal year; provided further, that the department shall conduct audits of fiscal year
2011 claims; provided further, that if the claims are found to be inaccurate, the department shall
recalculate the fiscal year 2012 reimbursement amount and adjust the third and fourth quarter
payments to the districts to reflect the new reimbursement amount; provided further, that the
department shall file a report with the house and senate committees on ways and means not later
than February 15, 2012, on the results of the audit; and provided further, that the department

9
shall work in conjunction with the department of public health to track, by community, the
number of children receiving early intervention services and the number of those children who
later receive special education services and shall report the house and senate committees on
ways and means on April 1, 2012 detailing the findings. $213,119,160
Related Documents