Transit Demand Analysis Purpose To determine impact on ridership and revenues of any change in service policy. Need to know how demand estimates will be used. May not require an elaborate analysis in many cases. Just try it and find out level of demand. Role of MPO or State DOT Generally have expertise in demand forecasts, full scale system wide mode split analysis using computerized techniques. Demand estimates for a new start or major project need to use advanced methods as part of a regional travel simulation while demand estimates for operational changes can use simplified methods and rules of thumb. Relation to Service Design Services should be designed to attract users – successful service/user oriented transit. Transit will be successful when it has the following characteristics • Concentrated trip ends: Activities that relate to transit should be located close to transit stops. • A quality access system: Provide safe, direct and easy access to transit by pedestrians, bicyclists and automobile users. Minimize distances from vehicle door to buildings. • Transit oriented street patterns: Permit through routing, direct service, few turns. Control through automobile traffic if necessary. • Market orientation: Services are designed to maximize customer satisfaction and needs. Operate directly between origins and destinations without transfers, convenient schedules, competitive price, clean, comfortable vehicles, good user information. Services should be designed to meet the needs of customers. User oriented transit means that there is:: • Direct service from the users trip origin to destination • No transfers • Schedules that match customer needs • Reasonable cost • Users ride with similar users • Good access on both ends of the trip Two factors need to be determined with transit estimates: market size and market share Market Size What is the total number of potential users for your service? Need to define where the market is and then determine how many people this represents. For example, university students, workers in CBD, elderly without a car, etc.. Analysis using census or better yet through data from major trip generators along the route. H:\Projects\Transit course\TRANSIT DEMAND ANALYSIS.doc 1 of 13

Welcome message from author
This document is posted to help you gain knowledge. Please leave a comment to let me know what you think about it! Share it to your friends and learn new things together.
Transcript
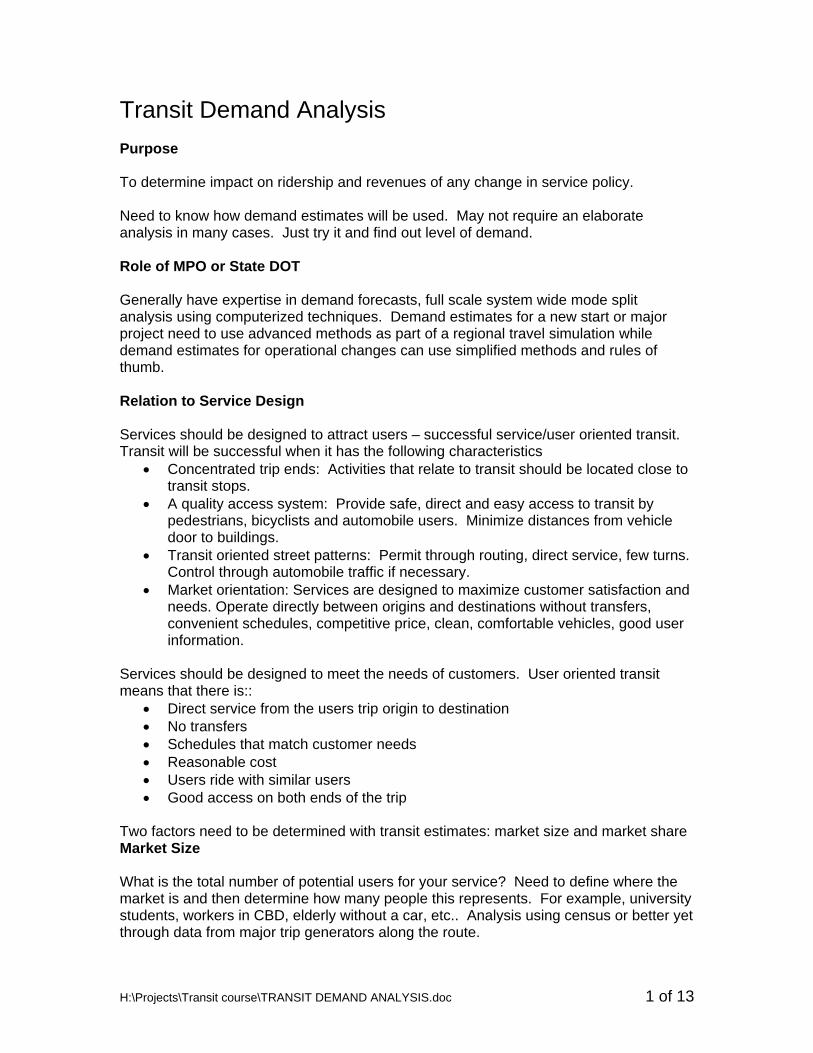
Transit Demand Analysis Purpose To determine impact on ridership and revenues of any change in service policy. Need to know how demand estimates will be used. May not require an elaborate analysis in many cases. Just try it and find out level of demand. Role of MPO or State DOT Generally have expertise in demand forecasts, full scale system wide mode split analysis using computerized techniques. Demand estimates for a new start or major project need to use advanced methods as part of a regional travel simulation while demand estimates for operational changes can use simplified methods and rules of thumb. Relation to Service Design Services should be designed to attract users – successful service/user oriented transit. Transit will be successful when it has the following characteristics
• Concentrated trip ends: Activities that relate to transit should be located close to transit stops.
• A quality access system: Provide safe, direct and easy access to transit by pedestrians, bicyclists and automobile users. Minimize distances from vehicle door to buildings.
• Transit oriented street patterns: Permit through routing, direct service, few turns. Control through automobile traffic if necessary.
• Market orientation: Services are designed to maximize customer satisfaction and needs. Operate directly between origins and destinations without transfers, convenient schedules, competitive price, clean, comfortable vehicles, good user information.
Services should be designed to meet the needs of customers. User oriented transit means that there is::
• Direct service from the users trip origin to destination • No transfers • Schedules that match customer needs • Reasonable cost • Users ride with similar users • Good access on both ends of the trip
Two factors need to be determined with transit estimates: market size and market share Market Size What is the total number of potential users for your service? Need to define where the market is and then determine how many people this represents. For example, university students, workers in CBD, elderly without a car, etc.. Analysis using census or better yet through data from major trip generators along the route.
H:\Projects\Transit course\TRANSIT DEMAND ANALYSIS.doc 1 of 13
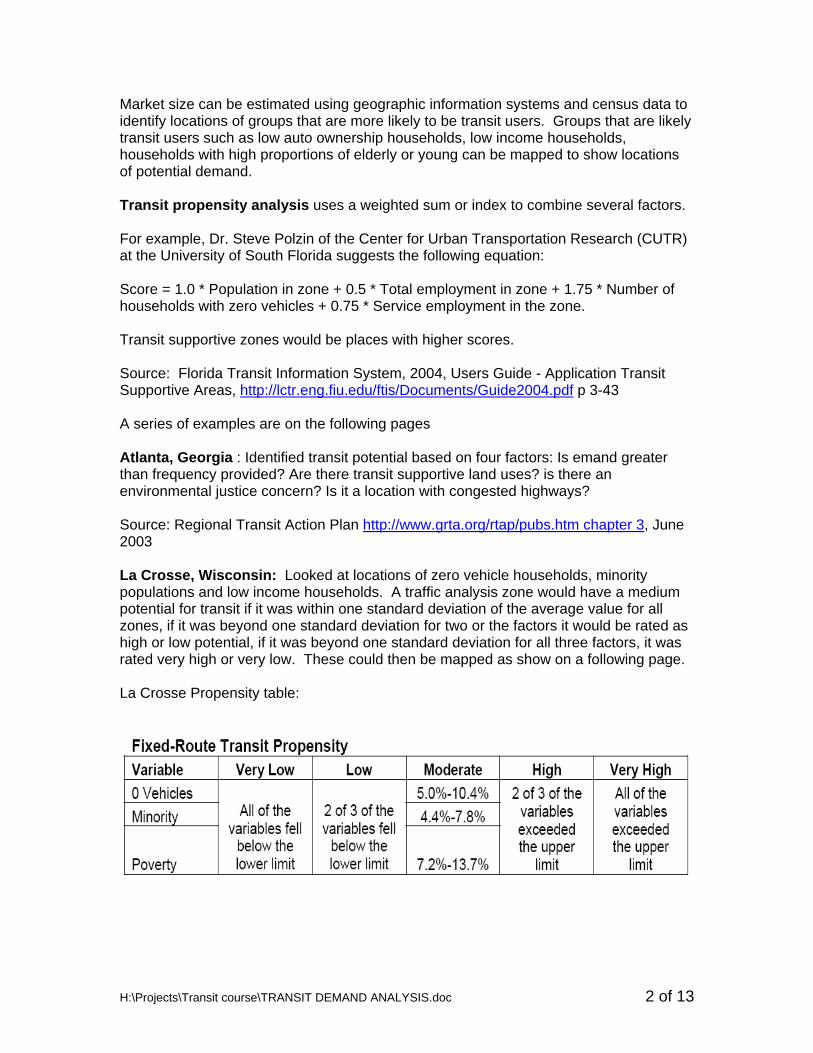
Market size can be estimated using geographic information systems and census data to identify locations of groups that are more likely to be transit users. Groups that are likely transit users such as low auto ownership households, low income households, households with high proportions of elderly or young can be mapped to show locations of potential demand. Transit propensity analysis uses a weighted sum or index to combine several factors. For example, Dr. Steve Polzin of the Center for Urban Transportation Research (CUTR) at the University of South Florida suggests the following equation: Score = 1.0 * Population in zone + 0.5 * Total employment in zone + 1.75 * Number of households with zero vehicles + 0.75 * Service employment in the zone. Transit supportive zones would be places with higher scores. Source: Florida Transit Information System, 2004, Users Guide - Application Transit Supportive Areas, http://lctr.eng.fiu.edu/ftis/Documents/Guide2004.pdf p 3-43 A series of examples are on the following pages Atlanta, Georgia : Identified transit potential based on four factors: Is emand greater than frequency provided? Are there transit supportive land uses? is there an environmental justice concern? Is it a location with congested highways? Source: Regional Transit Action Plan http://www.grta.org/rtap/pubs.htm chapter 3, June 2003 La Crosse, Wisconsin: Looked at locations of zero vehicle households, minority populations and low income households. A traffic analysis zone would have a medium potential for transit if it was within one standard deviation of the average value for all zones, if it was beyond one standard deviation for two or the factors it would be rated as high or low potential, if it was beyond one standard deviation for all three factors, it was rated very high or very low. These could then be mapped as show on a following page. La Crosse Propensity table:
H:\Projects\Transit course\TRANSIT DEMAND ANALYSIS.doc 2 of 13
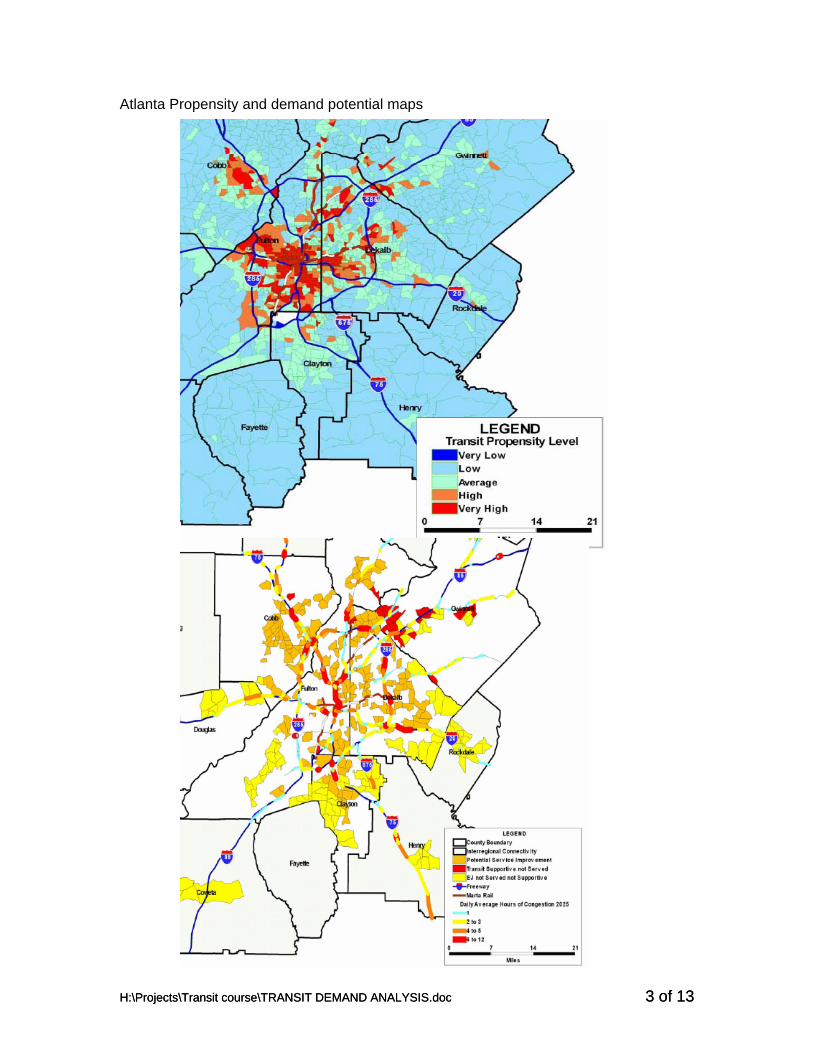
Atlanta Propensity and demand potential maps
H:\Projects\Transit course\TRANSIT DEMAND ANALYSIS.doc 3 of 13 H:\Projects\Transit course\TRANSIT DEMAND ANALYSIS.doc 3 of 13
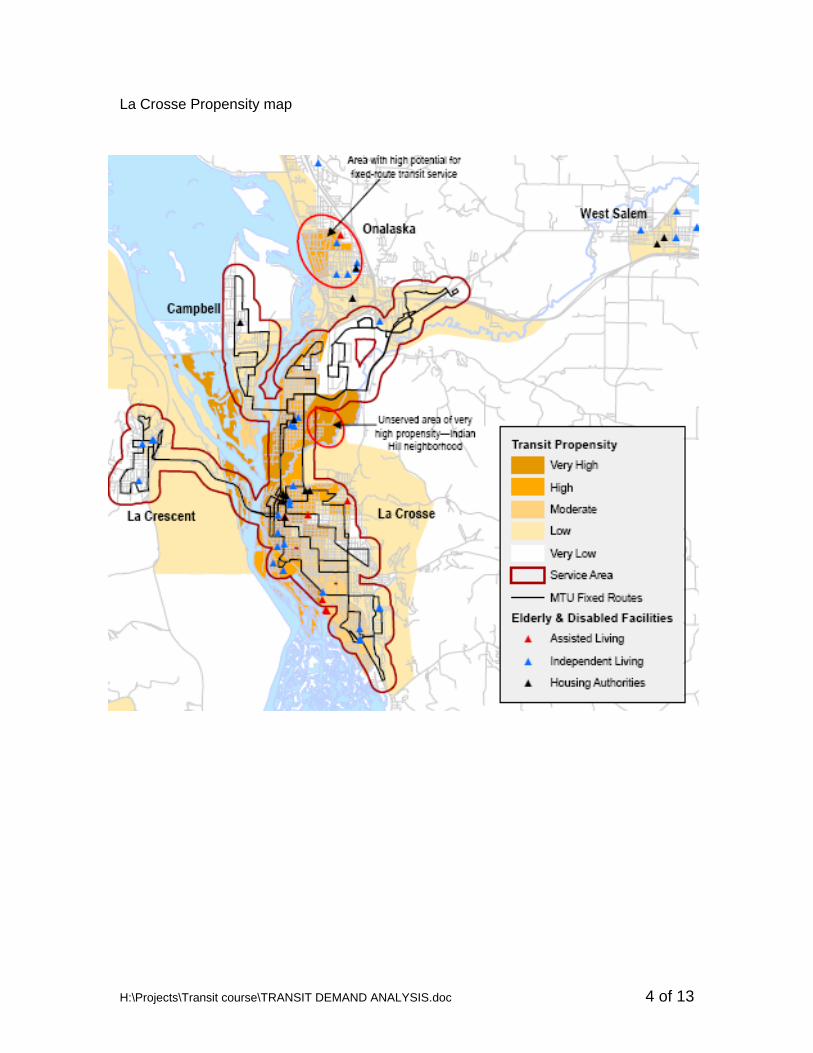
La Crosse Propensity map
H:\Projects\Transit course\TRANSIT DEMAND ANALYSIS.doc 4 of 13
Market Share What percent of the market will use your service? A well designed service aimed at a key market can capture a high share. Travel Behavior Travelers are constrained by time, money, social and family conditions. All travelers in the long run have choices: auto, bus, move residence, change jobs, etc.. Travelers will choose that mode which they believe will minimize the negative aspects of travel. These include total trip time, time spent waiting, walking, transferring, cost of trip, discomfort of vehicle, feeling of insecurity. TECHNIQUES FOR DEMAND ESTIMATES Simple Methods A) None
If it is a well designed service with a high potential market, simply begin the service and see who shows up. Need flexibility to quickly add service, or ability to drop it later if it doesn't work. Set goals, label as an experimental route.
B) Judgment
Based on past experiences, what do you expect the ridership to be? Football pool Rules of thumb
First guess methods learned from working with the system
Examples: Passengers/Bus Mile = (0.03) * # of residents within service area of route Passengers per day = (1.2) * park-n-ride spaces Park and ride will attract 30% of the market. A 1% increase in fare produces a 0.3% decrease in ridership. A 10% change in frequency of service produces a 5% change in ridership.
C) Non-committal survey
Would you ride the bus if . . .?
Rely on stated intentions, requires extensive new data collection, useful for modifying ridership estimates from other techniques, stated intention known to badly overestimate ridership.
D) Similar Route Method
H:\Projects\Transit course\TRANSIT DEMAND ANALYSIS.doc 5 of 13
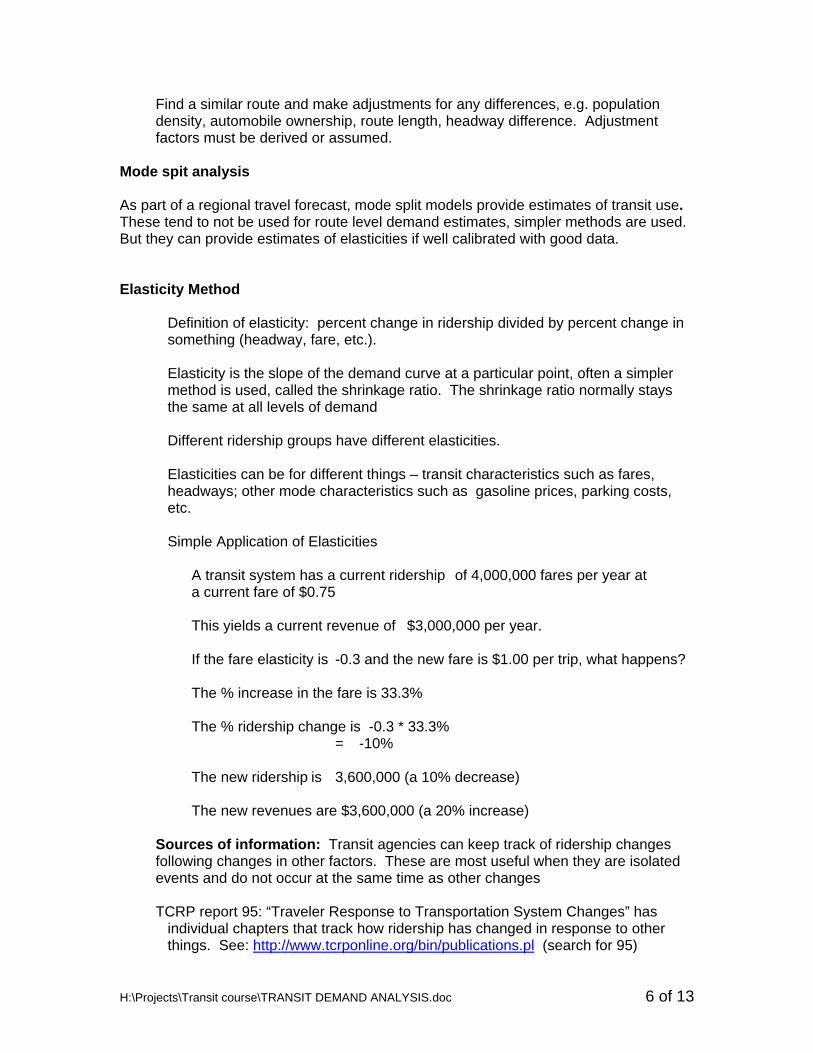
Find a similar route and make adjustments for any differences, e.g. population density, automobile ownership, route length, headway difference. Adjustment factors must be derived or assumed.
Mode spit analysis As part of a regional travel forecast, mode split models provide estimates of transit use. These tend to not be used for route level demand estimates, simpler methods are used. But they can provide estimates of elasticities if well calibrated with good data. Elasticity Method
Definition of elasticity: percent change in ridership divided by percent change in something (headway, fare, etc.).
Elasticity is the slope of the demand curve at a particular point, often a simpler method is used, called the shrinkage ratio. The shrinkage ratio normally stays the same at all levels of demand Different ridership groups have different elasticities. Elasticities can be for different things – transit characteristics such as fares, headways; other mode characteristics such as gasoline prices, parking costs, etc.
Simple Application of Elasticities
A transit system has a current ridership of 4,000,000 fares per year at a current fare of $0.75 This yields a current revenue of $3,000,000 per year. If the fare elasticity is -0.3 and the new fare is $1.00 per trip, what happens? The % increase in the fare is 33.3% The % ridership change is -0.3 * 33.3%
= -10% The new ridership is 3,600,000 (a 10% decrease)
The new revenues are $3,600,000 (a 20% increase)
Sources of information: Transit agencies can keep track of ridership changes following changes in other factors. These are most useful when they are isolated events and do not occur at the same time as other changes TCRP report 95: “Traveler Response to Transportation System Changes” has
individual chapters that track how ridership has changed in response to other things. See: http://www.tcrponline.org/bin/publications.pl (search for 95)
H:\Projects\Transit course\TRANSIT DEMAND ANALYSIS.doc 6 of 13
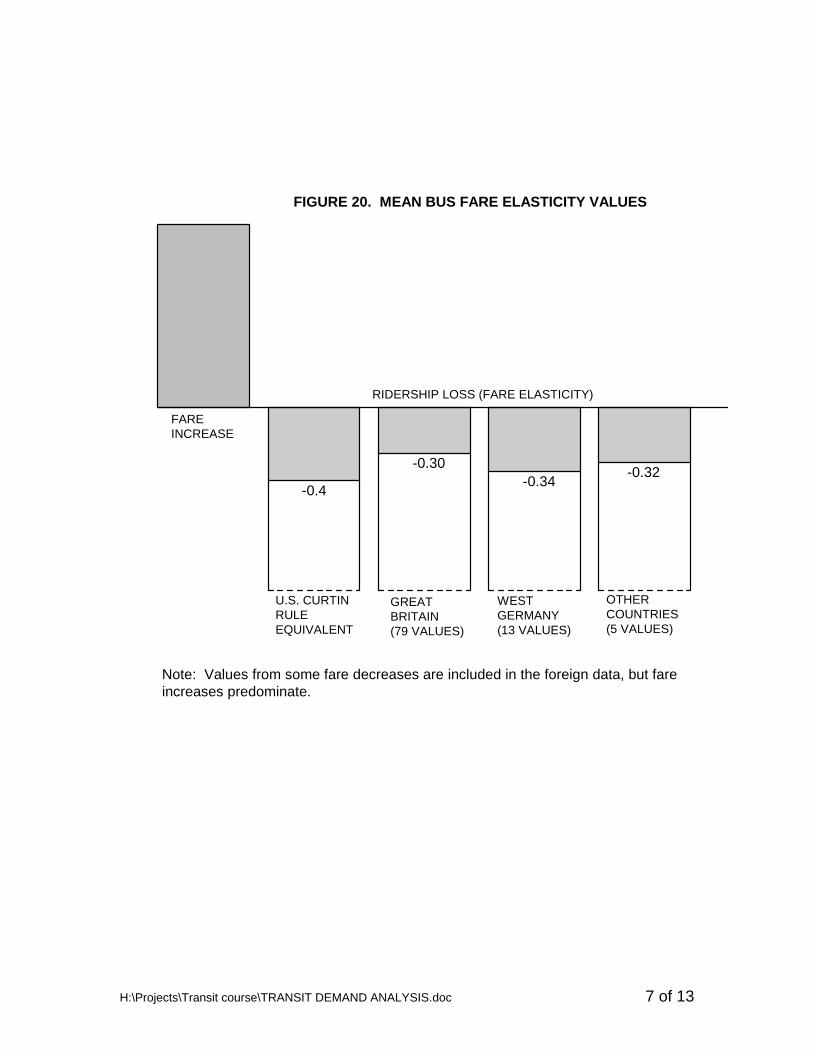
FAREINCREASE
U.S. CURTINRULEEQUIVALENT
WESTGERMANY(13 VALUES)
GREATBRITAIN(79 VALUES)
OTHERCOUNTRIES(5 VALUES)
RIDERSHIP LOSS (FARE ELASTICITY)
-0.32-0.34-0.30
-0.4
FIGURE 20. MEAN BUS FARE ELASTICITY VALUES
Note: Values from some fare decreases are included in the foreign data, but fareincreases predominate.
H:\Projects\Transit course\TRANSIT DEMAND ANALYSIS.doc 7 of 13
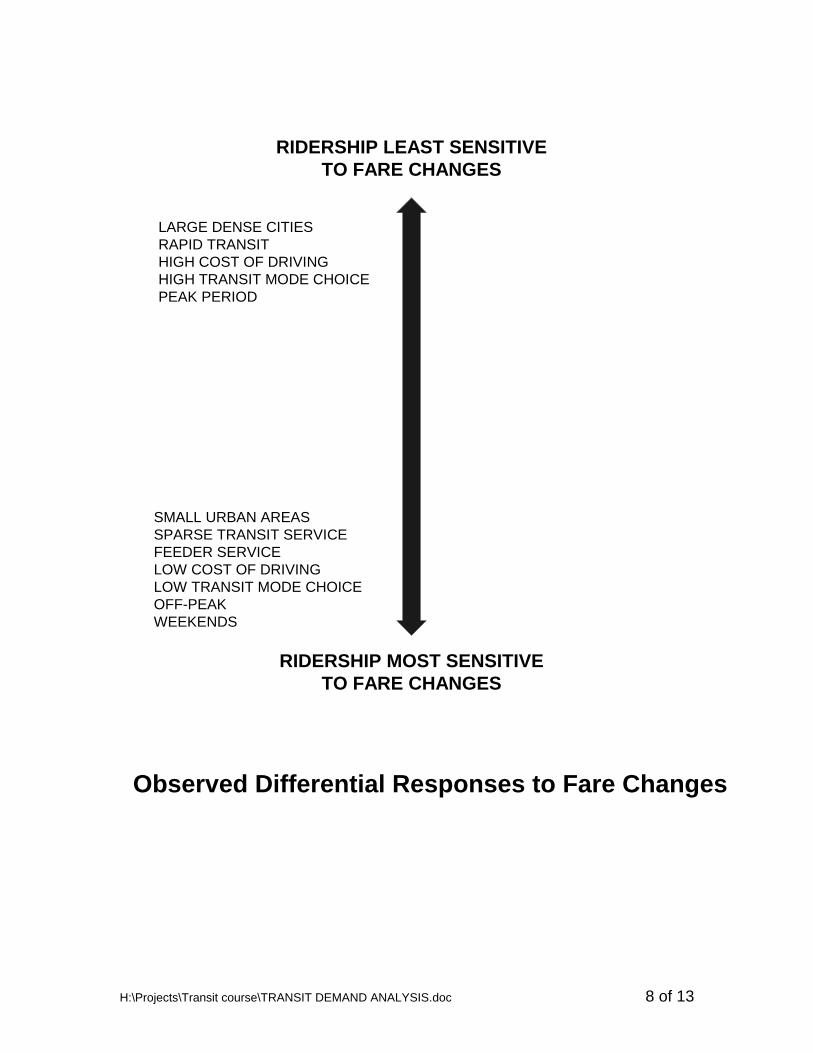
RIDERSHIP LEAST SENSITIVETO FARE CHANGES
RIDERSHIP MOST SENSITIVETO FARE CHANGES
Observed Differential Responses to Fare Changes
LARGE DENSE CITIESAPID TRANSITIGH COST OF DRIVINGGH TRANSIT MODE CHOICE
EAK PERIOD
SMALL URBAN AREASSPARSE TRANSIT SERVICEFEEDER SERVICELOW COST OF DRIVINGLOW TRANSIT MODE CHOICEOFF-PEAKWEEKENDS
RHHIP
H:\Projects\Transit course\TRANSIT DEMAND ANALYSIS.doc 8 of 13
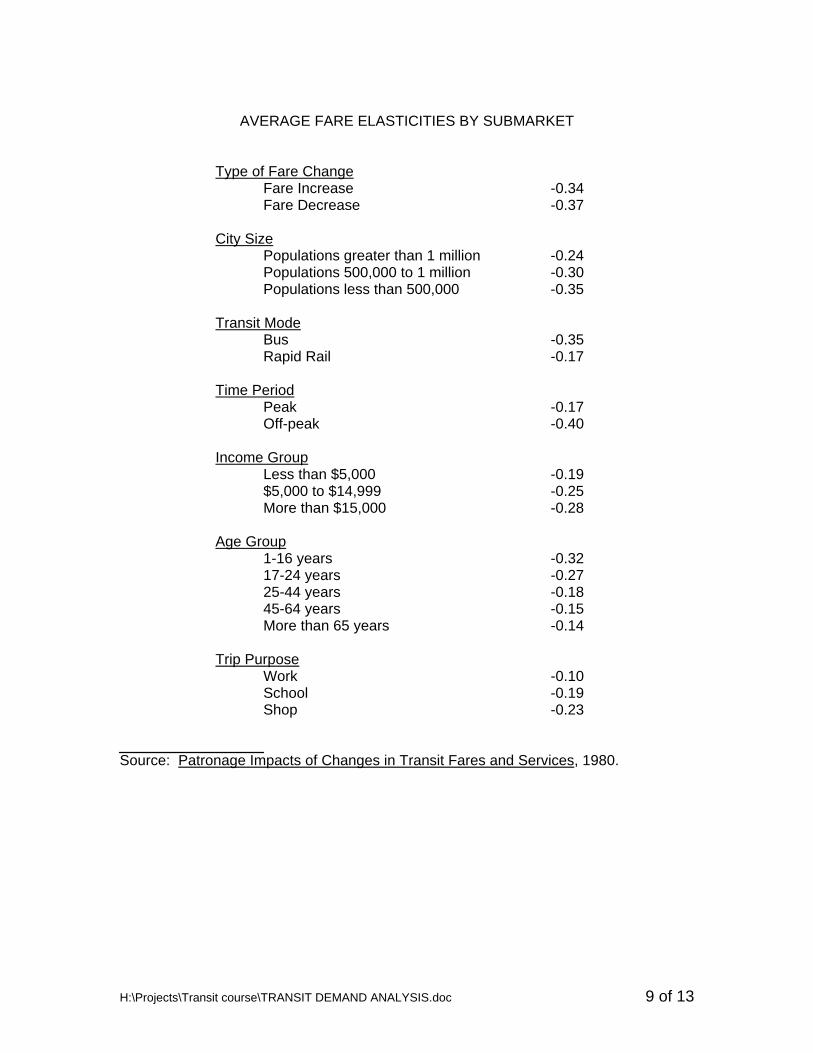
AVERAGE FARE ELASTICITIES BY SUBMARKET
Type of Fare Change Fare Increase -0.34 Fare Decrease -0.37 City Size Populations greater than 1 million -0.24 Populations 500,000 to 1 million -0.30 Populations less than 500,000 -0.35 Transit Mode Bus -0.35 Rapid Rail -0.17 Time Period Peak -0.17 Off-peak -0.40 Income Group Less than $5,000 -0.19 $5,000 to $14,999 -0.25 More than $15,000 -0.28 Age Group 1-16 years -0.32 17-24 years -0.27 25-44 years -0.18 45-64 years -0.15 More than 65 years -0.14 Trip Purpose Work -0.10 School -0.19 Shop -0.23 Source: Patronage Impacts of Changes in Transit Fares and Services, 1980.
H:\Projects\Transit course\TRANSIT DEMAND ANALYSIS.doc 9 of 13
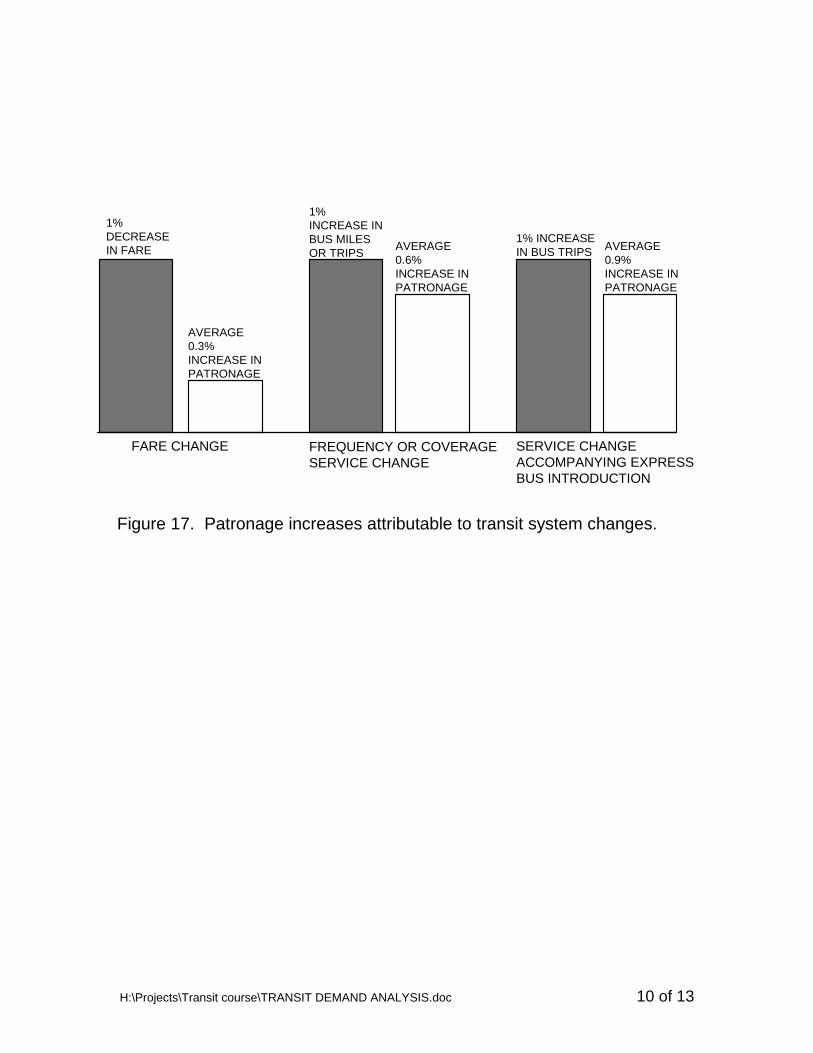
Figure 17. Patronage increases attributable to transit system changes.
FARE CHANG QUENCY OR COVERAGEANGE
SERVICE CHANGEACCOMP ING EXPRESSBUS I UCTION
1%DECREASEIN FARE
1% INCREASEIN BU AVERAGE
0.9%INCREASE INPATRONAGE
INCREASE INBUS MILES
PATRONAGE
1%
AVERAGE0.6%
S TRIPSOR TRIPS
INCREASE INPATRONAGE
AVERAGE0.3%INCREASE IN
E FRESERVICE CH ANY
NTROD
H:\Projects\Transit course\TRANSIT DEMAND ANALYSIS.doc 10 of 13
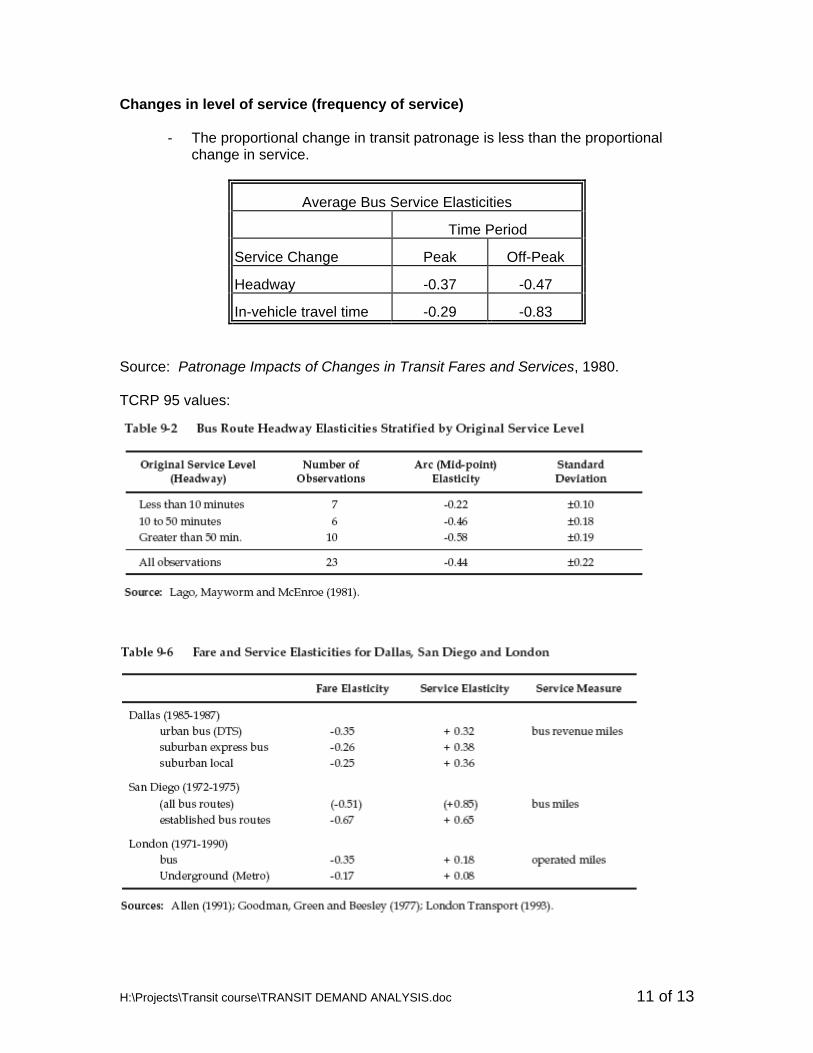
Changes in level of service (frequency of service)
- The proportional change in transit patronage is less than the proportional change in service.
Average Bus Service Elasticities
Time Period
Service Change Peak Off-Peak
Headway -0.37 -0.47
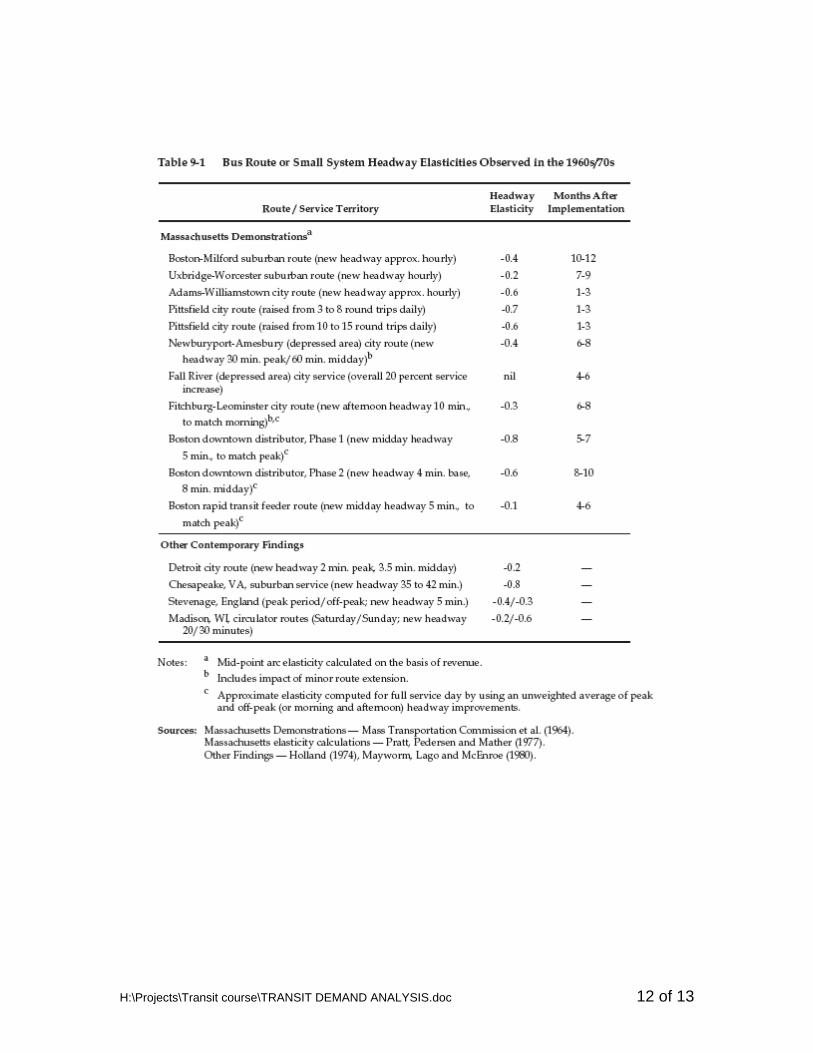
In-vehicle travel time -0.29 -0.83 Source: Patronage Impacts of Changes in Transit Fares and Services, 1980. TCRP 95 values:
H:\Projects\Transit course\TRANSIT DEMAND ANALYSIS.doc 11 of 13
H:\Projects\Transit course\TRANSIT DEMAND ANALYSIS.doc 12 of 13
H:\Projects\Transit course\TRANSIT DEMAND ANALYSIS.doc 13 of 13
Acknowledgements: Some of this material was developed as part of work being conducted by the Great
Cities University consortium under the lead of the University of Alabama at Birmingham using funds provided by the Federal Transit Administration of the U.S. Department of Transportation.
The opinions expressed are the product of independent university work and not necessarily those of the sponsoring agencies or of the agencies supplying data for the project.
Related Documents