TRADITIONAL VEGETABLES 2011 PLANNING BUDGETS Mississippi State University Department of Agricultural Economics Budget Report 2010-09 December 2010

Welcome message from author
This document is posted to help you gain knowledge. Please leave a comment to let me know what you think about it! Share it to your friends and learn new things together.
Transcript

TRADITIONAL VEGETABLES
2011 PLANNING BUDGETS
Mississippi State University Department of Agricultural Economics
Budget Report 2010-09 December 2010


i
Foreword
This report is designed to provide necessary planning data to farmers, research and extension staffs, lending agencies, and others in agriculture. Estimated costs for land, management, and general farm overhead are not included in this report. Acknowledgments
A list of individuals who contributed to the development of the agricultural enterprise budgets follows this acknowledgment. The administrative committee structure and enterprise committees have shown a spirit of cooperation seldom found when so many work together. A team effort has led to many improvements in the budgets over the years.
Special appreciation is expressed to producers who provided information on crop practices used. Appreciation also is expressed to farm supply dealers, equipment dealers, custom operators, and chemical companies who provided prices for crop production inputs. The Mississippi Agricultural Statistics Service is commended for its excellence in collecting price and production practice data.
Acknowledgment is made to the Mississippi State University Extension Service, the Mississippi Agricultural and Forestry Experiment Station, and the United States Agricultural Research Service staffs for the excellent cooperation that made this report possible.
The mention in this report of any commercial product does not imply its endorsement by MSU-ES, MAFES, or USDA over other products not named nor does the omission imply they are not satisfactory.

ii
2011 Budget Committees Corn, Grain Sorghum, and Wheat Gregg Ibendahl, MSU-ES, Chairman John Byrd, MSU-ES Wayne Ebelhar, MAFES Eric Larson, MSU-ES/MAFES Larry Oldham, MSU-ES Glover Triplett, MAFES Cotton John Michael Riley, MSU-ES, Chairman Gordon Andrews, MSU-ES Jason Bond, MAFES Angus Catchot, MSU-ES Darrin Dodds, MSU-ES Dan Reynolds, MAFES Peanuts John Michael Riley, MSU-ES, Chairman Mike Howell, MSU-ES Rice John Michael Riley, MSU-ES, Chairman Gordon Andrews, MSU-ES Nathan Buehring, MSU-ES Tim Walker, MAFES
Soybeans Gregg Ibendahl, MSU-ES, Chairman Normie W. Buehring, MAFES Angus Catchot, MSU-ES Trey Koger, MSU-ES Vegetables Ken Hood, MSU-ES, Chairman Allen Henn, MSU-ES David Ingram, MAFES David H. Nagel, MSU-ES Blake Layton, MSU-ES Fruit & Nut Kim Morgan, MSU-ES, Chairman John Braswell, MSU-ES Frank Matta, MAFES David Ingram, MAFES Blake Layton, MSU-ES
Supporting Committees
Equipment Ken Hood, MSU-ES, Chairman Dave Sites, MAFES Prices Ken Hood, MSU-ES, Chairman Dave Sites, MAFES W. Gail Gillis, MAFES
Documentation and Data Processing Ken Hood, MSU-ES, Chairman Dave Sites, MAFES W. Gail Gillis, MAFES Publication Review Ken Hood, MSU-ES, Chairman Dave Sites, MAFES W. Gail Gillis, MAFES
iii
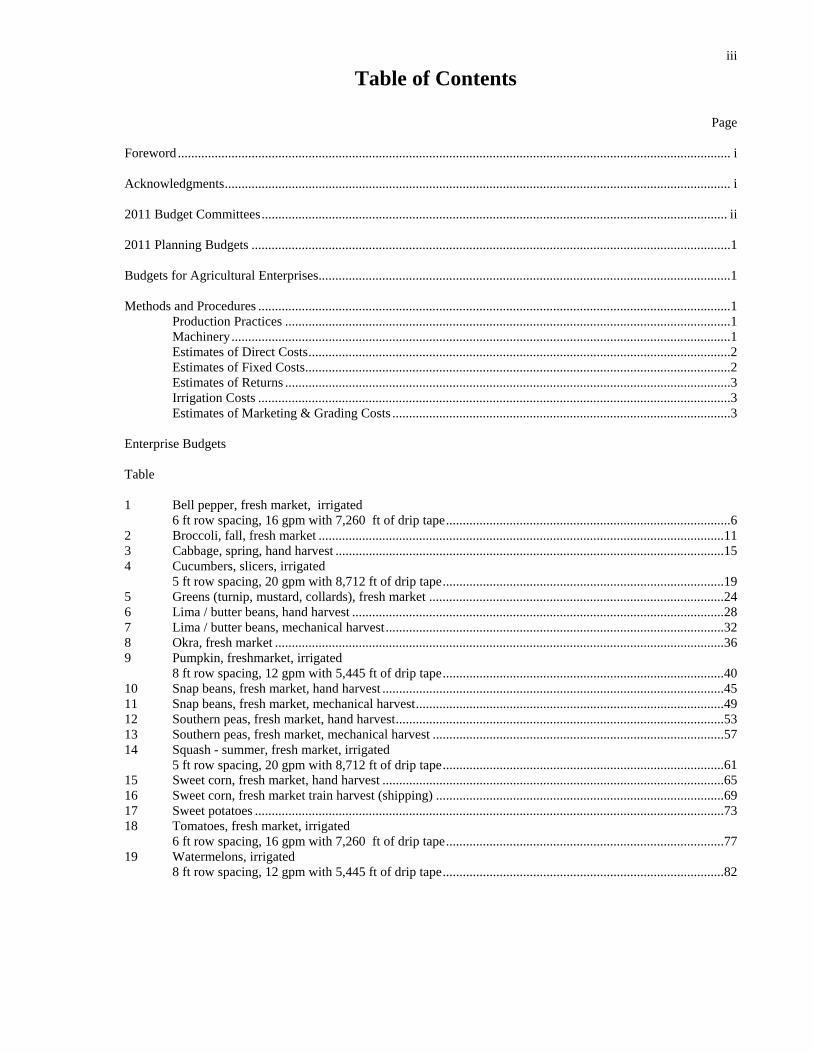
Table of Contents
Page Foreword ..................................................................................................................................................................... i Acknowledgments ....................................................................................................................................................... i 2011 Budget Committees ........................................................................................................................................... ii 2011 Planning Budgets ............................................................................................................................................... 1 Budgets for Agricultural Enterprises ........................................................................................................................... 1 Methods and Procedures ............................................................................................................................................. 1
Production Practices ..................................................................................................................................... 1 Machinery ..................................................................................................................................................... 1 Estimates of Direct Costs .............................................................................................................................. 2 Estimates of Fixed Costs............................................................................................................................... 2 Estimates of Returns ..................................................................................................................................... 3 Irrigation Costs ............................................................................................................................................. 3
Estimates of Marketing & Grading Costs ..................................................................................................... 3 Enterprise Budgets Table 1 Bell pepper, fresh market, irrigated
6 ft row spacing, 16 gpm with 7,260 ft of drip tape ..................................................................................... 6 2 Broccoli, fall, fresh market ......................................................................................................................... 11 3 Cabbage, spring, hand harvest .................................................................................................................... 15 4 Cucumbers, slicers, irrigated
5 ft row spacing, 20 gpm with 8,712 ft of drip tape .................................................................................... 19 5 Greens (turnip, mustard, collards), fresh market ........................................................................................ 24 6 Lima / butter beans, hand harvest ............................................................................................................... 28 7 Lima / butter beans, mechanical harvest ..................................................................................................... 32 8 Okra, fresh market ...................................................................................................................................... 36 9 Pumpkin, freshmarket, irrigated
8 ft row spacing, 12 gpm with 5,445 ft of drip tape .................................................................................... 40 10 Snap beans, fresh market, hand harvest ...................................................................................................... 45 11 Snap beans, fresh market, mechanical harvest ............................................................................................ 49 12 Southern peas, fresh market, hand harvest .................................................................................................. 53 13 Southern peas, fresh market, mechanical harvest ....................................................................................... 57 14 Squash - summer, fresh market, irrigated
5 ft row spacing, 20 gpm with 8,712 ft of drip tape .................................................................................... 61 15 Sweet corn, fresh market, hand harvest ...................................................................................................... 65 16 Sweet corn, fresh market train harvest (shipping) ...................................................................................... 69 17 Sweet potatoes ............................................................................................................................................ 73 18 Tomatoes, fresh market, irrigated
6 ft row spacing, 16 gpm with 7,260 ft of drip tape ................................................................................... 77 19 Watermelons, irrigated
8 ft row spacing, 12 gpm with 5,445 ft of drip tape .................................................................................... 82

iv
Appendix Table 1 Tractors/Harvesters: estimated purchase price, annual use, useful life, fuel use, and direct and fixed costs per hour ............................................................................................................ 88 2 Self-propelled machines: estimated purchase price, annual use, useful life, fuel use, performance rate, and direct and fixed costs per hour ............................................................................... 88 3 Towed equipment: estimated purchase price, annual use, useful life, performance rate, and direct and fixed costs per acre ............................................................................................................. 89 4 Operating inputs: estimated prices ............................................................................................................. 91 5 Estimated fuel prices and interest rates ...................................................................................................... 93 6 Labor types, and wage rates ....................................................................................................................... 93 7 Drip tape irrigation system, 5 ft row spacing, 20 gpm with 8,712 ft of drip tape ............................................................................................................................ 94 8 Drip tape irrigation system, 6 ft row spacing, 16 gpm with 7,260 ft of drip tape ............................................................................................................................ 95 9 Drip tape irrigation system, 8 ft row spacing, 12 gpm with 5,445 ft of drip tape ............................................................................................................................ 96 Literature Cited ........................................................................................................................................................ 97

2011 Planning Budgets Budgets for Agricultural Enterprises
This publication provides economic and technical information in the form of enterprise budgets for vegetable crops produced by Mississippi farmers. A multidisciplinary approach involving researchers and extension personnel was used to determine production practices and input quantities, and to estimate costs for each enterprise (14). The purpose of this section is to present the methods and procedures used to calculate costs for each budget included in this publication.
Enterprise budgets represent a type of information that can be used by a wide variety of individuals in making decisions in the food and fiber industry. They are used: - by farmers for planning, - by extension personnel in providing
educational programs to farmers, - by lenders as a basis for credit, - to provide basic data for research, and - to inform non-farmers of the costs incurred by
farmers in the production of food and fiber crops.
A budget should be prepared with a specific
objective in mind. The budgets in this report were prepared to provide general information for several different uses. They provide information concerning general levels of costs which will need to be adjusted for specific situations. Most users should think of these budgets as a first approximation and then make appropriate adjustments using the "Your Farm" column provided on each budget to add, delete, or change costs to reflect their specific situations. Income is not included in the vegetable planning budgets due to the volatile nature of prices in the fresh produce market. Budgets reflect the cost of production per acre planted. The budgets allow the producer to determine the breakeven price needed for the vegetable grown. A sensitivity table reflecting different yields per acre compared to different market prices received for vegetables allows producers to estimate potential net returns.
Methods and Procedures Production Practices
The production practices listed in each budget are the result of a combined effort by researchers and extension personnel to represent current practices.
Committees made up of appropriate disciplines from the Mississippi Agricultural and Forestry Experiment Station, the Mississippi State University Extension Service, and the U.S. Department of Agriculture review and update the practices in the budgets every year. The updates are based on the collective judgement of the committee members. Quantities of materials and individual production practices are based on generally accepted recommendations by committee members. Machinery
Machinery manufacturers form the basis for machinery prices used in these publications. Prices by size of equipment are determined from the most common sales in each category as reported by machinery dealers. Prices used in the budgets reflect prices paid by farmers in 2010. (Appendix Tables 1, 2, and 3).
A performance rate reflects the time required to perform a given task or operation and is expressed as that part of an hour per acre. Previous studies and expert knowledge of the equipment committee members are used to estimate performance rates for new and larger equipment (1, 4, 5, 6, 7, 9, 13).
The hours of annual use have been modified based on information collected from the cited studies (3, 4, 6, 7).
Repairs and maintenance as a percentage of new cost are estimated for the life of the equipment and include oil and lubricants (1, 4, 6).

2
Estimates of Direct Costs
Direct costs include estimated costs of repairs and maintenance (R&M) for all machinery and include fuel costs for powered machinery (Appendix Tables 1, 2, and 3). Direct costs are estimated on an hourly basis and are then converted to a per-acre basis using the performance rate for the particular operation. R&M costs for towed equipment and powered equipment are estimated as follows:
RPH = RLC x RP THL
RPA = RPH x PR
where: RPH = R&M cost per hour of use RLC = Replacement cost of machine RP = R&M percentage (percent of RLC) THL = Total hours of machine life RPA = R&M cost per acre PR = Performance rate Direct costs include an estimate of fuel cost based on average fuel consumption per hour of use for the power unit. Other components of direct costs include quantities of materials used in production multiplied by the price per unit of these inputs, custom rates, hourly wage rates, and interest charges on operating capital (Appendix Tables 4, 5, and 6). Prices of chemicals, seed, fertilizers, and custom rates are updated every year.
The labor wage rate per hour includes social security, accident and unemployment insurance, and some perquisites (11). Labor costs are estimated for several different labor categories. Operator labor is that labor required to operate all power-driven equipment.
Interest on operating capital is determined by using a short-term interest rate obtained from agricultural lenders and making a charge against capital outflows as the production process takes place. Interest is accumulated until the crop is harvested.
Estimates of Fixed Costs
Annual fixed cost estimates for machinery are based on a budgeting technique which computes the annual capital recovery charge (Boehlje and Eidman, p. 143). When a combination of machines or equipment is required to perform a single operation, the total cost per acre for all equipment used in the operation is estimated. The fixed cost of machinery ownership is calculated by first computing the capital recovery factor and then using it to estimate the annual capital recovery charge. IIR
CRF = -TYL
1 – (1 + IIR) where: CRF = Capital recovery factor IIR = Intermediate-term interest rate TYL = Total years of life
CRCPY = [(RLC - SV) x CRF]
+ (SV x IIR) where: CRCPY = Capital recovery charge per year RLC = Replacement cost SV = Salvage value (at end of useful life) This value is then converted to its per-hour and per-acre equivalent values:
CRCPH = CRCPY HAU
CRCPA = CRCPH x PR
where: CRCPH = Capital recovery charge per hour HAU = Hours of annual use CRCPA = Capital recovery charge per acre PR = Performance rate

3
Estimates of Returns
It is difficult to estimate crop yields that may be expected for a particular production system in a given year. Fresh vegetable prices are volatile and change daily. Because of this, no estimates of expected returns are provided. Budget Table D shows breakeven price above total expenses and net returns for price/yield combinations on a per-acre basis. Estimates of Irrigation Costs
Generally, irrigation is recommended for vegetable production. Irrigation costs for the most commonly used irrigation systems are presented in Appendix Tables 7, 8, and 9. Each appendix table lists all annual supplies, their prices, and quantities needed.
A non-irrigated vegetable budget can be converted to an irrigated budget by adding the desired irrigation system costs to the non-irrigated vegetable budget. Costs for the water will vary depending on the water source. Climatic conditions during the growing season will dictate water usage. Estimates of Marketing and Grading Costs Marketing and grading costs should be viewed as only rough estimates. These costs are highly dependent upon the market outlet. For producers with traditional customers acquired over the years, there may be no brokerage fees. Other packing for shipping may go through a broker and incur packaging costs as well.


Enterprise Budgets
6
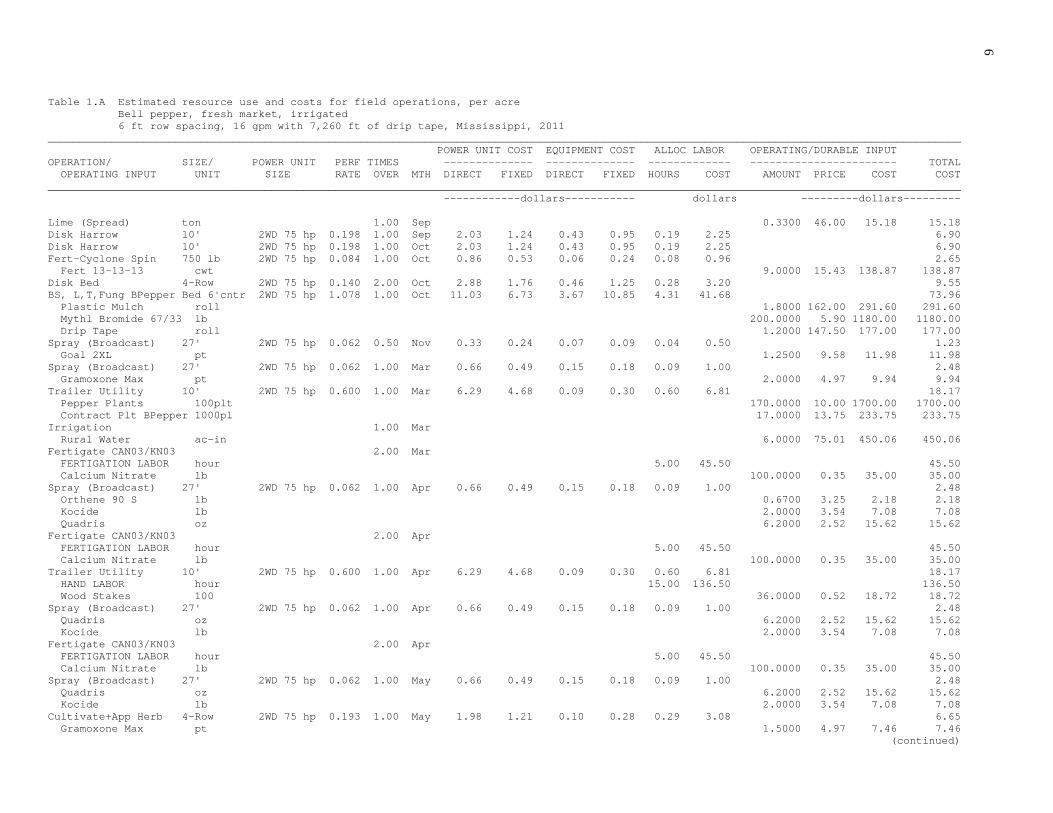
Table 1.A Estimated resource use and costs for field operations, per acre Bell pepper, fresh market, irrigated 6 ft row spacing, 16 gpm with 7,260 ft of drip tape, Mississippi, 2011 _______________________________________________________________________________________________________________________________________________ POWER UNIT COST EQUIPMENT COST ALLOC LABOR OPERATING/DURABLE INPUT OPERATION/ SIZE/ POWER UNIT PERF TIMES -------------- -------------- ------------- ----------------------- TOTAL OPERATING INPUT UNIT SIZE RATE OVER MTH DIRECT FIXED DIRECT FIXED HOURS COST AMOUNT PRICE COST COST _______________________________________________________________________________________________________________________________________________ ------------dollars----------- dollars ---------dollars--------- Lime (Spread) ton 1.00 Sep 0.3300 46.00 15.18 15.18 Disk Harrow 10' 2WD 75 hp 0.198 1.00 Sep 2.03 1.24 0.43 0.95 0.19 2.25 6.90 Disk Harrow 10' 2WD 75 hp 0.198 1.00 Oct 2.03 1.24 0.43 0.95 0.19 2.25 6.90 Fert-Cyclone Spin 750 lb 2WD 75 hp 0.084 1.00 Oct 0.86 0.53 0.06 0.24 0.08 0.96 2.65 Fert 13-13-13 cwt 9.0000 15.43 138.87 138.87 Disk Bed 4-Row 2WD 75 hp 0.140 2.00 Oct 2.88 1.76 0.46 1.25 0.28 3.20 9.55 BS, L,T,Fung BPepper Bed 6'cntr 2WD 75 hp 1.078 1.00 Oct 11.03 6.73 3.67 10.85 4.31 41.68 73.96 Plastic Mulch roll 1.8000 162.00 291.60 291.60 Mythl Bromide 67/33 lb 200.0000 5.90 1180.00 1180.00 Drip Tape roll 1.2000 147.50 177.00 177.00 Spray (Broadcast) 27' 2WD 75 hp 0.062 0.50 Nov 0.33 0.24 0.07 0.09 0.04 0.50 1.23 Goal 2XL pt 1.2500 9.58 11.98 11.98 Spray (Broadcast) 27' 2WD 75 hp 0.062 1.00 Mar 0.66 0.49 0.15 0.18 0.09 1.00 2.48 Gramoxone Max pt 2.0000 4.97 9.94 9.94 Trailer Utility 10' 2WD 75 hp 0.600 1.00 Mar 6.29 4.68 0.09 0.30 0.60 6.81 18.17 Pepper Plants 100plt 170.0000 10.00 1700.00 1700.00 Contract Plt BPepper 1000pl 17.0000 13.75 233.75 233.75 Irrigation 1.00 Mar Rural Water ac-in 6.0000 75.01 450.06 450.06 Fertigate CAN03/KN03 2.00 Mar FERTIGATION LABOR hour 5.00 45.50 45.50 Calcium Nitrate lb 100.0000 0.35 35.00 35.00 Spray (Broadcast) 27' 2WD 75 hp 0.062 1.00 Apr 0.66 0.49 0.15 0.18 0.09 1.00 2.48 Orthene 90 S lb 0.6700 3.25 2.18 2.18 Kocide lb 2.0000 3.54 7.08 7.08 Quadris oz 6.2000 2.52 15.62 15.62 Fertigate CAN03/KN03 2.00 Apr FERTIGATION LABOR hour 5.00 45.50 45.50 Calcium Nitrate lb 100.0000 0.35 35.00 35.00 Trailer Utility 10' 2WD 75 hp 0.600 1.00 Apr 6.29 4.68 0.09 0.30 0.60 6.81 18.17 HAND LABOR hour 15.00 136.50 136.50 Wood Stakes 100 36.0000 0.52 18.72 18.72 Spray (Broadcast) 27' 2WD 75 hp 0.062 1.00 Apr 0.66 0.49 0.15 0.18 0.09 1.00 2.48 Quadris oz 6.2000 2.52 15.62 15.62 Kocide lb 2.0000 3.54 7.08 7.08 Fertigate CAN03/KN03 2.00 Apr FERTIGATION LABOR hour 5.00 45.50 45.50 Calcium Nitrate lb 100.0000 0.35 35.00 35.00 Spray (Broadcast) 27' 2WD 75 hp 0.062 1.00 May 0.66 0.49 0.15 0.18 0.09 1.00 2.48 Quadris oz 6.2000 2.52 15.62 15.62 Kocide lb 2.0000 3.54 7.08 7.08 Cultivate+App Herb 4-Row 2WD 75 hp 0.193 1.00 May 1.98 1.21 0.10 0.28 0.29 3.08 6.65 Gramoxone Max pt 1.5000 4.97 7.46 7.46 (continued)
7
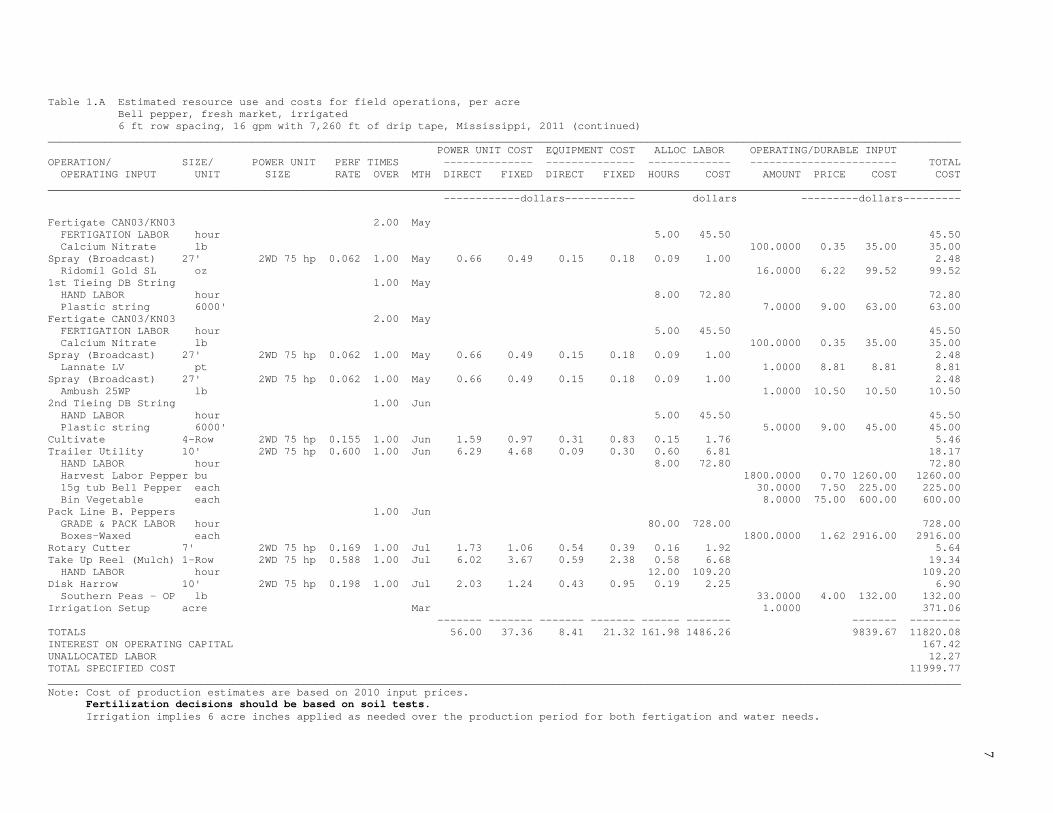
Table 1.A Estimated resource use and costs for field operations, per acre Bell pepper, fresh market, irrigated 6 ft row spacing, 16 gpm with 7,260 ft of drip tape, Mississippi, 2011 (continued) _______________________________________________________________________________________________________________________________________________ POWER UNIT COST EQUIPMENT COST ALLOC LABOR OPERATING/DURABLE INPUT OPERATION/ SIZE/ POWER UNIT PERF TIMES -------------- -------------- ------------- ----------------------- TOTAL OPERATING INPUT UNIT SIZE RATE OVER MTH DIRECT FIXED DIRECT FIXED HOURS COST AMOUNT PRICE COST COST _______________________________________________________________________________________________________________________________________________ ------------dollars----------- dollars ---------dollars--------- Fertigate CAN03/KN03 2.00 May FERTIGATION LABOR hour 5.00 45.50 45.50 Calcium Nitrate lb 100.0000 0.35 35.00 35.00 Spray (Broadcast) 27' 2WD 75 hp 0.062 1.00 May 0.66 0.49 0.15 0.18 0.09 1.00 2.48 Ridomil Gold SL oz 16.0000 6.22 99.52 99.52 1st Tieing DB String 1.00 May HAND LABOR hour 8.00 72.80 72.80 Plastic string 6000' 7.0000 9.00 63.00 63.00 Fertigate CAN03/KN03 2.00 May FERTIGATION LABOR hour 5.00 45.50 45.50 Calcium Nitrate lb 100.0000 0.35 35.00 35.00 Spray (Broadcast) 27' 2WD 75 hp 0.062 1.00 May 0.66 0.49 0.15 0.18 0.09 1.00 2.48 Lannate LV pt 1.0000 8.81 8.81 8.81 Spray (Broadcast) 27' 2WD 75 hp 0.062 1.00 May 0.66 0.49 0.15 0.18 0.09 1.00 2.48 Ambush 25WP lb 1.0000 10.50 10.50 10.50 2nd Tieing DB String 1.00 Jun HAND LABOR hour 5.00 45.50 45.50 Plastic string 6000' 5.0000 9.00 45.00 45.00 Cultivate 4-Row 2WD 75 hp 0.155 1.00 Jun 1.59 0.97 0.31 0.83 0.15 1.76 5.46 Trailer Utility 10' 2WD 75 hp 0.600 1.00 Jun 6.29 4.68 0.09 0.30 0.60 6.81 18.17 HAND LABOR hour 8.00 72.80 72.80 Harvest Labor Pepper bu 1800.0000 0.70 1260.00 1260.00 15g tub Bell Pepper each 30.0000 7.50 225.00 225.00 Bin Vegetable each 8.0000 75.00 600.00 600.00 Pack Line B. Peppers 1.00 Jun GRADE & PACK LABOR hour 80.00 728.00 728.00 Boxes-Waxed each 1800.0000 1.62 2916.00 2916.00 Rotary Cutter 7' 2WD 75 hp 0.169 1.00 Jul 1.73 1.06 0.54 0.39 0.16 1.92 5.64 Take Up Reel (Mulch) 1-Row 2WD 75 hp 0.588 1.00 Jul 6.02 3.67 0.59 2.38 0.58 6.68 19.34 HAND LABOR hour 12.00 109.20 109.20 Disk Harrow 10' 2WD 75 hp 0.198 1.00 Jul 2.03 1.24 0.43 0.95 0.19 2.25 6.90 Southern Peas - OP lb 33.0000 4.00 132.00 132.00 Irrigation Setup acre Mar 1.0000 371.06 ------- ------- ------- ------- ------ ------- ------- -------- TOTALS 56.00 37.36 8.41 21.32 161.98 1486.26 9839.67 11820.08 INTEREST ON OPERATING CAPITAL 167.42 UNALLOCATED LABOR 12.27 TOTAL SPECIFIED COST 11999.77 _______________________________________________________________________________________________________________________________________________ Note: Cost of production estimates are based on 2010 input prices. Fertilization decisions should be based on soil tests. Irrigation implies 6 acre inches applied as needed over the production period for both fertigation and water needs.

8 Table 1.B Estimated costs per acre Bell pepper, fresh market, irrigated 6 ft row spacing, 16 gpm with 7,260 ft of drip tape, Mississippi, 2011 _______________________________________________________________________ ITEM UNIT PRICE QUANTITY AMOUNT YOUR FARM _______________________________________________________________________ dollars dollars DIRECT EXPENSES CUSTOM Contract Plt BPepper 1000pl 13.75 17.0000 233.75 _________ FERTILIZER Lime (Spread) ton 46.00 0.3300 15.18 _________ Fert 13-13-13 cwt 15.43 9.0000 138.87 _________ Calcium Nitrate lb 0.35 500.0000 175.00 _________ FUNGICIDE Kocide lb 3.54 6.0000 21.24 _________ Quadris oz 2.52 18.6000 46.87 _________ Ridomil Gold SL oz 6.22 16.0000 99.52 _________ HERBICIDE Goal 2XL pt 9.58 1.2500 11.98 _________ Gramoxone Max pt 4.97 3.5000 17.40 _________ INSECTICIDE Orthene 90 S lb 3.25 0.6700 2.18 _________ Lannate LV pt 8.81 1.0000 8.81 _________ Ambush 25WP lb 10.50 1.0000 10.50 _________ SEED/PLANTS Pepper Plants 100plt 10.00 170.0000 1700.00 _________ Southern Peas - OP lb 4.00 33.0000 132.00 _________ OTHER Plastic Mulch roll 162.00 1.8000 291.60 _________ Mythl Bromide 67/33 lb 5.90 200.0000 1180.00 _________ Wood Stakes 100 0.52 36.0000 18.72 _________ Plastic string 6000' 9.00 12.0000 108.00 _________ Harvest Labor Pepper bu 0.70 1800.0000 1260.00 _________ 15g tub Bell Pepper each 7.50 30.0000 225.00 _________ Bin Vegetable each 75.00 8.0000 600.00 _________ Boxes-Waxed each 1.62 1800.0000 2916.00 _________ IRRIGATION SUPPLIES Drip Tape roll 147.50 1.2000 177.00 _________ Rural Water ac-in 75.01 6.0000 450.06 _________ OPERATOR LABOR Tractors hour 11.35 5.4161 61.47 _________ GRADE & PACK LABOR Special Labor hour 9.10 80.0000 728.00 _________ HAND LABOR Special Labor hour 9.10 48.0000 436.80 _________ Implements hour 9.10 3.5672 32.49 _________ FERTIGATION LABOR Special Labor hour 9.10 25.0000 227.50 _________ UNALLOCATED LABOR hour 11.32 1.0832 12.27 _________ DIESEL FUEL Tractors gal 2.39 20.9084 50.00 _________ REPAIR & MAINTENANCE Implements acre 8.41 1.0000 8.41 _________ Tractors acre 6.00 1.0000 6.00 _________ INTEREST ON OP. CAP. acre 167.42 1.0000 167.42 _________ --------- TOTAL DIRECT EXPENSES 11570.03 _________ FIXED EXPENSES Implements acre 21.32 1.0000 21.32 _________ Tractors acre 37.36 1.0000 37.36 _________ Irrigation Setup acre 371.06 1.0000 371.06 _________ --------- TOTAL FIXED EXPENSES 429.74 _________ --------- TOTAL SPECIFIED EXPENSES 11999.77 _________ _______________________________________________________________________ Note: Cost of production estimates are based on 2010 input prices. Fertilization decisions should be based on soil tests. Irrigation implies 6 acre inches applied as needed over the production period for both fertigation and water needs.

9
Table 1.C Estimated monthly income and expense flows per acre Bell pepper, fresh market, irrigated 6 ft row spacing, 16 gpm with 7,260 ft of drip tape, Mississippi, 2011 __________________________________________________________________________________________________________________________________ ITEM Sep Oct Nov Dec Jan Feb Mar Apr May Jun Jul Aug __________________________________________________________________________________________________________________________________ --------------------------------------------------dollars-------------------------------------------------- TOTAL INCOME 0.00 0.00 0.00 0.00 0.00 0.00 0.00 0.00 0.00 0.00 0.00 0.00 DIRECT EXPENSES CUSTOM 0.00 0.00 0.00 0.00 0.00 0.00 233.75 0.00 0.00 0.00 0.00 0.00 FERTILIZER 15.18 138.87 0.00 0.00 0.00 0.00 35.00 70.00 70.00 0.00 0.00 0.00 FUNGICIDE 0.00 0.00 0.00 0.00 0.00 0.00 0.00 45.40 122.22 0.00 0.00 0.00 HERBICIDE 0.00 0.00 11.98 0.00 0.00 0.00 9.94 0.00 7.46 0.00 0.00 0.00 INSECTICIDE 0.00 0.00 0.00 0.00 0.00 0.00 0.00 2.18 19.31 0.00 0.00 0.00 SEED/PLANTS 0.00 0.00 0.00 0.00 0.00 0.00 1700.00 0.00 0.00 0.00 132.00 0.00 OTHER 0.00 1471.60 0.00 0.00 0.00 0.00 0.00 18.72 63.00 5046.00 0.00 0.00 IRRIGATION SUPPLIES 0.00 177.00 0.00 0.00 0.00 0.00 450.06 0.00 0.00 0.00 0.00 0.00 LABOR 2.70 51.82 0.57 0.00 0.00 0.00 54.81 237.95 171.88 856.58 122.22 0.00 LEASE * 0.00 0.00 0.00 0.00 0.00 0.00 0.00 0.00 0.00 0.00 0.00 0.00 FUEL 1.83 15.16 0.29 0.00 0.00 0.00 6.12 6.70 4.11 6.97 8.82 0.00 REPAIR & MAINTENANCE 0.63 6.26 0.11 0.00 0.00 0.00 1.07 1.30 1.21 1.31 2.52 0.00 INTEREST ON OP. CAP. 0.80 67.14 0.42 0.00 0.00 0.00 44.94 5.54 4.97 42.65 0.96 0.00 -------- -------- -------- -------- -------- -------- -------- -------- -------- -------- -------- -------- TOTAL DIRECT EXPENSES 21.14 1927.85 13.37 0.00 0.00 0.00 2535.69 387.79 464.16 5953.51 266.52 0.00 NET INCOME -21.14 -1927.85 -13.37 0.00 0.00 0.00 -2535.69 -387.79 -464.16 -5953.51 -266.52 0.00 NET INCOME TO DATE -21.14 -1948.99 -1962.36 -1962.36 -1962.36 -1962.36 -4498.05 -4885.84 -5350.00-11303.51-11570.03-11570.03 __________________________________________________________________________________________________________________________________ Note: Cost of production estimates are based on 2010 input prices. Fertilization decisions should be based on soil tests. Irrigation implies 6 acre inches applied as needed over the production period for both fertigation and water needs. * Lease costs are based on hourly usage costs.

10
Table 1.D Breakeven price above total expenses and net returns for price/yield combinations, per acre Bell pepper, fresh market, irrigated 6 ft row spacing, 16 gpm with 7,260 ft of drip tape, Mississippi, 2011 ________________________________________________________________________________________________________________________ -------------------------------------------BREAKEVEN PRICE---------------------------------------- Bell Pepper 4.98 5.22 5.50 5.82 6.20 6.66 7.22 7.92 8.82 10.02 11.70 ________________________________________________________________________________________________________________________ PERCENT YIELD UNIT ---------------------------------------------dollars---------------------------------------------- 50 900.00 Bu -5612 -5396 -5147 -4856 -4513 -4101 -3598 -2968 -2159 -1080 429 -6041 -5826 -5577 -5286 -4943 -4531 -4027 -3398 -2589 -1510 0 60 1080.00 Bu -5007 -4748 -4450 -4101 -3689 -3195 -2591 -1835 -864 429 2242 -5437 -5178 -4879 -4531 -4119 -3625 -3020 -2265 -1294 0 1812 70 1260.00 Bu -4403 -4101 -3753 -3346 -2865 -2289 -1584 -703 429 1940 4054 -4833 -4531 -4182 -3776 -3295 -2718 -2013 -1132 0 1510 3625 80 1440.00 Bu -3799 -3454 -3055 -2591 -2041 -1382 -577 429 1724 3450 5867 -4229 -3884 -3485 -3020 -2471 -1812 -1006 0 1294 3020 5437 90 1620.00 Bu -3195 -2806 -2358 -1835 -1218 -476 429 1562 3019 4961 7679 -3625 -3236 -2788 -2265 -1647 -906 0 1132 2589 4531 7250 100 1800.00 Bu -2591 -2159 -1661 -1080 -394 429 1436 2695 4313 6471 9492 -3020 -2589 -2091 -1510 -823 0 1006 2265 3884 6041 9062 110 1980.00 Bu -1986 -1512 -964 -325 429 1336 2443 3828 5608 7982 11305 -2416 -1942 -1394 -755 0 906 2013 3398 5178 7552 10875 120 2160.00 Bu -1382 -864 -267 429 1253 2242 3450 4961 6903 9492 13117 -1812 -1294 -697 0 823 1812 3020 4531 6473 9062 12687 130 2340.00 Bu -778 -217 429 1184 2077 3148 4457 6093 8197 11002 14930 -1208 -647 0 755 1647 2718 4027 5664 7768 10573 14500 140 2520.00 Bu -174 429 1126 1940 2901 4054 5464 7226 9492 12513 16742 -604 0 697 1510 2471 3625 5034 6797 9062 12083 16312 150 2700.00 Bu 429 1077 1824 2695 3725 4961 6471 8359 10787 14023 18555 0 647 1394 2265 3295 4531 6041 7929 10357 13594 18125 ________________________________________________________________________________________________________________________ The top number in each cell is Returns Above Direct Expenses. The bottom number in each cell is Returns Above Total Specified Expenses. Only the product listed has been varied to calculate net returns. Note: Cost of production estimates are based on 2010 input prices.

11
Table 2.A Estimated resource use and costs for field operations, per acre Broccoli, fall, fresh market Mississippi, 2011 _______________________________________________________________________________________________________________________________________________ POWER UNIT COST EQUIPMENT COST ALLOC LABOR OPERATING/DURABLE INPUT OPERATION/ SIZE/ POWER UNIT PERF TIMES -------------- -------------- ------------- ----------------------- TOTAL OPERATING INPUT UNIT SIZE RATE OVER MTH DIRECT FIXED DIRECT FIXED HOURS COST AMOUNT PRICE COST COST _______________________________________________________________________________________________________________________________________________ ------------dollars----------- dollars ---------dollars--------- Lime (Spread) ton 0.33 Jul 0.4950 46.00 22.77 22.77 Chisel Plow 7 ' 2WD 75 hp 0.220 1.00 Aug 2.25 1.38 0.28 0.50 0.22 2.50 6.91 Disk Harrow 10' 2WD 75 hp 0.198 2.00 Aug 4.06 2.48 0.87 1.90 0.39 4.50 13.81 Fert-Cyclone Spin 750 lb 2WD 75 hp 0.084 1.00 Aug 0.86 0.53 0.06 0.24 0.08 0.96 2.65 Fert 13-13-13 cwt 8.0000 15.43 123.44 123.44 Disk + Incorporate 10' 2WD 75 hp 0.206 1.00 Aug 2.11 1.29 0.80 1.45 0.30 3.28 8.93 Treflan HFP pt 1.5000 3.11 4.67 4.67 Plntr/H20 Wheel 2-Row 2WD 75 hp 1.473 1.00 Aug 15.07 9.20 4.98 8.42 8.83 83.75 121.42 PLANTING LABOR hour 30.00 273.00 273.00 Broccoli Plants thous 18.0000 40.00 720.00 720.00 Cultivate+App Ins 4-Row 2WD 75 hp 0.193 1.00 Aug 1.98 1.21 0.10 0.28 0.29 3.08 6.65 Bravo Weather Stick pt 1.5000 5.69 8.54 8.54 Diazinon AG600 pt 1.0000 5.92 5.92 5.92 Sprayer Air Blast 16' 100 ga 2WD 75 hp 0.245 1.00 Sep 2.52 1.53 9.34 16.87 0.24 2.79 33.05 Bravo Weather Stick pt 1.5000 5.69 8.54 8.54 Dipel ES pt 1.0000 4.56 4.56 4.56 Cultivate+Sidedress 4-Row 2WD 75 hp 0.193 1.00 Sep 1.98 1.21 0.72 3.34 0.29 3.08 10.33 Amm Nitrate (34%) cwt 2.3000 18.00 41.40 41.40 Sprayer Air Blast 16' 100 ga 2WD 75 hp 0.245 1.00 Sep 2.52 1.53 9.34 16.87 0.24 2.79 33.05 Diazinon AG600 pt 1.0000 5.92 5.92 5.92 Sprayer Air Blast 16' 100 ga 2WD 75 hp 0.245 1.00 Sep 2.52 1.53 9.34 16.87 0.24 2.79 33.05 Bravo Weather Stick pt 1.5000 5.69 8.54 8.54 Sprayer Air Blast 16' 100 ga 2WD 75 hp 0.245 1.00 Oct 2.52 1.53 9.34 16.87 0.24 2.79 33.05 Dipel ES pt 1.0000 4.56 4.56 4.56 Trailer - Vegetables 16' 2WD 75 hp 0.090 1.00 Nov 0.92 0.56 0.05 0.08 0.18 1.84 3.45 HARVEST & PACK LABOR hour 1.00 Nov 125.00 1137.50 1137.50 Boxes-Waxed each 300.0000 1.62 486.00 486.00 Ice + Cooling box 300.0000 0.75 225.00 225.00 ------- ------- ------- ------- ------ ------- ------- -------- TOTALS 39.31 23.98 45.22 83.69 166.59 1524.65 1669.86 3386.71 INTEREST ON OPERATING CAPITAL 26.89 UNALLOCATED LABOR 8.72 TOTAL SPECIFIED COST 3422.32 _______________________________________________________________________________________________________________________________________________ Note: Cost of production estimates are based on 2010 input prices. Fertilization decisions should be based on soil tests.

12
Table 2.B Estimated costs per acre Broccoli, fall, fresh market Mississippi, 2011 _______________________________________________________________________ ITEM UNIT PRICE QUANTITY AMOUNT YOUR FARM _______________________________________________________________________ dollars dollars DIRECT EXPENSES FERTILIZER Lime (Spread) ton 46.00 0.4950 22.77 _________ Fert 13-13-13 cwt 15.43 8.0000 123.44 _________ Amm Nitrate (34%) cwt 18.00 2.3000 41.40 _________ FUNGICIDE Bravo Weather Stick pt 5.69 4.5000 25.61 _________ HERBICIDE Treflan HFP pt 3.11 1.5000 4.67 _________ INSECTICIDE Diazinon AG600 pt 5.92 2.0000 11.84 _________ Dipel ES pt 4.56 2.0000 9.12 _________ SEED/PLANTS Broccoli Plants thous 40.00 18.0000 720.00 _________ OTHER Boxes-Waxed each 1.62 300.0000 486.00 _________ Ice + Cooling box 0.75 300.0000 225.00 _________ OPERATOR LABOR Tractors hour 11.35 3.8404 43.60 _________ PLANTING LABOR Special Labor hour 9.10 30.0000 273.00 _________ HAND LABOR Implements hour 9.10 7.7530 70.55 _________ HARVEST & PACK LABOR Special Labor hour 9.10 125.0000 1137.50 _________ UNALLOCATED LABOR hour 11.35 0.7680 8.72 _________ DIESEL FUEL Tractors gal 2.39 14.8256 35.45 _________ REPAIR & MAINTENANCE Implements acre 45.22 1.0000 45.22 _________ Tractors acre 3.86 1.0000 3.86 _________ INTEREST ON OP. CAP. acre 26.89 1.0000 26.89 _________ --------- TOTAL DIRECT EXPENSES 3314.65 _________ FIXED EXPENSES Implements acre 83.69 1.0000 83.69 _________ Tractors acre 23.98 1.0000 23.98 _________ --------- TOTAL FIXED EXPENSES 107.67 _________ --------- TOTAL SPECIFIED EXPENSES 3422.32 _________ _______________________________________________________________________ Note: Cost of production estimates are based on 2010 input prices. Fertilization decisions should be based on soil tests.

13
Table 2.C Estimated monthly income and expense flows per acre Broccoli, fall, fresh market Mississippi, 2011 __________________________________________________________________________________________________________________________________ ITEM Jul Aug Sep Oct Nov Dec Jan Feb Mar Apr May Jun __________________________________________________________________________________________________________________________________ --------------------------------------------------dollars-------------------------------------------------- TOTAL INCOME 0.00 0.00 0.00 0.00 0.00 0.00 0.00 0.00 0.00 0.00 0.00 0.00 DIRECT EXPENSES FERTILIZER 22.77 123.44 41.40 0.00 0.00 0.00 0.00 0.00 0.00 0.00 0.00 0.00 FUNGICIDE 0.00 8.54 17.08 0.00 0.00 0.00 0.00 0.00 0.00 0.00 0.00 0.00 HERBICIDE 0.00 4.67 0.00 0.00 0.00 0.00 0.00 0.00 0.00 0.00 0.00 0.00 INSECTICIDE 0.00 5.92 10.48 4.56 0.00 0.00 0.00 0.00 0.00 0.00 0.00 0.00 SEED/PLANTS 0.00 720.00 0.00 0.00 0.00 0.00 0.00 0.00 0.00 0.00 0.00 0.00 OTHER 0.00 0.00 0.00 0.00 711.00 0.00 0.00 0.00 0.00 0.00 0.00 0.00 LABOR 0.00 376.91 13.57 3.35 1139.54 0.00 0.00 0.00 0.00 0.00 0.00 0.00 LEASE * 0.00 0.00 0.00 0.00 0.00 0.00 0.00 0.00 0.00 0.00 0.00 0.00 FUEL 0.00 23.75 8.60 2.27 0.83 0.00 0.00 0.00 0.00 0.00 0.00 0.00 REPAIR & MAINTENANCE 0.00 9.67 29.68 9.59 0.14 0.00 0.00 0.00 0.00 0.00 0.00 0.00 INTEREST ON OP. CAP. 0.41 18.38 1.29 0.14 6.67 0.00 0.00 0.00 0.00 0.00 0.00 0.00 -------- -------- -------- -------- -------- -------- -------- -------- -------- -------- -------- -------- TOTAL DIRECT EXPENSES 23.18 1291.28 122.10 19.91 1858.18 0.00 0.00 0.00 0.00 0.00 0.00 0.00 NET INCOME -23.18 -1291.28 -122.10 -19.91 -1858.18 0.00 0.00 0.00 0.00 0.00 0.00 0.00 NET INCOME TO DATE -23.18 -1314.46 -1436.56 -1456.47 -3314.65 -3314.65 -3314.65 -3314.65 -3314.65 -3314.65 -3314.65 -3314.65 __________________________________________________________________________________________________________________________________ Note: Cost of production estimates are based on 2010 input prices. Fertilization decisions should be based on soil tests. * Lease costs are based on hourly usage costs.

14
Table 2.D Breakeven price above total expenses and net returns for price/yield combinations, per acre Broccoli, fall, fresh market Mississippi, 2011 ________________________________________________________________________________________________________________________ -------------------------------------------BREAKEVEN PRICE---------------------------------------- Broccoli 8.14 8.61 9.15 9.77 10.51 11.40 12.49 13.85 15.59 17.92 21.18 ________________________________________________________________________________________________________________________ PERCENT YIELD UNIT ---------------------------------------------dollars---------------------------------------------- 50 150.00 21lb -1848 -1778 -1698 -1604 -1493 -1359 -1196 -992 -730 -381 107 -1956 -1886 -1805 -1711 -1600 -1467 -1304 -1100 -838 -489 0 60 180.00 21lb -1653 -1569 -1472 -1359 -1226 -1066 -870 -625 -311 107 694 -1760 -1676 -1580 -1467 -1333 -1173 -978 -733 -419 0 586 70 210.00 21lb -1457 -1359 -1246 -1115 -959 -772 -544 -259 107 596 1281 -1565 -1467 -1354 -1222 -1067 -880 -652 -366 0 489 1173 80 240.00 21lb -1261 -1150 -1021 -870 -692 -479 -218 107 526 1085 1868 -1369 -1257 -1128 -978 -800 -586 -326 0 419 978 1760 90 270.00 21lb -1066 -940 -795 -625 -425 -185 107 474 946 1574 2455 -1173 -1048 -902 -733 -533 -293 0 366 838 1467 2347 100 300.00 21lb -870 -730 -569 -381 -159 107 433 841 1365 2064 3042 -978 -838 -677 -489 -266 0 326 733 1257 1956 2934 110 330.00 21lb -674 -521 -343 -136 107 401 759 1208 1784 2553 3629 -782 -628 -451 -244 0 293 652 1100 1676 2445 3521 120 360.00 21lb -479 -311 -118 107 374 694 1085 1574 2203 3042 4216 -586 -419 -225 0 266 586 978 1467 2096 2934 4108 130 390.00 21lb -283 -101 107 352 641 988 1411 1941 2623 3531 4802 -391 -209 0 244 533 880 1304 1834 2515 3423 4695 140 420.00 21lb -87 107 333 596 908 1281 1737 2308 3042 4020 5389 -195 0 225 489 800 1173 1630 2200 2934 3912 5282 150 450.00 21lb 107 317 559 841 1174 1574 2064 2675 3461 4509 5976 0 209 451 733 1067 1467 1956 2567 3353 4401 5869 ________________________________________________________________________________________________________________________ The top number in each cell is Returns Above Direct Expenses. The bottom number in each cell is Returns Above Total Specified Expenses. Only the product listed has been varied to calculate net returns. Note: Cost of production estimates are based on 2010 input prices.

15
Table 3.A Estimated resource use and costs for field operations, per acre Cabbage, spring, hand harvest Mississippi, 2011 _______________________________________________________________________________________________________________________________________________ POWER UNIT COST EQUIPMENT COST ALLOC LABOR OPERATING/DURABLE INPUT OPERATION/ SIZE/ POWER UNIT PERF TIMES -------------- -------------- ------------- ----------------------- TOTAL OPERATING INPUT UNIT SIZE RATE OVER MTH DIRECT FIXED DIRECT FIXED HOURS COST AMOUNT PRICE COST COST _______________________________________________________________________________________________________________________________________________ ------------dollars----------- dollars ---------dollars--------- Lime (Spread) ton 0.33 Jan 0.4950 46.00 22.77 22.77 Fert-Cyclone Spin 750 lb 2WD 75 hp 0.084 1.00 Feb 0.86 0.53 0.06 0.24 0.08 0.96 2.65 Fert 13-13-13 cwt 8.0000 15.43 123.44 123.44 Chisel Plow 7 ' 2WD 75 hp 0.220 1.00 Feb 2.25 1.38 0.28 0.50 0.22 2.50 6.91 Disk Harrow 10' 2WD 75 hp 0.198 1.00 Feb 2.03 1.24 0.43 0.95 0.19 2.25 6.90 Disk Bed 2-Row 2WD 75 hp 0.284 1.00 Feb 2.90 1.77 0.24 0.96 0.28 3.22 9.09 Cultivate+App Herb 4-Row 2WD 75 hp 0.193 1.00 Feb 1.98 1.21 0.10 0.28 0.29 3.08 6.65 Treflan HFP pt 2.0000 3.11 6.22 6.22 Plntr/H20 Wheel 2-Row 2WD 75 hp 1.473 1.00 Feb 15.07 9.20 4.98 8.42 8.83 83.75 121.42 PLANTING LABOR hour 30.00 273.00 273.00 Cabbage Plants thous 13.2000 32.00 422.40 422.40 Cultivate 4-Row 2WD 75 hp 0.155 3.00 Mar 4.76 2.91 0.92 2.50 0.46 5.28 16.37 Sprayer Air Blast 16' 100 ga 2WD 75 hp 0.245 1.00 Mar 2.52 1.53 9.34 16.87 0.24 2.79 33.05 Bravo Weather Stick pt 1.5000 5.69 8.54 8.54 Kocide lb 2.0000 3.54 7.08 7.08 Cultivate+Sidedress 4-Row 2WD 75 hp 0.193 1.00 Mar 1.98 1.21 0.72 3.34 0.29 3.08 10.33 Amm Nitrate (34%) cwt 1.0000 18.00 18.00 18.00 Sprayer Air Blast 16' 100 ga 2WD 75 hp 0.245 1.00 Apr 2.52 1.53 9.34 16.87 0.24 2.79 33.05 Endosulfan 3EC pt 1.3300 3.75 4.99 4.99 Dipel ES pt 1.0000 4.56 4.56 4.56 Fert-Side Dresser 2R 6' 2WD 75 hp 0.423 1.00 Apr 4.32 2.64 3.06 12.35 0.42 4.80 27.17 Amm Nitrate (34%) cwt 1.0000 18.00 18.00 18.00 Sprayer Air Blast 16' 100 ga 2WD 75 hp 0.245 1.00 May 2.52 1.53 9.34 16.87 0.24 2.79 33.05 Endosulfan 3EC pt 1.3300 3.75 4.99 4.99 Dipel ES pt 1.0000 4.56 4.56 4.56 Sprayer Air Blast 16' 100 ga 2WD 75 hp 0.245 1.00 May 2.52 1.53 9.34 16.87 0.24 2.79 33.05 Asana XL oz 6.0000 0.68 4.08 4.08 Dipel ES pt 1.0000 4.56 4.56 4.56 Sprayer Air Blast 16' 100 ga 2WD 75 hp 0.245 1.00 May 2.52 1.53 9.34 16.87 0.24 2.79 33.05 Confirm 2F oz 24.0000 1.62 38.88 38.88 Dipel ES pt 1.0000 4.56 4.56 4.56 Trailer - Vegetables 16' 2WD 75 hp 0.090 1.00 Jun 0.92 0.56 0.05 0.08 0.18 1.84 3.45 Harv.Labor S.Cabbage box 1.00 Jun 600.0000 1.35 810.00 810.00 Grd & Pack S.Cabbage box 1.00 Jun 600.0000 1.40 840.00 840.00 Box Cabbage each 600.0000 2.38 1428.00 1428.00 Marketing Fee box 1.00 Jun 600.0000 1.00 600.00 600.00 CoolingBox S.Cabbage box 1.00 Jun 600.0000 0.25 150.00 150.00 ------- ------- ------- ------- ------ ------- ------- -------- TOTALS 49.67 30.30 57.54 113.97 42.50 397.71 4525.63 5174.82 INTEREST ON OPERATING CAPITAL 33.91 UNALLOCATED LABOR 11.02 TOTAL SPECIFIED COST 5219.75 _______________________________________________________________________________________________________________________________________________ Note: Cost of production estimates are based on 2010 input prices. Fertilization decisions should be based on soil tests.
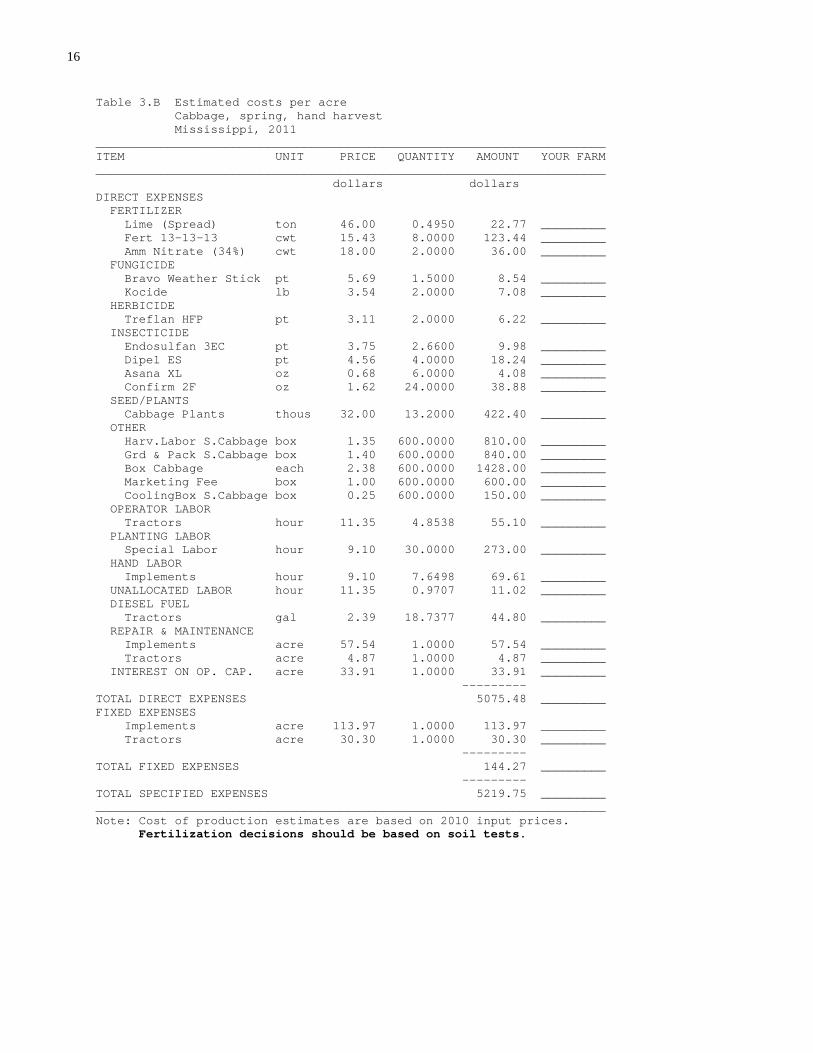
16
Table 3.B Estimated costs per acre Cabbage, spring, hand harvest Mississippi, 2011 _______________________________________________________________________ ITEM UNIT PRICE QUANTITY AMOUNT YOUR FARM _______________________________________________________________________ dollars dollars DIRECT EXPENSES FERTILIZER Lime (Spread) ton 46.00 0.4950 22.77 _________ Fert 13-13-13 cwt 15.43 8.0000 123.44 _________ Amm Nitrate (34%) cwt 18.00 2.0000 36.00 _________ FUNGICIDE Bravo Weather Stick pt 5.69 1.5000 8.54 _________ Kocide lb 3.54 2.0000 7.08 _________ HERBICIDE Treflan HFP pt 3.11 2.0000 6.22 _________ INSECTICIDE Endosulfan 3EC pt 3.75 2.6600 9.98 _________ Dipel ES pt 4.56 4.0000 18.24 _________ Asana XL oz 0.68 6.0000 4.08 _________ Confirm 2F oz 1.62 24.0000 38.88 _________ SEED/PLANTS Cabbage Plants thous 32.00 13.2000 422.40 _________ OTHER Harv.Labor S.Cabbage box 1.35 600.0000 810.00 _________ Grd & Pack S.Cabbage box 1.40 600.0000 840.00 _________ Box Cabbage each 2.38 600.0000 1428.00 _________ Marketing Fee box 1.00 600.0000 600.00 _________ CoolingBox S.Cabbage box 0.25 600.0000 150.00 _________ OPERATOR LABOR Tractors hour 11.35 4.8538 55.10 _________ PLANTING LABOR Special Labor hour 9.10 30.0000 273.00 _________ HAND LABOR Implements hour 9.10 7.6498 69.61 _________ UNALLOCATED LABOR hour 11.35 0.9707 11.02 _________ DIESEL FUEL Tractors gal 2.39 18.7377 44.80 _________ REPAIR & MAINTENANCE Implements acre 57.54 1.0000 57.54 _________ Tractors acre 4.87 1.0000 4.87 _________ INTEREST ON OP. CAP. acre 33.91 1.0000 33.91 _________ --------- TOTAL DIRECT EXPENSES 5075.48 _________ FIXED EXPENSES Implements acre 113.97 1.0000 113.97 _________ Tractors acre 30.30 1.0000 30.30 _________ --------- TOTAL FIXED EXPENSES 144.27 _________ --------- TOTAL SPECIFIED EXPENSES 5219.75 _________ _______________________________________________________________________ Note: Cost of production estimates are based on 2010 input prices. Fertilization decisions should be based on soil tests.

17
Table 3.C Estimated monthly income and expense flows per acre Cabbage, spring, hand harvest Mississippi, 2011 __________________________________________________________________________________________________________________________________ ITEM Jan Feb Mar Apr May Jun Jul Aug Sep Oct Nov Dec __________________________________________________________________________________________________________________________________ --------------------------------------------------dollars-------------------------------------------------- TOTAL INCOME 0.00 0.00 0.00 0.00 0.00 0.00 0.00 0.00 0.00 0.00 0.00 0.00 DIRECT EXPENSES FERTILIZER 22.77 123.44 18.00 18.00 0.00 0.00 0.00 0.00 0.00 0.00 0.00 0.00 FUNGICIDE 0.00 0.00 15.62 0.00 0.00 0.00 0.00 0.00 0.00 0.00 0.00 0.00 HERBICIDE 0.00 6.22 0.00 0.00 0.00 0.00 0.00 0.00 0.00 0.00 0.00 0.00 INSECTICIDE 0.00 0.00 0.00 9.55 61.63 0.00 0.00 0.00 0.00 0.00 0.00 0.00 SEED/PLANTS 0.00 422.40 0.00 0.00 0.00 0.00 0.00 0.00 0.00 0.00 0.00 0.00 OTHER 0.00 0.00 0.00 0.00 0.00 3828.00 0.00 0.00 0.00 0.00 0.00 0.00 LABOR 0.00 374.32 13.21 9.11 10.05 2.04 0.00 0.00 0.00 0.00 0.00 0.00 LEASE * 0.00 0.00 0.00 0.00 0.00 0.00 0.00 0.00 0.00 0.00 0.00 0.00 FUEL 0.00 22.64 8.35 6.17 6.81 0.83 0.00 0.00 0.00 0.00 0.00 0.00 REPAIR & MAINTENANCE 0.00 8.54 11.89 13.07 28.77 0.14 0.00 0.00 0.00 0.00 0.00 0.00 INTEREST ON OP. CAP. 0.49 17.28 0.96 0.59 0.77 13.82 0.00 0.00 0.00 0.00 0.00 0.00 -------- -------- -------- -------- -------- -------- -------- -------- -------- -------- -------- -------- TOTAL DIRECT EXPENSES 23.26 974.84 68.03 56.49 108.03 3844.83 0.00 0.00 0.00 0.00 0.00 0.00 NET INCOME -23.26 -974.84 -68.03 -56.49 -108.03 -3844.83 0.00 0.00 0.00 0.00 0.00 0.00 NET INCOME TO DATE -23.26 -998.10 -1066.13 -1122.62 -1230.65 -5075.48 -5075.48 -5075.48 -5075.48 -5075.48 -5075.48 -5075.48 __________________________________________________________________________________________________________________________________ Note: Cost of production estimates are based on 2010 input prices. Fertilization decisions should be based on soil tests. * Lease costs are based on hourly usage costs.
18
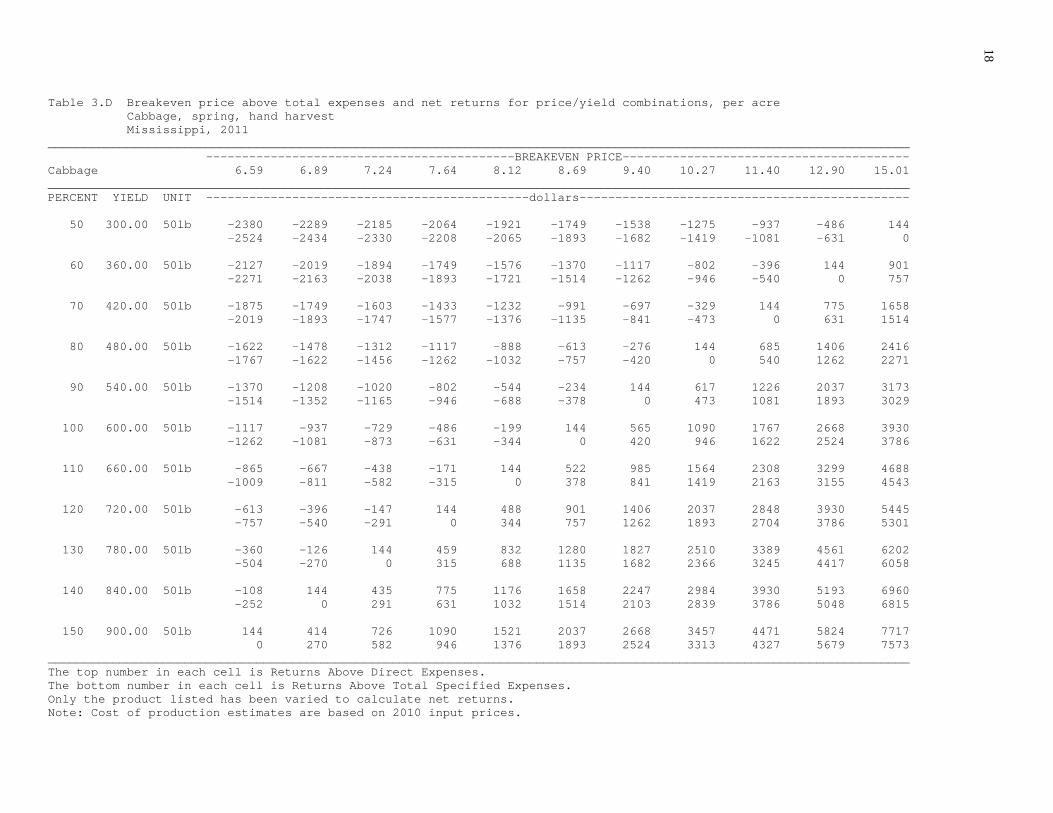
Table 3.D Breakeven price above total expenses and net returns for price/yield combinations, per acre Cabbage, spring, hand harvest Mississippi, 2011 ________________________________________________________________________________________________________________________ -------------------------------------------BREAKEVEN PRICE---------------------------------------- Cabbage 6.59 6.89 7.24 7.64 8.12 8.69 9.40 10.27 11.40 12.90 15.01 ________________________________________________________________________________________________________________________ PERCENT YIELD UNIT ---------------------------------------------dollars---------------------------------------------- 50 300.00 50lb -2380 -2289 -2185 -2064 -1921 -1749 -1538 -1275 -937 -486 144 -2524 -2434 -2330 -2208 -2065 -1893 -1682 -1419 -1081 -631 0 60 360.00 50lb -2127 -2019 -1894 -1749 -1576 -1370 -1117 -802 -396 144 901 -2271 -2163 -2038 -1893 -1721 -1514 -1262 -946 -540 0 757 70 420.00 50lb -1875 -1749 -1603 -1433 -1232 -991 -697 -329 144 775 1658 -2019 -1893 -1747 -1577 -1376 -1135 -841 -473 0 631 1514 80 480.00 50lb -1622 -1478 -1312 -1117 -888 -613 -276 144 685 1406 2416 -1767 -1622 -1456 -1262 -1032 -757 -420 0 540 1262 2271 90 540.00 50lb -1370 -1208 -1020 -802 -544 -234 144 617 1226 2037 3173 -1514 -1352 -1165 -946 -688 -378 0 473 1081 1893 3029 100 600.00 50lb -1117 -937 -729 -486 -199 144 565 1090 1767 2668 3930 -1262 -1081 -873 -631 -344 0 420 946 1622 2524 3786 110 660.00 50lb -865 -667 -438 -171 144 522 985 1564 2308 3299 4688 -1009 -811 -582 -315 0 378 841 1419 2163 3155 4543 120 720.00 50lb -613 -396 -147 144 488 901 1406 2037 2848 3930 5445 -757 -540 -291 0 344 757 1262 1893 2704 3786 5301 130 780.00 50lb -360 -126 144 459 832 1280 1827 2510 3389 4561 6202 -504 -270 0 315 688 1135 1682 2366 3245 4417 6058 140 840.00 50lb -108 144 435 775 1176 1658 2247 2984 3930 5193 6960 -252 0 291 631 1032 1514 2103 2839 3786 5048 6815 150 900.00 50lb 144 414 726 1090 1521 2037 2668 3457 4471 5824 7717 0 270 582 946 1376 1893 2524 3313 4327 5679 7573 ________________________________________________________________________________________________________________________ The top number in each cell is Returns Above Direct Expenses. The bottom number in each cell is Returns Above Total Specified Expenses. Only the product listed has been varied to calculate net returns. Note: Cost of production estimates are based on 2010 input prices.

19
Table 4.A Estimated resource use and costs for field operations, per acre Cucumbers, slicers, irrigated 5 ft row spacing, 20 gpm with 8,712 ft of drip tape, Mississippi, 2011 _______________________________________________________________________________________________________________________________________________ POWER UNIT COST EQUIPMENT COST ALLOC LABOR OPERATING/DURABLE INPUT OPERATION/ SIZE/ POWER UNIT PERF TIMES -------------- -------------- ------------- ----------------------- TOTAL OPERATING INPUT UNIT SIZE RATE OVER MTH DIRECT FIXED DIRECT FIXED HOURS COST AMOUNT PRICE COST COST _______________________________________________________________________________________________________________________________________________ ------------dollars----------- dollars ---------dollars--------- Lime (Spread) ton 0.33 Mar 0.4950 46.00 22.77 22.77 Chisel Plow 7 ' 2WD 75 hp 0.220 1.00 Mar 2.25 1.38 0.28 0.50 0.22 2.50 6.91 Fert-Cyclone Spin 750 lb 2WD 75 hp 0.084 1.00 Mar 0.86 0.53 0.06 0.24 0.08 0.96 2.65 Fert 13-13-13 cwt 6.0000 15.43 92.58 92.58 Disk Harrow 10' 2WD 75 hp 0.198 1.00 Mar 2.03 1.24 0.43 0.95 0.19 2.25 6.90 Disk + Incorporate 10' 2WD 75 hp 0.206 1.00 Apr 2.11 1.29 0.80 1.45 0.30 3.28 8.93 Diazinon AG600 pt 6.0000 5.92 35.52 35.52 BS,Lay/Tape/Cucumber Bed 4'cntr 2WD 75 hp 1.617 1.00 Apr 16.55 10.10 2.41 7.13 1.61 18.36 54.55 Plastic Mulch roll 2.2000 162.00 356.40 356.40 Drip Tape roll 1.5000 147.50 221.25 221.25 Plntr/H20 Cucumber 1R 4'cntr 2WD 75 hp 2.578 1.00 Apr 26.38 16.10 2.30 3.90 10.31 99.64 148.32 Cucumber - Hybrid lb 3.0000 107.00 321.00 321.00 Irrigation 1.00 Apr Rural Water ac-in 6.0000 75.01 450.06 450.06 Sprayer Air Blast 16' 100 ga 2WD 75 hp 0.245 1.00 Apr 2.52 1.53 9.34 16.87 0.24 2.79 33.05 Asana XL oz 6.0000 0.68 4.08 4.08 Fertigate CAN03/KN03 2.00 Apr FERTIGATION LABOR hour 2.00 18.20 18.20 Calcium Nitrate lb 50.0000 0.35 17.50 17.50 Spray (Broadcast) 27' 2WD 75 hp 0.062 1.00 Apr 0.64 0.39 0.15 0.18 0.09 1.00 2.36 Sandea oz 0.5000 38.45 19.23 19.23 Select 2EC oz 6.0000 1.53 9.18 9.18 Sprayer Air Blast 16' 100 ga 2WD 75 hp 0.245 1.00 Apr 2.52 1.53 9.34 16.87 0.24 2.79 33.05 Bravo Weather Stick pt 1.5000 5.69 8.54 8.54 Fertigate CAN03/KN03 2.00 May FERTIGATION LABOR hour 2.00 18.20 18.20 Calcium Nitrate lb 50.0000 0.35 17.50 17.50 Sprayer Air Blast 16' 100 ga 2WD 75 hp 0.245 1.00 May 2.52 1.53 9.34 16.87 0.24 2.79 33.05 Bravo Weather Stick pt 1.5000 5.69 8.54 8.54 Asana XL oz 6.0000 0.68 4.08 4.08 Fertigate CAN03/KN03 2.00 May FERTIGATION LABOR hour 2.00 18.20 18.20 Calcium Nitrate lb 50.0000 0.35 17.50 17.50 Fertigate CAN03/KN03 1.00 Jun FERTIGATION LABOR hour 1.00 9.10 9.10 Calcium Nitrate lb 25.0000 0.35 8.75 8.75 Sprayer Air Blast 16' 100 ga 2WD 75 hp 0.245 1.00 Jun 2.52 1.53 9.34 16.87 0.24 2.79 33.05 Asana XL oz 6.0000 0.68 4.08 4.08 Fertigate CAN03/KN03 1.00 Jun FERTIGATION LABOR hour 1.00 9.10 9.10 Calcium Nitrate lb 25.0000 0.35 8.75 8.75 Sprayer Air Blast 16' 100 ga 2WD 75 hp 0.245 1.00 Jun 2.52 1.53 9.34 16.87 0.24 2.79 33.05 Bravo Weather Stick pt 3.0000 5.69 17.07 17.07 Trailer - Vegetables 16' 2WD 75 hp 0.090 1.00 Jun 0.92 0.56 0.05 0.08 0.18 1.84 3.45 (continued)
20
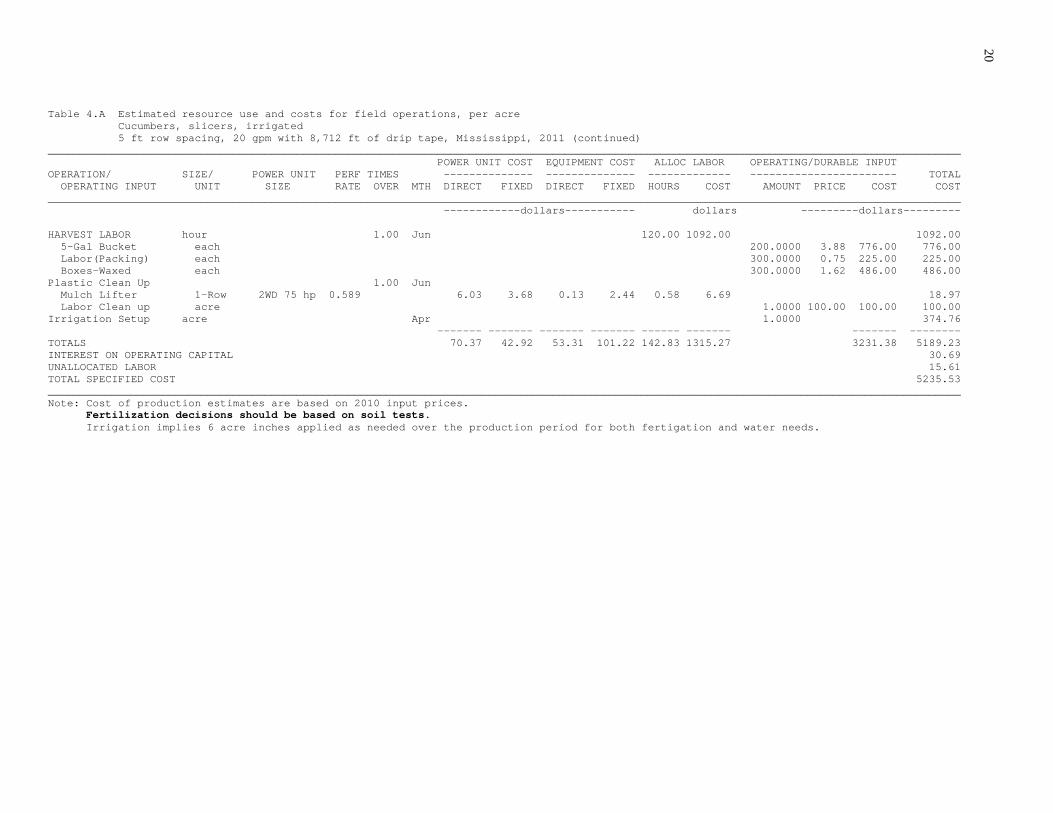
Table 4.A Estimated resource use and costs for field operations, per acre Cucumbers, slicers, irrigated 5 ft row spacing, 20 gpm with 8,712 ft of drip tape, Mississippi, 2011 (continued) _______________________________________________________________________________________________________________________________________________ POWER UNIT COST EQUIPMENT COST ALLOC LABOR OPERATING/DURABLE INPUT OPERATION/ SIZE/ POWER UNIT PERF TIMES -------------- -------------- ------------- ----------------------- TOTAL OPERATING INPUT UNIT SIZE RATE OVER MTH DIRECT FIXED DIRECT FIXED HOURS COST AMOUNT PRICE COST COST _______________________________________________________________________________________________________________________________________________ ------------dollars----------- dollars ---------dollars--------- HARVEST LABOR hour 1.00 Jun 120.00 1092.00 1092.00 5-Gal Bucket each 200.0000 3.88 776.00 776.00 Labor(Packing) each 300.0000 0.75 225.00 225.00 Boxes-Waxed each 300.0000 1.62 486.00 486.00 Plastic Clean Up 1.00 Jun Mulch Lifter 1-Row 2WD 75 hp 0.589 6.03 3.68 0.13 2.44 0.58 6.69 18.97 Labor Clean up acre 1.0000 100.00 100.00 100.00 Irrigation Setup acre Apr 1.0000 374.76 ------- ------- ------- ------- ------ ------- ------- -------- TOTALS 70.37 42.92 53.31 101.22 142.83 1315.27 3231.38 5189.23 INTEREST ON OPERATING CAPITAL 30.69 UNALLOCATED LABOR 15.61 TOTAL SPECIFIED COST 5235.53 _______________________________________________________________________________________________________________________________________________ Note: Cost of production estimates are based on 2010 input prices. Fertilization decisions should be based on soil tests. Irrigation implies 6 acre inches applied as needed over the production period for both fertigation and water needs.

21
Table 4.B Estimated costs per acre Cucumbers, slicers, irrigated 5 ft row spacing, 20 gpm with 8,712 ft of drip tape, Mississippi, 2011 _______________________________________________________________________ ITEM UNIT PRICE QUANTITY AMOUNT YOUR FARM _______________________________________________________________________ dollars dollars DIRECT EXPENSES FERTILIZER Lime (Spread) ton 46.00 0.4950 22.77 _________ Fert 13-13-13 cwt 15.43 6.0000 92.58 _________ Calcium Nitrate lb 0.35 200.0000 70.00 _________ FUNGICIDE Bravo Weather Stick pt 5.69 6.0000 34.14 _________ HERBICIDE Sandea oz 38.45 0.5000 19.23 _________ Select 2EC oz 1.53 6.0000 9.18 _________ INSECTICIDE Diazinon AG600 pt 5.92 6.0000 35.52 _________ Asana XL oz 0.68 18.0000 12.24 _________ SEED/PLANTS Cucumber - Hybrid lb 107.00 3.0000 321.00 _________ OTHER Plastic Mulch roll 162.00 2.2000 356.40 _________ 5-Gal Bucket each 3.88 200.0000 776.00 _________ Labor(Packing) each 0.75 300.0000 225.00 _________ Boxes-Waxed each 1.62 300.0000 486.00 _________ Labor Clean up acre 100.00 1.0000 100.00 _________ IRRIGATION SUPPLIES Drip Tape roll 147.50 1.5000 221.25 _________ Rural Water ac-in 75.01 6.0000 450.06 _________ OPERATOR LABOR Tractors hour 11.35 6.8745 78.04 _________ HARVEST LABOR Special Labor hour 9.10 120.0000 1092.00 _________ HAND LABOR Implements hour 9.10 7.9588 72.43 _________ FERTIGATION LABOR Special Labor hour 9.10 8.0000 72.80 _________ UNALLOCATED LABOR hour 11.35 1.3749 15.61 _________ DIESEL FUEL Tractors gal 2.39 26.5383 63.46 _________ REPAIR & MAINTENANCE Implements acre 53.31 1.0000 53.31 _________ Tractors acre 6.91 1.0000 6.91 _________ INTEREST ON OP. CAP. acre 30.69 1.0000 30.69 _________ --------- TOTAL DIRECT EXPENSES 4716.63 _________ FIXED EXPENSES Implements acre 101.22 1.0000 101.22 _________ Tractors acre 42.92 1.0000 42.92 _________ Irrigation Setup acre 374.76 1.0000 374.76 _________ --------- TOTAL FIXED EXPENSES 518.90 _________ --------- TOTAL SPECIFIED EXPENSES 5235.53 _________ _______________________________________________________________________ Note: Cost of production estimates are based on 2010 input prices. Fertilization decisions should be based on soil tests. Irrigation implies 6 acre inches applied as needed over the production period for both fertigation and water needs.

22
Table 4.C Estimated monthly income and expense flows per acre Cucumbers, slicers, irrigated 5 ft row spacing, 20 gpm with 8,712 ft of drip tape, Mississippi, 2011 __________________________________________________________________________________________________________________________________ ITEM Mar Apr May Jun Jul Aug Sep Oct Nov Dec Jan Feb __________________________________________________________________________________________________________________________________ --------------------------------------------------dollars-------------------------------------------------- TOTAL INCOME 0.00 0.00 0.00 0.00 0.00 0.00 0.00 0.00 0.00 0.00 0.00 0.00 DIRECT EXPENSES FERTILIZER 115.35 17.50 35.00 17.50 0.00 0.00 0.00 0.00 0.00 0.00 0.00 0.00 FUNGICIDE 0.00 8.54 8.54 17.07 0.00 0.00 0.00 0.00 0.00 0.00 0.00 0.00 HERBICIDE 0.00 28.41 0.00 0.00 0.00 0.00 0.00 0.00 0.00 0.00 0.00 0.00 INSECTICIDE 0.00 39.60 4.08 4.08 0.00 0.00 0.00 0.00 0.00 0.00 0.00 0.00 SEED/PLANTS 0.00 321.00 0.00 0.00 0.00 0.00 0.00 0.00 0.00 0.00 0.00 0.00 OTHER 0.00 356.40 0.00 1587.00 0.00 0.00 0.00 0.00 0.00 0.00 0.00 0.00 IRRIGATION SUPPLIES 0.00 671.31 0.00 0.00 0.00 0.00 0.00 0.00 0.00 0.00 0.00 0.00 LABOR 6.85 157.31 39.75 1126.97 0.00 0.00 0.00 0.00 0.00 0.00 0.00 0.00 LEASE * 0.00 0.00 0.00 0.00 0.00 0.00 0.00 0.00 0.00 0.00 0.00 0.00 FUEL 4.64 45.74 2.27 10.81 0.00 0.00 0.00 0.00 0.00 0.00 0.00 0.00 REPAIR & MAINTENANCE 1.27 29.32 9.59 20.04 0.00 0.00 0.00 0.00 0.00 0.00 0.00 0.00 INTEREST ON OP. CAP. 1.85 18.11 0.72 10.01 0.00 0.00 0.00 0.00 0.00 0.00 0.00 0.00 -------- -------- -------- -------- -------- -------- -------- -------- -------- -------- -------- -------- TOTAL DIRECT EXPENSES 129.96 1693.24 99.95 2793.48 0.00 0.00 0.00 0.00 0.00 0.00 0.00 0.00 NET INCOME -129.96 -1693.24 -99.95 -2793.48 0.00 0.00 0.00 0.00 0.00 0.00 0.00 0.00 NET INCOME TO DATE -129.96 -1823.20 -1923.15 -4716.63 -4716.63 -4716.63 -4716.63 -4716.63 -4716.63 -4716.63 -4716.63 -4716.63 __________________________________________________________________________________________________________________________________ Note: Cost of production estimates are based on 2010 input prices. Fertilization decisions should be based on soil tests. Irrigation implies 6 acre inches applied as needed over the production period for both fertigation and water needs. * Lease costs are based on hourly usage costs.
23
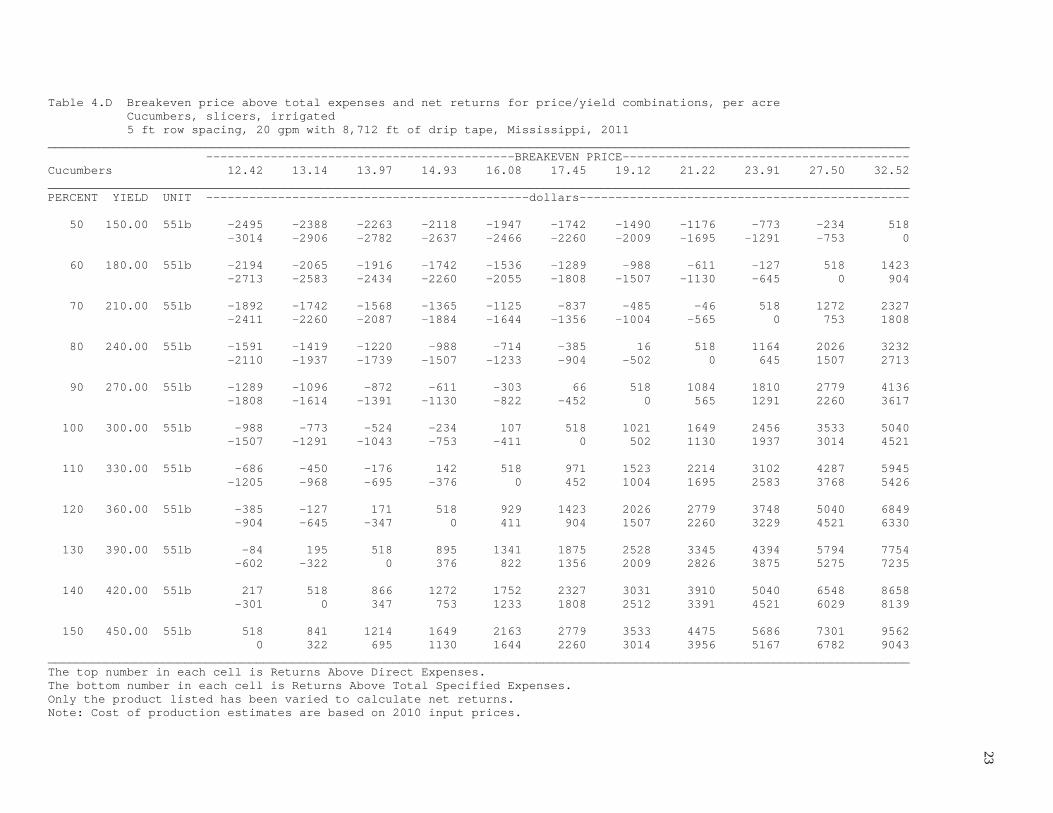
Table 4.D Breakeven price above total expenses and net returns for price/yield combinations, per acre Cucumbers, slicers, irrigated 5 ft row spacing, 20 gpm with 8,712 ft of drip tape, Mississippi, 2011 ________________________________________________________________________________________________________________________ -------------------------------------------BREAKEVEN PRICE---------------------------------------- Cucumbers 12.42 13.14 13.97 14.93 16.08 17.45 19.12 21.22 23.91 27.50 32.52 ________________________________________________________________________________________________________________________ PERCENT YIELD UNIT ---------------------------------------------dollars---------------------------------------------- 50 150.00 55lb -2495 -2388 -2263 -2118 -1947 -1742 -1490 -1176 -773 -234 518 -3014 -2906 -2782 -2637 -2466 -2260 -2009 -1695 -1291 -753 0 60 180.00 55lb -2194 -2065 -1916 -1742 -1536 -1289 -988 -611 -127 518 1423 -2713 -2583 -2434 -2260 -2055 -1808 -1507 -1130 -645 0 904 70 210.00 55lb -1892 -1742 -1568 -1365 -1125 -837 -485 -46 518 1272 2327 -2411 -2260 -2087 -1884 -1644 -1356 -1004 -565 0 753 1808 80 240.00 55lb -1591 -1419 -1220 -988 -714 -385 16 518 1164 2026 3232 -2110 -1937 -1739 -1507 -1233 -904 -502 0 645 1507 2713 90 270.00 55lb -1289 -1096 -872 -611 -303 66 518 1084 1810 2779 4136 -1808 -1614 -1391 -1130 -822 -452 0 565 1291 2260 3617 100 300.00 55lb -988 -773 -524 -234 107 518 1021 1649 2456 3533 5040 -1507 -1291 -1043 -753 -411 0 502 1130 1937 3014 4521 110 330.00 55lb -686 -450 -176 142 518 971 1523 2214 3102 4287 5945 -1205 -968 -695 -376 0 452 1004 1695 2583 3768 5426 120 360.00 55lb -385 -127 171 518 929 1423 2026 2779 3748 5040 6849 -904 -645 -347 0 411 904 1507 2260 3229 4521 6330 130 390.00 55lb -84 195 518 895 1341 1875 2528 3345 4394 5794 7754 -602 -322 0 376 822 1356 2009 2826 3875 5275 7235 140 420.00 55lb 217 518 866 1272 1752 2327 3031 3910 5040 6548 8658 -301 0 347 753 1233 1808 2512 3391 4521 6029 8139 150 450.00 55lb 518 841 1214 1649 2163 2779 3533 4475 5686 7301 9562 0 322 695 1130 1644 2260 3014 3956 5167 6782 9043 ________________________________________________________________________________________________________________________ The top number in each cell is Returns Above Direct Expenses. The bottom number in each cell is Returns Above Total Specified Expenses. Only the product listed has been varied to calculate net returns. Note: Cost of production estimates are based on 2010 input prices.

24
Table 5.A Estimated resource use and costs for field operations, per acre Greens (turnip, mustard, collards), fresh market Mississippi, 2011 _______________________________________________________________________________________________________________________________________________ POWER UNIT COST EQUIPMENT COST ALLOC LABOR OPERATING/DURABLE INPUT OPERATION/ SIZE/ POWER UNIT PERF TIMES -------------- -------------- ------------- ----------------------- TOTAL OPERATING INPUT UNIT SIZE RATE OVER MTH DIRECT FIXED DIRECT FIXED HOURS COST AMOUNT PRICE COST COST _______________________________________________________________________________________________________________________________________________ ------------dollars----------- dollars ---------dollars--------- Lime (Spread) ton 0.33 Jan 0.4950 46.00 22.77 22.77 Chisel Plow 7 ' 2WD 75 hp 0.220 1.00 Aug 2.25 1.38 0.28 0.50 0.22 2.50 6.91 Disk Harrow 10' 2WD 75 hp 0.198 2.00 Aug 4.06 2.48 0.87 1.90 0.39 4.50 13.81 Fert-Cyclone Spin 750 lb 2WD 75 hp 0.084 1.00 Aug 0.86 0.53 0.06 0.24 0.08 0.96 2.65 Fert 13-13-13 cwt 6.0000 15.43 92.58 92.58 Disk + Incorporate 10' 2WD 75 hp 0.206 1.00 Aug 2.11 1.29 0.80 1.45 0.30 3.28 8.93 Treflan HFP pt 1.5000 3.11 4.67 4.67 Cultipacker 12' 2WD 75 hp 0.124 1.00 Aug 1.27 0.78 0.15 0.21 0.12 1.41 3.82 Plntr - Vacuum+Ins 2R 30-40 2WD 75 hp 0.396 1.00 Sep 4.06 2.48 8.33 13.85 0.39 4.50 33.22 Greens - Hybrid lb 3.3000 105.00 346.50 346.50 Admire Pro oz 8.0000 5.57 44.56 44.56 Fert-Cyclone Spin 750 lb 2WD 75 hp 0.084 1.00 Sep 0.86 0.53 0.06 0.24 0.08 0.96 2.65 Amm Nitrate (34%) cwt 1.0000 18.00 18.00 18.00 Sprayer Air Blast 16' 100 ga 2WD 75 hp 0.245 1.00 Sep 2.52 1.53 9.34 16.87 0.24 2.79 33.05 Kocide lb 1.5000 3.54 5.31 5.31 Quadris oz 15.4000 2.52 38.81 38.81 Sprayer Air Blast 16' 100 ga 2WD 75 hp 0.245 1.00 Sep 2.52 1.53 9.34 16.87 0.24 2.79 33.05 Malathion 5E pt 2.0000 4.09 8.18 8.18 Sprayer Air Blast 16' 100 ga 2WD 75 hp 0.245 1.00 Oct 2.52 1.53 9.34 16.87 0.24 2.79 33.05 Radiant 1SC oz 5.0000 4.99 24.95 24.95 Bins/Stacking each 1.00 Oct 20.0000 2.00 40.00 40.00 Trailer - Vegetables 16' 2WD 75 hp 0.090 1.00 Oct 0.92 0.56 0.05 0.08 0.18 1.84 3.45 HARVEST & PACK LABOR hour 1.00 Oct 175.00 1592.50 1592.50 Boxes-Waxed each 1.00 Oct 500.0000 1.62 810.00 810.00 Cooling Box - Greens box 500.0000 0.25 125.00 125.00 ------- ------- ------- ------- ------ ------- ------- -------- TOTALS 23.95 14.62 38.62 69.08 177.53 1620.82 1581.33 3348.42 INTEREST ON OPERATING CAPITAL 15.26 UNALLOCATED LABOR 5.31 TOTAL SPECIFIED COST 3368.99 _______________________________________________________________________________________________________________________________________________ Note: Cost of production estimates are based on 2010 input prices. Fertilization decisions should be based on soil tests.

25
Table 5.B Estimated costs per acre Greens (turnip, mustard, collards), fresh market Mississippi, 2011 _______________________________________________________________________ ITEM UNIT PRICE QUANTITY AMOUNT YOUR FARM _______________________________________________________________________ dollars dollars DIRECT EXPENSES FERTILIZER Lime (Spread) ton 46.00 0.4950 22.77 _________ Fert 13-13-13 cwt 15.43 6.0000 92.58 _________ Amm Nitrate (34%) cwt 18.00 1.0000 18.00 _________ FUNGICIDE Kocide lb 3.54 1.5000 5.31 _________ Quadris oz 2.52 15.4000 38.81 _________ HERBICIDE Treflan HFP pt 3.11 1.5000 4.67 _________ INSECTICIDE Admire Pro oz 5.57 8.0000 44.56 _________ Malathion 5E pt 4.09 2.0000 8.18 _________ Radiant 1SC oz 4.99 5.0000 24.95 _________ SEED/PLANTS Greens - Hybrid lb 105.00 3.3000 346.50 _________ OTHER Bins/Stacking each 2.00 20.0000 40.00 _________ Boxes-Waxed each 1.62 500.0000 810.00 _________ Cooling Box - Greens box 0.25 500.0000 125.00 _________ OPERATOR LABOR Tractors hour 11.35 2.3392 26.56 _________ HAND LABOR Implements hour 9.10 0.1931 1.76 _________ HARVEST & PACK LABOR Special Labor hour 9.10 175.0000 1592.50 _________ UNALLOCATED LABOR hour 11.34 0.4678 5.31 _________ DIESEL FUEL Tractors gal 2.39 9.0304 21.60 _________ REPAIR & MAINTENANCE Implements acre 38.62 1.0000 38.62 _________ Tractors acre 2.35 1.0000 2.35 _________ INTEREST ON OP. CAP. acre 15.26 1.0000 15.26 _________ --------- TOTAL DIRECT EXPENSES 3285.29 _________ FIXED EXPENSES Implements acre 69.08 1.0000 69.08 _________ Tractors acre 14.62 1.0000 14.62 _________ --------- TOTAL FIXED EXPENSES 83.70 _________ --------- TOTAL SPECIFIED EXPENSES 3368.99 _________ _______________________________________________________________________ Note: Cost of production estimates are based on 2010 input prices. Fertilization decisions should be based on soil tests.

26
Table 5.C Estimated monthly income and expense flows per acre Greens (turnip, mustard, collards), fresh market Mississippi, 2011 __________________________________________________________________________________________________________________________________ ITEM Jan Feb Mar Apr May Jun Jul Aug Sep Oct Nov Dec __________________________________________________________________________________________________________________________________ --------------------------------------------------dollars-------------------------------------------------- TOTAL INCOME 0.00 0.00 0.00 0.00 0.00 0.00 0.00 0.00 0.00 0.00 0.00 0.00 DIRECT EXPENSES FERTILIZER 22.77 0.00 0.00 0.00 0.00 0.00 0.00 92.58 18.00 0.00 0.00 0.00 FUNGICIDE 0.00 0.00 0.00 0.00 0.00 0.00 0.00 0.00 44.12 0.00 0.00 0.00 HERBICIDE 0.00 0.00 0.00 0.00 0.00 0.00 0.00 4.67 0.00 0.00 0.00 0.00 INSECTICIDE 0.00 0.00 0.00 0.00 0.00 0.00 0.00 0.00 52.74 24.95 0.00 0.00 SEED/PLANTS 0.00 0.00 0.00 0.00 0.00 0.00 0.00 0.00 346.50 0.00 0.00 0.00 OTHER 0.00 0.00 0.00 0.00 0.00 0.00 0.00 0.00 0.00 975.00 0.00 0.00 LABOR 0.00 0.00 0.00 0.00 0.00 0.00 0.00 14.99 13.25 1597.89 0.00 0.00 LEASE * 0.00 0.00 0.00 0.00 0.00 0.00 0.00 0.00 0.00 0.00 0.00 0.00 FUEL 0.00 0.00 0.00 0.00 0.00 0.00 0.00 9.52 8.98 3.10 0.00 0.00 REPAIR & MAINTENANCE 0.00 0.00 0.00 0.00 0.00 0.00 0.00 3.19 28.05 9.73 0.00 0.00 INTEREST ON OP. CAP. 0.82 0.00 0.00 0.00 0.00 0.00 0.00 1.34 3.69 9.41 0.00 0.00 -------- -------- -------- -------- -------- -------- -------- -------- -------- -------- -------- -------- TOTAL DIRECT EXPENSES 23.59 0.00 0.00 0.00 0.00 0.00 0.00 126.29 515.33 2620.08 0.00 0.00 NET INCOME -23.59 0.00 0.00 0.00 0.00 0.00 0.00 -126.29 -515.33 -2620.08 0.00 0.00 NET INCOME TO DATE -23.59 -23.59 -23.59 -23.59 -23.59 -23.59 -23.59 -149.88 -665.21 -3285.29 -3285.29 -3285.29 __________________________________________________________________________________________________________________________________ Note: Cost of production estimates are based on 2010 input prices. Fertilization decisions should be based on soil tests. * Lease costs are based on hourly usage costs.

27
Table 5.D Breakeven price above total expenses and net returns for price/yield combinations, per acre Greens (turnip, mustard, collards), fresh market Mississippi, 2011 ________________________________________________________________________________________________________________________ -------------------------------------------BREAKEVEN PRICE---------------------------------------- Greens (25lb) 5.03 5.27 5.55 5.88 6.27 6.73 7.30 8.01 8.92 10.14 11.85 ________________________________________________________________________________________________________________________ PERCENT YIELD UNIT ---------------------------------------------dollars---------------------------------------------- 50 250.00 2doz -1620 -1559 -1489 -1407 -1310 -1194 -1052 -874 -646 -342 83 -1704 -1643 -1572 -1491 -1394 -1278 -1136 -958 -730 -426 0 60 300.00 2doz -1449 -1376 -1292 -1194 -1078 -938 -768 -555 -281 83 594 -1533 -1460 -1376 -1278 -1161 -1022 -852 -639 -365 0 511 70 350.00 2doz -1279 -1194 -1096 -981 -845 -683 -484 -235 83 509 1106 -1363 -1278 -1179 -1065 -929 -766 -568 -319 0 426 1022 80 400.00 2doz -1109 -1011 -899 -768 -613 -427 -200 83 448 935 1617 -1192 -1095 -983 -852 -697 -511 -284 0 365 852 1533 90 450.00 2doz -938 -829 -702 -555 -381 -171 83 403 814 1361 2128 -1022 -912 -786 -639 -464 -255 0 319 730 1278 2044 100 500.00 2doz -768 -646 -506 -342 -148 83 367 722 1179 1787 2639 -852 -730 -589 -426 -232 0 284 639 1095 1704 2556 110 550.00 2doz -597 -464 -309 -129 83 339 651 1042 1544 2213 3150 -681 -547 -393 -213 0 255 568 958 1460 2130 3067 120 600.00 2doz -427 -281 -112 83 316 594 935 1361 1909 2639 3662 -511 -365 -196 0 232 511 852 1278 1825 2556 3578 130 650.00 2doz -257 -98 83 296 548 850 1219 1681 2274 3065 4173 -340 -182 0 213 464 766 1136 1597 2190 2982 4089 140 700.00 2doz -86 83 280 509 780 1106 1503 2000 2639 3491 4684 -170 0 196 426 697 1022 1420 1917 2556 3408 4600 150 750.00 2doz 83 266 476 722 1013 1361 1787 2320 3004 3917 5195 0 182 393 639 929 1278 1704 2236 2921 3834 5112 ________________________________________________________________________________________________________________________ The top number in each cell is Returns Above Direct Expenses. The bottom number in each cell is Returns Above Total Specified Expenses. Only the product listed has been varied to calculate net returns. Note: Cost of production estimates are based on 2010 input prices.
28
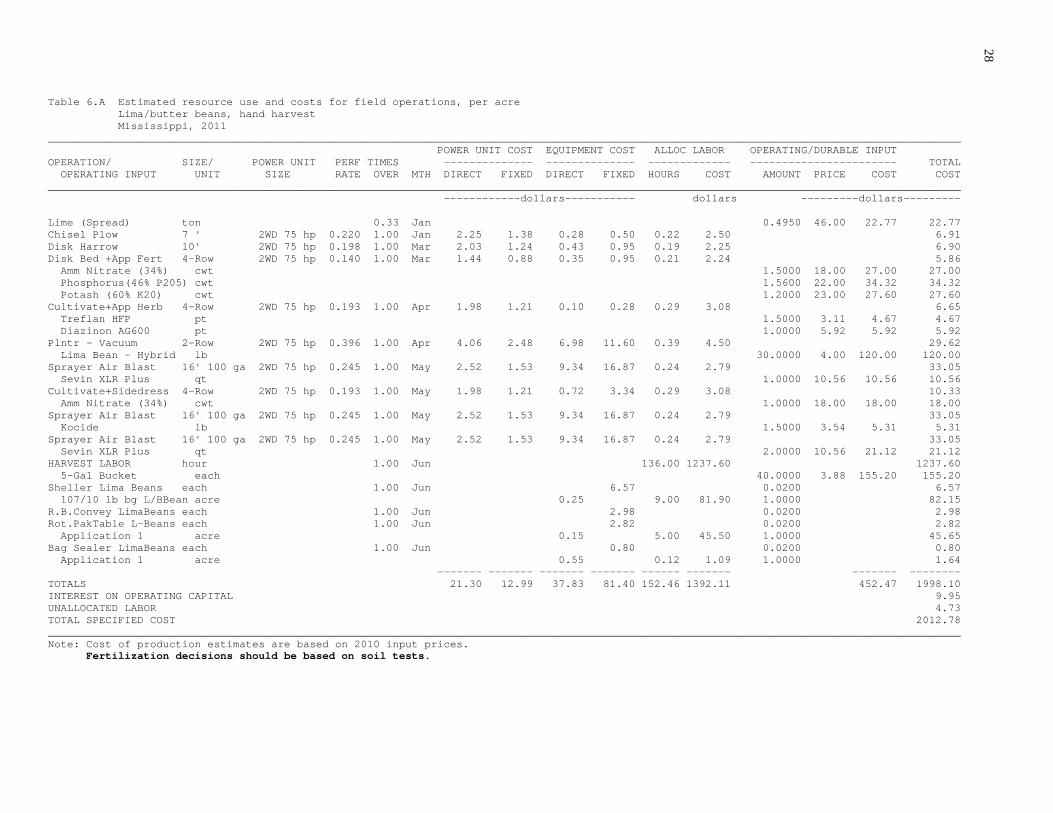
Table 6.A Estimated resource use and costs for field operations, per acre Lima/butter beans, hand harvest Mississippi, 2011 _______________________________________________________________________________________________________________________________________________ POWER UNIT COST EQUIPMENT COST ALLOC LABOR OPERATING/DURABLE INPUT OPERATION/ SIZE/ POWER UNIT PERF TIMES -------------- -------------- ------------- ----------------------- TOTAL OPERATING INPUT UNIT SIZE RATE OVER MTH DIRECT FIXED DIRECT FIXED HOURS COST AMOUNT PRICE COST COST _______________________________________________________________________________________________________________________________________________ ------------dollars----------- dollars ---------dollars--------- Lime (Spread) ton 0.33 Jan 0.4950 46.00 22.77 22.77 Chisel Plow 7 ' 2WD 75 hp 0.220 1.00 Jan 2.25 1.38 0.28 0.50 0.22 2.50 6.91 Disk Harrow 10' 2WD 75 hp 0.198 1.00 Mar 2.03 1.24 0.43 0.95 0.19 2.25 6.90 Disk Bed +App Fert 4-Row 2WD 75 hp 0.140 1.00 Mar 1.44 0.88 0.35 0.95 0.21 2.24 5.86 Amm Nitrate (34%) cwt 1.5000 18.00 27.00 27.00 Phosphorus(46% P205) cwt 1.5600 22.00 34.32 34.32 Potash (60% K20) cwt 1.2000 23.00 27.60 27.60 Cultivate+App Herb 4-Row 2WD 75 hp 0.193 1.00 Apr 1.98 1.21 0.10 0.28 0.29 3.08 6.65 Treflan HFP pt 1.5000 3.11 4.67 4.67 Diazinon AG600 pt 1.0000 5.92 5.92 5.92 Plntr - Vacuum 2-Row 2WD 75 hp 0.396 1.00 Apr 4.06 2.48 6.98 11.60 0.39 4.50 29.62 Lima Bean - Hybrid lb 30.0000 4.00 120.00 120.00 Sprayer Air Blast 16' 100 ga 2WD 75 hp 0.245 1.00 May 2.52 1.53 9.34 16.87 0.24 2.79 33.05 Sevin XLR Plus qt 1.0000 10.56 10.56 10.56 Cultivate+Sidedress 4-Row 2WD 75 hp 0.193 1.00 May 1.98 1.21 0.72 3.34 0.29 3.08 10.33 Amm Nitrate (34%) cwt 1.0000 18.00 18.00 18.00 Sprayer Air Blast 16' 100 ga 2WD 75 hp 0.245 1.00 May 2.52 1.53 9.34 16.87 0.24 2.79 33.05 Kocide lb 1.5000 3.54 5.31 5.31 Sprayer Air Blast 16' 100 ga 2WD 75 hp 0.245 1.00 May 2.52 1.53 9.34 16.87 0.24 2.79 33.05 Sevin XLR Plus qt 2.0000 10.56 21.12 21.12 HARVEST LABOR hour 1.00 Jun 136.00 1237.60 1237.60 5-Gal Bucket each 40.0000 3.88 155.20 155.20 Sheller Lima Beans each 1.00 Jun 6.57 0.0200 6.57 107/10 lb bg L/BBean acre 0.25 9.00 81.90 1.0000 82.15 R.B.Convey LimaBeans each 1.00 Jun 2.98 0.0200 2.98 Rot.PakTable L-Beans each 1.00 Jun 2.82 0.0200 2.82 Application 1 acre 0.15 5.00 45.50 1.0000 45.65 Bag Sealer LimaBeans each 1.00 Jun 0.80 0.0200 0.80 Application 1 acre 0.55 0.12 1.09 1.0000 1.64 ------- ------- ------- ------- ------ ------- ------- -------- TOTALS 21.30 12.99 37.83 81.40 152.46 1392.11 452.47 1998.10 INTEREST ON OPERATING CAPITAL 9.95 UNALLOCATED LABOR 4.73 TOTAL SPECIFIED COST 2012.78 _______________________________________________________________________________________________________________________________________________ Note: Cost of production estimates are based on 2010 input prices. Fertilization decisions should be based on soil tests.

29
Table 6.B Estimated costs per acre Lima/butter beans, hand harvest Mississippi, 2011 _______________________________________________________________________ ITEM UNIT PRICE QUANTITY AMOUNT YOUR FARM _______________________________________________________________________ dollars dollars DIRECT EXPENSES FERTILIZER Lime (Spread) ton 46.00 0.4950 22.77 _________ Amm Nitrate (34%) cwt 18.00 2.5000 45.00 _________ Phosphorus(46% P205) cwt 22.00 1.5600 34.32 _________ Potash (60% K20) cwt 23.00 1.2000 27.60 _________ FUNGICIDE Kocide lb 3.54 1.5000 5.31 _________ HERBICIDE Treflan HFP pt 3.11 1.5000 4.67 _________ INSECTICIDE Diazinon AG600 pt 5.92 1.0000 5.92 _________ Sevin XLR Plus qt 10.56 3.0000 31.68 _________ SEED/PLANTS Lima Bean - Hybrid lb 4.00 30.0000 120.00 _________ OTHER 5-Gal Bucket each 3.88 40.0000 155.20 _________ OPERATOR LABOR Tractors hour 11.35 2.0805 23.62 _________ HARVEST LABOR Special Labor hour 9.10 136.0000 1237.60 _________ HAND LABOR Implements hour 9.10 0.2643 2.40 _________ GRD LABOR LIMA BEANS Bag Sealer LimaBeans hour 9.10 0.1200 1.09 _________ Rot.PakTable L-Beans hour 9.10 5.0000 45.50 _________ Sheller Lima Beans hour 9.10 9.0000 81.90 _________ UNALLOCATED LABOR hour 11.36 0.4161 4.73 _________ DIESEL FUEL Tractors gal 2.39 8.0318 19.21 _________ REPAIR & MAINTENANCE Implements acre 36.88 1.0000 36.88 _________ Tractors acre 2.09 1.0000 2.09 _________ Bag Sealer LimaBeans acre 0.55 1.0000 0.55 _________ Rot.PakTable L-Beans acre 0.15 1.0000 0.15 _________ Sheller Lima Beans acre 0.25 1.0000 0.25 _________ INTEREST ON OP. CAP. acre 9.95 1.0000 9.95 _________ --------- TOTAL DIRECT EXPENSES 1918.39 _________ FIXED EXPENSES Implements acre 68.23 1.0000 68.23 _________ Tractors acre 12.99 1.0000 12.99 _________ Bag Sealer LimaBeans each 39.78 0.0200 0.80 _________ R.B.Convey LimaBeans each 149.19 0.0200 2.98 _________ Rot.PakTable L-Beans each 140.82 0.0200 2.82 _________ Sheller Lima Beans each 328.63 0.0200 6.57 _________ --------- TOTAL FIXED EXPENSES 94.39 _________ --------- TOTAL SPECIFIED EXPENSES 2012.78 _________ _______________________________________________________________________ Note: Cost of production estimates are based on 2010 input prices. Fertilization decisions should be based on soil tests.

30
Table 6.C Estimated monthly income and expense flows per acre Lima/butter beans, hand harvest Mississippi, 2011 __________________________________________________________________________________________________________________________________ ITEM Jan Feb Mar Apr May Jun Jul Aug Sep Oct Nov Dec __________________________________________________________________________________________________________________________________ --------------------------------------------------dollars-------------------------------------------------- TOTAL INCOME 0.00 0.00 0.00 0.00 0.00 0.00 0.00 0.00 0.00 0.00 0.00 0.00 DIRECT EXPENSES FERTILIZER 22.77 0.00 88.92 0.00 18.00 0.00 0.00 0.00 0.00 0.00 0.00 0.00 FUNGICIDE 0.00 0.00 0.00 0.00 5.31 0.00 0.00 0.00 0.00 0.00 0.00 0.00 HERBICIDE 0.00 0.00 0.00 4.67 0.00 0.00 0.00 0.00 0.00 0.00 0.00 0.00 INSECTICIDE 0.00 0.00 0.00 5.92 31.68 0.00 0.00 0.00 0.00 0.00 0.00 0.00 SEED/PLANTS 0.00 0.00 0.00 120.00 0.00 0.00 0.00 0.00 0.00 0.00 0.00 0.00 OTHER 0.00 0.00 0.00 0.00 0.00 155.20 0.00 0.00 0.00 0.00 0.00 0.00 LABOR 3.00 0.00 5.26 8.92 13.57 1366.09 0.00 0.00 0.00 0.00 0.00 0.00 LEASE * 0.00 0.00 0.00 0.00 0.00 0.00 0.00 0.00 0.00 0.00 0.00 0.00 FUEL 2.03 0.00 3.13 5.45 8.60 0.00 0.00 0.00 0.00 0.00 0.00 0.00 REPAIR & MAINTENANCE 0.50 0.00 1.12 7.67 29.68 0.95 0.00 0.00 0.00 0.00 0.00 0.00 INTEREST ON OP. CAP. 0.61 0.00 1.42 1.65 0.77 5.50 0.00 0.00 0.00 0.00 0.00 0.00 -------- -------- -------- -------- -------- -------- -------- -------- -------- -------- -------- -------- TOTAL DIRECT EXPENSES 28.91 0.00 99.85 154.28 107.61 1527.74 0.00 0.00 0.00 0.00 0.00 0.00 NET INCOME -28.91 0.00 -99.85 -154.28 -107.61 -1527.74 0.00 0.00 0.00 0.00 0.00 0.00 NET INCOME TO DATE -28.91 -28.91 -128.76 -283.04 -390.65 -1918.39 -1918.39 -1918.39 -1918.39 -1918.39 -1918.39 -1918.39 __________________________________________________________________________________________________________________________________ Note: Cost of production estimates are based on 2010 input prices. Fertilization decisions should be based on soil tests. * Lease costs are based on hourly usage costs.

31
Table 6.D Breakeven price above total expenses and net returns for price/yield combinations, per acre Lima/butter beans, hand harvest Mississippi, 2011 ________________________________________________________________________________________________________________________ -------------------------------------------BREAKEVEN PRICE---------------------------------------- Lima/Butter Beans 12.54 13.43 14.47 15.67 17.10 18.81 20.90 23.51 26.87 31.35 37.62 ________________________________________________________________________________________________________________________ PERCENT YIELD UNIT ---------------------------------------------dollars---------------------------------------------- 50 53.50 10lb -1247 -1199 -1144 -1079 -1003 -912 -800 -660 -480 -241 94 -1341 -1293 -1238 -1174 -1097 -1006 -894 -754 -575 -335 0 60 64.20 10lb -1113 -1055 -989 -912 -820 -710 -576 -408 -193 94 496 -1207 -1150 -1083 -1006 -914 -805 -670 -503 -287 0 402 70 74.90 10lb -979 -912 -834 -744 -637 -509 -352 -157 94 429 899 -1073 -1006 -928 -838 -731 -603 -447 -251 0 335 805 80 85.60 10lb -844 -768 -679 -576 -454 -308 -129 94 381 765 1302 -939 -862 -774 -670 -548 -402 -223 0 287 670 1207 90 96.30 10lb -710 -624 -524 -408 -271 -106 94 345 669 1100 1704 -805 -718 -619 -503 -365 -201 0 251 575 1006 1610 100 107.00 10lb -576 -480 -370 -241 -88 94 318 597 957 1436 2107 -670 -575 -464 -335 -182 0 223 503 862 1341 2012 110 117.70 10lb -442 -336 -215 -73 94 295 541 849 1244 1771 2509 -536 -431 -309 -167 0 201 447 754 1150 1677 2415 120 128.40 10lb -308 -193 -60 94 277 496 765 1100 1532 2107 2912 -402 -287 -154 0 182 402 670 1006 1437 2012 2817 130 139.10 10lb -173 -49 94 262 460 698 988 1352 1819 2442 3314 -268 -143 0 167 365 603 894 1257 1725 2348 3220 140 149.80 10lb -39 94 249 429 643 899 1212 1603 2107 2778 3717 -134 0 154 335 548 805 1118 1509 2012 2683 3623 150 160.50 10lb 94 238 404 597 826 1100 1436 1855 2394 3113 4119 0 143 309 503 731 1006 1341 1761 2300 3019 4025 ________________________________________________________________________________________________________________________ The top number in each cell is Returns Above Direct Expenses. The bottom number in each cell is Returns Above Total Specified Expenses. Only the product listed has been varied to calculate net returns. Note: Cost of production estimates are based on 2010 input prices.

32
Table 7.A Estimated resource use and costs for field operations, per acre Lima/butter beans, mechanical harvest Mississippi, 2011 _______________________________________________________________________________________________________________________________________________ POWER UNIT COST EQUIPMENT COST ALLOC LABOR OPERATING/DURABLE INPUT OPERATION/ SIZE/ POWER UNIT PERF TIMES -------------- -------------- ------------- ----------------------- TOTAL OPERATING INPUT UNIT SIZE RATE OVER MTH DIRECT FIXED DIRECT FIXED HOURS COST AMOUNT PRICE COST COST _______________________________________________________________________________________________________________________________________________ ------------dollars----------- dollars ---------dollars--------- Lime (Spread) ton 0.33 Jan 0.4950 46.00 22.77 22.77 Chisel Plow 7 ' 2WD 75 hp 0.220 1.00 Jan 2.25 1.38 0.28 0.50 0.22 2.50 6.91 Disk Harrow 10' 2WD 75 hp 0.198 1.00 Mar 2.03 1.24 0.43 0.95 0.19 2.25 6.90 Disk Bed +App Fert 4-Row 2WD 75 hp 0.140 1.00 Mar 1.44 0.88 0.35 0.95 0.21 2.24 5.86 Amm Nitrate (34%) cwt 1.5000 18.00 27.00 27.00 Phosphorus(46% P205) cwt 1.5600 22.00 34.32 34.32 Potash (60% K20) cwt 1.2000 23.00 27.60 27.60 Cultivate+App Herb 4-Row 2WD 75 hp 0.193 1.00 Apr 1.98 1.21 0.10 0.28 0.29 3.08 6.65 Treflan HFP pt 1.5000 3.11 4.67 4.67 Diazinon AG600 pt 1.0000 5.92 5.92 5.92 Plntr - Vacuum 2-Row 2WD 75 hp 0.396 1.00 Apr 4.06 2.48 6.98 11.60 0.39 4.50 29.62 Lima Bean - Hybrid lb 30.0000 4.00 120.00 120.00 Sprayer Air Blast 16' 100 ga 2WD 75 hp 0.245 1.00 May 2.52 1.53 9.34 16.87 0.24 2.79 33.05 Sevin XLR Plus qt 1.0000 10.56 10.56 10.56 Cultivate+Sidedress 4-Row 2WD 75 hp 0.193 1.00 May 1.98 1.21 0.72 3.34 0.29 3.08 10.33 Amm Nitrate (34%) cwt 1.0000 18.00 18.00 18.00 Sprayer Air Blast 16' 100 ga 2WD 75 hp 0.245 1.00 May 2.52 1.53 9.34 16.87 0.24 2.79 33.05 Kocide lb 1.5000 3.54 5.31 5.31 Sprayer Air Blast 16' 100 ga 2WD 75 hp 0.245 1.00 May 2.52 1.53 9.34 16.87 0.24 2.79 33.05 Sevin XLR Plus qt 2.0000 10.56 21.12 21.12 Picker Beans/Peas 1-Row 2WD 75 hp 3.571 1.00 Jun 36.53 22.30 48.32 37.97 10.71 105.54 250.66 Trailer-Lima/B. Bean 16' 2WD 75 hp 3.571 1.00 Jun 36.53 22.30 2.15 3.75 7.14 73.04 137.77 LABOR BEAN TRAILER hour 3.58 32.58 32.58 Sheller Lima Beans each 1.00 Jun 6.57 0.0200 6.57 65/10 lb bg L/BBean acre 0.25 9.00 81.90 1.0000 82.15 R.B.Convey LimaBeans each 1.00 Jun 2.98 0.0200 2.98 Rot.PakTable L-Beans each 1.00 Jun 2.82 0.0200 2.82 Application 1 acre 0.15 5.00 45.50 1.0000 45.65 Bag Sealer LimaBeans each 1.00 Jun 0.80 0.0200 0.80 Application 1 acre 0.55 0.12 1.09 1.0000 1.64 ------- ------- ------- ------- ------ ------- ------- -------- TOTALS 94.36 57.59 88.30 123.12 37.90 365.67 297.27 1026.31 INTEREST ON OPERATING CAPITAL 6.19 UNALLOCATED LABOR 20.95 TOTAL SPECIFIED COST 1053.45 _______________________________________________________________________________________________________________________________________________ Note: Cost of production estimates are based on 2010 input prices. Fertilization decisions should be based on soil tests.

33
Table 7.B Estimated costs per acre Lima/butter beans, mechanical harvest Mississippi, 2011 _______________________________________________________________________ ITEM UNIT PRICE QUANTITY AMOUNT YOUR FARM _______________________________________________________________________ dollars dollars DIRECT EXPENSES FERTILIZER Lime (Spread) ton 46.00 0.4950 22.77 _________ Amm Nitrate (34%) cwt 18.00 2.5000 45.00 _________ Phosphorus(46% P205) cwt 22.00 1.5600 34.32 _________ Potash (60% K20) cwt 23.00 1.2000 27.60 _________ FUNGICIDE Kocide lb 3.54 1.5000 5.31 _________ HERBICIDE Treflan HFP pt 3.11 1.5000 4.67 _________ INSECTICIDE Diazinon AG600 pt 5.92 1.0000 5.92 _________ Sevin XLR Plus qt 10.56 3.0000 31.68 _________ SEED/PLANTS Lima Bean - Hybrid lb 4.00 30.0000 120.00 _________ OPERATOR LABOR Tractors hour 11.35 9.2234 104.70 _________ HAND LABOR Implements hour 9.10 10.9786 99.90 _________ LABOR BEAN TRAILER Special Labor hour 9.10 3.5800 32.58 _________ GRD LABOR LIMA BEANS Bag Sealer LimaBeans hour 9.10 0.1200 1.09 _________ Rot.PakTable L-Beans hour 9.10 5.0000 45.50 _________ Sheller Lima Beans hour 9.10 9.0000 81.90 _________ UNALLOCATED LABOR hour 11.35 1.8446 20.95 _________ DIESEL FUEL Tractors gal 2.39 35.6061 85.11 _________ REPAIR & MAINTENANCE Implements acre 87.35 1.0000 87.35 _________ Tractors acre 9.25 1.0000 9.25 _________ Bag Sealer LimaBeans acre 0.55 1.0000 0.55 _________ Rot.PakTable L-Beans acre 0.15 1.0000 0.15 _________ Sheller Lima Beans acre 0.25 1.0000 0.25 _________ INTEREST ON OP. CAP. acre 6.19 1.0000 6.19 _________ --------- TOTAL DIRECT EXPENSES 872.74 _________ FIXED EXPENSES Implements acre 109.95 1.0000 109.95 _________ Tractors acre 57.59 1.0000 57.59 _________ Bag Sealer LimaBeans each 39.78 0.0200 0.80 _________ R.B.Convey LimaBeans each 149.19 0.0200 2.98 _________ Rot.PakTable L-Beans each 140.82 0.0200 2.82 _________ Sheller Lima Beans each 328.63 0.0200 6.57 _________ --------- TOTAL FIXED EXPENSES 180.71 _________ --------- TOTAL SPECIFIED EXPENSES 1053.45 _________ _______________________________________________________________________ Note: Cost of production estimates are based on 2010 input prices. Fertilization decisions should be based on soil tests.

34
Table 7.C Estimated monthly income and expense flows per acre Lima/butter beans, mechanical harvest Mississippi, 2011 __________________________________________________________________________________________________________________________________ ITEM Jan Feb Mar Apr May Jun Jul Aug Sep Oct Nov Dec __________________________________________________________________________________________________________________________________ --------------------------------------------------dollars-------------------------------------------------- TOTAL INCOME 0.00 0.00 0.00 0.00 0.00 0.00 0.00 0.00 0.00 0.00 0.00 0.00 DIRECT EXPENSES FERTILIZER 22.77 0.00 88.92 0.00 18.00 0.00 0.00 0.00 0.00 0.00 0.00 0.00 FUNGICIDE 0.00 0.00 0.00 0.00 5.31 0.00 0.00 0.00 0.00 0.00 0.00 0.00 HERBICIDE 0.00 0.00 0.00 4.67 0.00 0.00 0.00 0.00 0.00 0.00 0.00 0.00 INSECTICIDE 0.00 0.00 0.00 5.92 31.68 0.00 0.00 0.00 0.00 0.00 0.00 0.00 SEED/PLANTS 0.00 0.00 0.00 120.00 0.00 0.00 0.00 0.00 0.00 0.00 0.00 0.00 LABOR 3.00 0.00 5.26 8.92 13.57 355.87 0.00 0.00 0.00 0.00 0.00 0.00 LEASE * 0.00 0.00 0.00 0.00 0.00 0.00 0.00 0.00 0.00 0.00 0.00 0.00 FUEL 2.03 0.00 3.13 5.45 8.60 65.90 0.00 0.00 0.00 0.00 0.00 0.00 REPAIR & MAINTENANCE 0.50 0.00 1.12 7.67 29.68 58.58 0.00 0.00 0.00 0.00 0.00 0.00 INTEREST ON OP. CAP. 0.61 0.00 1.42 1.65 0.77 1.74 0.00 0.00 0.00 0.00 0.00 0.00 -------- -------- -------- -------- -------- -------- -------- -------- -------- -------- -------- -------- TOTAL DIRECT EXPENSES 28.91 0.00 99.85 154.28 107.61 482.09 0.00 0.00 0.00 0.00 0.00 0.00 NET INCOME -28.91 0.00 -99.85 -154.28 -107.61 -482.09 0.00 0.00 0.00 0.00 0.00 0.00 NET INCOME TO DATE -28.91 -28.91 -128.76 -283.04 -390.65 -872.74 -872.74 -872.74 -872.74 -872.74 -872.74 -872.74 __________________________________________________________________________________________________________________________________ Note: Cost of production estimates are based on 2010 input prices. Fertilization decisions should be based on soil tests. * Lease costs are based on hourly usage costs.

35
Table 7.D Breakeven price above total expenses and net returns for price/yield combinations, per acre Lima/butter beans, mechanical harvest Mississippi, 2011 ________________________________________________________________________________________________________________________ -------------------------------------------BREAKEVEN PRICE---------------------------------------- Lima/Butter Beans 10.80 11.57 12.46 13.50 14.73 16.20 18.00 20.25 23.15 27.01 32.41 ________________________________________________________________________________________________________________________ PERCENT YIELD UNIT ---------------------------------------------dollars---------------------------------------------- 50 32.50 10lb -521 -496 -467 -433 -393 -346 -287 -214 -120 5 180 -702 -677 -648 -614 -574 -526 -468 -395 -300 -175 0 60 39.00 10lb -451 -421 -386 -346 -298 -240 -170 -82 30 180 391 -632 -601 -567 -526 -478 -421 -351 -263 -150 0 210 70 45.50 10lb -381 -346 -305 -258 -202 -135 -53 49 180 356 602 -561 -526 -486 -438 -383 -316 -234 -131 0 175 421 80 52.00 10lb -310 -270 -224 -170 -106 -29 63 180 331 531 812 -491 -451 -405 -351 -287 -210 -117 0 150 351 632 90 58.50 10lb -240 -195 -143 -82 -10 75 180 312 481 707 1023 -421 -376 -324 -263 -191 -105 0 131 300 526 842 100 65.00 10lb -170 -120 -62 5 84 180 297 444 632 883 1234 -351 -300 -243 -175 -95 0 117 263 451 702 1053 110 71.50 10lb -100 -45 18 92 180 286 414 575 782 1058 1444 -280 -225 -162 -87 0 105 234 395 601 877 1264 120 78.00 10lb -29 30 99 180 276 391 531 707 933 1234 1655 -210 -150 -81 0 95 210 351 526 752 1053 1474 130 84.50 10lb 40 105 180 268 372 496 648 839 1083 1409 1866 -140 -75 0 87 191 316 468 658 902 1229 1685 140 91.00 10lb 110 180 261 356 468 602 765 970 1234 1585 2076 -70 0 81 175 287 421 585 790 1053 1404 1896 150 97.50 10lb 180 255 342 444 563 707 883 1102 1384 1760 2287 0 75 162 263 383 526 702 921 1203 1580 2106 ________________________________________________________________________________________________________________________ The top number in each cell is Returns Above Direct Expenses. The bottom number in each cell is Returns Above Total Specified Expenses. Only the product listed has been varied to calculate net returns. Note: Cost of production estimates are based on 2010 input prices.

36
Table 8.A Estimated resource use and costs for field operations, per acre Okra, fresh market Mississippi, 2011 _______________________________________________________________________________________________________________________________________________ POWER UNIT COST EQUIPMENT COST ALLOC LABOR OPERATING/DURABLE INPUT OPERATION/ SIZE/ POWER UNIT PERF TIMES -------------- -------------- ------------- ----------------------- TOTAL OPERATING INPUT UNIT SIZE RATE OVER MTH DIRECT FIXED DIRECT FIXED HOURS COST AMOUNT PRICE COST COST _______________________________________________________________________________________________________________________________________________ ------------dollars----------- dollars ---------dollars--------- Lime (Spread) ton 0.33 Mar 0.4950 46.00 22.77 22.77 Chisel Plow 7 ' 2WD 75 hp 0.220 1.00 Mar 2.25 1.38 0.28 0.50 0.22 2.50 6.91 Disk Harrow 10' 2WD 75 hp 0.198 2.00 Mar 4.06 2.48 0.87 1.90 0.39 4.50 13.81 Disk Bed +App Fert 4-Row 2WD 75 hp 0.140 1.00 Apr 1.44 0.88 0.35 0.95 0.21 2.24 5.86 Amm Nitrate (34%) cwt 0.7000 18.00 12.60 12.60 Phosphorus(46% P205) cwt 1.5600 22.00 34.32 34.32 Potash (60% K20) cwt 1.2000 23.00 27.60 27.60 Cultivate+App Herb 4-Row 2WD 75 hp 0.193 1.00 Apr 1.98 1.21 0.10 0.28 0.29 3.08 6.65 Treflan HFP pt 1.5000 3.11 4.67 4.67 Plntr - Vacuum 2-Row 2WD 75 hp 0.396 1.00 Apr 4.06 2.48 6.98 11.60 0.39 4.50 29.62 Okra - Hybrid lb 8.8000 187.00 1645.60 1645.60 Cultivate+Sidedress 4-Row 2WD 75 hp 0.193 1.00 Apr 1.98 1.21 0.72 3.34 0.29 3.08 10.33 Amm Nitrate (34%) cwt 1.0000 18.00 18.00 18.00 Cultivate 4-Row 2WD 75 hp 0.155 2.00 May 3.17 1.94 0.61 1.67 0.31 3.52 10.91 Sprayer Air Blast 16' 100 ga 2WD 75 hp 0.245 2.00 May 5.02 3.07 18.68 33.74 0.49 5.57 66.08 Provado 1.6 oz 7.6000 1.94 14.74 14.74 Cultivate+Sidedress 4-Row 2WD 75 hp 0.193 1.00 May 1.98 1.21 0.72 3.34 0.29 3.08 10.33 Amm Nitrate (34%) cwt 1.0000 18.00 18.00 18.00 Sprayer Air Blast 16' 100 ga 2WD 75 hp 0.245 3.00 Jun 7.54 4.60 28.02 50.62 0.73 8.36 99.14 Mustang Max oz 12.0000 1.30 15.60 15.60 Trailer - Vegetables 16' 2WD 75 hp 0.090 12.00 Jun 11.04 6.74 0.58 1.01 2.16 22.09 41.46 HARVEST LABOR hour 1.00 Jun 300.00 2730.00 2730.00 5-Gal Bucket each 200.0000 3.88 776.00 776.00 GRADE & PACK LABOR hour 1.00 Jun 30.00 273.00 273.00 Boxes-Waxed each 400.0000 1.62 648.00 648.00 ------- ------- ------- ------- ------ ------- ------- -------- TOTALS 44.52 27.20 57.91 108.95 335.79 3065.52 3237.90 6542.00 INTEREST ON OPERATING CAPITAL 36.67 UNALLOCATED LABOR 9.87 TOTAL SPECIFIED COST 6588.54 _______________________________________________________________________________________________________________________________________________ Note: Cost of production estimates are based on 2010 input prices. Fertilization decisions should be based on soil tests.

37
Table 8.B Estimated costs per acre Okra, fresh market Mississippi, 2011 _______________________________________________________________________ ITEM UNIT PRICE QUANTITY AMOUNT YOUR FARM _______________________________________________________________________ dollars dollars DIRECT EXPENSES FERTILIZER Lime (Spread) ton 46.00 0.4950 22.77 _________ Amm Nitrate (34%) cwt 18.00 2.7000 48.60 _________ Phosphorus(46% P205) cwt 22.00 1.5600 34.32 _________ Potash (60% K20) cwt 23.00 1.2000 27.60 _________ HERBICIDE Treflan HFP pt 3.11 1.5000 4.67 _________ INSECTICIDE Provado 1.6 oz 1.94 7.6000 14.74 _________ Mustang Max oz 1.30 12.0000 15.60 _________ SEED/PLANTS Okra - Hybrid lb 187.00 8.8000 1645.60 _________ OTHER 5-Gal Bucket each 3.88 200.0000 776.00 _________ Boxes-Waxed each 1.62 400.0000 648.00 _________ OPERATOR LABOR Tractors hour 11.35 4.3539 49.41 _________ HARVEST LABOR Special Labor hour 9.10 300.0000 2730.00 _________ GRADE & PACK LABOR Special Labor hour 9.10 30.0000 273.00 _________ HAND LABOR Implements hour 9.10 1.4412 13.11 _________ UNALLOCATED LABOR hour 11.33 0.8707 9.87 _________ DIESEL FUEL Tractors gal 2.39 16.8080 40.17 _________ REPAIR & MAINTENANCE Implements acre 57.91 1.0000 57.91 _________ Tractors acre 4.35 1.0000 4.35 _________ INTEREST ON OP. CAP. acre 36.67 1.0000 36.67 _________ --------- TOTAL DIRECT EXPENSES 6452.39 _________ FIXED EXPENSES Implements acre 108.95 1.0000 108.95 _________ Tractors acre 27.20 1.0000 27.20 _________ --------- TOTAL FIXED EXPENSES 136.15 _________ --------- TOTAL SPECIFIED EXPENSES 6588.54 _________ _______________________________________________________________________ Note: Cost of production estimates are based on 2010 input prices. Fertilization decisions should be based on soil tests.

38
Table 8.C Estimated monthly income and expense flows per acre Okra, fresh market Mississippi, 2011 __________________________________________________________________________________________________________________________________ ITEM Mar Apr May Jun Jul Aug Sep Oct Nov Dec Jan Feb __________________________________________________________________________________________________________________________________ --------------------------------------------------dollars-------------------------------------------------- TOTAL INCOME 0.00 0.00 0.00 0.00 0.00 0.00 0.00 0.00 0.00 0.00 0.00 0.00 DIRECT EXPENSES FERTILIZER 22.77 92.52 18.00 0.00 0.00 0.00 0.00 0.00 0.00 0.00 0.00 0.00 HERBICIDE 0.00 4.67 0.00 0.00 0.00 0.00 0.00 0.00 0.00 0.00 0.00 0.00 INSECTICIDE 0.00 0.00 14.74 15.60 0.00 0.00 0.00 0.00 0.00 0.00 0.00 0.00 SEED/PLANTS 0.00 1645.60 0.00 0.00 0.00 0.00 0.00 0.00 0.00 0.00 0.00 0.00 OTHER 0.00 0.00 0.00 1424.00 0.00 0.00 0.00 0.00 0.00 0.00 0.00 0.00 LABOR 8.40 15.00 14.42 3037.57 0.00 0.00 0.00 0.00 0.00 0.00 0.00 0.00 LEASE * 0.00 0.00 0.00 0.00 0.00 0.00 0.00 0.00 0.00 0.00 0.00 0.00 FUEL 5.69 8.54 9.18 16.76 0.00 0.00 0.00 0.00 0.00 0.00 0.00 0.00 REPAIR & MAINTENANCE 1.77 9.07 21.00 30.42 0.00 0.00 0.00 0.00 0.00 0.00 0.00 0.00 INTEREST ON OP. CAP. 0.56 19.22 0.56 16.33 0.00 0.00 0.00 0.00 0.00 0.00 0.00 0.00 -------- -------- -------- -------- -------- -------- -------- -------- -------- -------- -------- -------- TOTAL DIRECT EXPENSES 39.19 1794.62 77.90 4540.68 0.00 0.00 0.00 0.00 0.00 0.00 0.00 0.00 NET INCOME -39.19 -1794.62 -77.90 -4540.68 0.00 0.00 0.00 0.00 0.00 0.00 0.00 0.00 NET INCOME TO DATE -39.19 -1833.81 -1911.71 -6452.39 -6452.39 -6452.39 -6452.39 -6452.39 -6452.39 -6452.39 -6452.39 -6452.39 __________________________________________________________________________________________________________________________________ Note: Cost of production estimates are based on 2010 input prices. Fertilization decisions should be based on soil tests. * Lease costs are based on hourly usage costs.
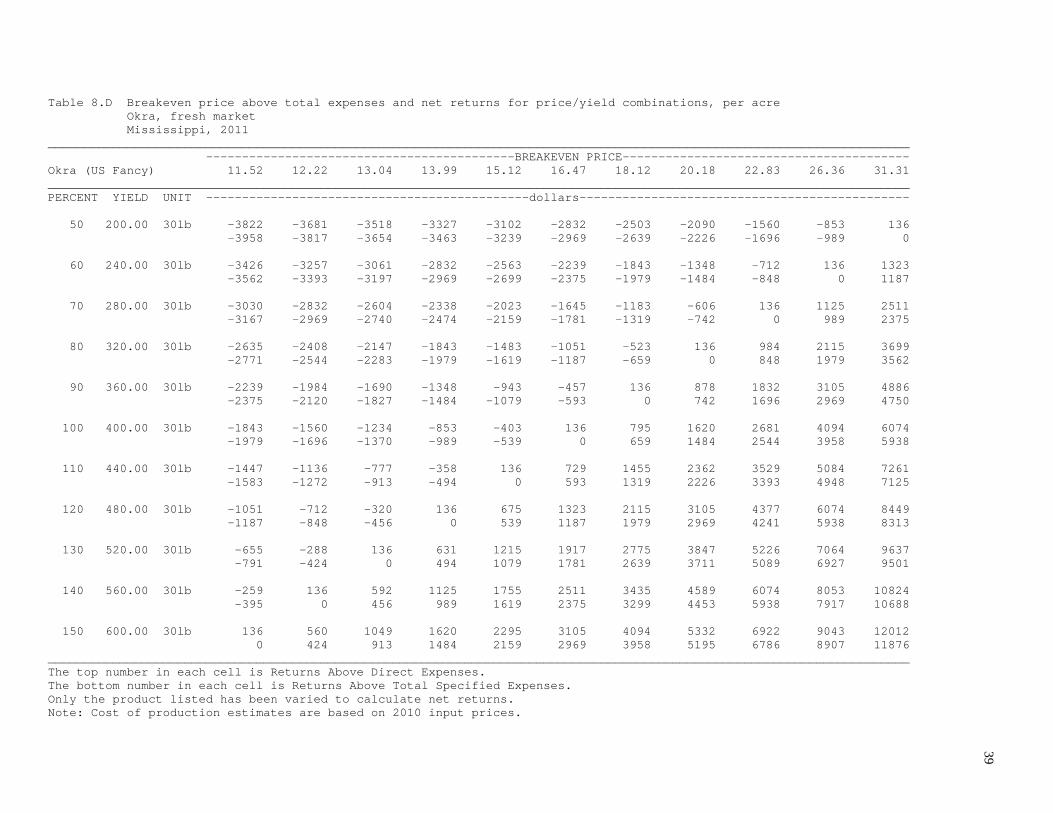
39
Table 8.D Breakeven price above total expenses and net returns for price/yield combinations, per acre Okra, fresh market Mississippi, 2011 ________________________________________________________________________________________________________________________ -------------------------------------------BREAKEVEN PRICE---------------------------------------- Okra (US Fancy) 11.52 12.22 13.04 13.99 15.12 16.47 18.12 20.18 22.83 26.36 31.31 ________________________________________________________________________________________________________________________ PERCENT YIELD UNIT ---------------------------------------------dollars---------------------------------------------- 50 200.00 30lb -3822 -3681 -3518 -3327 -3102 -2832 -2503 -2090 -1560 -853 136 -3958 -3817 -3654 -3463 -3239 -2969 -2639 -2226 -1696 -989 0 60 240.00 30lb -3426 -3257 -3061 -2832 -2563 -2239 -1843 -1348 -712 136 1323 -3562 -3393 -3197 -2969 -2699 -2375 -1979 -1484 -848 0 1187 70 280.00 30lb -3030 -2832 -2604 -2338 -2023 -1645 -1183 -606 136 1125 2511 -3167 -2969 -2740 -2474 -2159 -1781 -1319 -742 0 989 2375 80 320.00 30lb -2635 -2408 -2147 -1843 -1483 -1051 -523 136 984 2115 3699 -2771 -2544 -2283 -1979 -1619 -1187 -659 0 848 1979 3562 90 360.00 30lb -2239 -1984 -1690 -1348 -943 -457 136 878 1832 3105 4886 -2375 -2120 -1827 -1484 -1079 -593 0 742 1696 2969 4750 100 400.00 30lb -1843 -1560 -1234 -853 -403 136 795 1620 2681 4094 6074 -1979 -1696 -1370 -989 -539 0 659 1484 2544 3958 5938 110 440.00 30lb -1447 -1136 -777 -358 136 729 1455 2362 3529 5084 7261 -1583 -1272 -913 -494 0 593 1319 2226 3393 4948 7125 120 480.00 30lb -1051 -712 -320 136 675 1323 2115 3105 4377 6074 8449 -1187 -848 -456 0 539 1187 1979 2969 4241 5938 8313 130 520.00 30lb -655 -288 136 631 1215 1917 2775 3847 5226 7064 9637 -791 -424 0 494 1079 1781 2639 3711 5089 6927 9501 140 560.00 30lb -259 136 592 1125 1755 2511 3435 4589 6074 8053 10824 -395 0 456 989 1619 2375 3299 4453 5938 7917 10688 150 600.00 30lb 136 560 1049 1620 2295 3105 4094 5332 6922 9043 12012 0 424 913 1484 2159 2969 3958 5195 6786 8907 11876 ________________________________________________________________________________________________________________________ The top number in each cell is Returns Above Direct Expenses. The bottom number in each cell is Returns Above Total Specified Expenses. Only the product listed has been varied to calculate net returns. Note: Cost of production estimates are based on 2010 input prices.

40
Table 9.A Estimated resource use and costs for field operations, per acre Pumpkin, freshmarket, irrigated 8 ft row spacing, 12 gpm with 5,445 ft of drip tape, Mississippi, 2011 _______________________________________________________________________________________________________________________________________________ POWER UNIT COST EQUIPMENT COST ALLOC LABOR OPERATING/DURABLE INPUT OPERATION/ SIZE/ POWER UNIT PERF TIMES -------------- -------------- ------------- ----------------------- TOTAL OPERATING INPUT UNIT SIZE RATE OVER MTH DIRECT FIXED DIRECT FIXED HOURS COST AMOUNT PRICE COST COST _______________________________________________________________________________________________________________________________________________ ------------dollars----------- dollars ---------dollars--------- Lime (Spread) ton 0.33 May 0.1633 46.00 7.51 7.51 Chisel Plow 7 ' 2WD 75 hp 0.220 1.00 May 2.25 1.38 0.28 0.50 0.22 2.50 6.91 Disk Harrow 10' 2WD 75 hp 0.198 2.00 Jun 4.06 2.48 0.87 1.90 0.39 4.50 13.81 Disk Bed +App Fert 4-Row 2WD 75 hp 0.140 1.00 Jun 1.44 0.88 0.35 0.95 0.21 2.24 5.86 Fert 13-13-13 cwt 9.0000 15.43 138.87 138.87 BS, Lay/Tape/Pumpkin Bed 8'cntr 2WD 75 hp 0.080 1.00 Jun 0.83 0.51 0.24 0.72 0.08 0.92 3.22 Plastic Mulch roll 1.4000 162.00 226.80 226.80 Drip Tape roll 0.9000 147.50 132.75 132.75 Plntr/H20/pnch/seed 1-Row 2WD 75 hp 2.578 1.00 Jul 26.38 16.10 4.31 7.30 5.15 52.72 106.81 Pumpkin Seed Hybrid lb 1.5000 81.00 121.50 121.50 Irrigation 1.00 Jul Rural Water ac-in 6.0000 75.01 450.06 450.06 Fertigate CAN03/KN03 1.00 Jul FERTIGATION LABOR hour 1.00 9.10 9.10 Calcium Nitrate lb 25.0000 0.35 8.75 8.75 Sprayer Air Blast 16' 100 ga 2WD 75 hp 0.245 1.00 Jul 2.52 1.53 9.34 16.87 0.24 2.79 33.05 Thionex 3EC pt 2.0000 3.47 6.94 6.94 Disk Harrow-Hvy Duty 5' 2WD 75 hp 0.412 0.50 Jul 2.11 1.29 0.10 0.21 0.20 2.34 6.05 Fertigate CAN03/KN03 1.00 Jul FERTIGATION LABOR hour 1.00 9.10 9.10 Calcium Nitrate lb 25.0000 0.35 8.75 8.75 Sprayer Air Blast 16' 100 ga 2WD 75 hp 0.245 1.00 Jul 2.52 1.53 9.34 16.87 0.24 2.79 33.05 Thionex 3EC pt 2.0000 3.47 6.94 6.94 Fertigate CAN03/KN03 1.00 Jul FERTIGATION LABOR hour 1.00 9.10 9.10 Calcium Nitrate lb 25.0000 0.35 8.75 8.75 Sprayer Air Blast 16' 100 ga 2WD 75 hp 0.245 1.00 Aug 2.52 1.53 9.34 16.87 0.24 2.79 33.05 Quadris oz 11.0000 2.52 27.72 27.72 Bravo Weather Stick pt 2.0000 5.69 11.38 11.38 Fertigate CAN03/KN03 3.00 Aug FERTIGATION LABOR hour 3.00 27.30 27.30 Calcium Nitrate lb 75.0000 0.35 26.25 26.25 Sprayer Air Blast 16' 100 ga 2WD 75 hp 0.245 1.00 Aug 2.52 1.53 9.34 16.87 0.24 2.79 33.05 Bravo Weather Stick pt 2.0000 5.69 11.38 11.38 Fertigate CAN03/KN03 1.00 Sep FERTIGATION LABOR hour 1.00 9.10 9.10 Calcium Nitrate lb 25.0000 0.35 8.75 8.75 Sprayer Air Blast 16' 100 ga 2WD 75 hp 0.245 1.00 Sep 2.52 1.53 9.34 16.87 0.24 2.79 33.05 Brigade 2EC oz 6.0000 0.94 5.64 5.64 Fertigate CAN03/KN03 3.00 Sep FERTIGATION LABOR hour 3.00 27.30 27.30 Calcium Nitrate lb 75.0000 0.35 26.25 26.25 (continued)
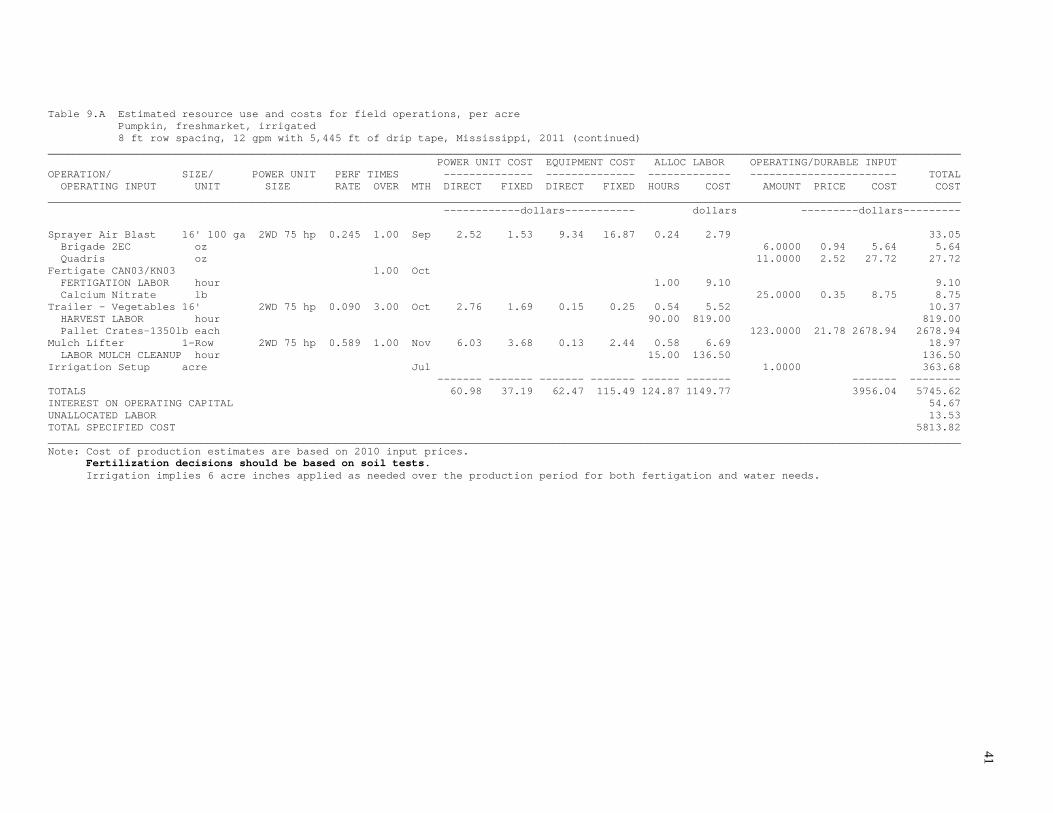
41
Table 9.A Estimated resource use and costs for field operations, per acre Pumpkin, freshmarket, irrigated 8 ft row spacing, 12 gpm with 5,445 ft of drip tape, Mississippi, 2011 (continued) _______________________________________________________________________________________________________________________________________________ POWER UNIT COST EQUIPMENT COST ALLOC LABOR OPERATING/DURABLE INPUT OPERATION/ SIZE/ POWER UNIT PERF TIMES -------------- -------------- ------------- ----------------------- TOTAL OPERATING INPUT UNIT SIZE RATE OVER MTH DIRECT FIXED DIRECT FIXED HOURS COST AMOUNT PRICE COST COST _______________________________________________________________________________________________________________________________________________ ------------dollars----------- dollars ---------dollars--------- Sprayer Air Blast 16' 100 ga 2WD 75 hp 0.245 1.00 Sep 2.52 1.53 9.34 16.87 0.24 2.79 33.05 Brigade 2EC oz 6.0000 0.94 5.64 5.64 Quadris oz 11.0000 2.52 27.72 27.72 Fertigate CAN03/KN03 1.00 Oct FERTIGATION LABOR hour 1.00 9.10 9.10 Calcium Nitrate lb 25.0000 0.35 8.75 8.75 Trailer - Vegetables 16' 2WD 75 hp 0.090 3.00 Oct 2.76 1.69 0.15 0.25 0.54 5.52 10.37 HARVEST LABOR hour 90.00 819.00 819.00 Pallet Crates-1350lb each 123.0000 21.78 2678.94 2678.94 Mulch Lifter 1-Row 2WD 75 hp 0.589 1.00 Nov 6.03 3.68 0.13 2.44 0.58 6.69 18.97 LABOR MULCH CLEANUP hour 15.00 136.50 136.50 Irrigation Setup acre Jul 1.0000 363.68 ------- ------- ------- ------- ------ ------- ------- -------- TOTALS 60.98 37.19 62.47 115.49 124.87 1149.77 3956.04 5745.62 INTEREST ON OPERATING CAPITAL 54.67 UNALLOCATED LABOR 13.53 TOTAL SPECIFIED COST 5813.82 _______________________________________________________________________________________________________________________________________________ Note: Cost of production estimates are based on 2010 input prices. Fertilization decisions should be based on soil tests. Irrigation implies 6 acre inches applied as needed over the production period for both fertigation and water needs.

42
Table 9.B Estimated costs per acre Pumpkin, freshmarket, irrigated 8 ft row spacing, 12 gpm with 5,445 ft of drip tape, Mississippi, 2011 _______________________________________________________________________ ITEM UNIT PRICE QUANTITY AMOUNT YOUR FARM _______________________________________________________________________ dollars dollars DIRECT EXPENSES FERTILIZER Lime (Spread) ton 46.00 0.1633 7.51 _________ Fert 13-13-13 cwt 15.43 9.0000 138.87 _________ Calcium Nitrate lb 0.35 275.0000 96.25 _________ FUNGICIDE Quadris oz 2.52 22.0000 55.44 _________ Bravo Weather Stick pt 5.69 4.0000 22.76 _________ INSECTICIDE Thionex 3EC pt 3.47 4.0000 13.88 _________ Brigade 2EC oz 0.94 12.0000 11.28 _________ SEED/PLANTS Pumpkin Seed Hybrid lb 81.00 1.5000 121.50 _________ OTHER Plastic Mulch roll 162.00 1.4000 226.80 _________ Pallet Crates-1350lb each 21.78 123.0000 2678.94 _________ IRRIGATION SUPPLIES Drip Tape roll 147.50 0.9000 132.75 _________ Rural Water ac-in 75.01 6.0000 450.06 _________ OPERATOR LABOR Tractors hour 11.35 5.9557 67.61 _________ HARVEST LABOR Special Labor hour 9.10 90.0000 819.00 _________ HAND LABOR Implements hour 9.10 2.9186 26.56 _________ FERTIGATION LABOR Special Labor hour 9.10 11.0000 100.10 _________ LABOR MULCH CLEANUP Special Labor hour 9.10 15.0000 136.50 _________ UNALLOCATED LABOR hour 11.35 1.1911 13.53 _________ DIESEL FUEL Tractors gal 2.39 22.9914 54.98 _________ REPAIR & MAINTENANCE Implements acre 62.47 1.0000 62.47 _________ Tractors acre 6.00 1.0000 6.00 _________ INTEREST ON OP. CAP. acre 54.67 1.0000 54.67 _________ --------- TOTAL DIRECT EXPENSES 5297.46 _________ FIXED EXPENSES Implements acre 115.49 1.0000 115.49 _________ Tractors acre 37.19 1.0000 37.19 _________ Irrigation Setup acre 363.68 1.0000 363.68 _________ --------- TOTAL FIXED EXPENSES 516.36 _________ --------- TOTAL SPECIFIED EXPENSES 5813.82 _________ _______________________________________________________________________ Note: Cost of production estimates are based on 2010 input prices. Fertilization decisions should be based on soil tests. Irrigation implies 6 acre inches applied as needed over the production period for both fertigation and water needs.

43
Table 9.C Estimated monthly income and expense flows per acre Pumpkin, freshmarket, irrigated 8 ft row spacing, 12 gpm with 5,445 ft of drip tape, Mississippi, 2011 __________________________________________________________________________________________________________________________________ ITEM May Jun Jul Aug Sep Oct Nov Dec Jan Feb Mar Apr __________________________________________________________________________________________________________________________________ --------------------------------------------------dollars-------------------------------------------------- TOTAL INCOME 0.00 0.00 0.00 0.00 0.00 0.00 0.00 0.00 0.00 0.00 0.00 0.00 DIRECT EXPENSES FERTILIZER 7.51 138.87 26.25 26.25 35.00 8.75 0.00 0.00 0.00 0.00 0.00 0.00 FUNGICIDE 0.00 0.00 0.00 50.48 27.72 0.00 0.00 0.00 0.00 0.00 0.00 0.00 INSECTICIDE 0.00 0.00 13.88 0.00 11.28 0.00 0.00 0.00 0.00 0.00 0.00 0.00 SEED/PLANTS 0.00 0.00 121.50 0.00 0.00 0.00 0.00 0.00 0.00 0.00 0.00 0.00 OTHER 0.00 226.80 0.00 0.00 0.00 2678.94 0.00 0.00 0.00 0.00 0.00 0.00 IRRIGATION SUPPLIES 0.00 132.75 450.06 0.00 0.00 0.00 0.00 0.00 0.00 0.00 0.00 0.00 LABOR 3.00 9.06 95.38 34.00 43.10 834.23 144.53 0.00 0.00 0.00 0.00 0.00 LEASE * 0.00 0.00 0.00 0.00 0.00 0.00 0.00 0.00 0.00 0.00 0.00 0.00 FUEL 2.03 5.71 30.23 4.54 4.54 2.49 5.44 0.00 0.00 0.00 0.00 0.00 REPAIR & MAINTENANCE 0.50 2.08 26.39 19.18 19.18 0.42 0.72 0.00 0.00 0.00 0.00 0.00 INTEREST ON OP. CAP. 0.33 11.15 13.77 1.93 1.51 25.44 0.54 0.00 0.00 0.00 0.00 0.00 -------- -------- -------- -------- -------- -------- -------- -------- -------- -------- -------- -------- TOTAL DIRECT EXPENSES 13.37 526.42 777.46 136.38 142.33 3550.27 151.23 0.00 0.00 0.00 0.00 0.00 NET INCOME -13.37 -526.42 -777.46 -136.38 -142.33 -3550.27 -151.23 0.00 0.00 0.00 0.00 0.00 NET INCOME TO DATE -13.37 -539.79 -1317.25 -1453.63 -1595.96 -5146.23 -5297.46 -5297.46 -5297.46 -5297.46 -5297.46 -5297.46 __________________________________________________________________________________________________________________________________ Note: Cost of production estimates are based on 2010 input prices. Fertilization decisions should be based on soil tests. Irrigation implies 6 acre inches applied as needed over the production period for both fertigation and water needs. * Lease costs are based on hourly usage costs.

44
Table 9.D Breakeven price above total expenses and net returns for price/yield combinations, per acre Pumpkin, freshmarket, irrigated 8 ft row spacing, 12 gpm with 5,445 ft of drip tape, Mississippi, 2011 ________________________________________________________________________________________________________________________ -------------------------------------------BREAKEVEN PRICE---------------------------------------- Pumpkin 0.09 0.10 0.10 0.11 0.12 0.14 0.15 0.17 0.20 0.23 0.28 ________________________________________________________________________________________________________________________ PERCENT YIELD UNIT ---------------------------------------------dollars---------------------------------------------- 50 20500.00 lb -3359 -3221 -3061 -2875 -2654 -2390 -2067 -1663 -1144 -452 516 -3875 -3737 -3577 -3391 -3171 -2906 -2583 -2180 -1661 -968 0 60 24600.00 lb -2971 -2805 -2614 -2390 -2126 -1809 -1421 -937 -314 516 1679 -3488 -3322 -3130 -2906 -2642 -2325 -1937 -1453 -830 0 1162 70 28700.00 lb -2584 -2390 -2166 -1906 -1597 -1227 -775 -210 516 1485 2841 -3100 -2906 -2683 -2422 -2114 -1744 -1291 -726 0 968 2325 80 32800.00 lb -2196 -1975 -1719 -1421 -1069 -646 -129 516 1346 2454 4004 -2713 -2491 -2236 -1937 -1585 -1162 -645 0 830 1937 3488 90 36900.00 lb -1809 -1560 -1272 -937 -540 -65 516 1243 2177 3423 5167 -2325 -2076 -1788 -1453 -1057 -581 0 726 1661 2906 4651 100 41000.00 lb -1421 -1144 -825 -452 -12 516 1162 1969 3007 4392 6330 -1937 -1661 -1341 -968 -528 0 645 1453 2491 3875 5813 110 45100.00 lb -1033 -729 -378 31 516 1097 1808 2696 3838 5361 7492 -1550 -1245 -894 -484 0 581 1291 2180 3322 4844 6976 120 49200.00 lb -646 -314 69 516 1044 1679 2454 3423 4669 6330 8655 -1162 -830 -447 0 528 1162 1937 2906 4152 5813 8139 130 53300.00 lb -258 101 516 1000 1573 2260 3100 4149 5499 7299 9818 -775 -415 0 484 1057 1744 2583 3633 4983 6782 9302 140 57400.00 lb 128 516 963 1485 2101 2841 3746 4876 6330 8268 10981 -387 0 447 968 1585 2325 3229 4360 5813 7751 10464 150 61500.00 lb 516 931 1410 1969 2630 3423 4392 5603 7160 9237 12144 0 415 894 1453 2114 2906 3875 5087 6644 8720 11627 ________________________________________________________________________________________________________________________ The top number in each cell is Returns Above Direct Expenses. The bottom number in each cell is Returns Above Total Specified Expenses. Only the product listed has been varied to calculate net returns. Note: Cost of production estimates are based on 2010 input prices.
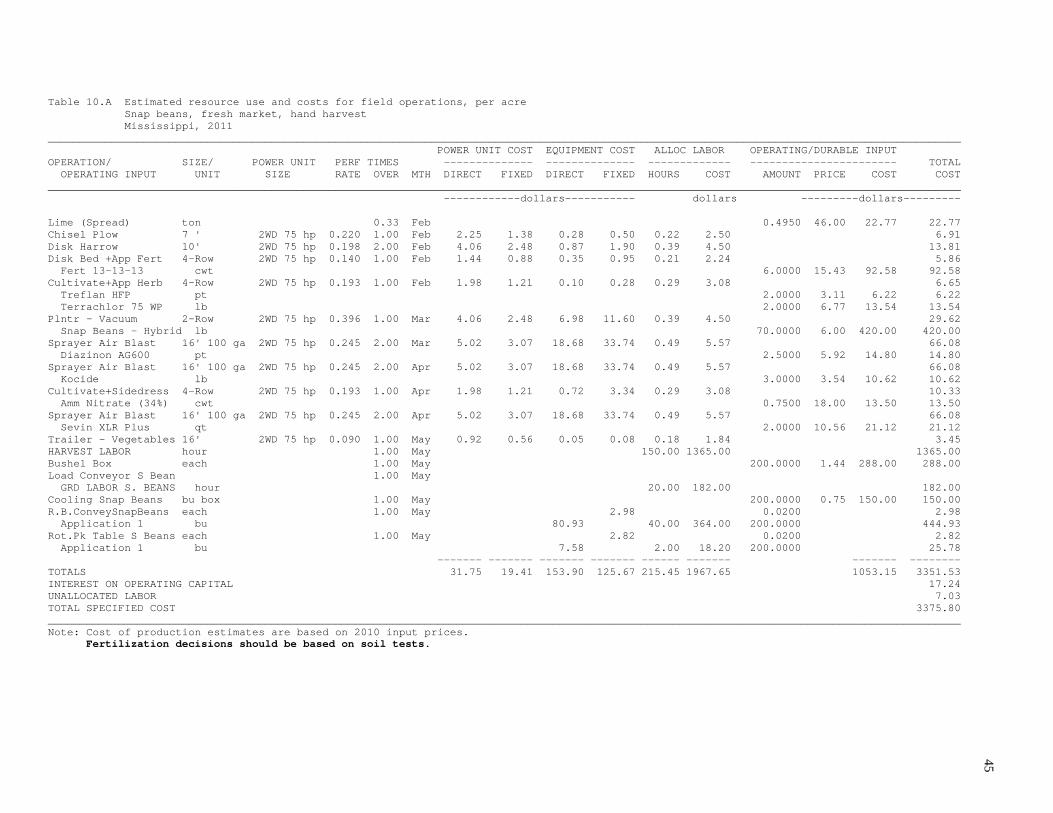
45
Table 10.A Estimated resource use and costs for field operations, per acre Snap beans, fresh market, hand harvest Mississippi, 2011 _______________________________________________________________________________________________________________________________________________ POWER UNIT COST EQUIPMENT COST ALLOC LABOR OPERATING/DURABLE INPUT OPERATION/ SIZE/ POWER UNIT PERF TIMES -------------- -------------- ------------- ----------------------- TOTAL OPERATING INPUT UNIT SIZE RATE OVER MTH DIRECT FIXED DIRECT FIXED HOURS COST AMOUNT PRICE COST COST _______________________________________________________________________________________________________________________________________________ ------------dollars----------- dollars ---------dollars--------- Lime (Spread) ton 0.33 Feb 0.4950 46.00 22.77 22.77 Chisel Plow 7 ' 2WD 75 hp 0.220 1.00 Feb 2.25 1.38 0.28 0.50 0.22 2.50 6.91 Disk Harrow 10' 2WD 75 hp 0.198 2.00 Feb 4.06 2.48 0.87 1.90 0.39 4.50 13.81 Disk Bed +App Fert 4-Row 2WD 75 hp 0.140 1.00 Feb 1.44 0.88 0.35 0.95 0.21 2.24 5.86 Fert 13-13-13 cwt 6.0000 15.43 92.58 92.58 Cultivate+App Herb 4-Row 2WD 75 hp 0.193 1.00 Feb 1.98 1.21 0.10 0.28 0.29 3.08 6.65 Treflan HFP pt 2.0000 3.11 6.22 6.22 Terrachlor 75 WP lb 2.0000 6.77 13.54 13.54 Plntr - Vacuum 2-Row 2WD 75 hp 0.396 1.00 Mar 4.06 2.48 6.98 11.60 0.39 4.50 29.62 Snap Beans - Hybrid lb 70.0000 6.00 420.00 420.00 Sprayer Air Blast 16' 100 ga 2WD 75 hp 0.245 2.00 Mar 5.02 3.07 18.68 33.74 0.49 5.57 66.08 Diazinon AG600 pt 2.5000 5.92 14.80 14.80 Sprayer Air Blast 16' 100 ga 2WD 75 hp 0.245 2.00 Apr 5.02 3.07 18.68 33.74 0.49 5.57 66.08 Kocide lb 3.0000 3.54 10.62 10.62 Cultivate+Sidedress 4-Row 2WD 75 hp 0.193 1.00 Apr 1.98 1.21 0.72 3.34 0.29 3.08 10.33 Amm Nitrate (34%) cwt 0.7500 18.00 13.50 13.50 Sprayer Air Blast 16' 100 ga 2WD 75 hp 0.245 2.00 Apr 5.02 3.07 18.68 33.74 0.49 5.57 66.08 Sevin XLR Plus qt 2.0000 10.56 21.12 21.12 Trailer - Vegetables 16' 2WD 75 hp 0.090 1.00 May 0.92 0.56 0.05 0.08 0.18 1.84 3.45 HARVEST LABOR hour 1.00 May 150.00 1365.00 1365.00 Bushel Box each 1.00 May 200.0000 1.44 288.00 288.00 Load Conveyor S Bean 1.00 May GRD LABOR S. BEANS hour 20.00 182.00 182.00 Cooling Snap Beans bu box 1.00 May 200.0000 0.75 150.00 150.00 R.B.ConveySnapBeans each 1.00 May 2.98 0.0200 2.98 Application 1 bu 80.93 40.00 364.00 200.0000 444.93 Rot.Pk Table S Beans each 1.00 May 2.82 0.0200 2.82 Application 1 bu 7.58 2.00 18.20 200.0000 25.78 ------- ------- ------- ------- ------ ------- ------- -------- TOTALS 31.75 19.41 153.90 125.67 215.45 1967.65 1053.15 3351.53 INTEREST ON OPERATING CAPITAL 17.24 UNALLOCATED LABOR 7.03 TOTAL SPECIFIED COST 3375.80 _______________________________________________________________________________________________________________________________________________ Note: Cost of production estimates are based on 2010 input prices. Fertilization decisions should be based on soil tests.

46
Table 10.B Estimated costs per acre Snap beans, fresh market, hand harvest Mississippi, 2011 _______________________________________________________________________ ITEM UNIT PRICE QUANTITY AMOUNT YOUR FARM _______________________________________________________________________ dollars dollars DIRECT EXPENSES FERTILIZER Lime (Spread) ton 46.00 0.4950 22.77 _________ Fert 13-13-13 cwt 15.43 6.0000 92.58 _________ Amm Nitrate (34%) cwt 18.00 0.7500 13.50 _________ FUNGICIDE Terrachlor 75 WP lb 6.77 2.0000 13.54 _________ Kocide lb 3.54 3.0000 10.62 _________ HERBICIDE Treflan HFP pt 3.11 2.0000 6.22 _________ INSECTICIDE Diazinon AG600 pt 5.92 2.5000 14.80 _________ Sevin XLR Plus qt 10.56 2.0000 21.12 _________ SEED/PLANTS Snap Beans - Hybrid lb 6.00 70.0000 420.00 _________ OTHER Bushel Box each 1.44 200.0000 288.00 _________ Cooling Snap Beans bu box 0.75 200.0000 150.00 _________ OPERATOR LABOR Tractors hour 11.35 3.1054 35.23 _________ HARVEST LABOR Special Labor hour 9.10 150.0000 1365.00 _________ HAND LABOR Implements hour 9.10 0.3543 3.22 _________ GRD LABOR S. BEANS Special Labor hour 9.10 20.0000 182.00 _________ R.B.ConveySnapBeans hour 9.10 40.0000 364.00 _________ Rot.Pk Table S Beans hour 9.10 2.0000 18.20 _________ UNALLOCATED LABOR hour 11.31 0.6210 7.03 _________ DIESEL FUEL Tractors gal 2.39 11.9884 28.65 _________ REPAIR & MAINTENANCE Implements acre 65.39 1.0000 65.39 _________ Tractors acre 3.10 1.0000 3.10 _________ R.B.ConveySnapBeans bu 0.40 200.0000 80.93 _________ Rot.Pk Table S Beans bu 0.03 200.0000 7.58 _________ INTEREST ON OP. CAP. acre 17.24 1.0000 17.24 _________ --------- TOTAL DIRECT EXPENSES 3230.72 _________ FIXED EXPENSES Implements acre 119.87 1.0000 119.87 _________ Tractors acre 19.41 1.0000 19.41 _________ R.B.ConveySnapBeans each 149.19 0.0200 2.98 _________ Rot.Pk Table S Beans each 140.82 0.0200 2.82 _________ --------- TOTAL FIXED EXPENSES 145.08 _________ --------- TOTAL SPECIFIED EXPENSES 3375.80 _________ _______________________________________________________________________ Note: Cost of production estimates are based on 2010 input prices. Fertilization decisions should be based on soil tests.

47
Table 10.C Estimated monthly income and expense flows per acre Snap beans, fresh market, hand harvest Mississippi, 2011 __________________________________________________________________________________________________________________________________ ITEM Feb Mar Apr May Jun Jul Aug Sep Oct Nov Dec Jan __________________________________________________________________________________________________________________________________ --------------------------------------------------dollars-------------------------------------------------- TOTAL INCOME 0.00 0.00 0.00 0.00 0.00 0.00 0.00 0.00 0.00 0.00 0.00 0.00 DIRECT EXPENSES FERTILIZER 115.35 0.00 13.50 0.00 0.00 0.00 0.00 0.00 0.00 0.00 0.00 0.00 FUNGICIDE 13.54 0.00 10.62 0.00 0.00 0.00 0.00 0.00 0.00 0.00 0.00 0.00 HERBICIDE 6.22 0.00 0.00 0.00 0.00 0.00 0.00 0.00 0.00 0.00 0.00 0.00 INSECTICIDE 0.00 14.80 21.12 0.00 0.00 0.00 0.00 0.00 0.00 0.00 0.00 0.00 SEED/PLANTS 0.00 420.00 0.00 0.00 0.00 0.00 0.00 0.00 0.00 0.00 0.00 0.00 OTHER 0.00 0.00 0.00 438.00 0.00 0.00 0.00 0.00 0.00 0.00 0.00 0.00 LABOR 14.48 12.08 16.88 1931.24 0.00 0.00 0.00 0.00 0.00 0.00 0.00 0.00 LEASE * 0.00 0.00 0.00 0.00 0.00 0.00 0.00 0.00 0.00 0.00 0.00 0.00 FUEL 8.78 8.19 10.85 0.83 0.00 0.00 0.00 0.00 0.00 0.00 0.00 0.00 REPAIR & MAINTENANCE 2.55 26.55 39.25 88.65 0.00 0.00 0.00 0.00 0.00 0.00 0.00 0.00 INTEREST ON OP. CAP. 2.33 5.22 0.81 8.88 0.00 0.00 0.00 0.00 0.00 0.00 0.00 0.00 -------- -------- -------- -------- -------- -------- -------- -------- -------- -------- -------- -------- TOTAL DIRECT EXPENSES 163.25 486.84 113.03 2467.60 0.00 0.00 0.00 0.00 0.00 0.00 0.00 0.00 NET INCOME -163.25 -486.84 -113.03 -2467.60 0.00 0.00 0.00 0.00 0.00 0.00 0.00 0.00 NET INCOME TO DATE -163.25 -650.09 -763.12 -3230.72 -3230.72 -3230.72 -3230.72 -3230.72 -3230.72 -3230.72 -3230.72 -3230.72 __________________________________________________________________________________________________________________________________ Note: Cost of production estimates are based on 2010 input prices. Fertilization decisions should be based on soil tests. * Lease costs are based on hourly usage costs.
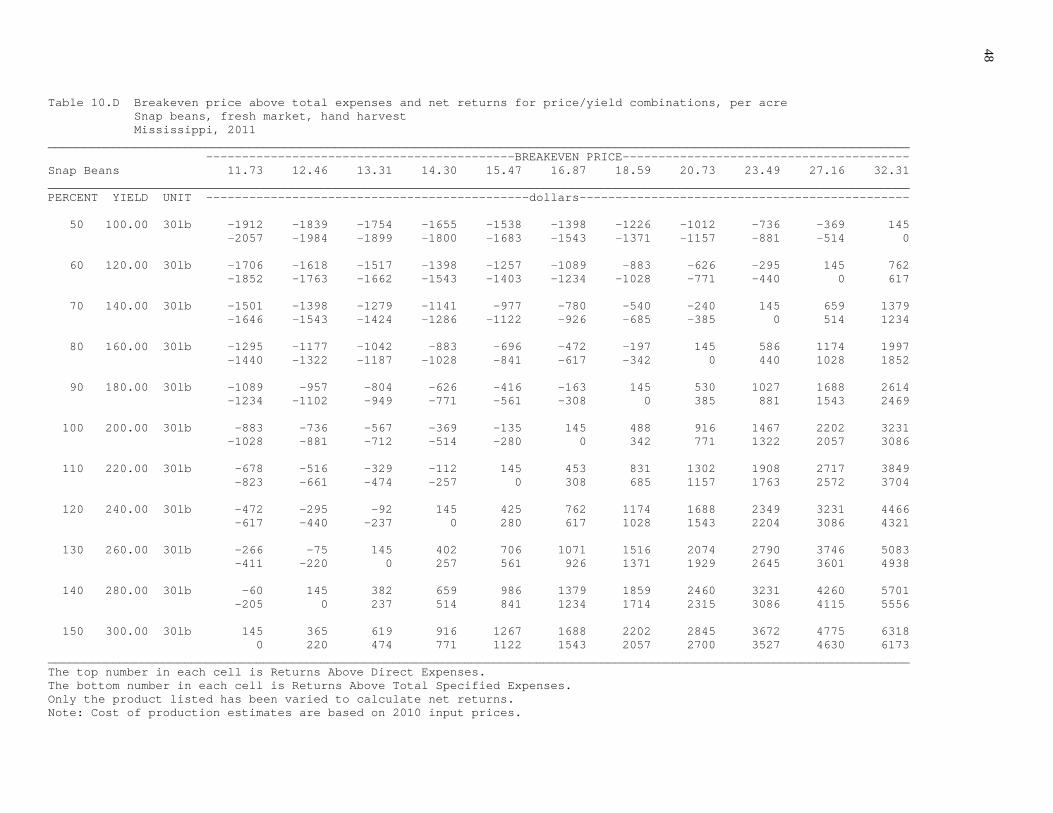
48
Table 10.D Breakeven price above total expenses and net returns for price/yield combinations, per acre Snap beans, fresh market, hand harvest Mississippi, 2011 ________________________________________________________________________________________________________________________ -------------------------------------------BREAKEVEN PRICE---------------------------------------- Snap Beans 11.73 12.46 13.31 14.30 15.47 16.87 18.59 20.73 23.49 27.16 32.31 ________________________________________________________________________________________________________________________ PERCENT YIELD UNIT ---------------------------------------------dollars---------------------------------------------- 50 100.00 30lb -1912 -1839 -1754 -1655 -1538 -1398 -1226 -1012 -736 -369 145 -2057 -1984 -1899 -1800 -1683 -1543 -1371 -1157 -881 -514 0 60 120.00 30lb -1706 -1618 -1517 -1398 -1257 -1089 -883 -626 -295 145 762 -1852 -1763 -1662 -1543 -1403 -1234 -1028 -771 -440 0 617 70 140.00 30lb -1501 -1398 -1279 -1141 -977 -780 -540 -240 145 659 1379 -1646 -1543 -1424 -1286 -1122 -926 -685 -385 0 514 1234 80 160.00 30lb -1295 -1177 -1042 -883 -696 -472 -197 145 586 1174 1997 -1440 -1322 -1187 -1028 -841 -617 -342 0 440 1028 1852 90 180.00 30lb -1089 -957 -804 -626 -416 -163 145 530 1027 1688 2614 -1234 -1102 -949 -771 -561 -308 0 385 881 1543 2469 100 200.00 30lb -883 -736 -567 -369 -135 145 488 916 1467 2202 3231 -1028 -881 -712 -514 -280 0 342 771 1322 2057 3086 110 220.00 30lb -678 -516 -329 -112 145 453 831 1302 1908 2717 3849 -823 -661 -474 -257 0 308 685 1157 1763 2572 3704 120 240.00 30lb -472 -295 -92 145 425 762 1174 1688 2349 3231 4466 -617 -440 -237 0 280 617 1028 1543 2204 3086 4321 130 260.00 30lb -266 -75 145 402 706 1071 1516 2074 2790 3746 5083 -411 -220 0 257 561 926 1371 1929 2645 3601 4938 140 280.00 30lb -60 145 382 659 986 1379 1859 2460 3231 4260 5701 -205 0 237 514 841 1234 1714 2315 3086 4115 5556 150 300.00 30lb 145 365 619 916 1267 1688 2202 2845 3672 4775 6318 0 220 474 771 1122 1543 2057 2700 3527 4630 6173 ________________________________________________________________________________________________________________________ The top number in each cell is Returns Above Direct Expenses. The bottom number in each cell is Returns Above Total Specified Expenses. Only the product listed has been varied to calculate net returns. Note: Cost of production estimates are based on 2010 input prices.

49
Table 11.A Estimated resource use and costs for field operations, per acre Snap beans, fresh market, mechanical harvest Mississippi, 2011 _______________________________________________________________________________________________________________________________________________ POWER UNIT COST EQUIPMENT COST ALLOC LABOR OPERATING/DURABLE INPUT OPERATION/ SIZE/ POWER UNIT PERF TIMES -------------- -------------- ------------- ----------------------- TOTAL OPERATING INPUT UNIT SIZE RATE OVER MTH DIRECT FIXED DIRECT FIXED HOURS COST AMOUNT PRICE COST COST _______________________________________________________________________________________________________________________________________________ ------------dollars----------- dollars ---------dollars--------- Custom Apply Fert acre 0.33 Feb 0.4950 9.00 4.46 4.46 Chisel Plow 7 ' 2WD 75 hp 0.220 1.00 Feb 2.25 1.38 0.28 0.50 0.22 2.50 6.91 Disk Harrow 10' 2WD 75 hp 0.198 2.00 Feb 4.06 2.48 0.87 1.90 0.39 4.50 13.81 Disk Bed +App Fert 4-Row 2WD 75 hp 0.140 1.00 Feb 1.44 0.88 0.35 0.95 0.21 2.24 5.86 Fert 13-13-13 cwt 6.0000 15.43 92.58 92.58 Cultivate+App Herb 4-Row 2WD 75 hp 0.193 1.00 Feb 1.98 1.21 0.10 0.28 0.29 3.08 6.65 Treflan HFP pt 2.0000 3.11 6.22 6.22 Terrachlor 75 WP lb 2.0000 6.77 13.54 13.54 Plntr - Vacuum 2-Row 2WD 75 hp 0.396 1.00 Mar 4.06 2.48 6.98 11.60 0.39 4.50 29.62 Snap Beans - Hybrid lb 70.0000 6.00 420.00 420.00 Sprayer Air Blast 16' 100 ga 2WD 75 hp 0.245 2.00 Mar 5.02 3.07 18.68 33.74 0.49 5.57 66.08 Diazinon AG600 pt 2.5000 5.92 14.80 14.80 Sprayer Air Blast 16' 100 ga 2WD 75 hp 0.245 2.00 Apr 5.02 3.07 18.68 33.74 0.49 5.57 66.08 Kocide lb 3.0000 3.54 10.62 10.62 Cultivate+Sidedress 2-Row 2WD 75 hp 0.390 1.00 Apr 3.99 2.44 0.45 2.12 0.58 6.21 15.21 Amm Nitrate (34%) cwt 0.7500 18.00 13.50 13.50 Sprayer Air Blast 16' 100 ga 2WD 75 hp 0.245 2.00 Apr 5.02 3.07 18.68 33.74 0.49 5.57 66.08 Sevin XLR Plus qt 2.0000 10.56 21.12 21.12 Picker Beans/Peas 1-Row 2WD 75 hp 3.571 1.00 May 36.53 22.30 48.32 37.97 10.71 105.54 250.66 Bushel Box each 150.0000 1.44 216.00 216.00 Trailer - Snap Bean 16' 2WD 75 hp 3.571 1.00 May 36.53 22.30 2.15 3.75 7.14 73.04 137.77 Load Conveyor S Bean 1.00 May GRD LABOR S. BEANS hour 20.00 182.00 182.00 Cooling Snap Beans bu box 1.00 May 150.0000 0.75 112.50 112.50 R.B.ConveySnapBeans each 1.00 May 2.98 0.0200 2.98 Application 1 bu 60.69 30.00 273.00 150.0000 333.69 Rot.Pk Table S Beans each 1.00 May 2.82 0.0200 2.82 Application 1 bu 5.69 1.50 13.65 150.0000 19.34 ------- ------- ------- ------- ------ ------- ------- -------- TOTALS 105.90 64.68 181.92 166.09 72.93 686.97 925.34 2130.90 INTEREST ON OPERATING CAPITAL 12.40 UNALLOCATED LABOR 23.50 TOTAL SPECIFIED COST 2166.80 _______________________________________________________________________________________________________________________________________________ Note: Cost of production estimates are based on 2010 input prices. Fertilization decisions should be based on soil tests.

50
50
Table 11.B Estimated costs per acre Snap beans, fresh market, mechanical harvest Mississippi, 2011 _______________________________________________________________________ ITEM UNIT PRICE QUANTITY AMOUNT YOUR FARM _______________________________________________________________________ dollars dollars DIRECT EXPENSES CUSTOM Custom Apply Fert acre 9.00 0.4950 4.46 _________ FERTILIZER Fert 13-13-13 cwt 15.43 6.0000 92.58 _________ Amm Nitrate (34%) cwt 18.00 0.7500 13.50 _________ FUNGICIDE Terrachlor 75 WP lb 6.77 2.0000 13.54 _________ Kocide lb 3.54 3.0000 10.62 _________ HERBICIDE Treflan HFP pt 3.11 2.0000 6.22 _________ INSECTICIDE Diazinon AG600 pt 5.92 2.5000 14.80 _________ Sevin XLR Plus qt 10.56 2.0000 21.12 _________ SEED/PLANTS Snap Beans - Hybrid lb 6.00 70.0000 420.00 _________ OTHER Bushel Box each 1.44 150.0000 216.00 _________ Cooling Snap Beans bu box 0.75 150.0000 112.50 _________ OPERATOR LABOR Tractors hour 11.35 10.3551 117.52 _________ HAND LABOR Implements hour 9.10 11.0770 100.80 _________ GRD LABOR S. BEANS Special Labor hour 9.10 20.0000 182.00 _________ R.B.ConveySnapBeans hour 9.10 30.0000 273.00 _________ Rot.Pk Table S Beans hour 9.10 1.5000 13.65 _________ UNALLOCATED LABOR hour 11.34 2.0710 23.50 _________ DIESEL FUEL Tractors gal 2.39 39.9749 95.53 _________ REPAIR & MAINTENANCE Implements acre 115.54 1.0000 115.54 _________ Tractors acre 10.37 1.0000 10.37 _________ R.B.ConveySnapBeans bu 0.40 150.0000 60.69 _________ Rot.Pk Table S Beans bu 0.03 150.0000 5.69 _________ INTEREST ON OP. CAP. acre 12.40 1.0000 12.40 _________ --------- TOTAL DIRECT EXPENSES 1936.03 _________ FIXED EXPENSES Implements acre 160.29 1.0000 160.29 _________ Tractors acre 64.68 1.0000 64.68 _________ R.B.ConveySnapBeans each 149.19 0.0200 2.98 _________ Rot.Pk Table S Beans each 140.82 0.0200 2.82 _________ --------- TOTAL FIXED EXPENSES 230.77 _________ --------- TOTAL SPECIFIED EXPENSES 2166.80 _________ _______________________________________________________________________ Note: Cost of production estimates are based on 2010 input prices. Fertilization decisions should be based on soil tests.

51
Table 11.C Estimated monthly income and expense flows per acre Snap beans, fresh market, mechanical harvest Mississippi, 2011 __________________________________________________________________________________________________________________________________ ITEM Feb Mar Apr May Jun Jul Aug Sep Oct Nov Dec Jan __________________________________________________________________________________________________________________________________ --------------------------------------------------dollars-------------------------------------------------- TOTAL INCOME 0.00 0.00 0.00 0.00 0.00 0.00 0.00 0.00 0.00 0.00 0.00 0.00 DIRECT EXPENSES CUSTOM 4.46 0.00 0.00 0.00 0.00 0.00 0.00 0.00 0.00 0.00 0.00 0.00 FERTILIZER 92.58 0.00 13.50 0.00 0.00 0.00 0.00 0.00 0.00 0.00 0.00 0.00 FUNGICIDE 13.54 0.00 10.62 0.00 0.00 0.00 0.00 0.00 0.00 0.00 0.00 0.00 HERBICIDE 6.22 0.00 0.00 0.00 0.00 0.00 0.00 0.00 0.00 0.00 0.00 0.00 INSECTICIDE 0.00 14.80 21.12 0.00 0.00 0.00 0.00 0.00 0.00 0.00 0.00 0.00 SEED/PLANTS 0.00 420.00 0.00 0.00 0.00 0.00 0.00 0.00 0.00 0.00 0.00 0.00 OTHER 0.00 0.00 0.00 328.50 0.00 0.00 0.00 0.00 0.00 0.00 0.00 0.00 LABOR 14.48 12.08 20.46 663.45 0.00 0.00 0.00 0.00 0.00 0.00 0.00 0.00 LEASE * 0.00 0.00 0.00 0.00 0.00 0.00 0.00 0.00 0.00 0.00 0.00 0.00 FUEL 8.78 8.19 12.66 65.90 0.00 0.00 0.00 0.00 0.00 0.00 0.00 0.00 REPAIR & MAINTENANCE 2.55 26.55 39.18 124.01 0.00 0.00 0.00 0.00 0.00 0.00 0.00 0.00 INTEREST ON OP. CAP. 2.06 5.22 0.85 4.27 0.00 0.00 0.00 0.00 0.00 0.00 0.00 0.00 -------- -------- -------- -------- -------- -------- -------- -------- -------- -------- -------- -------- TOTAL DIRECT EXPENSES 144.67 486.84 118.39 1186.13 0.00 0.00 0.00 0.00 0.00 0.00 0.00 0.00 NET INCOME -144.67 -486.84 -118.39 -1186.13 0.00 0.00 0.00 0.00 0.00 0.00 0.00 0.00 NET INCOME TO DATE -144.67 -631.51 -749.90 -1936.03 -1936.03 -1936.03 -1936.03 -1936.03 -1936.03 -1936.03 -1936.03 -1936.03 __________________________________________________________________________________________________________________________________ Note: Cost of production estimates are based on 2010 input prices. Fertilization decisions should be based on soil tests. * Lease costs are based on hourly usage costs.

52
Table 11.D Breakeven price above total expenses and net returns for price/yield combinations, per acre Snap beans, fresh market, mechanical harvest Mississippi, 2011 ________________________________________________________________________________________________________________________ -------------------------------------------BREAKEVEN PRICE---------------------------------------- Snap Beans 10.11 10.73 11.44 12.27 13.26 14.44 15.88 17.69 20.01 23.11 27.44 ________________________________________________________________________________________________________________________ PERCENT YIELD UNIT ---------------------------------------------dollars---------------------------------------------- 50 75.00 30lb -1069 -1022 -969 -906 -832 -744 -635 -500 -326 -94 230 -1300 -1253 -1200 -1137 -1063 -975 -866 -731 -557 -325 0 60 90.00 30lb -939 -883 -819 -744 -655 -549 -419 -256 -47 230 620 -1170 -1114 -1050 -975 -886 -780 -650 -487 -278 0 390 70 105.00 30lb -809 -744 -669 -581 -478 -354 -202 -12 230 555 1010 -1040 -975 -900 -812 -709 -585 -433 -243 0 325 780 80 120.00 30lb -679 -604 -519 -419 -301 -159 14 230 509 880 1400 -910 -835 -750 -650 -531 -390 -216 0 278 650 1170 90 135.00 30lb -549 -465 -369 -256 -123 35 230 474 787 1205 1790 -780 -696 -600 -487 -354 -195 0 243 557 975 1560 100 150.00 30lb -419 -326 -219 -94 53 230 447 718 1066 1530 2180 -650 -557 -450 -325 -177 0 216 487 835 1300 1950 110 165.00 30lb -289 -187 -69 68 230 425 664 962 1345 1855 2570 -520 -417 -300 -162 0 195 433 731 1114 1625 2340 120 180.00 30lb -159 -47 80 230 408 620 880 1205 1623 2180 2960 -390 -278 -150 0 177 390 650 975 1392 1950 2730 130 195.00 30lb -29 91 230 393 585 815 1097 1449 1902 2505 3350 -260 -139 0 162 354 585 866 1218 1671 2275 3120 140 210.00 30lb 100 230 380 555 762 1010 1314 1693 2180 2830 3740 -130 0 150 325 531 780 1083 1462 1950 2600 3510 150 225.00 30lb 230 370 530 718 939 1205 1530 1937 2459 3155 4130 0 139 300 487 709 975 1300 1706 2228 2925 3900 ________________________________________________________________________________________________________________________ The top number in each cell is Returns Above Direct Expenses. The bottom number in each cell is Returns Above Total Specified Expenses. Only the product listed has been varied to calculate net returns. Note: Cost of production estimates are based on 2010 input prices.
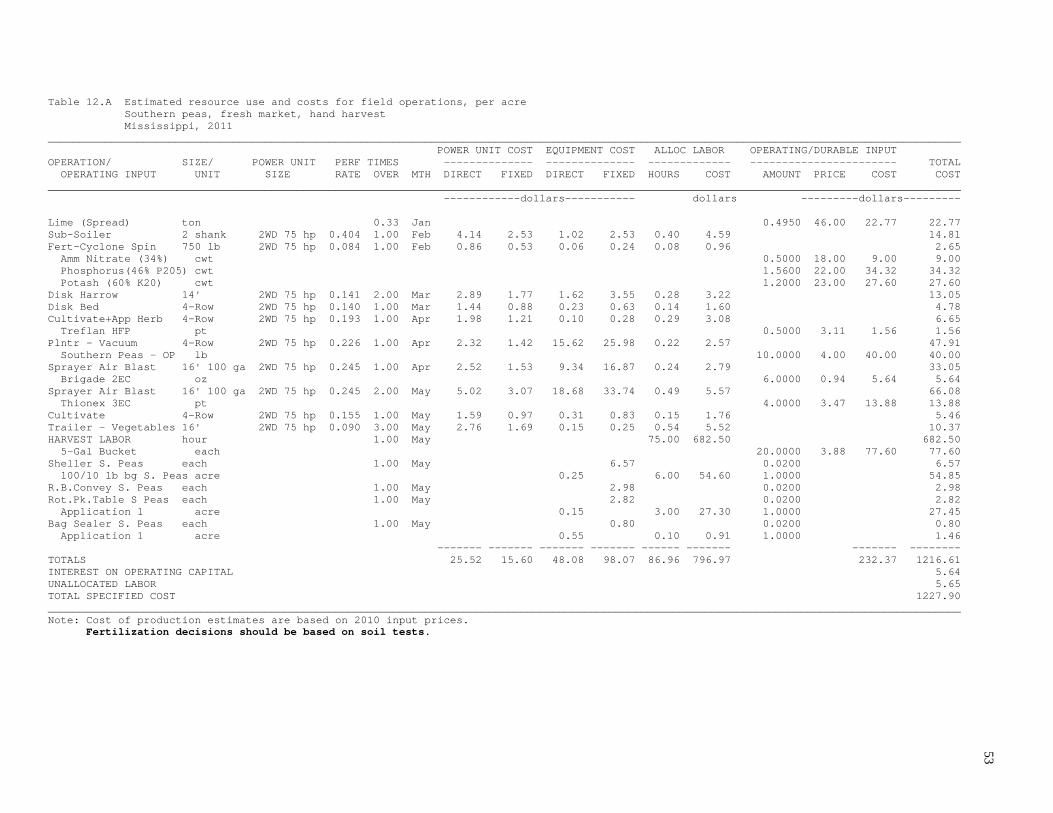
53
Table 12.A Estimated resource use and costs for field operations, per acre Southern peas, fresh market, hand harvest Mississippi, 2011 _______________________________________________________________________________________________________________________________________________ POWER UNIT COST EQUIPMENT COST ALLOC LABOR OPERATING/DURABLE INPUT OPERATION/ SIZE/ POWER UNIT PERF TIMES -------------- -------------- ------------- ----------------------- TOTAL OPERATING INPUT UNIT SIZE RATE OVER MTH DIRECT FIXED DIRECT FIXED HOURS COST AMOUNT PRICE COST COST _______________________________________________________________________________________________________________________________________________ ------------dollars----------- dollars ---------dollars--------- Lime (Spread) ton 0.33 Jan 0.4950 46.00 22.77 22.77 Sub-Soiler 2 shank 2WD 75 hp 0.404 1.00 Feb 4.14 2.53 1.02 2.53 0.40 4.59 14.81 Fert-Cyclone Spin 750 lb 2WD 75 hp 0.084 1.00 Feb 0.86 0.53 0.06 0.24 0.08 0.96 2.65 Amm Nitrate (34%) cwt 0.5000 18.00 9.00 9.00 Phosphorus(46% P205) cwt 1.5600 22.00 34.32 34.32 Potash (60% K20) cwt 1.2000 23.00 27.60 27.60 Disk Harrow 14' 2WD 75 hp 0.141 2.00 Mar 2.89 1.77 1.62 3.55 0.28 3.22 13.05 Disk Bed 4-Row 2WD 75 hp 0.140 1.00 Mar 1.44 0.88 0.23 0.63 0.14 1.60 4.78 Cultivate+App Herb 4-Row 2WD 75 hp 0.193 1.00 Apr 1.98 1.21 0.10 0.28 0.29 3.08 6.65 Treflan HFP pt 0.5000 3.11 1.56 1.56 Plntr - Vacuum 4-Row 2WD 75 hp 0.226 1.00 Apr 2.32 1.42 15.62 25.98 0.22 2.57 47.91 Southern Peas - OP lb 10.0000 4.00 40.00 40.00 Sprayer Air Blast 16' 100 ga 2WD 75 hp 0.245 1.00 Apr 2.52 1.53 9.34 16.87 0.24 2.79 33.05 Brigade 2EC oz 6.0000 0.94 5.64 5.64 Sprayer Air Blast 16' 100 ga 2WD 75 hp 0.245 2.00 May 5.02 3.07 18.68 33.74 0.49 5.57 66.08 Thionex 3EC pt 4.0000 3.47 13.88 13.88 Cultivate 4-Row 2WD 75 hp 0.155 1.00 May 1.59 0.97 0.31 0.83 0.15 1.76 5.46 Trailer - Vegetables 16' 2WD 75 hp 0.090 3.00 May 2.76 1.69 0.15 0.25 0.54 5.52 10.37 HARVEST LABOR hour 1.00 May 75.00 682.50 682.50 5-Gal Bucket each 20.0000 3.88 77.60 77.60 Sheller S. Peas each 1.00 May 6.57 0.0200 6.57 100/10 lb bg S. Peas acre 0.25 6.00 54.60 1.0000 54.85 R.B.Convey S. Peas each 1.00 May 2.98 0.0200 2.98 Rot.Pk.Table S Peas each 1.00 May 2.82 0.0200 2.82 Application 1 acre 0.15 3.00 27.30 1.0000 27.45 Bag Sealer S. Peas each 1.00 May 0.80 0.0200 0.80 Application 1 acre 0.55 0.10 0.91 1.0000 1.46 ------- ------- ------- ------- ------ ------- ------- -------- TOTALS 25.52 15.60 48.08 98.07 86.96 796.97 232.37 1216.61 INTEREST ON OPERATING CAPITAL 5.64 UNALLOCATED LABOR 5.65 TOTAL SPECIFIED COST 1227.90 _______________________________________________________________________________________________________________________________________________ Note: Cost of production estimates are based on 2010 input prices. Fertilization decisions should be based on soil tests.

54
54
Table 12.B Estimated costs per acre Southern peas, fresh market, hand harvest Mississippi, 2011 _______________________________________________________________________ ITEM UNIT PRICE QUANTITY AMOUNT YOUR FARM _______________________________________________________________________ dollars dollars DIRECT EXPENSES FERTILIZER Lime (Spread) ton 46.00 0.4950 22.77 _________ Amm Nitrate (34%) cwt 18.00 0.5000 9.00 _________ Phosphorus(46% P205) cwt 22.00 1.5600 34.32 _________ Potash (60% K20) cwt 23.00 1.2000 27.60 _________ HERBICIDE Treflan HFP pt 3.11 0.5000 1.56 _________ INSECTICIDE Brigade 2EC oz 0.94 6.0000 5.64 _________ Thionex 3EC pt 3.47 4.0000 13.88 _________ SEED/PLANTS Southern Peas - OP lb 4.00 10.0000 40.00 _________ OTHER 5-Gal Bucket each 3.88 20.0000 77.60 _________ OPERATOR LABOR Tractors hour 11.35 2.4950 28.32 _________ HARVEST LABOR Special Labor hour 9.10 75.0000 682.50 _________ HAND LABOR Implements hour 9.10 0.3669 3.34 _________ GRD LABOR S. PEAS Rot.Pk.Table S Peas hour 9.10 3.0000 27.30 _________ Bag Sealer S. Peas hour 9.10 0.1000 0.91 _________ Sheller S. Peas hour 9.10 6.0000 54.60 _________ UNALLOCATED LABOR hour 11.32 0.4990 5.65 _________ DIESEL FUEL Tractors gal 2.39 9.6319 23.02 _________ REPAIR & MAINTENANCE Implements acre 47.13 1.0000 47.13 _________ Tractors acre 2.50 1.0000 2.50 _________ Rot.Pk.Table S Peas acre 0.15 1.0000 0.15 _________ Bag Sealer S. Peas acre 0.55 1.0000 0.55 _________ Sheller S. Peas acre 0.25 1.0000 0.25 _________ INTEREST ON OP. CAP. acre 5.64 1.0000 5.64 _________ --------- TOTAL DIRECT EXPENSES 1114.23 _________ FIXED EXPENSES Implements acre 84.90 1.0000 84.90 _________ Tractors acre 15.60 1.0000 15.60 _________ R.B.Convey S. Peas each 149.19 0.0200 2.98 _________ Rot.Pk.Table S Peas each 140.82 0.0200 2.82 _________ Bag Sealer S. Peas each 39.78 0.0200 0.80 _________ Sheller S. Peas each 328.63 0.0200 6.57 _________ --------- TOTAL FIXED EXPENSES 113.67 _________ --------- TOTAL SPECIFIED EXPENSES 1227.90 _________ _______________________________________________________________________ Note: Cost of production estimates are based on 2010 input prices. Fertilization decisions should be based on soil tests.

55
Table 12.C Estimated monthly income and expense flows per acre Southern peas, fresh market, hand harvest Mississippi, 2011 __________________________________________________________________________________________________________________________________ ITEM Jan Feb Mar Apr May Jun Jul Aug Sep Oct Nov Dec __________________________________________________________________________________________________________________________________ --------------------------------------------------dollars-------------------------------------------------- TOTAL INCOME 0.00 0.00 0.00 0.00 0.00 0.00 0.00 0.00 0.00 0.00 0.00 0.00 DIRECT EXPENSES FERTILIZER 22.77 70.92 0.00 0.00 0.00 0.00 0.00 0.00 0.00 0.00 0.00 0.00 HERBICIDE 0.00 0.00 0.00 1.56 0.00 0.00 0.00 0.00 0.00 0.00 0.00 0.00 INSECTICIDE 0.00 0.00 0.00 5.64 13.88 0.00 0.00 0.00 0.00 0.00 0.00 0.00 SEED/PLANTS 0.00 0.00 0.00 40.00 0.00 0.00 0.00 0.00 0.00 0.00 0.00 0.00 OTHER 0.00 0.00 0.00 0.00 77.60 0.00 0.00 0.00 0.00 0.00 0.00 0.00 LABOR 0.00 6.66 5.78 9.95 780.23 0.00 0.00 0.00 0.00 0.00 0.00 0.00 LEASE * 0.00 0.00 0.00 0.00 0.00 0.00 0.00 0.00 0.00 0.00 0.00 0.00 FUEL 0.00 4.51 3.91 6.15 8.45 0.00 0.00 0.00 0.00 0.00 0.00 0.00 REPAIR & MAINTENANCE 0.00 1.57 2.27 25.73 21.01 0.00 0.00 0.00 0.00 0.00 0.00 0.00 INTEREST ON OP. CAP. 0.41 1.21 0.13 0.64 3.25 0.00 0.00 0.00 0.00 0.00 0.00 0.00 -------- -------- -------- -------- -------- -------- -------- -------- -------- -------- -------- -------- TOTAL DIRECT EXPENSES 23.18 84.87 12.09 89.67 904.42 0.00 0.00 0.00 0.00 0.00 0.00 0.00 NET INCOME -23.18 -84.87 -12.09 -89.67 -904.42 0.00 0.00 0.00 0.00 0.00 0.00 0.00 NET INCOME TO DATE -23.18 -108.05 -120.14 -209.81 -1114.23 -1114.23 -1114.23 -1114.23 -1114.23 -1114.23 -1114.23 -1114.23 __________________________________________________________________________________________________________________________________ Note: Cost of production estimates are based on 2010 input prices. Fertilization decisions should be based on soil tests. * Lease costs are based on hourly usage costs.

56
Table 12.D Breakeven price above total expenses and net returns for price/yield combinations, per acre Southern peas, fresh market, hand harvest Mississippi, 2011 ________________________________________________________________________________________________________________________ -------------------------------------------BREAKEVEN PRICE---------------------------------------- Southern Peas 8.18 8.77 9.44 10.23 11.16 12.27 13.64 15.34 17.54 20.46 24.55 ________________________________________________________________________________________________________________________ PERCENT YIELD UNIT ---------------------------------------------dollars---------------------------------------------- 50 50.00 10lb -704 -675 -641 -602 -556 -500 -432 -346 -237 -90 113 -818 -789 -755 -716 -669 -613 -545 -460 -350 -204 0 60 60.00 10lb -623 -587 -547 -500 -444 -377 -295 -193 -61 113 359 -736 -701 -661 -613 -558 -491 -409 -306 -175 0 245 70 70.00 10lb -541 -500 -453 -397 -332 -254 -159 -39 113 318 604 -654 -613 -566 -511 -446 -368 -272 -153 0 204 491 80 80.00 10lb -459 -412 -358 -295 -221 -131 -22 113 289 522 850 -573 -526 -472 -409 -334 -245 -136 0 175 409 736 90 90.00 10lb -377 -324 -264 -193 -109 -9 113 267 464 727 1095 -491 -438 -377 -306 -223 -122 0 153 350 613 982 100 100.00 10lb -295 -237 -169 -90 2 113 250 420 639 932 1341 -409 -350 -283 -204 -111 0 136 306 526 818 1227 110 110.00 10lb -213 -149 -75 11 113 236 386 574 815 1136 1587 -327 -263 -188 -102 0 122 272 460 701 1023 1473 120 120.00 10lb -131 -61 19 113 225 359 522 727 990 1341 1832 -245 -175 -94 0 111 245 409 613 877 1227 1719 130 130.00 10lb -50 25 113 215 336 482 659 881 1166 1546 2078 -163 -87 0 102 223 368 545 767 1052 1432 1964 140 140.00 10lb 31 113 208 318 448 604 795 1034 1341 1750 2323 -81 0 94 204 334 491 682 920 1227 1637 2210 150 150.00 10lb 113 201 302 420 560 727 932 1188 1516 1955 2569 0 87 188 306 446 613 818 1074 1403 1841 2455 ________________________________________________________________________________________________________________________ The top number in each cell is Returns Above Direct Expenses. The bottom number in each cell is Returns Above Total Specified Expenses. Only the product listed has been varied to calculate net returns. Note: Cost of production estimates are based on 2010 input prices.

57
Table 13.A Estimated resource use and costs for field operations, per acre Southern peas, fresh market, mechanical harvest Mississippi, 2011 _______________________________________________________________________________________________________________________________________________ POWER UNIT COST EQUIPMENT COST ALLOC LABOR OPERATING/DURABLE INPUT OPERATION/ SIZE/ POWER UNIT PERF TIMES -------------- -------------- ------------- ----------------------- TOTAL OPERATING INPUT UNIT SIZE RATE OVER MTH DIRECT FIXED DIRECT FIXED HOURS COST AMOUNT PRICE COST COST _______________________________________________________________________________________________________________________________________________ ------------dollars----------- dollars ---------dollars--------- Lime (Spread) ton 0.33 Jan 0.4950 46.00 22.77 22.77 Sub-Soiler 2 shank 2WD 75 hp 0.404 1.00 Feb 4.14 2.53 1.02 2.53 0.40 4.59 14.81 Fert-Cyclone Spin 750 lb 2WD 75 hp 0.084 1.00 Feb 0.86 0.53 0.06 0.24 0.08 0.96 2.65 Amm Nitrate (34%) cwt 0.5000 18.00 9.00 9.00 Phosphorus(46% P205) cwt 1.5600 22.00 34.32 34.32 Potash (60% K20) cwt 1.2000 23.00 27.60 27.60 Disk Harrow 14' 2WD 75 hp 0.141 2.00 Mar 2.89 1.77 1.62 3.55 0.28 3.22 13.05 Disk Bed 4-Row 2WD 75 hp 0.140 1.00 Mar 1.44 0.88 0.23 0.63 0.14 1.60 4.78 Cultivate+App Herb 4-Row 2WD 75 hp 0.193 1.00 Apr 1.98 1.21 0.10 0.28 0.29 3.08 6.65 Treflan HFP pt 0.5000 3.11 1.56 1.56 Plntr - Vacuum 4-Row 2WD 75 hp 0.226 1.00 Apr 2.32 1.42 15.62 25.98 0.22 2.57 47.91 Southern Peas - OP lb 10.0000 4.00 40.00 40.00 Sprayer Air Blast 16' 100 ga 2WD 75 hp 0.245 1.00 Apr 2.52 1.53 9.34 16.87 0.24 2.79 33.05 Brigade 2EC oz 6.0000 0.94 5.64 5.64 Sprayer Air Blast 16' 100 ga 2WD 75 hp 0.245 2.00 May 5.02 3.07 18.68 33.74 0.49 5.57 66.08 Thionex 3EC pt 4.0000 3.47 13.88 13.88 Cultivate 4-Row 2WD 75 hp 0.155 1.00 May 1.59 0.97 0.31 0.83 0.15 1.76 5.46 Trailer-Southern Pea 16' 2WD 75 hp 3.571 1.00 May 36.53 22.30 2.15 3.75 7.14 73.04 137.77 Picker Beans/Peas 1-Row 2WD 75 hp 3.571 1.00 May 36.53 22.30 48.32 37.97 10.71 105.54 250.66 Sacks - S Peas each 75.0000 0.36 27.00 27.00 Sheller S. Peas each 1.00 May 6.57 0.0200 6.57 64/10 lb bg S. Peas acre 0.25 6.00 54.60 1.0000 54.85 R.B.Convey S. Peas each 1.00 May 2.98 0.0200 2.98 Rot.Pk.Table S Peas each 1.00 May 2.82 0.0200 2.82 Application 1 acre 0.15 3.00 27.30 1.0000 27.45 Bag Sealer S. Peas each 1.00 May 0.80 0.0200 0.80 Application 1 acre 0.55 0.10 0.91 1.0000 1.46 ------- ------- ------- ------- ------ ------- ------- -------- TOTALS 95.82 58.51 98.40 139.54 29.27 287.53 181.77 861.57 INTEREST ON OPERATING CAPITAL 4.12 UNALLOCATED LABOR 21.26 TOTAL SPECIFIED COST 886.95 _______________________________________________________________________________________________________________________________________________ Note: Cost of production estimates are based on 2010 input prices. Fertilization decisions should be based on soil tests.

58
Table 13.B Estimated costs per acre Southern peas, fresh market, mechanical harvest Mississippi, 2011 _______________________________________________________________________ ITEM UNIT PRICE QUANTITY AMOUNT YOUR FARM _______________________________________________________________________ dollars dollars DIRECT EXPENSES FERTILIZER Lime (Spread) ton 46.00 0.4950 22.77 _________ Amm Nitrate (34%) cwt 18.00 0.5000 9.00 _________ Phosphorus(46% P205) cwt 22.00 1.5600 34.32 _________ Potash (60% K20) cwt 23.00 1.2000 27.60 _________ HERBICIDE Treflan HFP pt 3.11 0.5000 1.56 _________ INSECTICIDE Brigade 2EC oz 0.94 6.0000 5.64 _________ Thionex 3EC pt 3.47 4.0000 13.88 _________ SEED/PLANTS Southern Peas - OP lb 4.00 10.0000 40.00 _________ OTHER Sacks - S Peas each 0.36 75.0000 27.00 _________ OPERATOR LABOR Tractors hour 11.35 9.3679 106.34 _________ HAND LABOR Implements hour 9.10 10.8112 98.38 _________ GRD LABOR S. PEAS Rot.Pk.Table S Peas hour 9.10 3.0000 27.30 _________ Bag Sealer S. Peas hour 9.10 0.1000 0.91 _________ Sheller S. Peas hour 9.10 6.0000 54.60 _________ UNALLOCATED LABOR hour 11.34 1.8735 21.26 _________ DIESEL FUEL Tractors gal 2.39 36.1639 86.43 _________ REPAIR & MAINTENANCE Implements acre 97.45 1.0000 97.45 _________ Tractors acre 9.39 1.0000 9.39 _________ Rot.Pk.Table S Peas acre 0.15 1.0000 0.15 _________ Bag Sealer S. Peas acre 0.55 1.0000 0.55 _________ Sheller S. Peas acre 0.25 1.0000 0.25 _________ INTEREST ON OP. CAP. acre 4.12 1.0000 4.12 _________ --------- TOTAL DIRECT EXPENSES 688.90 _________ FIXED EXPENSES Implements acre 126.37 1.0000 126.37 _________ Tractors acre 58.51 1.0000 58.51 _________ R.B.Convey S. Peas each 149.19 0.0200 2.98 _________ Rot.Pk.Table S Peas each 140.82 0.0200 2.82 _________ Bag Sealer S. Peas each 39.78 0.0200 0.80 _________ Sheller S. Peas each 328.63 0.0200 6.57 _________ --------- TOTAL FIXED EXPENSES 198.05 _________ --------- TOTAL SPECIFIED EXPENSES 886.95 _________ _______________________________________________________________________ Note: Cost of production estimates are based on 2010 input prices. Fertilization decisions should be based on soil tests.

59
Table 13.C Estimated monthly income and expense flows per acre Southern peas, fresh market, mechanical harvest Mississippi, 2011 __________________________________________________________________________________________________________________________________ ITEM Jan Feb Mar Apr May Jun Jul Aug Sep Oct Nov Dec __________________________________________________________________________________________________________________________________ --------------------------------------------------dollars-------------------------------------------------- TOTAL INCOME 0.00 0.00 0.00 0.00 0.00 0.00 0.00 0.00 0.00 0.00 0.00 0.00 DIRECT EXPENSES FERTILIZER 22.77 70.92 0.00 0.00 0.00 0.00 0.00 0.00 0.00 0.00 0.00 0.00 HERBICIDE 0.00 0.00 0.00 1.56 0.00 0.00 0.00 0.00 0.00 0.00 0.00 0.00 INSECTICIDE 0.00 0.00 0.00 5.64 13.88 0.00 0.00 0.00 0.00 0.00 0.00 0.00 SEED/PLANTS 0.00 0.00 0.00 40.00 0.00 0.00 0.00 0.00 0.00 0.00 0.00 0.00 OTHER 0.00 0.00 0.00 0.00 27.00 0.00 0.00 0.00 0.00 0.00 0.00 0.00 LABOR 0.00 6.66 5.78 9.95 286.40 0.00 0.00 0.00 0.00 0.00 0.00 0.00 LEASE * 0.00 0.00 0.00 0.00 0.00 0.00 0.00 0.00 0.00 0.00 0.00 0.00 FUEL 0.00 4.51 3.91 6.15 71.86 0.00 0.00 0.00 0.00 0.00 0.00 0.00 REPAIR & MAINTENANCE 0.00 1.57 2.27 25.73 78.22 0.00 0.00 0.00 0.00 0.00 0.00 0.00 INTEREST ON OP. CAP. 0.41 1.21 0.13 0.64 1.73 0.00 0.00 0.00 0.00 0.00 0.00 0.00 -------- -------- -------- -------- -------- -------- -------- -------- -------- -------- -------- -------- TOTAL DIRECT EXPENSES 23.18 84.87 12.09 89.67 479.09 0.00 0.00 0.00 0.00 0.00 0.00 0.00 NET INCOME -23.18 -84.87 -12.09 -89.67 -479.09 0.00 0.00 0.00 0.00 0.00 0.00 0.00 NET INCOME TO DATE -23.18 -108.05 -120.14 -209.81 -688.90 -688.90 -688.90 -688.90 -688.90 -688.90 -688.90 -688.90 __________________________________________________________________________________________________________________________________ Note: Cost of production estimates are based on 2010 input prices. Fertilization decisions should be based on soil tests. * Lease costs are based on hourly usage costs.

60
Table 13.D Breakeven price above total expenses and net returns for price/yield combinations, per acre Southern peas, fresh market, mechanical harvest Mississippi, 2011 ________________________________________________________________________________________________________________________ -------------------------------------------BREAKEVEN PRICE---------------------------------------- Southern Peas 9.23 9.89 10.66 11.54 12.59 13.85 15.39 17.32 19.79 23.09 27.71 ________________________________________________________________________________________________________________________ PERCENT YIELD UNIT ---------------------------------------------dollars---------------------------------------------- 50 32.00 10lb -393 -372 -347 -319 -285 -245 -196 -134 -55 50 198 -591 -570 -545 -517 -483 -443 -394 -332 -253 -147 0 60 38.40 10lb -334 -308 -279 -245 -205 -156 -97 -23 71 198 375 -532 -506 -477 -443 -403 -354 -295 -221 -126 0 177 70 44.80 10lb -274 -245 -211 -171 -124 -68 0 87 198 345 552 -473 -443 -409 -369 -322 -266 -197 -110 0 147 354 80 51.20 10lb -215 -182 -143 -97 -43 20 99 198 324 493 730 -413 -380 -341 -295 -241 -177 -98 0 126 295 532 90 57.60 10lb -156 -118 -74 -23 36 109 198 308 451 641 907 -354 -316 -272 -221 -161 -88 0 110 253 443 709 100 64.00 10lb -97 -55 -6 50 117 198 296 419 578 789 1085 -295 -253 -204 -147 -80 0 98 221 380 591 886 110 70.40 10lb -38 7 61 124 198 286 395 530 704 937 1262 -236 -190 -136 -73 0 88 197 332 506 739 1064 120 76.80 10lb 20 71 129 198 278 375 493 641 831 1085 1439 -177 -126 -68 0 80 177 295 443 633 886 1241 130 83.20 10lb 79 134 198 271 359 464 592 752 958 1232 1617 -118 -63 0 73 161 266 394 554 760 1034 1419 140 89.60 10lb 138 198 266 345 439 552 690 863 1085 1380 1794 -59 0 68 147 241 354 492 665 886 1182 1596 150 96.00 10lb 198 261 334 419 520 641 789 974 1211 1528 1971 0 63 136 221 322 443 591 776 1013 1330 1773 ________________________________________________________________________________________________________________________ The top number in each cell is Returns Above Direct Expenses. The bottom number in each cell is Returns Above Total Specified Expenses. Only the product listed has been varied to calculate net returns. Note: Cost of production estimates are based on 2010 input prices.

61 Table 14.A Estimated resource use and costs for field operations, per acre Squash, summer, fresh market, irrigated 5 ft row spacing, 20 gpm with 8,712 ft of drip tape, Mississippi, 2011 _______________________________________________________________________________________________________________________________________________ POWER UNIT COST EQUIPMENT COST ALLOC LABOR OPERATING/DURABLE INPUT OPERATION/ SIZE/ POWER UNIT PERF TIMES -------------- -------------- ------------- ----------------------- TOTAL OPERATING INPUT UNIT SIZE RATE OVER MTH DIRECT FIXED DIRECT FIXED HOURS COST AMOUNT PRICE COST COST _______________________________________________________________________________________________________________________________________________ ------------dollars----------- dollars ---------dollars--------- Lime (Spread) ton 0.33 Feb 0.4950 46.00 22.77 22.77 Chisel Plow 7 ' 2WD 75 hp 0.220 1.00 Feb 2.25 1.38 0.28 0.50 0.22 2.50 6.91 Disk Harrow 10' 2WD 75 hp 0.198 2.00 Mar 4.06 2.48 0.87 1.90 0.39 4.50 13.81 Disk Bed +App Fert 4-Row 2WD 75 hp 0.140 1.00 Mar 1.44 0.88 0.35 0.95 0.21 2.24 5.86 Fert 13-13-13 cwt 9.0000 15.43 138.87 138.87 BS, Lay/Tape/Squash Bed 5'cntr 2WD 75 hp 1.294 1.00 Mar 13.24 8.08 2.40 7.11 1.29 14.69 45.52 Plastic Mulch roll 2.2000 162.00 356.40 356.40 Drip Tape roll 1.5000 147.50 221.25 221.25 Plntr/H20/pnch/seed 1-Row 2WD 75 hp 2.578 1.00 Apr 26.38 16.10 4.31 7.30 5.15 52.72 106.81 Squash - Hybrid lb 2.0000 129.00 258.00 258.00 Irrigation 1.00 Apr Rural Water ac-in 6.0000 75.01 450.06 450.06 Fertigate CAN03/KN03 1.00 Apr FERTIGATION LABOR hour 1.00 9.10 9.10 Calcium Nitrate lb 25.0000 0.35 8.75 8.75 Sprayer Air Blast 16' 100 ga 2WD 75 hp 0.245 1.00 Apr 2.52 1.53 9.34 16.87 0.24 2.79 33.05 Brigade 2EC oz 6.0000 0.94 5.64 5.64 Fertigate CAN03/KN03 2.00 Apr FERTIGATION LABOR hour 2.00 18.20 18.20 Calcium Nitrate lb 50.0000 0.35 17.50 17.50 Sprayer Air Blast 16' 100 ga 2WD 75 hp 0.245 1.00 Apr 2.52 1.53 9.34 16.87 0.24 2.79 33.05 Quadris oz 11.0000 2.52 27.72 27.72 Fertigate CAN03/KN03 1.00 Apr FERTIGATION LABOR hour 1.00 9.10 9.10 Calcium Nitrate lb 25.0000 0.35 8.75 8.75 Sprayer Air Blast 16' 100 ga 2WD 75 hp 0.245 2.00 Apr 5.02 3.07 18.68 33.74 0.49 5.57 66.08 Brigade 2EC oz 12.0000 0.94 11.28 11.28 Bravo Weather Stick pt 3.0000 5.69 17.07 17.07 Fertigate CAN03/KN03 4.00 May FERTIGATION LABOR hour 4.00 36.40 36.40 Calcium Nitrate lb 100.0000 0.35 35.00 35.00 Trailer - Vegetables 16' 2WD 75 hp 0.090 10.00 Jun 9.20 5.62 0.48 0.84 1.80 18.40 34.54 HARVEST LABOR hour 1.00 Jun 100.00 910.00 910.00 5-Gal Bucket each 200.0000 3.88 776.00 776.00 Bushel Box each 250.0000 1.44 360.00 360.00 GRADE & PACK LABOR hour 10.00 Jun 110.00 1001.00 1001.00 Mulch Lifter 1-Row 2WD 75 hp 0.589 1.00 Jun 6.03 3.68 0.13 2.44 0.58 6.69 18.97 LABOR MULCH CLEANUP hour 15.00 136.50 136.50 Irrigation Setup acre Apr 1.0000 374.76 ------- ------- ------- ------- ------ ------- ------- -------- TOTALS 72.66 44.35 46.18 88.52 243.65 2233.19 2715.06 5574.72 INTEREST ON OPERATING CAPITAL 34.39 UNALLOCATED LABOR 16.12 TOTAL SPECIFIED COST 5625.23 _______________________________________________________________________________________________________________________________________________ Note: Cost of production estimates are based on 2010 input prices. Fertilization decisions should be based on soil tests. Irrigation implies 6 acre inches applied as needed over the production period for both fertigation and water needs.

62
Table 14.B Estimated costs per acre Squash, summer, fresh market, irrigated 5 ft row spacing, 20 gpm with 8,712 ft of drip tape, Mississippi, 2011 _______________________________________________________________________ ITEM UNIT PRICE QUANTITY AMOUNT YOUR FARM _______________________________________________________________________ dollars dollars DIRECT EXPENSES FERTILIZER Lime (Spread) ton 46.00 0.4950 22.77 _________ Fert 13-13-13 cwt 15.43 9.0000 138.87 _________ Calcium Nitrate lb 0.35 200.0000 70.00 _________ FUNGICIDE Quadris oz 2.52 11.0000 27.72 _________ Bravo Weather Stick pt 5.69 3.0000 17.07 _________ INSECTICIDE Brigade 2EC oz 0.94 18.0000 16.92 _________ SEED/PLANTS Squash - Hybrid lb 129.00 2.0000 258.00 _________ OTHER Plastic Mulch roll 162.00 2.2000 356.40 _________ 5-Gal Bucket each 3.88 200.0000 776.00 _________ Bushel Box each 1.44 250.0000 360.00 _________ IRRIGATION SUPPLIES Drip Tape roll 147.50 1.5000 221.25 _________ Rural Water ac-in 75.01 6.0000 450.06 _________ OPERATOR LABOR Tractors hour 11.35 7.1016 80.60 _________ HARVEST LABOR Special Labor hour 9.10 100.0000 910.00 _________ GRADE & PACK LABOR Special Labor hour 9.10 110.0000 1001.00 _________ HAND LABOR Implements hour 9.10 3.5486 32.29 _________ FERTIGATION LABOR Special Labor hour 9.10 8.0000 72.80 _________ LABOR MULCH CLEANUP Special Labor hour 9.10 15.0000 136.50 _________ UNALLOCATED LABOR hour 11.34 1.4203 16.12 _________ DIESEL FUEL Tractors gal 2.39 27.4151 65.53 _________ REPAIR & MAINTENANCE Implements acre 46.18 1.0000 46.18 _________ Tractors acre 7.13 1.0000 7.13 _________ INTEREST ON OP. CAP. acre 34.39 1.0000 34.39 _________ --------- TOTAL DIRECT EXPENSES 5117.60 _________ FIXED EXPENSES Implements acre 88.52 1.0000 88.52 _________ Tractors acre 44.35 1.0000 44.35 _________ Irrigation Setup acre 374.76 1.0000 374.76 _________ --------- TOTAL FIXED EXPENSES 507.63 _________ --------- TOTAL SPECIFIED EXPENSES 5625.23 _________ _______________________________________________________________________ Note: Cost of production estimates are based on 2010 input prices. Fertilization decisions should be based on soil tests. Irrigation implies 6 acre inches applied as needed over the production period for both fertigation and water needs.

63
Table 14.C Estimated monthly income and expense flows per acre Squash, summer, fresh market, irrigated 5 ft row spacing, 20 gpm with 8,712 ft of drip tape, Mississippi, 2011 __________________________________________________________________________________________________________________________________ ITEM Feb Mar Apr May Jun Jul Aug Sep Oct Nov Dec Jan __________________________________________________________________________________________________________________________________ --------------------------------------------------dollars-------------------------------------------------- TOTAL INCOME 0.00 0.00 0.00 0.00 0.00 0.00 0.00 0.00 0.00 0.00 0.00 0.00 DIRECT EXPENSES FERTILIZER 22.77 138.87 35.00 35.00 0.00 0.00 0.00 0.00 0.00 0.00 0.00 0.00 FUNGICIDE 0.00 0.00 44.79 0.00 0.00 0.00 0.00 0.00 0.00 0.00 0.00 0.00 INSECTICIDE 0.00 0.00 16.92 0.00 0.00 0.00 0.00 0.00 0.00 0.00 0.00 0.00 SEED/PLANTS 0.00 0.00 258.00 0.00 0.00 0.00 0.00 0.00 0.00 0.00 0.00 0.00 OTHER 0.00 356.40 0.00 0.00 1136.00 0.00 0.00 0.00 0.00 0.00 0.00 0.00 IRRIGATION SUPPLIES 0.00 221.25 450.06 0.00 0.00 0.00 0.00 0.00 0.00 0.00 0.00 0.00 LABOR 3.00 25.59 108.35 36.40 2075.97 0.00 0.00 0.00 0.00 0.00 0.00 0.00 LEASE * 0.00 0.00 0.00 0.00 0.00 0.00 0.00 0.00 0.00 0.00 0.00 0.00 FUEL 2.03 16.90 32.86 0.00 13.74 0.00 0.00 0.00 0.00 0.00 0.00 0.00 REPAIR & MAINTENANCE 0.50 5.46 45.25 0.00 2.10 0.00 0.00 0.00 0.00 0.00 0.00 0.00 INTEREST ON OP. CAP. 0.51 11.02 10.71 0.51 11.64 0.00 0.00 0.00 0.00 0.00 0.00 0.00 -------- -------- -------- -------- -------- -------- -------- -------- -------- -------- -------- -------- TOTAL DIRECT EXPENSES 28.81 775.49 1001.94 71.91 3239.45 0.00 0.00 0.00 0.00 0.00 0.00 0.00 NET INCOME -28.81 -775.49 -1001.94 -71.91 -3239.45 0.00 0.00 0.00 0.00 0.00 0.00 0.00 NET INCOME TO DATE -28.81 -804.30 -1806.24 -1878.15 -5117.60 -5117.60 -5117.60 -5117.60 -5117.60 -5117.60 -5117.60 -5117.60 __________________________________________________________________________________________________________________________________ Note: Cost of production estimates are based on 2010 input prices. Fertilization decisions should be based on soil tests. Irrigation implies 6 acre inches applied as needed over the production period for both fertigation and water needs. * Lease costs are based on hourly usage costs.

64
Table 14.D Breakeven price above total expenses and net returns for price/yield combinations, per acre Squash, summer, fresh market, irrigated 5 ft row spacing, 20 gpm with 8,712 ft of drip tape, Mississippi, 2011 ________________________________________________________________________________________________________________________ -------------------------------------------BREAKEVEN PRICE---------------------------------------- Squash 15.48 16.48 17.64 18.99 20.58 22.50 24.84 27.76 31.52 36.53 43.55 ________________________________________________________________________________________________________________________ PERCENT YIELD UNIT ---------------------------------------------dollars---------------------------------------------- 50 125.00 42lb -3001 -2876 -2731 -2562 -2363 -2124 -1831 -1466 -996 -369 507 -3509 -3383 -3239 -3070 -2871 -2631 -2339 -1973 -1503 -877 0 60 150.00 42lb -2650 -2500 -2326 -2124 -1885 -1597 -1247 -808 -244 507 1560 -3158 -3007 -2834 -2631 -2392 -2105 -1754 -1315 -751 0 1052 70 175.00 42lb -2299 -2124 -1921 -1685 -1406 -1071 -662 -150 507 1384 2613 -2807 -2631 -2429 -2193 -1914 -1579 -1169 -657 0 877 2105 80 200.00 42lb -1948 -1748 -1516 -1247 -927 -545 -77 507 1259 2262 3665 -2456 -2255 -2024 -1754 -1435 -1052 -584 0 751 1754 3158 90 225.00 42lb -1597 -1372 -1112 -808 -449 -18 507 1165 2011 3139 4718 -2105 -1879 -1619 -1315 -957 -526 0 657 1503 2631 4211 100 250.00 42lb -1247 -996 -707 -369 29 507 1092 1823 2763 4016 5771 -1754 -1503 -1214 -877 -478 0 584 1315 2255 3509 5263 110 275.00 42lb -896 -620 -302 68 507 1034 1677 2481 3515 4894 6824 -1403 -1127 -809 -438 0 526 1169 1973 3007 4386 6316 120 300.00 42lb -545 -244 102 507 986 1560 2262 3139 4267 5771 7877 -1052 -751 -404 0 478 1052 1754 2631 3759 5263 7369 130 325.00 42lb -194 131 507 946 1464 2086 2847 3797 5019 6648 8929 -701 -375 0 438 957 1579 2339 3289 4511 6141 8422 140 350.00 42lb 156 507 912 1384 1943 2613 3432 4455 5771 7526 9982 -350 0 404 877 1435 2105 2924 3947 5263 7018 9475 150 375.00 42lb 507 883 1317 1823 2421 3139 4016 5113 6523 8403 11035 0 375 809 1315 1914 2631 3509 4605 6015 7895 10527 ________________________________________________________________________________________________________________________ The top number in each cell is Returns Above Direct Expenses. The bottom number in each cell is Returns Above Total Specified Expenses. Only the product listed has been varied to calculate net returns. Note: Cost of production estimates are based on 2010 input prices.
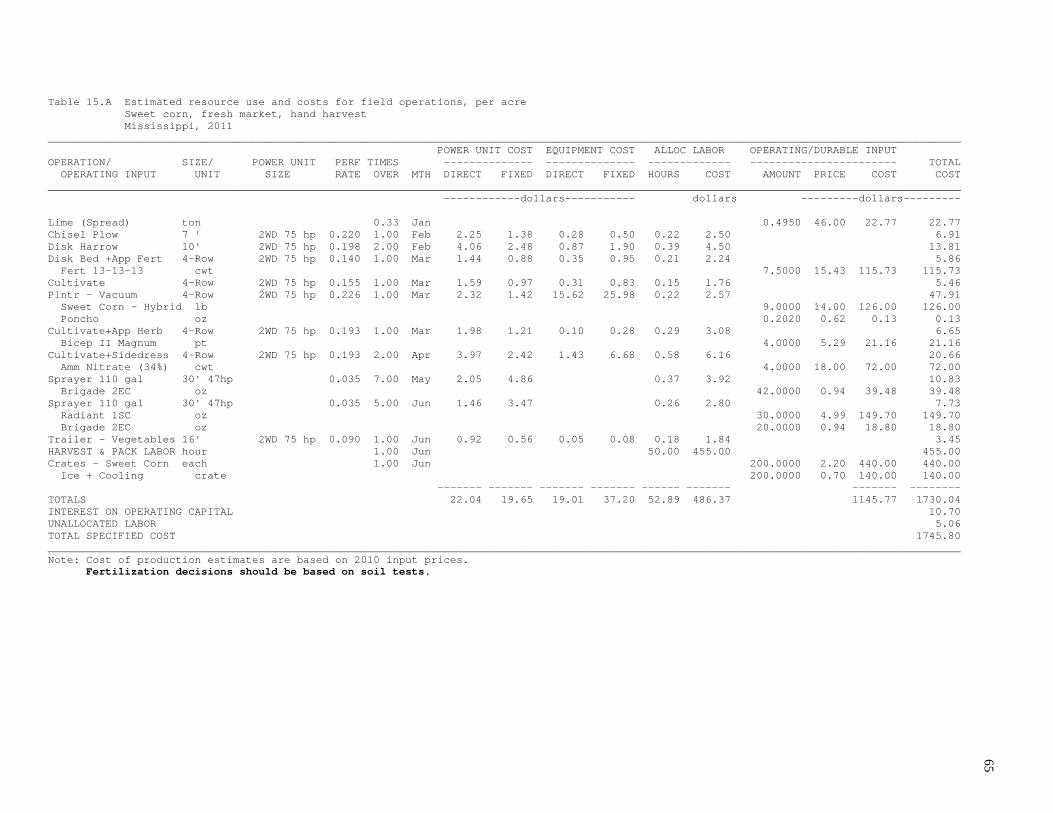
65
Table 15.A Estimated resource use and costs for field operations, per acre Sweet corn, fresh market, hand harvest Mississippi, 2011 _______________________________________________________________________________________________________________________________________________ POWER UNIT COST EQUIPMENT COST ALLOC LABOR OPERATING/DURABLE INPUT OPERATION/ SIZE/ POWER UNIT PERF TIMES -------------- -------------- ------------- ----------------------- TOTAL OPERATING INPUT UNIT SIZE RATE OVER MTH DIRECT FIXED DIRECT FIXED HOURS COST AMOUNT PRICE COST COST _______________________________________________________________________________________________________________________________________________ ------------dollars----------- dollars ---------dollars--------- Lime (Spread) ton 0.33 Jan 0.4950 46.00 22.77 22.77 Chisel Plow 7 ' 2WD 75 hp 0.220 1.00 Feb 2.25 1.38 0.28 0.50 0.22 2.50 6.91 Disk Harrow 10' 2WD 75 hp 0.198 2.00 Feb 4.06 2.48 0.87 1.90 0.39 4.50 13.81 Disk Bed +App Fert 4-Row 2WD 75 hp 0.140 1.00 Mar 1.44 0.88 0.35 0.95 0.21 2.24 5.86 Fert 13-13-13 cwt 7.5000 15.43 115.73 115.73 Cultivate 4-Row 2WD 75 hp 0.155 1.00 Mar 1.59 0.97 0.31 0.83 0.15 1.76 5.46 Plntr - Vacuum 4-Row 2WD 75 hp 0.226 1.00 Mar 2.32 1.42 15.62 25.98 0.22 2.57 47.91 Sweet Corn - Hybrid lb 9.0000 14.00 126.00 126.00 Poncho oz 0.2020 0.62 0.13 0.13 Cultivate+App Herb 4-Row 2WD 75 hp 0.193 1.00 Mar 1.98 1.21 0.10 0.28 0.29 3.08 6.65 Bicep II Magnum pt 4.0000 5.29 21.16 21.16 Cultivate+Sidedress 4-Row 2WD 75 hp 0.193 2.00 Apr 3.97 2.42 1.43 6.68 0.58 6.16 20.66 Amm Nitrate (34%) cwt 4.0000 18.00 72.00 72.00 Sprayer 110 gal 30' 47hp 0.035 7.00 May 2.05 4.86 0.37 3.92 10.83 Brigade 2EC oz 42.0000 0.94 39.48 39.48 Sprayer 110 gal 30' 47hp 0.035 5.00 Jun 1.46 3.47 0.26 2.80 7.73 Radiant 1SC oz 30.0000 4.99 149.70 149.70 Brigade 2EC oz 20.0000 0.94 18.80 18.80 Trailer - Vegetables 16' 2WD 75 hp 0.090 1.00 Jun 0.92 0.56 0.05 0.08 0.18 1.84 3.45 HARVEST & PACK LABOR hour 1.00 Jun 50.00 455.00 455.00 Crates - Sweet Corn each 1.00 Jun 200.0000 2.20 440.00 440.00 Ice + Cooling crate 200.0000 0.70 140.00 140.00 ------- ------- ------- ------- ------ ------- ------- -------- TOTALS 22.04 19.65 19.01 37.20 52.89 486.37 1145.77 1730.04 INTEREST ON OPERATING CAPITAL 10.70 UNALLOCATED LABOR 5.06 TOTAL SPECIFIED COST 1745.80 _______________________________________________________________________________________________________________________________________________ Note: Cost of production estimates are based on 2010 input prices. Fertilization decisions should be based on soil tests.
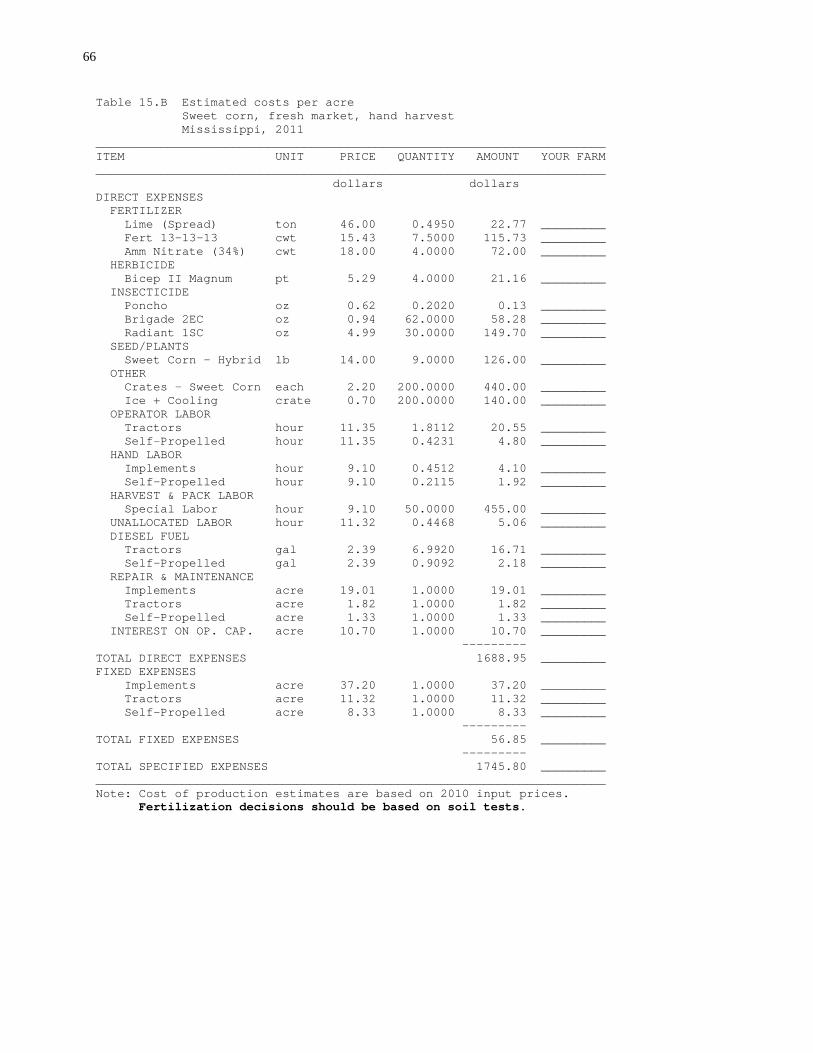
66
Table 15.B Estimated costs per acre Sweet corn, fresh market, hand harvest Mississippi, 2011 _______________________________________________________________________ ITEM UNIT PRICE QUANTITY AMOUNT YOUR FARM _______________________________________________________________________ dollars dollars DIRECT EXPENSES FERTILIZER Lime (Spread) ton 46.00 0.4950 22.77 _________ Fert 13-13-13 cwt 15.43 7.5000 115.73 _________ Amm Nitrate (34%) cwt 18.00 4.0000 72.00 _________ HERBICIDE Bicep II Magnum pt 5.29 4.0000 21.16 _________ INSECTICIDE Poncho oz 0.62 0.2020 0.13 _________ Brigade 2EC oz 0.94 62.0000 58.28 _________ Radiant 1SC oz 4.99 30.0000 149.70 _________ SEED/PLANTS Sweet Corn - Hybrid lb 14.00 9.0000 126.00 _________ OTHER Crates - Sweet Corn each 2.20 200.0000 440.00 _________ Ice + Cooling crate 0.70 200.0000 140.00 _________ OPERATOR LABOR Tractors hour 11.35 1.8112 20.55 _________ Self-Propelled hour 11.35 0.4231 4.80 _________ HAND LABOR Implements hour 9.10 0.4512 4.10 _________ Self-Propelled hour 9.10 0.2115 1.92 _________ HARVEST & PACK LABOR Special Labor hour 9.10 50.0000 455.00 _________ UNALLOCATED LABOR hour 11.32 0.4468 5.06 _________ DIESEL FUEL Tractors gal 2.39 6.9920 16.71 _________ Self-Propelled gal 2.39 0.9092 2.18 _________ REPAIR & MAINTENANCE Implements acre 19.01 1.0000 19.01 _________ Tractors acre 1.82 1.0000 1.82 _________ Self-Propelled acre 1.33 1.0000 1.33 _________ INTEREST ON OP. CAP. acre 10.70 1.0000 10.70 _________ --------- TOTAL DIRECT EXPENSES 1688.95 _________ FIXED EXPENSES Implements acre 37.20 1.0000 37.20 _________ Tractors acre 11.32 1.0000 11.32 _________ Self-Propelled acre 8.33 1.0000 8.33 _________ --------- TOTAL FIXED EXPENSES 56.85 _________ --------- TOTAL SPECIFIED EXPENSES 1745.80 _________ _______________________________________________________________________ Note: Cost of production estimates are based on 2010 input prices. Fertilization decisions should be based on soil tests.

67
Table 15.C Estimated monthly income and expense flows per acre Sweet corn, fresh market, hand harvest Mississippi, 2011 __________________________________________________________________________________________________________________________________ ITEM Jan Feb Mar Apr May Jun Jul Aug Sep Oct Nov Dec __________________________________________________________________________________________________________________________________ --------------------------------------------------dollars-------------------------------------------------- TOTAL INCOME 0.00 0.00 0.00 0.00 0.00 0.00 0.00 0.00 0.00 0.00 0.00 0.00 DIRECT EXPENSES FERTILIZER 22.77 0.00 115.73 72.00 0.00 0.00 0.00 0.00 0.00 0.00 0.00 0.00 HERBICIDE 0.00 0.00 21.16 0.00 0.00 0.00 0.00 0.00 0.00 0.00 0.00 0.00 INSECTICIDE 0.00 0.00 0.13 0.00 39.48 168.50 0.00 0.00 0.00 0.00 0.00 0.00 SEED/PLANTS 0.00 0.00 126.00 0.00 0.00 0.00 0.00 0.00 0.00 0.00 0.00 0.00 OTHER 0.00 0.00 0.00 0.00 0.00 580.00 0.00 0.00 0.00 0.00 0.00 0.00 LABOR 0.00 8.40 11.27 7.04 4.48 460.24 0.00 0.00 0.00 0.00 0.00 0.00 LEASE * 0.00 0.00 0.00 0.00 0.00 0.00 0.00 0.00 0.00 0.00 0.00 0.00 FUEL 0.00 5.69 6.61 3.58 1.27 1.74 0.00 0.00 0.00 0.00 0.00 0.00 REPAIR & MAINTENANCE 0.00 1.77 17.10 1.82 0.78 0.69 0.00 0.00 0.00 0.00 0.00 0.00 INTEREST ON OP. CAP. 0.49 0.29 4.30 0.91 0.33 4.38 0.00 0.00 0.00 0.00 0.00 0.00 -------- -------- -------- -------- -------- -------- -------- -------- -------- -------- -------- -------- TOTAL DIRECT EXPENSES 23.26 16.15 302.30 85.35 46.34 1215.55 0.00 0.00 0.00 0.00 0.00 0.00 NET INCOME -23.26 -16.15 -302.30 -85.35 -46.34 -1215.55 0.00 0.00 0.00 0.00 0.00 0.00 NET INCOME TO DATE -23.26 -39.41 -341.71 -427.06 -473.40 -1688.95 -1688.95 -1688.95 -1688.95 -1688.95 -1688.95 -1688.95 __________________________________________________________________________________________________________________________________ Note: Cost of production estimates are based on 2010 input prices. Fertilization decisions should be based on soil tests. * Lease costs are based on hourly usage costs.

68
Table 15.D Breakeven price above total expenses and net returns for price/yield combinations, per acre Sweet corn, fresh market, hand harvest Mississippi, 2011 ________________________________________________________________________________________________________________________ -------------------------------------------BREAKEVEN PRICE---------------------------------------- Sweet Corn 6.78 7.06 7.38 7.75 8.20 8.72 9.37 10.18 11.22 12.60 14.54 ________________________________________________________________________________________________________________________ PERCENT YIELD UNIT ---------------------------------------------dollars---------------------------------------------- 50 100.00 5doz -718 -691 -659 -621 -577 -525 -460 -379 -275 -137 56 -775 -748 -716 -678 -634 -581 -517 -436 -332 -193 0 60 120.00 5doz -641 -608 -569 -525 -472 -408 -331 -234 -109 56 289 -698 -664 -626 -581 -528 -465 -387 -290 -166 0 232 70 140.00 5doz -563 -525 -480 -428 -366 -292 -201 -88 56 250 522 -620 -581 -537 -484 -423 -349 -258 -145 0 193 465 80 160.00 5doz -486 -441 -390 -331 -260 -175 -72 56 223 444 755 -543 -498 -447 -387 -317 -232 -129 0 166 387 698 90 180.00 5doz -408 -358 -301 -234 -154 -59 56 202 389 638 987 -465 -415 -358 -290 -211 -116 0 145 332 581 930 100 200.00 5doz -331 -275 -211 -137 -48 56 186 347 555 832 1220 -387 -332 -268 -193 -105 0 129 290 498 775 1163 110 220.00 5doz -253 -192 -122 -40 56 173 315 493 721 1026 1453 -310 -249 -179 -96 0 116 258 436 664 969 1396 120 240.00 5doz -175 -109 -32 56 162 289 444 638 888 1220 1686 -232 -166 -89 0 105 232 387 581 831 1163 1629 130 260.00 5doz -98 -26 56 153 268 405 574 784 1054 1414 1918 -155 -83 0 96 211 349 517 727 997 1357 1861 140 280.00 5doz -20 56 146 250 374 522 703 929 1220 1608 2151 -77 0 89 193 317 465 646 872 1163 1551 2094 150 300.00 5doz 56 139 235 347 480 638 832 1075 1386 1802 2384 0 83 179 290 423 581 775 1018 1329 1745 2327 ________________________________________________________________________________________________________________________ The top number in each cell is Returns Above Direct Expenses. The bottom number in each cell is Returns Above Total Specified Expenses. Only the product listed has been varied to calculate net returns. Note: Cost of production estimates are based on 2010 input prices.

69
Table 16.A Estimated resource use and costs for field operations, per acre Sweet corn, fresh market, train harvest (shipping) Mississippi, 2011 _______________________________________________________________________________________________________________________________________________ POWER UNIT COST EQUIPMENT COST ALLOC LABOR OPERATING/DURABLE INPUT OPERATION/ SIZE/ POWER UNIT PERF TIMES -------------- -------------- ------------- ----------------------- TOTAL OPERATING INPUT UNIT SIZE RATE OVER MTH DIRECT FIXED DIRECT FIXED HOURS COST AMOUNT PRICE COST COST _______________________________________________________________________________________________________________________________________________ ------------dollars----------- dollars ---------dollars--------- Lime (Spread) ton 0.33 Jan 0.4950 46.00 22.77 22.77 Chisel Plow 7 ' 2WD 75 hp 0.220 1.00 Feb 2.25 1.38 0.28 0.50 0.22 2.50 6.91 Disk Harrow 10' 2WD 75 hp 0.198 2.00 Feb 4.06 2.48 0.87 1.90 0.39 4.50 13.81 Disk Bed +App Fert 4-Row 2WD 75 hp 0.140 1.00 Mar 1.44 0.88 0.35 0.95 0.21 2.24 5.86 Fert 13-13-13 cwt 7.5000 15.43 115.73 115.73 Cultivate 4-Row 2WD 75 hp 0.155 1.00 Mar 1.59 0.97 0.31 0.83 0.15 1.76 5.46 Plntr - Vacuum+Ins 4R 30-40 2WD 75 hp 0.226 1.00 Mar 2.32 1.42 16.98 28.24 0.22 2.57 51.53 Sweet Corn - Hybrid lb 9.0000 14.00 126.00 126.00 Poncho oz 0.2020 0.62 0.13 0.13 Cultivate+App Herb 4-Row 2WD 75 hp 0.193 1.00 Mar 1.98 1.21 0.10 0.28 0.29 3.08 6.65 Bicep II Magnum pt 4.0000 5.29 21.16 21.16 Cultivate+Sidedress 2-Row 2WD 75 hp 0.390 2.00 Apr 7.99 4.88 0.91 4.24 1.17 12.42 30.44 Amm Nitrate (34%) cwt 4.0000 18.00 72.00 72.00 Sprayer 110 gal 30' 47hp 0.035 7.00 May 2.05 4.86 0.37 3.92 10.83 Brigade 2EC oz 42.0000 0.94 39.48 39.48 Sprayer 110 gal 30' 47hp 0.035 5.00 Jun 1.46 3.47 0.26 2.80 7.73 Radiant 1SC oz 30.0000 4.99 149.70 149.70 Brigade 2EC oz 20.0000 0.94 18.80 18.80 Mule Train (Corn) 30' 2WD 75 hp 0.229 1.00 Jun 2.34 1.43 13.35 89.08 7.56 69.33 175.53 Trailer(MuleTrn)Corn 16' 2WD 75 hp 0.229 1.00 Jun 2.34 1.43 2.06 3.59 0.68 6.77 16.19 Crates - Sweet Corn each 1.00 Jun 200.0000 2.20 440.00 440.00 Ice + Cooling crate 200.0000 0.70 140.00 140.00 ------- ------- ------- ------- ------ ------- ------- -------- TOTALS 29.82 24.41 35.21 129.61 11.55 111.89 1145.77 1476.71 INTEREST ON OPERATING CAPITAL 9.54 UNALLOCATED LABOR 6.79 TOTAL SPECIFIED COST 1493.04 _______________________________________________________________________________________________________________________________________________ Note: Cost of production estimates are based on 2010 input prices. Fertilization decisions should be based on soil tests.

70
Table 16.B Estimated costs per acre Sweet corn, fresh market, train harvest (shipping) Mississippi, 2011 _______________________________________________________________________ ITEM UNIT PRICE QUANTITY AMOUNT YOUR FARM _______________________________________________________________________ dollars dollars DIRECT EXPENSES FERTILIZER Lime (Spread) ton 46.00 0.4950 22.77 _________ Fert 13-13-13 cwt 15.43 7.5000 115.73 _________ Amm Nitrate (34%) cwt 18.00 4.0000 72.00 _________ HERBICIDE Bicep II Magnum pt 5.29 4.0000 21.16 _________ INSECTICIDE Poncho oz 0.62 0.2020 0.13 _________ Brigade 2EC oz 0.94 62.0000 58.28 _________ Radiant 1SC oz 4.99 30.0000 149.70 _________ SEED/PLANTS Sweet Corn - Hybrid lb 14.00 9.0000 126.00 _________ OTHER Crates - Sweet Corn each 2.20 200.0000 440.00 _________ Ice + Cooling crate 0.70 200.0000 140.00 _________ OPERATOR LABOR Tractors hour 11.35 2.5731 29.20 _________ Self-Propelled hour 11.35 0.4231 4.80 _________ HARVEST LABOR Implements hour 9.10 7.7917 70.90 _________ HAND LABOR Implements hour 9.10 0.5580 5.07 _________ Self-Propelled hour 9.10 0.2115 1.92 _________ UNALLOCATED LABOR hour 11.33 0.5992 6.79 _________ DIESEL FUEL Tractors gal 2.39 9.9333 23.73 _________ Self-Propelled gal 2.39 0.9092 2.18 _________ REPAIR & MAINTENANCE Implements acre 35.21 1.0000 35.21 _________ Tractors acre 2.58 1.0000 2.58 _________ Self-Propelled acre 1.33 1.0000 1.33 _________ INTEREST ON OP. CAP. acre 9.54 1.0000 9.54 _________ --------- TOTAL DIRECT EXPENSES 1339.02 _________ FIXED EXPENSES Implements acre 129.61 1.0000 129.61 _________ Tractors acre 16.08 1.0000 16.08 _________ Self-Propelled acre 8.33 1.0000 8.33 _________ --------- TOTAL FIXED EXPENSES 154.02 _________ --------- TOTAL SPECIFIED EXPENSES 1493.04 _________ _______________________________________________________________________ Note: Cost of production estimates are based on 2010 input prices. Fertilization decisions should be based on soil tests.

71
Table 16.C Estimated monthly income and expense flows per acre Sweet corn, fresh market, train harvest (shipping) Mississippi, 2011 __________________________________________________________________________________________________________________________________ ITEM Jan Feb Mar Apr May Jun Jul Aug Sep Oct Nov Dec __________________________________________________________________________________________________________________________________ --------------------------------------------------dollars-------------------------------------------------- TOTAL INCOME 0.00 0.00 0.00 0.00 0.00 0.00 0.00 0.00 0.00 0.00 0.00 0.00 DIRECT EXPENSES FERTILIZER 22.77 0.00 115.73 72.00 0.00 0.00 0.00 0.00 0.00 0.00 0.00 0.00 HERBICIDE 0.00 0.00 21.16 0.00 0.00 0.00 0.00 0.00 0.00 0.00 0.00 0.00 INSECTICIDE 0.00 0.00 0.13 0.00 39.48 168.50 0.00 0.00 0.00 0.00 0.00 0.00 SEED/PLANTS 0.00 0.00 126.00 0.00 0.00 0.00 0.00 0.00 0.00 0.00 0.00 0.00 OTHER 0.00 0.00 0.00 0.00 0.00 580.00 0.00 0.00 0.00 0.00 0.00 0.00 LABOR 0.00 8.40 11.27 14.19 4.48 80.34 0.00 0.00 0.00 0.00 0.00 0.00 LEASE * 0.00 0.00 0.00 0.00 0.00 0.00 0.00 0.00 0.00 0.00 0.00 0.00 FUEL 0.00 5.69 6.61 7.21 1.27 5.13 0.00 0.00 0.00 0.00 0.00 0.00 REPAIR & MAINTENANCE 0.00 1.77 18.46 1.69 0.78 16.42 0.00 0.00 0.00 0.00 0.00 0.00 INTEREST ON OP. CAP. 0.49 0.29 4.32 1.03 0.33 3.08 0.00 0.00 0.00 0.00 0.00 0.00 -------- -------- -------- -------- -------- -------- -------- -------- -------- -------- -------- -------- TOTAL DIRECT EXPENSES 23.26 16.15 303.68 96.12 46.34 853.47 0.00 0.00 0.00 0.00 0.00 0.00 NET INCOME -23.26 -16.15 -303.68 -96.12 -46.34 -853.47 0.00 0.00 0.00 0.00 0.00 0.00 NET INCOME TO DATE -23.26 -39.41 -343.09 -439.21 -485.55 -1339.02 -1339.02 -1339.02 -1339.02 -1339.02 -1339.02 -1339.02 __________________________________________________________________________________________________________________________________ Note: Cost of production estimates are based on 2010 input prices. Fertilization decisions should be based on soil tests. * Lease costs are based on hourly usage costs.

72
Table 16.D Breakeven price above total expenses and net returns for price/yield combinations, per acre Sweet corn, fresh market, train harvest (shipping) Mississippi, 2011 ________________________________________________________________________________________________________________________ -------------------------------------------BREAKEVEN PRICE---------------------------------------- Sweet Corn 5.94 6.16 6.41 6.70 7.05 7.46 7.97 8.60 9.41 10.50 12.01 ________________________________________________________________________________________________________________________ PERCENT YIELD UNIT ---------------------------------------------dollars---------------------------------------------- 50 100.00 5doz -453 -431 -406 -377 -342 -301 -250 -187 -106 2 154 -607 -585 -560 -531 -496 -455 -404 -341 -260 -151 0 60 120.00 5doz -392 -366 -336 -301 -260 -210 -149 -73 23 154 336 -546 -520 -490 -455 -414 -364 -303 -227 -130 0 182 70 140.00 5doz -331 -301 -266 -225 -177 -119 -48 40 154 305 518 -485 -455 -420 -379 -331 -273 -202 -113 0 151 364 80 160.00 5doz -271 -236 -196 -149 -94 -28 52 154 284 457 700 -425 -390 -350 -303 -248 -182 -101 0 130 303 546 90 180.00 5doz -210 -171 -126 -73 -11 62 154 267 414 609 882 -364 -325 -280 -227 -165 -91 0 113 260 455 728 100 200.00 5doz -149 -106 -56 2 71 154 255 381 544 761 1064 -303 -260 -210 -151 -82 0 101 227 390 607 910 110 220.00 5doz -88 -41 13 78 154 245 356 495 674 913 1247 -242 -195 -140 -75 0 91 202 341 520 759 1093 120 240.00 5doz -28 23 83 154 236 336 457 609 804 1064 1429 -182 -130 -70 0 82 182 303 455 650 910 1275 130 260.00 5doz 32 88 154 229 319 427 558 723 934 1216 1611 -121 -65 0 75 165 273 404 569 780 1062 1457 140 280.00 5doz 93 154 224 305 402 518 660 837 1064 1368 1793 -60 0 70 151 248 364 506 683 910 1214 1639 150 300.00 5doz 154 219 294 381 485 609 761 951 1195 1520 1975 0 65 140 227 331 455 607 797 1041 1366 1821 ________________________________________________________________________________________________________________________ The top number in each cell is Returns Above Direct Expenses. The bottom number in each cell is Returns Above Total Specified Expenses. Only the product listed has been varied to calculate net returns. Note: Cost of production estimates are based on 2010 input prices.
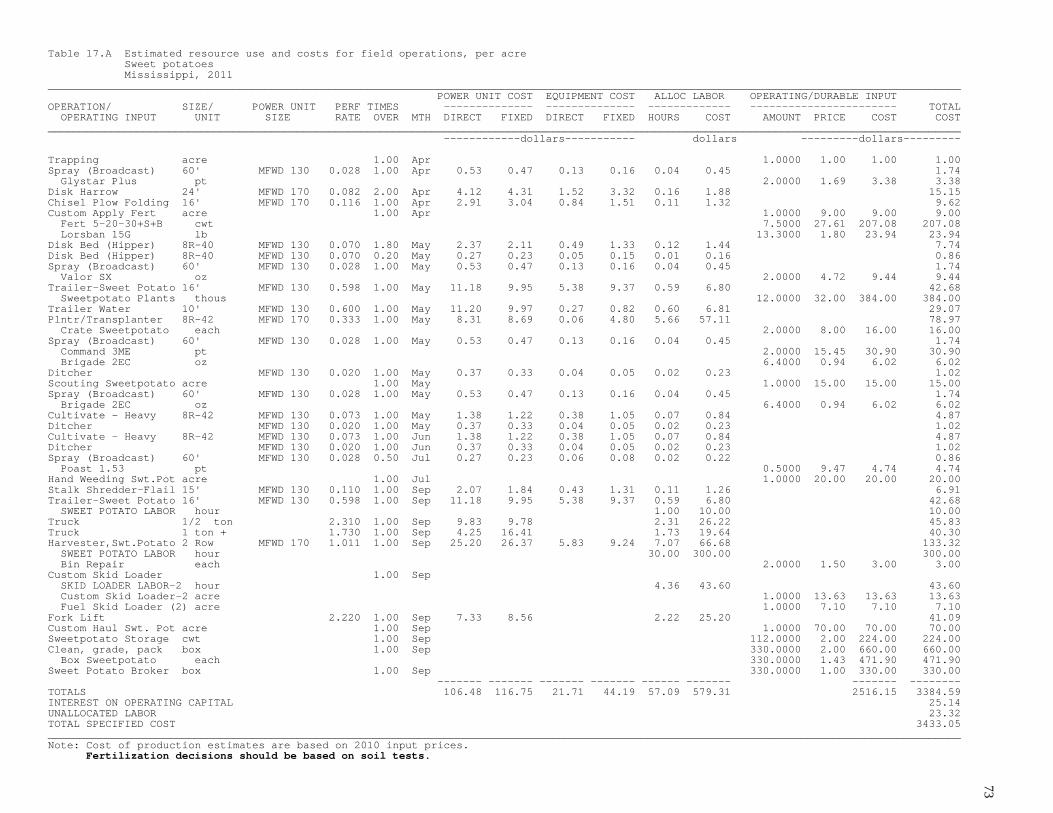
73 Table 17.A Estimated resource use and costs for field operations, per acre Sweet potatoes Mississippi, 2011 _______________________________________________________________________________________________________________________________________________ POWER UNIT COST EQUIPMENT COST ALLOC LABOR OPERATING/DURABLE INPUT OPERATION/ SIZE/ POWER UNIT PERF TIMES -------------- -------------- ------------- ----------------------- TOTAL OPERATING INPUT UNIT SIZE RATE OVER MTH DIRECT FIXED DIRECT FIXED HOURS COST AMOUNT PRICE COST COST _______________________________________________________________________________________________________________________________________________ ------------dollars----------- dollars ---------dollars--------- Trapping acre 1.00 Apr 1.0000 1.00 1.00 1.00 Spray (Broadcast) 60' MFWD 130 0.028 1.00 Apr 0.53 0.47 0.13 0.16 0.04 0.45 1.74 Glystar Plus pt 2.0000 1.69 3.38 3.38 Disk Harrow 24' MFWD 170 0.082 2.00 Apr 4.12 4.31 1.52 3.32 0.16 1.88 15.15 Chisel Plow Folding 16' MFWD 170 0.116 1.00 Apr 2.91 3.04 0.84 1.51 0.11 1.32 9.62 Custom Apply Fert acre 1.00 Apr 1.0000 9.00 9.00 9.00 Fert 5-20-30+S+B cwt 7.5000 27.61 207.08 207.08 Lorsban 15G lb 13.3000 1.80 23.94 23.94 Disk Bed (Hipper) 8R-40 MFWD 130 0.070 1.80 May 2.37 2.11 0.49 1.33 0.12 1.44 7.74 Disk Bed (Hipper) 8R-40 MFWD 130 0.070 0.20 May 0.27 0.23 0.05 0.15 0.01 0.16 0.86 Spray (Broadcast) 60' MFWD 130 0.028 1.00 May 0.53 0.47 0.13 0.16 0.04 0.45 1.74 Valor SX oz 2.0000 4.72 9.44 9.44 Trailer-Sweet Potato 16' MFWD 130 0.598 1.00 May 11.18 9.95 5.38 9.37 0.59 6.80 42.68 Sweetpotato Plants thous 12.0000 32.00 384.00 384.00 Trailer Water 10' MFWD 130 0.600 1.00 May 11.20 9.97 0.27 0.82 0.60 6.81 29.07 Plntr/Transplanter 8R-42 MFWD 170 0.333 1.00 May 8.31 8.69 0.06 4.80 5.66 57.11 78.97 Crate Sweetpotato each 2.0000 8.00 16.00 16.00 Spray (Broadcast) 60' MFWD 130 0.028 1.00 May 0.53 0.47 0.13 0.16 0.04 0.45 1.74 Command 3ME pt 2.0000 15.45 30.90 30.90 Brigade 2EC oz 6.4000 0.94 6.02 6.02 Ditcher MFWD 130 0.020 1.00 May 0.37 0.33 0.04 0.05 0.02 0.23 1.02 Scouting Sweetpotato acre 1.00 May 1.0000 15.00 15.00 15.00 Spray (Broadcast) 60' MFWD 130 0.028 1.00 May 0.53 0.47 0.13 0.16 0.04 0.45 1.74 Brigade 2EC oz 6.4000 0.94 6.02 6.02 Cultivate - Heavy 8R-42 MFWD 130 0.073 1.00 May 1.38 1.22 0.38 1.05 0.07 0.84 4.87 Ditcher MFWD 130 0.020 1.00 May 0.37 0.33 0.04 0.05 0.02 0.23 1.02 Cultivate - Heavy 8R-42 MFWD 130 0.073 1.00 Jun 1.38 1.22 0.38 1.05 0.07 0.84 4.87 Ditcher MFWD 130 0.020 1.00 Jun 0.37 0.33 0.04 0.05 0.02 0.23 1.02 Spray (Broadcast) 60' MFWD 130 0.028 0.50 Jul 0.27 0.23 0.06 0.08 0.02 0.22 0.86 Poast 1.53 pt 0.5000 9.47 4.74 4.74 Hand Weeding Swt.Pot acre 1.00 Jul 1.0000 20.00 20.00 20.00 Stalk Shredder-Flail 15' MFWD 130 0.110 1.00 Sep 2.07 1.84 0.43 1.31 0.11 1.26 6.91 Trailer-Sweet Potato 16' MFWD 130 0.598 1.00 Sep 11.18 9.95 5.38 9.37 0.59 6.80 42.68 SWEET POTATO LABOR hour 1.00 10.00 10.00 Truck 1/2 ton 2.310 1.00 Sep 9.83 9.78 2.31 26.22 45.83 Truck 1 ton + 1.730 1.00 Sep 4.25 16.41 1.73 19.64 40.30 Harvester,Swt.Potato 2 Row MFWD 170 1.011 1.00 Sep 25.20 26.37 5.83 9.24 7.07 66.68 133.32 SWEET POTATO LABOR hour 30.00 300.00 300.00 Bin Repair each 2.0000 1.50 3.00 3.00 Custom Skid Loader 1.00 Sep SKID LOADER LABOR-2 hour 4.36 43.60 43.60 Custom Skid Loader-2 acre 1.0000 13.63 13.63 13.63 Fuel Skid Loader (2) acre 1.0000 7.10 7.10 7.10 Fork Lift 2.220 1.00 Sep 7.33 8.56 2.22 25.20 41.09 Custom Haul Swt. Pot acre 1.00 Sep 1.0000 70.00 70.00 70.00 Sweetpotato Storage cwt 1.00 Sep 112.0000 2.00 224.00 224.00 Clean, grade, pack box 1.00 Sep 330.0000 2.00 660.00 660.00 Box Sweetpotato each 330.0000 1.43 471.90 471.90 Sweet Potato Broker box 1.00 Sep 330.0000 1.00 330.00 330.00 ------- ------- ------- ------- ------ ------- ------- -------- TOTALS 106.48 116.75 21.71 44.19 57.09 579.31 2516.15 3384.59 INTEREST ON OPERATING CAPITAL 25.14 UNALLOCATED LABOR 23.32 TOTAL SPECIFIED COST 3433.05 _______________________________________________________________________________________________________________________________________________ Note: Cost of production estimates are based on 2010 input prices. Fertilization decisions should be based on soil tests.
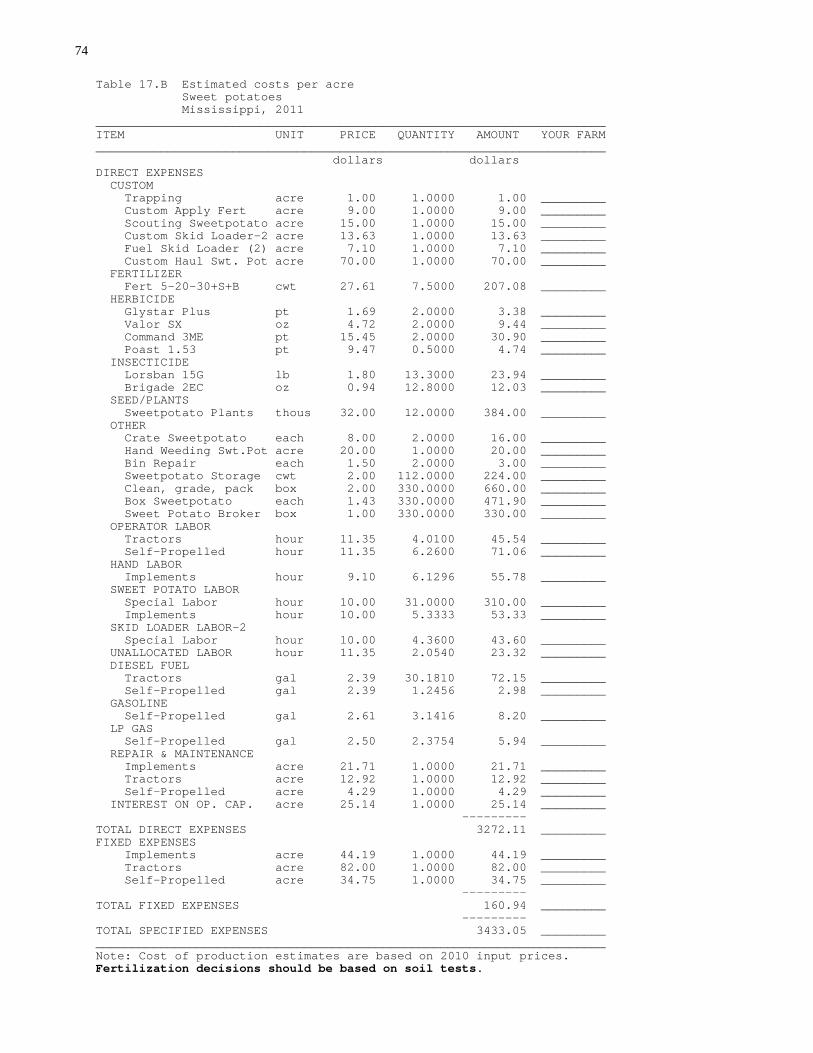
74
Table 17.B Estimated costs per acre Sweet potatoes Mississippi, 2011 _______________________________________________________________________ ITEM UNIT PRICE QUANTITY AMOUNT YOUR FARM _______________________________________________________________________ dollars dollars DIRECT EXPENSES CUSTOM Trapping acre 1.00 1.0000 1.00 _________ Custom Apply Fert acre 9.00 1.0000 9.00 _________ Scouting Sweetpotato acre 15.00 1.0000 15.00 _________ Custom Skid Loader-2 acre 13.63 1.0000 13.63 _________ Fuel Skid Loader (2) acre 7.10 1.0000 7.10 _________ Custom Haul Swt. Pot acre 70.00 1.0000 70.00 _________ FERTILIZER Fert 5-20-30+S+B cwt 27.61 7.5000 207.08 _________ HERBICIDE Glystar Plus pt 1.69 2.0000 3.38 _________ Valor SX oz 4.72 2.0000 9.44 _________ Command 3ME pt 15.45 2.0000 30.90 _________ Poast 1.53 pt 9.47 0.5000 4.74 _________ INSECTICIDE Lorsban 15G lb 1.80 13.3000 23.94 _________ Brigade 2EC oz 0.94 12.8000 12.03 _________ SEED/PLANTS Sweetpotato Plants thous 32.00 12.0000 384.00 _________ OTHER Crate Sweetpotato each 8.00 2.0000 16.00 _________ Hand Weeding Swt.Pot acre 20.00 1.0000 20.00 _________ Bin Repair each 1.50 2.0000 3.00 _________ Sweetpotato Storage cwt 2.00 112.0000 224.00 _________ Clean, grade, pack box 2.00 330.0000 660.00 _________ Box Sweetpotato each 1.43 330.0000 471.90 _________ Sweet Potato Broker box 1.00 330.0000 330.00 _________ OPERATOR LABOR Tractors hour 11.35 4.0100 45.54 _________ Self-Propelled hour 11.35 6.2600 71.06 _________ HAND LABOR Implements hour 9.10 6.1296 55.78 _________ SWEET POTATO LABOR Special Labor hour 10.00 31.0000 310.00 _________ Implements hour 10.00 5.3333 53.33 _________ SKID LOADER LABOR-2 Special Labor hour 10.00 4.3600 43.60 _________ UNALLOCATED LABOR hour 11.35 2.0540 23.32 _________ DIESEL FUEL Tractors gal 2.39 30.1810 72.15 _________ Self-Propelled gal 2.39 1.2456 2.98 _________ GASOLINE Self-Propelled gal 2.61 3.1416 8.20 _________ LP GAS Self-Propelled gal 2.50 2.3754 5.94 _________ REPAIR & MAINTENANCE Implements acre 21.71 1.0000 21.71 _________ Tractors acre 12.92 1.0000 12.92 _________ Self-Propelled acre 4.29 1.0000 4.29 _________ INTEREST ON OP. CAP. acre 25.14 1.0000 25.14 _________ --------- TOTAL DIRECT EXPENSES 3272.11 _________ FIXED EXPENSES Implements acre 44.19 1.0000 44.19 _________ Tractors acre 82.00 1.0000 82.00 _________ Self-Propelled acre 34.75 1.0000 34.75 _________ --------- TOTAL FIXED EXPENSES 160.94 _________ --------- TOTAL SPECIFIED EXPENSES 3433.05 _________ _______________________________________________________________________ Note: Cost of production estimates are based on 2010 input prices. Fertilization decisions should be based on soil tests.

75
Table 17.C Estimated monthly income and expense flows per acre Sweet potatoes Mississippi, 2011 __________________________________________________________________________________________________________________________________ ITEM Apr May Jun Jul Aug Sep Oct Nov Dec Jan Feb Mar __________________________________________________________________________________________________________________________________ --------------------------------------------------dollars-------------------------------------------------- TOTAL INCOME 0.00 0.00 0.00 0.00 0.00 0.00 0.00 0.00 0.00 0.00 0.00 0.00 DIRECT EXPENSES CUSTOM 10.00 15.00 0.00 0.00 0.00 90.73 0.00 0.00 0.00 0.00 0.00 0.00 FERTILIZER 207.08 0.00 0.00 0.00 0.00 0.00 0.00 0.00 0.00 0.00 0.00 0.00 HERBICIDE 3.38 40.34 0.00 4.74 0.00 0.00 0.00 0.00 0.00 0.00 0.00 0.00 INSECTICIDE 23.94 12.04 0.00 0.00 0.00 0.00 0.00 0.00 0.00 0.00 0.00 0.00 SEED/PLANTS 0.00 384.00 0.00 0.00 0.00 0.00 0.00 0.00 0.00 0.00 0.00 0.00 OTHER 0.00 16.00 0.00 20.00 0.00 1688.90 0.00 0.00 0.00 0.00 0.00 0.00 LABOR 4.35 79.22 1.29 0.25 0.00 517.52 0.00 0.00 0.00 0.00 0.00 0.00 LEASE * 0.00 0.00 0.00 0.00 0.00 0.00 0.00 0.00 0.00 0.00 0.00 0.00 FUEL 6.35 31.58 1.50 0.23 0.00 49.61 0.00 0.00 0.00 0.00 0.00 0.00 REPAIR & MAINTENANCE 3.70 12.56 0.67 0.10 0.00 21.89 0.00 0.00 0.00 0.00 0.00 0.00 INTEREST ON OP. CAP. 5.60 10.66 0.05 0.28 0.00 8.55 0.00 0.00 0.00 0.00 0.00 0.00 -------- -------- -------- -------- -------- -------- -------- -------- -------- -------- -------- -------- TOTAL DIRECT EXPENSES 264.40 601.40 3.51 25.60 0.00 2377.20 0.00 0.00 0.00 0.00 0.00 0.00 NET INCOME -264.40 -601.40 -3.51 -25.60 0.00 -2377.20 0.00 0.00 0.00 0.00 0.00 0.00 NET INCOME TO DATE -264.40 -865.80 -869.31 -894.91 -894.91 -3272.11 -3272.11 -3272.11 -3272.11 -3272.11 -3272.11 -3272.11 __________________________________________________________________________________________________________________________________ Note: Cost of production estimates are based on 2010 input prices. Fertilization decisions should be based on soil tests. * Lease costs are based on hourly usage costs.

76
Table 17.D Breakeven price above total expenses and net returns for price/yield combinations, per acre Sweet potatoes Mississippi, 2011 ________________________________________________________________________________________________________________________ -------------------------------------------BREAKEVEN PRICE---------------------------------------- Sweet Potatoes 8.41 8.84 9.34 9.92 10.61 11.44 12.45 13.71 15.33 17.49 20.52 ________________________________________________________________________________________________________________________ PERCENT YIELD UNIT ---------------------------------------------dollars---------------------------------------------- 50 150.00 40lb -1655 -1590 -1516 -1428 -1325 -1201 -1050 -860 -617 -293 160 -1816 -1751 -1676 -1589 -1486 -1362 -1211 -1021 -778 -454 0 60 180.00 40lb -1474 -1396 -1306 -1201 -1077 -929 -747 -520 -228 160 705 -1635 -1557 -1467 -1362 -1238 -1090 -908 -681 -389 0 545 70 210.00 40lb -1292 -1201 -1096 -974 -829 -656 -444 -179 160 615 1250 -1453 -1362 -1257 -1135 -990 -817 -605 -340 0 454 1090 80 240.00 40lb -1110 -1006 -887 -747 -582 -384 -141 160 550 1069 1795 -1271 -1167 -1048 -908 -743 -545 -302 0 389 908 1635 90 270.00 40lb -929 -812 -677 -520 -334 -111 160 501 939 1523 2340 -1090 -973 -838 -681 -495 -272 0 340 778 1362 2180 100 300.00 40lb -747 -617 -467 -293 -86 160 463 842 1328 1977 2885 -908 -778 -628 -454 -247 0 302 681 1167 1816 2725 110 330.00 40lb -565 -422 -258 -66 160 433 766 1182 1718 2431 3430 -726 -583 -419 -227 0 272 605 1021 1557 2270 3270 120 360.00 40lb -384 -228 -48 160 408 705 1069 1523 2107 2885 3975 -545 -389 -209 0 247 545 908 1362 1946 2725 3815 130 390.00 40lb -202 -33 160 388 656 978 1372 1864 2496 3340 4520 -363 -194 0 227 495 817 1211 1703 2335 3179 4360 140 420.00 40lb -20 160 370 615 904 1250 1674 2204 2885 3794 5065 -181 0 209 454 743 1090 1513 2043 2725 3633 4905 150 450.00 40lb 160 355 580 842 1151 1523 1977 2545 3275 4248 5611 0 194 419 681 990 1362 1816 2384 3114 4087 5450 ________________________________________________________________________________________________________________________ The top number in each cell is Returns Above Direct Expenses. The bottom number in each cell is Returns Above Total Specified Expenses. Only the product listed has been varied to calculate net returns. Note: Cost of production estimates are based on 2010 input prices.

77 Table 18.A Estimated resource use and costs for field operations, per acre Tomatoes, fresh market, irrigated 6 ft row spacing, 16 gpm with 7,260 ft of drip tape, Mississippi, 2011 _______________________________________________________________________________________________________________________________________________ POWER UNIT COST EQUIPMENT COST ALLOC LABOR OPERATING/DURABLE INPUT OPERATION/ SIZE/ POWER UNIT PERF TIMES -------------- -------------- ------------- ----------------------- TOTAL OPERATING INPUT UNIT SIZE RATE OVER MTH DIRECT FIXED DIRECT FIXED HOURS COST AMOUNT PRICE COST COST _______________________________________________________________________________________________________________________________________________ ------------dollars----------- dollars ---------dollars--------- Lime (Spread) ton 0.33 Feb 0.3300 46.00 15.18 15.18 Chisel Plow 7 ' 2WD 75 hp 0.220 1.00 Feb 2.25 1.38 0.28 0.50 0.22 2.50 6.91 Disk Harrow 10' 2WD 75 hp 0.198 2.00 Mar 4.06 2.48 0.87 1.90 0.39 4.50 13.81 Fert-Cyclone Spin 750 lb 2WD 75 hp 0.084 1.00 Mar 0.86 0.53 0.06 0.24 0.08 0.96 2.65 Amm Nitrate (34%) cwt 1.1700 18.00 21.06 21.06 Phosphorus(46% P205) cwt 2.6000 22.00 57.20 57.20 Potash (60% K20) cwt 2.0000 23.00 46.00 46.00 Disk + Incorporate 10' 2WD 75 hp 0.206 1.00 Mar 2.11 1.29 0.80 1.45 0.30 3.28 8.93 Diazinon AG600 pt 4.0000 5.92 23.68 23.68 Treflan HFP pt 0.7500 3.11 2.33 2.33 BS, L,T,FumigTomato Bed 6'cntr 2WD 75 hp 1.078 1.00 Mar 11.03 6.73 3.67 10.85 4.31 41.68 73.96 Plastic Mulch roll 1.8000 162.00 291.60 291.60 Drip Tape roll 1.2000 147.50 177.00 177.00 Mythl Bromide 67/33 lb 200.0000 5.90 1180.00 1180.00 Plntr/H20 Tomato 1R 6'cntr 2WD 75 hp 1.718 1.00 Apr 17.58 10.73 2.30 3.90 6.87 66.43 100.94 PLANTING LABOR hour 30.00 273.00 273.00 Tomato Plants-Hybrid thous 4.4000 112.00 492.80 492.80 Fert 15-30-15 lb 37.5000 0.23 8.63 8.63 Admire Pro oz 7.0000 5.57 38.99 38.99 Irrigation 1.00 Apr Rural Water ac-in 6.0000 75.01 450.06 450.06 Fertigate CAN03/KN03 1.00 Apr FERTIGATION LABOR hour 1.00 9.10 9.10 Calcium Nitrate lb 30.0000 0.35 10.50 10.50 Sprayer Air Blast 16' 100 ga 2WD 75 hp 0.245 1.00 Apr 2.52 1.53 9.34 16.87 0.24 2.79 33.05 Bravo Weather Stick pt 1.5000 5.69 8.54 8.54 Radiant 1SC oz 10.0000 4.99 49.90 49.90 Fertigate CAN03/KN03 1.00 Apr FERTIGATION LABOR hour 1.00 9.10 9.10 Calcium Nitrate lb 30.0000 0.35 10.50 10.50 Sprayer Air Blast 16' 100 ga 2WD 75 hp 0.245 1.00 Apr 2.52 1.53 9.34 16.87 0.24 2.79 33.05 Radiant 1SC oz 10.0000 4.99 49.90 49.90 Quadris oz 5.0000 2.52 12.60 12.60 Fertigate CAN03/KN03 2.00 Apr FERTIGATION LABOR hour 2.00 18.20 18.20 Calcium Nitrate lb 60.0000 0.35 21.00 21.00 Sprayer Air Blast 16' 100 ga 2WD 75 hp 0.245 1.00 May 2.52 1.53 9.34 16.87 0.24 2.79 33.05 Quadris oz 5.0000 2.52 12.60 12.60 Brigade 2EC oz 6.0000 0.94 5.64 5.64 Sprayer Air Blast 16' 100 ga 2WD 75 hp 0.245 1.00 May 2.52 1.53 9.34 16.87 0.24 2.79 33.05 Radiant 1SC oz 10.0000 4.99 49.90 49.90 Sprayer Air Blast 16' 100 ga 2WD 75 hp 0.245 1.00 May 2.52 1.53 9.34 16.87 0.24 2.79 33.05 Brigade 2EC oz 6.0000 0.94 5.64 5.64 Bravo Weather Stick pt 2.0000 5.69 11.38 11.38 Oberon 2SC oz 8.0000 4.49 35.92 35.92 Fertigate CAN03/KN03 1.00 May FERTIGATION LABOR hour 1.00 9.10 9.10 Calcium Nitrate lb 30.0000 0.35 10.50 10.50 (continued)

78 Table 18.A Estimated resource use and costs for field operations, per acre Tomatoes, fresh market, irrigated 6 ft row spacing, 16 gpm with 7,260 ft of drip tape, Mississippi, 2011 (continued) _______________________________________________________________________________________________________________________________________________ POWER UNIT COST EQUIPMENT COST ALLOC LABOR OPERATING/DURABLE INPUT OPERATION/ SIZE/ POWER UNIT PERF TIMES -------------- -------------- ------------- ----------------------- TOTAL OPERATING INPUT UNIT SIZE RATE OVER MTH DIRECT FIXED DIRECT FIXED HOURS COST AMOUNT PRICE COST COST _______________________________________________________________________________________________________________________________________________ ------------dollars----------- dollars ---------dollars--------- HAND & STOR LABOR hour 1.00 May 10.00 91.00 91.00 Wood Stakes 100 44.0000 0.52 22.88 22.88 Plastic string 6000' 4.0000 9.00 36.00 36.00 Fertigate CAN03/KN03 3.00 May FERTIGATION LABOR hour 3.00 27.30 27.30 Calcium Nitrate lb 90.0000 0.35 31.50 31.50 Sucker Control 1.00 Jun HAND LABOR hour 5.00 45.50 45.50 Fertigate CAN03/KN03 1.00 Jun FERTIGATION LABOR hour 1.00 9.10 9.10 Calcium Nitrate lb 30.0000 0.35 10.50 10.50 Sprayer Air Blast 16' 100 ga 2WD 75 hp 0.245 1.00 Jun 2.52 1.53 9.34 16.87 0.24 2.79 33.05 Bravo Weather Stick pt 2.0000 5.69 11.38 11.38 Brigade 2EC oz 6.0000 0.94 5.64 5.64 Fertigate CAN03/KN03 3.00 Jun FERTIGATION LABOR hour 3.00 27.30 27.30 Calcium Nitrate lb 90.0000 0.35 31.50 31.50 Sprayer Air Blast 16' 100 ga 2WD 75 hp 0.245 1.00 Jul 2.52 1.53 9.34 16.87 0.24 2.79 33.05 Brigade 2EC oz 6.0000 0.94 5.64 5.64 Trailer - Vegetables 16' 2WD 75 hp 0.090 1.00 Jul 0.92 0.56 0.05 0.08 0.18 1.84 3.45 CustomHarvest Tomato box 1.00 Jul 1600.0000 1.00 1600.00 1600.00 5-Gal Bucket each 200.0000 3.88 776.00 776.00 GRADE & PACK LABOR hour 1.00 Jul 320.00 2912.00 2912.00 Box Tomato box 1600.0000 1.79 2864.00 2864.00 Mulch Lifter 1-Row 2WD 75 hp 0.589 1.00 Jul 6.03 3.68 0.13 2.44 0.58 6.69 18.97 LABOR MULCH CLEANUP hour 15.00 136.50 136.50 Irrigation Setup acre Apr 1.0000 371.06 ------- ------- ------- ------- ------ ------- ------- -------- TOTALS 62.48 38.09 73.54 139.45 406.68 3714.61 8494.09 12893.32 INTEREST ON OPERATING CAPITAL 92.58 UNALLOCATED LABOR 13.87 TOTAL SPECIFIED COST 12999.77 _______________________________________________________________________________________________________________________________________________ Note: Cost of production estimates are based on 2010 input prices. Fertilization decisions should be based on soil tests. Irrigation implies 6 acre inches applied as needed over the production period for both fertigation and water needs.
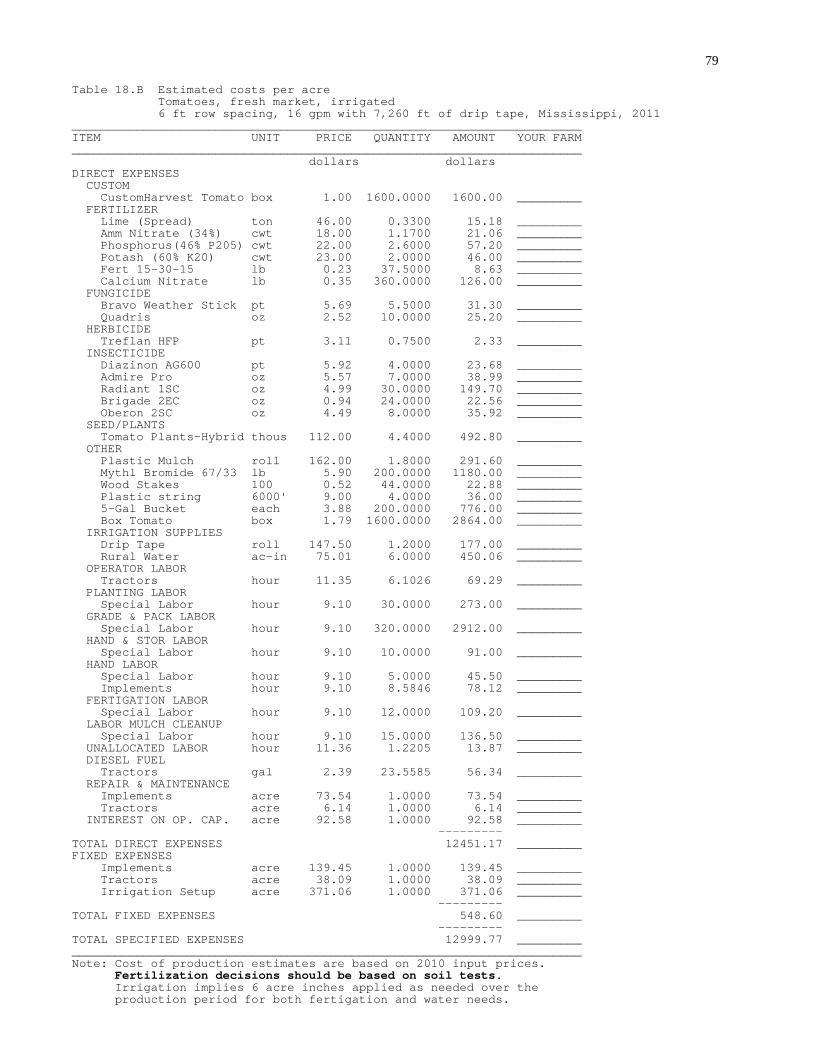
79
Table 18.B Estimated costs per acre Tomatoes, fresh market, irrigated 6 ft row spacing, 16 gpm with 7,260 ft of drip tape, Mississippi, 2011 _______________________________________________________________________ ITEM UNIT PRICE QUANTITY AMOUNT YOUR FARM _______________________________________________________________________ dollars dollars DIRECT EXPENSES CUSTOM CustomHarvest Tomato box 1.00 1600.0000 1600.00 _________ FERTILIZER Lime (Spread) ton 46.00 0.3300 15.18 _________ Amm Nitrate (34%) cwt 18.00 1.1700 21.06 _________ Phosphorus(46% P205) cwt 22.00 2.6000 57.20 _________ Potash (60% K20) cwt 23.00 2.0000 46.00 _________ Fert 15-30-15 lb 0.23 37.5000 8.63 _________ Calcium Nitrate lb 0.35 360.0000 126.00 _________ FUNGICIDE Bravo Weather Stick pt 5.69 5.5000 31.30 _________ Quadris oz 2.52 10.0000 25.20 _________ HERBICIDE Treflan HFP pt 3.11 0.7500 2.33 _________ INSECTICIDE Diazinon AG600 pt 5.92 4.0000 23.68 _________ Admire Pro oz 5.57 7.0000 38.99 _________ Radiant 1SC oz 4.99 30.0000 149.70 _________ Brigade 2EC oz 0.94 24.0000 22.56 _________ Oberon 2SC oz 4.49 8.0000 35.92 _________ SEED/PLANTS Tomato Plants-Hybrid thous 112.00 4.4000 492.80 _________ OTHER Plastic Mulch roll 162.00 1.8000 291.60 _________ Mythl Bromide 67/33 lb 5.90 200.0000 1180.00 _________ Wood Stakes 100 0.52 44.0000 22.88 _________ Plastic string 6000' 9.00 4.0000 36.00 _________ 5-Gal Bucket each 3.88 200.0000 776.00 _________ Box Tomato box 1.79 1600.0000 2864.00 _________ IRRIGATION SUPPLIES Drip Tape roll 147.50 1.2000 177.00 _________ Rural Water ac-in 75.01 6.0000 450.06 _________ OPERATOR LABOR Tractors hour 11.35 6.1026 69.29 _________ PLANTING LABOR Special Labor hour 9.10 30.0000 273.00 _________ GRADE & PACK LABOR Special Labor hour 9.10 320.0000 2912.00 _________ HAND & STOR LABOR Special Labor hour 9.10 10.0000 91.00 _________ HAND LABOR Special Labor hour 9.10 5.0000 45.50 _________ Implements hour 9.10 8.5846 78.12 _________ FERTIGATION LABOR Special Labor hour 9.10 12.0000 109.20 _________ LABOR MULCH CLEANUP Special Labor hour 9.10 15.0000 136.50 _________ UNALLOCATED LABOR hour 11.36 1.2205 13.87 _________ DIESEL FUEL Tractors gal 2.39 23.5585 56.34 _________ REPAIR & MAINTENANCE Implements acre 73.54 1.0000 73.54 _________ Tractors acre 6.14 1.0000 6.14 _________ INTEREST ON OP. CAP. acre 92.58 1.0000 92.58 _________ --------- TOTAL DIRECT EXPENSES 12451.17 _________ FIXED EXPENSES Implements acre 139.45 1.0000 139.45 _________ Tractors acre 38.09 1.0000 38.09 _________ Irrigation Setup acre 371.06 1.0000 371.06 _________ --------- TOTAL FIXED EXPENSES 548.60 _________ --------- TOTAL SPECIFIED EXPENSES 12999.77 _________ _______________________________________________________________________ Note: Cost of production estimates are based on 2010 input prices. Fertilization decisions should be based on soil tests. Irrigation implies 6 acre inches applied as needed over the production period for both fertigation and water needs.

80
Table 18.C Estimated monthly income and expense flows per acre Tomatoes, fresh market, irrigated 6 ft row spacing, 16 gpm with 7,260 ft of drip tape, Mississippi, 2011 __________________________________________________________________________________________________________________________________ ITEM Feb Mar Apr May Jun Jul Aug Sep Oct Nov Dec Jan __________________________________________________________________________________________________________________________________ --------------------------------------------------dollars-------------------------------------------------- TOTAL INCOME 0.00 0.00 0.00 0.00 0.00 0.00 0.00 0.00 0.00 0.00 0.00 0.00 DIRECT EXPENSES CUSTOM 0.00 0.00 0.00 0.00 0.00 1600.00 0.00 0.00 0.00 0.00 0.00 0.00 FERTILIZER 15.18 124.26 50.63 42.00 42.00 0.00 0.00 0.00 0.00 0.00 0.00 0.00 FUNGICIDE 0.00 0.00 21.14 23.98 11.38 0.00 0.00 0.00 0.00 0.00 0.00 0.00 HERBICIDE 0.00 2.33 0.00 0.00 0.00 0.00 0.00 0.00 0.00 0.00 0.00 0.00 INSECTICIDE 0.00 23.68 138.79 97.10 5.64 5.64 0.00 0.00 0.00 0.00 0.00 0.00 SEED/PLANTS 0.00 0.00 492.80 0.00 0.00 0.00 0.00 0.00 0.00 0.00 0.00 0.00 OTHER 0.00 1471.60 0.00 58.88 0.00 3640.00 0.00 0.00 0.00 0.00 0.00 0.00 IRRIGATION SUPPLIES 0.00 177.00 450.06 0.00 0.00 0.00 0.00 0.00 0.00 0.00 0.00 0.00 LABOR 3.00 54.43 386.43 137.45 85.25 3061.92 0.00 0.00 0.00 0.00 0.00 0.00 LEASE * 0.00 0.00 0.00 0.00 0.00 0.00 0.00 0.00 0.00 0.00 0.00 0.00 FUEL 2.03 16.29 20.40 6.81 2.27 8.54 0.00 0.00 0.00 0.00 0.00 0.00 REPAIR & MAINTENANCE 0.50 7.17 23.20 28.77 9.59 10.45 0.00 0.00 0.00 0.00 0.00 0.00 INTEREST ON OP. CAP. 0.45 33.86 22.83 4.27 1.14 30.03 0.00 0.00 0.00 0.00 0.00 0.00 -------- -------- -------- -------- -------- -------- -------- -------- -------- -------- -------- -------- TOTAL DIRECT EXPENSES 21.16 1910.62 1606.28 399.26 157.27 8356.58 0.00 0.00 0.00 0.00 0.00 0.00 NET INCOME -21.16 -1910.62 -1606.28 -399.26 -157.27 -8356.58 0.00 0.00 0.00 0.00 0.00 0.00 NET INCOME TO DATE -21.16 -1931.78 -3538.06 -3937.32 -4094.59-12451.17-12451.17-12451.17-12451.17-12451.17-12451.17-12451.17 __________________________________________________________________________________________________________________________________ Note: Cost of production estimates are based on 2010 input prices. Fertilization decisions should be based on soil tests. Irrigation implies 6 acre inches applied as needed over the production period for both fertigation and water needs. * Lease costs are based on hourly usage costs.
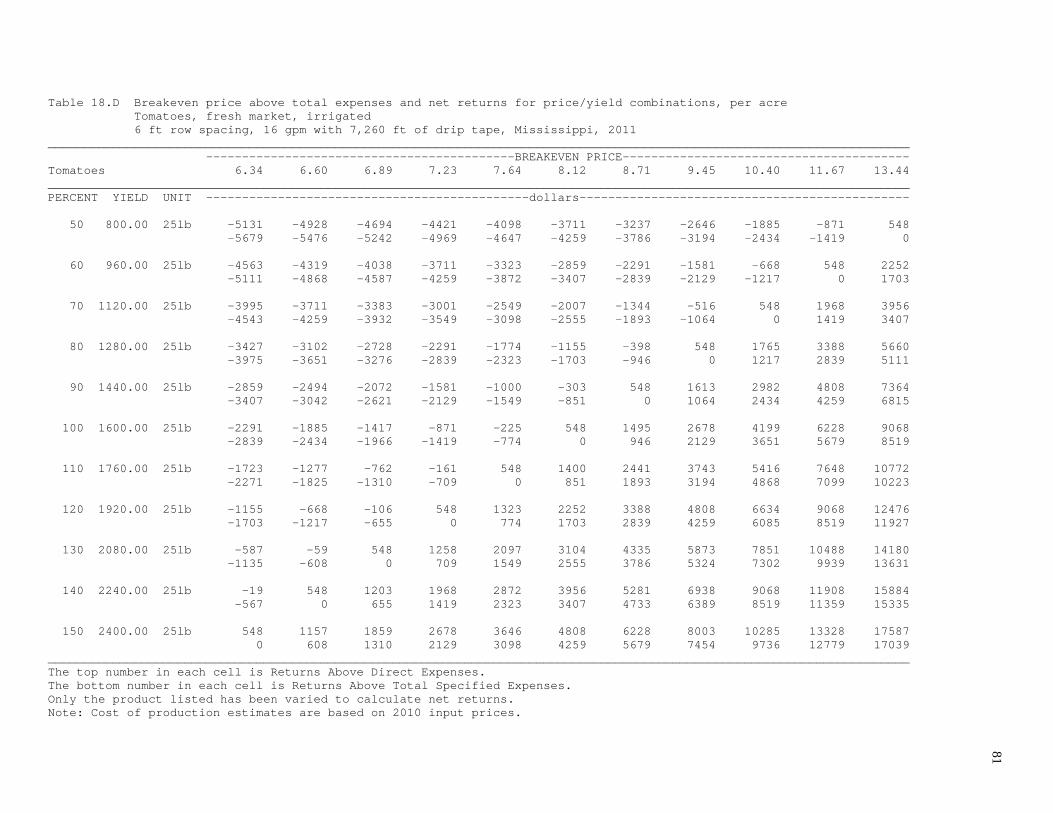
81
Table 18.D Breakeven price above total expenses and net returns for price/yield combinations, per acre Tomatoes, fresh market, irrigated 6 ft row spacing, 16 gpm with 7,260 ft of drip tape, Mississippi, 2011 ________________________________________________________________________________________________________________________ -------------------------------------------BREAKEVEN PRICE---------------------------------------- Tomatoes 6.34 6.60 6.89 7.23 7.64 8.12 8.71 9.45 10.40 11.67 13.44 ________________________________________________________________________________________________________________________ PERCENT YIELD UNIT ---------------------------------------------dollars---------------------------------------------- 50 800.00 25lb -5131 -4928 -4694 -4421 -4098 -3711 -3237 -2646 -1885 -871 548 -5679 -5476 -5242 -4969 -4647 -4259 -3786 -3194 -2434 -1419 0 60 960.00 25lb -4563 -4319 -4038 -3711 -3323 -2859 -2291 -1581 -668 548 2252 -5111 -4868 -4587 -4259 -3872 -3407 -2839 -2129 -1217 0 1703 70 1120.00 25lb -3995 -3711 -3383 -3001 -2549 -2007 -1344 -516 548 1968 3956 -4543 -4259 -3932 -3549 -3098 -2555 -1893 -1064 0 1419 3407 80 1280.00 25lb -3427 -3102 -2728 -2291 -1774 -1155 -398 548 1765 3388 5660 -3975 -3651 -3276 -2839 -2323 -1703 -946 0 1217 2839 5111 90 1440.00 25lb -2859 -2494 -2072 -1581 -1000 -303 548 1613 2982 4808 7364 -3407 -3042 -2621 -2129 -1549 -851 0 1064 2434 4259 6815 100 1600.00 25lb -2291 -1885 -1417 -871 -225 548 1495 2678 4199 6228 9068 -2839 -2434 -1966 -1419 -774 0 946 2129 3651 5679 8519 110 1760.00 25lb -1723 -1277 -762 -161 548 1400 2441 3743 5416 7648 10772 -2271 -1825 -1310 -709 0 851 1893 3194 4868 7099 10223 120 1920.00 25lb -1155 -668 -106 548 1323 2252 3388 4808 6634 9068 12476 -1703 -1217 -655 0 774 1703 2839 4259 6085 8519 11927 130 2080.00 25lb -587 -59 548 1258 2097 3104 4335 5873 7851 10488 14180 -1135 -608 0 709 1549 2555 3786 5324 7302 9939 13631 140 2240.00 25lb -19 548 1203 1968 2872 3956 5281 6938 9068 11908 15884 -567 0 655 1419 2323 3407 4733 6389 8519 11359 15335 150 2400.00 25lb 548 1157 1859 2678 3646 4808 6228 8003 10285 13328 17587 0 608 1310 2129 3098 4259 5679 7454 9736 12779 17039 ________________________________________________________________________________________________________________________ The top number in each cell is Returns Above Direct Expenses. The bottom number in each cell is Returns Above Total Specified Expenses. Only the product listed has been varied to calculate net returns. Note: Cost of production estimates are based on 2010 input prices.
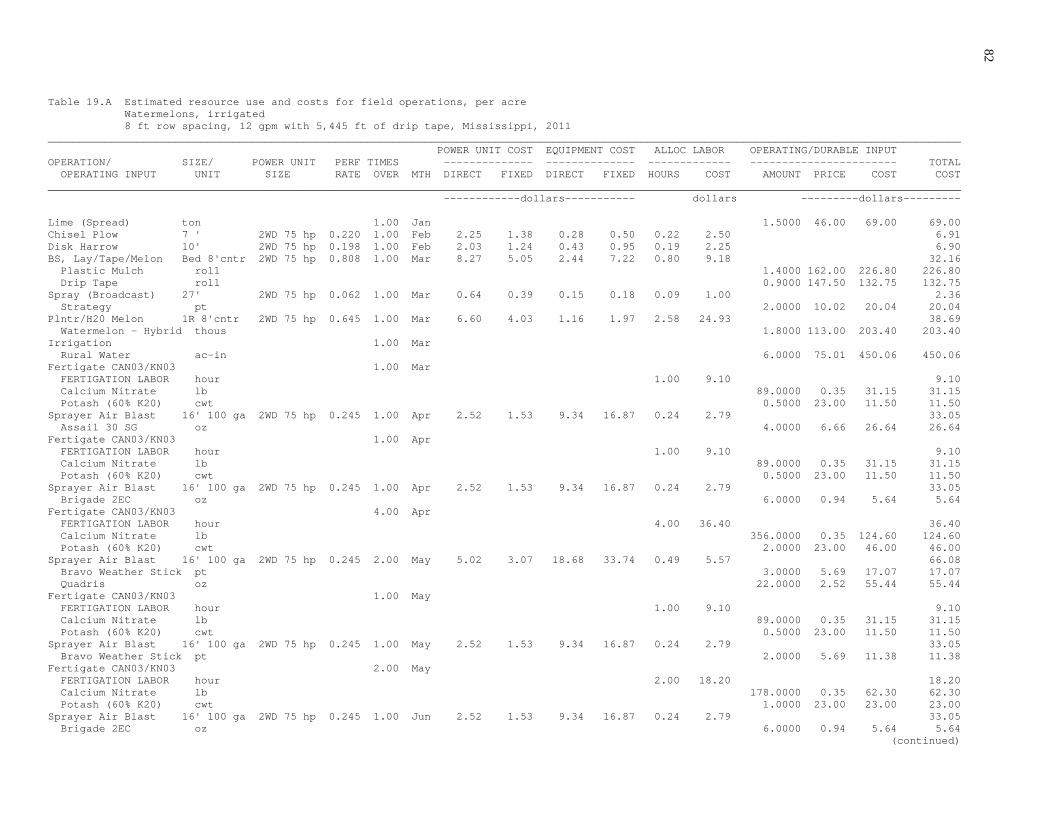
82
Table 19.A Estimated resource use and costs for field operations, per acre Watermelons, irrigated 8 ft row spacing, 12 gpm with 5,445 ft of drip tape, Mississippi, 2011 _______________________________________________________________________________________________________________________________________________ POWER UNIT COST EQUIPMENT COST ALLOC LABOR OPERATING/DURABLE INPUT OPERATION/ SIZE/ POWER UNIT PERF TIMES -------------- -------------- ------------- ----------------------- TOTAL OPERATING INPUT UNIT SIZE RATE OVER MTH DIRECT FIXED DIRECT FIXED HOURS COST AMOUNT PRICE COST COST _______________________________________________________________________________________________________________________________________________ ------------dollars----------- dollars ---------dollars--------- Lime (Spread) ton 1.00 Jan 1.5000 46.00 69.00 69.00 Chisel Plow 7 ' 2WD 75 hp 0.220 1.00 Feb 2.25 1.38 0.28 0.50 0.22 2.50 6.91 Disk Harrow 10' 2WD 75 hp 0.198 1.00 Feb 2.03 1.24 0.43 0.95 0.19 2.25 6.90 BS, Lay/Tape/Melon Bed 8'cntr 2WD 75 hp 0.808 1.00 Mar 8.27 5.05 2.44 7.22 0.80 9.18 32.16 Plastic Mulch roll 1.4000 162.00 226.80 226.80 Drip Tape roll 0.9000 147.50 132.75 132.75 Spray (Broadcast) 27' 2WD 75 hp 0.062 1.00 Mar 0.64 0.39 0.15 0.18 0.09 1.00 2.36 Strategy pt 2.0000 10.02 20.04 20.04 Plntr/H20 Melon 1R 8'cntr 2WD 75 hp 0.645 1.00 Mar 6.60 4.03 1.16 1.97 2.58 24.93 38.69 Watermelon - Hybrid thous 1.8000 113.00 203.40 203.40 Irrigation 1.00 Mar Rural Water ac-in 6.0000 75.01 450.06 450.06 Fertigate CAN03/KN03 1.00 Mar FERTIGATION LABOR hour 1.00 9.10 9.10 Calcium Nitrate lb 89.0000 0.35 31.15 31.15 Potash (60% K20) cwt 0.5000 23.00 11.50 11.50 Sprayer Air Blast 16' 100 ga 2WD 75 hp 0.245 1.00 Apr 2.52 1.53 9.34 16.87 0.24 2.79 33.05 Assail 30 SG oz 4.0000 6.66 26.64 26.64 Fertigate CAN03/KN03 1.00 Apr FERTIGATION LABOR hour 1.00 9.10 9.10 Calcium Nitrate lb 89.0000 0.35 31.15 31.15 Potash (60% K20) cwt 0.5000 23.00 11.50 11.50 Sprayer Air Blast 16' 100 ga 2WD 75 hp 0.245 1.00 Apr 2.52 1.53 9.34 16.87 0.24 2.79 33.05 Brigade 2EC oz 6.0000 0.94 5.64 5.64 Fertigate CAN03/KN03 4.00 Apr FERTIGATION LABOR hour 4.00 36.40 36.40 Calcium Nitrate lb 356.0000 0.35 124.60 124.60 Potash (60% K20) cwt 2.0000 23.00 46.00 46.00 Sprayer Air Blast 16' 100 ga 2WD 75 hp 0.245 2.00 May 5.02 3.07 18.68 33.74 0.49 5.57 66.08 Bravo Weather Stick pt 3.0000 5.69 17.07 17.07 Quadris oz 22.0000 2.52 55.44 55.44 Fertigate CAN03/KN03 1.00 May FERTIGATION LABOR hour 1.00 9.10 9.10 Calcium Nitrate lb 89.0000 0.35 31.15 31.15 Potash (60% K20) cwt 0.5000 23.00 11.50 11.50 Sprayer Air Blast 16' 100 ga 2WD 75 hp 0.245 1.00 May 2.52 1.53 9.34 16.87 0.24 2.79 33.05 Bravo Weather Stick pt 2.0000 5.69 11.38 11.38 Fertigate CAN03/KN03 2.00 May FERTIGATION LABOR hour 2.00 18.20 18.20 Calcium Nitrate lb 178.0000 0.35 62.30 62.30 Potash (60% K20) cwt 1.0000 23.00 23.00 23.00 Sprayer Air Blast 16' 100 ga 2WD 75 hp 0.245 1.00 Jun 2.52 1.53 9.34 16.87 0.24 2.79 33.05 Brigade 2EC oz 6.0000 0.94 5.64 5.64 (continued)
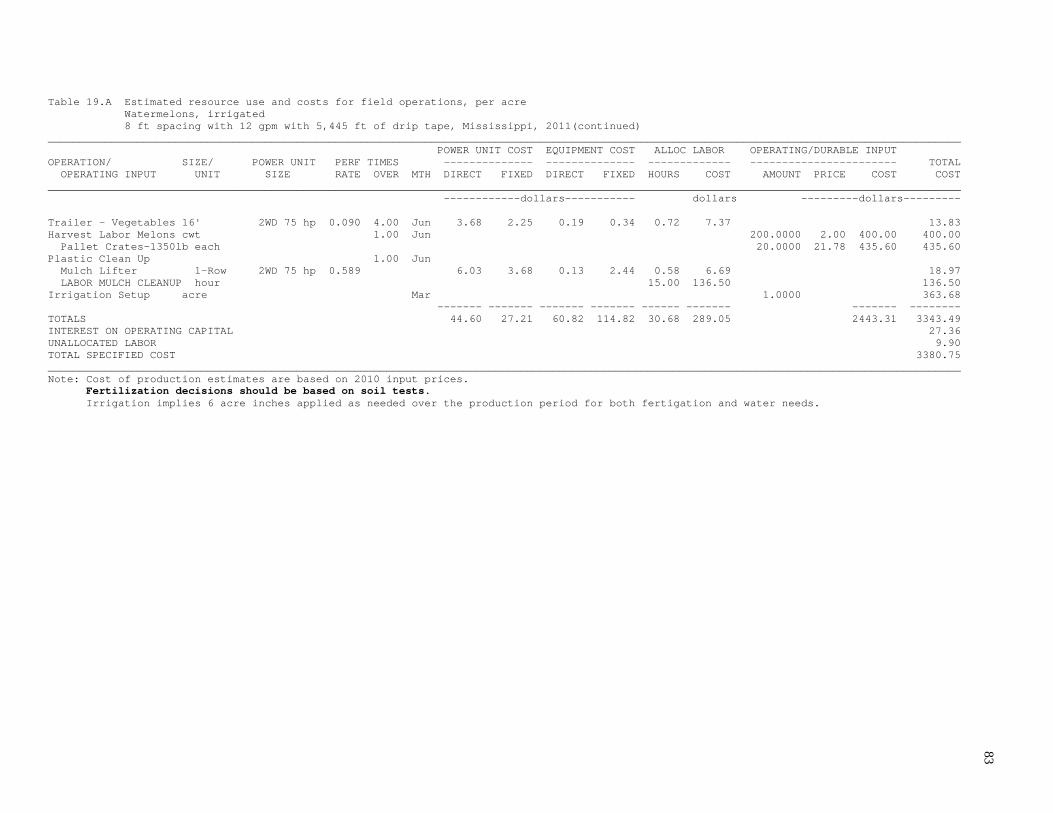
83
Table 19.A Estimated resource use and costs for field operations, per acre Watermelons, irrigated 8 ft spacing with 12 gpm with 5,445 ft of drip tape, Mississippi, 2011(continued) _______________________________________________________________________________________________________________________________________________ POWER UNIT COST EQUIPMENT COST ALLOC LABOR OPERATING/DURABLE INPUT OPERATION/ SIZE/ POWER UNIT PERF TIMES -------------- -------------- ------------- ----------------------- TOTAL OPERATING INPUT UNIT SIZE RATE OVER MTH DIRECT FIXED DIRECT FIXED HOURS COST AMOUNT PRICE COST COST _______________________________________________________________________________________________________________________________________________ ------------dollars----------- dollars ---------dollars--------- Trailer - Vegetables 16' 2WD 75 hp 0.090 4.00 Jun 3.68 2.25 0.19 0.34 0.72 7.37 13.83 Harvest Labor Melons cwt 1.00 Jun 200.0000 2.00 400.00 400.00 Pallet Crates-1350lb each 20.0000 21.78 435.60 435.60 Plastic Clean Up 1.00 Jun Mulch Lifter 1-Row 2WD 75 hp 0.589 6.03 3.68 0.13 2.44 0.58 6.69 18.97 LABOR MULCH CLEANUP hour 15.00 136.50 136.50 Irrigation Setup acre Mar 1.0000 363.68 ------- ------- ------- ------- ------ ------- ------- -------- TOTALS 44.60 27.21 60.82 114.82 30.68 289.05 2443.31 3343.49 INTEREST ON OPERATING CAPITAL 27.36 UNALLOCATED LABOR 9.90 TOTAL SPECIFIED COST 3380.75 _______________________________________________________________________________________________________________________________________________ Note: Cost of production estimates are based on 2010 input prices. Fertilization decisions should be based on soil tests. Irrigation implies 6 acre inches applied as needed over the production period for both fertigation and water needs.
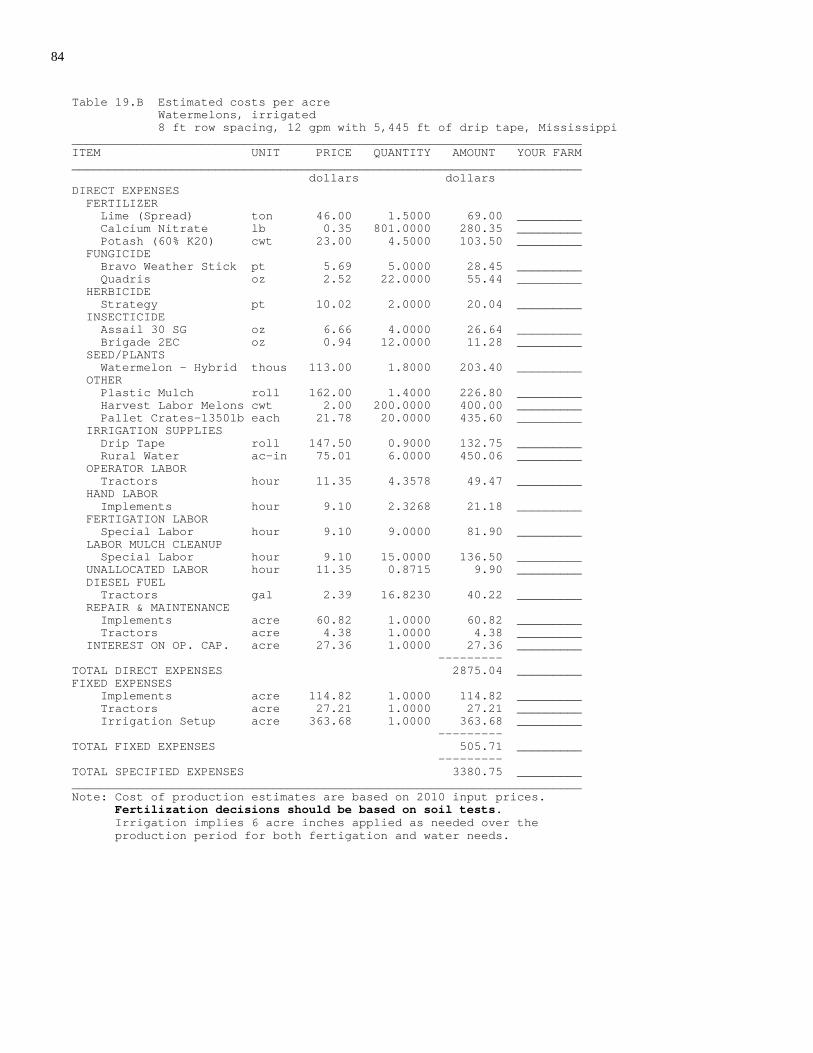
84
Table 19.B Estimated costs per acre Watermelons, irrigated 8 ft row spacing, 12 gpm with 5,445 ft of drip tape, Mississippi _______________________________________________________________________ ITEM UNIT PRICE QUANTITY AMOUNT YOUR FARM _______________________________________________________________________ dollars dollars DIRECT EXPENSES FERTILIZER Lime (Spread) ton 46.00 1.5000 69.00 _________ Calcium Nitrate lb 0.35 801.0000 280.35 _________ Potash (60% K20) cwt 23.00 4.5000 103.50 _________ FUNGICIDE Bravo Weather Stick pt 5.69 5.0000 28.45 _________ Quadris oz 2.52 22.0000 55.44 _________ HERBICIDE Strategy pt 10.02 2.0000 20.04 _________ INSECTICIDE Assail 30 SG oz 6.66 4.0000 26.64 _________ Brigade 2EC oz 0.94 12.0000 11.28 _________ SEED/PLANTS Watermelon - Hybrid thous 113.00 1.8000 203.40 _________ OTHER Plastic Mulch roll 162.00 1.4000 226.80 _________ Harvest Labor Melons cwt 2.00 200.0000 400.00 _________ Pallet Crates-1350lb each 21.78 20.0000 435.60 _________ IRRIGATION SUPPLIES Drip Tape roll 147.50 0.9000 132.75 _________ Rural Water ac-in 75.01 6.0000 450.06 _________ OPERATOR LABOR Tractors hour 11.35 4.3578 49.47 _________ HAND LABOR Implements hour 9.10 2.3268 21.18 _________ FERTIGATION LABOR Special Labor hour 9.10 9.0000 81.90 _________ LABOR MULCH CLEANUP Special Labor hour 9.10 15.0000 136.50 _________ UNALLOCATED LABOR hour 11.35 0.8715 9.90 _________ DIESEL FUEL Tractors gal 2.39 16.8230 40.22 _________ REPAIR & MAINTENANCE Implements acre 60.82 1.0000 60.82 _________ Tractors acre 4.38 1.0000 4.38 _________ INTEREST ON OP. CAP. acre 27.36 1.0000 27.36 _________ --------- TOTAL DIRECT EXPENSES 2875.04 _________ FIXED EXPENSES Implements acre 114.82 1.0000 114.82 _________ Tractors acre 27.21 1.0000 27.21 _________ Irrigation Setup acre 363.68 1.0000 363.68 _________ --------- TOTAL FIXED EXPENSES 505.71 _________ --------- TOTAL SPECIFIED EXPENSES 3380.75 _________ _______________________________________________________________________ Note: Cost of production estimates are based on 2010 input prices. Fertilization decisions should be based on soil tests. Irrigation implies 6 acre inches applied as needed over the production period for both fertigation and water needs.

85
Table 19.C Estimated monthly income and expense flows per acre Watermelons, irrigated 8 ft row spacing, 12 gpm with 5,445 ft of drip tape, Mississippi, 2011 __________________________________________________________________________________________________________________________________ ITEM Jan Feb Mar Apr May Jun Jul Aug Sep Oct Nov Dec __________________________________________________________________________________________________________________________________ --------------------------------------------------dollars-------------------------------------------------- TOTAL INCOME 0.00 0.00 0.00 0.00 0.00 0.00 0.00 0.00 0.00 0.00 0.00 0.00 DIRECT EXPENSES FERTILIZER 69.00 0.00 42.65 213.25 127.95 0.00 0.00 0.00 0.00 0.00 0.00 0.00 FUNGICIDE 0.00 0.00 0.00 0.00 83.89 0.00 0.00 0.00 0.00 0.00 0.00 0.00 HERBICIDE 0.00 0.00 20.04 0.00 0.00 0.00 0.00 0.00 0.00 0.00 0.00 0.00 INSECTICIDE 0.00 0.00 0.00 32.28 0.00 5.64 0.00 0.00 0.00 0.00 0.00 0.00 SEED/PLANTS 0.00 0.00 203.40 0.00 0.00 0.00 0.00 0.00 0.00 0.00 0.00 0.00 OTHER 0.00 0.00 226.80 0.00 0.00 835.60 0.00 0.00 0.00 0.00 0.00 0.00 IRRIGATION SUPPLIES 0.00 0.00 582.81 0.00 0.00 0.00 0.00 0.00 0.00 0.00 0.00 0.00 LABOR 0.00 5.70 47.65 52.20 37.33 156.07 0.00 0.00 0.00 0.00 0.00 0.00 LEASE * 0.00 0.00 0.00 0.00 0.00 0.00 0.00 0.00 0.00 0.00 0.00 0.00 FUEL 0.00 3.86 13.99 4.54 6.80 11.03 0.00 0.00 0.00 0.00 0.00 0.00 REPAIR & MAINTENANCE 0.00 1.13 5.27 19.18 28.76 10.86 0.00 0.00 0.00 0.00 0.00 0.00 INTEREST ON OP. CAP. 1.49 0.19 16.50 3.47 2.05 3.66 0.00 0.00 0.00 0.00 0.00 0.00 -------- -------- -------- -------- -------- -------- -------- -------- -------- -------- -------- -------- TOTAL DIRECT EXPENSES 70.49 10.88 1159.11 324.92 286.78 1022.86 0.00 0.00 0.00 0.00 0.00 0.00 NET INCOME -70.49 -10.88 -1159.11 -324.92 -286.78 -1022.86 0.00 0.00 0.00 0.00 0.00 0.00 NET INCOME TO DATE -70.49 -81.37 -1240.48 -1565.40 -1852.18 -2875.04 -2875.04 -2875.04 -2875.04 -2875.04 -2875.04 -2875.04 __________________________________________________________________________________________________________________________________ Note: Cost of production estimates are based on 2010 input prices. Fertilization decisions should be based on soil tests. Irrigation implies 6 acre inches applied as needed over the production period for both fertigation and water needs. * Lease costs are based on hourly usage costs.

86
Table 19.D Breakeven price above total expenses and net returns for price/yield combinations, per acre Watermelons, irrigated 8 ft row spacing, 12 gpm with 5,445 ft of drip tape, Mississippi, 2011 ________________________________________________________________________________________________________________________ -------------------------------------------BREAKEVEN PRICE---------------------------------------- Watermelons 11.93 12.64 13.46 14.42 15.54 16.90 18.55 20.62 23.28 26.83 31.80 ________________________________________________________________________________________________________________________ PERCENT YIELD UNIT ---------------------------------------------dollars---------------------------------------------- 50 100.00 cwt -1480 -1409 -1327 -1232 -1119 -983 -818 -611 -345 9 505 -1986 -1915 -1833 -1737 -1625 -1489 -1324 -1117 -851 -496 0 60 120.00 cwt -1281 -1196 -1098 -983 -848 -686 -487 -239 80 505 1101 -1787 -1702 -1604 -1489 -1354 -1191 -993 -744 -425 0 595 70 140.00 cwt -1083 -983 -869 -735 -577 -388 -156 133 505 1002 1697 -1588 -1489 -1375 -1241 -1083 -893 -662 -372 0 496 1191 80 160.00 cwt -884 -771 -640 -487 -306 -90 174 505 931 1498 2293 -1390 -1276 -1145 -993 -812 -595 -331 0 425 993 1787 90 180.00 cwt -686 -558 -411 -239 -35 207 505 878 1356 1995 2889 -1191 -1064 -916 -744 -541 -297 0 372 851 1489 2383 100 200.00 cwt -487 -345 -181 9 234 505 836 1250 1782 2491 3485 -993 -851 -687 -496 -270 0 331 744 1276 1986 2979 110 220.00 cwt -288 -132 47 257 505 803 1167 1622 2208 2988 4080 -794 -638 -458 -248 0 297 662 1117 1702 2482 3575 120 240.00 cwt -90 80 276 505 776 1101 1498 1995 2633 3485 4676 -595 -425 -229 0 270 595 993 1489 2128 2979 4171 130 260.00 cwt 108 292 505 753 1047 1399 1829 2367 3059 3981 5272 -397 -212 0 248 541 893 1324 1862 2553 3475 4766 140 280.00 cwt 307 505 734 1002 1318 1697 2160 2740 3485 4478 5868 -198 0 229 496 812 1191 1655 2234 2979 3972 5362 150 300.00 cwt 505 718 964 1250 1589 1995 2491 3112 3910 4974 6464 0 212 458 744 1083 1489 1986 2606 3404 4468 5958 ________________________________________________________________________________________________________________________ The top number in each cell is Returns Above Direct Expenses. The bottom number in each cell is Returns Above Total Specified Expenses. Only the product listed has been varied to calculate net returns. Note: Cost of production estimates are based on 2010 input prices.

APPENDIX

88 Appendix Table 1. Tractors/Harvesters: estimated purchase price, annual use, useful life, fuel use, and direct and fixed cost per hour, Mississippi, 2011 _______________________________________________________________________________________________________ Purchase Annual Useful Fuel Labor Fuel R&M Total Fixed Total Item Name Size Price Use Life Use Direct Cost _______________________________________________________________________________________________________ dollars hours years gal/hr ----------------$/hour---------------- Tractor (40-59hp)CB 2WD 50 hp 29,300 600 8 2.57 11.35 6.15 0.91 18.41 5.69 24.11 Tractor (40-59hp)CB MFWD 50 hp 31,900 600 8 2.57 11.35 6.15 0.99 18.49 6.20 24.70 Tractor (40-59hp)RB 2WD 50 hp 22,500 600 8 2.57 11.35 6.15 0.70 18.20 4.37 22.58 Tractor (40-59hp)RB MFWD 50 hp 26,600 600 8 2.57 11.35 6.15 0.83 18.33 5.17 23.50 Tractor (60-89hp)CB 2WD 75 hp 40,100 600 8 3.86 11.35 9.22 1.25 21.82 7.80 29.63 Tractor (60-89hp)CB MFWD 75 hp 43,900 600 8 3.86 11.35 9.22 1.37 21.94 8.53 30.48 Tractor (60-89hp)RB 2WD 75 hp 32,100 600 8 3.86 11.35 9.22 1.00 21.57 6.24 27.82 Tractor (60-89hp)RB MFWD 75 hp 35,900 600 8 3.86 11.35 9.22 1.12 21.69 6.98 28.68 Tractor(120-139hp)CB MFWD 130 85,400 600 8 6.69 11.35 15.99 2.66 30.01 16.61 46.62 Tractor(160-179hp)CB MFWD 170 128,400 600 8 8.75 11.35 20.91 4.01 36.27 26.07 62.35 Utility Vehicle 600CC 9,500 200 8 0.50 11.35 1.30 1.48 14.13 6.03 20.17 _______________________________________________________________________________________________________ Notes: Labor: Includes allocated labor from power unit. Total Direct: Does not include interest on operating capital. Appendix Table 2. Self-propelled machines: estimated purchase price, annual use, useful life, fuel use, performance rate, and direct and fixed cost per acre, Mississippi, 2011 ______________________________________________________________________________________________________________ Purchase Annual Useful Fuel Perf Labor Fuel R&M Total Fixed Total Item Name Size Price Use Life Use Rate Direct Cost ______________________________________________________________________________________________________________ dollars hours years gal/hr hr/ac ----------------$/acre---------------- Fork Lift 32,900 1000 10 1.07 2.220 25.19 5.93 1.38 32.52 8.55 41.07 Sprayer 110 gal 30' 47hp 44,000 350 6 2.14 0.035 0.56 0.18 0.11 0.85 0.69 1.54 Sprayer(300-450GAL) 60' 96,400 350 8 5.66 0.017 0.28 0.23 0.09 0.60 0.61 1.22 Truck 1 ton + 41,000 780 5 0.72 1.730 19.63 2.97 1.27 23.88 16.40 40.29 Truck 1/2 ton 24,400 1040 5 1.36 2.310 26.21 8.19 1.62 36.04 9.77 45.82 Utility Vehicle 800CC 10,800 200 8 0.70 0.249 2.83 0.45 0.42 3.71 1.71 5.43 ______________________________________________________________________________________________________________ Notes: Labor: includes allocated labor plus any additional labor from self-propelled machine. Total Direct: Does not include interest on operating capital.

89
Appendix Table 3. Towed equipment: estimated purchase price, annual use, useful life, performance rate, and direct and fixed cost per acre, Mississippi, 2011 ___________________________________________________________________________________________________________________________ Power Purchase Annual Useful Perf Labor Fuel ---R&M---- Total --Fixed--- Total Item Name Size Unit Price Use Life Rate Imp. P.U. Direct Imp. P.U. Cost ___________________________________________________________________________________________________________________________ dollars hours years hr/ac ----------------------$/acre--------------------- Bd Shaper Cucumber Bed 4'cntr 2WD 75 hp 2,544 81 16 1.617 18.36 14.92 1.52 1.62 36.43 4.50 10.10 51.03 Bd Shaper Melons Bed 8'cntr 2WD 75 hp 2,544 40 16 0.808 9.18 7.46 1.54 0.81 18.99 4.56 5.05 28.61 Bd Shaper Squash Bed 5'cntr 2WD 75 hp 2,544 65 16 1.294 14.68 11.93 1.51 1.29 29.44 4.49 8.08 42.01 Bd Shaper Tomato Bed 6'cntr 2WD 75 hp 2,544 54 16 1.078 12.24 9.94 1.52 1.08 24.79 4.50 6.73 36.03 Bd Shaper/LayCucumbe Bed 4'cntr 2WD 75 hp 3,759 81 16 1.617 33.08 14.92 2.25 1.62 51.88 6.65 10.10 68.63 Bd Shaper/LayMelon Bed 8'cntr 2WD 75 hp 3,759 40 16 0.808 16.54 7.46 2.28 0.81 27.09 6.74 5.05 38.88 Bd Shaper/LaySquash Bed 5'cntr 2WD 75 hp 3,759 65 16 1.294 26.46 11.93 2.24 1.29 41.94 6.63 8.08 56.66 Bd Shaper/LayTomato Bed 6'cntr 2WD 75 hp 3,759 54 16 1.078 22.05 9.94 2.25 1.08 35.33 6.65 6.73 48.72 Bd Shaper/P-bdCucumb Bed 4'cntr 2WD 75 hp 10,200 81 16 1.617 18.36 14.92 6.11 1.62 41.01 18.31 10.10 69.43 Bd Shaper/P-bdMelon Bed 8'cntr 2WD 75 hp 10,200 40 16 0.808 9.18 7.46 6.18 0.81 23.64 18.54 5.05 47.23 Bd Shaper/P-bdSquash Bed 5'cntr 2WD 75 hp 10,200 65 16 1.294 14.68 11.93 6.09 1.29 34.01 18.25 8.08 60.35 Bd Shaper/P-bdTomato Bed 6'cntr 2WD 75 hp 10,200 54 16 1.078 12.24 9.94 6.11 1.08 29.38 18.31 6.73 54.43 Bd Shaper3XCucumber Bed 4'cntr 2WD 75 hp 5,478 81 16 1.617 33.08 14.92 3.28 1.62 52.91 9.61 10.10 72.62 Bd Shaper3XMelon Bed 8'cntr 2WD 75 hp 5,478 40 16 0.808 16.54 7.46 3.32 0.81 28.13 9.73 5.05 42.92 Bd Shaper3XSquash Bed 5'cntr 2WD 75 hp 5,478 65 16 1.294 26.46 11.93 3.27 1.29 42.97 9.58 8.08 60.63 Bd Shaper3XTomato Bed 6'cntr 2WD 75 hp 5,478 54 16 1.078 22.05 9.94 3.28 1.08 36.36 9.61 6.73 52.71 BS, L,T,FumigTomato Bed 6'cntr 2WD 75 hp 6,125 54 16 1.078 41.68 9.94 3.66 1.08 56.38 10.84 6.73 73.96 BS, L,T,Fung BPepper Bed 6'cntr 2WD 75 hp 6,125 54 16 1.078 41.68 9.94 3.66 1.08 56.38 10.84 6.73 73.96 BS, Lay/Tape BPepper Bed 6'cntr 2WD 75 hp 4,025 54 16 1.078 12.24 9.94 2.41 1.08 25.68 7.12 6.73 39.54 BS, Lay/Tape/Melon Bed 8'cntr 2WD 75 hp 4,025 40 16 0.808 9.18 7.46 2.44 0.81 19.89 7.21 5.05 32.16 BS, Lay/Tape/Pumpkin Bed 8'cntr 2WD 75 hp 4,025 40 16 0.080 0.91 0.74 0.24 0.08 1.98 0.72 0.50 3.21 BS, Lay/Tape/Squash Bed 5'cntr 2WD 75 hp 4,025 65 16 1.294 14.68 11.93 2.40 1.29 30.33 7.10 8.08 45.51 BS, Lay/Tape/Tomato Bed 6'cntr 2WD 75 hp 4,025 54 16 1.078 12.24 9.94 2.41 1.08 25.68 7.12 6.73 39.54 BS,Lay/Tape/Cucumber Bed 4'cntr 2WD 75 hp 4,025 81 16 1.617 18.36 14.92 2.41 1.62 37.31 7.12 10.10 54.54 Chain Harrow 6' 600CC 534 100 1 0.343 3.90 0.44 0.01 0.51 4.87 1.91 2.07 8.87 Chisel Plow 7 ' 2WD 75 hp 3,500 150 12 0.220 2.50 2.03 0.27 0.22 5.03 0.50 1.37 6.91 Chisel Plow Folding 16' MFWD 170 19,900 150 12 0.116 1.32 2.43 0.83 0.46 5.07 1.51 3.04 9.62 Cult - Rolling 2-Row 2WD 75 hp 3,105 47 27 0.310 3.52 2.86 0.30 0.31 7.00 1.41 1.93 10.36 Cult - Rolling 4-Row 2WD 75 hp 5,520 25 27 0.165 1.87 1.52 0.54 0.16 4.10 2.52 1.03 7.65 Cult - Rolling+Fert 2-Row 2WD 75 hp 6,155 31 27 0.310 3.52 2.86 0.91 0.31 7.61 4.25 1.93 13.81 Cult - Rolling+Fert 4-Row 2WD 75 hp 10,115 17 27 0.165 2.62 1.52 1.45 0.16 5.77 6.79 1.03 13.59 Cult - Rotary Hoe 12' 2WD 75 hp 4,870 32 27 0.214 2.43 1.98 0.48 0.21 5.12 2.25 1.34 8.72 Cult - Rotary Hoe 15' 2WD 75 hp 4,444 26 27 0.171 1.95 1.58 0.43 0.17 4.14 2.02 1.07 7.24 Cultipacker 12' 2WD 75 hp 5,020 300 12 0.124 1.41 1.14 0.14 0.12 2.83 0.20 0.77 3.81 Cultivate 1-Row 2WD 75 hp 1,283 110 27 0.589 6.68 5.43 0.10 0.59 12.81 0.47 3.67 16.97 Cultivate 2-Row 2WD 75 hp 1,332 59 27 0.312 3.54 2.88 0.10 0.31 6.84 0.48 1.95 9.28 Cultivate 4-Row 2WD 75 hp 1,426 29 10 0.155 1.76 1.43 0.30 0.15 3.65 0.83 0.96 5.45 Cultivate - Heavy 4R-38 2WD 50 hp 9,440 150 10 0.155 1.76 0.95 0.39 0.10 3.21 1.06 0.67 4.95 Cultivate - Heavy 8R-42 MFWD 130 19,600 150 10 0.073 0.83 1.17 0.38 0.19 2.59 1.05 1.22 4.87 Cultivate+App Herb 4-Row 2WD 75 hp 1,976 150 10 0.193 3.08 1.78 0.10 0.19 5.16 0.27 1.21 6.65 Cultivate+App Ins 2-Row 2WD 75 hp 1,882 150 10 0.390 6.21 3.60 0.19 0.39 10.40 0.53 2.43 13.37 Cultivate+App Ins 4-Row 2WD 75 hp 1,976 150 10 0.193 3.08 1.78 0.10 0.19 5.16 0.27 1.21 6.65 Cultivate+Sidedress 2-Row 2WD 75 hp 3,061 39 27 0.390 6.21 3.60 0.45 0.39 10.66 2.11 2.43 15.21 Cultivate+Sidedress 4-Row 2WD 75 hp 4,739 19 27 0.193 3.08 1.78 0.71 0.19 5.78 3.33 1.21 10.33 Disc Mower 10' 2WD 75 hp 10,658 200 8 0.206 2.34 1.90 1.37 0.20 5.82 1.56 1.28 8.67 Disk + Incorporate 10' 2WD 75 hp 12,858 200 10 0.206 3.27 1.90 0.79 0.20 6.18 1.45 1.28 8.92 Disk + Incorporate 14' 2WD 75 hp 25,600 200 10 0.147 2.34 1.35 1.13 0.14 4.98 2.06 0.91 7.96 Disk Bed 2-Row 2WD 75 hp 4,449 160 10 0.284 3.22 2.62 0.23 0.28 6.36 0.95 1.77 9.09 Disk Bed 4-Row 2WD 75 hp 6,495 160 10 0.140 1.60 1.30 0.22 0.14 3.27 0.62 0.88 4.77 Disk Bed (Hipper) 8R-40 MFWD 130 15,300 160 10 0.070 0.80 1.12 0.26 0.18 2.38 0.73 1.17 4.29 Disk Bed + Spray PD 8R-40 MFWD 130 22,290 160 10 0.070 0.80 1.12 0.39 0.18 2.50 1.07 1.17 4.75 Disk Bed +App Fert 4-Row 2WD 75 hp 9,807 160 10 0.140 2.24 1.30 0.34 0.14 4.02 0.94 0.88 5.85 Disk Harrow 10' 2WD 75 hp 7,868 180 10 0.198 2.25 1.82 0.43 0.19 4.71 0.94 1.23 6.89 Disk Harrow 14' 2WD 75 hp 20,600 180 10 0.141 1.60 1.30 0.81 0.14 3.86 1.77 0.88 6.52 Disk Harrow 24' MFWD 170 33,100 180 10 0.082 0.93 1.72 0.75 0.33 3.75 1.66 2.15 7.57 Disk Harrow-Hvy Duty 5' 2WD 75 hp 1,694 180 10 0.412 4.68 3.80 0.19 0.41 9.09 0.42 2.57 12.09 Ditcher 2WD 50 hp 4,390 200 10 0.020 0.22 0.12 0.03 0.01 0.39 0.04 0.08 0.53 Fert-Cyclone Spin 750 lb 2WD 75 hp 1,000 50 8 0.084 0.95 0.77 0.06 0.08 1.87 0.23 0.52 2.64 Fert-Side Dresser 1R 3' 2WD 75 hp 1,973 42 10 0.846 9.60 7.80 1.19 0.84 19.45 4.81 5.28 29.54 Fert-Side Dresser 2R 6' 2WD 75 hp 5,065 21 10 0.423 4.80 3.90 3.06 0.42 12.19 12.34 2.64 27.18 Fert-Side Dresser 4R-40 2WD 75 hp 10,263 10 10 0.195 2.21 1.80 6.01 0.19 10.22 24.25 1.21 35.69 Fert-Sprd Pull Type 6' 2WD 75 hp 3,475 10 10 0.392 4.45 3.62 4.09 0.39 12.57 16.52 2.45 31.54 Fert-Sprd Pull Type 8' 2WD 75 hp 3,750 15 10 0.294 3.34 2.71 2.20 0.29 8.56 8.91 1.83 19.32 Fert-Sprd Pull Type 10' 2WD 75 hp 3,995 12 10 0.235 2.67 2.17 2.35 0.23 7.44 9.49 1.47 18.40 Fert-Sprd Pull Type 12' 2WD 75 hp 4,285 10 10 0.196 2.22 1.81 2.52 0.19 6.76 10.18 1.22 18.17 Front End Loader .5yd 2WD 75 hp 5,822 100 10 0.600 6.81 5.53 1.04 0.60 13.99 4.36 3.74 22.10 Harvester,Swt.Potato 2 Row MFWD 170 29,500 300 15 1.011 66.67 21.14 5.83 4.05 97.71 9.23 26.36 133.31 Mulch Lifter 1-Row 2WD 75 hp 1,900 29 30 0.589 6.68 5.43 0.12 0.59 12.84 2.44 3.67 18.96 Mule Train (Corn) 30' MFWD 75 hp 69,900 12 25 0.229 69.33 2.11 13.34 0.25 85.05 89.07 1.60 175.73 Picker Beans/Peas 1-Row 2WD 75 hp 34,600 179 10 3.571 105.53 32.95 48.32 3.58 190.39 37.96 22.30 250.66 Picker Corn 1-Row 2WD 75 hp 42,000 42 10 0.840 9.53 7.75 25.21 0.84 43.34 46.21 5.24 94.81 (continued)

90
Appendix Table 3. Towed equipment: estimated purchase price, annual use, useful life, performance rate, and direct and fixed cost per acre, Mississippi, 2011 (continued) ___________________________________________________________________________________________________________________________ Power Purchase Annual Useful Perf Labor Fuel ---R&M---- Total --Fixed--- Total Item Name Size Unit Price Use Life Rate Imp. P.U. Direct Imp. P.U. Cost ___________________________________________________________________________________________________________________________ dollars hours years hr/ac ----------------------$/acre--------------------- Plastic Layer Melon Bed 8'cntr 2WD 75 hp 2,310 40 16 0.808 9.18 7.46 1.40 0.81 18.85 4.14 5.05 28.04 Plastic Layer Squash Bed 5'cntr 2WD 75 hp 2,310 65 16 1.294 14.68 11.93 2.29 1.29 30.22 4.07 8.08 42.38 Plastic Layer Tomato Bed 6'cntr 2WD 75 hp 2,310 54 16 1.078 12.24 9.94 2.30 1.08 25.57 4.09 6.73 36.40 Plastic Lyr Cucumber Bed 4'cntr 2WD 75 hp 2,310 81 16 1.617 18.36 14.92 2.30 1.62 37.21 4.09 10.10 51.40 Plntr - Vacuum 1-Row 2WD 75 hp 4,550 53 18 1.057 12.00 9.75 4.54 1.06 27.36 7.55 6.60 41.52 Plntr - Vacuum 2-Row 2WD 75 hp 7,037 20 18 0.396 4.50 3.65 6.97 0.39 15.53 11.60 2.47 29.61 Plntr - Vacuum 4-Row 2WD 75 hp 15,165 11 18 0.226 2.57 2.09 15.62 0.22 20.51 25.98 1.41 47.91 Plntr - Vacuum+Ins 1-Row 2WD 75 hp 5,345 53 18 1.057 12.00 9.75 5.33 1.06 28.15 8.86 6.60 43.63 Plntr - Vacuum+Ins 2R 30-40 2WD 75 hp 8,400 20 18 0.396 4.50 3.65 8.32 0.39 16.88 13.85 2.47 33.21 Plntr - Vacuum+Ins 4R 30-40 2WD 75 hp 16,485 11 18 0.226 2.57 2.09 16.98 0.22 21.87 28.24 1.41 51.53 Plntr - Vacuum+Ins Bed 4'cntr 2WD 75 hp 5,345 40 18 0.793 9.00 7.31 5.30 0.79 22.41 8.81 4.95 36.18 Plntr - Vacuum+Ins Bed 5'cntr 2WD 75 hp 5,345 32 18 0.634 7.20 5.85 5.29 0.63 18.99 8.81 3.96 31.77 Plntr - Vacuum+Ins Bed 6'cntr 2WD 75 hp 5,345 26 18 0.528 6.00 4.87 5.43 0.53 16.84 9.04 3.30 29.19 Plntr - Vacuum+Ins Bed 8'cntr 2WD 75 hp 5,345 20 18 0.396 4.50 3.65 5.29 0.39 13.85 8.81 2.47 25.14 Plntr/H20 Cucumber 1R 4'cntr 2WD 75 hp 2,305 129 17 2.578 99.64 23.78 2.30 2.58 128.32 3.89 16.09 148.31 Plntr/H20 Cucumber 2R 4'cntr 2WD 75 hp 4,999 129 17 1.289 73.28 11.89 2.49 1.29 88.96 4.22 8.04 101.24 Plntr/H20 Melon 1R 8'cntr 2WD 75 hp 2,305 64 17 0.645 24.93 5.95 1.16 0.64 32.69 1.96 4.02 38.69 Plntr/H20 Melon 2R 8'cntr 2WD 75 hp 4,999 64 17 0.644 36.64 5.94 2.51 0.64 45.75 4.26 4.02 54.03 Plntr/H20 Squash 1R 5'cntr 2WD 75 hp 2,305 103 17 2.062 79.71 19.02 2.30 2.06 103.12 3.90 12.87 119.90 Plntr/H20 Squash 2R 5'cntr 2WD 75 hp 4,999 103 17 1.031 58.62 9.51 2.50 1.03 71.67 4.23 6.43 82.35 Plntr/H20 Tomato 1R 6'cntr 2WD 75 hp 2,305 86 17 1.718 66.42 15.85 2.30 1.72 86.31 3.89 10.73 100.94 Plntr/H20 Tomato 2R 6'cntr 2WD 75 hp 4,999 86 17 0.859 48.85 7.92 2.49 0.86 60.14 4.22 5.36 69.73 Plntr/H20 Wheel 2-Row 2WD 75 hp 4,999 74 17 1.473 83.75 13.59 4.97 1.47 103.79 8.42 9.19 121.42 Plntr/H20/pnch/seed 1-Row 2WD 75 hp 4,315 129 17 2.578 52.72 23.78 4.31 2.58 83.40 7.29 16.09 106.80 Plntr/H20/pnch/seed 2R 18-60 2WD 75 hp 12,945 129 17 1.586 32.44 14.63 7.96 1.59 56.63 13.47 9.90 80.01 Plntr/Transplant-H20 4R 36-48 2WD 75 hp 13,395 34 17 0.687 64.10 6.34 0.31 0.68 71.46 22.82 4.29 98.57 Plntr/Transplanter 1-Row 2WD 75 hp 2,393 31 19 1.586 61.32 14.63 0.12 1.59 77.67 9.90 9.90 97.48 Plntr/Transplanter 4R 36-48 2WD 75 hp 16,618 300 19 0.687 64.10 6.34 0.04 0.68 71.18 3.07 4.29 78.55 Plntr/Transplanter 8R-42 MFWD 170 26,692 150 19 0.333 57.11 6.97 0.06 1.33 65.48 4.79 8.69 78.97 Rotary Cutter 7' 2WD 75 hp 3,920 185 10 0.169 1.92 1.56 0.53 0.16 4.19 0.39 1.05 5.64 Rotary Tiller 5' 2WD 75 hp 1,908 49 18 0.970 11.01 8.95 2.64 0.97 23.59 3.12 6.06 32.78 Spray (Broadcast) 27' 2WD 50 hp 4,990 200 8 0.062 0.99 0.38 0.14 0.04 1.57 0.18 0.27 2.02 Spray (Broadcast) 60' MFWD 130 9,580 200 8 0.028 0.44 0.45 0.12 0.07 1.10 0.15 0.46 1.72 Sprayer Air Blast 16' 100 ga 2WD 75 hp 9,131 12 16 0.245 2.78 2.26 9.34 0.24 14.64 16.87 1.53 33.04 Sprayer Air Blast 16' 200 ga 2WD 75 hp 13,509 12 16 0.245 2.78 2.26 13.82 0.24 19.11 24.96 1.53 45.61 Stalk Shredder-Flail 15' 2WD 50 hp 18,068 185 10 0.110 1.25 0.68 0.43 0.07 2.45 1.31 0.48 4.24 Sub-Soiler 1 shank 2WD 75 hp 585 54 23 1.078 12.24 9.94 0.35 1.08 23.62 0.87 6.73 31.22 Sub-Soiler 2 shank 2WD 75 hp 1,681 20 23 0.404 4.59 3.73 1.01 0.40 9.74 2.53 2.52 14.80 Take Up Reel (M&T) 1-Row 2WD 75 hp 3,244 42 10 0.588 6.67 5.42 1.36 0.59 14.05 5.53 3.67 23.26 Take Up Reel (Mulch) 1-Row 2WD 75 hp 1,395 42 10 0.588 6.67 5.42 0.58 0.59 13.27 2.37 3.67 19.33 Trailer - Snap Bean 16' 2WD 75 hp 2,020 179 15 3.571 73.03 32.95 2.14 3.58 111.71 3.74 22.30 137.76 Trailer - Vegetables 16' 2WD 75 hp 2,020 200 15 0.090 1.84 0.83 0.04 0.09 2.80 0.08 0.56 3.45 Trailer Utility 10' 2WD 50 hp 1,065 200 15 0.600 6.81 3.69 0.08 0.42 11.00 0.29 2.62 13.93 Trailer Water 10' 2WD 50 hp 1,691 150 10 0.600 6.81 3.69 0.27 0.42 11.19 0.81 2.62 14.63 Trailer(MuleTrn)Corn 16' 2WD 75 hp 2,020 12 15 0.229 6.77 2.11 2.05 0.22 11.17 3.58 1.43 16.18 Trailer-Lima/B. Bean 16' 2WD 75 hp 2,020 179 15 3.571 73.03 32.95 2.14 3.58 111.71 3.74 22.30 137.76 Trailer-Southern Pea 16' 2WD 75 hp 2,020 179 15 3.571 73.03 32.95 2.14 3.58 111.71 3.74 22.30 137.76 Trailer-Sweet Potato 16' MFWD 130 2,020 12 15 0.598 6.79 9.57 5.37 1.59 23.34 9.36 9.94 42.66 ___________________________________________________________________________________________________________________________ Notes: Labor: Includes labor from Power unit plus additional labor from the implement. Total Direct: Does not include interest on operating capital.

91Appendix Table 4. Operating inputs: estimated prices, Mississippi, 2011 _______________________________________________________________________________________ ITEM NAME UNIT PRICE ITEM NAME UNIT PRICE _______________________________________________________________________________________ dollars dollars ADJUVANT Crop oil Conc. (Veg) pt 3.33 CUSTOM Contract Plt BPepper 1000pl 13.75 Custom Apply Fert acre 9.00 Custom Haul Swt. Pot acre 70.00 Custom Skid Loader-2 acre 13.63 CustomHarvest Tomato box 1.00 Fuel Skid Loader (2) acre 7.10 Scouting Sweetpotato acre 15.00 Site Prep w/Dozer acre 213.00 Trapping acre 1.00 FERTILIZER Amm Nitrate (34%) cwt 18.00 Amm. Sulfate(21%N) lb 0.14 Boron (15G Sol) lb 0.42 Calcium Nitrate lb 0.35 Fert 13-13-13 cwt 15.43 Fert 15-30-15 lb 0.23 Fert 5-20-30+S+B cwt 27.61 Lime (Spread) ton 46.00 Phosphorus(46% P205) cwt 22.00 Potash (60% K20) cwt 23.00 FUNGICIDE Basic Copper Sulfate lb 4.37 Botran 75W lb 17.88 Bravo Weather Stick pt 5.69 Cabrio oz 2.14 Captan 50 WP lb 5.62 Chaleau WDG oz 5.75 Dithane Rainshield lb 2.54 Elevate 50 WDG lb 35.55 Headline oz 2.60 Kocide lb 3.54 Kocide 2000 lb 5.12 Kocide 3000 lb 7.49 Maneb 75 DF lb 2.65 Manex qt 4.26 Manzate FL pt 4.60 Manzate Prostick lb 3.48 Mertect 340-F oz 2.43 Neem Oil pt 13.32 Nova 40W oz 4.00 Previcur Flex oz 0.65 Pristine oz 3.75 Procure 480SC oz 2.93 Quadris oz 2.52 Ridomil Gold BravoSC oz 0.72 Ridomil Gold MZ lb 12.46 Ridomil Gold SL oz 6.22 Telone II pt 2.12 Terraclor 75WP lb 6.89 Tilt oz 2.15 Topsin 4.5L oz 0.56 HERBICIDE Accent DF 75% oz 36.35 Alanap pt 4.66 Assure ll oz 1.08 Atrazine 4L pt 2.10 Basagran pt 12.16 Bicep II Magnum pt 5.29 Bicep ll pt 4.00 Command 3ME pt 15.45 Curbit EC pt 6.30 Dacthal W-75 lb 16.79 Dual II Magnum pt 13.26 Dual Magnum pt 12.64 Eptam 7E pt 4.87 Fusilade DX oz 1.46
Glyphosate 3lbs a.e. pt 1.75 Glyphosate 3lbs a.e. oz 0.11 Glystar Plus pt 1.69 Goal 2XL pt 9.58 Gramonone Inteon oz 0.25 Gramoxone Max pt 4.97 Guardsman Max pt 5.74 Lasso 4EC qt 6.60 Lorox 50 DF lb 18.23 Outlook pt 21.29 Permit 75DF oz 19.00 Poast 1.53 pt 9.47 Prefar 4E pt 7.75 Princep 4L pt 3.18 Roundup Original Max oz 0.45 Roundup Original Max pt 7.25 Roundup Power Max pt 4.14 Roundup Power Max oz 0.26 Roundup WeatherMax pt 4.43 Roundup WeatherMax oz 0.28 Sandea oz 38.45 Select 2EC oz 1.53 Solicam DF lb 22.02 Stinger oz 3.81 Strategy pt 10.02 Surflan AS qt 12.64 Treflan HFP pt 3.11 Valor SX oz 4.72 INSECTICIDE Admire Pro oz 5.57 Agri-Mek 15EC oz 2.63 Ambush 25WP lb 10.50 Asana XL oz 0.68 Assail 30 SG oz 6.66 Azatin EC oz 4.69 Brigade 2EC oz 0.94 Brigade WSB lb 21.00 Capture 2EC oz 1.50 Confirm 2F oz 1.62 Diazinon AG600 pt 5.92 Dimethoate 4EC pt 5.88 Dipel ES pt 4.56 Endosulfan 3EC pt 3.75 Gaucho 600 oz 6.56 Guthion 50WSP lb 10.19 Imidan 70 WSB lb 9.60 K-Pam HL gal 8.06 Lannate LV pt 8.81 Lorsban 15G lb 1.80 Lorsban 4E pt 6.20 Malathion 57EC pt 4.23 Malathion 5E pt 4.09 Mustang Max oz 1.30 Oberon 2SC oz 4.49 Orthene 90 S lb 3.25 Penncap-M pt 3.50 Poncho oz 0.62 Provado 1.6 oz 1.94 Pyrethrins oz 3.12 Radiant 1SC oz 4.99 Sevin XLR Plus qt 10.56 Spintor 2SC oz 5.34 Thionex 3EC pt 3.47 IRRIGATION SUPPLIES Adapter(Reg to Head) 1 1/2" 3.23 Barb Lock Sleeve 1/4" 0.45 Cost of PumpingWater 6" in 24.00 Coupler 5/8" 0.58 Drip Tape roll 147.50 (continued)

92 Appendix Table 4. Operating inputs: estimated prices, Mississippi 2011 (continued) _______________________________________________________________________________________ ITEM NAME UNIT PRICE ITEM NAME UNIT PRICE _______________________________________________________________________________________ dollars dollars End Plug for Header 1 1/2" 1.60 Feeder Tube ft 0.08 Fertigation System each 181.50 Header Line 1 1/2" ft 0.23 Hole Punch 1/4" 6.50 Hose Clamp 1 1/2" 0.70 Pressure Regulator 12 PSI 30.00 PVC Female Adaptor 1 1/2" 3.23 PVC Fitting (adpt) 1 1/2" 1.00 PVC Fitting (bush) 1 1/2" 1.94 Rural Water ac-in 75.01 Transfer Barb 1/4" 0.25 Y Filter 1" 18.00 OTHER 15g tub Bell Pepper each 7.50 5-Gal Bucket each 3.88 Bin Repair each 1.50 Bin Sweetpotato each 75.00 Bin Vegetable each 75.00 Bins/Stacking each 2.00 Box Cabbage each 2.38 Box Sweetpotato each 1.43 Box Tomato box 1.79 Boxes-Waxed each 1.62 Bushel Box each 1.44 Clean, grade, pack box 2.00 Clean, grade, pack lb 0.01 Cooling Box - Greens box 0.25 Cooling Snap Beans bu box 0.75 CoolingBox S.Cabbage box 0.25 Crate Sweetpotato each 8.00 Crates - Sweet Corn each 2.20 Grd & Pack S.Cabbage box 1.40 Hand Weeding Swt.Pot acre 20.00 Harv.Labor S.Cabbage box 1.35 Harvest Labor Melons cwt 2.00 Harvest Labor Pepper bu 0.70 Ice cwt 7.10 Ice + Cooling crate 0.70 Ice + Cooling box 0.75 Labor Clean up acre 100.00
Labor(Packing) each 0.75 Marketing Fee box 1.00 Midas 50/50 lb 9.00 Mythl Bromide 67/33 lb 5.90 Pallet Crates-1350lb each 21.78 Plastic Mulch roll 162.00 Plastic string 6000' 9.00 Sacks - S Peas each 0.36 Soil Test each 6.00 Soil Test Probe each 75.00 Sweet Potato Broker box 1.00 Sweetpotato Storage cwt 2.00 Wood Stakes 100 0.52 SEED/PLANTS Broccoli Plants thous 40.00 Broccoli - Hybrid lb 1234.00 Cabbage Plants thous 32.00 Cabbage - Hybrid lb 370.00 Collard Seed - OP lb 9.00 Collard Seed -Hybrid lb 244.00 Cucumber - Hybrid lb 107.00 Greens - Hybrid lb 105.00 Greens - OP lb 9.00 Lima Bean - Hybrid lb 4.00 Mustard Seed -Hybrid lb 24.00 Okra - Hybrid lb 187.00 Okra - OP lb 8.00 Pepper Plants 100plt 10.00 Peppers lb 3959.00 Pumpkin Seed Hybrid lb 81.00 Snap Beans - Hybrid lb 6.00 Southern Peas - OP lb 4.00 Squash - Hybrid lb 129.00 Sweet Corn - Hybrid lb 14.00 Sweetpotato Plants thous 32.00 Tomato - Hybrid lb 7252.00 Tomato Plants-Hybrid thous 112.00 Turnip - Hybrid lb 46.00 Turnip Seed - OP lb 10.00 Watermelon - Hybrid lb 1090.00 Watermelon - OP lb 27.00
________________________________________________________________________________________
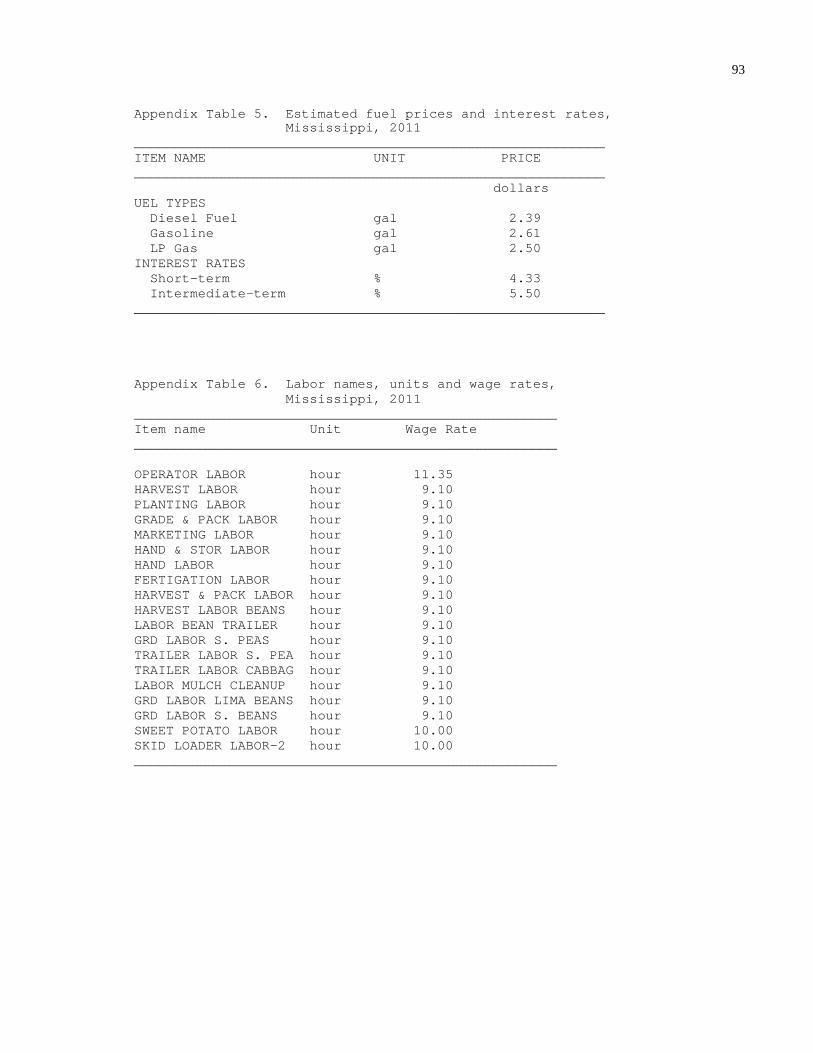
93
Appendix Table 5. Estimated fuel prices and interest rates, Mississippi, 2011 ___________________________________________________________ ITEM NAME UNIT PRICE ___________________________________________________________ dollars UEL TYPES Diesel Fuel gal 2.39 Gasoline gal 2.61 LP Gas gal 2.50 INTEREST RATES Short-term % 4.33 Intermediate-term % 5.50 ___________________________________________________________ Appendix Table 6. Labor names, units and wage rates, Mississippi, 2011 _____________________________________________________ Item name Unit Wage Rate _____________________________________________________ OPERATOR LABOR hour 11.35 HARVEST LABOR hour 9.10 PLANTING LABOR hour 9.10 GRADE & PACK LABOR hour 9.10 MARKETING LABOR hour 9.10 HAND & STOR LABOR hour 9.10 HAND LABOR hour 9.10 FERTIGATION LABOR hour 9.10 HARVEST & PACK LABOR hour 9.10 HARVEST LABOR BEANS hour 9.10 LABOR BEAN TRAILER hour 9.10 GRD LABOR S. PEAS hour 9.10 TRAILER LABOR S. PEA hour 9.10 TRAILER LABOR CABBAG hour 9.10 LABOR MULCH CLEANUP hour 9.10 GRD LABOR LIMA BEANS hour 9.10 GRD LABOR S. BEANS hour 9.10 SWEET POTATO LABOR hour 10.00 SKID LOADER LABOR-2 hour 10.00 _____________________________________________________

94
Appendix Table 7 Estimated costs per acre Drip tape irrigation system, 5 ft row spacing, 20 gpm with 8,712 ft of drip tape, Mississippi, 2011 _______________________________________________________________________ ITEM UNIT PRICE QUANTITY AMOUNT YOUR FARM _______________________________________________________________________ dollars dollars DIRECT EXPENSES IRRIGATION SUPPLIES Fertigation System each 181.50 1.0000 181.50 _________ Barb Lock Sleeve 1/4" 0.45 45.0000 20.25 _________ Transfer Barb 1/4" 0.25 45.0000 11.25 _________ Feeder Tube ft 0.08 50.0000 4.00 _________ Header Line 1 1/2" ft 0.23 300.0000 69.00 _________ Adapter(Reg to Head) 1 1/2" 3.23 1.0000 3.23 _________ End Plug for Header 1 1/2" 1.60 1.0000 1.60 _________ Hose Clamp 1 1/2" 0.70 2.0000 1.40 _________ Pressure Regulator 12 PSI 30.00 1.0000 30.00 _________ PVC Female Adaptor 1 1/2" 3.23 1.0000 3.23 _________ Y Filter 1" 18.00 1.0000 18.00 _________ PVC Fitting (bush) 1 1/2" 1.94 1.0000 1.94 _________ PVC Fitting (adpt) 1 1/2" 1.00 1.0000 1.00 _________ Hole Punch 1/4" 6.50 1.0000 6.50 _________ Coupler 5/8" 0.58 4.0000 2.32 _________ --------- TOTAL DIRECT EXPENSES 355.22 _________ FIXED EXPENSES --------- TOTAL INTEREST 19.54 _________ --------- TOTAL SPECIFIED EXPENSES 374.76 _________ _______________________________________________________________________ Note: Cost of production estimates are based on 2010 input prices. These items are grouped together and listed as Irrigation Setup on the last line of Table A and also as a fixed expense on Table B in an irrigated budget. A capital recovery charge of $374.76 will appear in the budget to represent the annual ownership cost of these items. Additional irrigation inputs(such as rural water, drip tape, and plastic mulch) are not included in this table, but are listed as individual inputs within each irrigated enterprise budget.

95
Appendix Table 8 Estimated costs per acre Drip tape irrigation system, 6 ft row spacing, 16 gpm with 7,260 ft of drip tape,Mississippi, 2011 _______________________________________________________________________ ITEM UNIT PRICE QUANTITY AMOUNT YOUR FARM _______________________________________________________________________ dollars dollars DIRECT EXPENSES IRRIGATION SUPPLIES Fertigation System each 181.50 1.0000 181.50 _________ Barb Lock Sleeve 1/4" 0.45 40.0000 18.00 _________ Transfer Barb 1/4" 0.25 40.0000 10.00 _________ Feeder Tube ft 0.08 50.0000 4.00 _________ Header Line 1 1/2" ft 0.23 300.0000 69.00 _________ Adapter(Reg to Head) 1 1/2" 3.23 1.0000 3.23 _________ End Plug for Header 1 1/2" 1.60 1.0000 1.60 _________ Hose Clamp 1 1/2" 0.70 2.0000 1.40 _________ Pressure Regulator 12 PSI 30.00 1.0000 30.00 _________ PVC Female Adaptor 1 1/2" 3.23 1.0000 3.23 _________ Y Filter 1" 18.00 1.0000 18.00 _________ PVC Fitting (bush) 1 1/2" 1.94 1.0000 1.94 _________ PVC Fitting (adpt) 1 1/2" 1.00 1.0000 1.00 _________ Hole Punch 1/4" 6.50 1.0000 6.50 _________ Coupler 5/8" 0.58 4.0000 2.32 _________ --------- TOTAL DIRECT EXPENSES 351.72 _________ FIXED EXPENSES --------- TOTAL FIXED EXPENSES 19.34 _________ --------- TOTAL SPECIFIED EXPENSES 371.06 _________ _______________________________________________________________________ Note: Cost of production estimates are based on 2010 input prices. These items are grouped together and listed as Irrigation Setup on the last line of Table A and also as a fixed expense on Table B in an irrigated budget. A capital recovery charge of $371.06 will appear in the budget to represent the annual ownership cost of these items. Additional irrigation inputs(such as rural water, drip tape, and plastic mulch) are not included in this table, but are listed as individual inputs within each irrigated enterprise budget.
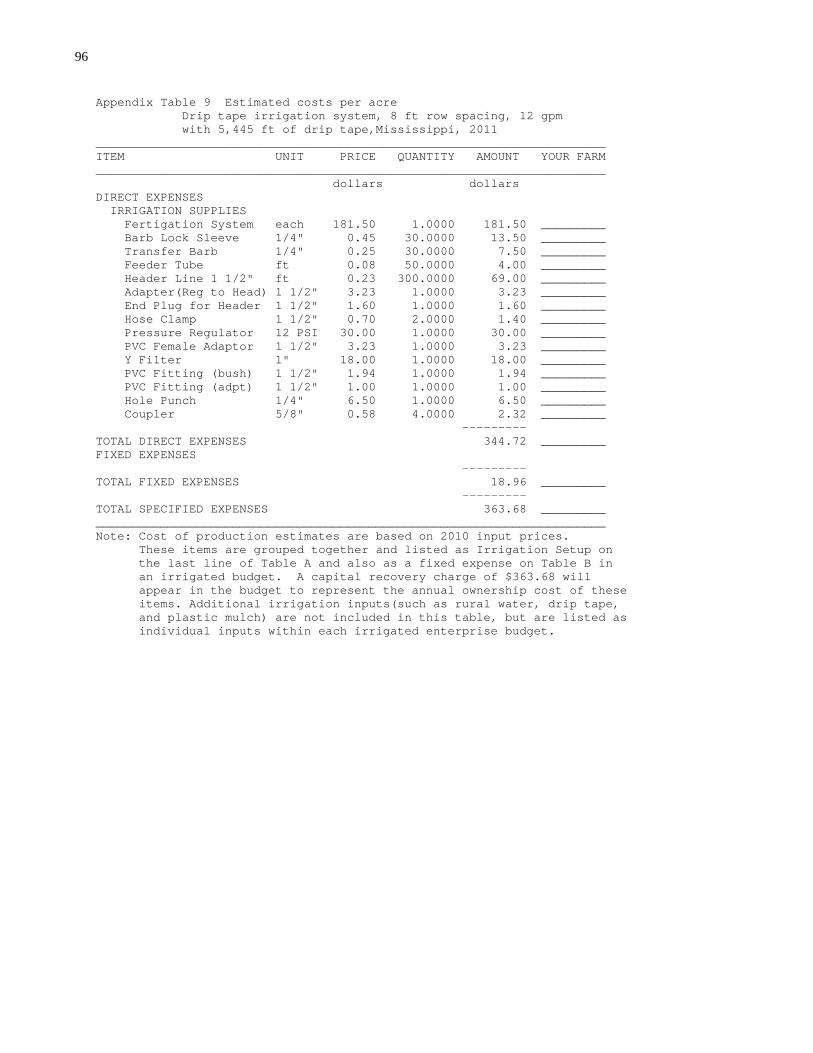
96
Appendix Table 9 Estimated costs per acre Drip tape irrigation system, 8 ft row spacing, 12 gpm with 5,445 ft of drip tape,Mississippi, 2011 _______________________________________________________________________ ITEM UNIT PRICE QUANTITY AMOUNT YOUR FARM _______________________________________________________________________ dollars dollars DIRECT EXPENSES IRRIGATION SUPPLIES Fertigation System each 181.50 1.0000 181.50 _________ Barb Lock Sleeve 1/4" 0.45 30.0000 13.50 _________ Transfer Barb 1/4" 0.25 30.0000 7.50 _________ Feeder Tube ft 0.08 50.0000 4.00 _________ Header Line 1 1/2" ft 0.23 300.0000 69.00 _________ Adapter(Reg to Head) 1 1/2" 3.23 1.0000 3.23 _________ End Plug for Header 1 1/2" 1.60 1.0000 1.60 _________ Hose Clamp 1 1/2" 0.70 2.0000 1.40 _________ Pressure Regulator 12 PSI 30.00 1.0000 30.00 _________ PVC Female Adaptor 1 1/2" 3.23 1.0000 3.23 _________ Y Filter 1" 18.00 1.0000 18.00 _________ PVC Fitting (bush) 1 1/2" 1.94 1.0000 1.94 _________ PVC Fitting (adpt) 1 1/2" 1.00 1.0000 1.00 _________ Hole Punch 1/4" 6.50 1.0000 6.50 _________ Coupler 5/8" 0.58 4.0000 2.32 _________ --------- TOTAL DIRECT EXPENSES 344.72 _________ FIXED EXPENSES --------- TOTAL FIXED EXPENSES 18.96 _________ --------- TOTAL SPECIFIED EXPENSES 363.68 _________ _______________________________________________________________________ Note: Cost of production estimates are based on 2010 input prices. These items are grouped together and listed as Irrigation Setup on the last line of Table A and also as a fixed expense on Table B in an irrigated budget. A capital recovery charge of $363.68 will appear in the budget to represent the annual ownership cost of these items. Additional irrigation inputs(such as rural water, drip tape, and plastic mulch) are not included in this table, but are listed as individual inputs within each irrigated enterprise budget.

Literature Cited
1. Agricultural Engineers Yearbook of Standards. American Society of Agricultural Engineers, St. Joseph, Michigan.
2. Boehlje, M.D. and V.R. Eidman. Farm Management. New York: John Wiley and Sons, 1984. 3. Bolton, Bill, J.B. Penn, Fred T. Cooke Jr., and Arthur M. Heagler. "Days Suitable for Fieldwork, Mississippi
River Delta Cotton Area." D.A.E. Research Report No. 384, Louisiana State University, November 1968.". 4. Budgets for Major Farm Enterprises in the Mississippi River Delta of Arkansas, Louisiana, and Mississippi."
D.A.E. Circular No. 281, Department of Agricultural Economics and Agribusiness, Agricultural Experiment Station, Louisiana State University, June 1961
5. Caillavet, DeWitt F. "An Economic Assessment of Production Alternatives Resulting From Changes in the
Machinery Complement of Representative Farms in the Delta Area of Mississippi." Master of Science Thesis, Department of Agricultural Economics, Mississippi State University, May 1984.
6. Cooke, Fred T. Jr., J.M. Anderson, and Arthur M. Heagler. "Crop Budgets and Planning Data for Major Farm
Enterprises in the Yazoo-Mississippi Delta." Mississippi Agricultural and Forestry Experiment Station Bulletin 794, July 1972.
1. Cooke, Fred T. Jr., J.M. Anderson, D.W. Parvin Jr., A.M. Heagler, Kenneth Paxton, Shelby Holders Jr., and
James G. Hamill. "Crop Budgets and Planning Data for Major Farm Enterprises in the Mississippi-Louisiana Delta, 1975." Mississippi Agricultural and Forestry Experiment Station Bulletin 834, May 1975.
8. "Corn, Grain Sorghum & Wheat 2010 Planning Budgets." Budget Report No. 2009-04, Department of
Agricultural Economics, Mississippi State University, December 2009. 9. "Costs of Producing Selected Crops in the U.S., 1974." Senate Committee Project No. 63-092, Committee on
Agriculture and Forestry, U.S. Senate, January 8, 1976. 10. "Cotton 2010 Planning Budgets." Budget Report No. 2009-02, Department of Agricultural Economics,
Mississippi State University, December 2009. 11. Cox, Laura Rebecca. "Overhead Labor Cost in the Delta Area of Mississippi." Master of Science Thesis,
Department of Agricultural Economics, Mississippi State University, October 1982. 12. "Forage 2009 Planning Budgets." Budget Report No. 2008-1, Department of Agricultural Economics,
Mississippi State University, September 2008. 13. Laughlin, David H. and Robert K. Mehrle. "An Economic Evaluation: Straight Versus Contour Levee Rice
Production Practices in Mississippi." Mississippi Agricultural and Forestry Experiment Station Bulletin 1063. December 1996.
14. Laughlin, David H. and Stan Spurlock. “User’s Guide for the Mississippi State Budget Generator Version 6.0
for Windows.” AEC Staff Report No. 2003-01, Department of Agricultural Economics, Mississippi State University, March 2003.
15. "Mississippi Agricultural Statistics." Mississippi Department of Agriculture and Commerce and Department of Agriculture, Mississippi Agriculture Statistical Service, Jackson, Mississippi.
16. "Rice 2010 Planning Budgets." Budget Report No. 2009-05, Department of Agricultural Economics,
Mississippi State University, December 2009. 17. "Soybeans 2010 Planning Budgets." Budget Report No. 2009-03, Department of Agricultural Economics,
Mississippi State University, December 2009. 18. "Vegetables 2010 Planning Budgets." Budget Report No. 2009-01, Department of Agricultural Economics,
Mississippi State University December 2009. 19. “Peanuts 2010 Planning Budgets." Budget Report No. 2009-08, Department of Agricultural Economics,
Mississippi State University, December 2009.


Mark E. Keenum, President
Division of Agriculture, Forestry, and Veterinary Medicine Gregory Bohach, Vice President
Department of Agricultural Economics
Steven C. Turner, Head Discrimination based upon race, color, religion, sex, national origin, age, disability, or veteran's status is a violation of federal and state law and MSU policy and will not be tolerated. Discrimination based upon sexual orientation or group affiliation is a violation of MSU policy and will not be tolerated.
Related Documents