Tracking Performance in the IB Diploma & CEM IBE: Student Guidance and Performance Monitoring for the IB Diploma A joint presentation from Peter Fidczuk, Dartford Grammar School and Robert Clark, Nicola Forster, CEM, Durham University

Welcome message from author
This document is posted to help you gain knowledge. Please leave a comment to let me know what you think about it! Share it to your friends and learn new things together.
Transcript
Tracking Performance in the IB Diploma
& CEM IBE: Student Guidance and Performance
Monitoring for the IB Diploma
A joint presentation from Peter Fidczuk, Dartford Grammar School and Robert Clark, Nicola Forster,
CEM, Durham University
Robert Clark, Nicola Forster CEM (Centre for Evaluation & Monitoring), Durham University
CEM IBE Student Guidance and Performance
Monitoring for the IB Diploma

Who is CEM? Centre for Evaluation & Monitoring
• Part of Durham University • Close links to School of Education • Established 1983 • Not for Profit Organisation • Nursery / Reception → Post-16 • Monitoring Systems, Research and Evaluation
Projects • UK & International • Working in Over 50 Countries • Informed by Evidence from Research
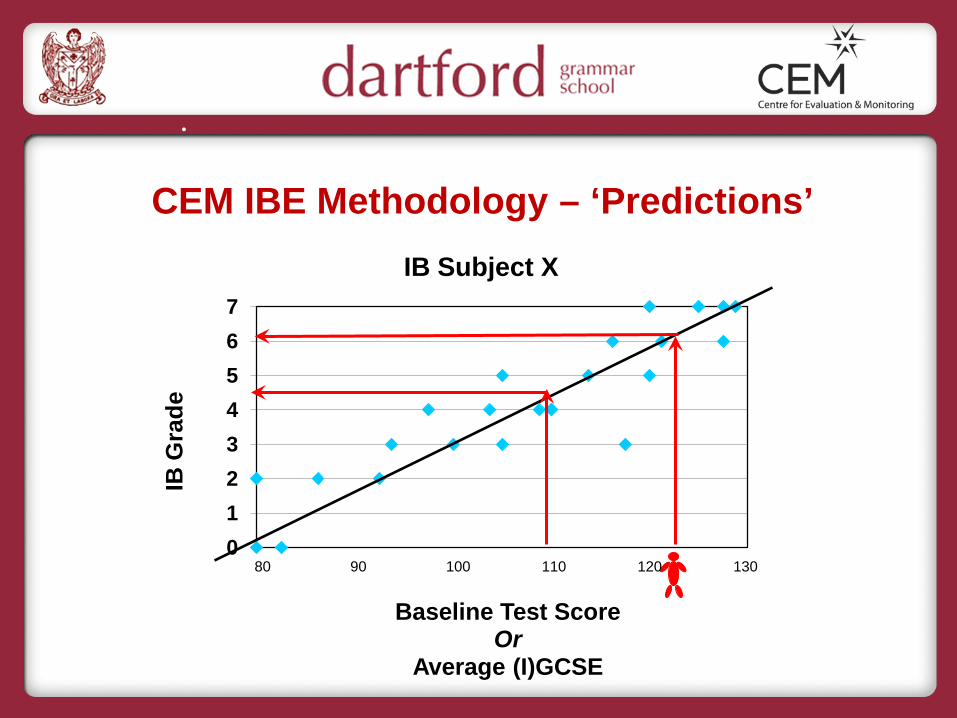
0 1 2 3 4 5 6 7
IB G
rade
Baseline Test Score Or
Average (I)GCSE
.
IB Subject X
CEM IBE Methodology – ‘Predictions’
80 90 100 110 120 130
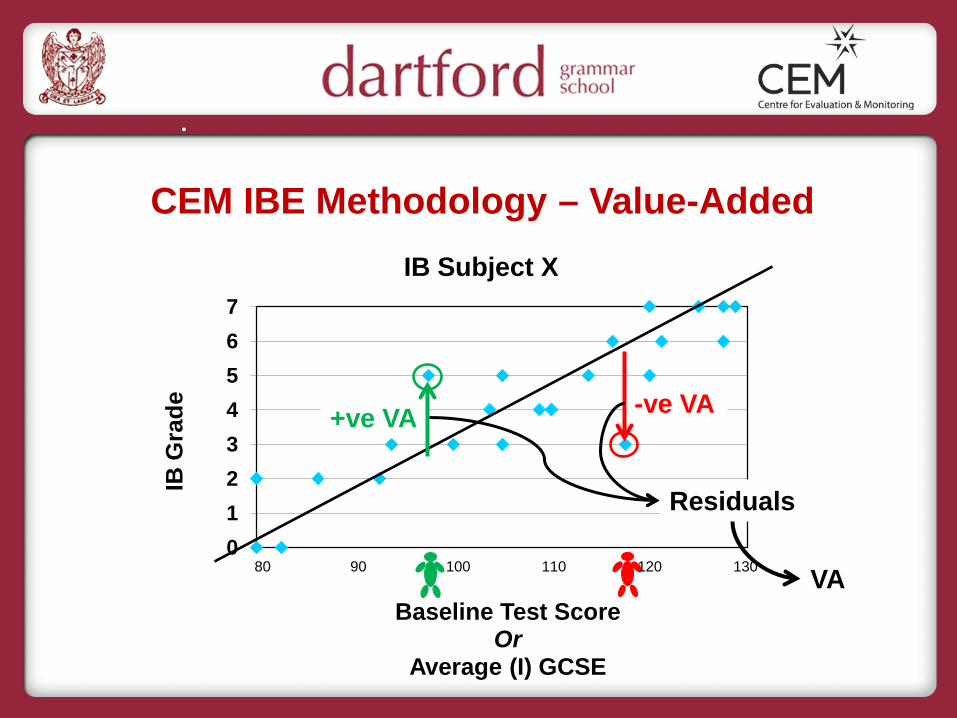
0 1 2 3 4 5 6 7
IB G
rade
Baseline Test Score Or
Average (I) GCSE
.
IB Subject X
CEM IBE Methodology – Value-Added
-ve VA +ve VA
Residuals
VA 80 90 100 110 120 130
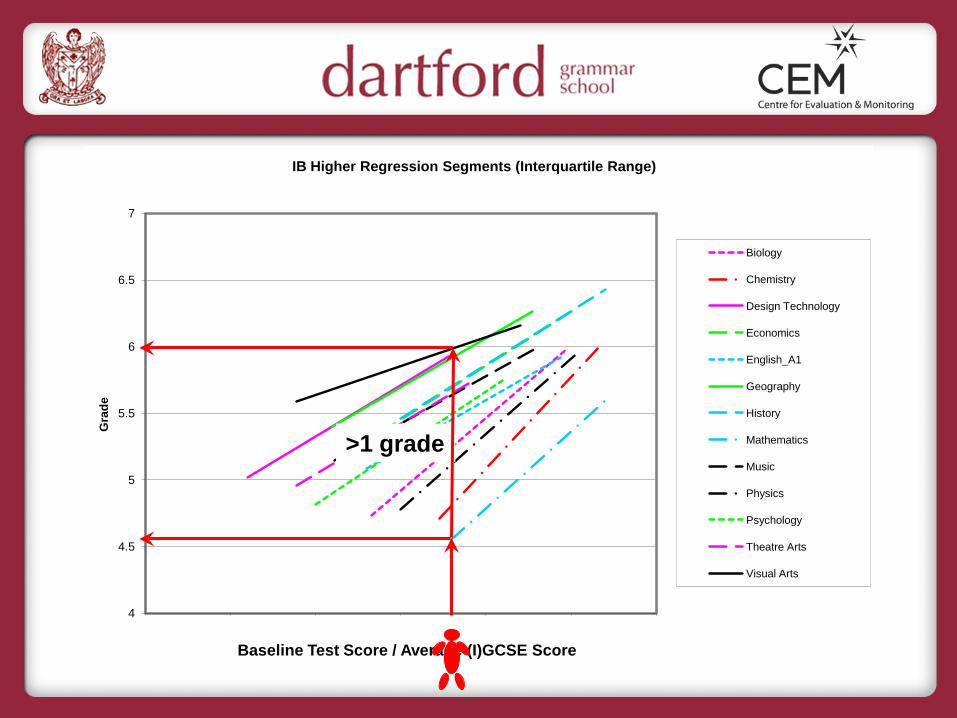
4
4.5
5
5.5
6
6.5
7
5 5.5 6 6.5 7 7.5 8
Gra
de
Average (I)GCSE Score
IB Higher Regression Segments (Interquartile Range)
Biology
Chemistry
Design Technology
Economics
English_A1
Geography
History
Mathematics
Music
Physics
Psychology
Theatre Arts
Visual Arts
>1 grade
Baseline Test Score / Average (I)GCSE Score
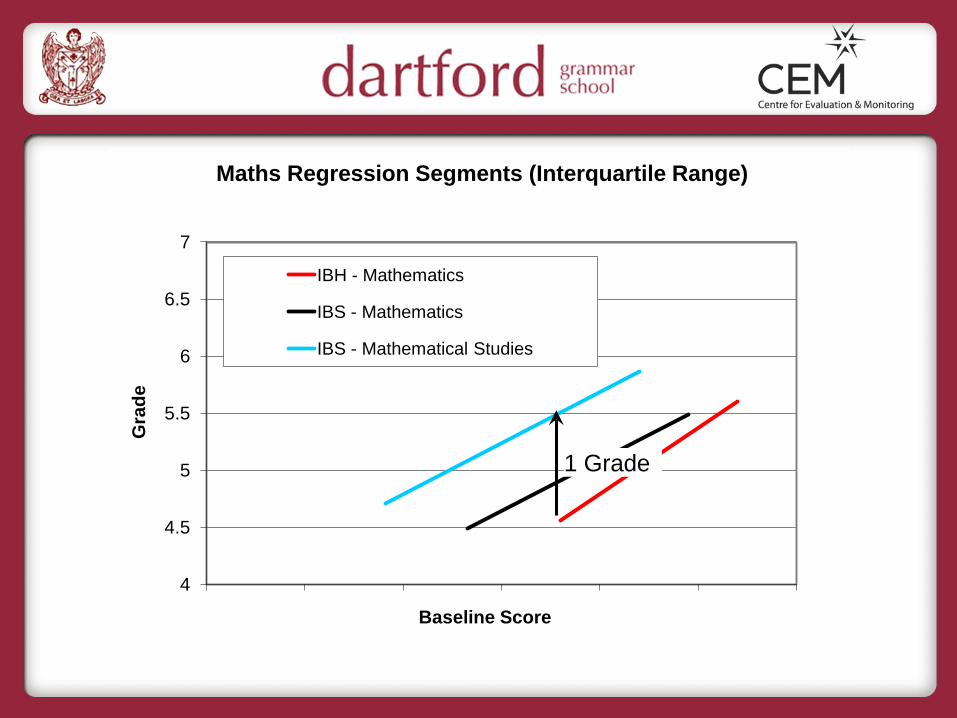
4
4.5
5
5.5
6
6.5
7
Gra
de
Baseline Score
Maths Regression Segments (Interquartile Range)
IBH - Mathematics
IBS - Mathematics
IBS - Mathematical Studies
1 Grade
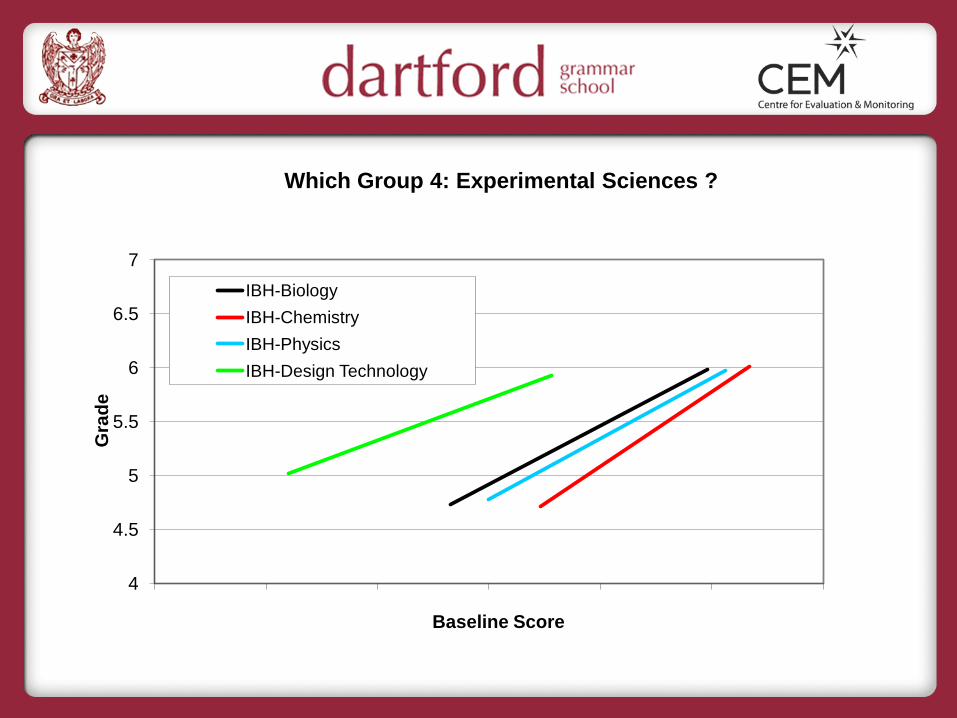
4
4.5
5
5.5
6
6.5
7
Gra
de
Baseline Score
Which Group 4: Experimental Sciences ?
IBH-Biology IBH-Chemistry IBH-Physics IBH-Design Technology
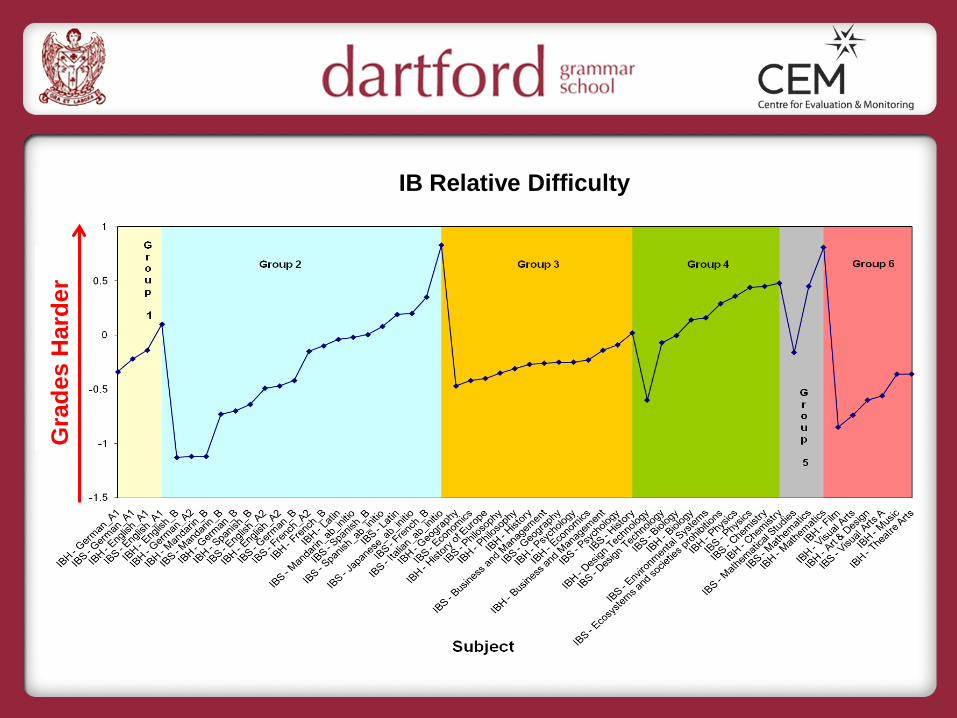
Gra
des
Har
der
IB Relative Difficulty
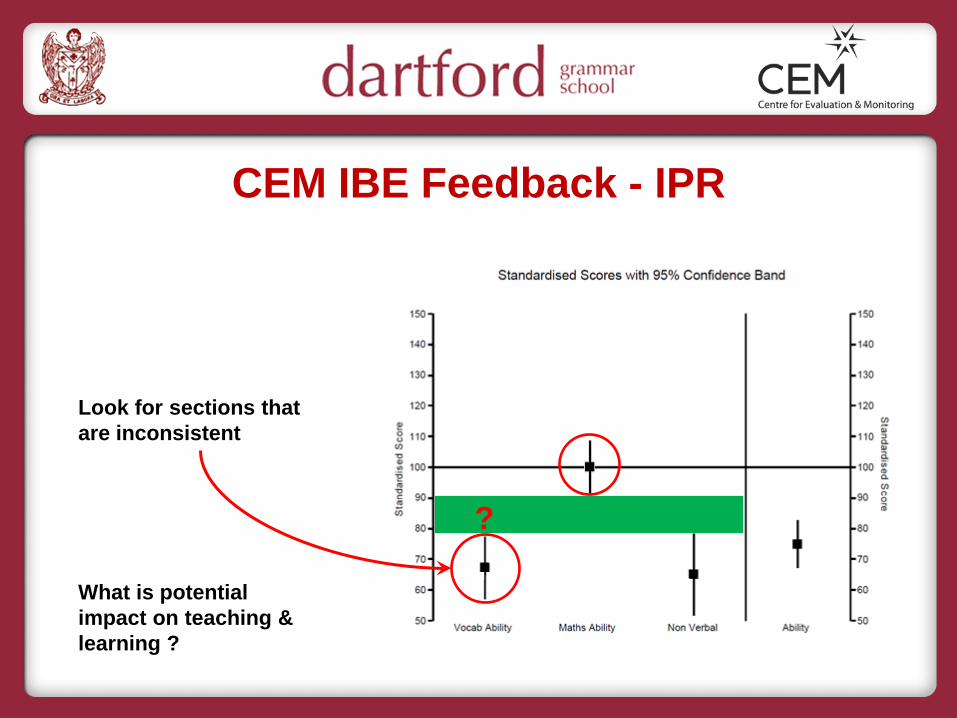
CEM IBE Feedback - IPR
?
Look for sections that are inconsistent
What is potential impact on teaching & learning ?
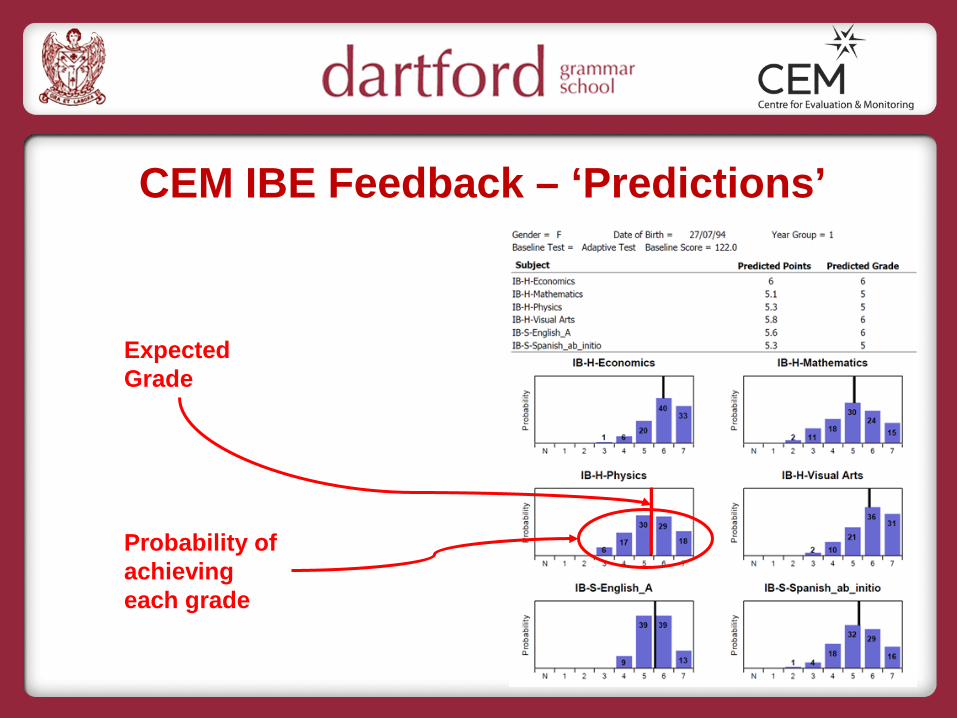
CEM IBE Feedback – ‘Predictions’
Probability of achieving each grade
Expected Grade
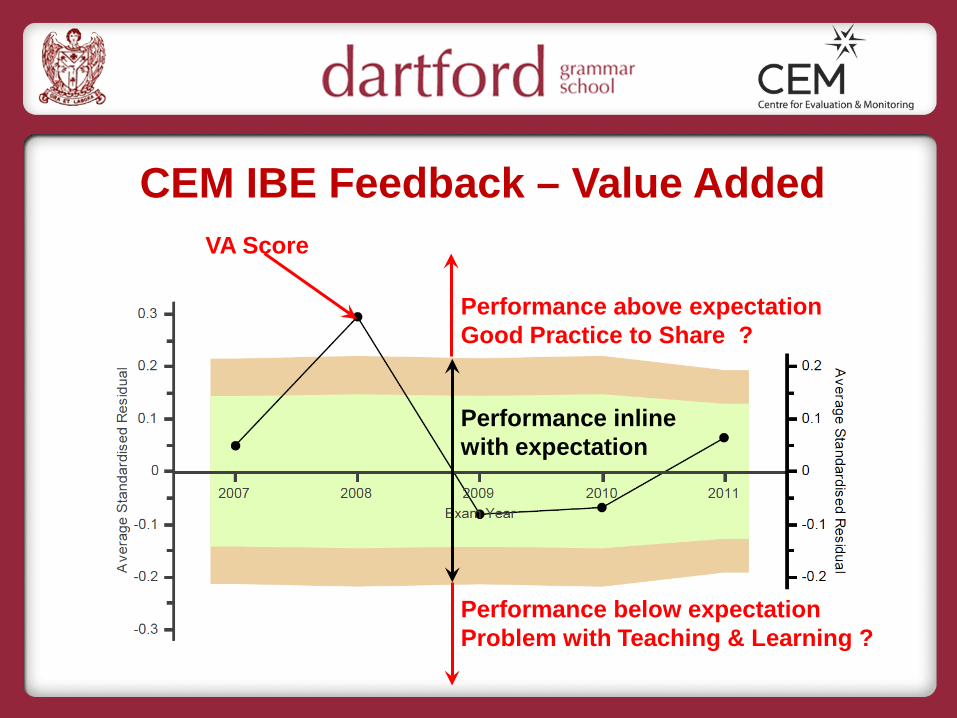
CEM IBE Feedback – Value Added
Performance inline with expectation
VA Score
Performance below expectation Problem with Teaching & Learning ?
Performance above expectation Good Practice to Share ?
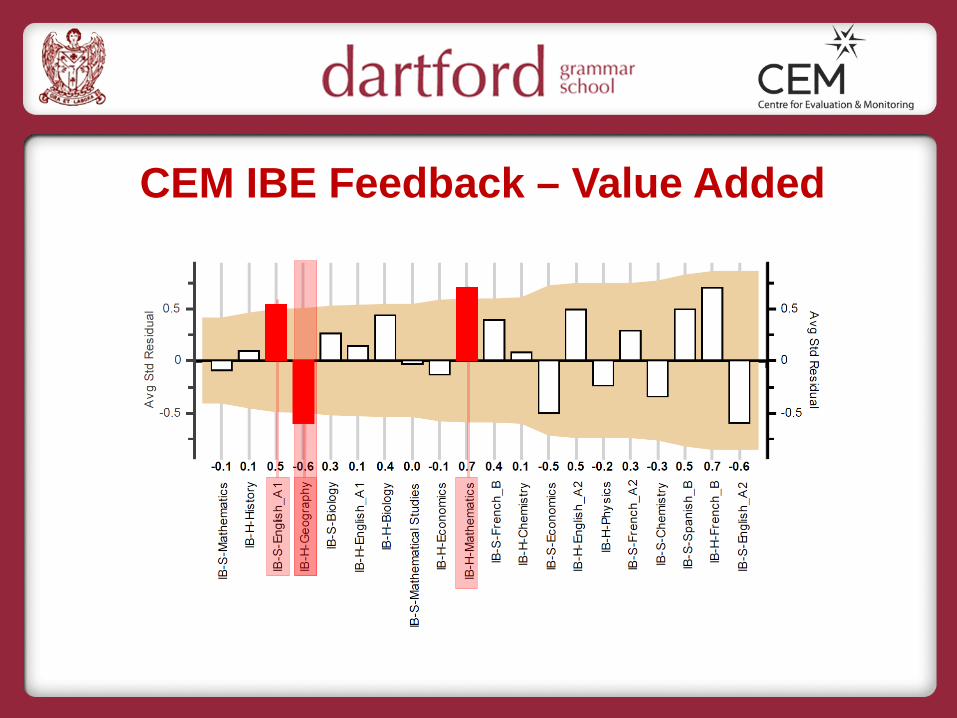
CEM IBE Feedback – Value Added
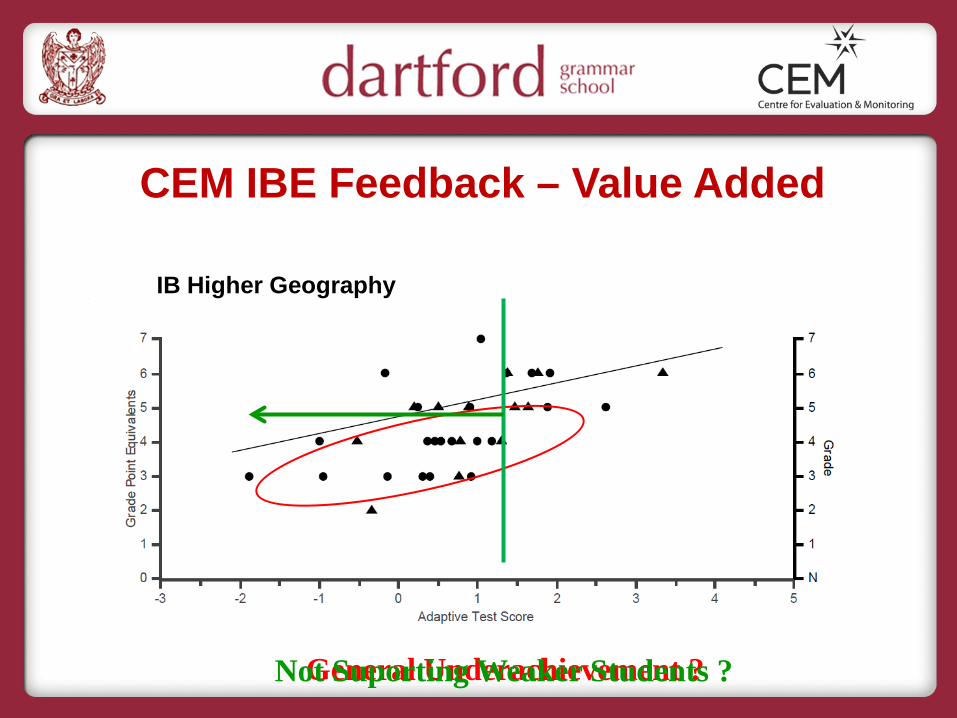
CEM IBE Feedback – Value Added
IB Higher Geography
General Underachievement ? Not Suporting Weaker Students ?
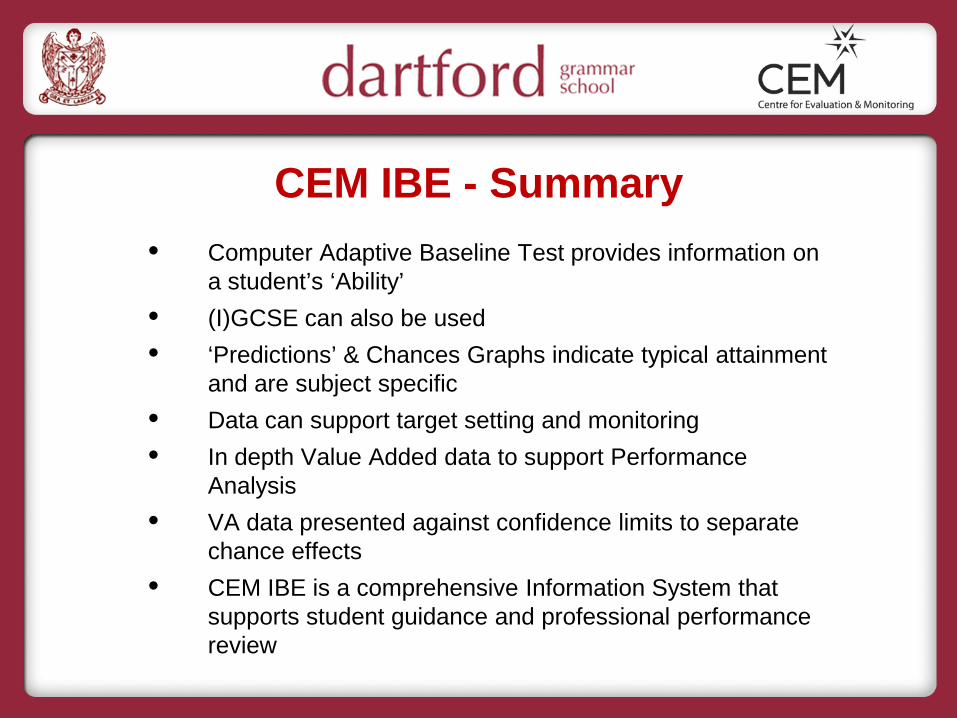
CEM IBE - Summary • Computer Adaptive Baseline Test provides information on
a student’s ‘Ability’ • (I)GCSE can also be used • ‘Predictions’ & Chances Graphs indicate typical attainment
and are subject specific • Data can support target setting and monitoring • In depth Value Added data to support Performance
Analysis • VA data presented against confidence limits to separate
chance effects • CEM IBE is a comprehensive Information System that
supports student guidance and professional performance review
Why track performance? • To inform students & parents of progress • To inform teachers if progress is as expected, and if not to
trigger an intervention • To inform the HOY if the student is performing across all
subjects • To inform the subject leader if classes are performing
satisfactorily • To inform Performance Management • To inform the SMT of the year groups’ and subjects’
performance and their contribution to the whole school target
• To develop a target for the whole year group which is realistic and which allows VA and CVA.
Methodology
• All performance tracking is based on making a prediction based on the students prior attainment – usually by taking their average GCSE attainment (APS) or by using a CAT test
• Relating this to an average outcome based on previous data which is generated national – regression equations
• This is the prediction. The target is then the prediction plus some value added
Sources of Regression Data
• DfE (GCSE APS – total IB points) • LEA • ALIS • ALPS • FFT
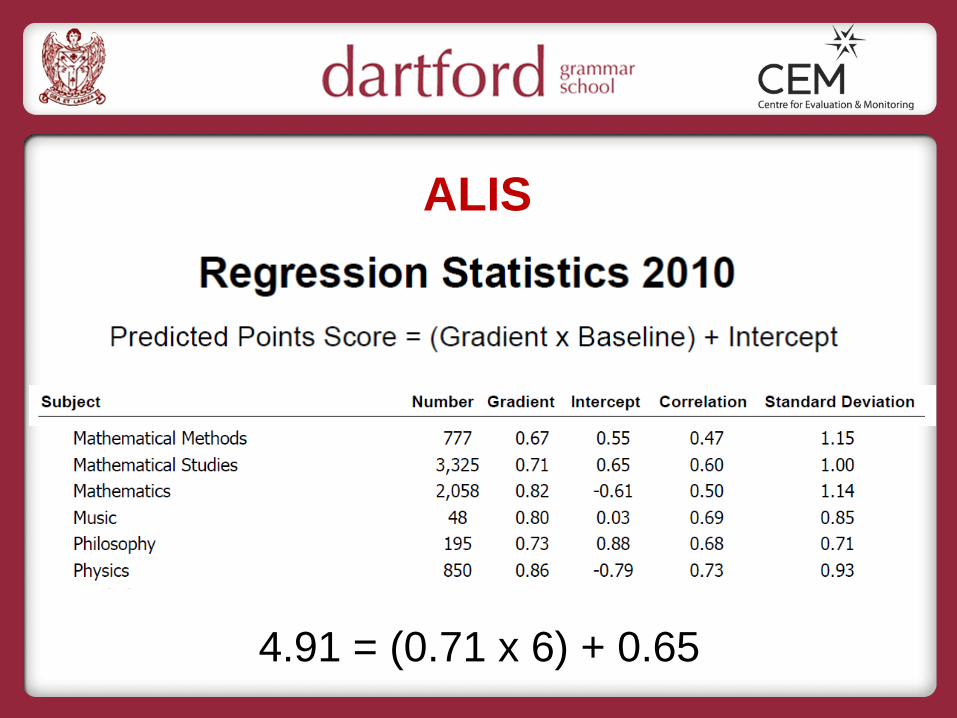
ALIS
4.91 = (0.71 x 6) + 0.65
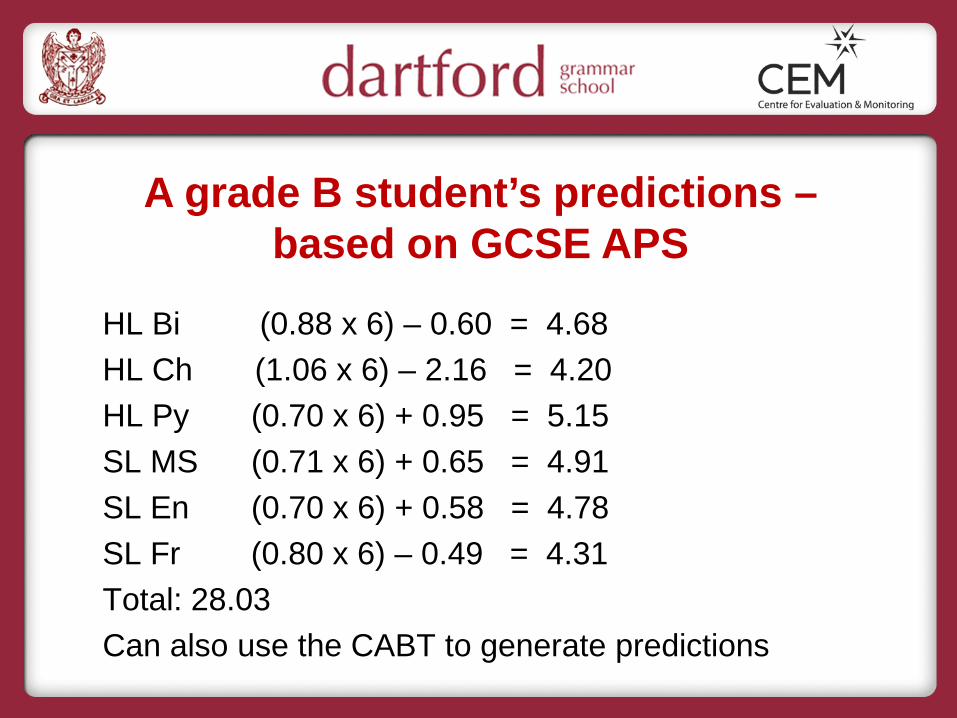
A grade B student’s predictions – based on GCSE APS
HL Bi (0.88 x 6) – 0.60 = 4.68 HL Ch (1.06 x 6) – 2.16 = 4.20 HL Py (0.70 x 6) + 0.95 = 5.15 SL MS (0.71 x 6) + 0.65 = 4.91 SL En (0.70 x 6) + 0.58 = 4.78 SL Fr (0.80 x 6) – 0.49 = 4.31 Total: 28.03 Can also use the CABT to generate predictions
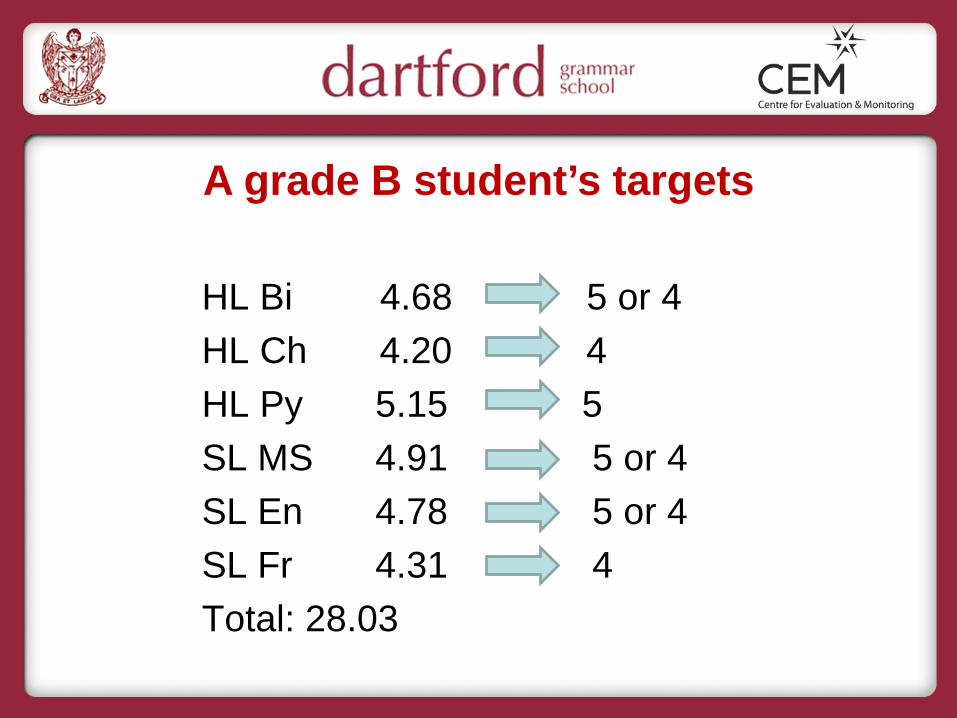
A grade B student’s targets
HL Bi 4.68 5 or 4 HL Ch 4.20 4 HL Py 5.15 5 SL MS 4.91 5 or 4 SL En 4.78 5 or 4 SL Fr 4.31 4 Total: 28.03
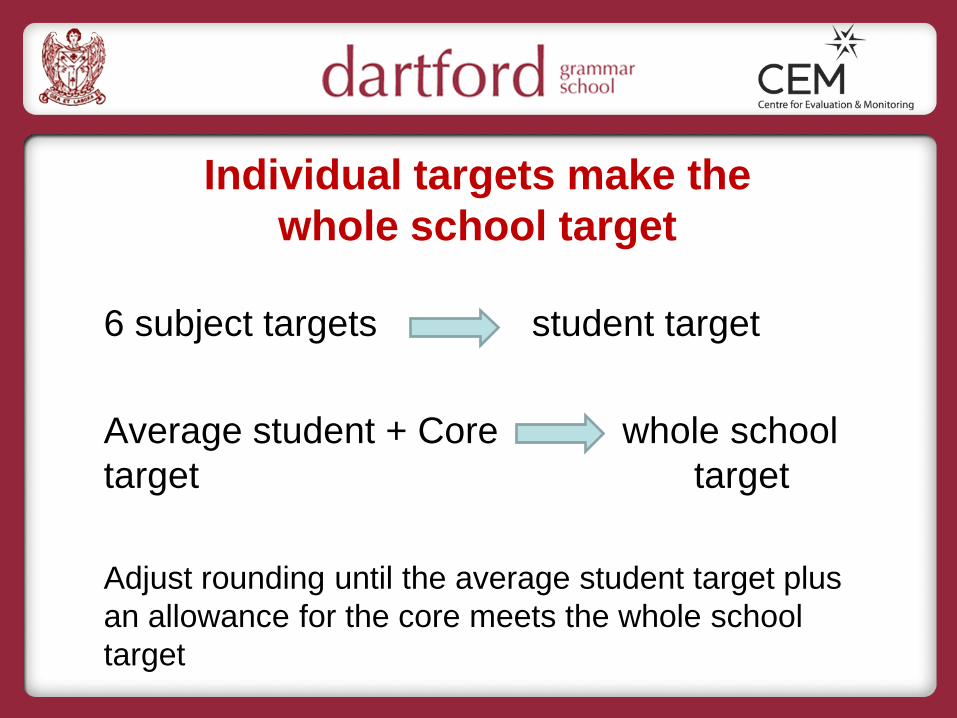
Individual targets make the whole school target
6 subject targets student target Average student + Core whole school target target Adjust rounding until the average student target plus an allowance for the core meets the whole school target
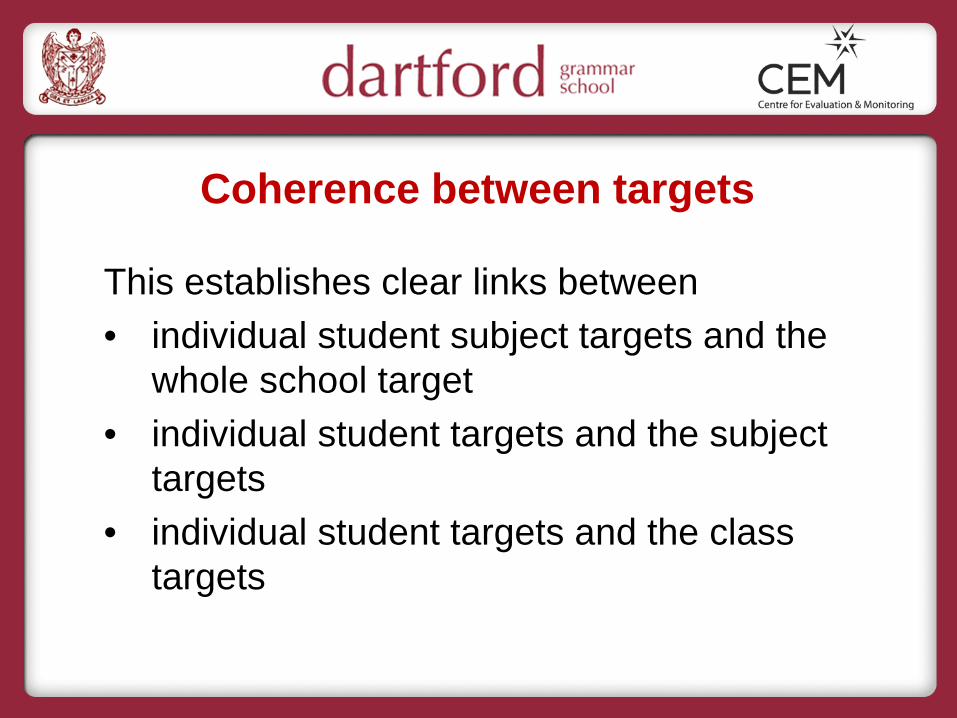
Coherence between targets
This establishes clear links between • individual student subject targets and the
whole school target • individual student targets and the subject
targets • individual student targets and the class
targets
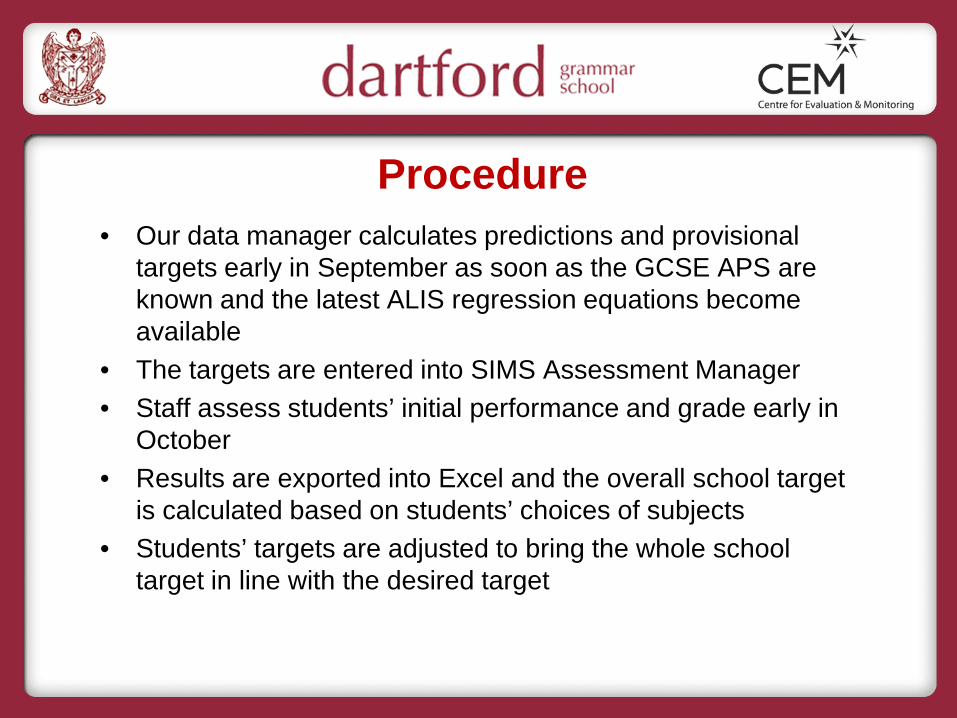
Procedure • Our data manager calculates predictions and provisional
targets early in September as soon as the GCSE APS are known and the latest ALIS regression equations become available
• The targets are entered into SIMS Assessment Manager • Staff assess students’ initial performance and grade early in
October • Results are exported into Excel and the overall school target
is calculated based on students’ choices of subjects • Students’ targets are adjusted to bring the whole school
target in line with the desired target
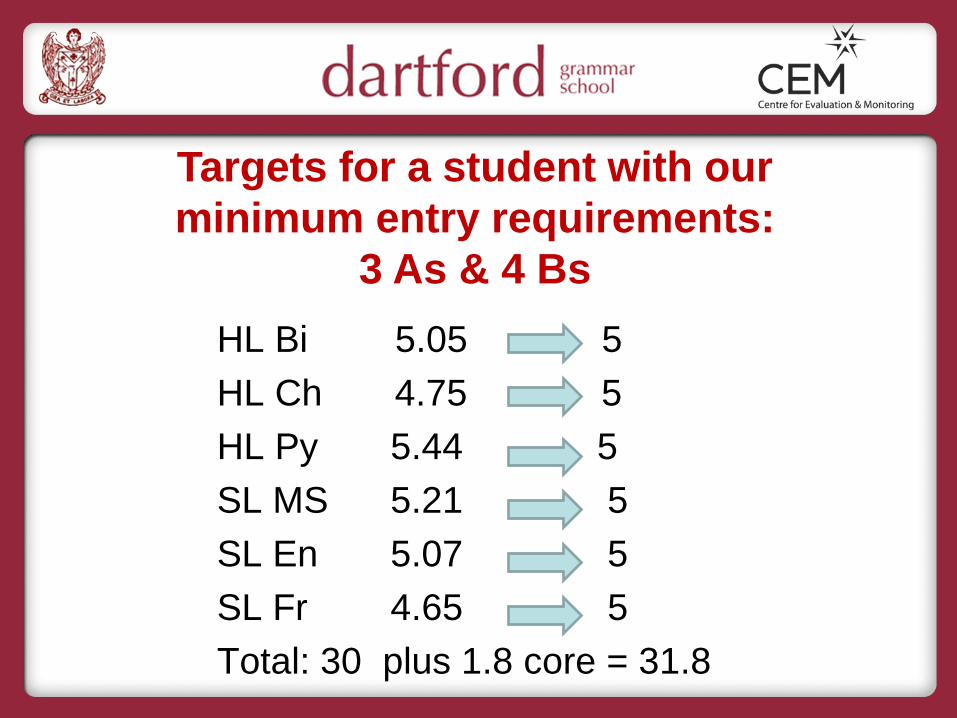
Targets for a student with our minimum entry requirements:
3 As & 4 Bs HL Bi 5.05 5 HL Ch 4.75 5 HL Py 5.44 5 SL MS 5.21 5 SL En 5.07 5 SL Fr 4.65 5 Total: 30 plus 1.8 core = 31.8
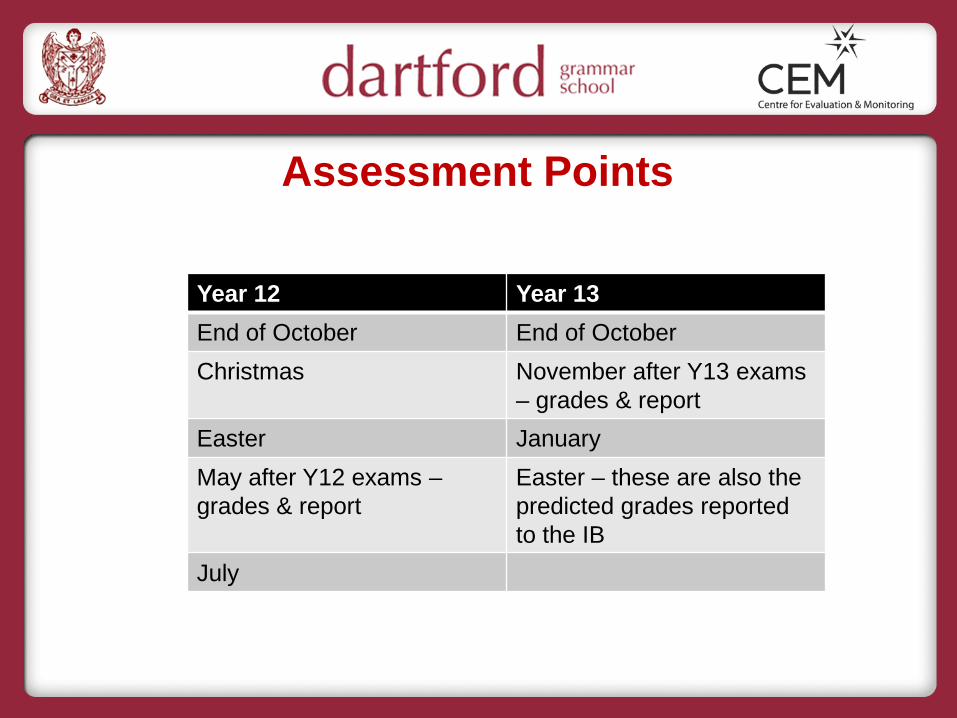
Assessment Points
Year 12 Year 13 End of October End of October Christmas November after Y13 exams
– grades & report Easter January May after Y12 exams – grades & report
Easter – these are also the predicted grades reported to the IB
July
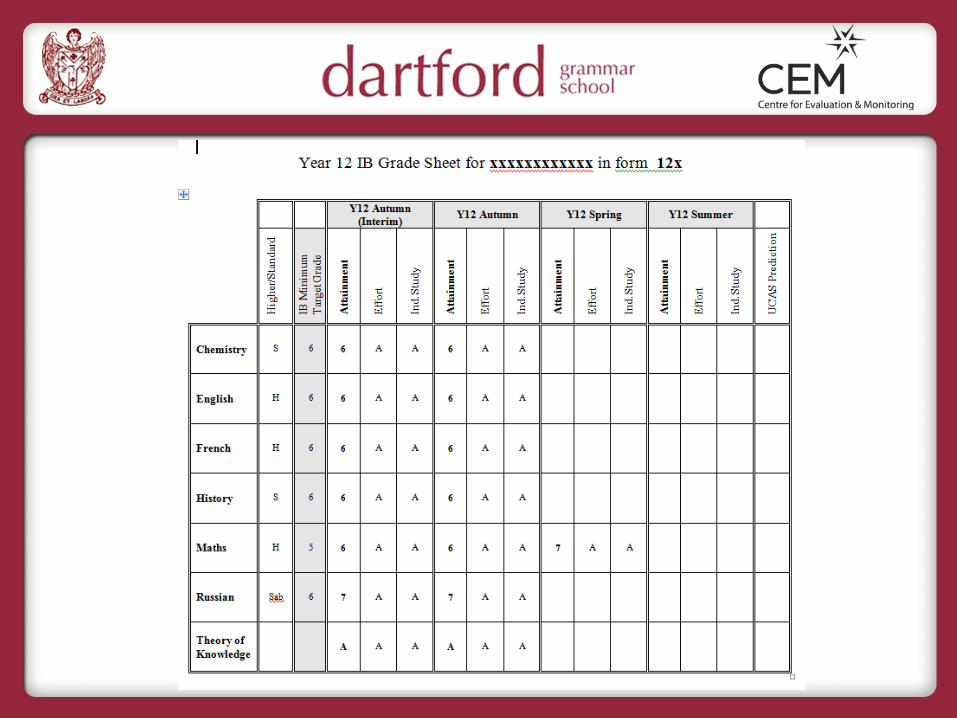
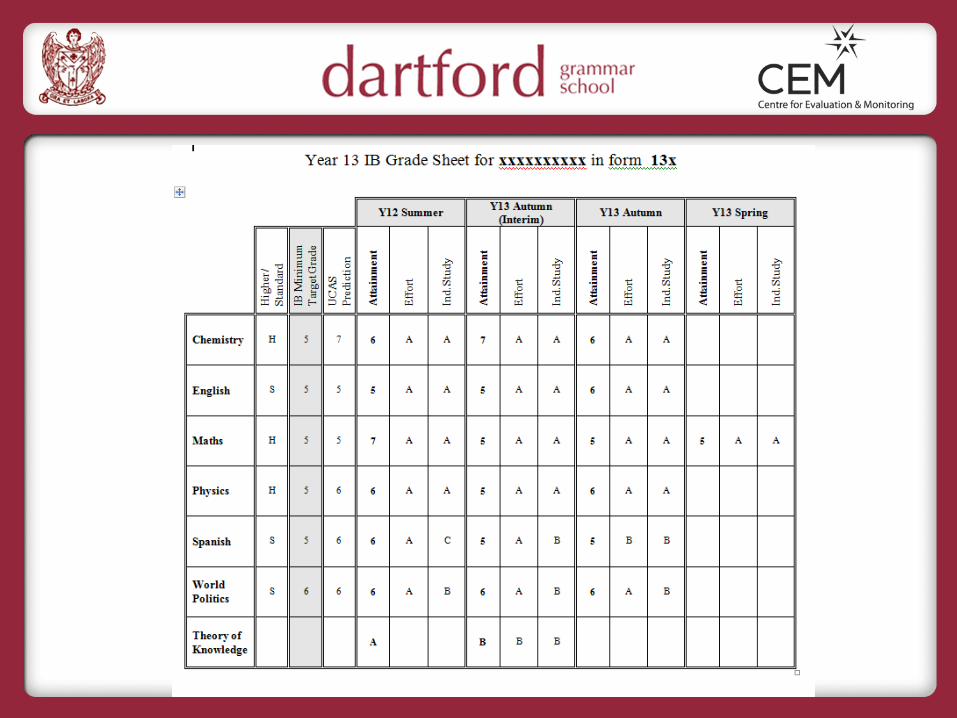
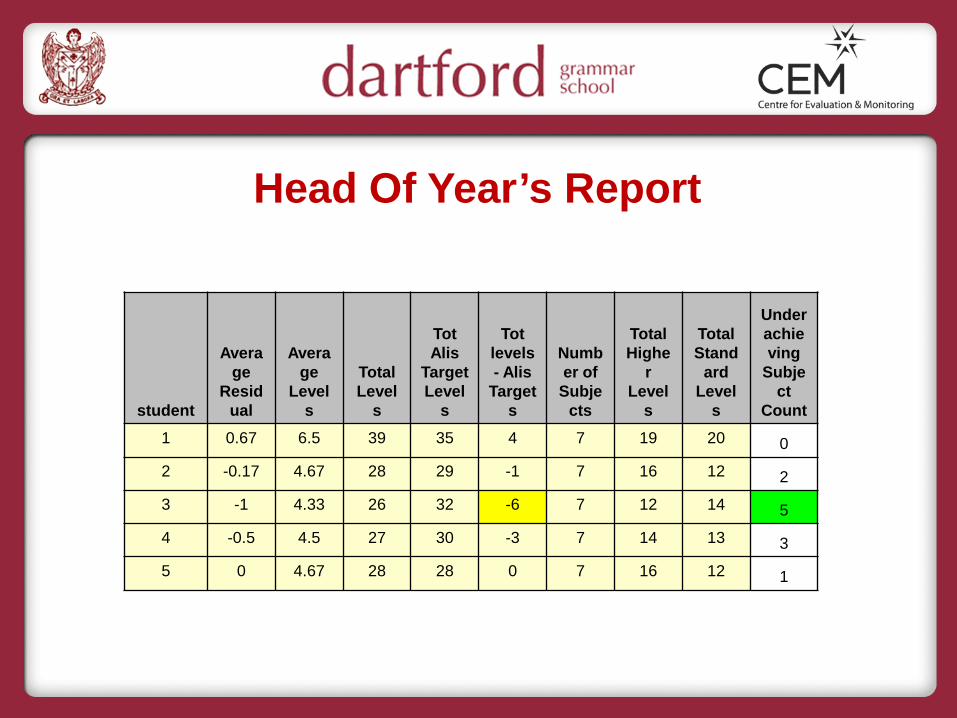
Head Of Year’s Report
student
Average
Residual
Average
Levels
Total Level
s
Tot Alis
Target Level
s
Tot levels - Alis
Targets
Number of
Subjects
Total Highe
r Level
s
Total Stand
ard Level
s
Underachieving
Subject
Count 1 0.67 6.5 39 35 4 7 19 20 0
2 -0.17 4.67 28 29 -1 7 16 12 2
3 -1 4.33 26 32 -6 7 12 14 5
4 -0.5 4.5 27 30 -3 7 14 13 3
5 0 4.67 28 28 0 7 16 12 1
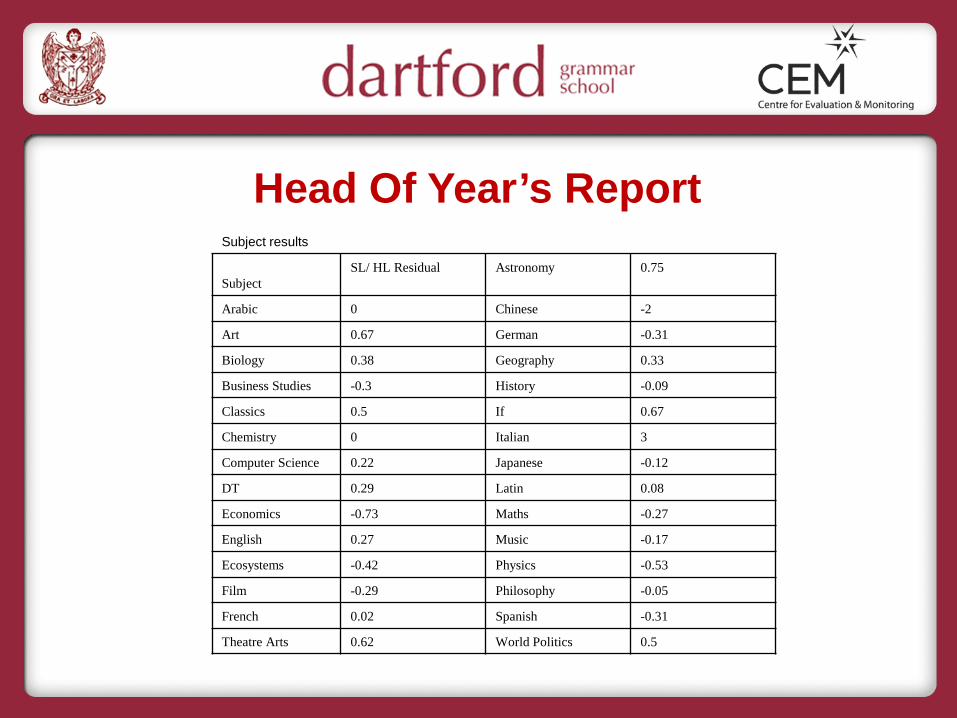
Head Of Year’s Report Subject results
Subject
SL/ HL Residual Astronomy 0.75
Arabic 0 Chinese -2
Art 0.67 German -0.31
Biology 0.38 Geography 0.33
Business Studies -0.3 History -0.09
Classics 0.5 If 0.67
Chemistry 0 Italian 3
Computer Science 0.22 Japanese -0.12
DT 0.29 Latin 0.08
Economics -0.73 Maths -0.27
English 0.27 Music -0.17
Ecosystems -0.42 Physics -0.53
Film -0.29 Philosophy -0.05
French 0.02 Spanish -0.31
Theatre Arts 0.62 World Politics 0.5
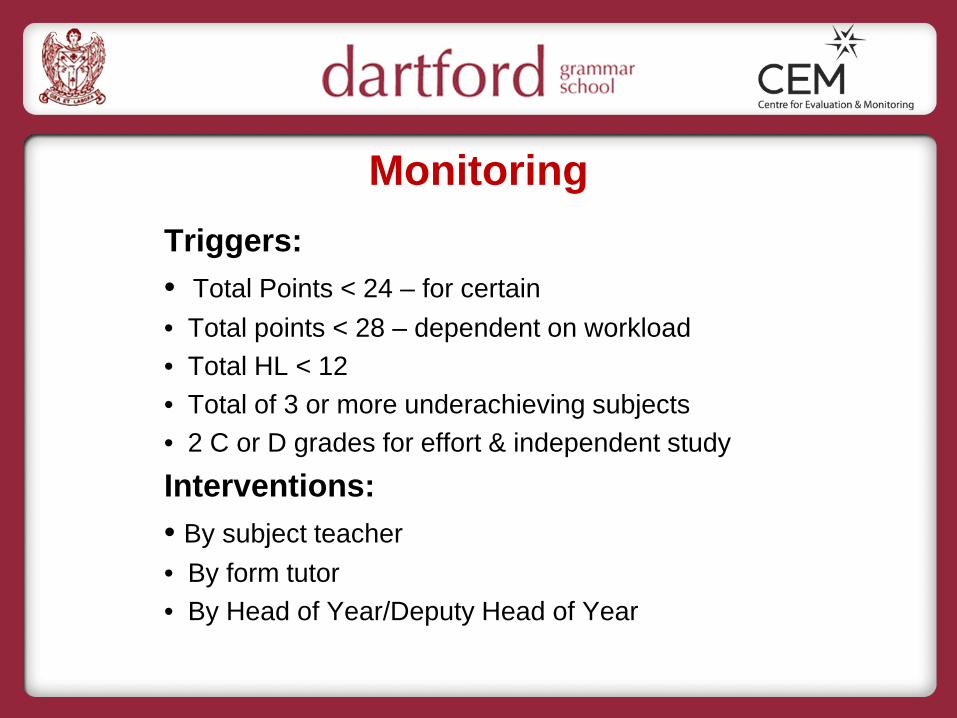
Monitoring Triggers: • Total Points < 24 – for certain • Total points < 28 – dependent on workload • Total HL < 12 • Total of 3 or more underachieving subjects • 2 C or D grades for effort & independent study
Interventions: • By subject teacher • By form tutor • By Head of Year/Deputy Head of Year
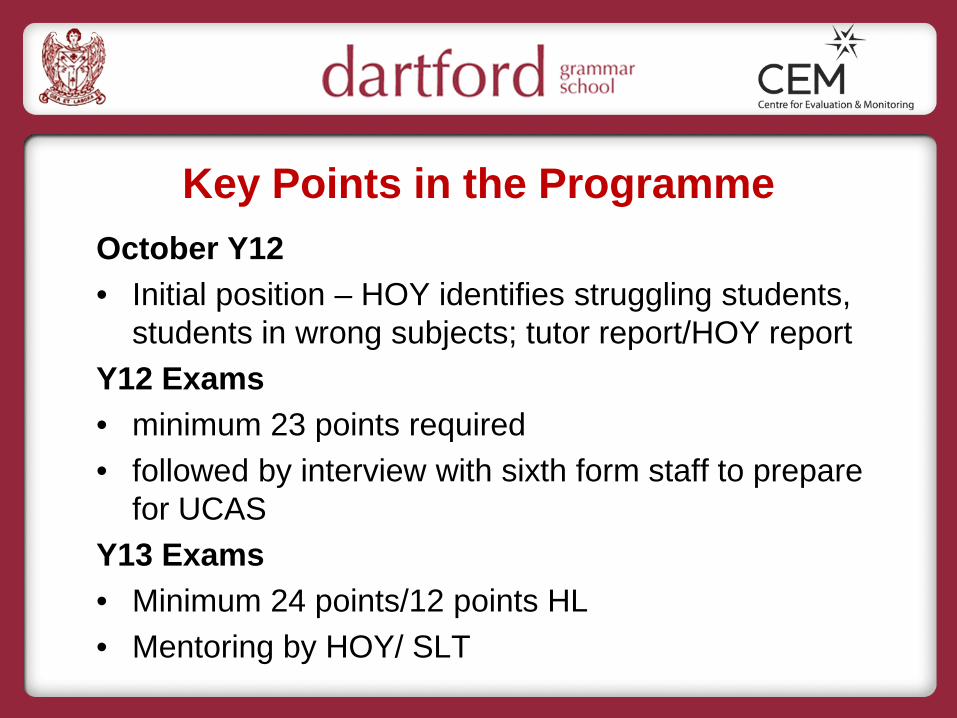
Key Points in the Programme October Y12 • Initial position – HOY identifies struggling students,
students in wrong subjects; tutor report/HOY report Y12 Exams • minimum 23 points required • followed by interview with sixth form staff to prepare
for UCAS Y13 Exams • Minimum 24 points/12 points HL • Mentoring by HOY/ SLT
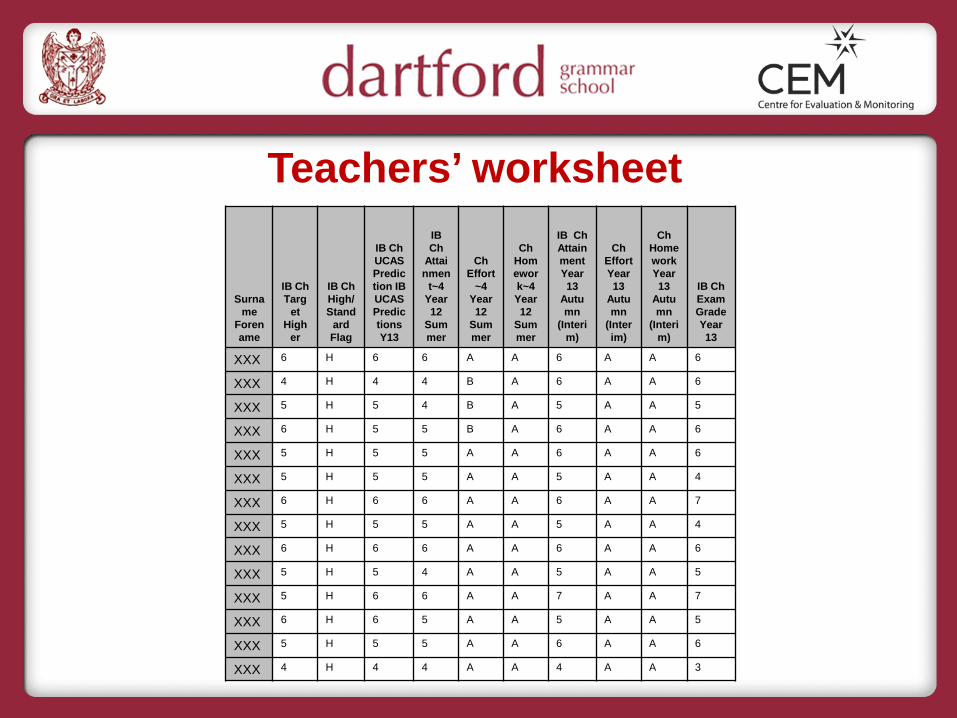
Teachers’ worksheet
Surname
Forename
IB Ch Targ
et High
er
IB Ch High/Stand
ard Flag
IB Ch UCAS Prediction IB UCAS Predictions Y13
IB Ch
Attainmen
t~4 Year 12
Summer
Ch Effort
~4 Year 12
Summer
Ch Homework~4 Year 12
Summer
IB Ch Attainment Year 13
Autumn
(Interim)
Ch Effort Year 13
Autumn
(Interim)
Ch Homework Year 13
Autumn
(Interim)
IB Ch Exam Grade Year 13
XXX 6 H 6 6 A A 6 A A 6
XXX 4 H 4 4 B A 6 A A 6
XXX 5 H 5 4 B A 5 A A 5
XXX 6 H 5 5 B A 6 A A 6
XXX 5 H 5 5 A A 6 A A 6
XXX 5 H 5 5 A A 5 A A 4
XXX 6 H 6 6 A A 6 A A 7
XXX 5 H 5 5 A A 5 A A 4
XXX 6 H 6 6 A A 6 A A 6
XXX 5 H 5 4 A A 5 A A 5
XXX 5 H 6 6 A A 7 A A 7
XXX 6 H 6 5 A A 5 A A 5
XXX 5 H 5 5 A A 6 A A 6
XXX 4 H 4 4 A A 4 A A 3
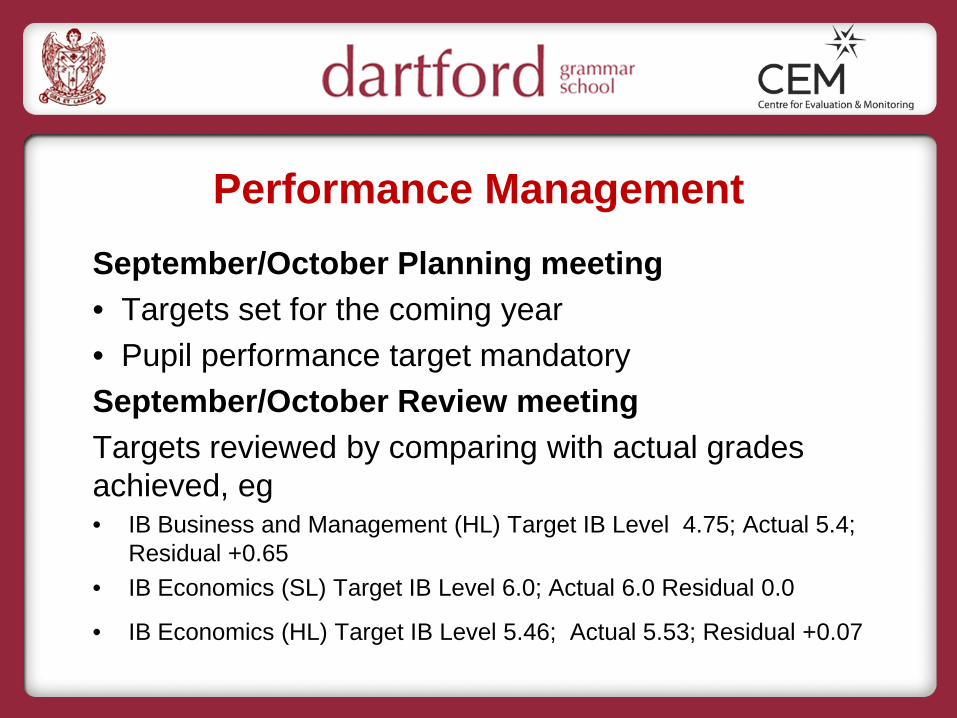
Performance Management September/October Planning meeting • Targets set for the coming year • Pupil performance target mandatory September/October Review meeting Targets reviewed by comparing with actual grades achieved, eg • IB Business and Management (HL) Target IB Level 4.75; Actual 5.4;
Residual +0.65 • IB Economics (SL) Target IB Level 6.0; Actual 6.0 Residual 0.0
• IB Economics (HL) Target IB Level 5.46; Actual 5.53; Residual +0.07
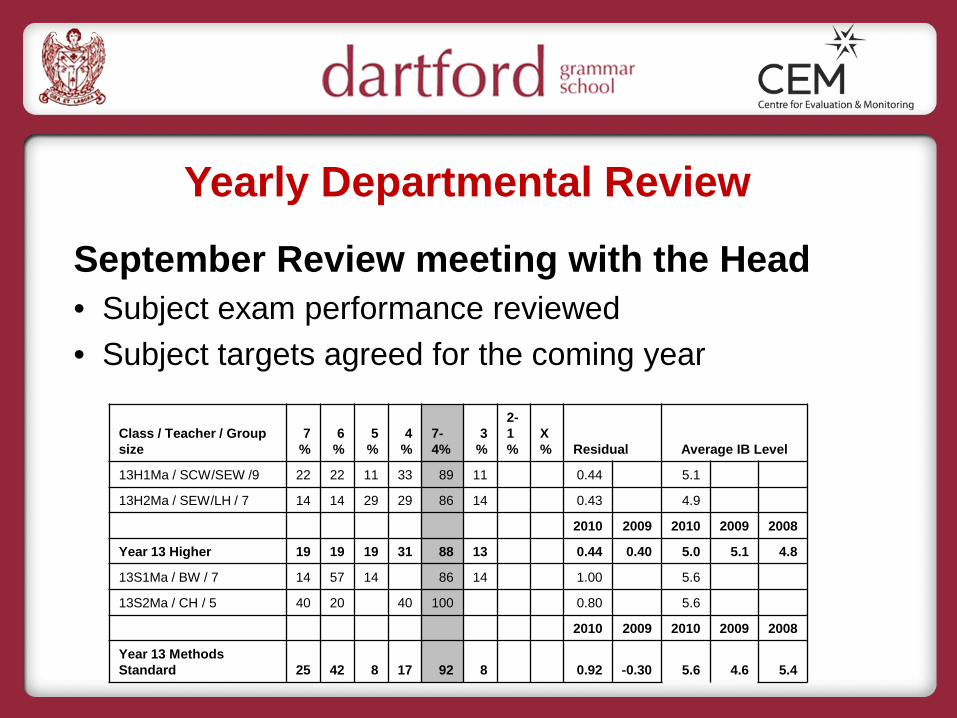
Yearly Departmental Review
September Review meeting with the Head • Subject exam performance reviewed • Subject targets agreed for the coming year
Class / Teacher / Group size
7%
6%
5%
4%
7-4%
3%
2-1%
X% Residual Average IB Level
13H1Ma / SCW/SEW /9 22 22 11 33 89 11 0.44 5.1
13H2Ma / SEW/LH / 7 14 14 29 29 86 14 0.43 4.9
2010 2009 2010 2009 2008
Year 13 Higher 19 19 19 31 88 13 0.44 0.40 5.0 5.1 4.8
13S1Ma / BW / 7 14 57 14 86 14 1.00 5.6
13S2Ma / CH / 5 40 20 40 100 0.80 5.6
2010 2009 2010 2009 2008
Year 13 Methods Standard 25 42 8 17 92 8 0.92 -0.30 5.6 4.6 5.4
LG Faculty Review
2 year cycle – current focus Y11 and the Diploma • Attainment – in comparison with targets • Lesson Observations • Teacher feedback • Student feedback – do students know
their targets?
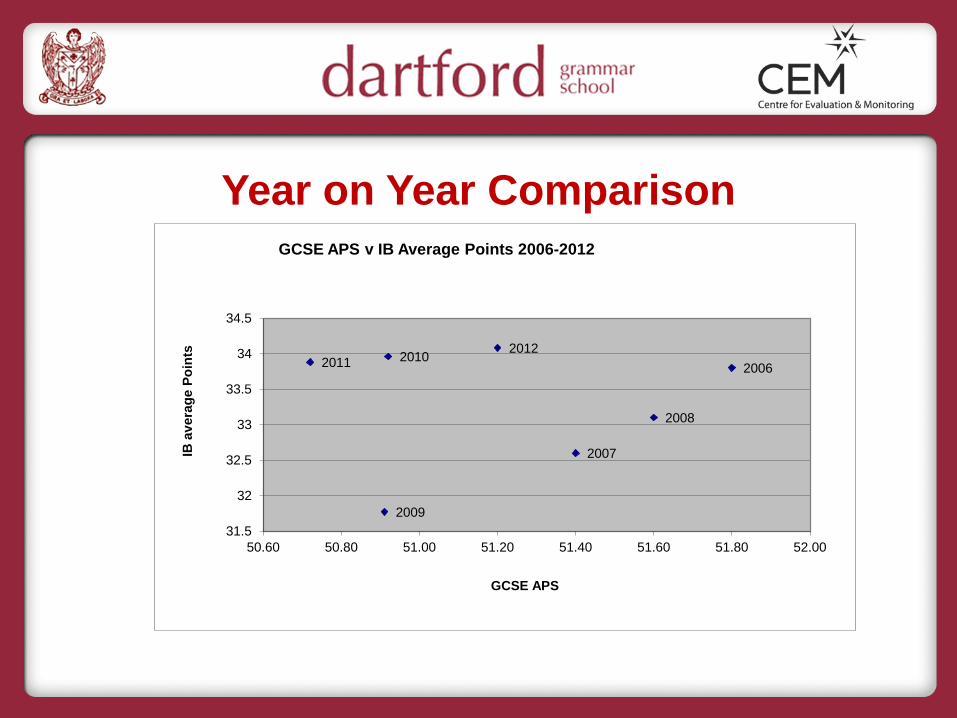
Year on Year Comparison
2006
2007
2008
2009
2010 2011 2012
31.5
32
32.5
33
33.5
34
34.5
50.60 50.80 51.00 51.20 51.40 51.60 51.80 52.00
IB a
vera
ge P
oint
s
GCSE APS
GCSE APS v IB Average Points 2006-2012
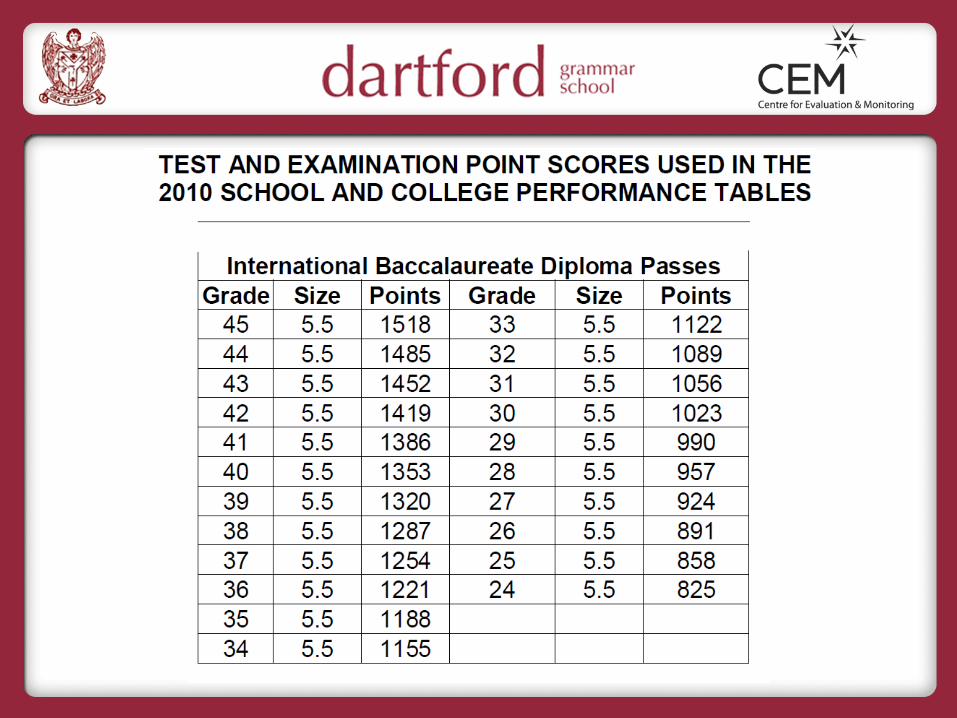
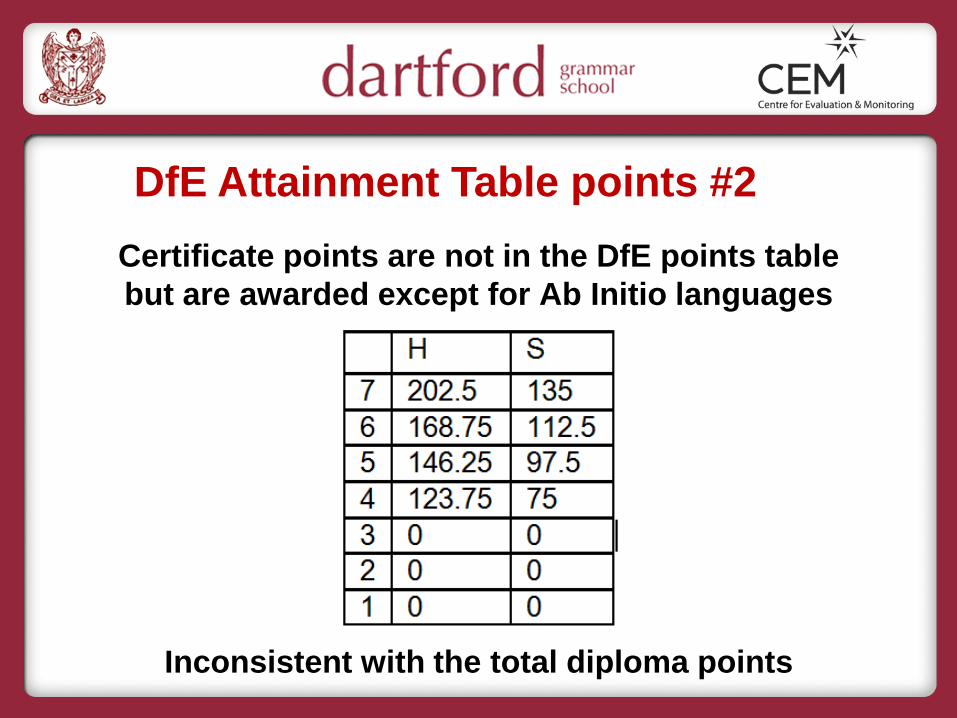
DfE Attainment Table points #2 Certificate points are not in the DfE points table but are awarded except for Ab Initio languages
Inconsistent with the total diploma points
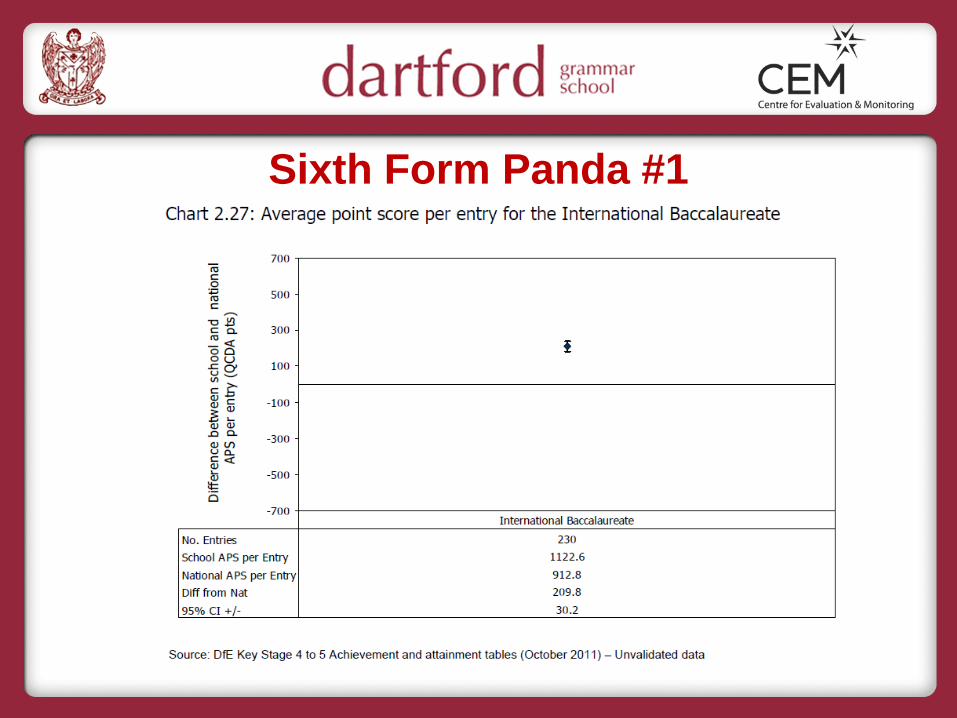
Sixth Form Panda #1
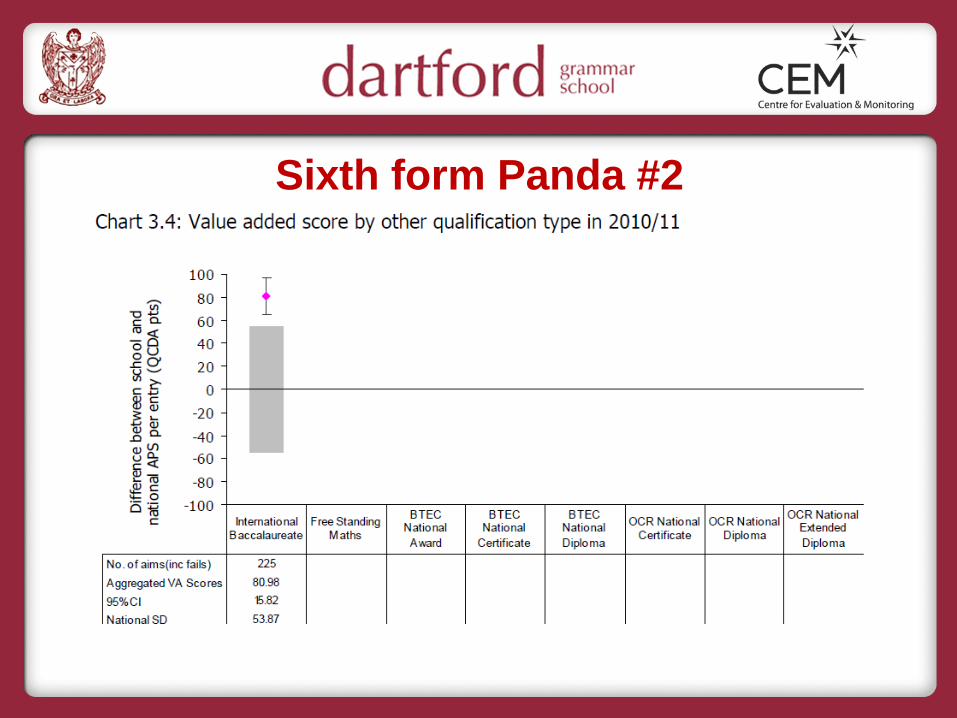
Sixth form Panda #2
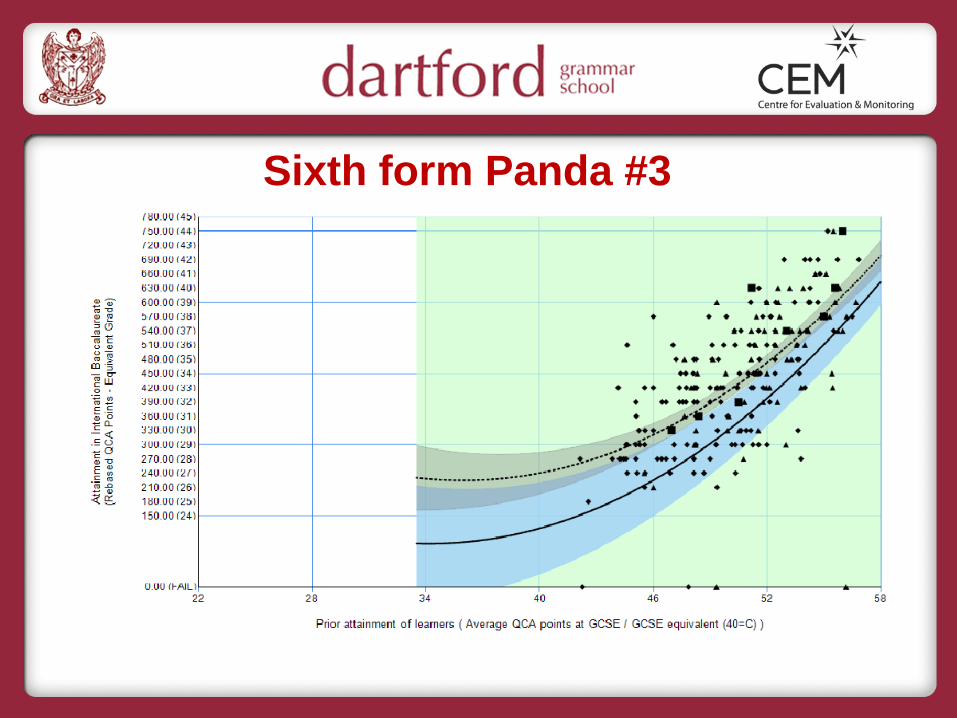
Sixth form Panda #3
Related Documents