Tirol Werbung / Tourismus Netzwerk FACTS AND FIGURES 2018 1 Tourism in Tirol Facts and Figures 2018

Welcome message from author
This document is posted to help you gain knowledge. Please leave a comment to let me know what you think about it! Share it to your friends and learn new things together.
Transcript
Tirol Werbung / Tourismus Netzwerk FACTS AND FIGURES 2018 1
Tourism in TirolFacts and Figures 2018
Tirol Werbung / Tourismus Netzwerk FACTS AND FIGURES 2018 2
Inhalt
1. Arrivals and overnight stays in Tirol 3
2. Markets of origin 9
3. Tourism associations and municipalities 16
4. Accommodation 20
5. Alpine competitors at a glance 27
6. Economic importance of tourism in Tirol 31
7. Reasons for visiting Tirol 35

Tirol Werbung / Tourismus Netzwerk FACTS AND FIGURES 2018 3
Arrivals and overnight stays in Tirol
Tirol Werbung / Tourismus Netzwerk FACTS AND FIGURES 2018 4
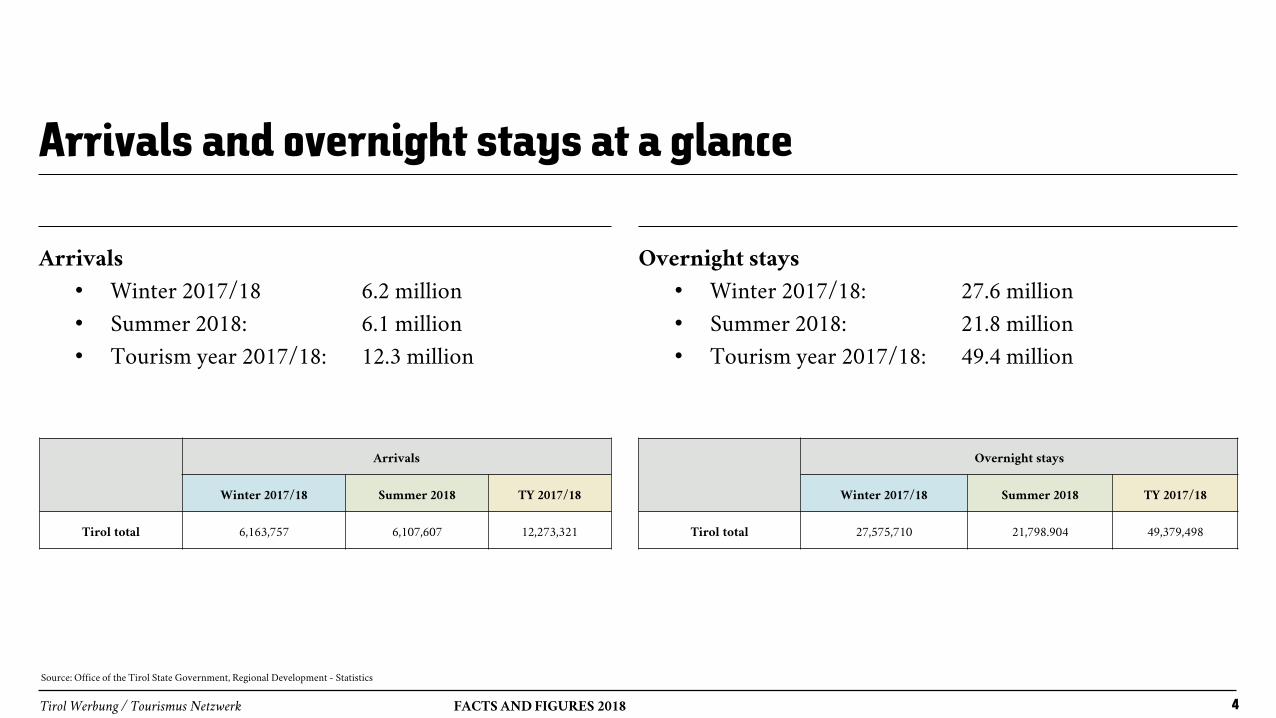
Arrivals and overnight stays at a glance
Arrivals
• Winter 2017/18 6.2 million
• Summer 2018: 6.1 million
• Tourism year 2017/18: 12.3 million
Overnight stays
• Winter 2017/18: 27.6 million
• Summer 2018: 21.8 million
• Tourism year 2017/18: 49.4 million
Source: Office of the Tirol State Government, Regional Development - Statistics
Overnight stays
Winter 2017/18 Summer 2018 TY 2017/18
Tirol total 27,575,710 21,798.904 49,379,498
Arrivals
Winter 2017/18 Summer 2018 TY 2017/18
Tirol total 6,163,757 6,107,607 12,273,321
0
5
10
15
20
25
30
35
40
45
50
19
51
19
52
19
53
19
54
19
55
19
56
19
57
19
58
19
59
19
60
19
61
19
62
19
63
19
64
19
65
19
66
19
67
19
68
19
69
19
70
19
71
19
72
19
73
19
74
19
75
19
76
19
77
19
78
19
79
19
80
19
81
19
82
19
83
19
84
19
85
19
86
19
87
19
88
19
89
19
90
19
91
19
92
19
93
19
94
19
95
19
96
19
97
19
98
19
99
20
00
20
01
20
02
20
03
20
04
20
05
20
06
20
07
20
08
20
09
20
10
20
11
20
12
20
13
20
14
20
15
20
16
20
17
20
18
Mil
lio
n
Tirol Werbung / Tourismus Netzwerk FACTS AND FIGURES 2018
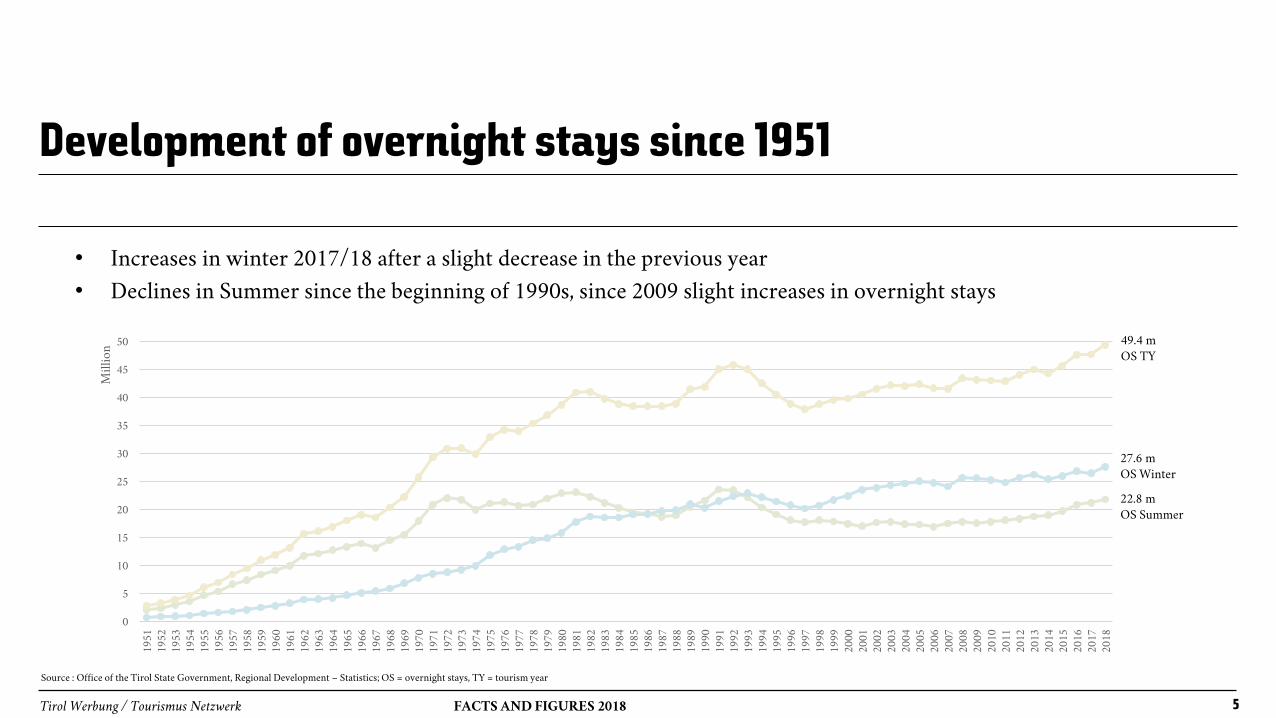
Development of overnight stays since 1951
• Increases in winter 2017/18 after a slight decrease in the previous year
• Declines in Summer since the beginning of 1990s, since 2009 slight increases in overnight stays
49.4 m
OS TY
27.6 m
OS Winter
22.8 m
OS Summer
Source : Office of the Tirol State Government, Regional Development – Statistics; OS = overnight stays, TY = tourism year
5
0
5
10
15
20
25
30
35
40
45
50
2007/08 2008/09 2009/10 2010/11 2011/12 2012/13 2013/14 2014/15 2015/16 2016/17 2017/18
Mil
lio
n
Tirol Werbung / Tourismus Netzwerk FACTS AND FIGURES 2018 6
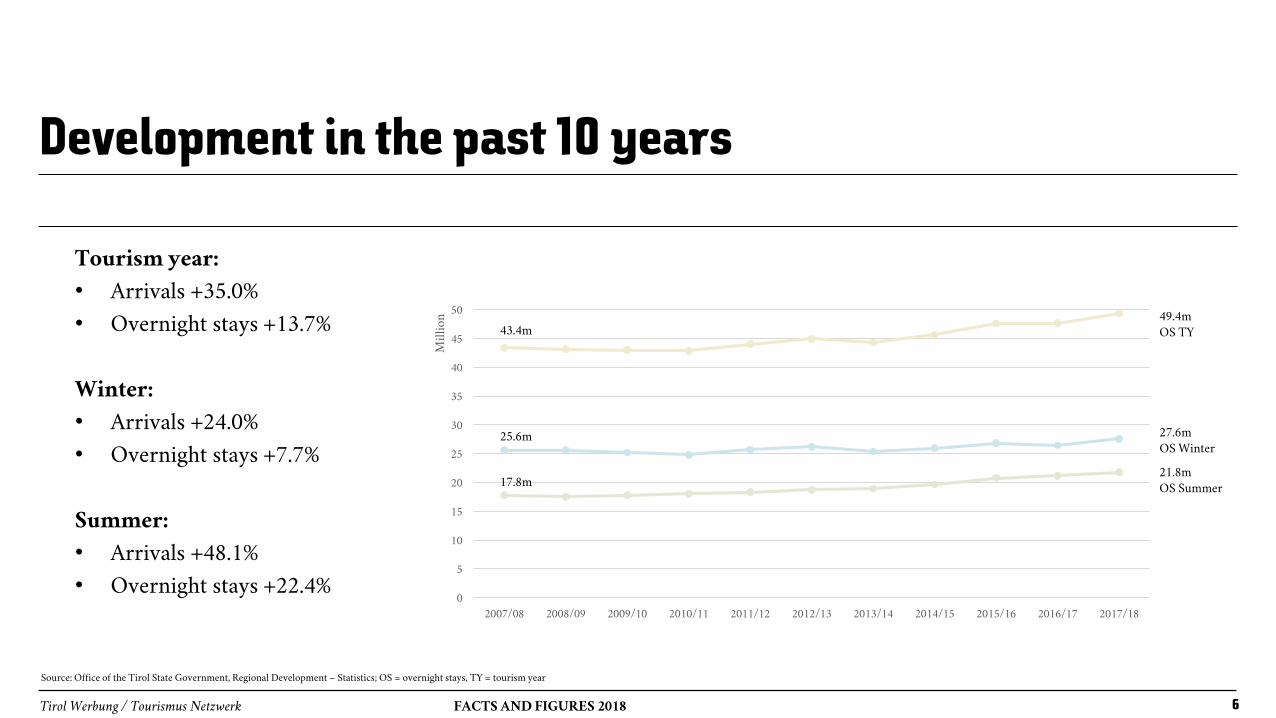
Development in the past 10 years
Tourism year:
• Arrivals +35.0%
• Overnight stays +13.7%
Winter:
• Arrivals +24.0%
• Overnight stays +7.7%
Summer:
• Arrivals +48.1%
• Overnight stays +22.4%
49.4m
OS TY
27.6m
OS Winter
21.8m
OS Summer
43.4m
25.6m
17.8m
Source: Office of the Tirol State Government, Regional Development – Statistics; OS = overnight stays, TY = tourism year
Tirol Werbung / Tourismus Netzwerk FACTS AND FIGURES 2018 7
Comparison of arrivals and overnight stays
• The average length of stay for guests in Tirol decreased in the last 10 tourism years from 4.8 to 4.0 days
• Trend towards shorter holidays, but more of them
• Guests stay longer in Tirol in winter than in summer:
• Winter 2017/18: 4.5 days
• Summer 2018: 3.6 days
Source: Office of the Tirol State Government, Regional Development - Statistics
Tirol Werbung / Tourismus Netzwerk FACTS AND FIGURES 2018 8
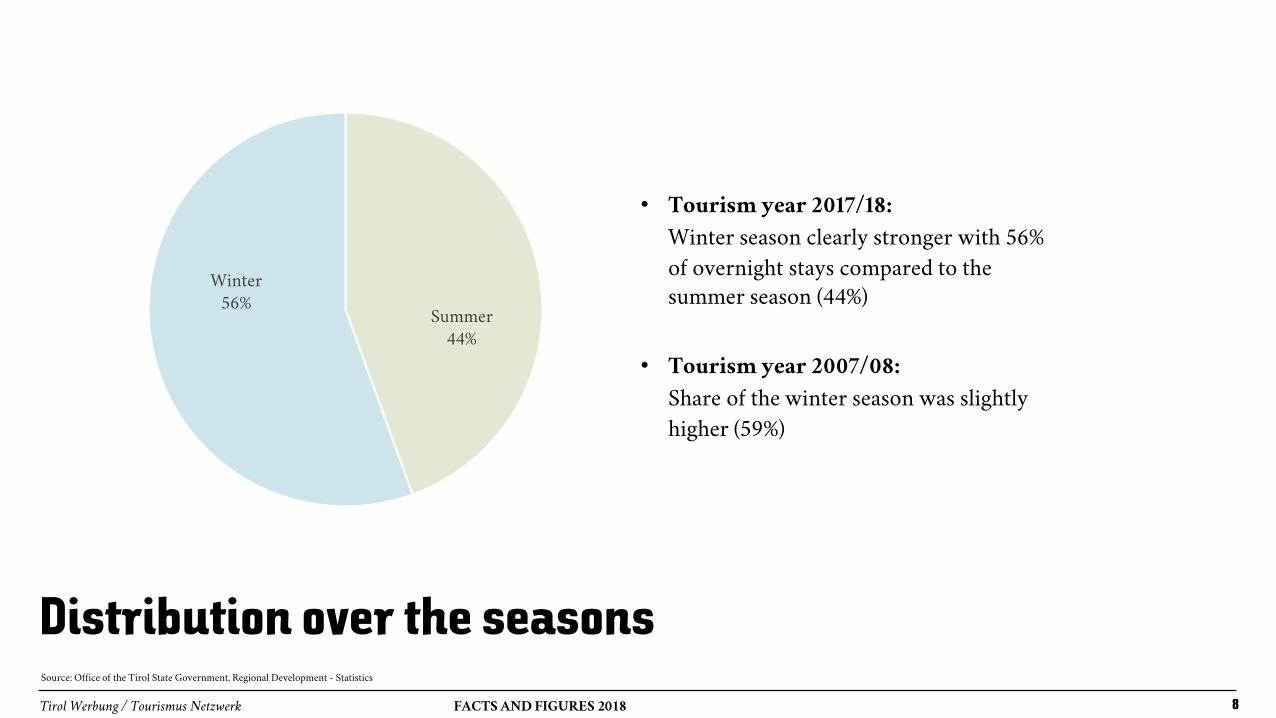
Distribution over the seasons
• Tourism year 2017/18:
Winter season clearly stronger with 56%
of overnight stays compared to the
summer season (44%)
• Tourism year 2007/08:
Share of the winter season was slightly
higher (59%)
Summer
44%
Winter
56%
Source: Office of the Tirol State Government, Regional Development - Statistics
Tirol Werbung / Tourismus Netzwerk FACTS AND FIGURES 2018 9
Markets of origin
Tirol Werbung / Tourismus Netzwerk FACTS AND FIGURES 2018 10
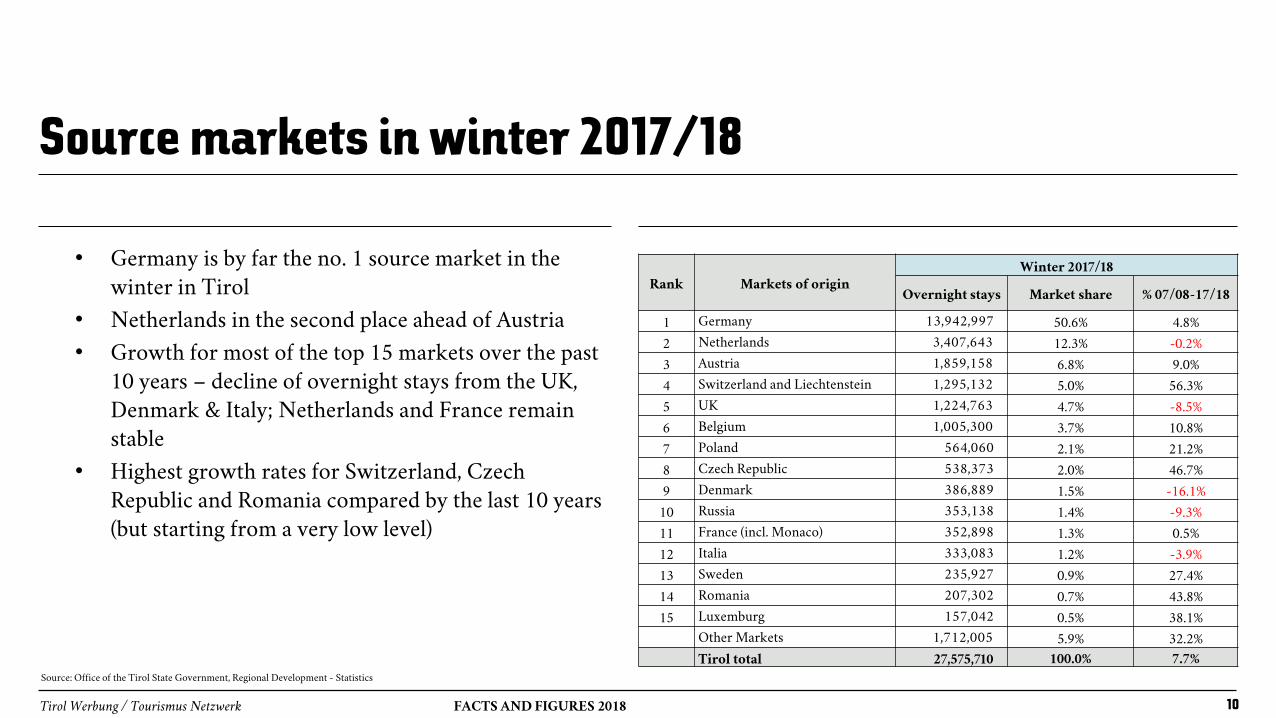
Source markets in winter 2017/18
• Germany is by far the no. 1 source market in the
winter in Tirol
• Netherlands in the second place ahead of Austria
• Growth for most of the top 15 markets over the past
10 years – decline of overnight stays from the UK,
Denmark & Italy; Netherlands and France remain
stable
• Highest growth rates for Switzerland, Czech
Republic and Romania compared by the last 10 years
(but starting from a very low level)
Rank Markets of origin
Winter 2017/18
Overnight stays Market share % 07/08-17/18
1 Germany 13,942,997 50.6% 4.8%
2 Netherlands 3,407,643 12.3% -0.2%
3 Austria 1,859,158 6.8% 9.0%
4 Switzerland and Liechtenstein 1,295,132 5.0% 56.3%
5 UK 1,224,763 4.7% -8.5%
6 Belgium 1,005,300 3.7% 10.8%
7 Poland 564,060 2.1% 21.2%
8 Czech Republic 538,373 2.0% 46.7%
9 Denmark 386,889 1.5% -16.1%
10 Russia 353,138 1.4% -9.3%
11 France (incl. Monaco) 352,898 1.3% 0.5%
12 Italia 333,083 1.2% -3.9%
13 Sweden 235,927 0.9% 27.4%
14 Romania 207,302 0.7% 43.8%
15 Luxemburg 157,042 0.5% 38.1%
Other Markets 1,712,005 5.9% 32.2%
Tirol total 27,575,710 100.0% 7.7%
Source: Office of the Tirol State Government, Regional Development - Statistics
DE
51%
NL
12%
AT
7%
CH
5%
UK
4%
BE
4%
PL
2%
CZ
2%
DK
1%
RUS
1%
FR
1%
IT
1%
SWE
1%
RO
1%
LUX
0,5%
Other
Markets
6%
Tirol Werbung / Tourismus Netzwerk FACTS AND FIGURES 2018 11
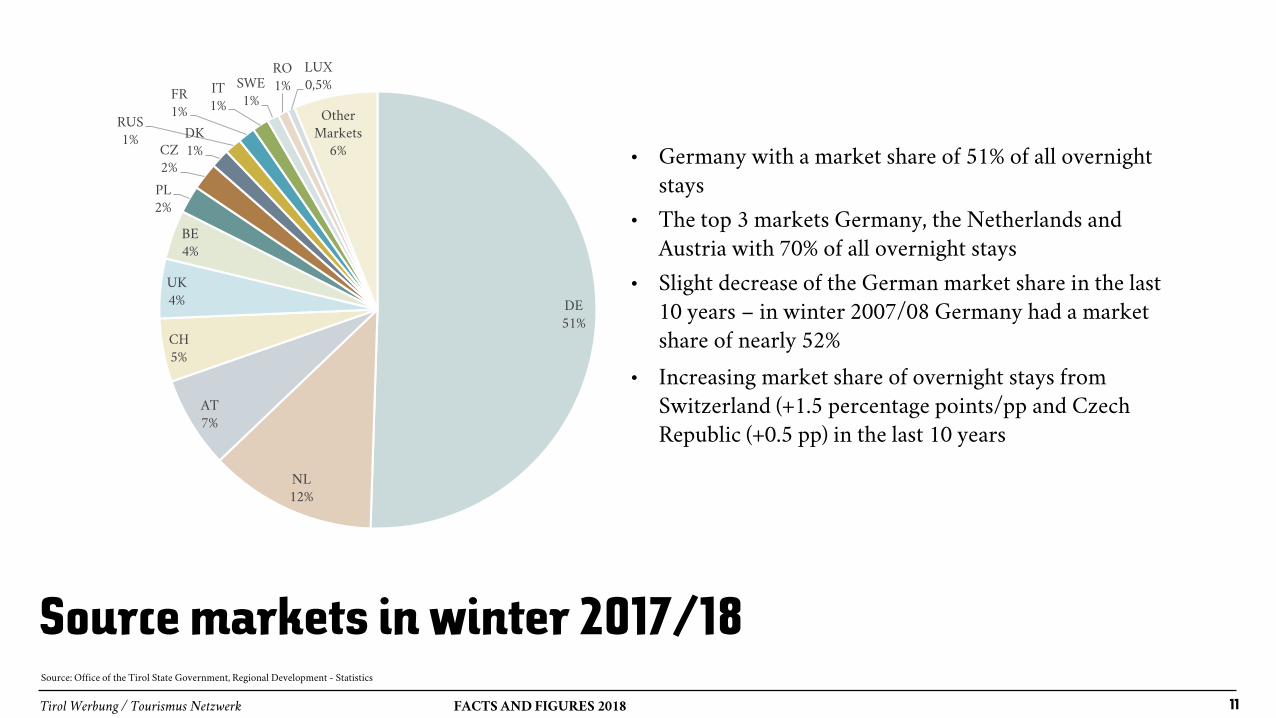
Source markets in winter 2017/18
• Germany with a market share of 51% of all overnight
stays
• The top 3 markets Germany, the Netherlands and
Austria with 70% of all overnight stays
• Slight decrease of the German market share in the last
10 years – in winter 2007/08 Germany had a market
share of nearly 52%
• Increasing market share of overnight stays from
Switzerland (+1.5 percentage points/pp and Czech
Republic (+0.5 pp) in the last 10 years
Source: Office of the Tirol State Government, Regional Development - Statistics
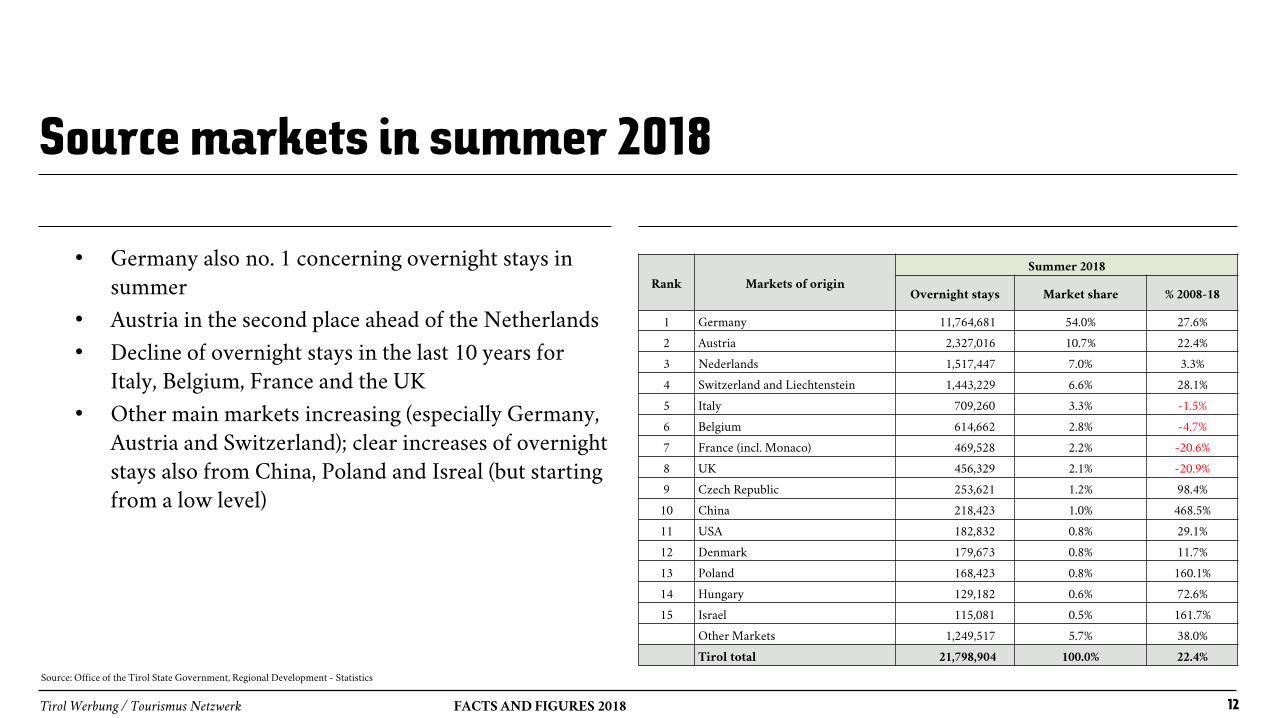
Rank Markets of origin
Summer 2018
Overnight stays Market share % 2008-18
1 Germany 11,764,681 54.0% 27.6%
2 Austria 2,327,016 10.7% 22.4%
3 Nederlands 1,517,447 7.0% 3.3%
4 Switzerland and Liechtenstein 1,443,229 6.6% 28.1%
5 Italy 709,260 3.3% -1.5%
6 Belgium 614,662 2.8% -4.7%
7 France (incl. Monaco) 469,528 2.2% -20.6%
8 UK 456,329 2.1% -20.9%
9 Czech Republic 253,621 1.2% 98.4%
10 China 218,423 1.0% 468.5%
11 USA 182,832 0.8% 29.1%
12 Denmark 179,673 0.8% 11.7%
13 Poland 168,423 0.8% 160.1%
14 Hungary 129,182 0.6% 72.6%
15 Israel 115,081 0.5% 161.7%
Other Markets 1,249,517 5.7% 38.0%
Tirol total 21,798,904 100.0% 22.4%
Tirol Werbung / Tourismus Netzwerk FACTS AND FIGURES 2018 12
Source markets in summer 2018
• Germany also no. 1 concerning overnight stays in
summer
• Austria in the second place ahead of the Netherlands
• Decline of overnight stays in the last 10 years for
Italy, Belgium, France and the UK
• Other main markets increasing (especially Germany,
Austria and Switzerland); clear increases of overnight
stays also from China, Poland and Isreal (but starting
from a low level)
Source: Office of the Tirol State Government, Regional Development - Statistics

DE
54%
AT
11%
NL
7%
CH
7%
IT
3%
BE
3%
FR
2%
UK
2%
CZ
1%
CHN
1%
USA
1%DK
1%
PL
1%
HU
1%ISR
0,5%
Other
Markets
6%
Tirol Werbung / Tourismus Netzwerk FACTS AND FIGURES 2018 13
Source markets in summer 2018
• In summer Germany has a market share of about 54%
• The top 3 markets are Germany, Austria and
Netherlands with about 72% of all overnight stays
• The market share of Germany in summer increased in
the last 10 years – in summer 2008 Germany had a
market share of 52%
• Decreasing market share especially for the Netherlands
(-1.3 percentage points/pp) as well as for France (-1.2
pp) and UK (-1.1pp)
• Biggest increase of market share for Germany (+2.2 pp)
Source: Office of the Tirol State Government, Regional Development - Statistics
Tirol Werbung / Tourismus Netzwerk FACTS AND FIGURES 2018 14
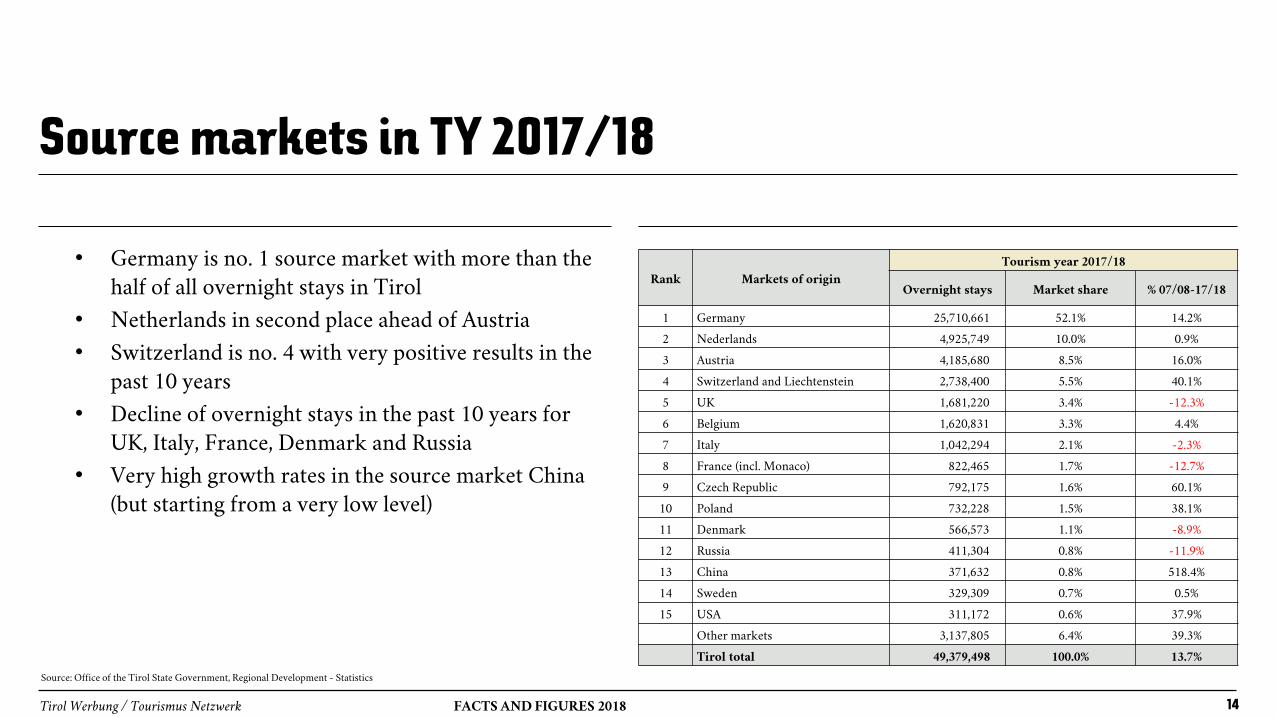
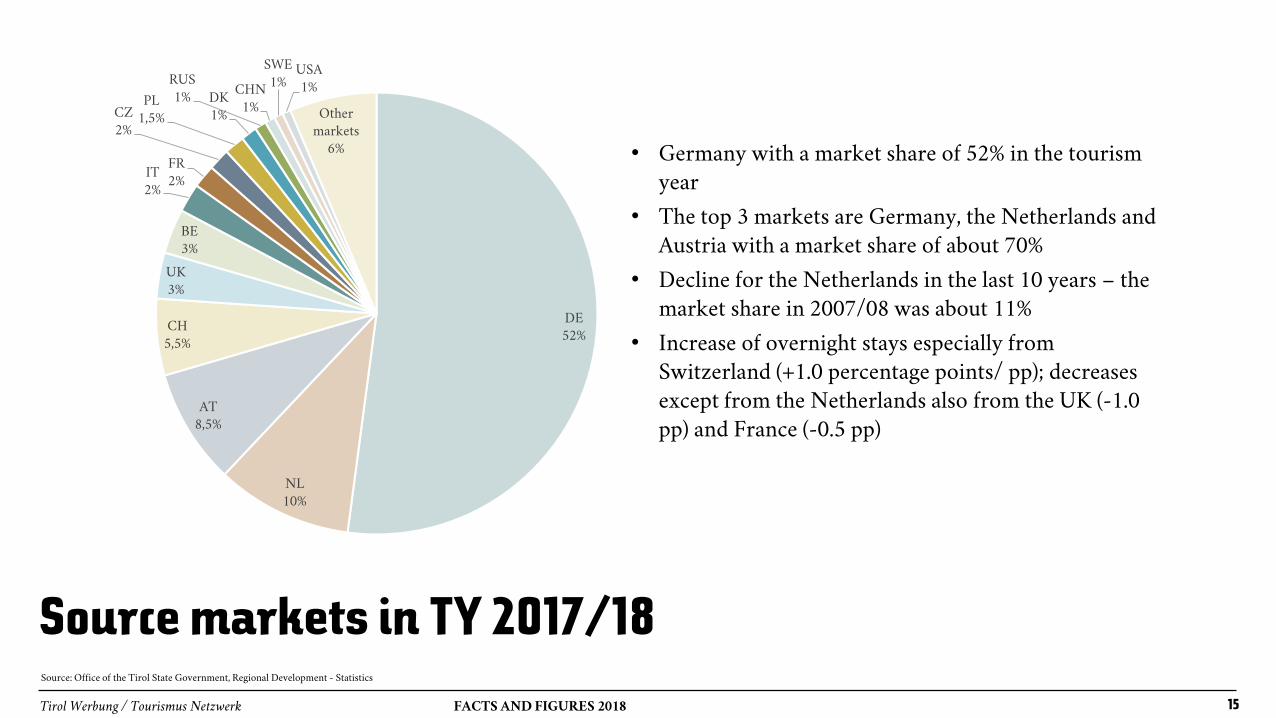
Source markets in TY 2017/18
• Germany is no. 1 source market with more than the
half of all overnight stays in Tirol
• Netherlands in second place ahead of Austria
• Switzerland is no. 4 with very positive results in the
past 10 years
• Decline of overnight stays in the past 10 years for
UK, Italy, France, Denmark and Russia
• Very high growth rates in the source market China
(but starting from a very low level)
Rank Markets of origin
Tourism year 2017/18
Overnight stays Market share % 07/08-17/18
1 Germany 25,710,661 52.1% 14.2%
2 Nederlands 4,925,749 10.0% 0.9%
3 Austria 4,185,680 8.5% 16.0%
4 Switzerland and Liechtenstein 2,738,400 5.5% 40.1%
5 UK 1,681,220 3.4% -12.3%
6 Belgium 1,620,831 3.3% 4.4%
7 Italy 1,042,294 2.1% -2.3%
8 France (incl. Monaco) 822,465 1.7% -12.7%
9 Czech Republic 792,175 1.6% 60.1%
10 Poland 732,228 1.5% 38.1%
11 Denmark 566,573 1.1% -8.9%
12 Russia 411,304 0.8% -11.9%
13 China 371,632 0.8% 518.4%
14 Sweden 329,309 0.7% 0.5%
15 USA 311,172 0.6% 37.9%
Other markets 3,137,805 6.4% 39.3%
Tirol total 49,379,498 100.0% 13.7%
Source: Office of the Tirol State Government, Regional Development - Statistics
DE
52%
NL
10%
AT
8,5%
CH
5,5%
UK
3%
BE
3%
IT
2%
FR
2%
CZ
2%
PL
1,5%
DK
1%
RUS
1%CHN
1%
SWE
1%USA
1%
Other
markets
6%
Tirol Werbung / Tourismus Netzwerk FACTS AND FIGURES 2018 15
Source markets in TY 2017/18
• Germany with a market share of 52% in the tourism
year
• The top 3 markets are Germany, the Netherlands and
Austria with a market share of about 70%
• Decline for the Netherlands in the last 10 years – the
market share in 2007/08 was about 11%
• Increase of overnight stays especially from
Switzerland (+1.0 percentage points/ pp); decreases
except from the Netherlands also from the UK (-1.0
pp) and France (-0.5 pp)
Source: Office of the Tirol State Government, Regional Development - Statistics
Tirol Werbung / Tourismus Netzwerk FACTS AND FIGURES 2018 16
Tourism associations and municipalities
Tirol Werbung / Tourismus Netzwerk FACTS AND FIGURES 2018 17
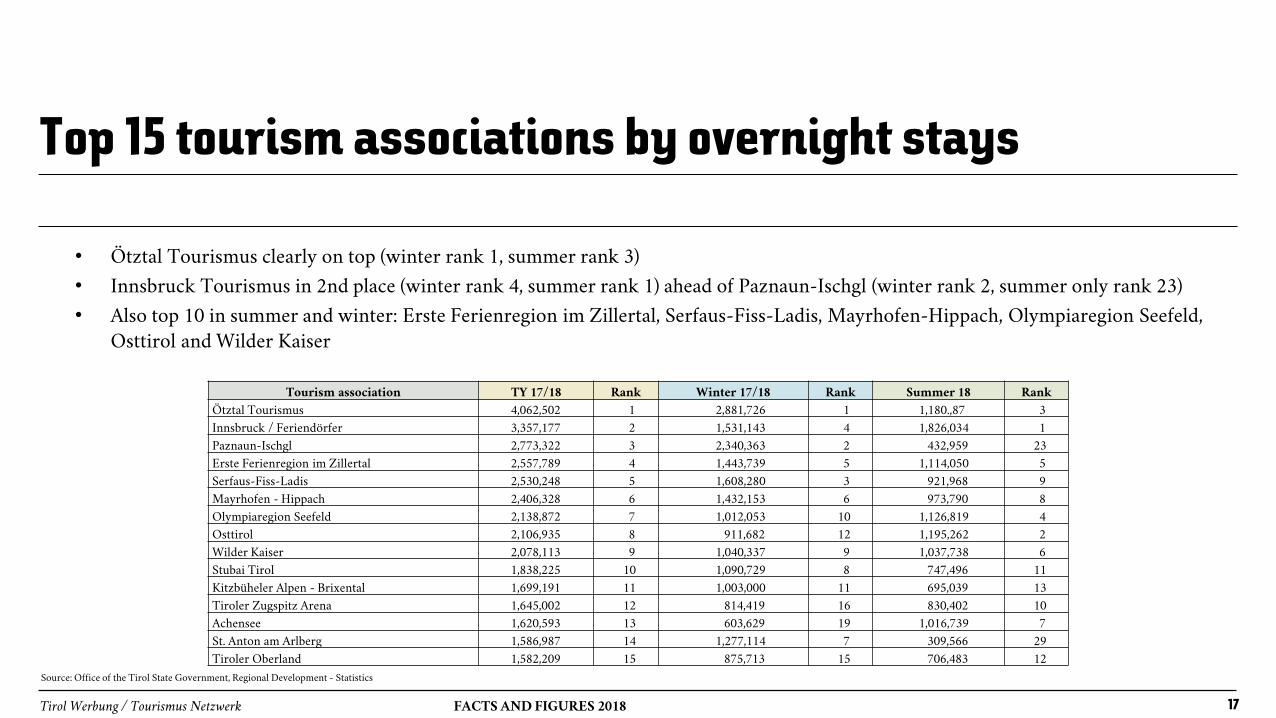
Top 15 tourism associations by overnight stays
• Ötztal Tourismus clearly on top (winter rank 1, summer rank 3)
• Innsbruck Tourismus in 2nd place (winter rank 4, summer rank 1) ahead of Paznaun-Ischgl (winter rank 2, summer only rank 23)
• Also top 10 in summer and winter: Erste Ferienregion im Zillertal, Serfaus-Fiss-Ladis, Mayrhofen-Hippach, Olympiaregion Seefeld,
Osttirol and Wilder Kaiser
Source: Office of the Tirol State Government, Regional Development - Statistics
Tourism association TY 17/18 Rank Winter 17/18 Rank Summer 18 Rank
Ötztal Tourismus 4,062,502 1 2,881,726 1 1,180.,87 3
Innsbruck / Feriendörfer 3,357,177 2 1,531,143 4 1,826,034 1
Paznaun-Ischgl 2,773,322 3 2,340,363 2 432,959 23
Erste Ferienregion im Zillertal 2,557,789 4 1,443,739 5 1,114,050 5
Serfaus-Fiss-Ladis 2,530,248 5 1,608,280 3 921,968 9
Mayrhofen - Hippach 2,406,328 6 1,432,153 6 973,790 8
Olympiaregion Seefeld 2,138,872 7 1,012,053 10 1,126,819 4
Osttirol 2,106,935 8 911,682 12 1,195,262 2
Wilder Kaiser 2,078,113 9 1,040,337 9 1,037,738 6
Stubai Tirol 1,838,225 10 1,090,729 8 747,496 11
Kitzbüheler Alpen - Brixental 1,699,191 11 1,003,000 11 695,039 13
Tiroler Zugspitz Arena 1,645,002 12 814,419 16 830,402 10
Achensee 1,620,593 13 603,629 19 1,016,739 7
St. Anton am Arlberg 1,586,987 14 1,277,114 7 309,566 29
Tiroler Oberland 1,582,209 15 875,713 15 706,483 12
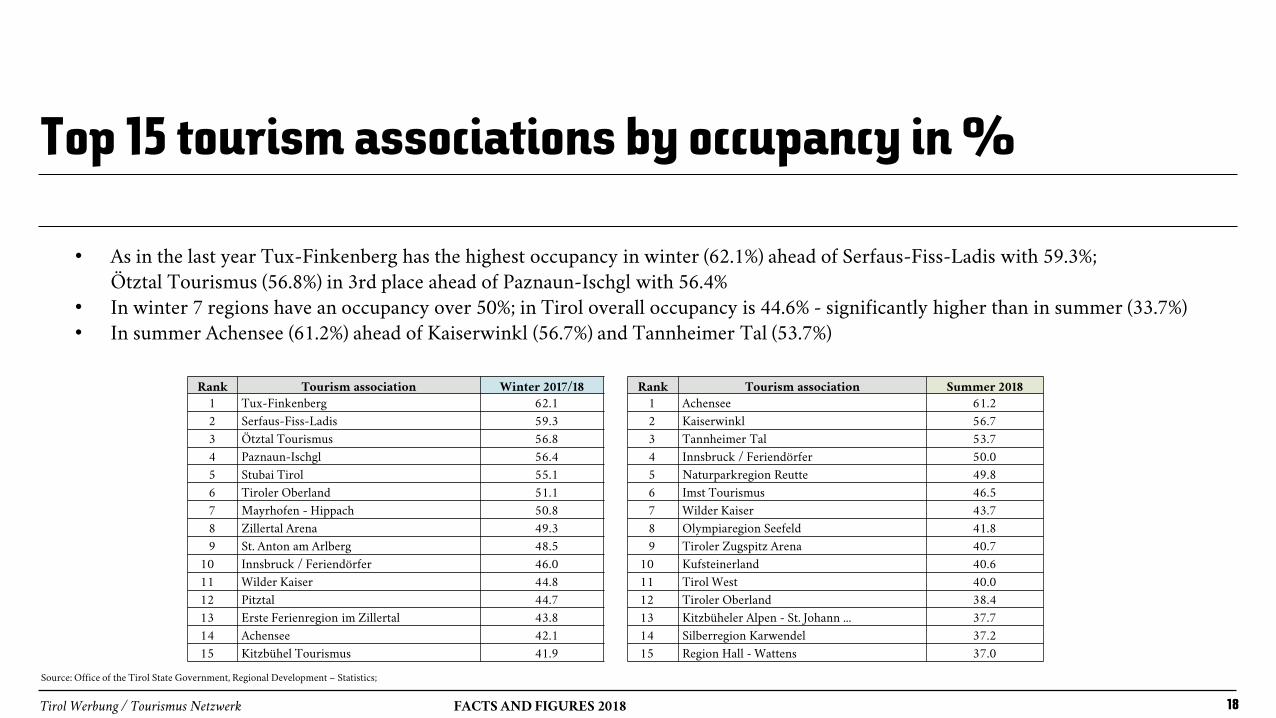
Rank Tourism association Winter 2017/181 Tux-Finkenberg 62.1
2 Serfaus-Fiss-Ladis 59.3
3 Ötztal Tourismus 56.8
4 Paznaun-Ischgl 56.4
5 Stubai Tirol 55.1
6 Tiroler Oberland 51.1
7 Mayrhofen - Hippach 50.8
8 Zillertal Arena 49.3
9 St. Anton am Arlberg 48.5
10 Innsbruck / Feriendörfer 46.0
11 Wilder Kaiser 44.8
12 Pitztal 44.7
13 Erste Ferienregion im Zillertal 43.8
14 Achensee 42.1
15 Kitzbühel Tourismus 41.9
Tirol Werbung / Tourismus Netzwerk FACTS AND FIGURES 2018 18
Top 15 tourism associations by occupancy in %
• As in the last year Tux-Finkenberg has the highest occupancy in winter (62.1%) ahead of Serfaus-Fiss-Ladis with 59.3%;
Ötztal Tourismus (56.8%) in 3rd place ahead of Paznaun-Ischgl with 56.4%
• In winter 7 regions have an occupancy over 50%; in Tirol overall occupancy is 44.6% - significantly higher than in summer (33.7%)
• In summer Achensee (61.2%) ahead of Kaiserwinkl (56.7%) and Tannheimer Tal (53.7%)
Rank Tourism association Summer 20181 Achensee 61.2
2 Kaiserwinkl 56.7
3 Tannheimer Tal 53.7
4 Innsbruck / Feriendörfer 50.0
5 Naturparkregion Reutte 49.8
6 Imst Tourismus 46.5
7 Wilder Kaiser 43.7
8 Olympiaregion Seefeld 41.8
9 Tiroler Zugspitz Arena 40.7
10 Kufsteinerland 40.6
11 Tirol West 40.0
12 Tiroler Oberland 38.4
13 Kitzbüheler Alpen - St. Johann ... 37.7
14 Silberregion Karwendel 37.2
15 Region Hall - Wattens 37.0
Source: Office of the Tirol State Government, Regional Development – Statistics;
Tirol Werbung / Tourismus Netzwerk FACTS AND FIGURES 2018 19
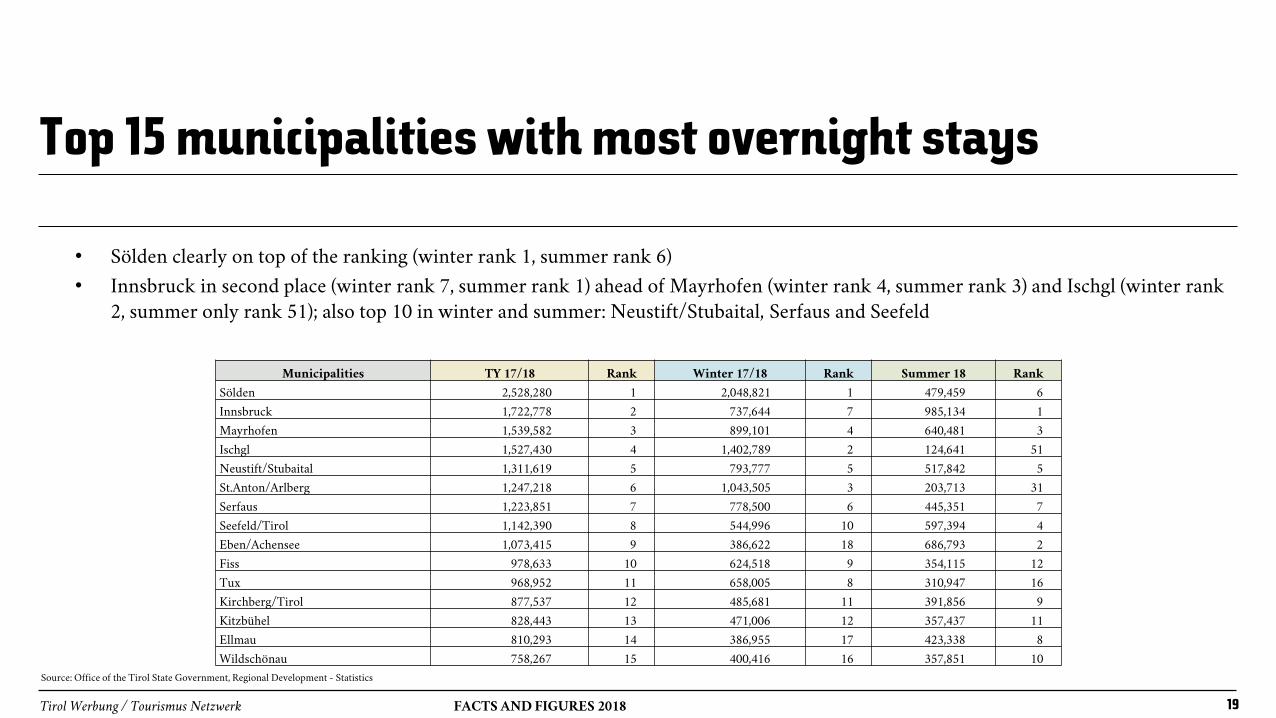
Top 15 municipalities with most overnight stays
• Sölden clearly on top of the ranking (winter rank 1, summer rank 6)
• Innsbruck in second place (winter rank 7, summer rank 1) ahead of Mayrhofen (winter rank 4, summer rank 3) and Ischgl (winter rank
2, summer only rank 51); also top 10 in winter and summer: Neustift/Stubaital, Serfaus and Seefeld
Municipalities TY 17/18 Rank Winter 17/18 Rank Summer 18 Rank
Sölden 2,528,280 1 2,048,821 1 479,459 6
Innsbruck 1,722,778 2 737,644 7 985,134 1
Mayrhofen 1,539,582 3 899,101 4 640,481 3
Ischgl 1,527,430 4 1,402,789 2 124,641 51
Neustift/Stubaital 1,311,619 5 793,777 5 517,842 5
St.Anton/Arlberg 1,247,218 6 1,043,505 3 203,713 31
Serfaus 1,223,851 7 778,500 6 445,351 7
Seefeld/Tirol 1,142,390 8 544,996 10 597,394 4
Eben/Achensee 1,073,415 9 386,622 18 686,793 2
Fiss 978,633 10 624,518 9 354,115 12
Tux 968,952 11 658,005 8 310,947 16
Kirchberg/Tirol 877,537 12 485,681 11 391,856 9
Kitzbühel 828,443 13 471,006 12 357,437 11
Ellmau 810,293 14 386,955 17 423,338 8
Wildschönau 758,267 15 400,416 16 357,851 10
Source: Office of the Tirol State Government, Regional Development - Statistics
Tirol Werbung / Tourismus Netzwerk FACTS AND FIGURES 2018 20
Tirol accommodation
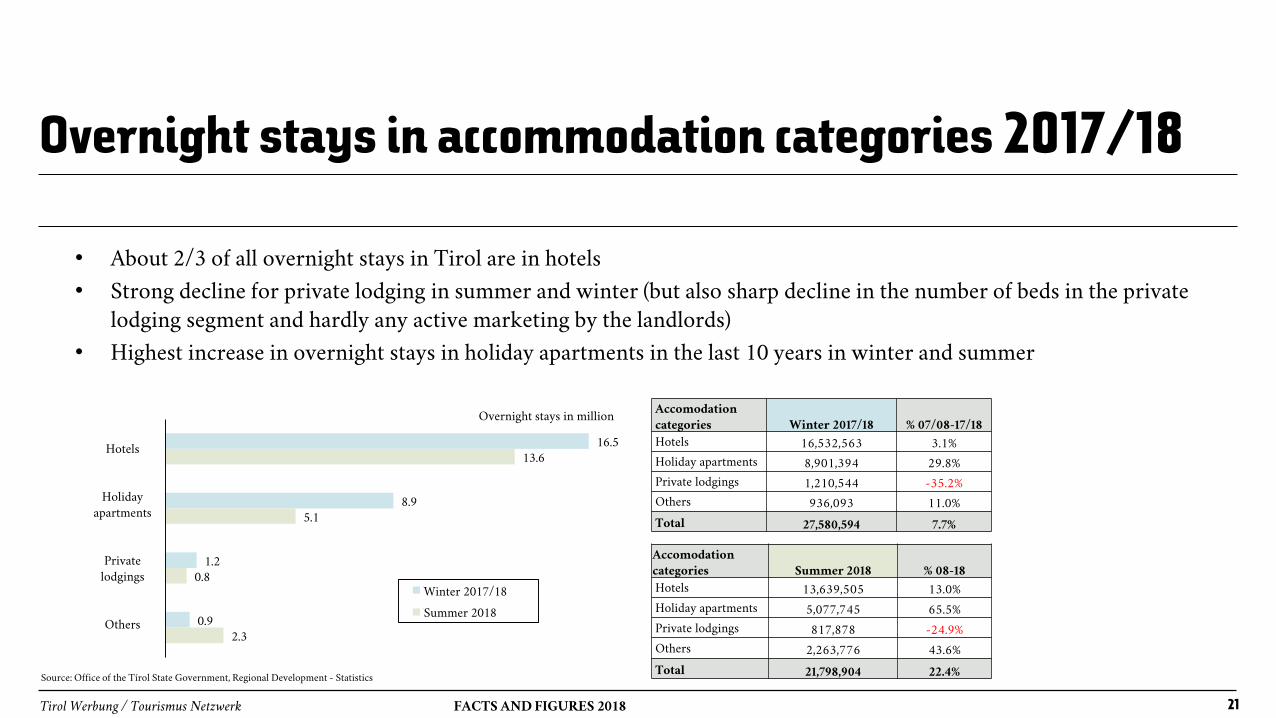
• About 2/3 of all overnight stays in Tirol are in hotels
• Strong decline for private lodging in summer and winter (but also sharp decline in the number of beds in the private
lodging segment and hardly any active marketing by the landlords)
• Highest increase in overnight stays in holiday apartments in the last 10 years in winter and summer
16.5
8.9
1.2
0.9
13.6
5.1
0.8
2.3
Hotellerie
Ferien-
wohnungen
Privat-
quartiere
Sonstige
ÜN Winter 2017/18
ÜN Sommer 2018
Accomodationcategories Summer 2018 % 08-18
Hotels 13,639,505 13.0%
Holiday apartments 5,077,745 65.5%
Private lodgings 817,878 -24.9%
Others 2,263,776 43.6%
Total 21,798,904 22.4%
Accomodationcategories Winter 2017/18 % 07/08-17/18
Hotels 16,532,563 3.1%
Holiday apartments 8,901,394 29.8%
Private lodgings 1,210,544 -35.2%
Others 936,093 11.0%
Total 27,580,594 7.7%
Tirol Werbung / Tourismus Netzwerk FACTS AND FIGURES 2018 21
Overnight stays in accommodation categories 2017/18
Overnight stays in million
Source: Office of the Tírol State Government, Regional Development - Statistics
Hotels
Holiday
apartments
Private
lodgings
Others
Winter 2017/18
Summer 2018
Tirol Werbung / Tourismus Netzwerk FACTS AND FIGURES 2018 22
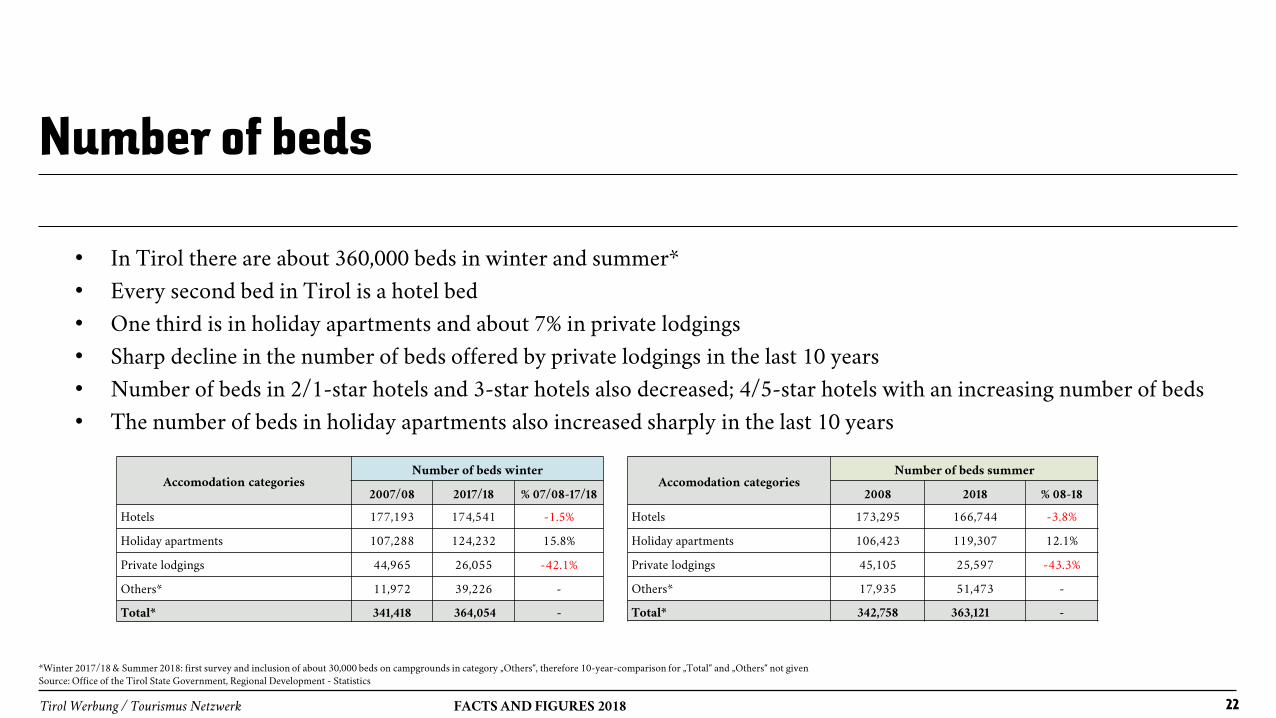
Number of beds
• In Tirol there are about 360,000 beds in winter and summer*
• Every second bed in Tirol is a hotel bed
• One third is in holiday apartments and about 7% in private lodgings
• Sharp decline in the number of beds offered by private lodgings in the last 10 years
• Number of beds in 2/1-star hotels and 3-star hotels also decreased; 4/5-star hotels with an increasing number of beds
• The number of beds in holiday apartments also increased sharply in the last 10 years
Accomodation categoriesNumber of beds winter
2007/08 2017/18 % 07/08-17/18
Hotels 177,193 174,541 -1.5%
Holiday apartments 107,288 124,232 15.8%
Private lodgings 44,965 26,055 -42.1%
Others* 11,972 39,226 -
Total* 341,418 364,054 -
Accomodation categoriesNumber of beds summer
2008 2018 % 08-18
Hotels 173,295 166,744 -3.8%
Holiday apartments 106,423 119,307 12.1%
Private lodgings 45,105 25,597 -43.3%
Others* 17,935 51,473 -
Total* 342,758 363,121 -
*Winter 2017/18 & Summer 2018: first survey and inclusion of about 30,000 beds on campgrounds in category „Others“, therefore 10-year-comparison for „Total“ and „Others“ not given
Source: Office of the Tirol State Government, Regional Development - Statistics
59.9%
32.3%
4.4%
3.4%
47.9%
34.1%
7.2%
10.8%
Hotellerie
Ferien-wohnungen
Privat-quartiere
Sonstige
Übernachtungen
BettenOvernight stays
Beds
Tirol Werbung / Tourismus Netzwerk FACTS AND FIGURES 2018 23
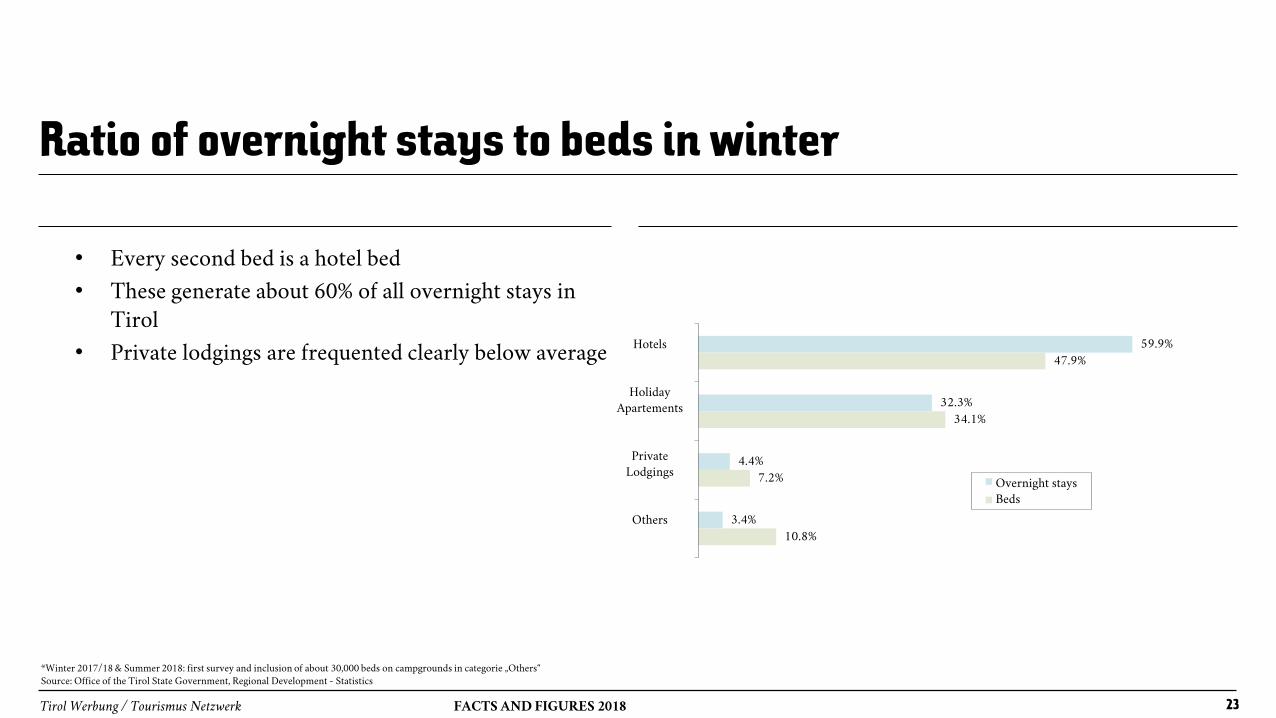
Ratio of overnight stays to beds in winter
• Every second bed is a hotel bed
• These generate about 60% of all overnight stays in
Tirol
• Private lodgings are frequented clearly below average
*Winter 2017/18 & Summer 2018: first survey and inclusion of about 30,000 beds on campgrounds in categorie „Others“
Source: Office of the Tirol State Government, Regional Development - Statistics
Hotels
Holiday
Apartements
Private
Lodgings
Others
62.6%
23.3%
3.8%
10.4%
45.9%
32.9%
7.0%
14.2%
Hotellerie
Ferien-wohnungen
Privat-quartiere
Sonstige
Übernachtungen
Betten
Overnight stays
Beds
Tirol Werbung / Tourismus Netzwerk FACTS AND FIGURES 2018 24
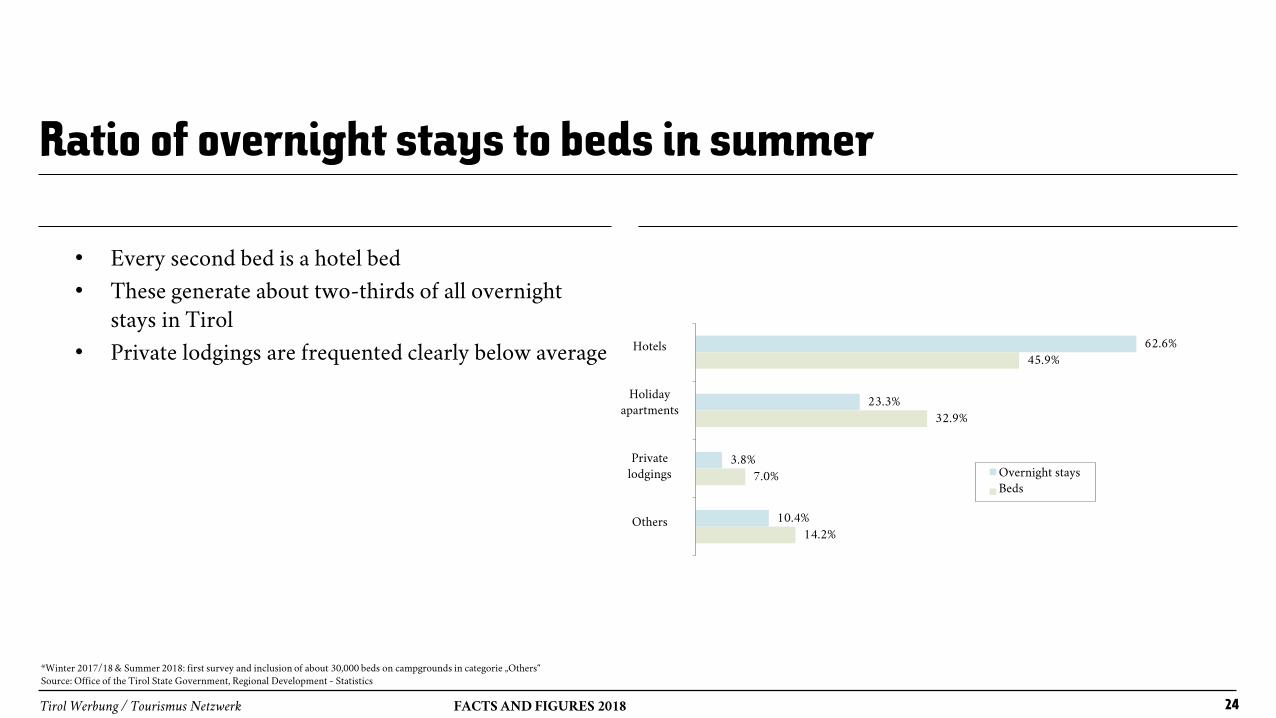
Ratio of overnight stays to beds in summer
• Every second bed is a hotel bed
• These generate about two-thirds of all overnight
stays in Tirol
• Private lodgings are frequented clearly below average
*Winter 2017/18 & Summer 2018: first survey and inclusion of about 30,000 beds on campgrounds in categorie „Others“
Source: Office of the Tirol State Government, Regional Development - Statistics
Hotels
Holiday
apartments
Private
lodgings
Others
58.9
50.1
40.4
46.7
37.033.2
26.822.8
52.3
42.3
29.726.9
20.7
26.4
16.9 18.6
4 - 5* Hotel 3* Hotel 2/1* Hotel Gew. FeWo FeWo Privat FeWo Privat a.B. Privatquartier Privatquartier a.B.
Winter 2017/18
Sommer 2018
Tirol Werbung / Tourismus Netzwerk FACTS AND FIGURES 2018 25
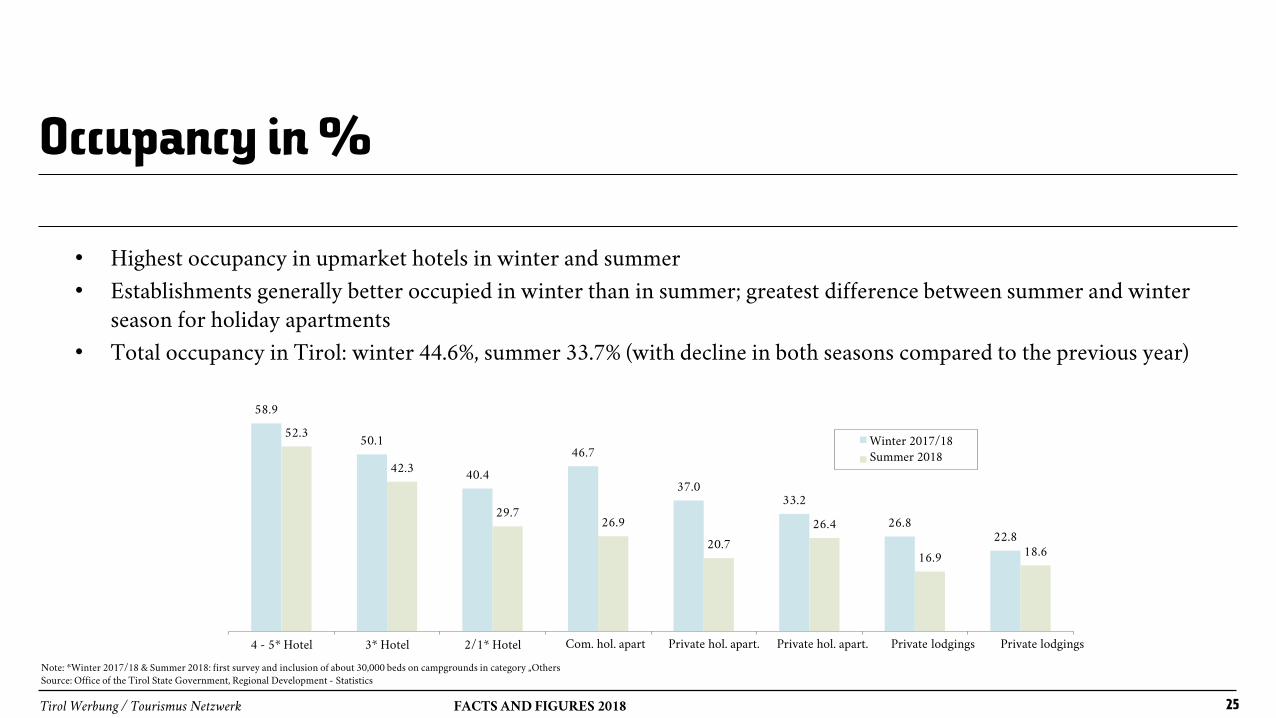
Occupancy in %
• Highest occupancy in upmarket hotels in winter and summer
• Establishments generally better occupied in winter than in summer; greatest difference between summer and winter
season for holiday apartments
• Total occupancy in Tirol: winter 44.6%, summer 33.7% (with decline in both seasons compared to the previous year)
Note: *Winter 2017/18 & Summer 2018: first survey and inclusion of about 30,000 beds on campgrounds in category „Others
Source: Office of the Tirol State Government, Regional Development - Statistics
Winter 2017/18
Summer 2018
Com. hol. apart Private hol. apart. Private hol. apart. Private lodgings Private lodgings
Tirol Werbung / Tourismus Netzwerk FACTS AND FIGURES 2018 26
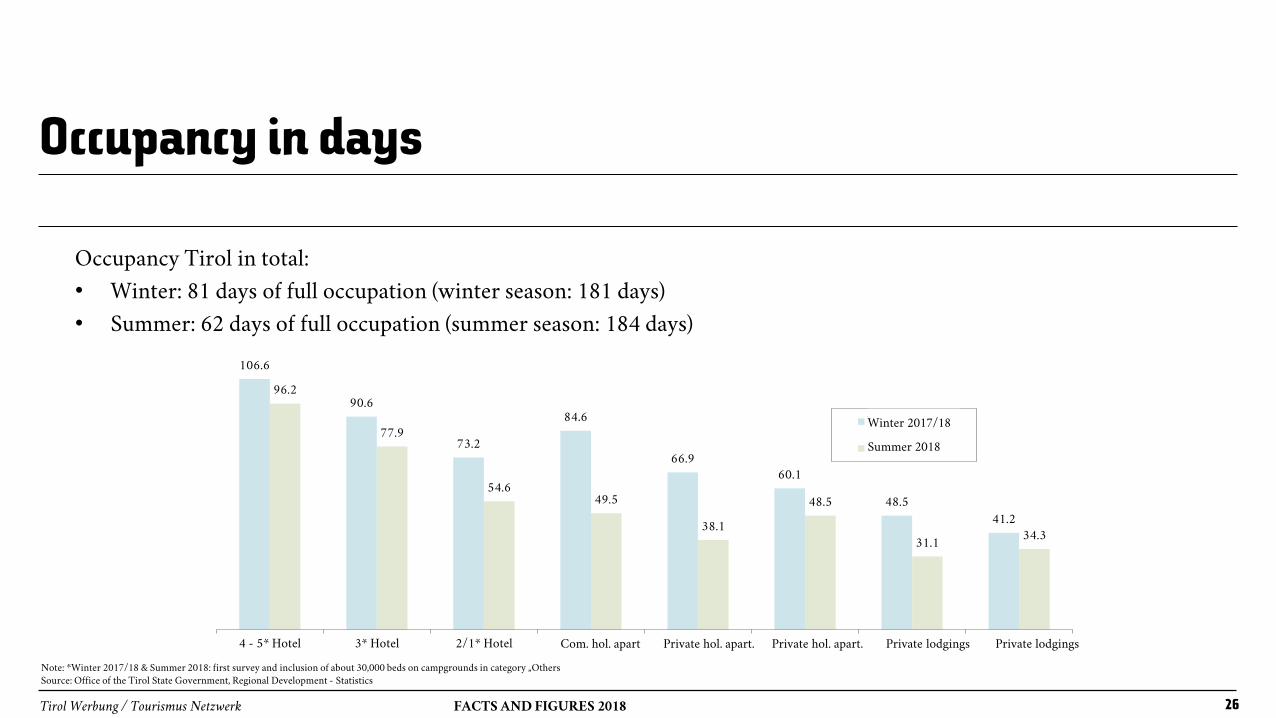
Occupancy in days
Occupancy Tirol in total:
• Winter: 81 days of full occupation (winter season: 181 days)
• Summer: 62 days of full occupation (summer season: 184 days)
106.6
90.6
73.2
84.6
66.960.1
48.5
41.2
96.2
77.9
54.649.5
38.1
48.5
31.134.3
4 - 5* Hotel 3* Hotel 2/1* Hotel Gew. FeWo FeWo Privat FeWo Privat a.B. Privatquartier Privatquartier a.B.
Winter 2017/18
Sommer 2018
Winter 2017/18
Summer 2018
Note: *Winter 2017/18 & Summer 2018: first survey and inclusion of about 30,000 beds on campgrounds in category „Others
Source: Office of the Tirol State Government, Regional Development - Statistics
Com. hol. apart Private hol. apart. Private hol. apart. Private lodgings Private lodgings
Tirol Werbung / Tourismus Netzwerk FACTS AND FIGURES 2018 27
Alpine competitors at a glance
Tirol Werbung / Tourismus Netzwerk FACTS AND FIGURES 2018 28
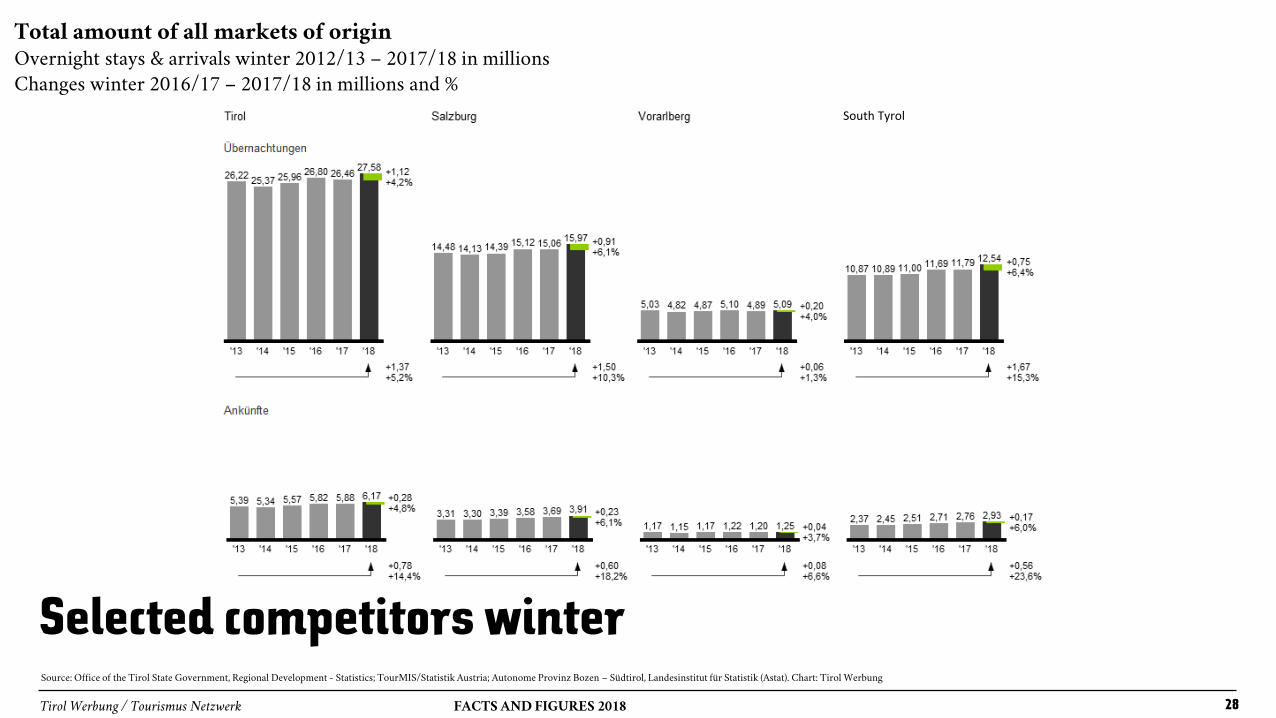
Selected competitors winterSource: Office of the Tirol State Government, Regional Development - Statistics; TourMIS/Statistik Austria; Autonome Provinz Bozen – Südtirol, Landesinstitut für Statistik (Astat). Chart: Tirol Werbung
Total amount of all markets of originOvernight stays & arrivals winter 2012/13 – 2017/18 in millions
Changes winter 2016/17 – 2017/18 in millions and %
South Tyrol
Tirol Werbung / Tourismus Netzwerk FACTS AND FIGURES 2018 29
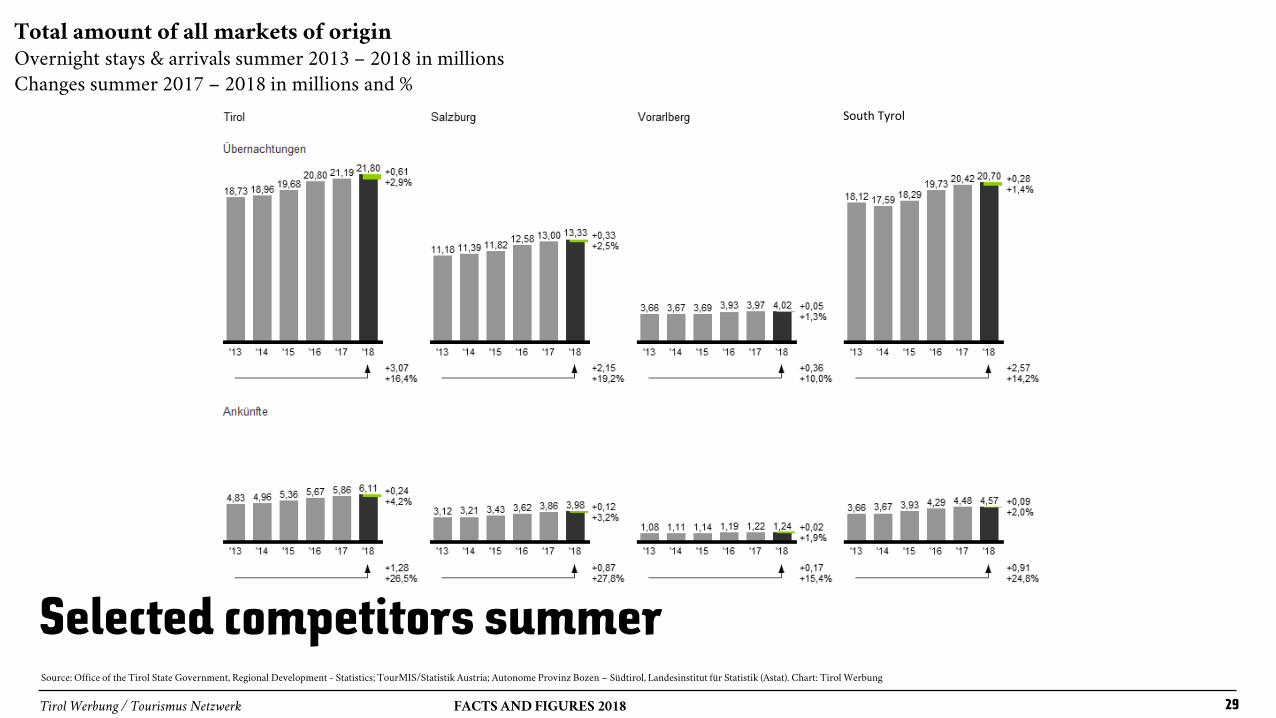
Selected competitors summerSource: Office of the Tirol State Government, Regional Development - Statistics; TourMIS/Statistik Austria; Autonome Provinz Bozen – Südtirol, Landesinstitut für Statistik (Astat). Chart: Tirol Werbung
Total amount of all markets of originOvernight stays & arrivals summer 2013 – 2018 in millions
Changes summer 2017 – 2018 in millions and %
South Tyrol
Tirol Werbung / Tourismus Netzwerk FACTS AND FIGURES 2018 30
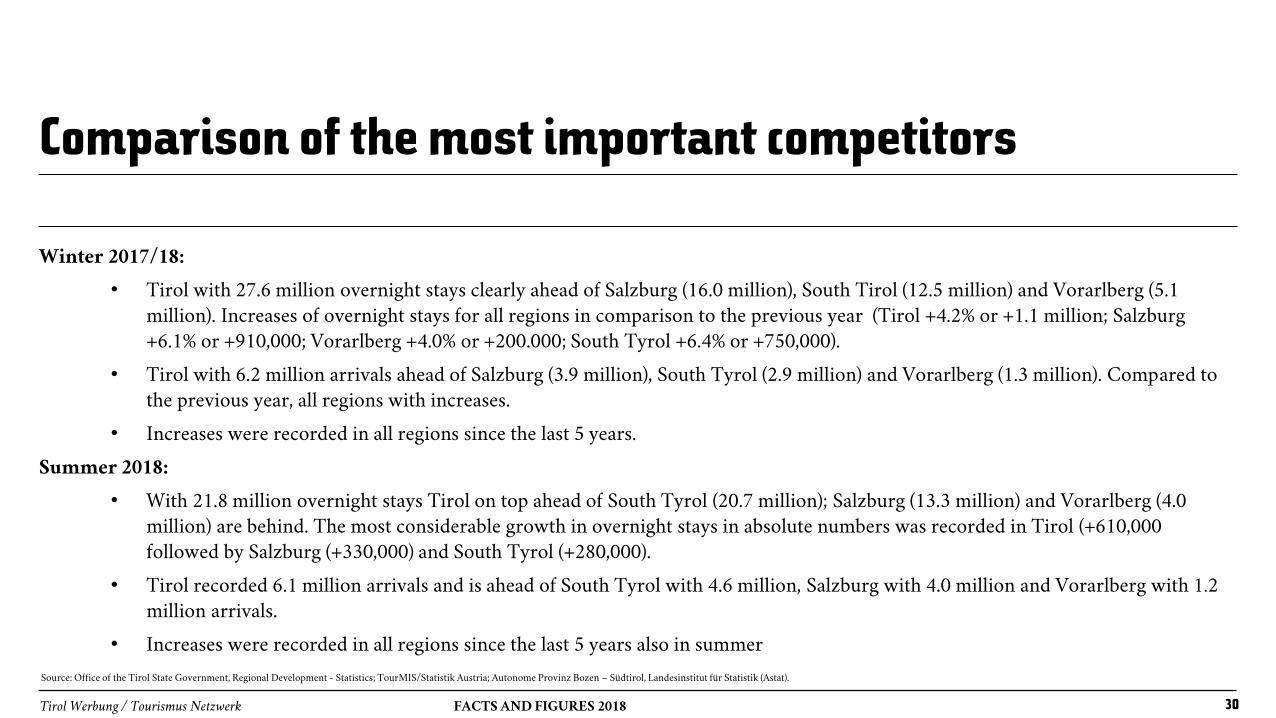
Comparison of the most important competitors
Winter 2017/18:
• Tirol with 27.6 million overnight stays clearly ahead of Salzburg (16.0 million), South Tirol (12.5 million) and Vorarlberg (5.1
million). Increases of overnight stays for all regions in comparison to the previous year (Tirol +4.2% or +1.1 million; Salzburg
+6.1% or +910,000; Vorarlberg +4.0% or +200.000; South Tyrol +6.4% or +750,000).
• Tirol with 6.2 million arrivals ahead of Salzburg (3.9 million), South Tyrol (2.9 million) and Vorarlberg (1.3 million). Compared to
the previous year, all regions with increases.
• Increases were recorded in all regions since the last 5 years.
Summer 2018:
• With 21.8 million overnight stays Tirol on top ahead of South Tyrol (20.7 million); Salzburg (13.3 million) and Vorarlberg (4.0
million) are behind. The most considerable growth in overnight stays in absolute numbers was recorded in Tirol (+610,000
followed by Salzburg (+330,000) and South Tyrol (+280,000).
• Tirol recorded 6.1 million arrivals and is ahead of South Tyrol with 4.6 million, Salzburg with 4.0 million and Vorarlberg with 1.2
million arrivals.
• Increases were recorded in all regions since the last 5 years also in summer
Source: Office of the Tirol State Government, Regional Development - Statistics; TourMIS/Statistik Austria; Autonome Provinz Bozen – Südtirol, Landesinstitut für Statistik (Astat).
Tirol Werbung / Tourismus Netzwerk FACTS AND FIGURES 2018 31
Economic importance of tourism in Tirol
Tirol Werbung / Tourismus Netzwerk FACTS AND FIGURES 2018 32
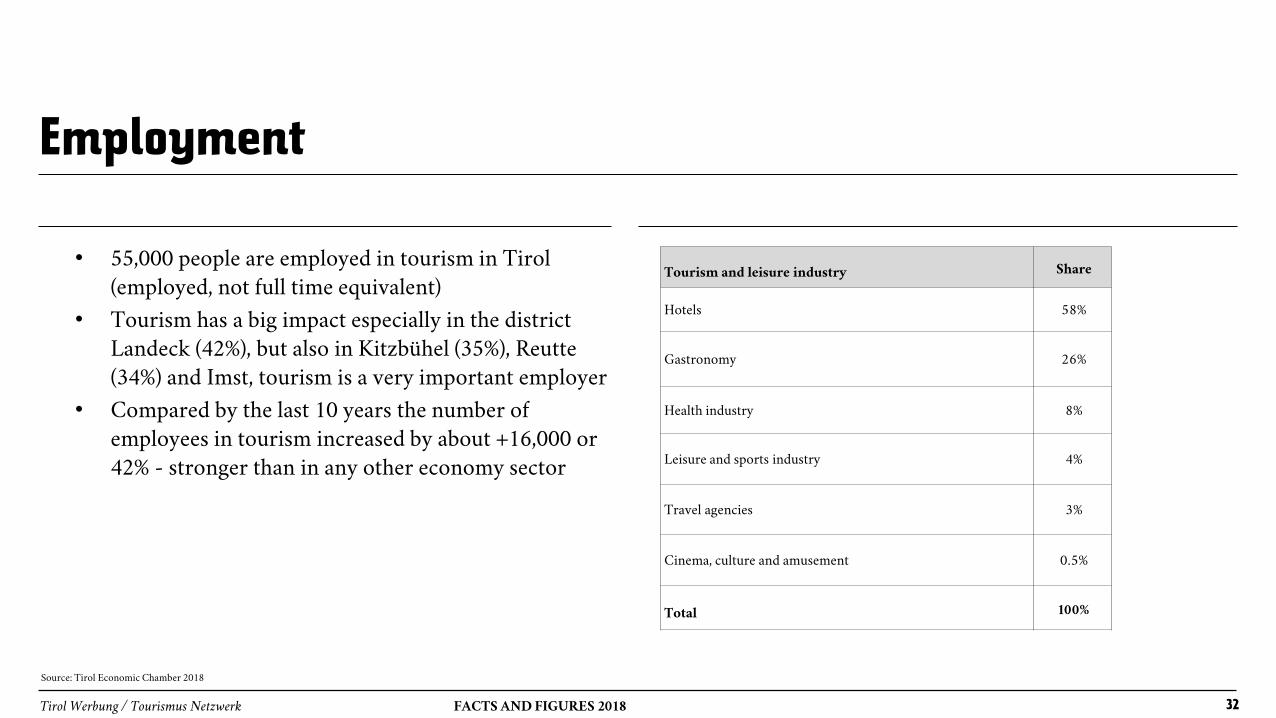
Employment
• 55,000 people are employed in tourism in Tirol
(employed, not full time equivalent)
• Tourism has a big impact especially in the district
Landeck (42%), but also in Kitzbühel (35%), Reutte
(34%) and Imst, tourism is a very important employer
• Compared by the last 10 years the number of
employees in tourism increased by about +16,000 or
42% - stronger than in any other economy sector
Tourism and leisure industry Share
Hotels 58%
Gastronomy 26%
Health industry 8%
Leisure and sports industry 4%
Travel agencies 3%
Cinema, culture and amusement 0.5%
Total 100%
Source: Tirol Economic Chamber 2018
Tirol Werbung / Tourismus Netzwerk FACTS AND FIGURES 2018 33
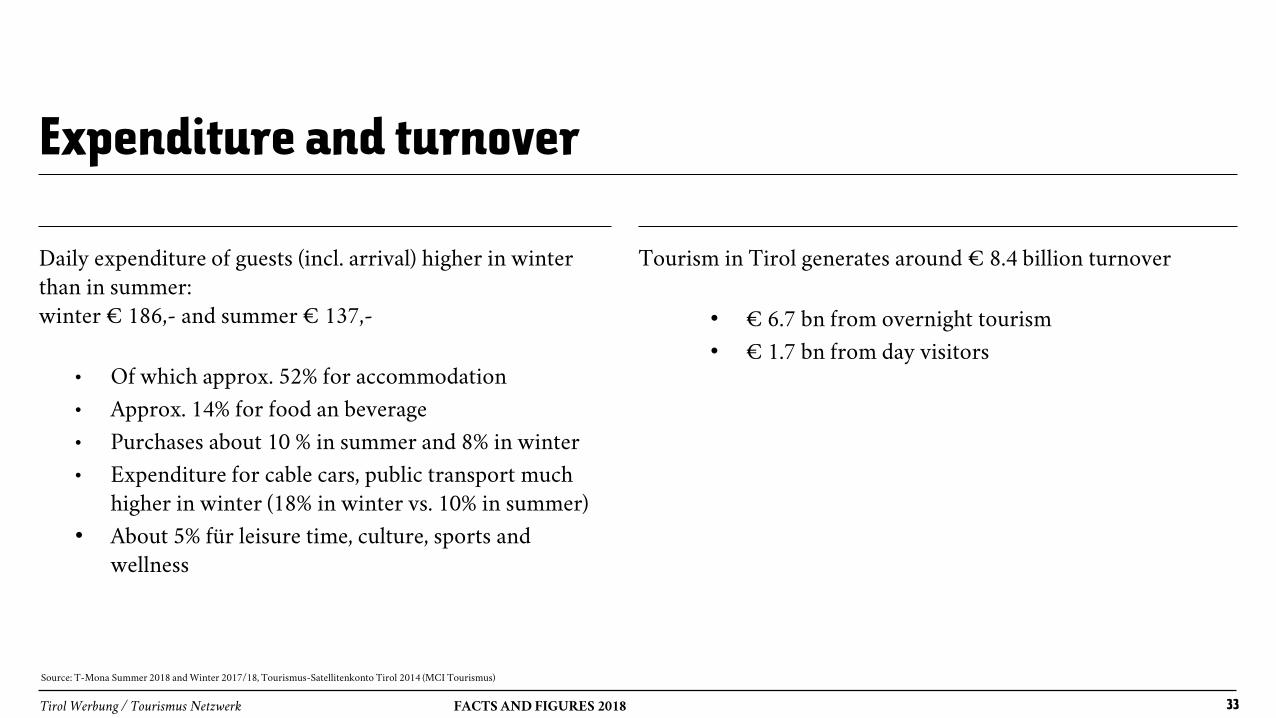
Expenditure and turnover
Daily expenditure of guests (incl. arrival) higher in winter
than in summer:
winter € 186,- and summer € 137,-
• Of which approx. 52% for accommodation
• Approx. 14% for food an beverage
• Purchases about 10 % in summer and 8% in winter
• Expenditure for cable cars, public transport much
higher in winter (18% in winter vs. 10% in summer)
• About 5% für leisure time, culture, sports and
wellness
Tourism in Tirol generates around € 8.4 billion turnover
• € 6.7 bn from overnight tourism
• € 1.7 bn from day visitors
Source: T-Mona Summer 2018 and Winter 2017/18, Tourismus-Satellitenkonto Tirol 2014 (MCI Tourismus)
Tirol Werbung / Tourismus Netzwerk FACTS AND FIGURES 2018 34
Value creation
• Direct tourism value creation for Tirol is approximately € 4.5 bn
• This is 17.5% share of the total value creation of Tirol
• For Austria the share of the direct value creation of tourism in the GDP is 7.0%
• By comparison: Upper Austria 4.0% and Vienna 2.2%
Source: Tourismus-Satellitenkonto Tirol 2014 (MCI Tourismus), Austria 2017, Upper Austria 2016 und Vienna 2015
Tirol Werbung / Tourismus Netzwerk FACTS AND FIGURES 2018 35
Reasons for visiting Tirol
Tirol Werbung / Tourismus Netzwerk FACTS AND FIGURES 2018 36
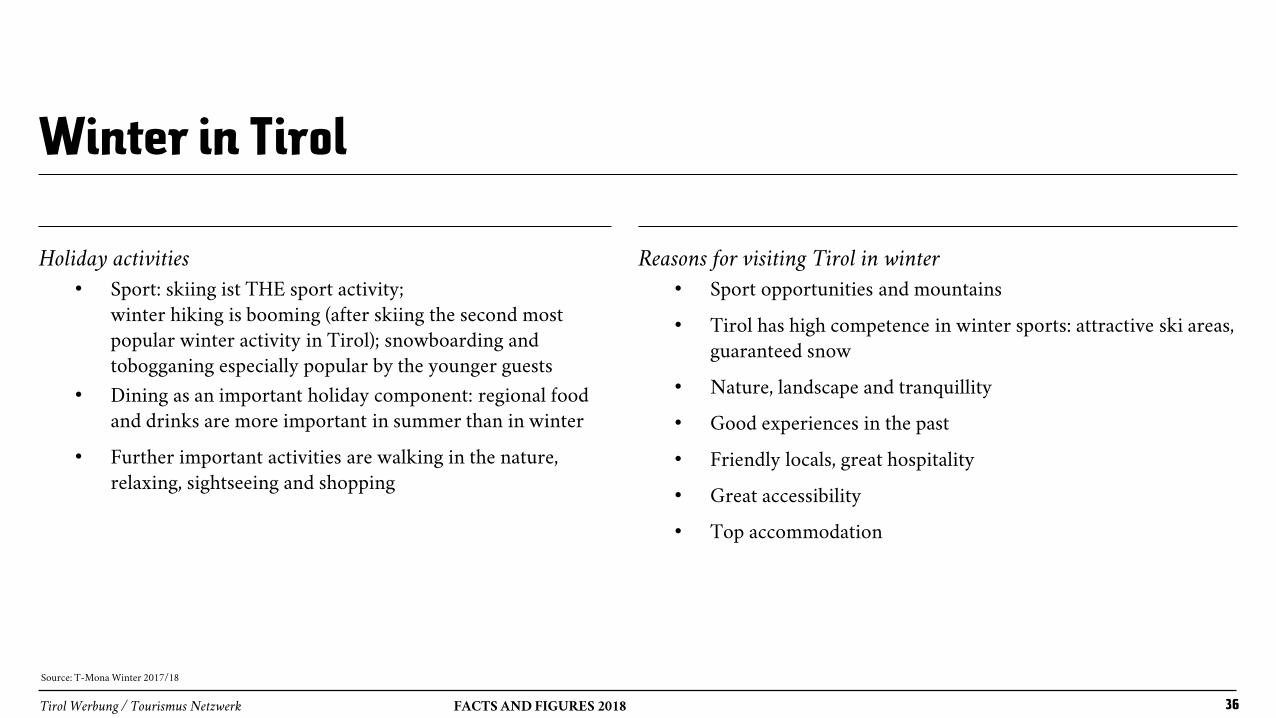
Winter in Tirol
Holiday activities
• Sport: skiing ist THE sport activity;
winter hiking is booming (after skiing the second most
popular winter activity in Tirol); snowboarding and
tobogganing especially popular by the younger guests
• Dining as an important holiday component: regional food
and drinks are more important in summer than in winter
• Further important activities are walking in the nature,
relaxing, sightseeing and shopping
Reasons for visiting Tirol in winter
• Sport opportunities and mountains
• Tirol has high competence in winter sports: attractive ski areas,
guaranteed snow
• Nature, landscape and tranquillity
• Good experiences in the past
• Friendly locals, great hospitality
• Great accessibility
• Top accommodation
Source: T-Mona Winter 2017/18
Tirol Werbung / Tourismus Netzwerk FACTS AND FIGURES 2018 37
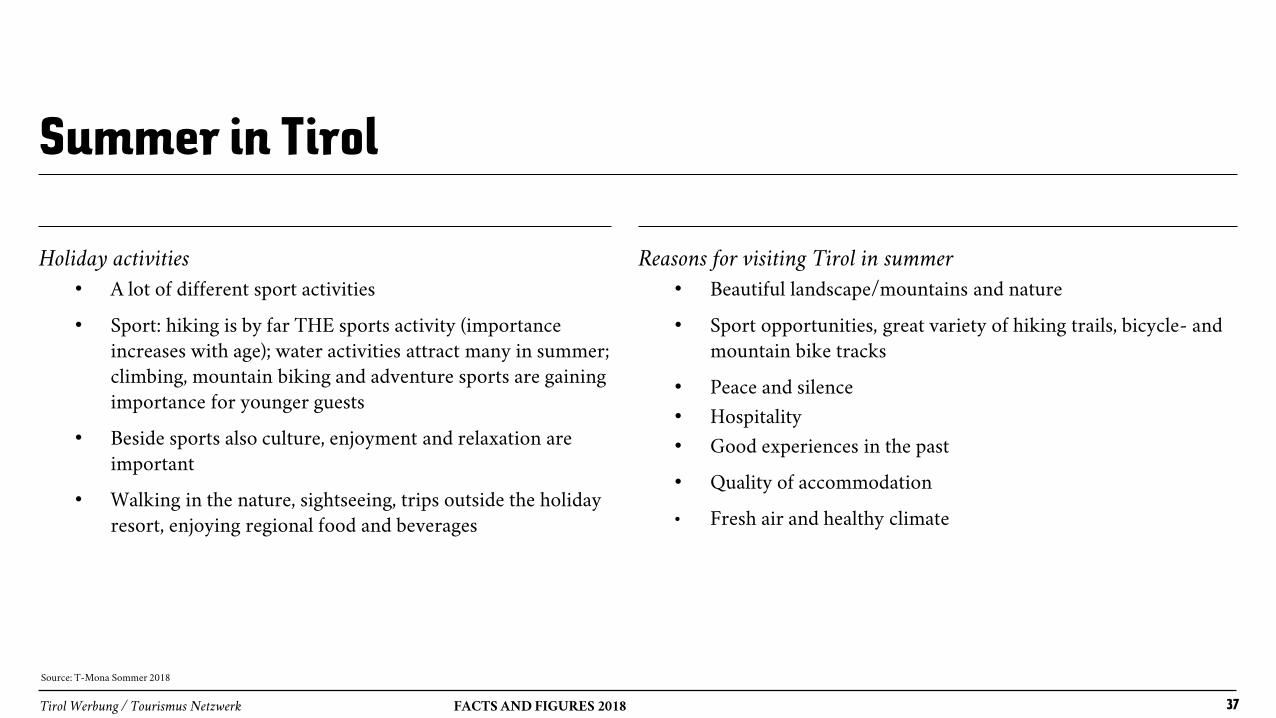
Summer in Tirol
Holiday activities
• A lot of different sport activities
• Sport: hiking is by far THE sports activity (importance
increases with age); water activities attract many in summer;
climbing, mountain biking and adventure sports are gaining
importance for younger guests
• Beside sports also culture, enjoyment and relaxation are
important
• Walking in the nature, sightseeing, trips outside the holiday
resort, enjoying regional food and beverages
Reasons for visiting Tirol in summer
• Beautiful landscape/mountains and nature
• Sport opportunities, great variety of hiking trails, bicycle- and
mountain bike tracks
• Peace and silence
• Hospitality
• Good experiences in the past
• Quality of accommodation
• Fresh air and healthy climate
Source: T-Mona Sommer 2018
Tirol Werbung / Tourismus Netzwerk FACTS AND FIGURES 2018 38
Tirol Werbung GmbH
Marktforschung
Julia Vögele, B.A.
Maria-Theresien-Straße 55
6020 Innsbruck · Österreich
+43.512.5320-236
+43.512.5320-92236
www.tirol.at
t
f
e
w
Related Documents