Time Series “ “ The Art of The Art of Forecasting” Forecasting”

Welcome message from author
This document is posted to help you gain knowledge. Please leave a comment to let me know what you think about it! Share it to your friends and learn new things together.
Transcript
Time Series
““The Art of Forecasting”The Art of Forecasting”
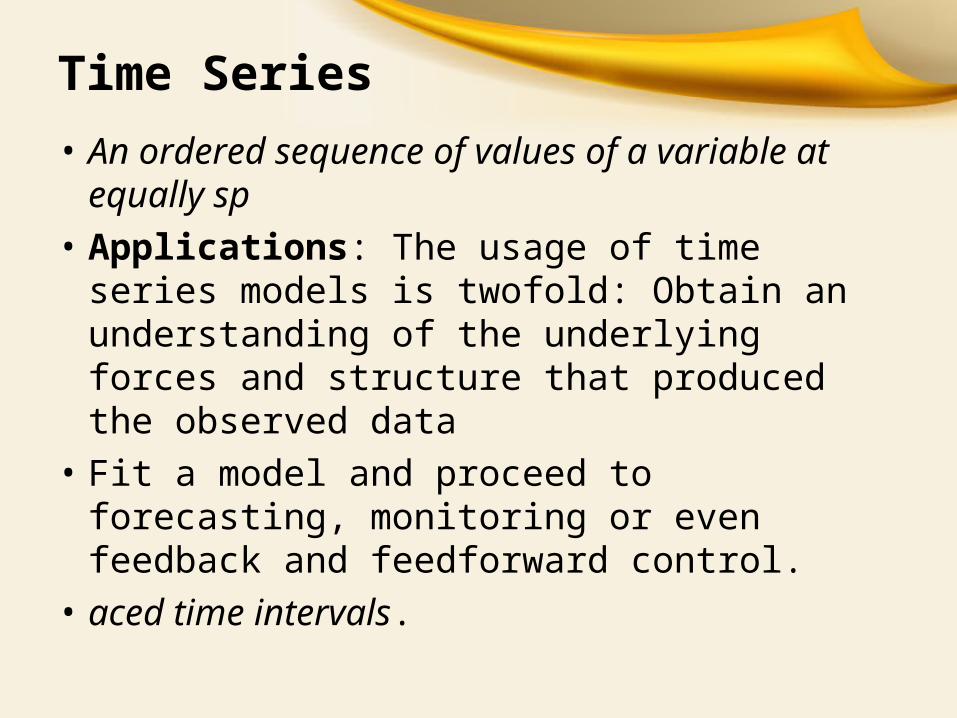
Time Series• An ordered sequence of values of a variable
at equally sp• Applications: The usage of time series
models is twofold: Obtain an understanding of the underlying forces and structure that produced the observed data
• Fit a model and proceed to forecasting, monitoring or even feedback and feedforward control.
• aced time intervals.
• Time Series Analysis is used for many applications such as: Economic Forecasting
• Sales Forecasting• Budgetary Analysis• Stock Market Analysis• Yield Projections• Process and Quality Control• Inventory Studies• Utility Studies• Census Analysis• and many, many more...

Time Series Components
Time Series Components
TrendTrend
Time Series Components
TrendTrend CyclicalCyclical
Time Series Components
TrendTrend
SeasonalSeasonal
CyclicalCyclical
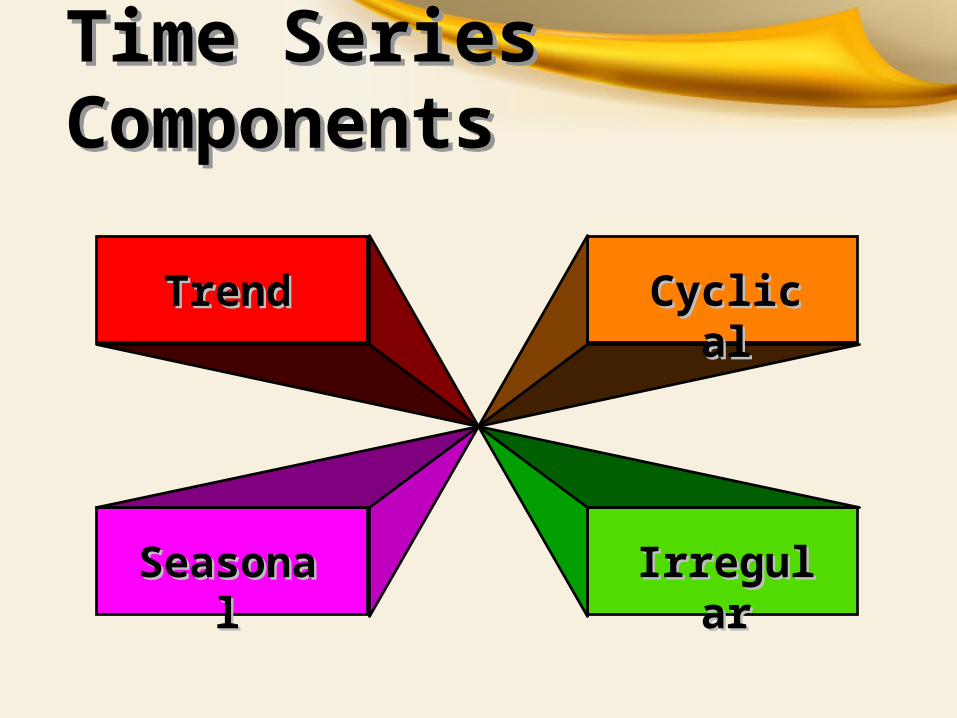
Time Series Components
TrendTrend
SeasonalSeasonal
CyclicalCyclical
IrregularIrregular
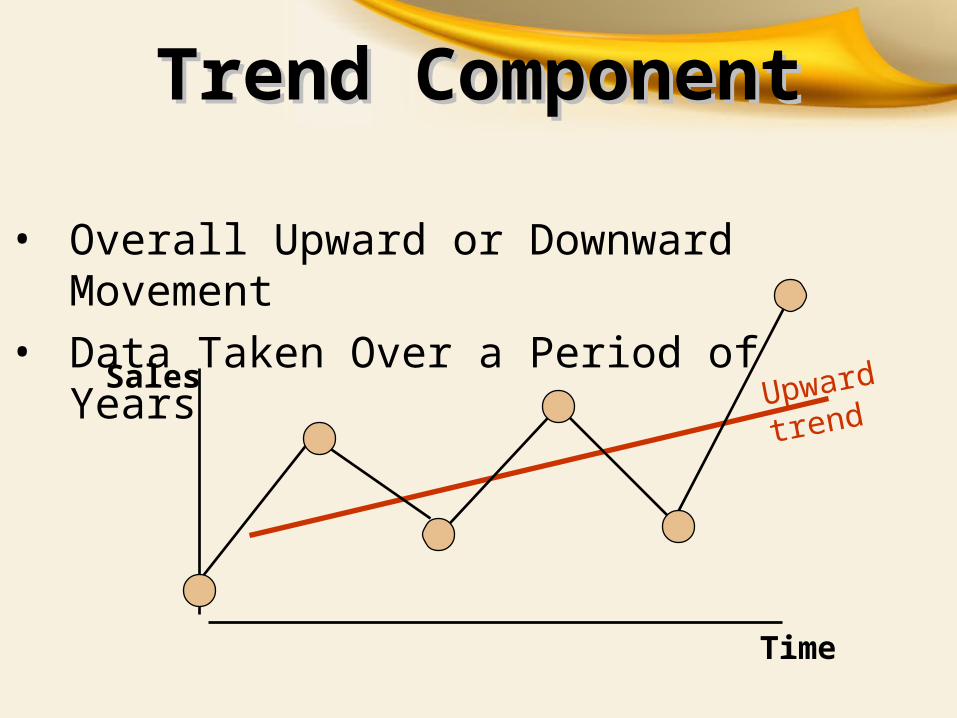
Trend ComponentTrend Component
• Overall Upward or Downward Movement• Data Taken Over a Period of Years
Sales
Time
Upward trend
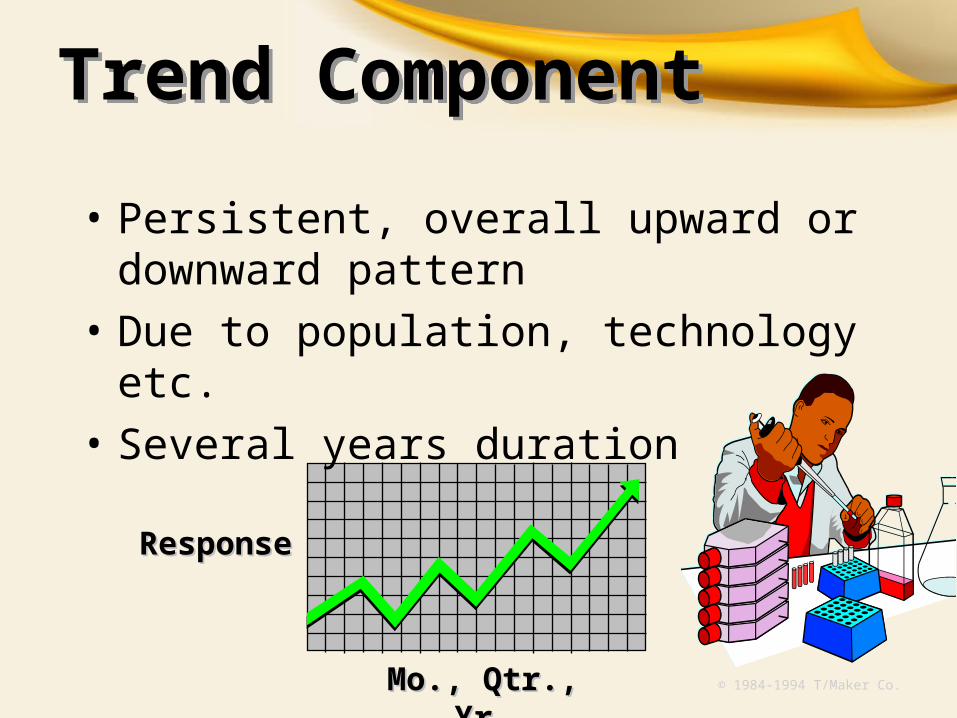
Trend Component
• Persistent, overall upward or downward pattern
• Due to population, technology etc.• Several years duration
Mo., Qtr., Yr.Mo., Qtr., Yr.
ResponseResponse
© 1984-1994 T/Maker Co.
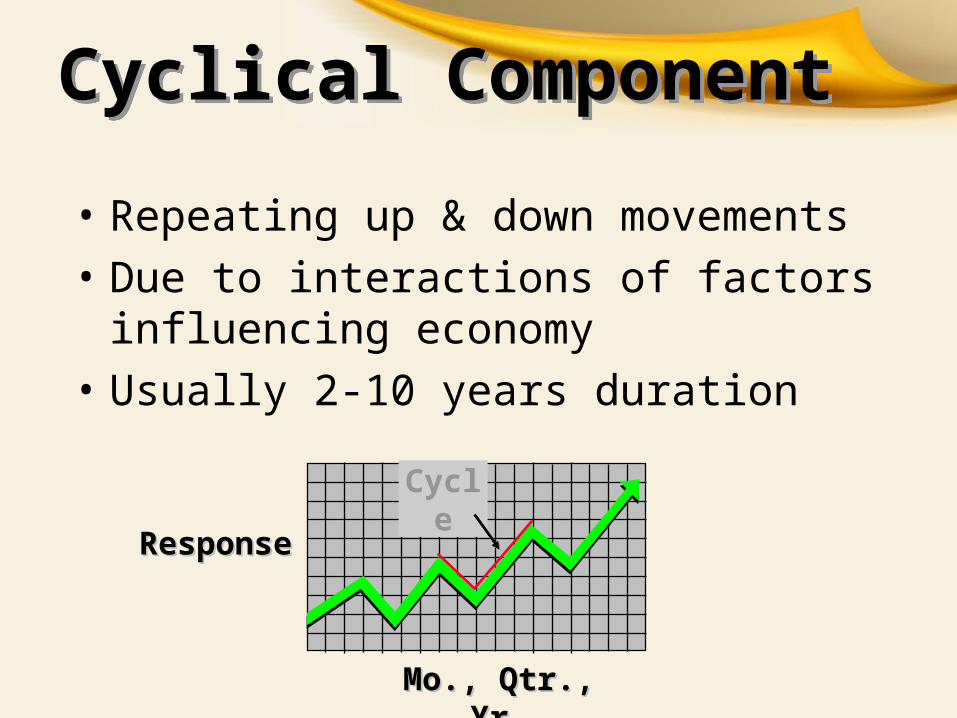
Cyclical Component
• Repeating up & down movements• Due to interactions of factors influencing
economy• Usually 2-10 years duration
Mo., Qtr., Yr.Mo., Qtr., Yr.
ResponseResponseCycle
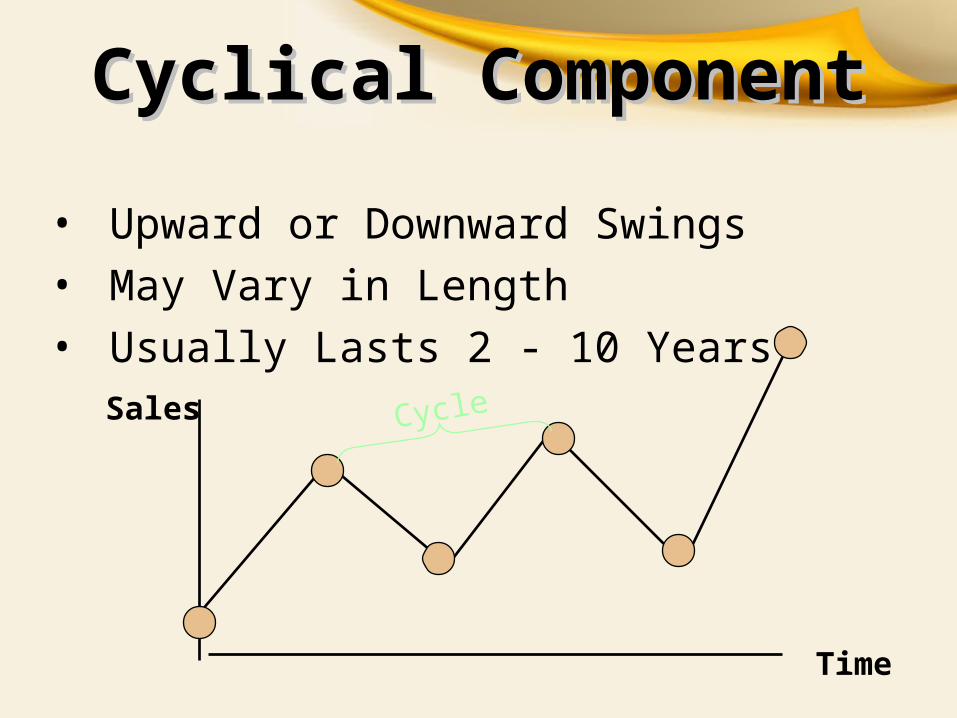
Cyclical ComponentCyclical Component
• Upward or Downward Swings• May Vary in Length• Usually Lasts 2 - 10 Years
Sales
Time
Cycle
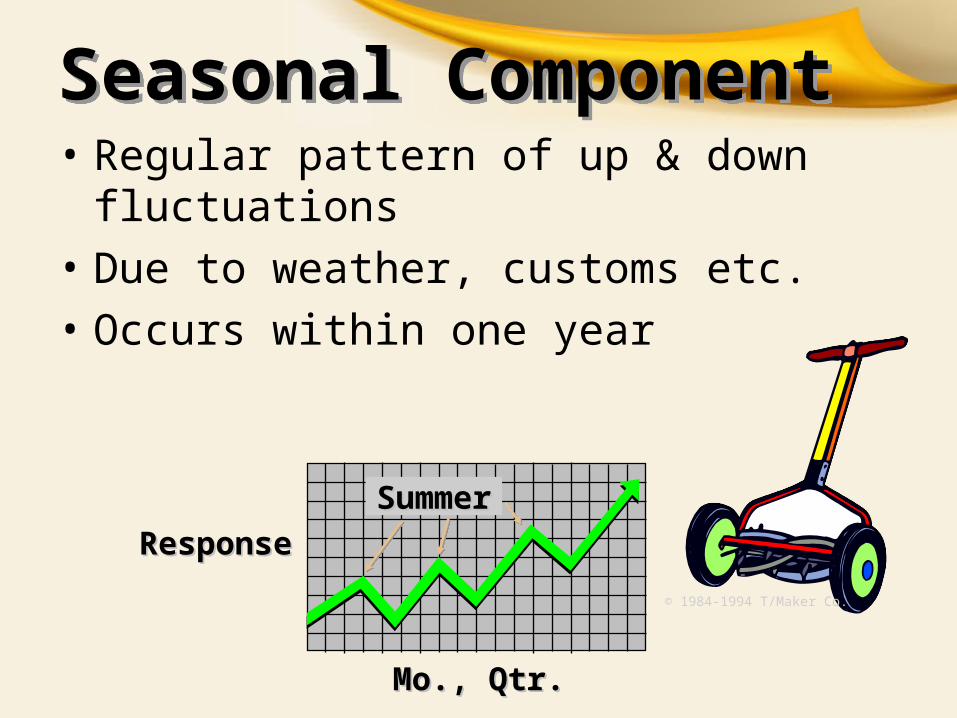
Seasonal Component• Regular pattern of up & down fluctuations• Due to weather, customs etc.• Occurs within one year
Mo., Qtr.Mo., Qtr.
ResponseResponseSummerSummer
© 1984-1994 T/Maker Co.
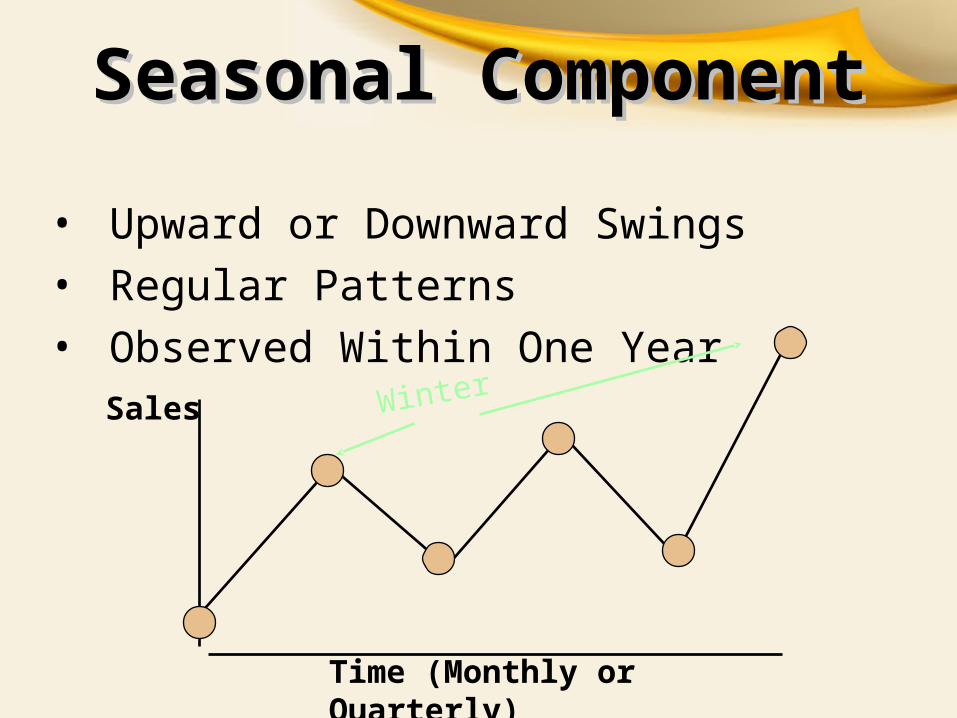
Seasonal ComponentSeasonal Component
• Upward or Downward Swings• Regular Patterns• Observed Within One Year
Sales
Time (Monthly or Quarterly)
Winter
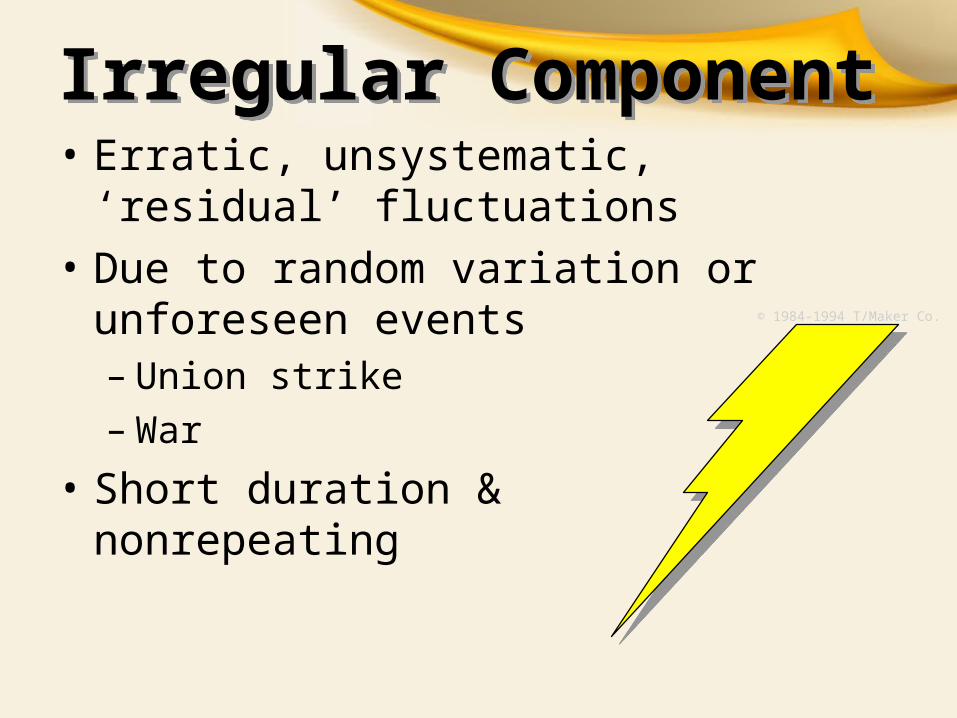
Irregular Component• Erratic, unsystematic, ‘residual’
fluctuations• Due to random variation or unforeseen
events– Union strike– War
• Short duration & nonrepeating
© 1984-1994 T/Maker Co.
Random or Irregular Random or Irregular ComponentComponent
• Erratic, Nonsystematic, Random, ‘Residual’ Fluctuations
• Due to Random Variations of – Nature
– Accidents
• Short Duration and Non-repeating
What Is Forecasting?What Is Forecasting?• Process of predicting a
future event• Underlying basis of
all business decisions– Production– Inventory– Personnel– Facilities
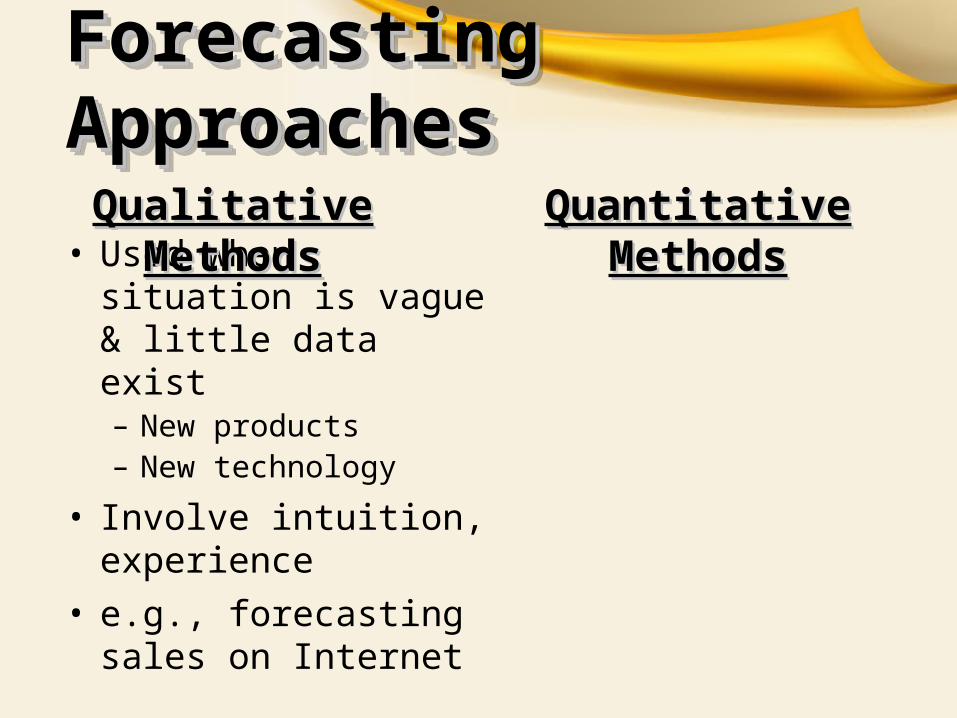
• Used when situation is vague & little data exist– New products– New technology
• Involve intuition, experience
• e.g., forecasting sales on Internet
Qualitative MethodsQualitative Methods
Forecasting ApproachesForecasting ApproachesQuantitative MethodsQuantitative Methods
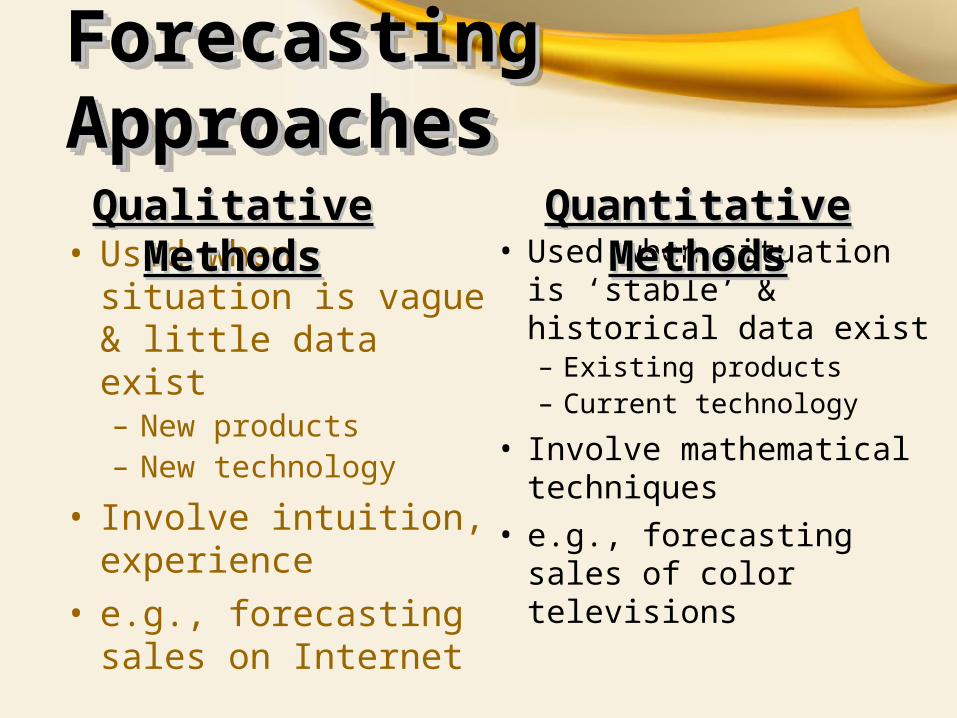
• Used when situation is ‘stable’ & historical data exist– Existing products– Current technology
• Involve mathematical techniques
• e.g., forecasting sales of color televisions
Quantitative MethodsQuantitative Methods
Forecasting ApproachesForecasting Approaches
• Used when situation is vague & little data exist– New products– New technology
• Involve intuition, experience
• e.g., forecasting sales on Internet
Qualitative MethodsQualitative Methods
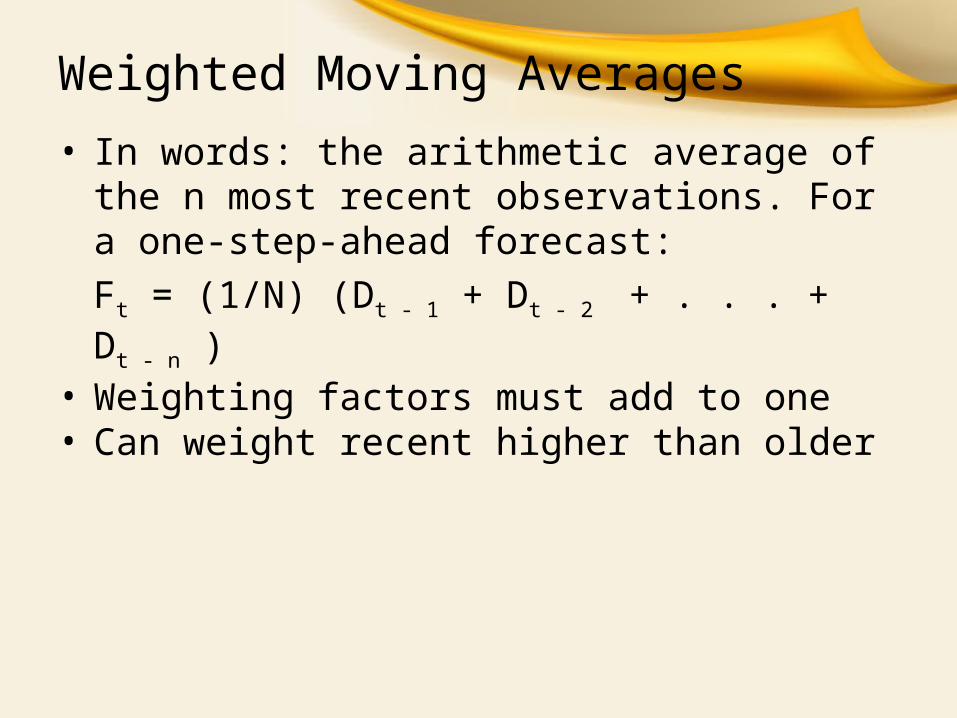
Weighted Moving Averages• In words: the arithmetic average of the n most
recent observations. For a one-step-ahead forecast: Ft = (1/N) (Dt - 1 + Dt - 2 + . . . + Dt - n )
• Weighting factors must add to one• Can weight recent higher than older

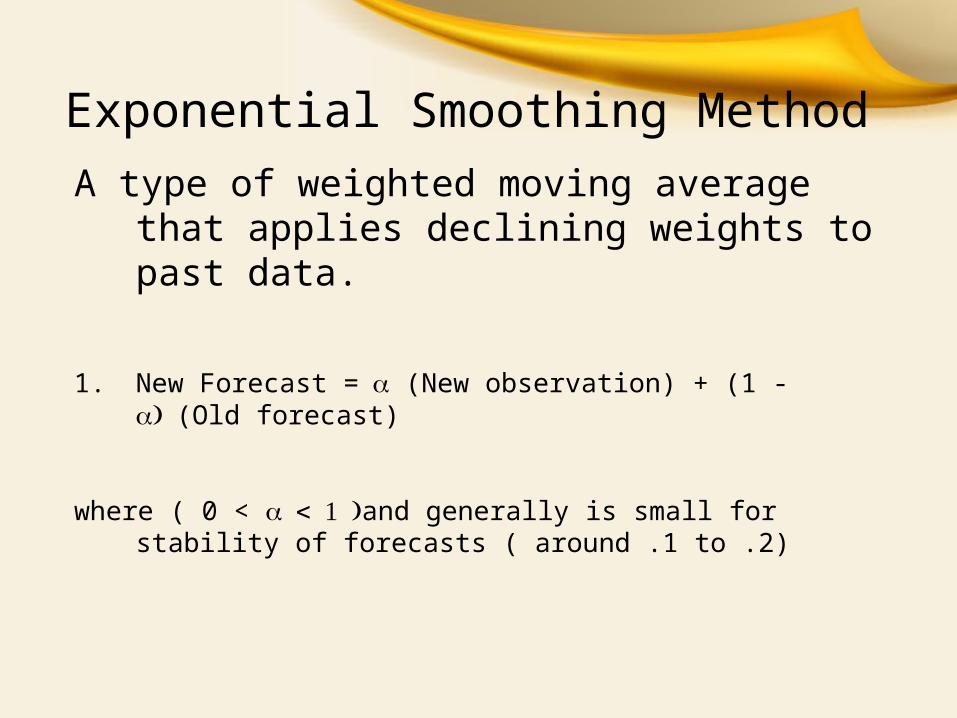
Exponential Smoothing MethodA type of weighted moving average that applies
declining weights to past data.
1. New Forecast = (New observation) + (1 - (Old forecast)
where ( 0 < and generally is small for stability of forecasts ( around .1 to .2)
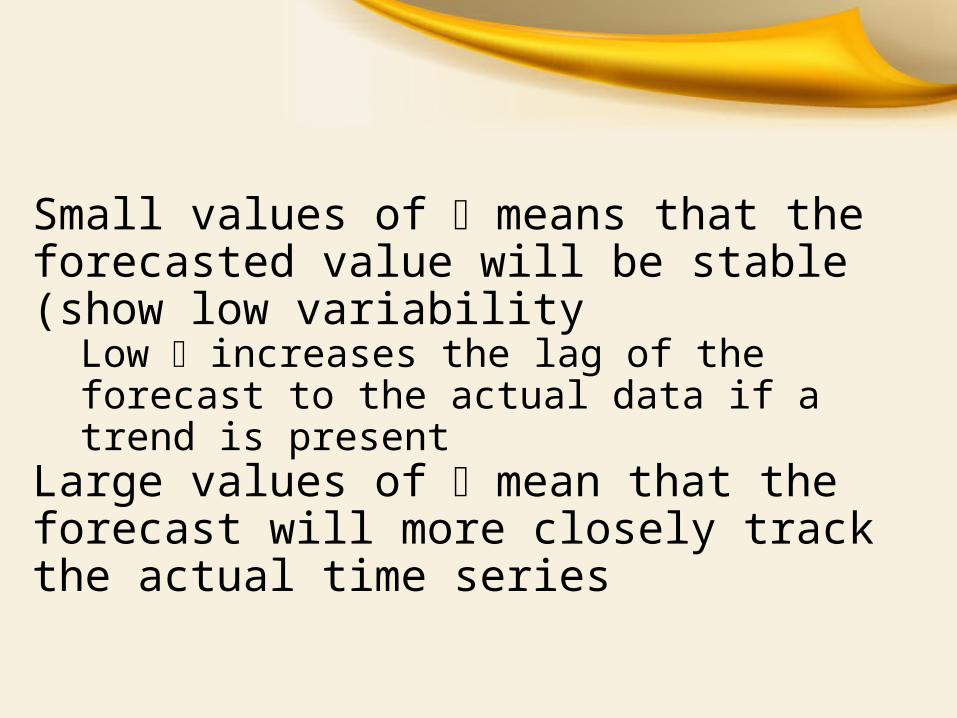
Small values of means that the forecasted value will be stable (show low variability
Low increases the lag of the forecast to the actual data if a trend is present
Large values of mean that the forecast will more closely track the actual time series
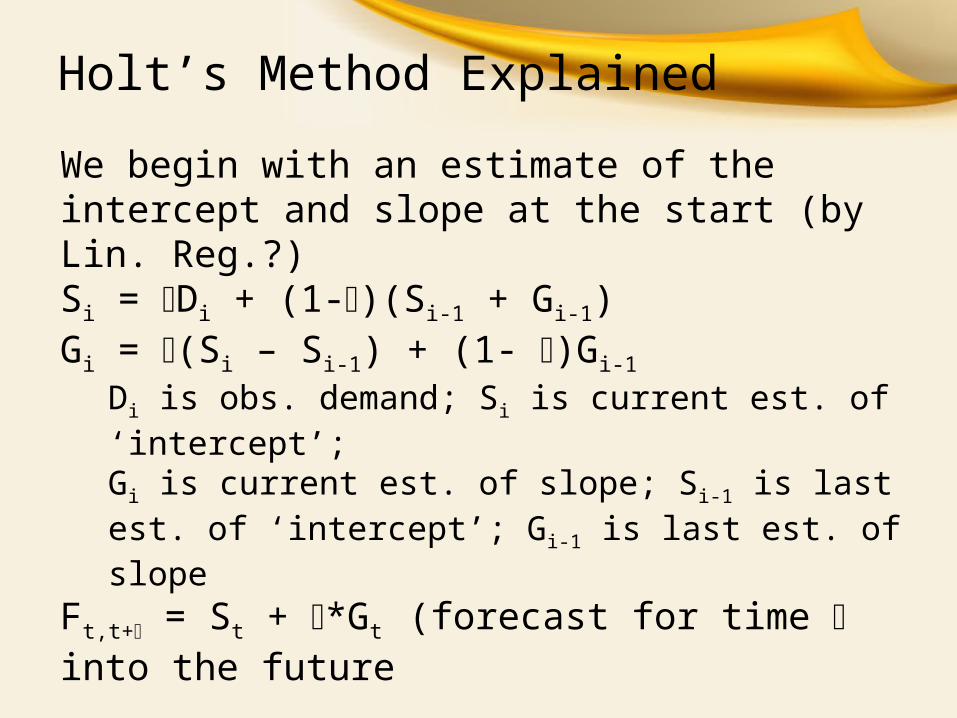
Holt’s Method Explained
We begin with an estimate of the intercept and slope at the start (by Lin. Reg.?)Si = Di + (1-)(Si-1 + Gi-1)Gi = (Si – Si-1) + (1- )Gi-1
Di is obs. demand; Si is current est. of ‘intercept’;Gi is current est. of slope; Si-1 is last est. of ‘intercept’; Gi-1 is last est. of slope
Ft,t+ = St + *Gt (forecast for time into the future
Exploring Winter’s Method
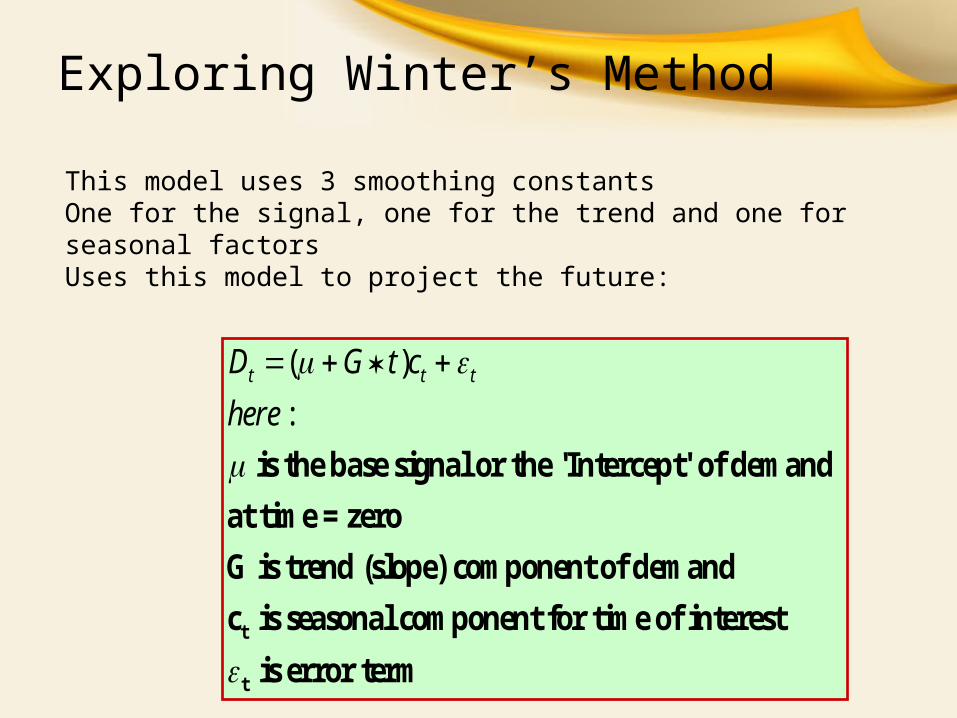
This model uses 3 smoothing constantsOne for the signal, one for the trend and one for seasonal factorsUses this model to project the future:
( ):
t
t
is the base signal or the 'Intercept' of demand at time = zeroG is trend (slope) component of demandc is seasonal component for time of interest
is error term
t t tD G t chere
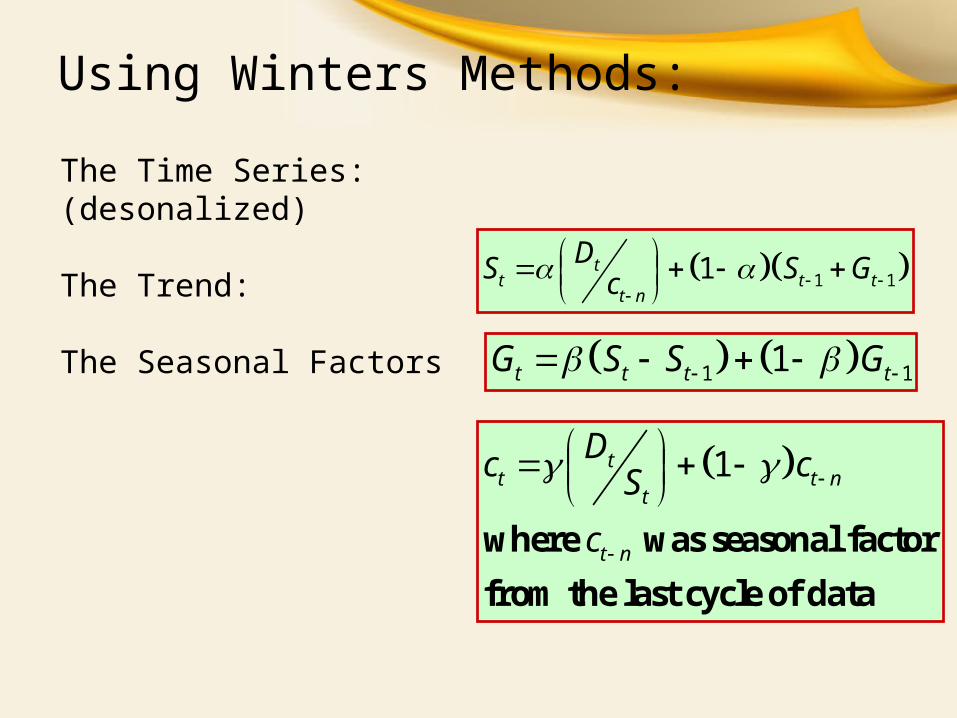
Using Winters Methods:
The Time Series:(desonalized)
The Trend:
The Seasonal Factors
1 11tt t t
t n
DS S Gc
1 11t t t tG S S G
1
where was seasonal factorfrom the last cycle of data
tt t n
t
t n
Dc cS
c

Thank you
Related Documents