Thermoluminescence in ultra-high dilution research R. van Wijk, S. Bosman and E. P. A. van Wijk Abstract Objective Thermoluminescence of homeopathically prepared ultra-high dilutions of lithium chloride in D 2 O (10 -30 g cm -3 ; C15 LiCl in D 2 O) and similarly pre- pared D 2 O (C15 D 2 O) was compared in three experiments varying a) time between preparation of substance and time of experimentation, and b) time between irradiation and thermoluminescence recording. Data were also compared with a normal solution 0.1 M LiCl in D 2 O and with pure D 2 O. Methods To record thermoluminescence, the solutions were frozen in liquid nitrogen (77K, -196 o C), irradiated with 1kGY, and after a succession of definite storage periods, were progressively rewarmed to 238K (-35 o C). Results Thermoluminescence patterns of C15 LiCl in D 2 O, C15 D 2 O and D 2 O were similar. The average thermoluminescence intensity of C15 LiCl in D 2 O tends to be less than C15 D 2 O when tests were performed shortly after preparation of the substances and with short storage time between irradia- tion and recording of thermoluminescence. Thermoluminescence of D 2 O was significantly lower than from C15 D 2 O, particularly when the time between irradiation and recording was increased.

Welcome message from author
This document is posted to help you gain knowledge. Please leave a comment to let me know what you think about it! Share it to your friends and learn new things together.
Transcript
Thermoluminescence in ultra-high dilution research R. van Wijk, S. Bosman and E. P. A. van Wijk
Abstract
Objective
Thermoluminescence of homeopathically prepared ultra-high dilutions of lithium chloride in D2O (10-30 g cm-3 ; C15 LiCl in D2O) and similarly pre-pared D2O (C15 D2O) was compared in three experiments varying a) time between preparation of substance and time of experimentation, and b) time between irradiation and thermoluminescence recording. Data were also compared with a normal solution 0.1 M LiCl in D2O and with pure D2O. Methods
To record thermoluminescence, the solutions were frozen in liquid nitrogen (77K, -196oC), irradiated with 1kGY, and after a succession of definite storage periods, were progressively rewarmed to 238K (-35oC). Results
Thermoluminescence patterns of C15 LiCl in D2O, C15 D2O and D2O were similar. The average thermoluminescence intensity of C15 LiCl in D2O tends to be less than C15 D2O when tests were performed shortly after preparation of the substances and with short storage time between irradia-tion and recording of thermoluminescence. Thermoluminescence of D2O was significantly lower than from C15 D2O, particularly when the time between irradiation and recording was increased.
170 Thermoluminescence in ultra-high dilution research
Conclusion
The nature of the phenomena described here still remains unexplained. Nevertheless, data suggest that thermoluminescence might be developed into a promising tool to study homeopathically prepared ultra-high dilu-tions. Key words
Thermoluminescence, deuterium oxide, lithium chloride, homeopathy, ultra-high dilutions. Introduction
Thermoluminescence is the emission of light from a substance when it is heated. It is not to be confused with the light spontaneously emitted from a material when it is heated to incandescence. It is the thermally stimulated emission of light following the previous absorption of energy from radia-tion. Thermoluminescence is a common tool to study the structure of solids, and it has been utilized following irradiation of samples at room tempera-ture and below room temperature for the purpose of dosimetry, age deter-mination, geology or solid-state defect structure analysis (McKeever, 1985). More recently, it has been investigated as future dating technique for icy bodies in the solar system (Yada et al, 2002).
Low-temperature thermoluminescence was also utilized to study prop-erties of liquids through turning them into stable solids with the use of very low temperatures (Rey, 2000). Utilizing thermoluminescence, an anoma-lous effect was observed with ultra-high dilutions of lithium chloride (10-30 g/cm3), prepared in successive steps alternating vigorous mechanical stirring and 1:100 dilution with deuterium oxide. Although theoretically, such dilutions consist of pure deuterium oxide (D2O), thermoluminescence was reported to differ from that of pure D2O without previously dissolved and diluted lithium chloride (Rey, 2003). Such data resulted in discussions about the memory capacity of ultra-high dilution regarding original salts dissolved initially (Milgrom, 2003).
Introduction 171
D2O frozen in liquid nitrogen and then irradiated demonstrated ther-moluminescence consisting of Peak 1 near 125K (-150oC) and a Peak 2 near 166K (-107oC). The two peaks differ in their induction by irradiation (Rey, 2003). Peak 1 luminescence demonstrated an increase greater than 2 orders of magnitude via a dose range between 1 and 20kGy. Peak 2 showed simi-lar thermoluminescence intensity and an increase in intensity via a dose range of 0.02 to 0.4kGy. The two peaks also differ in emission spectrum. The spectrum of the thermoluminescence of Peak 1 was around 350 nm (Peak 1A) and 660 nm (Peak 1B), whereas the spectrum of Peak 2 demon-strated peaks at 450 nm, 485 nm, 525 nm and 575 nm.
For the purpose of replicating these observations, however, the study was lacking information regarding a) variability in thermoluminescence of Peak 1 and 2 in identically frozen, irradiated and measured samples, b) time between preparation of sample and its utilization in the experiment, and c) time between irradiation of a sample and measurement of thermolumines-cence. The influence of time on thermoluminescence can be twofold. A change, by succussion, in the physical properties of a substance during the preparation of an ultra-high dilution can decrease over time while in stor-age. A change in the activated state following irradiation can also sponta-neously decrease.
The present study was an attempt to provide information on these top-ics. New data were collected for: a) D2O, b) 0.1 M lithium chloride in D2O, c) ultra-high dilutions of D2O prepared by 15 times (C15 D2O) a dilution of 100 fold alternated with vigorous mechanical stirring, and d) ultra-high dilution of lithium chloride in D2O by 15 times (C15 LiCl) a dilution of 100 fold with D2O alternated with vigorous mechanical stirring. Thermolumi-nescence of these samples was determined a) three weeks after their prepa-ration and with only one week at very low temperature storage between irradiation and recording, b) seven weeks after preparation and with two weeks of storage, and c) twelve weeks after preparation and three weeks of storage.
172 Thermoluminescence in ultra-high dilution research
Materials and Methods
Materials
D2O and LiCl were obtained from Sigma-Aldrich, Zwijndrecht, The Neth-erlands. Bottles, 20 ml, brown glass, hydrolytic Class 2, were utilized un-treated from original packaging; all bottles were from the same package. Dilutions were prepared by VSM Geneesmiddelen bv (Alkmaar, The Neth-erlands) according to a standard protocol. First dilution was prepared by solving 0.1 g lithium chloride (Sigma-Aldrich, Zwijndrecht, The Nether-lands) in 9.9 ml of deuterium oxide (D2O; Sigma-Aldrich, Zwijndrecht, The Netherlands). Following solutions were made by dissolving 1 (mass) part of the preceding solution in 99 (mass) parts of D2O. Each solution was pre-pared in a new, clean glass bottle. Between each diluting step, the solutions were mechanically succussed (Klinkhamer apparatus), in a vertical direc-tion (100 strokes in 15 seconds). This procedure was repeated until a „con-centration” of 10-30 was reached (C15 LiCl). The control preparation (C15 D2O) was prepared according to the same procedure with the exception that the first solution existed of 1 part of D2O in 99 parts of D2O. Cleaning be-tween potentizing different substances was performed according to Dutch pharmaceutical regulations. The dilutions and the solutions of 0.1 M LiCl in D2O and pure D2O were stored in tightly closed brown bottles under nitrogen at room temperature. All preparations were made from the same batch of D2O and at the same time. The four solutions were utilized throug-hout the experiment.
Materials and Methods 173
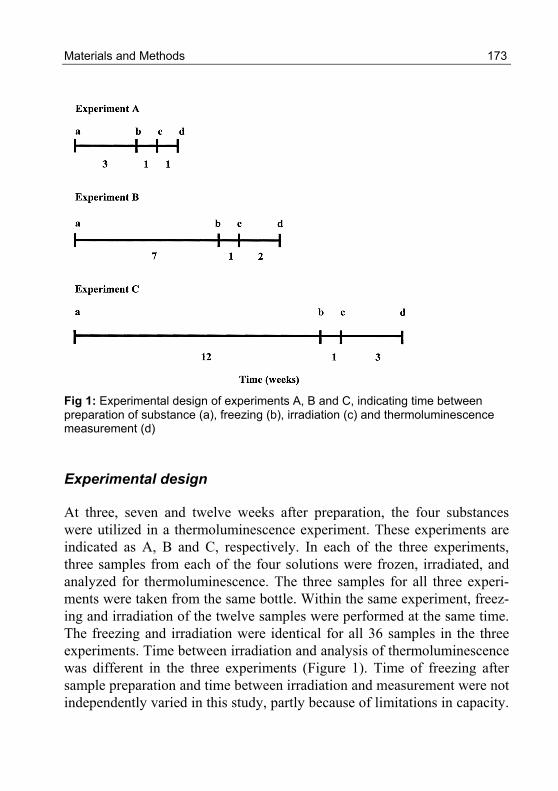
Fig 1: Experimental design of experiments A, B and C, indicating time between preparation of substance (a), freezing (b), irradiation (c) and thermoluminescence measurement (d)
Experimental design
At three, seven and twelve weeks after preparation, the four substances were utilized in a thermoluminescence experiment. These experiments are indicated as A, B and C, respectively. In each of the three experiments, three samples from each of the four solutions were frozen, irradiated, and analyzed for thermoluminescence. The three samples for all three experi-ments were taken from the same bottle. Within the same experiment, freez-ing and irradiation of the twelve samples were performed at the same time. The freezing and irradiation were identical for all 36 samples in the three experiments. Time between irradiation and analysis of thermoluminescence was different in the three experiments (Figure 1). Time of freezing after sample preparation and time between irradiation and measurement were not independently varied in this study, partly because of limitations in capacity.
174 Thermoluminescence in ultra-high dilution research
Thermoluminescence recordings in each experiment were carried out within a period of 36 h.
Freezing and blinding procedure
1 ml of each solution was placed in aluminum test cups of 20 mm diameter and 2 mm depth and frozen to 253K (-20oC). Each test cup had a number and the numbers corresponding with each of the four solutions were noted. The frozen samples were kept one day at 253K to achieve stability of the crystallization pattern. Then, the cups were randomly placed by another person on top of each other in two special holders and immersed into liquid nitrogen and maintained at 77K (-196oC) for one week in a large liquid nitrogen-containing Dewar vessel before irradiation. Samples were main-tained in the same ordered arrangement in the liquid nitrogen during irra-diation. The sequence of the cups in the holder was essentially unknown until after their thermoluminescence was recorded. The thermolumines-cence was recorded by a third person who was not present in any of the previous stages (coding, freezing or irradiation). This person took the sam-ples one after the other from the holder, starting with the upper cup. By recording the number of the cup after the thermoluminescence, it was evi-dent what the sequence in the holder was and which thermoluminescence data corresponded with which of the four solutions. Irradiation
Irradiation of the two holders with cups was performed with the Co-60 source Gammacell 220 Excell (GC220E) from MDS Nordion (Fleurus, Belgium). A special Dewar vessel with a size to fit in the radiation chamber was used. The dose selected was 1kGy. The Average dose rate was ap-proximately 30 cGy/sec; irradiation time was 58 min. This dose was se-lected because it is in the range that thermoluminescence of both Peak 1 and 2 are directly related with the dose (Rey, 2003). The exact absorbed dose distribution in a vertical plane through the central vertical axis of the irradiation chamber is known. After irradiation, all samples were trans-
Materials and Methods 175
ferred into the large liquid nitrogen container for one, two or three weeks before thermoluminescence measurements.
Thermoluminescence equipment and procedure
Thermoluminescence equipment (JMD electronique, Montelier, France) was equipped with a Statop 4849 temperature controller (Chauvin Arnoux, Vaulx en Velin, France). For each measurement, the Dewar of the ther-moluminescence equipment was filled with liquid nitrogen. When the alu-minum temperature block had reached 78K, a cup was transferred rapidly to the block and heating was started. The average time to increase the tem-perature of the block was approximately 20 min before the sensors regis-tered a linear increase of temperature in time. Temperature increase was 6oC per min from 85K to 235K. Thermoluminescence produced by the sample reached the photomultiplier at a distance of 216 mm utilizing a steel tube with reflecting walls.
Photomultiplier
The photomultiplier connected to the thermoluminescence equipment was a 9235QB, selected type, photomultiplier in a single-counting mode from Electron Tubes Limited (Ruislip, England). The photomultiplier has a win-dow of 52-mm diameter and a spectral sensitivity range of 200 to 650 nm, allowing optimal detection of Peak 1A and Peak 2. The front ring of the photomultiplier was vented inside, avoiding the condensation of moisture at the quartz window. The photomultiplier was maintained at a temperature of 238K (-25oC) to reduce the dark current. The dark current during the ex-perimental period was 5.1±0.3 cps.
176 Thermoluminescence in ultra-high dilution research
Results
D2O and solution of 0.1 M LiCl in D2O
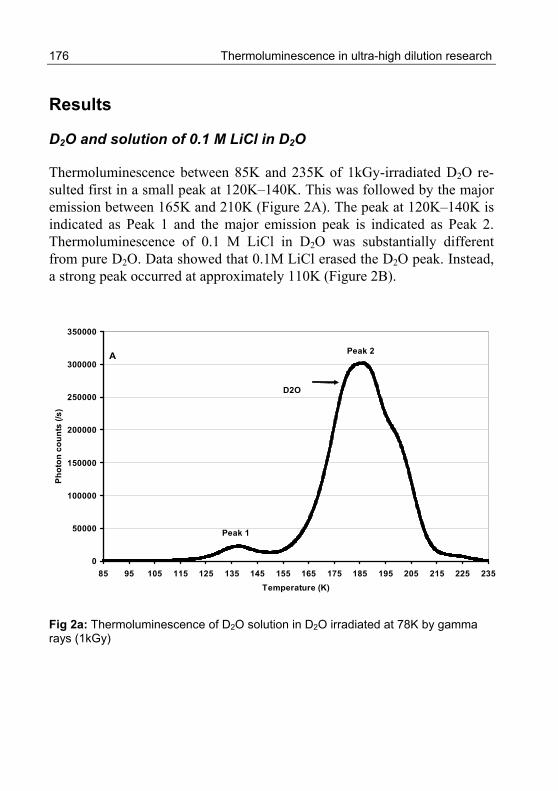
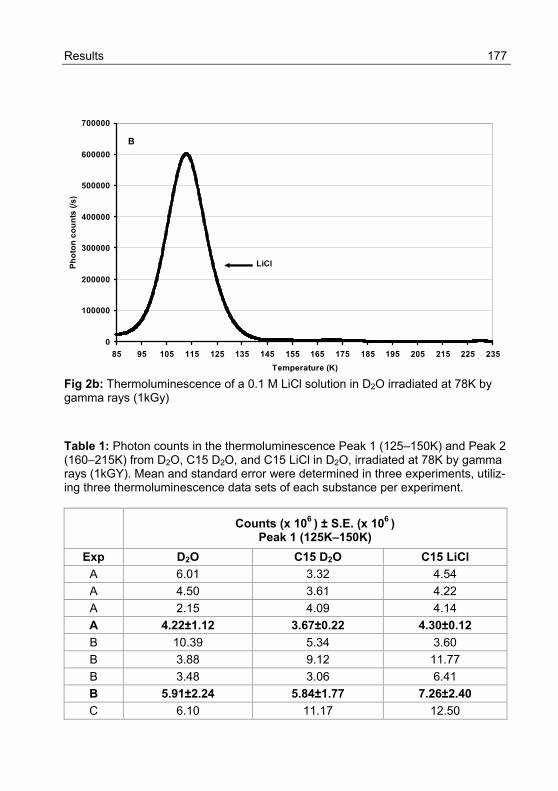
Thermoluminescence between 85K and 235K of 1kGy-irradiated D2O re-sulted first in a small peak at 120K–140K. This was followed by the major emission between 165K and 210K (Figure 2A). The peak at 120K–140K is indicated as Peak 1 and the major emission peak is indicated as Peak 2. Thermoluminescence of 0.1 M LiCl in D2O was substantially different from pure D2O. Data showed that 0.1M LiCl erased the D2O peak. Instead, a strong peak occurred at approximately 110K (Figure 2B).
A
0
50000
100000
150000
200000
250000
300000
350000
85 95 105 115 125 135 145 155 165 175 185 195 205 215 225 235Temperature (K)
Phot
on c
ount
s (/s
)
D2O
Peak 1
Peak 2
Fig 2a: Thermoluminescence of D2O solution in D2O irradiated at 78K by gamma rays (1kGy)
Results 177
0
100000
200000
300000
400000
500000
600000
700000
85 95 105 115 125 135 145 155 165 175 185 195 205 215 225 235Temperature (K)
Phot
on c
ount
s (/s
)
B
LiCl
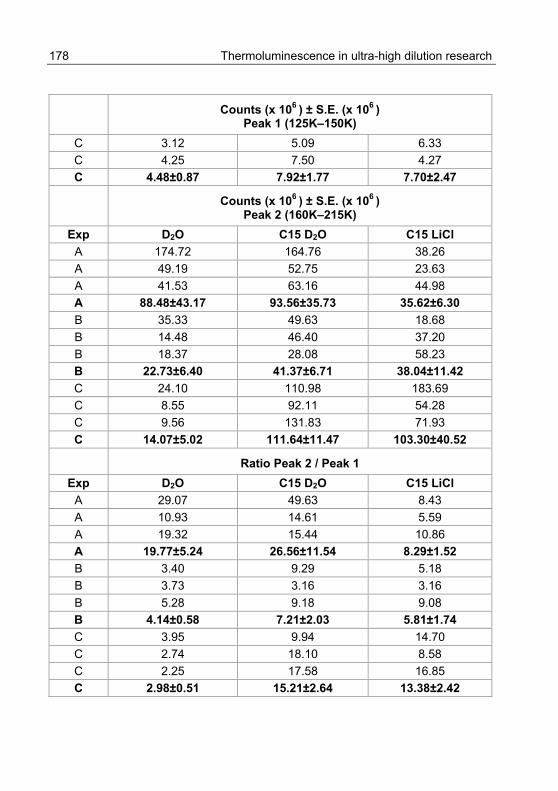
Fig 2b: Thermoluminescence of a 0.1 M LiCl solution in D2O irradiated at 78K by gamma rays (1kGy) Table 1: Photon counts in the thermoluminescence Peak 1 (125–150K) and Peak 2 (160–215K) from D2O, C15 D2O, and C15 LiCl in D2O, irradiated at 78K by gamma rays (1kGY). Mean and standard error were determined in three experiments, utiliz-ing three thermoluminescence data sets of each substance per experiment.
Counts (x 106 ) ± S.E. (x 106 ) Peak 1 (125K–150K)
Exp D2O C15 D2O C15 LiCl A 6.01 3.32 4.54 A 4.50 3.61 4.22 A 2.15 4.09 4.14 A 4.22±1.12 3.67±0.22 4.30±0.12 B 10.39 5.34 3.60 B 3.88 9.12 11.77 B 3.48 3.06 6.41 B 5.91±2.24 5.84±1.77 7.26±2.40 C 6.10 11.17 12.50
178 Thermoluminescence in ultra-high dilution research
Counts (x 106 ) ± S.E. (x 106 ) Peak 1 (125K–150K)
C 3.12 5.09 6.33 C 4.25 7.50 4.27 C 4.48±0.87 7.92±1.77 7.70±2.47
Counts (x 106 ) ± S.E. (x 106 ) Peak 2 (160K–215K)
Exp D2O C15 D2O C15 LiCl A 174.72 164.76 38.26 A 49.19 52.75 23.63 A 41.53 63.16 44.98 A 88.48±43.17 93.56±35.73 35.62±6.30 B 35.33 49.63 18.68 B 14.48 46.40 37.20 B 18.37 28.08 58.23 B 22.73±6.40 41.37±6.71 38.04±11.42 C 24.10 110.98 183.69 C 8.55 92.11 54.28 C 9.56 131.83 71.93 C 14.07±5.02 111.64±11.47 103.30±40.52
Ratio Peak 2 / Peak 1 Exp D2O C15 D2O C15 LiCl
A 29.07 49.63 8.43 A 10.93 14.61 5.59 A 19.32 15.44 10.86 A 19.77±5.24 26.56±11.54 8.29±1.52 B 3.40 9.29 5.18 B 3.73 3.16 3.16 B 5.28 9.18 9.08 B 4.14±0.58 7.21±2.03 5.81±1.74 C 3.95 9.94 14.70 C 2.74 18.10 8.58 C 2.25 17.58 16.85 C 2.98±0.51 15.21±2.64 13.38±2.42
Results 179
Effect of succussion
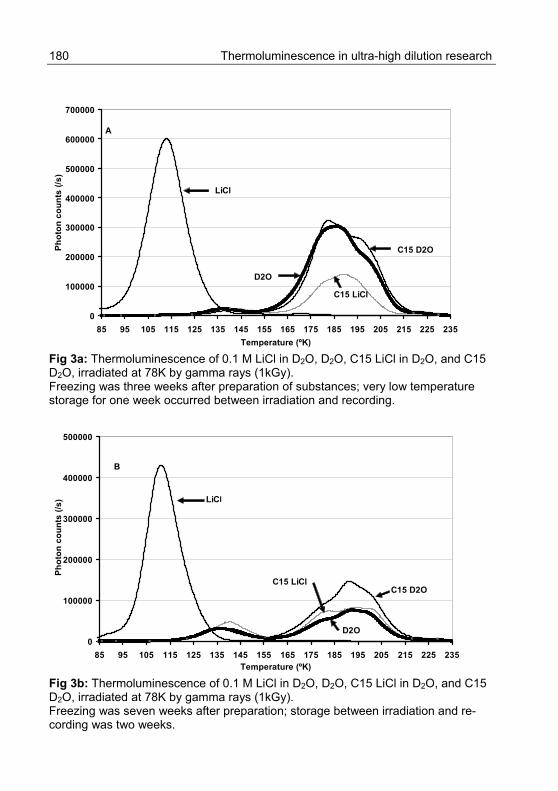
The stepwise repetition of succussion and dilution of D2O with non-succussed D2O resulted in C15 D2O. Similarly, such stepwise procedure starting with LiCl resulted in potentized LiCl in D2O (C15 LiCl in D2O). Figure 3 shows the average thermoluminescence patterns of LiCl, D2O, C15 D2O and C15 LiCl in D2O in the experiments A (Figure 3A), B (Figure 3B) and C (Figure 3C).
These experiments differed in time after preparation of substances and time between irradiation and analysis of thermoluminescence. In experi-ment A, samples were tested three weeks after their preparation and with only 1 week storage at 78K, after their radiation. In experiments B and C the samples were tested at seven and twelve weeks after preparation, and with two and three weeks storage at 78K, respectively. Quantitative infor-mation including mean and standard error of the counts of thermolumines-cence in the different peaks is given in Table 1.
Our experiments clearly show that the variability of the Peak 2 ther-moluminescence increases with its mean. Consequently, for further statisti-cal analysis we took all data to its logarithm, thus achieving homogenous variances across all conditions and substances. Next, we fitted a two-way analysis of variances (ANOVAs) to the data where the conditions (A, B, or C), the substances (D2O, C15 D2O and C15 LiCl) and the condition-substance interaction were taken as fixed factors.
From this model we can conclude that C15 LiCl does not significantly differ from C15 D2O in experiments B and C (p = 0.72, and p = 0.63, ANOVA t-tests). In experiment A, there tends to be a difference between both groups (p = 0.059, ANOVA t-test). Moreover, in experiment C D2O statistically differs from C15 D2O (p<0.0001, ANOVA t-test).
180 Thermoluminescence in ultra-high dilution research
A
0
100000
200000
300000
400000
500000
600000
700000
85 95 105 115 125 135 145 155 165 175 185 195 205 215 225 235Temperature (ºK)
Phot
on c
ount
s (/s
)
C15 LiCl
D2O
C15 D2O
LiCl
Fig 3a: Thermoluminescence of 0.1 M LiCl in D2O, D2O, C15 LiCl in D2O, and C15 D2O, irradiated at 78K by gamma rays (1kGy). Freezing was three weeks after preparation of substances; very low temperature storage for one week occurred between irradiation and recording.
B
0
100000
200000
300000
400000
500000
85 95 105 115 125 135 145 155 165 175 185 195 205 215 225 235Temperature (ºK)
Phot
on c
ount
s (/s
) LiCl
D2O
C15 D2O
C15 LiCl
Fig 3b: Thermoluminescence of 0.1 M LiCl in D2O, D2O, C15 LiCl in D2O, and C15 D2O, irradiated at 78K by gamma rays (1kGy). Freezing was seven weeks after preparation; storage between irradiation and re-cording was two weeks.
Discussion 181
C
0
100000
200000
300000
400000
500000
600000
700000
85 95 105 115 125 135 145 155 165 175 185 195 205 215 225 235Temperature (ºK)
Phot
on c
ount
s (/s
)
LiCl
C15 LiCl D2O
C15 D2O
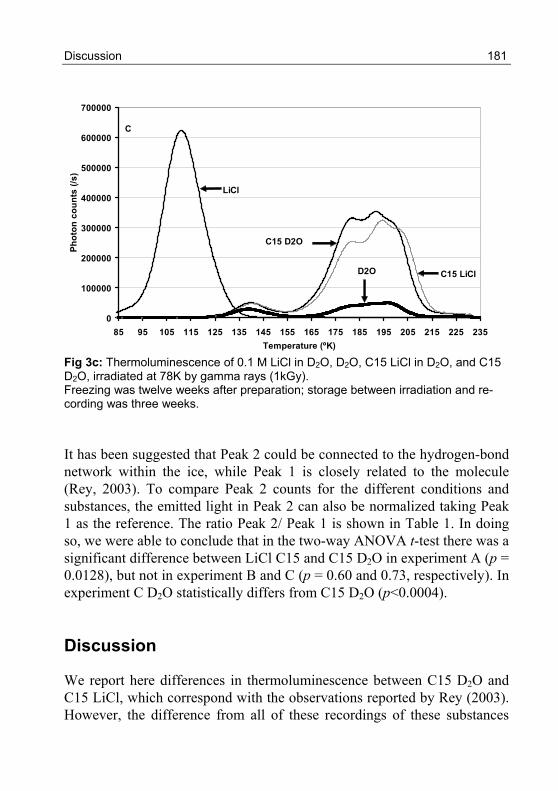
Fig 3c: Thermoluminescence of 0.1 M LiCl in D2O, D2O, C15 LiCl in D2O, and C15 D2O, irradiated at 78K by gamma rays (1kGy). Freezing was twelve weeks after preparation; storage between irradiation and re-cording was three weeks. It has been suggested that Peak 2 could be connected to the hydrogen-bond network within the ice, while Peak 1 is closely related to the molecule (Rey, 2003). To compare Peak 2 counts for the different conditions and substances, the emitted light in Peak 2 can also be normalized taking Peak 1 as the reference. The ratio Peak 2/ Peak 1 is shown in Table 1. In doing so, we were able to conclude that in the two-way ANOVA t-test there was a significant difference between LiCl C15 and C15 D2O in experiment A (p = 0.0128), but not in experiment B and C (p = 0.60 and 0.73, respectively). In experiment C D2O statistically differs from C15 D2O (p<0.0004).
Discussion
We report here differences in thermoluminescence between C15 D2O and C15 LiCl, which correspond with the observations reported by Rey (2003). However, the difference from all of these recordings of these substances
182 Thermoluminescence in ultra-high dilution research
was not statistically significant. The present data suggest that such differ-ence tended to be significant only when the experiment was carried out three weeks after preparation of the substances and with a short time be-tween irradiation and thermoluminescence recording. Another observation in the present study was the difference in thermoluminescence between C15 D2O and D2O. Data suggest an increased difference during long stor-age conditions.
We can only speculate about the significance of the observed opposite trends. Given that the original pure D2O had not been modified and was also the basis for the preparation of succussed ultra-high dilutions, it is proposed that it would not be additionally activated after irradiation in the experiments carried out at 3, 7 and 12 weeks after its use for the preparation of the succussed ultra-high dilutions. It is more likely that the obvious thermoluminescence decreasing trend of D2O compared to C15 D2O under long storage conditions suggests the possibility that stored irradiation en-ergy in D2O might be more easily released at very low temperatures. Be that as it may, it appears that the structural state of a solution made in D2O can be modified by strong succussion. The explanation of the trend ob-served in the difference between C15 D2O and C15 LiCl might be just the opposite. It has been proposed that LiCl suppresses hydrogen bonds. With such strong hydrogen bond suppression as a “ghost effect” after succussion in the ultra-high dilution, one can imagine that it is more likely to be pre-sent shortly after preparation. Such a ghost effect would be lost after a long storage of the substance. With this in mind, the hypothesis to explain the data include a) succussion stabilizes the D2O physical structure in such a way that stored radiation energy can be kept for a longer period, and b) the ghost effect of LiCl after preparation interferes with this stabilization proc-ess, but only for a limited time.
The nature of the phenomena here described still remains unexplained. Generally, liquid water is described as a disordered ensemble of highly polar molecules linked through a fluctuating network of intermolecular hydrogen bonds. Recent studies demonstrated the efficiency of energy re-distribution within the hydrogen-bonded network, and that water loses the memory of persistent correlations in its structure within 50 fs (Cowan et al, 2005). Energy-transfer dynamics studies of a water molecule that is en-closed by acetone molecules, has demonstrated hydrogen bond dynamics with time constant of 1.3 ps (Gilijamse et al, 2005). This means that the
Discussion 183
exact nature of the phenomena presented in this paper is not, at present, in agreement with current theories on the fluctuations in the network of inter-molecular hydrogen bonds.
It is evident that the results need further study. The point must be stressed that we obtained a very good qualitative reproducibility of the thermoluminescence pattern, but the quantitative reproducibility was rather poor, and p-values should be interpreted in the sense of descriptive statis-tics. Subsequent sample size calculations show that 18 Peak 2 measure-ments (9 with each group) were needed to detect a difference between C15 LiCl and C15 D2O with a power of 90%. The variation between samples can only partially be explained by the time between substance preparation and testing, and/or time between irradiation and recording. The variation is slightly reduced if we normalized the emitted light readings in Peak 2 util-izing Peak 1 as the reference (Rey, 2003). To study the origin of the fluc-tuations within one set of data, we have looked at the following variables: a) Filling the cups was kept constant. The thermoluminescence was not correlated filling the cups sequence or placing them in the freezer. b) The samples were frozen under similar conditions. c) The procedure for irradia-tion was constant. The location of the cups inside the irradiation chamber was compared with the absorbed dose-distribution in the irradiation cham-ber, and no correlation was observed between the location in the chamber and the luminescence recorded. d) The procedure for recording thermolu-minescence was kept constant. Although some variation was observed in time before temperature increased linearly, this linear increase always be-gan when the temperature was at approximately 87K, demonstrating no correlation with the differences in luminescence intensity. Comparing all these steps in the experimental protocol, it can be suggested that the freez-ing process causes the variation in thermoluminescence. It is well known that in this process, variations arise as they do in ice crystallization patterns. Yada et al (2002) observed that Peak 2 is extremely dependent upon oxy-gen content. Further studies are required to study the role of oxygen in the variation.
184 Thermoluminescence in ultra-high dilution research
Conclusions
In summary, the present data suggest that the thermoluminescence tech-nique can contribute to the challenge of succussion and ultra-high dilution preparation procedures commonly applied to homeopathic medication preparation. In order to improve the protocol, our data suggest further re-search utilizing a large number of observations to include a) different time periods between the preparation of substances and their use in an experi-ment, and b) different time periods between irradiation and thermolumines-cence registration. If such protocol were to be developed, it could be util-ized to compare different procedures currently used in homeopathic phar-maceutical practice. References
Chen R, McKeever SWS. Theory of Thermoluminescence and Related Phenom-ena. Singapore: World Scientific, 1997, 1–559.
Cowan ML, Bruner BD, Huse N, Dwyer JR, Chugh B, Nibbering ETJ, Elsaesser T, Miller RJD. Ultrafast memory loss and energy redistribtion in the hydrogen bond network of liquid H2O. Nature 2005; 434: 199–202.
Gilijamse, J.J., Lock, A.J., Bakker, H.J., Dynamics of confined water molecules, Proc. Natl. Acad. Sci. USA 102 (2005) 3202–3207.
McKeever SWS. Thermoluminescence of Solids. Cambridge: University Press, 1985, 1–376.
Milgrom LR. The memory of water regained? Homeopathy 2003; 92: 223–224. Rey LR. Thermoluminescence de la glace. C.R. Physique 2000;1: 107–110. Rey LR. Thermoluminescence of ultra-high dilutions of lithium chloride and so-
dium chloride. Physica A 2003; 323: 67–74. Yada T, Norizawa K, Hirai M, Yamanaka C, Ikeya M. Optically stimulated lumi-
nescence study on γ-irradiated ice frozen from H2O and D2O. Jpn. J. Appl. Phys. 2002; 41: 5874–5880.
Acknowledgements 185
Acknowledgements
We would like to thank the Karl and Veronica Carstens-Foundation for financial support, and VSM Geneesmiddelen B.V. for preparation of test solutions.
Dr. Roeland van Wijk, Dr. Saskia Bosman and Dr. Eduard P.A. van Wijk Corresponding author: Dr. Roeland van Wijk, International Institute of Biophysics, Raketenstation Hombroich, Kapellener Straße, 41427 Neuss Aus: The Journal of Alternative and Complementary Medicine 2006; 12 (5), 437–443 (Mary Ann Liebert, Inc)
Related Documents