The “Visible Hand” in a Production-Chain Market: A Market Equilibrium from Network Analytical Perspective ∗ Tsutomu Nakano Associate Professor of Management and Organization Theory, Kwansei Gakuin Business School, Japan/ External Faculty Affiliate, Center on Organizational Innovation (ISERP), Columbia University Email: [email protected] Douglas R. White Professor of Anthropology, Institute for Mathematical Behavioral Sciences, University of California, Irvine/ External Faculty, Santa Fe Institute Email: [email protected] Copyright © Tsutomu Nakano and Douglas R. White ∗ We thank Wayne Baker, Peter Bearman, Benjamin Cole, Gerald Davis, Hiroshi Ishida, Chris Marquis, Andrej Mrvar, James Lincoln, David Stark, Harrison White, Hugh Whittaker, Jonathan Zeitlin, and Aleš Ziberna for their helpful advice at different stages of the study project over the years. The Department of Sociology and Graduate School of Arts and Sciences at Columbia University, ITEC at Doshisha University-Kyoto, and Center for Japanese Studies at University of Michigan-Ann Arbor provided support to conduct the research study. The concepts used in this study benefited from extensive interactions within the Co-Evolution and Networks and Markets Working Group of the Santa Fe Institute and within the SFI Network Dynamics Working Group.

Welcome message from author
This document is posted to help you gain knowledge. Please leave a comment to let me know what you think about it! Share it to your friends and learn new things together.
Transcript
The “Visible Hand” in a Production-Chain Market:
A Market Equilibrium from Network Analytical Perspective∗
Tsutomu Nakano Associate Professor of Management and Organization Theory, Kwansei Gakuin Business School, Japan/
External Faculty Affiliate, Center on Organizational Innovation (ISERP), Columbia University Email: [email protected]
Douglas R. White
Professor of Anthropology, Institute for Mathematical Behavioral Sciences, University of California, Irvine/ External Faculty, Santa Fe Institute
Email: [email protected]
Copyright © Tsutomu Nakano and Douglas R. White
∗ We thank Wayne Baker, Peter Bearman, Benjamin Cole, Gerald Davis, Hiroshi Ishida, Chris Marquis, Andrej Mrvar, James Lincoln, David Stark, Harrison White, Hugh Whittaker, Jonathan Zeitlin, and Aleš Ziberna for their helpful advice at different stages of the study project over the years. The Department of Sociology and Graduate School of Arts and Sciences at Columbia University, ITEC at Doshisha University-Kyoto, and Center for Japanese Studies at University of Michigan-Ann Arbor provided support to conduct the research study. The concepts used in this study benefited from extensive interactions within the Co-Evolution and Networks and Markets Working Group of the Santa Fe Institute and within the SFI Network Dynamics Working Group.
Abstract
We analyze general price equilibrium mechanisms of production-chain markets, comparing the
producer market model proposed by Harrison White with hypothesized network effects on
pricing that emerge from empirical analysis of trade relationships among over 8,000 firms in a
large-scale industrial district in Tokyo. Consistent with White’s model, the supplier-prime buyer
relationships are strictly hierarchical and constitute a directed acyclic graph (DAG). There are no
exchange cycles that would promote price equilibrium. We argue, partly from a Simmelian
approach to triad configurations, that three linked network configurations are likely to affect
pricing. First, a particular form of structural cohesion as defined by multi-connectivity
(bicomplete connectedness within a large bicomponent) is a critical “seeding” mechanism where
quasi-optimal exchange can be achieved as the “visible hand” in production-chain markets.
Second, a powerful core of elite firms was detected that organizes status differences among firms
and serves to institutionalize role structures in the production markets. Third, structural
advantages in pricing accrue to elite core firms because suppliers upstream in the hierarchy
operate through a 4:1 preponderance of multiple-supplier to multiple-buyer triads, which
enforces competition among themselves rather than among the buyers. These pricing benefits to
buyers are passed along to the downstream elite firms. The elites can exert power over the
complex network through the serial divisions of labor embedded in the tiers of subcontracting
hierarchies, dominating price-setting from the top.
1
INTRODUCTION: COMPLEX NETWORKS, LARGE-SCALE INDUSTRIAL DISTRICTS AND PRODUCTION MARKETS Ever since Adam Smith’s invisible hand of the market (1776) talked about a general conception for price equilibrium in which demand and supply meet as to produce most efficient exchange transactions between the buyers and the sellers, the notion of market mechanisms have been a distinctive area of study, producing often provocative, if not innovative or revolutionary, views and theoretical undertakings. In particular, many economists, beginning with Cournot (1927), focused on competition between two firms to provide simpler models of equilibrium processes from which general solutions could be derived. Moreover, Nash equilibrium in a multiple players’ game, constructed on a generalization already known from Cournot, is, in part, Arrow and Debreu’s (1954) generalization of mathematical solutions to general equilibrium theory simultaneously applicable across different markets.
Recently, the concept of markets have also been widely debated in economic sociology, which generally puts focus on social structures and institutional settings where the market transactions are embedded (Callon 1998; Dobbin 2004; Fligstein 2001; Granovetter and Swedberg 2001; Guillén 2002; Knorr-Cetina and Preda 2005; Lie 1997; Nee and Swedberg 2005; Powell and Smith-Doerr 2005; Rauch and Casellat 2001; Smelser and Swedberg 2005; Swedberg 2002; Zuckerman 2004). Their arguments generally take the stand that, as market participants as individual actors cannot get complete information under the Knightian risk and uncertainty (Knight 1921), they rely on available information at hand to make strategic decisions for the economic exchange, and this in a long run will institutionalize local patterns of the social actions within the framework of the given legal and political settings. Then, these institutions start regulating the socially-constructed, local institutions as market mechanisms, and they will eventually function to reinforce themselves, as network closures. Once the institutionalized mechanisms get consolidated, they will be very robust and difficult to dislodge, as the memberships in the networks get limited to the socially-endorsed closed circles, which will have a tendency or drive to perpetuate themselves. Arguing against the claims of neo-classical economics, the sociologists insist that these locally institutionalized and behavioral patterns largely determine market pricing mechanisms and profiles extensively.
How can we understand these richly colorful and locally cultural, contextual markets as a general pricing mechanism? Harrison White recently proposed a network model of production markets and their price equilibria (White 2002b)1 in an ambitious and much debated attempt to construct a pricing model generally applicable across different markets from the structural stand of economic sociology and social networks. 2 Focusing on modern production markets, he (2002b; 2003:87) proposed a more general framework for the dispute over how to define markets, beginning with the observation that “most markets today regulate production flows of goods and services, rather than exchanges of existing stocks as in traditional views of markets.” The hallmarks of modern production markets are “persistent directionality in continuing flows of intermediate goods” (p.87) in which “only a niche within an industry establishes you in a line of business.”
1 According to Harrison White, the model should be generally applicable under certain conditions, including not financial but production markets where actual exchange of tangible goods or services are involved among a limited number of producers as sellers who carefully watch one another’s strategic actions and moves regarding production volume and pricing. 2 As for debates over the model, see for example, Swedberg (2002: 104-130) and Knorr-Cetina (2004)
2
The problem posed by White (2003:87) is that “Economists have not as yet agreed on how they should characterize the process and structure through which particular firms actually constitute a market. So they largely pass over particular firms by settling for a stylized store of pure competition where buyers do not distinguish between different firms’ qualities of product.” White takes a view that, as the players monitor and mimic price decisions of their rivals, each of them, as producers, recursively determines their production volumes according to the perceived rank ordering regarding the product quality and brand reputation among themselves (Leifer and White 1987; White 1981). The theory that White offers is that “each producer firm guides itself into its niche along a market profile from watching actions of its compatriots,” and “that profile is sustained when it offers tradeoffs of quality versus volume that are equally attractive downstream to buyers.” This he contrasts with the analysis of firm histories and strategies as well as structures, which “pass over particular markets and focus on various relations among, and orientations by, firms” (p.88).
Empirically testing Harrison White’s model as a baseline model, the objective of the present research, therefore, was to study production market mechanisms both from a theoretical viewpoint and empirical network analysis. We employ full-fledgedly recent innovations both in theory and in quantitative analytical techniques developed in the study of complex networks, probing large interfirm trade data among suppliers and their prime buyers in an industrial district.
The regional supplier-buyer network provides a test site to empirically study market mechanisms of the production chain. Therefore, the initial study question was set to find the structural mechanisms of the production market as a complex system. Then, given the structural properties, from the quantitative approach of social network analysis, how and where can price decisions be made in the embedded supplier-buyer relationships in a large-scale industrial district? What are some implications of the market mechanisms? Finally, we attempt to assess a comparison between the White model and our empirical study.
The remainder of the paper begins with a brief overview of previous literature and theoretical issues relevant to the study of structural mechanisms of the production market, followed by the research design and methodological issues, including data, concepts, and analytical tools applied from the study of the complex system. While describing the network properties and the integration mechanisms of the production market, we consider questions of hierarchy, and also review questions of multiconnectivity in production networks. Multiconnectivity exists in a subgraph of a network when each pair of nodes in the subgraph is multiply connected within the subgraph itself (Moody and White 2003). We develop these arguments through several parallel forms of analysis that take up different aspects of hierarchy and multiconnectivity. Then, we show how multiconnectivity affects pricing mechanisms and differentiation in the costs and benefits of multiconnectivity for buyers and for suppliers located at different strategic positions in a regional subcontracting hierarchy. We end with a discussion of findings and their implications, providing an assessment of the ambitious project by White.
As a note, the present discussion uses “suppliers” and “subcontractors” in industrial districts rather interchangeably. It also employs such terms as “regional supplier networks,” “suppler-prime buyer networks” and “subcontracting hierarchies” interchangeably to refer to hierarchical interfirm networks in large-scale industrial districts where the SME suppliers work for or with their prime buyers in various manufacturing activities executed in the regional economies. Pajek (Batagelj and Mrvar 2005) was used both to calculate network analytical measures and to draw graphs.
3
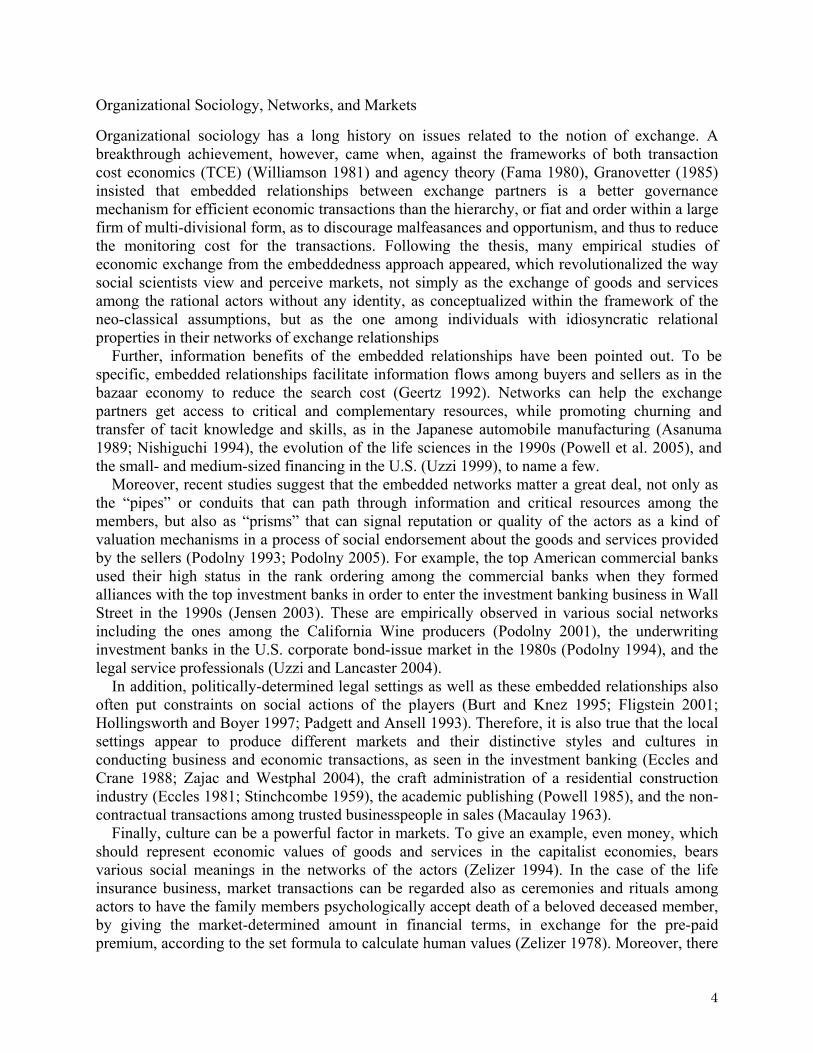
Organizational Sociology, Networks, and Markets Organizational sociology has a long history on issues related to the notion of exchange. A breakthrough achievement, however, came when, against the frameworks of both transaction cost economics (TCE) (Williamson 1981) and agency theory (Fama 1980), Granovetter (1985) insisted that embedded relationships between exchange partners is a better governance mechanism for efficient economic transactions than the hierarchy, or fiat and order within a large firm of multi-divisional form, as to discourage malfeasances and opportunism, and thus to reduce the monitoring cost for the transactions. Following the thesis, many empirical studies of economic exchange from the embeddedness approach appeared, which revolutionalized the way social scientists view and perceive markets, not simply as the exchange of goods and services among the rational actors without any identity, as conceptualized within the framework of the neo-classical assumptions, but as the one among individuals with idiosyncratic relational properties in their networks of exchange relationships
Further, information benefits of the embedded relationships have been pointed out. To be specific, embedded relationships facilitate information flows among buyers and sellers as in the bazaar economy to reduce the search cost (Geertz 1992). Networks can help the exchange partners get access to critical and complementary resources, while promoting churning and transfer of tacit knowledge and skills, as in the Japanese automobile manufacturing (Asanuma 1989; Nishiguchi 1994), the evolution of the life sciences in the 1990s (Powell et al. 2005), and the small- and medium-sized financing in the U.S. (Uzzi 1999), to name a few.
Moreover, recent studies suggest that the embedded networks matter a great deal, not only as the “pipes” or conduits that can path through information and critical resources among the members, but also as “prisms” that can signal reputation or quality of the actors as a kind of valuation mechanisms in a process of social endorsement about the goods and services provided by the sellers (Podolny 1993; Podolny 2005). For example, the top American commercial banks used their high status in the rank ordering among the commercial banks when they formed alliances with the top investment banks in order to enter the investment banking business in Wall Street in the 1990s (Jensen 2003). These are empirically observed in various social networks including the ones among the California Wine producers (Podolny 2001), the underwriting investment banks in the U.S. corporate bond-issue market in the 1980s (Podolny 1994), and the legal service professionals (Uzzi and Lancaster 2004).
In addition, politically-determined legal settings as well as these embedded relationships also often put constraints on social actions of the players (Burt and Knez 1995; Fligstein 2001; Hollingsworth and Boyer 1997; Padgett and Ansell 1993). Therefore, it is also true that the local settings appear to produce different markets and their distinctive styles and cultures in conducting business and economic transactions, as seen in the investment banking (Eccles and Crane 1988; Zajac and Westphal 2004), the craft administration of a residential construction industry (Eccles 1981; Stinchcombe 1959), the academic publishing (Powell 1985), and the non-contractual transactions among trusted businesspeople in sales (Macaulay 1963).
Finally, culture can be a powerful factor in markets. To give an example, even money, which should represent economic values of goods and services in the capitalist economies, bears various social meanings in the networks of the actors (Zelizer 1994). In the case of the life insurance business, market transactions can be regarded also as ceremonies and rituals among actors to have the family members psychologically accept death of a beloved deceased member, by giving the market-determined amount in financial terms, in exchange for the pre-paid premium, according to the set formula to calculate human values (Zelizer 1978). Moreover, there
4
appeared many empirical studies of local business cultures from these network perspectives, including the software industry in Silicon Valley (Saxenian 1994), the fine-arts museums management (DiMaggio 1991), the fads and fashion (Hirsch 1972), the Hollywood film-making projects (Baker and Faulkner 1991), an evolution of the Broadway Musicals (Uzzi and Spiro 2005), and the trading floor in Wall Street (Beunza and Stark 2004), among others.
How can the market mechanisms function from the viewpoint of these network perspectives? Markets can be understood as being composed of interactions among actors in different positions or roles (Leifer and White 1987). The participants, holding similar positions in their embedded networks as structurally-equivalent actors, tend to act in a similar way (Burt 1976; White, Boorman and Breiger 1973; Winship and Mandel 1983). Institutionalists insist that the homophilic pressure from the isomorphic or mimicking actions among the players is a powerful driver to rationalize the markets, standardizing the global culture (DiMaggio and Powell 1983; Meyer and Rowan 1977), as these relationships can facilitate particular patterns of social actions among the role equivalent actors such as in the diffusions of a medicine among physicians (Burt 1987), a so-called “poison pill” or anti-takeover device in the capital market (Davis 1991), and many other innovations including QWERTY keyboard and VHS video format (Arthur 1994; David 1987).
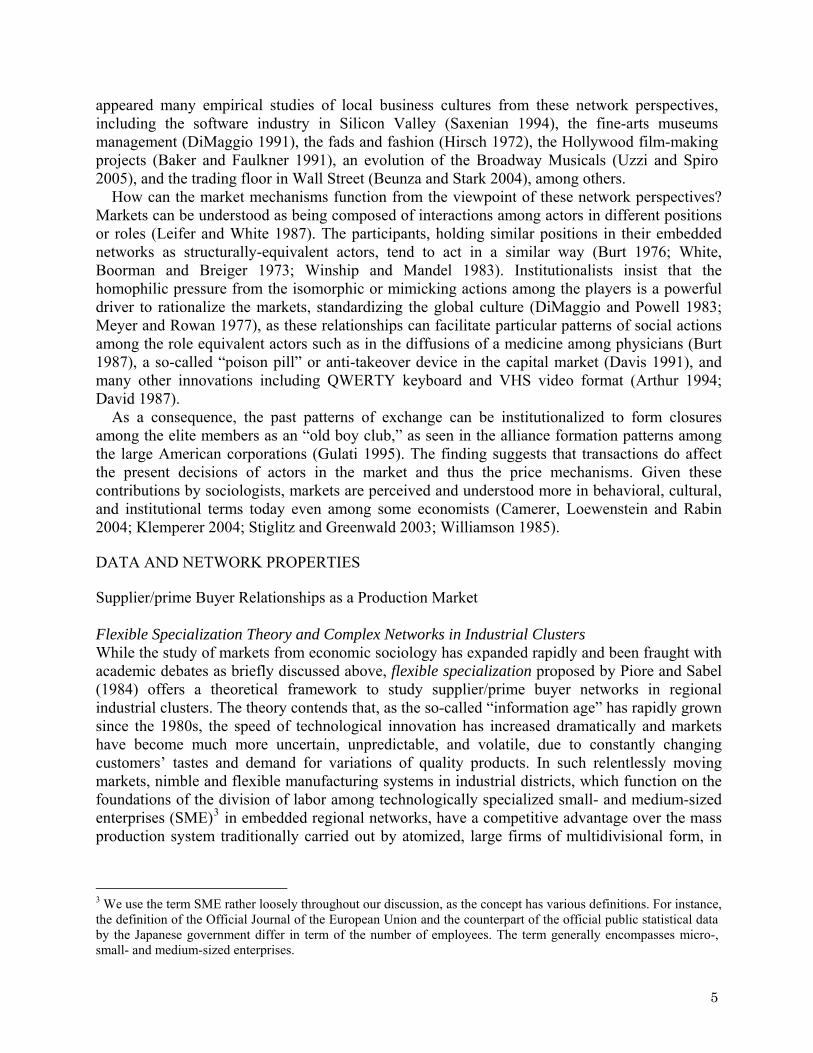
As a consequence, the past patterns of exchange can be institutionalized to form closures among the elite members as an “old boy club,” as seen in the alliance formation patterns among the large American corporations (Gulati 1995). The finding suggests that transactions do affect the present decisions of actors in the market and thus the price mechanisms. Given these contributions by sociologists, markets are perceived and understood more in behavioral, cultural, and institutional terms today even among some economists (Camerer, Loewenstein and Rabin 2004; Klemperer 2004; Stiglitz and Greenwald 2003; Williamson 1985). DATA AND NETWORK PROPERTIES Supplier/prime Buyer Relationships as a Production Market Flexible Specialization Theory and Complex Networks in Industrial Clusters While the study of markets from economic sociology has expanded rapidly and been fraught with academic debates as briefly discussed above, flexible specialization proposed by Piore and Sabel (1984) offers a theoretical framework to study supplier/prime buyer networks in regional industrial clusters. The theory contends that, as the so-called “information age” has rapidly grown since the 1980s, the speed of technological innovation has increased dramatically and markets have become much more uncertain, unpredictable, and volatile, due to constantly changing customers’ tastes and demand for variations of quality products. In such relentlessly moving markets, nimble and flexible manufacturing systems in industrial districts, which function on the foundations of the division of labor among technologically specialized small- and medium-sized enterprises (SME)3 in embedded regional networks, have a competitive advantage over the mass production system traditionally carried out by atomized, large firms of multidivisional form, in
3 We use the term SME rather loosely throughout our discussion, as the concept has various definitions. For instance, the definition of the Official Journal of the European Union and the counterpart of the official public statistical data by the Japanese government differ in term of the number of employees. The term generally encompasses micro-, small- and medium-sized enterprises.
5
order to maximize profits in aggregate (Goodman and Bamford 1989; Lazerson 1995; Locke 1995; Pyke, Becattini and Sengenberger 1990; Sabel and Zeitlin 1997).
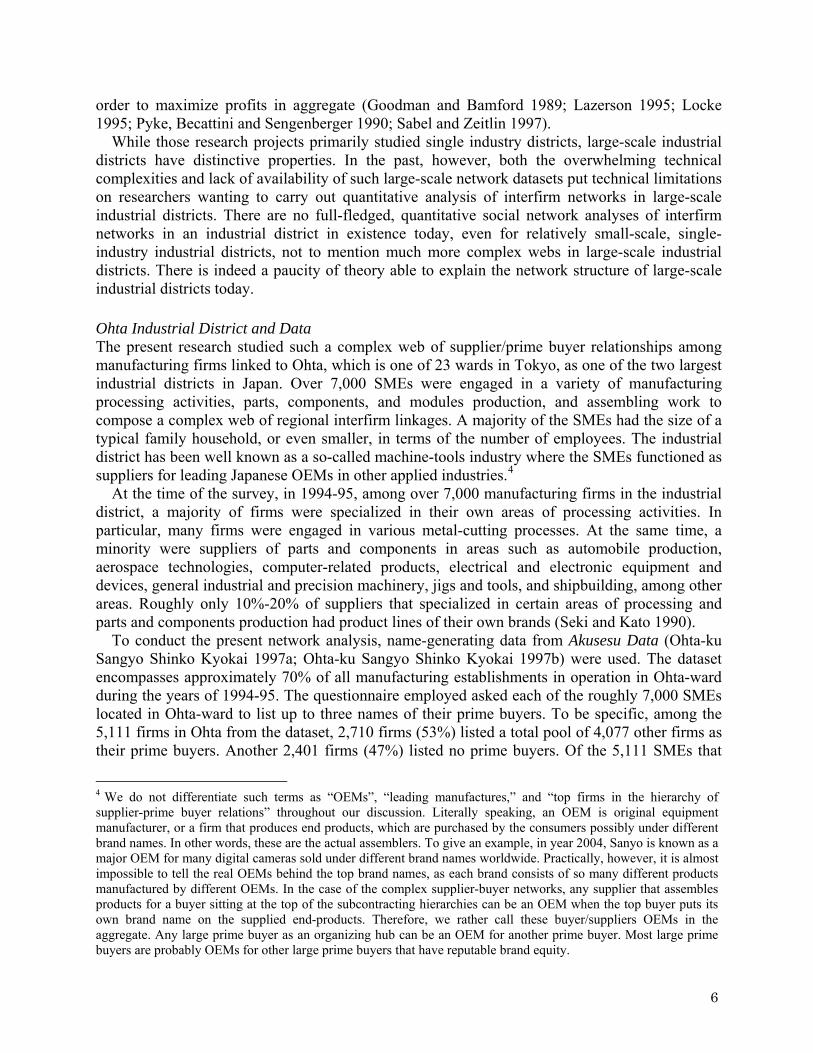
While those research projects primarily studied single industry districts, large-scale industrial districts have distinctive properties. In the past, however, both the overwhelming technical complexities and lack of availability of such large-scale network datasets put technical limitations on researchers wanting to carry out quantitative analysis of interfirm networks in large-scale industrial districts. There are no full-fledged, quantitative social network analyses of interfirm networks in an industrial district in existence today, even for relatively small-scale, single-industry industrial districts, not to mention much more complex webs in large-scale industrial districts. There is indeed a paucity of theory able to explain the network structure of large-scale industrial districts today. Ohta Industrial District and Data The present research studied such a complex web of supplier/prime buyer relationships among manufacturing firms linked to Ohta, which is one of 23 wards in Tokyo, as one of the two largest industrial districts in Japan. Over 7,000 SMEs were engaged in a variety of manufacturing processing activities, parts, components, and modules production, and assembling work to compose a complex web of regional interfirm linkages. A majority of the SMEs had the size of a typical family household, or even smaller, in terms of the number of employees. The industrial district has been well known as a so-called machine-tools industry where the SMEs functioned as suppliers for leading Japanese OEMs in other applied industries.4
At the time of the survey, in 1994-95, among over 7,000 manufacturing firms in the industrial district, a majority of firms were specialized in their own areas of processing activities. In particular, many firms were engaged in various metal-cutting processes. At the same time, a minority were suppliers of parts and components in areas such as automobile production, aerospace technologies, computer-related products, electrical and electronic equipment and devices, general industrial and precision machinery, jigs and tools, and shipbuilding, among other areas. Roughly only 10%-20% of suppliers that specialized in certain areas of processing and parts and components production had product lines of their own brands (Seki and Kato 1990).
To conduct the present network analysis, name-generating data from Akusesu Data (Ohta-ku Sangyo Shinko Kyokai 1997a; Ohta-ku Sangyo Shinko Kyokai 1997b) were used. The dataset encompasses approximately 70% of all manufacturing establishments in operation in Ohta-ward during the years of 1994-95. The questionnaire employed asked each of the roughly 7,000 SMEs located in Ohta-ward to list up to three names of their prime buyers. To be specific, among the 5,111 firms in Ohta from the dataset, 2,710 firms (53%) listed a total pool of 4,077 other firms as their prime buyers. Another 2,401 firms (47%) listed no prime buyers. Of the 5,111 SMEs that
4 We do not differentiate such terms as “OEMs”, “leading manufactures,” and “top firms in the hierarchy of supplier-prime buyer relations” throughout our discussion. Literally speaking, an OEM is original equipment manufacturer, or a firm that produces end products, which are purchased by the consumers possibly under different brand names. In other words, these are the actual assemblers. To give an example, in year 2004, Sanyo is known as a major OEM for many digital cameras sold under different brand names worldwide. Practically, however, it is almost impossible to tell the real OEMs behind the top brand names, as each brand consists of so many different products manufactured by different OEMs. In the case of the complex supplier-buyer networks, any supplier that assembles products for a buyer sitting at the top of the subcontracting hierarchies can be an OEM when the top buyer puts its own brand name on the supplied end-products. Therefore, we rather call these buyer/suppliers OEMs in the aggregate. Any large prime buyer as an organizing hub can be an OEM for another prime buyer. Most large prime buyers are probably OEMs for other large prime buyers that have reputable brand equity.
6
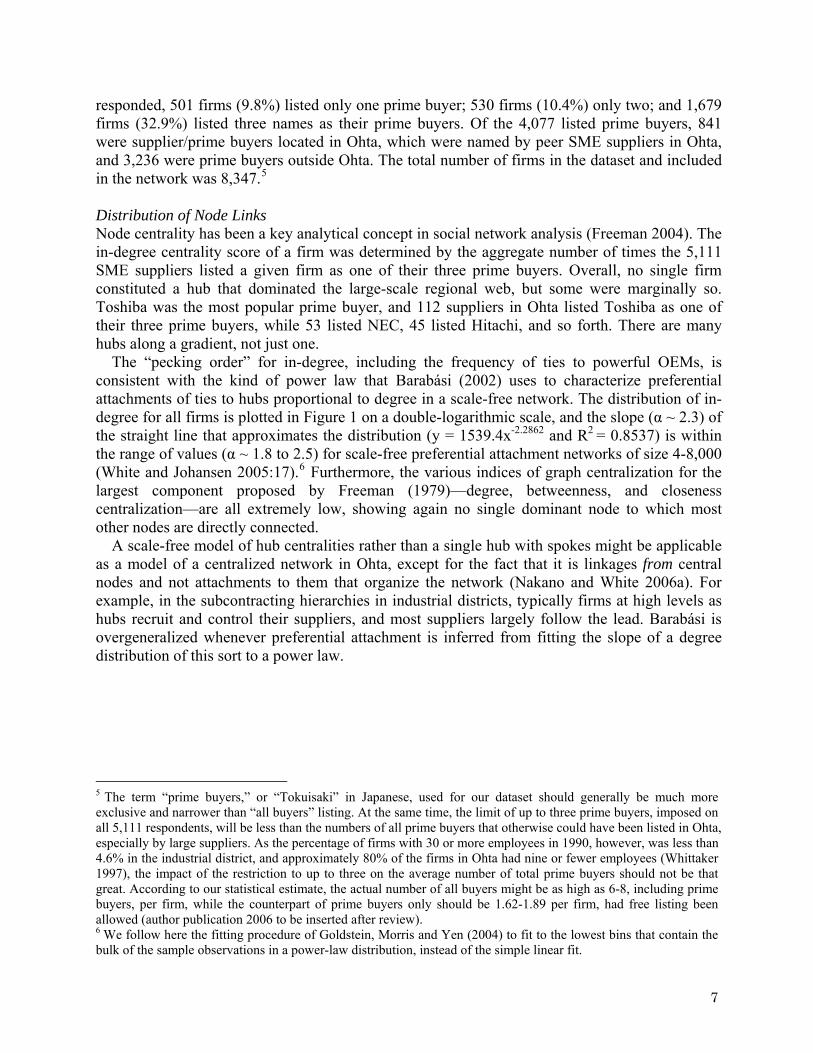
responded, 501 firms (9.8%) listed only one prime buyer; 530 firms (10.4%) only two; and 1,679 firms (32.9%) listed three names as their prime buyers. Of the 4,077 listed prime buyers, 841 were supplier/prime buyers located in Ohta, which were named by peer SME suppliers in Ohta, and 3,236 were prime buyers outside Ohta. The total number of firms in the dataset and included in the network was 8,347.5
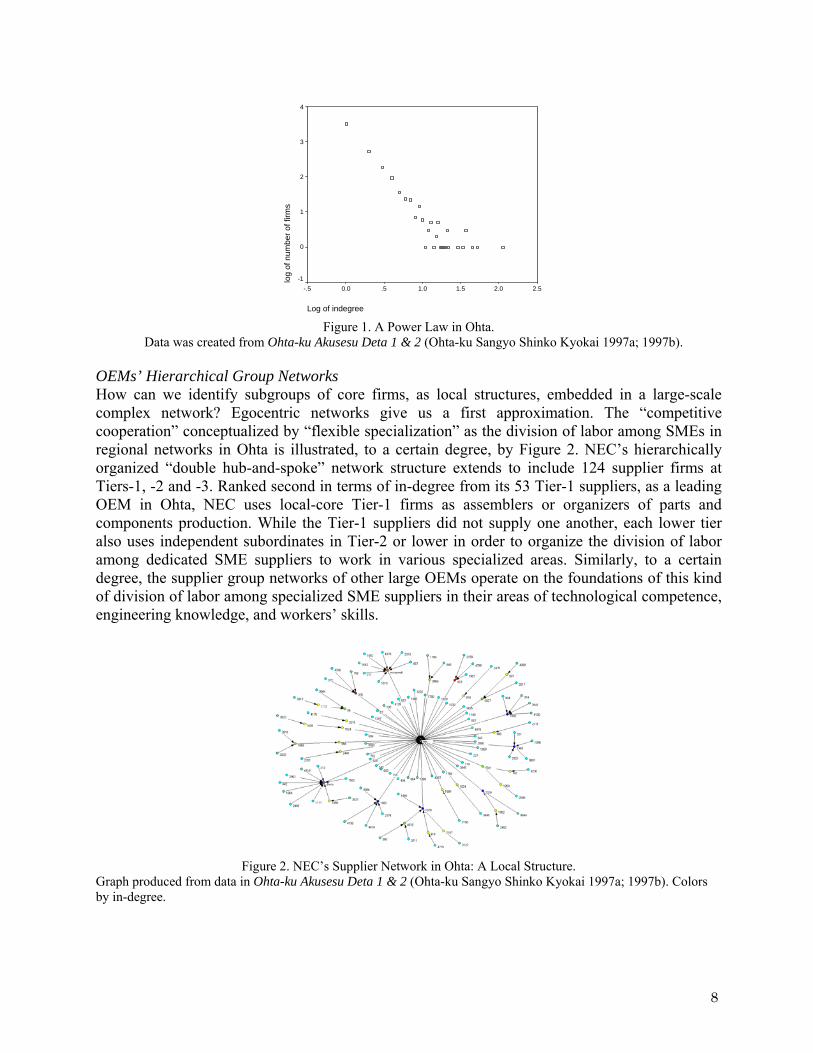
Distribution of Node Links Node centrality has been a key analytical concept in social network analysis (Freeman 2004). The in-degree centrality score of a firm was determined by the aggregate number of times the 5,111 SME suppliers listed a given firm as one of their three prime buyers. Overall, no single firm constituted a hub that dominated the large-scale regional web, but some were marginally so. Toshiba was the most popular prime buyer, and 112 suppliers in Ohta listed Toshiba as one of their three prime buyers, while 53 listed NEC, 45 listed Hitachi, and so forth. There are many hubs along a gradient, not just one.
The “pecking order” for in-degree, including the frequency of ties to powerful OEMs, is consistent with the kind of power law that Barabási (2002) uses to characterize preferential attachments of ties to hubs proportional to degree in a scale-free network. The distribution of in-degree for all firms is plotted in Figure 1 on a double-logarithmic scale, and the slope (α ~ 2.3) of the straight line that approximates the distribution (y = 1539.4x-2.2862 and R2 = 0.8537) is within the range of values (α ~ 1.8 to 2.5) for scale-free preferential attachment networks of size 4-8,000 (White and Johansen 2005:17).6 Furthermore, the various indices of graph centralization for the largest component proposed by Freeman (1979)—degree, betweenness, and closeness centralization—are all extremely low, showing again no single dominant node to which most other nodes are directly connected.
A scale-free model of hub centralities rather than a single hub with spokes might be applicable as a model of a centralized network in Ohta, except for the fact that it is linkages from central nodes and not attachments to them that organize the network (Nakano and White 2006a). For example, in the subcontracting hierarchies in industrial districts, typically firms at high levels as hubs recruit and control their suppliers, and most suppliers largely follow the lead. Barabási is overgeneralized whenever preferential attachment is inferred from fitting the slope of a degree distribution of this sort to a power law.
5 The term “prime buyers,” or “Tokuisaki” in Japanese, used for our dataset should generally be much more exclusive and narrower than “all buyers” listing. At the same time, the limit of up to three prime buyers, imposed on all 5,111 respondents, will be less than the numbers of all prime buyers that otherwise could have been listed in Ohta, especially by large suppliers. As the percentage of firms with 30 or more employees in 1990, however, was less than 4.6% in the industrial district, and approximately 80% of the firms in Ohta had nine or fewer employees (Whittaker 1997), the impact of the restriction to up to three on the average number of total prime buyers should not be that great. According to our statistical estimate, the actual number of all buyers might be as high as 6-8, including prime buyers, per firm, while the counterpart of prime buyers only should be 1.62-1.89 per firm, had free listing been allowed (author publication 2006 to be inserted after review). 6 We follow here the fitting procedure of Goldstein, Morris and Yen (2004) to fit to the lowest bins that contain the bulk of the sample observations in a power-law distribution, instead of the simple linear fit.
7
Log of indegree
2.52.01.51.0.50.0-.5lo
g of
num
ber o
f firm
s
4
3
2
1
0
-1
Figure 1. A Power Law in Ohta.
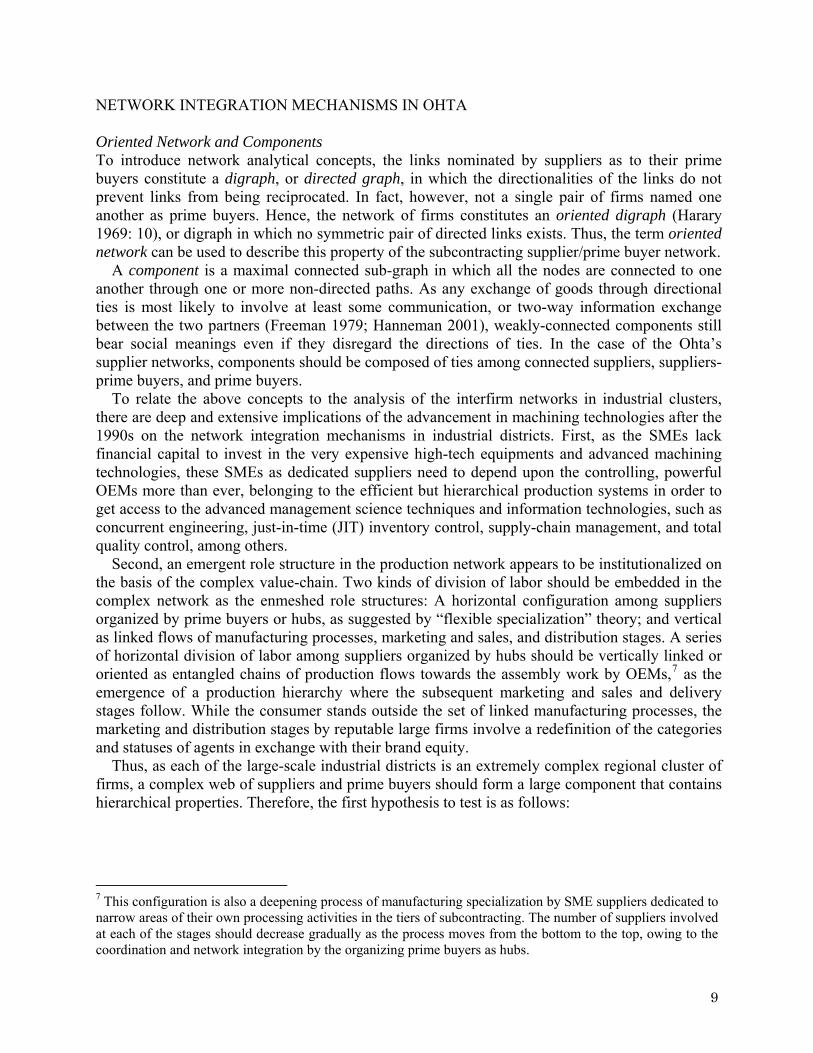
Data was created from Ohta-ku Akusesu Deta 1 & 2 (Ohta-ku Sangyo Shinko Kyokai 1997a; 1997b). OEMs’ Hierarchical Group Networks How can we identify subgroups of core firms, as local structures, embedded in a large-scale complex network? Egocentric networks give us a first approximation. The “competitive cooperation” conceptualized by “flexible specialization” as the division of labor among SMEs in regional networks in Ohta is illustrated, to a certain degree, by Figure 2. NEC’s hierarchically organized “double hub-and-spoke” network structure extends to include 124 supplier firms at Tiers-1, -2 and -3. Ranked second in terms of in-degree from its 53 Tier-1 suppliers, as a leading OEM in Ohta, NEC uses local-core Tier-1 firms as assemblers or organizers of parts and components production. While the Tier-1 suppliers did not supply one another, each lower tier also uses independent subordinates in Tier-2 or lower in order to organize the division of labor among dedicated SME suppliers to work in various specialized areas. Similarly, to a certain degree, the supplier group networks of other large OEMs operate on the foundations of this kind of division of labor among specialized SME suppliers in their areas of technological competence, engineering knowledge, and workers’ skills.
Figure 2. NEC’s Supplier Network in Ohta: A Local Structure.
Graph produced from data in Ohta-ku Akusesu Deta 1 & 2 (Ohta-ku Sangyo Shinko Kyokai 1997a; 1997b). Colors by in-degree.
8
NETWORK INTEGRATION MECHANISMS IN OHTA Oriented Network and Components To introduce network analytical concepts, the links nominated by suppliers as to their prime buyers constitute a digraph, or directed graph, in which the directionalities of the links do not prevent links from being reciprocated. In fact, however, not a single pair of firms named one another as prime buyers. Hence, the network of firms constitutes an oriented digraph (Harary 1969: 10), or digraph in which no symmetric pair of directed links exists. Thus, the term oriented network can be used to describe this property of the subcontracting supplier/prime buyer network.
A component is a maximal connected sub-graph in which all the nodes are connected to one another through one or more non-directed paths. As any exchange of goods through directional ties is most likely to involve at least some communication, or two-way information exchange between the two partners (Freeman 1979; Hanneman 2001), weakly-connected components still bear social meanings even if they disregard the directions of ties. In the case of the Ohta’s supplier networks, components should be composed of ties among connected suppliers, suppliers-prime buyers, and prime buyers.
To relate the above concepts to the analysis of the interfirm networks in industrial clusters, there are deep and extensive implications of the advancement in machining technologies after the 1990s on the network integration mechanisms in industrial districts. First, as the SMEs lack financial capital to invest in the very expensive high-tech equipments and advanced machining technologies, these SMEs as dedicated suppliers need to depend upon the controlling, powerful OEMs more than ever, belonging to the efficient but hierarchical production systems in order to get access to the advanced management science techniques and information technologies, such as concurrent engineering, just-in-time (JIT) inventory control, supply-chain management, and total quality control, among others.
Second, an emergent role structure in the production network appears to be institutionalized on the basis of the complex value-chain. Two kinds of division of labor should be embedded in the complex network as the enmeshed role structures: A horizontal configuration among suppliers organized by prime buyers or hubs, as suggested by “flexible specialization” theory; and vertical as linked flows of manufacturing processes, marketing and sales, and distribution stages. A series of horizontal division of labor among suppliers organized by hubs should be vertically linked or oriented as entangled chains of production flows towards the assembly work by OEMs,7 as the emergence of a production hierarchy where the subsequent marketing and sales and delivery stages follow. While the consumer stands outside the set of linked manufacturing processes, the marketing and distribution stages by reputable large firms involve a redefinition of the categories and statuses of agents in exchange with their brand equity.
Thus, as each of the large-scale industrial districts is an extremely complex regional cluster of firms, a complex web of suppliers and prime buyers should form a large component that contains hierarchical properties. Therefore, the first hypothesis to test is as follows:
7 This configuration is also a deepening process of manufacturing specialization by SME suppliers dedicated to narrow areas of their own processing activities in the tiers of subcontracting. The number of suppliers involved at each of the stages should decrease gradually as the process moves from the bottom to the top, owing to the coordination and network integration by the organizing prime buyers as hubs.
9
Hypothesis 1: In each of large-scale industrial districts, there will be a large component in existence where SMEs interact in order to form a division of labor under the lead of many OEMs or hubs
Consistent with this hypothesis, the largest component of 4,500 firms was identified. The operation created a simpler and somewhat reduced network, by excluding 3,847 firms disconnected from the component. Acyclic Depth Partition and DAG Structure in Ohta Why did the complex web of regional supplier networks generate such a giant component of 4,500 firms? How was it hierarchically organized through commodity chains and other network structures or processes? The Ohta supplier/prime buyer network has no reciprocated or symmetric links. In a separate paper (Nakano and White 2006a), we argued that the one-way directedness of supplier/prime buyer links is one of the fundamental characteristics of complex hierarchical subcontracting relationships as large sparse networks (LSN), with statistical evidence that these networks should generally take the form of directed acyclic graph (DAG), based on our empirical study of the Ohta industrial district and comparative observations on modern industrial districts.8 The DAG is the general property of supplier/prime buyer networks in large-scale industrial districts, in lieu of both small-world and scale-free models. The acyclically hierarchical orientation of the networks is overwhelming indeed.
To elaborate on some of the global properties, an acyclic network is a special kind of oriented network that contains no directed cycles. If we start a path from any node in the network and follow the direction of arcs (directional lines), there is no way to return to the node of origin (Batagelj and Mrvar 2005; Degenne and Forsé 1999; Scott 2000; Wasserman and Faust 1994). When there is no cycle in the network, the acyclic relationships among the nodes in the network constitute, by proof following from definition, a hierarchy (Harary 1969:200).
Acyclic depth partitioning is robust in that it will capture a great deal of the network structure of a large sparse oriented graph. Assigning rank to partially ordered elements in an upper triangular adjacency matrix can be done by construction of an acyclic depth partition based on two repeated steps. First, all vertices that do not have any in-degree are assigned as level d=1. Second, these vertices and their outgoing lines are removed, and steps one and two are repeated to identify level d=d+1 until no vertices remain (Batagelj and Mrvar 2005). The algorithm reorganizes the complex network into hierarchical levels such that if a node at any level has any incoming lines, at least one must be directed from the next lower level. Otherwise the node it connects to would drop down one or more levels. The analysis of levels in an acyclic network is thus an effective method by which hierarchical structures can be detected even in an extremely complex network. It is a highly effective method in this case because no directed cycles were found in the complex web in Ohta.
8 Studies of directed cycles in social organization often build on ideas from anthropological exchange theory and structuralism, Hage and Harary (1996) identified acyclic exchange cycles that bound together cultural networks among South Pacific islanders, and Bearman (1997) leveraged the concept of directed cycles for network investigations in proposing a structural theory of generalized exchange. For a literature review, see Douglas White (2004) and White and Johansen (2005). Few network researchers, however, have followed their lead. Among the exceptions, Robins, Pattison, and Woolcock (2005) attempted to simulate an emergence of small-world, applying the analytical concept of cycles. Studies in the relatively new field of network economics (Plott and Callander 2002) show general conditions under which directed cycles of exchange provide stable configurations for optimal price formation as a market pricing mechanism.
10
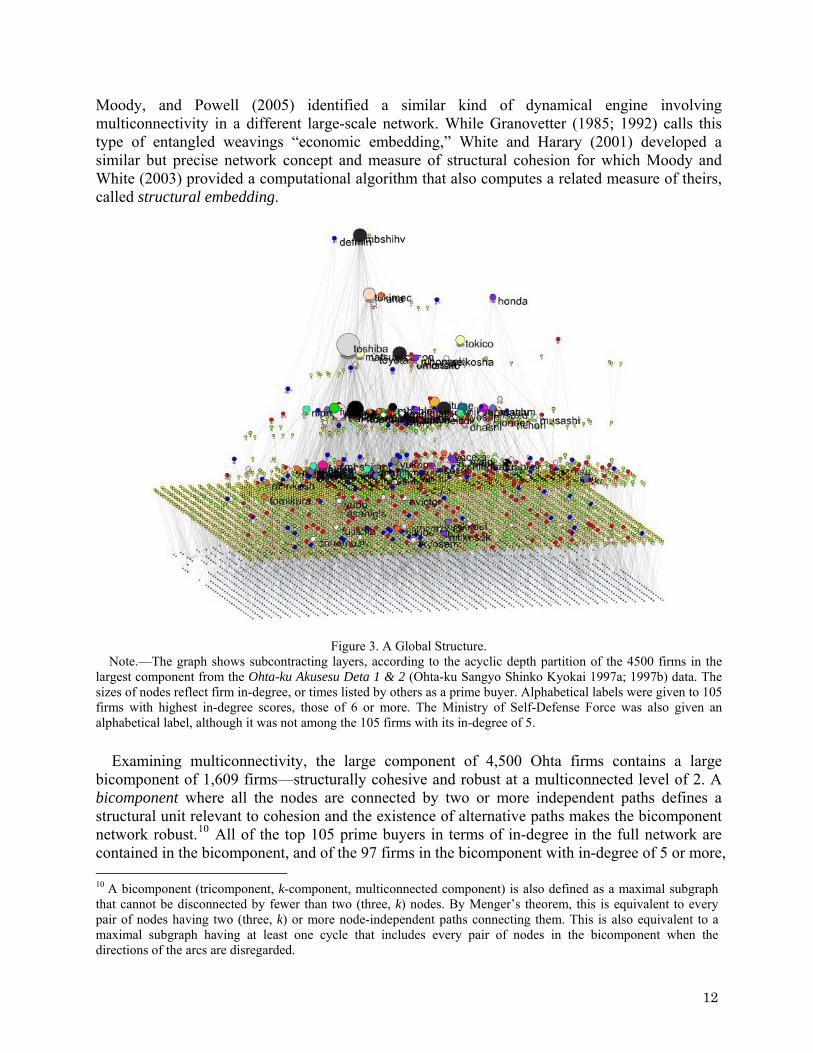
Figure 3 shows the outcome of a depth partition of the largest, weakly connected component of 4,500 firms. As shown in the figure, the partition reveals the simple hierarchical characteristics of this extremely complex web. This is done simply by ordering of the data rather than data reduction. There are seven linked but hierarchically ranked levels of firms, according to the partition criteria. The vertical paths that connect the firms across levels represent linked manufacturing processes that produce an enormous variety of parts, components, modules, and end products in the industrial district of Ohta, with the result that the industry value-chain is similar to “food-chains” running within and beyond the Ohta ward. The streams of goods and chains of services provided by these firms act as enmeshed threads weaving through various manufacturing processes.
Figure 3 includes 54% of the firms in the whole network. Node size reflects the in-degree of nodes. Labels, largely obscured, are those of the top 105 prime buyers with in-degree of 6 or more. All of the top 105 buyers in the full network are included in the largest component. Note that these levels do not correspond to Tier-1, -2, etcetera, suppliers, but starting from a firm that is sufficiently high in level, its suppliers at Tier-1, -2, and so forth, will always be at successively lower levels.
The hierarchically partitioned layers in Figure 3 map out the relative position of each firm in the upstream/downstream industry value-chain. In general, the larger the number from class 1 to 7, the closer the manufacturing processes and services are to the end products that reach final customers. The relatively low layers include large numbers of firms, and the relatively high layers have small numbers of firms. In these scalings, nodes are assigned on the x-y plane according to the average x-y coordinates of their neighbors (initially assigned randomly). The z coordinate in the 3D topology is assigned by the depth partition. It appears that the depth hierarchy has multiple peaks of prominent OEMs at the top of the overlapping “mountains,” or a series of “pyramids,” which were sharing numerous SME suppliers at low levels of the layers. Hence, Hypothesis 1 is accepted, and the hierarchical levels and proximities reflect a division of labor operating over a complex web of commodity chain transfers. Structural Embedding and Analysis of Cohesion Measures The above identification of the existence of large components and the hierarchically asymmetric configuration leads to a further analysis of the exchange mechanisms in the production market. Our analysis of the acyclic depth partition of the largest component has unveiled the underlying structure as multiple peaks of prominent OEMs, or “mountaintops” and “ridges” (White et al. 2005) that represent the downstream sinks (inverted mountaintops) toward which goods and services flow in weavings through the complex, hierarchical network as entangled chains of processing activities.9
Further, different measures of cohesion can help to distinguish different types of hierarchical structure from the viewpoint of underlying organizing principles of the network. As Powell, White, Koput and Owen-Smith (2005) show, forms of network analysis that incorporate cohesion analysis, as measurement of multiconnectivity of nodes, can help to identify powerful drivers or dynamical engines of a network, including those with hierarchical properties. White, Owen-Smith,
9 “Downstream” here is used in the economic sense consonant with Harrison White (2002b; 2003) of flow from upstream suppliers to downstream buyers, e.g., buyers who assemble parts, components, and modules into finished products that eventually flow to end consumers. If we think of our mountaintops of the hierarchy as inverted, downstream flows are toward these inverted tops.
11
Moody, and Powell (2005) identified a similar kind of dynamical engine involving multiconnectivity in a different large-scale network. While Granovetter (1985; 1992) calls this type of entangled weavings “economic embedding,” White and Harary (2001) developed a similar but precise network concept and measure of structural cohesion for which Moody and White (2003) provided a computational algorithm that also computes a related measure of theirs, called structural embedding.
Figure 3. A Global Structure. Note.—The graph shows subcontracting layers, according to the acyclic depth partition of the 4500 firms in the
largest component from the Ohta-ku Akusesu Deta 1 & 2 (Ohta-ku Sangyo Shinko Kyokai 1997a; 1997b) data. The sizes of nodes reflect firm in-degree, or times listed by others as a prime buyer. Alphabetical labels were given to 105 firms with highest in-degree scores, those of 6 or more. The Ministry of Self-Defense Force was also given an alphabetical label, although it was not among the 105 firms with its in-degree of 5.
Examining multiconnectivity, the large component of 4,500 Ohta firms contains a large bicomponent of 1,609 firms—structurally cohesive and robust at a multiconnected level of 2. A bicomponent where all the nodes are connected by two or more independent paths defines a structural unit relevant to cohesion and the existence of alternative paths makes the bicomponent network robust.10 All of the top 105 prime buyers in terms of in-degree in the full network are contained in the bicomponent, and of the 97 firms in the bicomponent with in-degree of 5 or more, 10 A bicomponent (tricomponent, k-component, multiconnected component) is also defined as a maximal subgraph that cannot be disconnected by fewer than two (three, k) nodes. By Menger’s theorem, this is equivalent to every pair of nodes having two (three, k) or more node-independent paths connecting them. This is also equivalent to a maximal subgraph having at least one cycle that includes every pair of nodes in the bicomponent when the directions of the arcs are disregarded.
12
88 are firms listed as the top 105 prime buyers for the whole network. A hierarchical nesting is apparent in the composition of the Ohta network.
The acyclic orientation and the embedding of two layers of nested components suggest that the whole network should converge towards a single core. Therefore, the second hypothesis to test is as follows: Hypothesis 2: Within the complex webs of the supplier-buyer network in industrial districts, there will be a cohesive core of the hierarchy with some level of multiconnectivity.
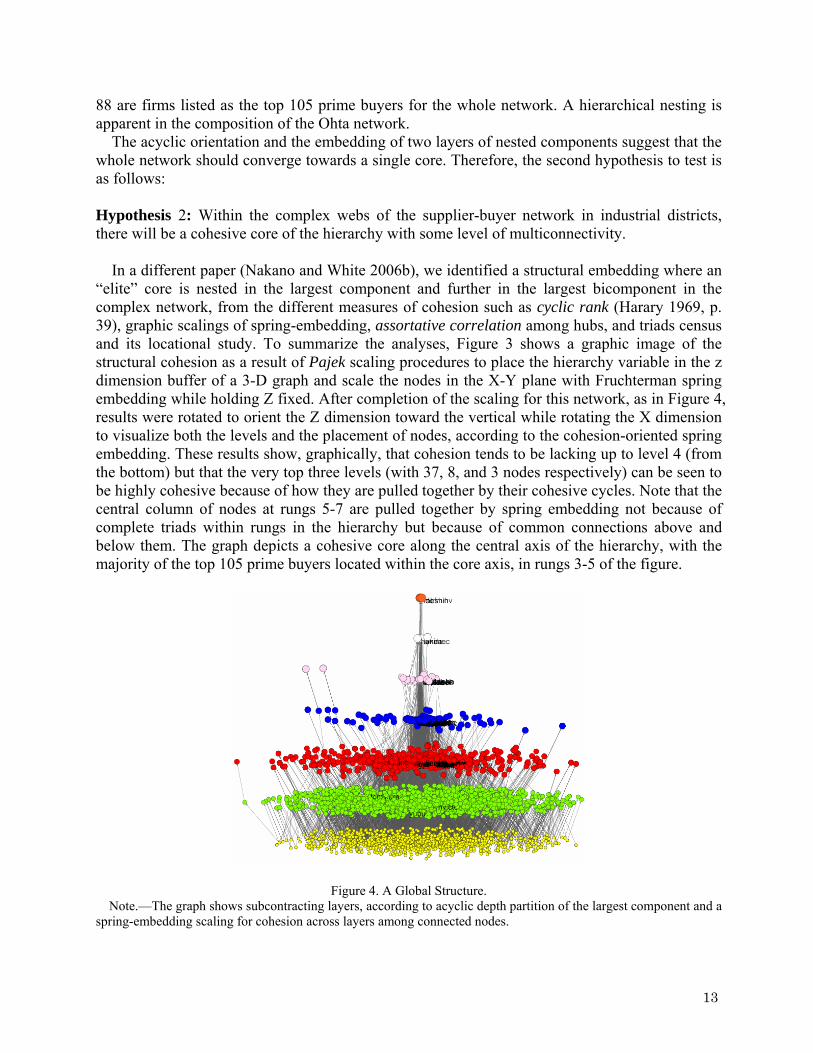
In a different paper (Nakano and White 2006b), we identified a structural embedding where an “elite” core is nested in the largest component and further in the largest bicomponent in the complex network, from the different measures of cohesion such as cyclic rank (Harary 1969, p. 39), graphic scalings of spring-embedding, assortative correlation among hubs, and triads census and its locational study. To summarize the analyses, Figure 3 shows a graphic image of the structural cohesion as a result of Pajek scaling procedures to place the hierarchy variable in the z dimension buffer of a 3-D graph and scale the nodes in the X-Y plane with Fruchterman spring embedding while holding Z fixed. After completion of the scaling for this network, as in Figure 4, results were rotated to orient the Z dimension toward the vertical while rotating the X dimension to visualize both the levels and the placement of nodes, according to the cohesion-oriented spring embedding. These results show, graphically, that cohesion tends to be lacking up to level 4 (from the bottom) but that the very top three levels (with 37, 8, and 3 nodes respectively) can be seen to be highly cohesive because of how they are pulled together by their cohesive cycles. Note that the central column of nodes at rungs 5-7 are pulled together by spring embedding not because of complete triads within rungs in the hierarchy but because of common connections above and below them. The graph depicts a cohesive core along the central axis of the hierarchy, with the majority of the top 105 prime buyers located within the core axis, in rungs 3-5 of the figure.
Figure 4. A Global Structure. Note.—The graph shows subcontracting layers, according to acyclic depth partition of the largest component and a
spring-embedding scaling for cohesion across layers among connected nodes.
13
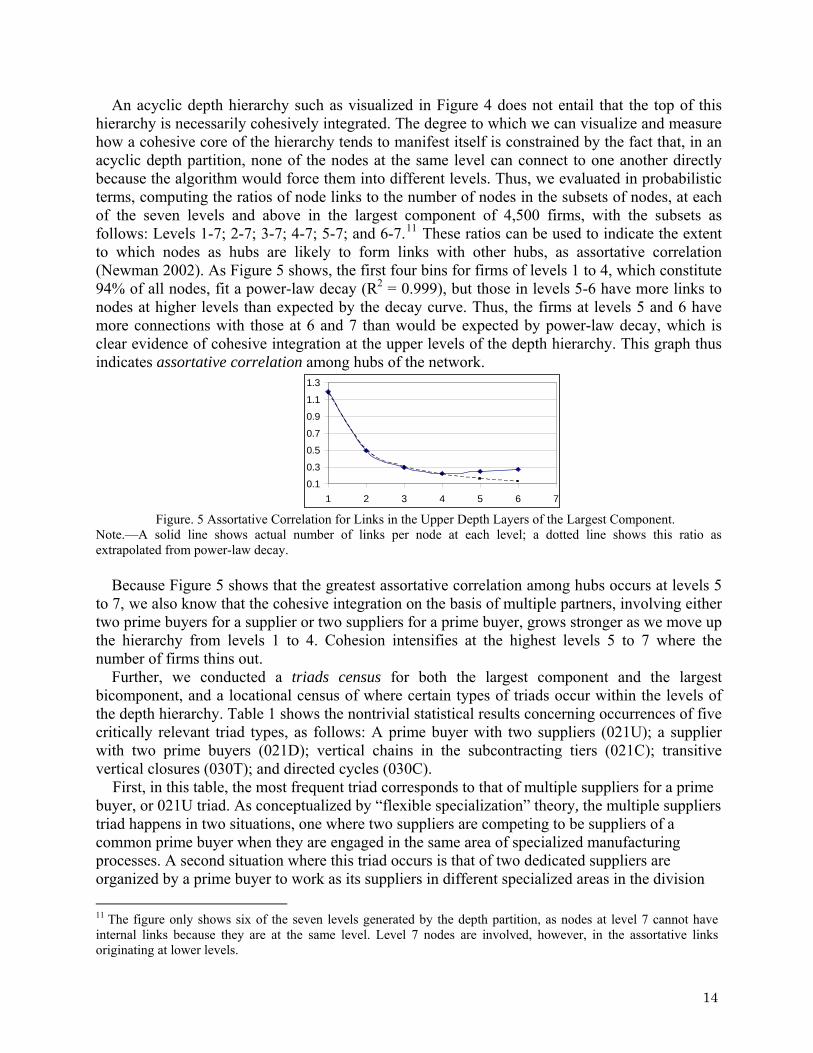
An acyclic depth hierarchy such as visualized in Figure 4 does not entail that the top of this hierarchy is necessarily cohesively integrated. The degree to which we can visualize and measure how a cohesive core of the hierarchy tends to manifest itself is constrained by the fact that, in an acyclic depth partition, none of the nodes at the same level can connect to one another directly because the algorithm would force them into different levels. Thus, we evaluated in probabilistic terms, computing the ratios of node links to the number of nodes in the subsets of nodes, at each of the seven levels and above in the largest component of 4,500 firms, with the subsets as follows: Levels 1-7; 2-7; 3-7; 4-7; 5-7; and 6-7.11 These ratios can be used to indicate the extent to which nodes as hubs are likely to form links with other hubs, as assortative correlation (Newman 2002). As Figure 5 shows, the first four bins for firms of levels 1 to 4, which constitute 94% of all nodes, fit a power-law decay (R2 = 0.999), but those in levels 5-6 have more links to nodes at higher levels than expected by the decay curve. Thus, the firms at levels 5 and 6 have more connections with those at 6 and 7 than would be expected by power-law decay, which is clear evidence of cohesive integration at the upper levels of the depth hierarchy. This graph thus indicates assortative correlation among hubs of the network.
0.1
0.3
0.5
0.7
0.9
1.1
1.3
1 2 3 4 5 6 7 Figure. 5 Assortative Correlation for Links in the Upper Depth Layers of the Largest Component.
Note.—A solid line shows actual number of links per node at each level; a dotted line shows this ratio as extrapolated from power-law decay.
Because Figure 5 shows that the greatest assortative correlation among hubs occurs at levels 5 to 7, we also know that the cohesive integration on the basis of multiple partners, involving either two prime buyers for a supplier or two suppliers for a prime buyer, grows stronger as we move up the hierarchy from levels 1 to 4. Cohesion intensifies at the highest levels 5 to 7 where the number of firms thins out.
Further, we conducted a triads census for both the largest component and the largest bicomponent, and a locational census of where certain types of triads occur within the levels of the depth hierarchy. Table 1 shows the nontrivial statistical results concerning occurrences of five critically relevant triad types, as follows: A prime buyer with two suppliers (021U); a supplier with two prime buyers (021D); vertical chains in the subcontracting tiers (021C); transitive vertical closures (030T); and directed cycles (030C).
First, in this table, the most frequent triad corresponds to that of multiple suppliers for a prime buyer, or 021U triad. As conceptualized by “flexible specialization” theory, the multiple suppliers triad happens in two situations, one where two suppliers are competing to be suppliers of a common prime buyer when they are engaged in the same area of specialized manufacturing processes. A second situation where this triad occurs is that of two dedicated suppliers are organized by a prime buyer to work as its suppliers in different specialized areas in the division 11 The figure only shows six of the seven levels generated by the depth partition, as nodes at level 7 cannot have internal links because they are at the same level. Level 7 nodes are involved, however, in the assortative links originating at lower levels.
14
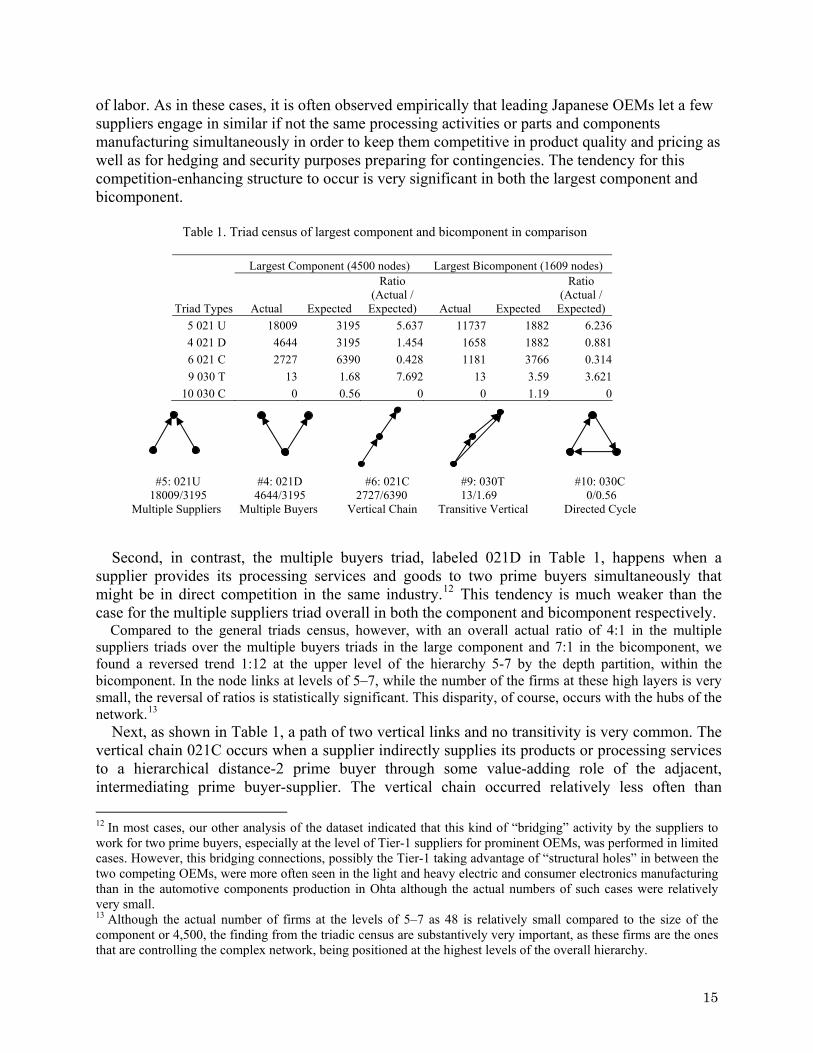
of labor. As in these cases, it is often observed empirically that leading Japanese OEMs let a few suppliers engage in similar if not the same processing activities or parts and components manufacturing simultaneously in order to keep them competitive in product quality and pricing as well as for hedging and security purposes preparing for contingencies. The tendency for this competition-enhancing structure to occur is very significant in both the largest component and bicomponent.
Table 1. Triad census of largest component and bicomponent in comparison
Largest Component (4500 nodes) Largest Bicomponent (1609 nodes)
Triad Types Actual Expected
Ratio (Actual /
Expected) Actual Expected
Ratio (Actual /
Expected) 5 021 U 18009 3195 5.637 11737 1882 6.236 4 021 D 4644 3195 1.454 1658 1882 0.881 6 021 C 2727 6390 0.428 1181 3766 0.314 9 030 T 13 1.68 7.692 13 3.59 3.621 10 030 C 0 0.56 0 0 1.19 0
#5: 021U #4: 021D #6: 021C #9: 030T #10: 030C 18009/3195 4644/3195 2727/6390 13/1.69 0/0.56
Multiple Suppliers Multiple Buyers Vertical Chain Transitive Vertical Directed Cycle
Second, in contrast, the multiple buyers triad, labeled 021D in Table 1, happens when a
supplier provides its processing services and goods to two prime buyers simultaneously that might be in direct competition in the same industry.12 This tendency is much weaker than the case for the multiple suppliers triad overall in both the component and bicomponent respectively.
Compared to the general triads census, however, with an overall actual ratio of 4:1 in the multiple suppliers triads over the multiple buyers triads in the large component and 7:1 in the bicomponent, we found a reversed trend 1:12 at the upper level of the hierarchy 5-7 by the depth partition, within the bicomponent. In the node links at levels of 5–7, while the number of the firms at these high layers is very small, the reversal of ratios is statistically significant. This disparity, of course, occurs with the hubs of the network.13
Next, as shown in Table 1, a path of two vertical links and no transitivity is very common. The vertical chain 021C occurs when a supplier indirectly supplies its products or processing services to a hierarchical distance-2 prime buyer through some value-adding role of the adjacent, intermediating prime buyer-supplier. The vertical chain occurred relatively less often than 12 In most cases, our other analysis of the dataset indicated that this kind of “bridging” activity by the suppliers to work for two prime buyers, especially at the level of Tier-1 suppliers for prominent OEMs, was performed in limited cases. However, this bridging connections, possibly the Tier-1 taking advantage of “structural holes” in between the two competing OEMs, were more often seen in the light and heavy electric and consumer electronics manufacturing than in the automotive components production in Ohta although the actual numbers of such cases were relatively very small. 13 Although the actual number of firms at the levels of 5–7 as 48 is relatively small compared to the size of the component or 4,500, the finding from the triadic census are substantively very important, as these firms are the ones that are controlling the complex network, being positioned at the highest levels of the overall hierarchy.
15
expected by chance in both the component and the bicomponent although the actual numbers of occurrence were relatively large. There were 2,727 such occurrences for the component and 1,181 for the bicomponent.
By comparison, the transitive vertical closure triad 030T is expected to occur very rarely, as suppliers do not need the intermediating roles of their adjacent prime buyer-suppliers when they can work for the prime buyers directly, except in the case that the intermediary has very unique value-adding technologies. In fact, there is only a miniscule tendency for firms to form a transitive hierarchy, and this mild transitivity asserts itself to an insignificant degree that does not carry over to the bicomponent.
Finally, in Table 1, a path of two vertical links and no transitivity is very common. The vertical chain 021C occurs when a supplier indirectly supplies its products or processing services to a hierarchically once-removed, prime buyer through some value-adding role of the adjacent, intermediating prime buyer-supplier. The vertical chain is expected to occur much more often than the transitive vertical closure or 030T. Actually, the former occurred relatively less often than expected by chance in both the component and the bicomponent although the actual numbers of occurrence were relatively large.
Overall, the structural evidence for convergences toward a single hierarchy, the prevalence of “multiple suppliers triad,” is a much stronger tendency than the “multiple prime buyers” triad. But the reverse is true for the hubs of the networks because the latter configuration tends to be concentrated in the upper levels of the hierarchy.
Thus, Hypothesis 2 of a cohesive core within the supplier-buyer hierarchy is supported with the above test results from a variety of cohesion measures including the different graphic scalings, the assortative correlation of the hubs, and the triads census results.14 TOWARD A NETWORK MODEL OF PRODUCTION MARKETS The Supplier/prime Buyer Network from the Perspective of White’s Market Model The above analysis of cohesion indicates that, deep in the complex hierarchies of regional supplier-buyer network, the core, as an “elite club” comprised of extremely powerful OEMs and their powerful suppliers, functions as a powerful organizing driver of the links in the entangled, hierarchical subcontracting relationships, or a key network integration mechanism in Ohta. The structural cohesion is about multiconnectivity rather than density, as White and Harary (2001), Moody and White (2003) and Powell, White, Koput and Owen-Smith (2005) have noted in their tests of the predicted effects of cohesion on other network and attribute variables.
Harrison White (2002a) builds his theory of production markets with the observation that production chains are directional and hierarchically organized, and that mechanisms are in place for price profiles to emerge competitively. As in his image of production markets, our analysis of the acyclic depth partition of the largest component unveiled the underlying structure behind the complex web of the regional supplier networks as multiple peaks of prominent OEMs, or “mountaintops” and “ridges”
The configurations of the regional supplier-buyer network fit well with the above conditions of the production markets identified by White, as the notion of regional “industry value-chain” in Ohta and its compositions were clarified, moving from the results of a series of network analysis toward a suggested network model of production chain markets. White argues that the 14 For more detailed discussions and analyses, see (Nakano and White 2006a; Nakano and White 2006b)
16
organizational story of production markets should emerge, which can organize along four dimensions, briefly paraphrased, as follows: First, their emergence in the context of upstream sellers and downstream buyers; second, a price profile is generated by a volume mechanism that bridges procurement to production to buyers; third, markets are higher level actors with a given context that can be explicitly modeled; and fourth, tugs-of-war cross-stream in a sector of markets (White 2002a). White (2002b; 2003) goes on to show how agency accommodates within such organization, and he maps the whole spectrum of viable markets, arguing as well that social construction of these self-adjusting mechanisms suggests predictions not conceived by existing economic modeling around cognitions. The windup of his book notes how the building of industrial and market culture accompanies this organizational story.
In short, the production markets modeled in Figures 3-5 show an overall fit within his approach: They are hierarchically organized; the production chains are directional; and the mechanisms are in place for price profiles to emerge competitively. A Simple Optimization Model of Acyclic Depth and Biconnectivity Our findings from the cohesion analysis of the supplier-buyer relations in the observed production-chain networks have strong implications for an optimization model of benefits from exchange relationships, and thus of a network model for industrial district market mechanisms. To begin with, the hierarchically partitioned layers in Figure 3 map out the relative position of each firm in the upstream/downstream industry value-chain. In general, the larger the number from class 1 to 7, the closer the manufacturing processes and services are to the end products that reach final customers.
We consider first the minimal form of cohesion in a network that facilitates quasi-optimal pricing. Price equilibrium is a dual outcome of suppliers seeking the best price for the quality of goods they sell, and buyers seeking the quality of goods that fit their needs best for the price they pay. Optimal conditions for price equilibrium will occur when there is little or no chance for monopoly of trade links, as where sellers have at least two buyers, and buyers have at least two sellers. In an acyclic depth partition, this quasi-optimal exchange would occur where the buyers located at the top of the production chains in the hierarchical subcontracting network have two or more suppliers, and so on down through the tiers in the network; then, inversely for sellers from the bottom of the hierarchies toward the top. Ignoring the direction of ties, such a structure would have multiconnectivity, or at least biconnectivity (two independent paths between every pair of nodes).
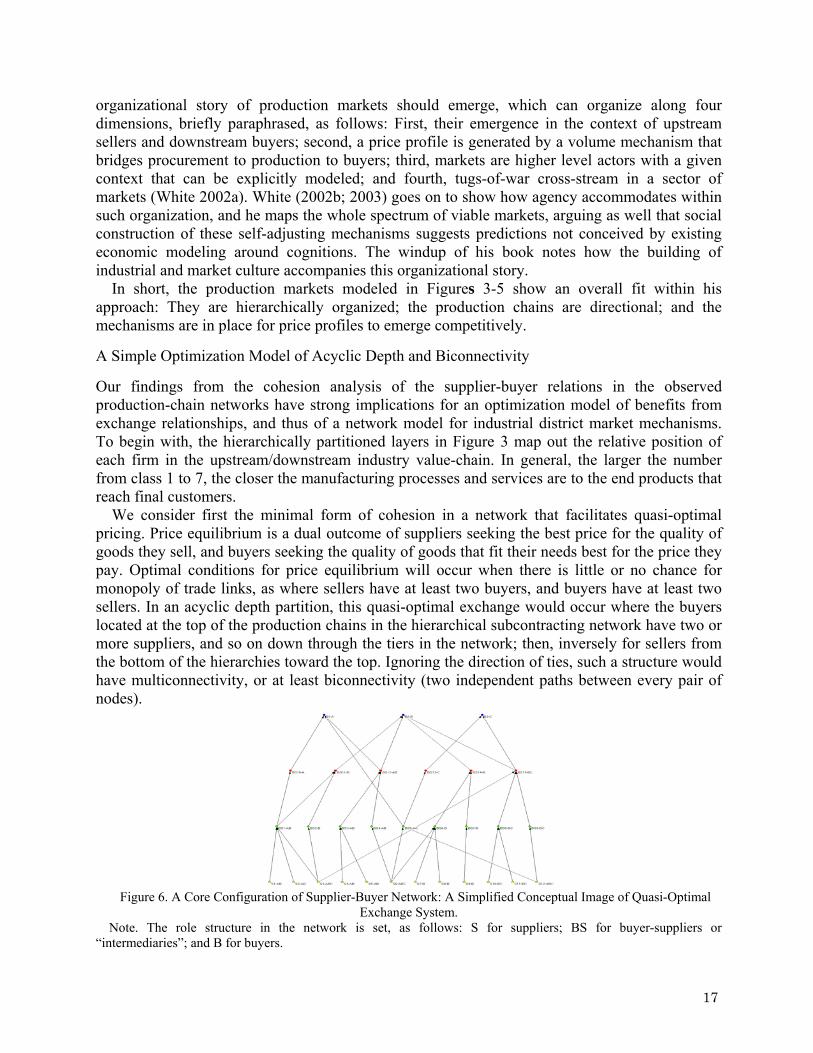
Figure 6. A Core Configuration of Supplier-Buyer Network: A Simplified Conceptual Image of Quasi-Optimal
Exchange System. Note. The role structure in the network is set, as follows: S for suppliers; BS for buyer-suppliers or
“intermediaries”; and B for buyers.
17
Network configurations like the ones in Figures 3-5 might be expected to emerge the better to
optimize benefits of the regional supplier-buyer system for the top OEMs and other prime buyers that share a pool of suppliers. We have argued, however, that bicomponents, even with a very low density of links between levels in the hierarchy, provide benefits of quasi-optimal pricing.
Figure 6 illustrates a simplified conceptual model of a core system. It is not a network in which every supplier (designated S) has two buyers, or every buyer (designated B) has two suppliers, but it still achieves quasi-optimal for exchange in an acyclic supplier-buyer network, as it takes the network configuration of a bicomponent embedded in a larger component. Horizontally viewed, there are 30 firms contained across the four hierarchical layers as follows: 12 suppliers at the level 1; 9 buyer-suppliers (designated BS) at level 2; 6 buyer-supplier at level 3; and 3 buyers at the top as OEMs. Taking a vertical view, there are three linked but different streams of production flow process, which start from the suppliers at the bottom and eventually reach the three different buyers or OEMs at the top: A, B, and C. These entangled but different paths start from the suppliers at level 1, and move up the tiers in the subcontracting hierarchies through the directional steps of manufacturing activities successively executed by those buyer-suppliers (BS) as “intermediaries,” which can be hubs in some cases at higher levels. In the graph, the alphabetical designation after each hyphen, as presented with combinations of A, B and C, indicates how the manufacturing activities are contributing or related to the final products or industries that are represented by the three OEMs at the top.
With respect to acyclic biconnectivity, here S3, S6, S12, BS1, BS5, BS12, BS15 have two or more buyers of their goods respectively, and therefore are able to choose buyers that offer the better tradeoff of price and quality. Similarly BS1, BS3, BS6, BS8, BS11, BS12, BS14, BS15, B1, B2, and B3 have two or more suppliers each and are able to choose suppliers that offer better goods for the price or better price for similar quality. A bicohesive unit of this sort with 30 nodes would have 18 buyers and 27 sellers, of which 11 and 7 respectively, or 11/18th and 7/27th, have the opportunity to make the pricing competitive and therefore efficient through the multiconnectivity.
The network mechanism of quasi-optimal pricing should be achieved in the long run if not short, given the configuration of bi-connectivity in the acyclic network, as in Figure 6. To give an example, S3 supplies similar products or services to both BS1 and BS15, which means that S3 is receiving quasi-optimal price from each, as S3 would stop supplying the products to one of the two buyer-suppliers, if the terms and conditions offered by one of the two was repeatedly considerably worse than the one by the other. At the same time, as BS1 has three suppliers, S1, S2, and S3, if the quality of products supplied by S3 was considerably inferior to the ones supplied by S1 and S2, BS1 would stop purchasing from S3 and instead would switch all the transactions only to S1 and S2. Then, while BS1 and BS15 have paid a quasi-optimal price to the services provided by S3, they in turn supply their processed and value-added products to their own buyers, respectively, such as BS10 and BS11 for BS1 and B2 and B3 for BS15. In the case of BS10, the competitive price that BS1 has paid to S1, S2, and S3 will be passed along to B1 with BS10’s appropriate profit margin for its value-added processing activity in-house, because, if BS10 should extract an excessively large amount of profit as “intermediary,” the entire chain of manufacturing processes from S1, S2, and S3 to B1 would eventually lose its competitiveness against the other supplier chains leading to B1, such as through BS5 and BS12, as a result of repeated transactions in the long run. To rephrase, all the firms involved in the chain of manufacturing processes, from the suppliers at the bottom to the buyer at the top, would not be
18
able to keep their competitive pricing advantages if this kind of inefficient exchange should occur in terms of buyer-supplier chains too frequently connected by single paths. Then, the chain would not survive for a long time, and a rewiring of the chain to exclude those “disequilibrium” points or inefficient nodes will get started soon in the regional supplier network. Therefore, it is obvious that these “intermediaries” that do not have multiple suppliers or buyers are also under the pressure from the competitive pricing of the system, to a certain degree.
Similarly, BS11, which also takes advantage of the direct competition, given that BS11 has two suppliers of similar quality of products or services, is under the pressure to sell its products or services at a competitive price to B2. If the price offered by BS11 was not competitive, B2 would buy similar products or services from the other buyer-suppliers, such as BS12, BS14, and BS15.
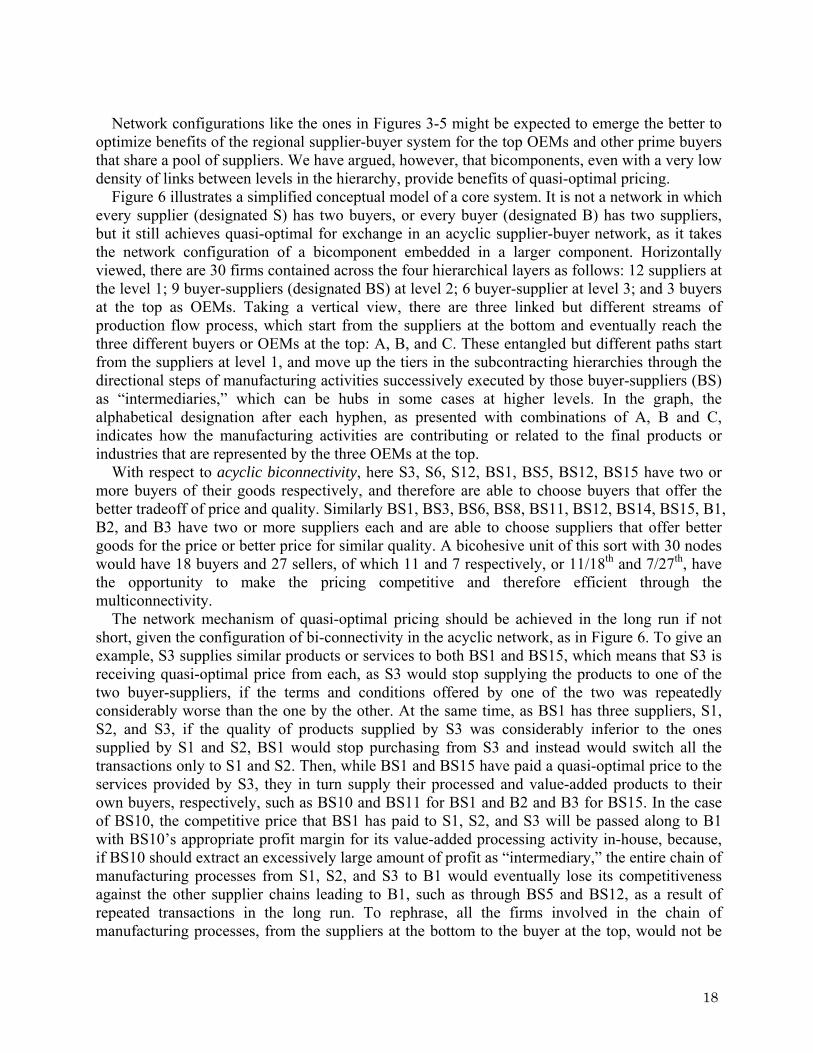
Figure. 7 A Hypothetical Efficient Core: The Largest Bicomponent of 18 Firms from 30. Note. The role structure in the network is set, as follows: S for suppliers; BS for buyer-suppliers or “intermediaries”; and B for buyers. An Equilibrium from Network Analysis and Test Results Figure 7 is the largest bicomponent embedded in Figure 6. It is clear that sets of these suppliers, buyer-suppliers, and buyers with in-degree or out-degree of two or more can be expected to “seed” equilibrium pricing throughout the network, as this kind of optimal pricing mechanisms should be at work in bicomponents where two node-independent paths are always available, from the suppliers at the bottom to the buyers at the top, as depicted by Figure 7.
It should be emphasized that a larger network as a weak component, such as Figure 6, should also generate a quasi-optimal pricing largely throughout the component, as the mechanisms of competitive pricing are built-in for the whole network, even though two node-independent paths from the suppliers at the bottom to the buyers at the top are available only a lot less frequently than in the case of the bicomponent in the competitive chains of a “survival game” among the suppliers and the buyers.
The pricing information on this multiple path-based competition should circulate recursively, within the whole component, as a result of the repeated transactions among bi- and single-connected nodes, regardless of the directions of the ties. In other words, the efficient or quasi-optimal pricing should occur, owing primarily to bridging and organizing functions of nodes that have a choice of their suppliers or their buyers, and secondarily to the competitive nature of the pricing mechanisms that those “intermediaries” without the choice of their buyers or suppliers are also under the pressure to pass along the embedded, quasi-optimal prices from their suppliers, in order to compete against alternative manufacturing chains or node-independent paths from the suppliers at the bottom to the buyers at the top.
19
We thus hypothesize that a bicomponent with multiple sellers and multiple buyers should be a necessary “seeding” mechanism for the quasi-optimal pricing. In other words, the network configuration for the quasi-optimal trading for all the players would also have to be part of a bicomponent, as the bicomponent provides at least two node-independent paths between suppliers at the bottom and buyers at the top, through the linked tiers in the embedded regional production network.15
However, it is also important to note that this pricing mechanism should produce only quasi-optimal, or a very efficient but not necessarily fully optimal pricing, in the actual production chain market, due to the following two reasons. First, through the local search processes of trading partners, what these firms expect to get at best is practically a “satisficing” solution to gain profit from these trade transactions in order to keep their business running for further growth, under the incomplete information or “bounded rationality” problem (March and Simon 1958). In the complex, entangled relationships embedded in a regional economy, to find the best trade partner, which could offer deals of maximal profits to the firm, should be based on the practical business considerations, trying to secure profits at the given relatively small costs of time and labor for their long-term survival and success. Under the circumstances, these firms can never know whether they in fact got the single optimal pricing but only the fact that they got good or “satisfactory” pricing if not the best.
Second, not every firm but only a good number of firms in the supplier-buyer network needs to have a choice between two buyers and two sellers, as a sufficient condition to create this quasi-optimal trading, as explained earlier. If this sort of multiconnected basis for exchange occurs at a good number of locations in the core of the network in the bicomponent, a large part of the whole network such as a large, weakly connected component can achieve “sufficiently optimal” exchange, owing to the nested local connectivity that connects all the firms in the largest bicomponent to all those firms in the largest component through at least one path, as the conversion of the core configurations from Figure 6 to Figure 7 can exemplify.
Therefore, we posit only the following hypothesis: Hypothesis 3: At the aggregate level of any production chain network in each of complex webs of regional supplier-buyer network, as the largest bicomponents are the ones where quasi-optimal pricing will occur and thus market equilibrium will be achieved, a large bicomponent will always exist within the largest component in each of complex webs of regional supplier-buyer network.
Testing on the data, a giant component that contains a large bicomponent does exist in the dataset, as hypothesized for a precondition of the quasi-optimal pricing. A large bicomponent of 1,609 firms was found within the largest component of 4,500 firms. As a note, all of the top 105 prime buyers in the full network are contained in the bicomponent. Moreover, of the 97 firms
15 One aspect of “flexible specialization” is this kind of quasi-optimal exchange through the two channels or more. At the same time, another is the division of labor among suppliers organized by OEMs and hubs where the dedicated suppliers often engage in related but different manufacturing processes on the basis of their specialized technologies and crafts. Theoretically speaking, it is possible that the trading with two or more suppliers may not necessarily create the competitive pricing for quasi-optimal exchange for the buyers or OEMs in the short-run, if the division of labor assigns completely different manufacturing activities and processing services to the specialized, dedicated suppliers. In the long-run, however, after the repeated exchange, the existence of the multiple suppliers that possess similar and comparable capabilities, crafts, technologies, and skills should achieve the quasi-optimal pricing mechanism, as there should always be potential, alternative suppliers that have complementary and comparable technological levels for the buyer. A critical point is whether the buyer has an alternative in contact or proximity that could replace the existing manufacturing supplier in the triads.
20
with in-degree of 5 or more in the bicomponent, 88 are firms listed as the top 105 prime buyers in the whole network. A hierarchical nesting is apparent in the network composition.
Further, of the 1,609 firms in the largest bicomponent, which is nested in the largest component, 782 are suppliers only, and 483 are prime buyers only, leaving 1,609 – 1,265 = 344 nodes that are prime buyer-suppliers, or sort of “intermediaries” in the hierarchical configuration. A maximal model of optimal pricing under these constraints would have 2*1,265 + 4*344 = 3,906 links and 2.43 links per node, which is greater than the actual average degree of the bicomponent, or 2,461 / 1,609 = 1.53. That is, the expected number is about 59% higher than the actual. This statistic is in line with Hypothesis 3, as the largest bicomponent in fact appears to contain enough node-independent paths as to create a quasi-optimal system of exchange relations at the core of the whole network.
What are some substantive implications of this acyclic biconnectivity for the suppliers and buyers respectively? Our argument about quasi-optimal price equilibrium has been made dually, as an outcome of suppliers seeking the best price for the quality of goods they sell or services that they provide, and of buyers seeking the goods or services that fit best their needs at the price they pay. The case of having multiple buyers of the commodities or services in a supplier’s production chains is a better position for a supplier in a production chain network, and hence suppliers will tend to optimize links in this direction toward having two buyers in their commodity chains. In view of our empirical findings, this situation might make more of a difference the higher the firm is located in the level hierarchy, given that the number of firms thins out the higher the level.
While having two or more prime buyers should be an optimal solution for a supplier embedded in the regional supplier/prime buyer relations as to avoid a closure or “lock-in” into over-embedded, fragmented cliques, which will lead to inefficient, sub-optimal pricing, we may repeat the argument on the flip-side, for each of buyers having two suppliers in the same area of manufacturing. This gives a prime buyer with a choice among two suppliers considerable benefit by offering hedging mechanisms for the buyer in case any trouble should happen in one of the two, which could possibly stop the buyer’s full line of operations in-house in order to further process or assemble the parts into the finished products. Moreover, the configurations will also provide more opportunities for the buyer to take advantage of rather competitive bidding between the two suppliers.16
From the point of view of buyers, a closure of many embedded suppliers should be beneficial as the lock-in of suppliers will give the buyer more power in negotiation in the short-run insofar as the buyer can control and coordinate multiple ties with these competing suppliers in the same manufacturing activities in both their operations management of logistics and inventory control from the suppliers.
However, having too many suppliers is not desirable for the prime buyers, as strategic action under the incomplete information has some of the following practical constraints. First, it would possibly incur unnecessary monitoring cost on the buyer in order to control and coordinate its logistics to assemble parts and components from the suppliers as hubs. Second, as the buyers need to exchange a lot of technical and technological information with their suppliers, including proprietary or highly confidential knowledge and skills, having an extra supplier would increase
16 It is often observed that leading Japanese OEMs let a few suppliers engage in the same processing activities or parts and components manufacturing, simultaneously as their suppliers, in order to keep them compete in product quality and pricing as well as hedging and security purposes preparing for contingencies.
21
their chance of giving away their core competencies.17 Finally, maintaining a large number of suppliers engaged in the same manufacturing process would create unnecessary tension and distrust not only among the suppliers but also between the prime buyer and the suppliers. From the viewpoint of this “satisficing” strategic consideration (Chandler 1977; March and Simon 1958) by the buyers, which may be still sub-optimal but sufficiently efficient under the bounded rationality where contingencies necessarily exist in their supplier/prime buyer relations, the magic number of their suppliers should be two. Therefore, another hypothesis was posited, as follows: Hypothesis 4: At the aggregate level of any production chain network in each of complex webs of regional supplier/prime buyer network, as the largest bi-components are the ones where quasi-optimal pricing and avoidance of closure by prime buyers will be achieved from the supplier’s viewpoint and also where quasi-optimal pricing, minimum monitoring cost, and risk hedging will be achieved simultaneously from the buyer’s viewpoint, and thus the market equilibrium will be achieved, a large bicomponent that has a high degree of acyclic bicompleteness will always exist within the largest component.
To test Hypothesis 4, Table 2 is a cross tabulation of the node distribution in the largest bicomponent, as relationships among the 1,609 firms in term of the number of out-degree (as suppliers) by the number of in-degree (as prime buyers). The most efficient configurations are comprised of three kinds of nodes as follows: Multi-connected suppliers, which are located at the bottom of the depth hierarchy; “intermediating” prime buyer-suppliers with multi-connectivity in both in- and out-degree; and multi-connected prime buyers, located at the “mountaintops.” The composition has the same order distribution as above: 782 (48.6%); 75 (4.7%); and 483 (30.0%). In other words, 83.3% of all the firms in the largest bicomponent are embedded in the most efficient configuration patters, as either suppliers, prime buyer-suppliers, or prime buyers. We call this bicompleteness measure b, which indicates how efficient the weakly-connected, largest bicomponents are as to generate exchange at optimal pricing.
As for a looser configuration, there exist two kinds of nodes that are embedded in the quasi-optimal exchange relationships: Prime buyer-suppliers with one supplier and multiple prime buyers (32 firms or 2.0%); and prime buyer-suppliers with multiple suppliers and one prime buyer (136 firms or 8.4%). In other words, 10.4% of the firms in the largest bicomponent are in a state of quasi-optimal exchange, from the point of view of the acyclic bicompleteness.
Finally, there are firms that are not directly embedded even in the quasi-optimal exchange, as “intermediaries” that should basically pass through price information with only one supplier and one prime buyer (the “vertical chain” in the triads census in Table 1). These are only 95 firms or 5.9% of the 1,609 firms. These measures indicate that the bicomponent is highly efficient in terms of acyclic bicompleteness of nodes for the quasi-optimal exchange in the production network.
If having multiple suppliers and multiple buyers is sufficiently common in a production chain network hierarchy so as to create an equilibrium-price effect that diffuses throughout the network components and the larger district, it will not be necessary for every firm with a buyer or a seller
17 In most cases, our other analysis of the dataset indicated that this kind of “bridging” activity by the suppliers to work for two buyers, at the level of Tier-1 suppliers for prominent OEMs, was performed in limited cases. However, this bridging connections, possibly the Tier-1 taking advantage of ‘structural holes’ in between the two competing OEMs, were more often seen in the light and heavy electric and consumer electronics manufacturing than in the automotive components production in Ohta although the actual numbers were relatively small.
22
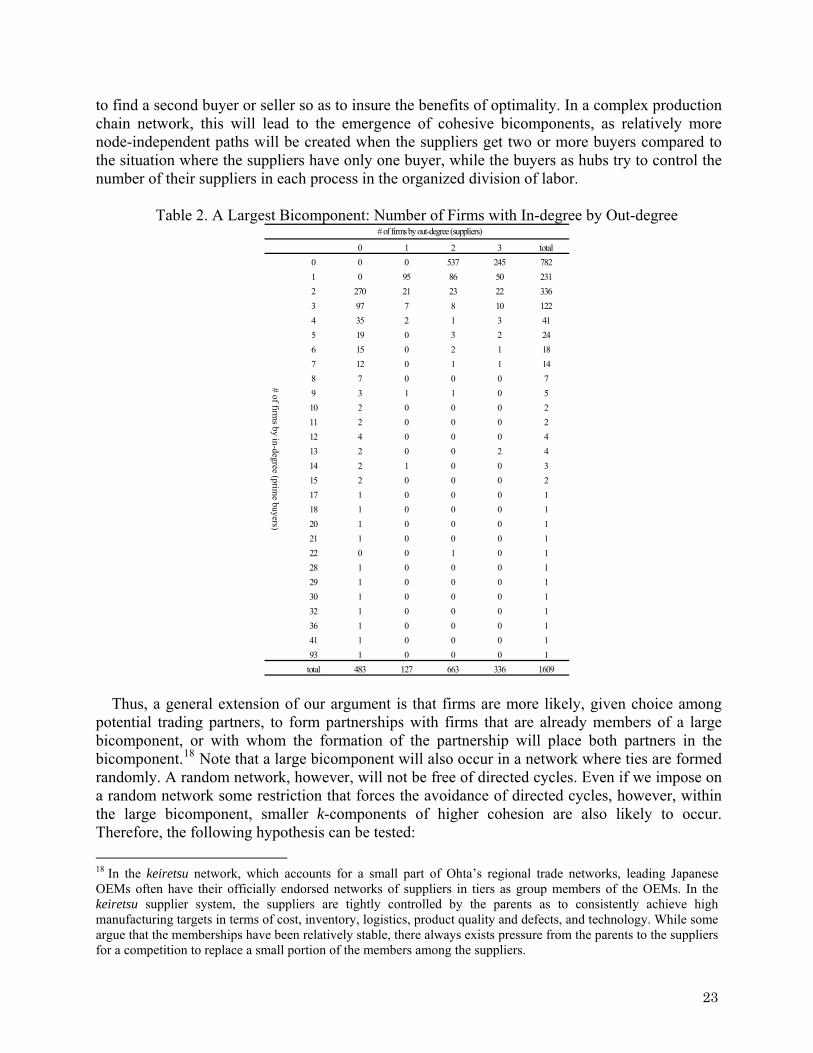
to find a second buyer or seller so as to insure the benefits of optimality. In a complex production chain network, this will lead to the emergence of cohesive bicomponents, as relatively more node-independent paths will be created when the suppliers get two or more buyers compared to the situation where the suppliers have only one buyer, while the buyers as hubs try to control the number of their suppliers in each process in the organized division of labor.
Table 2. A Largest Bicomponent: Number of Firms with In-degree by Out-degree
0 1 2 3 total0 0 0 537 245 7821 0 95 86 50 2312 270 21 23 22 3363 97 7 8 10 1224 35 2 1 3 415 19 0 3 2 246 15 0 2 1 187 12 0 1 1 148 7 0 0 0 79 3 1 1 0 510 2 0 0 0 211 2 0 0 0 212 4 0 0 0 413 2 0 0 2 414 2 1 0 0 315 2 0 0 0 217 1 0 0 0 118 1 0 0 0 120 1 0 0 0 121 1 0 0 0 122 0 0 1 0 128 1 0 0 0 129 1 0 0 0 130 1 0 0 0 132 1 0 0 0 136 1 0 0 0 141 1 0 0 0 193 1 0 0 0 1
total 483 127 663 336 1609
# of firms by out-degree (suppliers)
# of firms by in-degree (prim
e buyers)
Thus, a general extension of our argument is that firms are more likely, given choice among
potential trading partners, to form partnerships with firms that are already members of a large bicomponent, or with whom the formation of the partnership will place both partners in the bicomponent.18 Note that a large bicomponent will also occur in a network where ties are formed randomly. A random network, however, will not be free of directed cycles. Even if we impose on a random network some restriction that forces the avoidance of directed cycles, however, within the large bicomponent, smaller k-components of higher cohesion are also likely to occur. Therefore, the following hypothesis can be tested: 18 In the keiretsu network, which accounts for a small part of Ohta’s regional trade networks, leading Japanese OEMs often have their officially endorsed networks of suppliers in tiers as group members of the OEMs. In the keiretsu supplier system, the suppliers are tightly controlled by the parents as to consistently achieve high manufacturing targets in terms of cost, inventory, logistics, product quality and defects, and technology. While some argue that the memberships have been relatively stable, there always exists pressure from the parents to the suppliers for a competition to replace a small portion of the members among the suppliers.
23
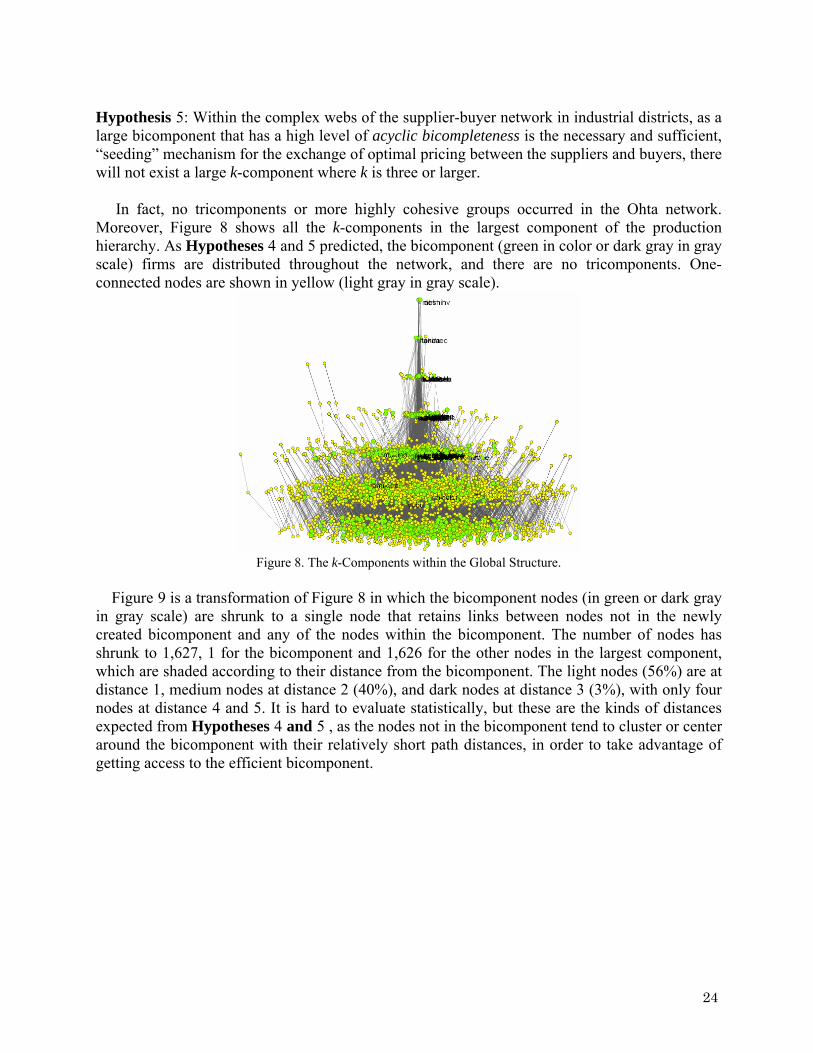
Hypothesis 5: Within the complex webs of the supplier-buyer network in industrial districts, as a large bicomponent that has a high level of acyclic bicompleteness is the necessary and sufficient, “seeding” mechanism for the exchange of optimal pricing between the suppliers and buyers, there will not exist a large k-component where k is three or larger.
In fact, no tricomponents or more highly cohesive groups occurred in the Ohta network. Moreover, Figure 8 shows all the k-components in the largest component of the production hierarchy. As Hypotheses 4 and 5 predicted, the bicomponent (green in color or dark gray in gray scale) firms are distributed throughout the network, and there are no tricomponents. One-connected nodes are shown in yellow (light gray in gray scale).
Figure 8. The k-Components within the Global Structure.
Figure 9 is a transformation of Figure 8 in which the bicomponent nodes (in green or dark gray
in gray scale) are shrunk to a single node that retains links between nodes not in the newly created bicomponent and any of the nodes within the bicomponent. The number of nodes has shrunk to 1,627, 1 for the bicomponent and 1,626 for the other nodes in the largest component, which are shaded according to their distance from the bicomponent. The light nodes (56%) are at distance 1, medium nodes at distance 2 (40%), and dark nodes at distance 3 (3%), with only four nodes at distance 4 and 5. It is hard to evaluate statistically, but these are the kinds of distances expected from Hypotheses 4 and 5 , as the nodes not in the bicomponent tend to cluster or center around the bicomponent with their relatively short path distances, in order to take advantage of getting access to the efficient bicomponent.
24
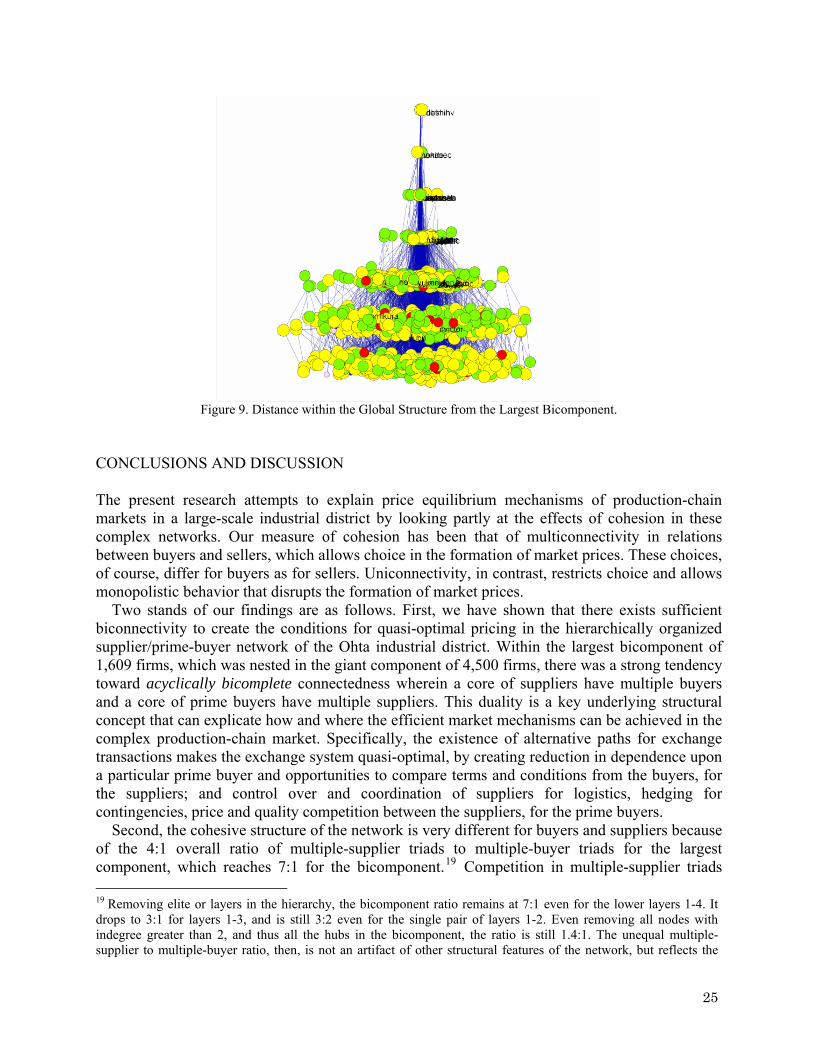
Figure 9. Distance within the Global Structure from the Largest Bicomponent.
CONCLUSIONS AND DISCUSSION The present research attempts to explain price equilibrium mechanisms of production-chain markets in a large-scale industrial district by looking partly at the effects of cohesion in these complex networks. Our measure of cohesion has been that of multiconnectivity in relations between buyers and sellers, which allows choice in the formation of market prices. These choices, of course, differ for buyers as for sellers. Uniconnectivity, in contrast, restricts choice and allows monopolistic behavior that disrupts the formation of market prices.
Two stands of our findings are as follows. First, we have shown that there exists sufficient biconnectivity to create the conditions for quasi-optimal pricing in the hierarchically organized supplier/prime-buyer network of the Ohta industrial district. Within the largest bicomponent of 1,609 firms, which was nested in the giant component of 4,500 firms, there was a strong tendency toward acyclically bicomplete connectedness wherein a core of suppliers have multiple buyers and a core of prime buyers have multiple suppliers. This duality is a key underlying structural concept that can explicate how and where the efficient market mechanisms can be achieved in the complex production-chain market. Specifically, the existence of alternative paths for exchange transactions makes the exchange system quasi-optimal, by creating reduction in dependence upon a particular prime buyer and opportunities to compare terms and conditions from the buyers, for the suppliers; and control over and coordination of suppliers for logistics, hedging for contingencies, price and quality competition between the suppliers, for the prime buyers.
Second, the cohesive structure of the network is very different for buyers and suppliers because of the 4:1 overall ratio of multiple-supplier triads to multiple-buyer triads for the largest component, which reaches 7:1 for the bicomponent.19 Competition in multiple-supplier triads 19 Removing elite or layers in the hierarchy, the bicomponent ratio remains at 7:1 even for the lower layers 1-4. It drops to 3:1 for layers 1-3, and is still 3:2 even for the single pair of layers 1-2. Even removing all nodes with indegree greater than 2, and thus all the hubs in the bicomponent, the ratio is still 1.4:1. The unequal multiple-supplier to multiple-buyer ratio, then, is not an artifact of other structural features of the network, but reflects the
25
should tend to favor lower purchasing prices for buyers in general, especially as firms in upper positions in the subcontracting hierarchy can exert extensive power as controlling and originating prime buyers that place orders to their suppliers. While the reverse is also true, that competition in multiple-buyer triads may favor higher prices paid to suppliers, the 4:1 and 7:1 frequency ratios for these two types of triads entails a much greater competitive pressure on suppliers to offer competitive prices to their buyers than the reverse. Moreover, these benefits for buyers become multiplicative as the serial steps of processing of parts, components, and products traverse the complex network of production-chain hierarchies. To elaborate, when a supplier offers a lower price for a component to a prime buyer, for example, the lowering of procurement cost can be incorporated into a lower price offered by the prime buyer as supplier to its next-level buyer. This process will continue until the flows of the goods in the successive value-added manufacturing processes reach its organizing hub, and then subsequently OEMs selling to customers outside the manufacturing industry. At the same time, while many different manufacturing paths tend to converge through the hierarchically linked, horizontal divisions of labor under the lead of hubs, the central core the elite suppliers and their extremely powerful OEMs organize the complex subcontracting network. Elite buyer firms located at the end of the production chain thus should benefit cumulatively from pricing competition among successive suppliers through the tiers of subcontracting hierarchies. This has a cumulative effect of enhancing the power of OEMs to set terms and conditions to their suppliers. These advantages are also reinforced by the assortative correlation “coalition” of elite buyers (rungs 5-7 in the hierarchy as shown in Figure 5), who have more connections with those similarly advantaged. Thus collective pressures emerge within the hierarchical structure for suppliers embedded in the chains of subcontracting to yield pricing advantages to OEMs that grow extremely powerful in the process.
The reversal in the preponderance of multiple-supplier over multiple-buyer triads from 4:1 to 1:12 for the elite levels in the hierarchy, combined with the assortative correlation for elite firms to have more links among themselves, may also be interpreted from the structural holes argument of network theory. It might appear that the supplier in the triads are taking advantage of the holes, or relative absence of ties, in between disconnected OEMs as prime-buyer rivals.20
Thus, while the more global pattern of biconnectivity enhances quasi-optimal pricing, the more specific patterns of differential cohesive patterns at the level of Simmelian triad structure favor pricing advantages to the core firms, including elite suppliers as Tier-1 organizing hubs. In the modern production-chain market, the coordinating skills and organizing roles of these Tier-1 elites may in fact fill a critical role by leveraging their cumulated organizing skills with the help of sophisticated information systems for logistical and quality control and advanced machining
reality of power and control asymmetries built in the complex network, through the tiers of divisions of labor in the subcontracting ladder in the overall hierarchy.
20 Resource dependency theory argues that firms that control critical resources in the network of firms can exert extensive power in the network, as these organizational resources are only scarcely available in their environments. This implies that, while the OEMs are extremely powerful, the elite suppliers or Tier-1 firms are also very powerful, as indicated by their reversal of the overall trend of triad configurations in their favor in the hierarchical chains of subcontracting. In other words, the preponderance of the two-buyer triads at the very top level of the hierarchy in the elite core indicates that the elite suppliers to the top OEMs are powerful enough to break the rules of subcontracting hierarchy by reversing the triad patterns that more typically place suppliers in the competitive, two-supplier triads. This pattern of elite suppliers might have arisen in the 1990s, although we need a further study on this point.
26
technologies, which only the rich and powerful can afford to get.21
In organization studies, from the framework of transaction cost economics, Williamson (1981) and Chandler (1977) argued that the visible hand of the middle managers, or their coordination skills within a large firm of multi-divisional structure, can achieve the profit maximization at the firm level, under the incomplete information or “bounded rationality” of CEOs, as the governance structure that was the engine of the American capitalism for a large part of the twentieth century until the 1970s. Triadic predominance of multiple-supplier structure in the production-chain hierarchies of industrial firms may well have contributed to profit maximization at the firm level.
In an analogous fashion, now at the level of a large-scale industrial district, where thousands of firms are engaged in the manufacturing of numerous industrial products through the complex web of the interfirm trade relationships, our present Simmelian triads network analysis offers an alternative explanation of profit maximization mechanisms, as constructed, first, by means of a large sparse network (LSN) of supplier/prime-buyer ties that serves as a production-chain market with quasi-optimal pricing. This can occur if the LSN consists of a giant component within which is a large bicomponent (with no need for k-components with k larger than two) organized as a directed acyclic graph (DAG). In other words, the number of two is good enough for a firm—in the Simmelian triad—to choose from, for both the suppliers and the prime buyers in any production-chain market. The existence of alternative series of transactional paths should generate a large bicomponent where efficient exchange will occur between the suppliers and the buyers, leading to a state of quasi-optimality of the whole network, even beyond the bicomponents.
Therefore, in the spirit of the visible hand and an empirically grounded graph theoretic approach to networks, we argue that firms, as market players, should need only two counter-parties as long as these triad relationships are embedded in a hierarchically linked, complex value-chain, owing quasi-optimal equilibrium to the practical business considerations by the nodes. The profit maximization behavior of the suppliers and prime buyers to search for better terms and conditions of trade constructs the bicomponent, and the bicomponent.
As a theoretical implication, our results suggest that complex production-chain networks should be organized by the emergence and dynamics of the cohesive structural core as the engine of the complex system where the structure and the rational social action mutually construct one another. In other words, differential structural cohesion owing to multi-connectivity appears to be a powerful factor in how network integration is distributed, acting as one of the bounds of bounded rationality in how “satisficing,” the rational practicality of social action, takes place in a network of exchange. Thus, what appear to be “scale-free” preferential attachments, as defined by Barabási (2002), came not so much from attractions to hubs in the perception of suppliers located at the bottom of the hierarchy, but mostly from the activities emanating from the central core of the network at the levels of top OEMs and their elite suppliers.
But this “top down” organizing behavior, too, has implications for profit maximization: Within the quasi-optimum pricing that can be achieved by the acyclic (DAG) bicomponent, pricing
21 The two buyers in a two-buyer triad may well be in different categories or industries in manufacturing, and the supplier may be bridging the two different industries as conduits for knowledge transfer. These are some problematic issues that we need to explore in a further study. If in the two-supplier triad, however, the two are suppliers of different components, for example, without alternative buyers, this may only increase the power of the buyer to set prices. This is because there are many more supplier firms at each lower level, many of which could step in into the manufacturing sequence to service the buyer.
27
advantages can also accrue at the top as a result of (1) prime buyers benefiting from the enormous preponderance of two-supplier triads in the production chains through the tiers of the supplier hierarchy, with 11,737 such triads within the bicomponent (seven times that of two-buyer triads) and (2) the fact that the bicomponent is acyclic, given that otherwise cyclic exchanges should converge on an optimal price equilibrium, as shown by Plott and Callander (2002).
We used the production market model proposed by Harrison White as an initial model of hierarchically organized production markets, seen from a network perspective, and compared our findings to his. Overall, our findings are largely consistent, including his view that modern production markets involve “persistent directionality in continuing flows of intermediate goods” in which “only a niche within an industry establishes you in a line of business.” We differ, however, in offering a more specific view of how “each producer firm guides itself into its niche along a market profile from watching actions of its compatriots,” and in how “that profile is sustained when it offers tradeoffs of quality versus volume that are equally attractive downstream to buyers” (p. 87). For White, the market profile is a broad array of mostly substitutable products, varying by perceptible tradeoffs between quality and price that can sustain scrutiny as a set of geographically distributed suppliers each of which has a viable tradeoff within the niche. White’s image of broader market profiles as between the producers most clearly applies to our OEMs in a near completion stage of products offered to consumers. These OEMs also fit White’s view of Knightian risk, in this case, the unpredictability of consumers who judge the signals of their quality in purchases from downstream. White’s view is that this orientation toward downstream uncertainty will ramify throughout the production hierarchy, as it certainly does for the smaller suppliers that are deeply upstream and whose main risk is losing their prime buyers.
What we find within the industrial district, however, is sustainable tradeoffs between quality and price, involving both substitutabilities and redundancies, that are differentially affected by the hierarchical directionality of the supplier network in terms of where the minimal paired alternatives occur within the production network. These differences reflect the differential cohesiveness of the structural roles—with differential power to affect pricing—of sets of firms that occupy different positions in the network hierarchy. What our results show—as explained by our networks-affect-pricing theory—is the existence of an “elite core” comprised of extremely powerful OEMs and their elite suppliers that are structurally differentiated within the network. These firms, of course, utilize advanced information and machining technologies in order to organize their suppliers in the tiers of hierarchy. But also, as elite suppliers in the division of labor, even if few in number, their structural advantages in triad ratios and assortative correlations give these downstream (including OEM) producers more power to determine their own pricing recursively in negotiations with firms less empowered structurally (i.e., those firms lower in the hierarchy and operating through bi-connected ties with a 4:1 preponderance of multiple-supplier to multiple-buyer triads, a constructed situation that serves to enforce competition among themselves rather than among the buyers).
The status ordering among the competitors in their specialized areas of manufacturing technologies, which White sees as affecting supplier-chain pricing, is one in which differential cohesion affects the power to influence prices within the general but also somewhat loose constraints of quasi-optimal pricing. Mimicking actions in the competition directed toward the downstream buyers or consumers, then, as described by White, are not the whole story. The core firms are likely to be Janus-faced in that they do not just watch for pricing signals within the linked market-profiles of their networks but actively seek to optimally adjust the organization of
28
their upstream suppliers (largely organized by their elite suppliers such as Tier-1 into the type of tree-like hierarchies we see in Figure 2) to provide competitive production volume and price in their favor, building on the unequally-skewed organization of the enmeshed ties that weave through the value-chain. That is, they are able, by observing and influencing the hierarchical organization of ties, to directly affect the series of divisions of labor to bring the low-cost advantages of multiple-suppliers to themselves from the upstream supplier. Thus, differences in the form taken by network cohesiveness of different sets of firms affect differences in the number of practical alternatives that in turn affect pricing.
Thus, our supplier/prime-buyer production market structure is more complex than envisioned by White, wherein a relatively small number of elite suppliers downstream serve their extremely powerful OEMs so as to organize thousands of SME suppliers in the upstream, through the linked hierarchical layers of the processing activities, parts and components production, and assembling on the foundations of power-law node links in a LSN. Further, in doing so, they skew the triad ratios that affect pricing in favor of the elite hubs. In other words, the extremely powerful OEMs and their powerful suppliers may be able to control the product quality and procurement costs through the entire value-chain, to some extent, even under their cognitive constraints of bounded rationality to monitor especially the numerous micro SMEs in the upstream, relying upon the organizing roles of the “intermediating” local hubs as their suppliers.
While network biconnectivity insures competitive quasi-optimal pricing, there is no conspicuous “market profile” further upstream in the production-chain networks by means of which the smaller suppliers can benefit from more global markets and signals directed to these markets. Most of these SMEs possess only locally endorsed technological reputation and, given their limited financial and human capital, they lack globally accredited, reputable brand equity, marketing capacity and skills, and direct interface with the end consumers. Therefore, our analysis indicates that the status classification consists of a pack of numerous SME suppliers without much global reputation, as located in the lower linked stages of the manufacturing processes in the upstream, and the highly reputable OEMs and their elite suppliers, as “gate-keepers” and access points for the upstream SMEs to receive a share of the downstream consumer revenues, which are capable of skewing the prices paid to their suppliers to levels that are probably below the theoretical supply/demand equilibrium.
Thus, while White perceives the producers’ signaling behavior all the way up the hierarchy to be the prime driver of the market mechanisms under the Knightian uncertainty, what we observe is a larger role for the “elite” members, composed of the extremely powerful, reputable OEMs and their elite suppliers, as a driver of differential network integration mechanisms that are the engines of the complex network. They are able to skew the network bridging between themselves and their consumers in the downstream, and the pack of SMEs in the upstream. In other words, White’s model takes the status ordering, as contained initially among the producers, as involving them in watching one another’s moves in an oligopolistic market, and then views their products as signaling quality information to the buyers downstream. In contrast, while our analysis suggests a comparable role of end consumers as the origin of the status ordering around the “elite core,” we do not so much disagree as to show the role of differential network multiconnectivities in effecting a segmented market between the “power elite” and the remaining numerous suppliers. We emphasize that the consumers are the ultimate source of revenues for all the embedded players, but via a cohesive core of powerful OEMs and elite suppliers as “gate keepers” that add their brand equity to the products and services provided by the numerous SME suppliers in the upstream, but that also benefit in pricing from skewed network triad-ratios.
29
It will prove important in the future to see whether the present findings are consistent across time, space, and content of different supplier networks in industrial districts. We have tried to foresee the conditions under which the same structural properties should exist in large-scale industrial districts of other manufacturing industries, although the present research study is only one case of a complex web of regional supplier networks in a large-scale cluster in the cultural context and institutional settings of the Japanese network economy in the mid 1990s. The regional economy as well as the macro economy was under the prolonged deflationary pressure, one dragged, after the peak of its “bubble,” into the spiral of severe recessions in the early 1990s, unprecedented scale in the history of the economy, which lasted for the time span of fifteen years. Yet, some of the principles we articulated here may well carry over to other industrial districts, and affect their dynamics.
To summarize, while our analysis articulated the subcontracting hierarchies of the network as an LSN as achieving an efficient and robust exchange in the supplier/prime-buyer production market for a generalized quasi-optimal market equilibrium by virtue of biconnectivity in exchange channels in the subcontracting hierarchies, we also identified how the role structure within the entangled ties of the complex value-chains in the large-scale regional subcontracting network served to segment the production-chain market in ways that favor the core firms. The role-equivalent firms divide into the upstream dedicated suppliers specialized in various processing activities, manufacturers of parts, components, and modules, the elite suppliers far downstream as organizing hubs, and the powerful, reputable OEMs as assembling hubs that provide the rest of the firms with access all the way downstream to the consumers at large. We detected not only status differences between the “elite” core and the remaining suppliers, in the complex and divided production-chain market, but differential power over pricing as a function of how their network roles are constructed. References Arrow, Kenneth J., and Gerald Debreu. 1954. "Existence of an Equilibrium for a Competitive
Economy." Econometrica 22:265-290. Arthur, Brian. 1994. Increasing Returns and Path Dependence in the Economy. Ann Arbor, MI:
University of Michigan Press. Asanuma, Banri. 1989. "Manufacturer-Supplier Relationships in Japan and the Concept of
Relationship-Specific Skills." Journal of the Japanese and International Economies 3:1-30.
Baker, Wayne E., and Robert R. Faulkner. 1991. "Role as Resource in the Hollywood Film Industry." American Journal of Sociology 97:279-309.
Barabási, Albert-László. 2002. Linked: How Everything Is Connected to Everything Else and What It Means for Business, Science, and Everyday Life. London: Plume.
Batagelj, Vladimir, and Andrej Mrvar. 2005. "PAJEK: Program for Large Network Analysis." Bearman, Peter S. 1997. "Generalized Exchange." American Journal of Sociology 102:1383-415. Beunza, Daniel, and David Stark. 2004. "Tools of the trade: The socio-technology of arbitrage in
a Wall Street trading room." Industrial and Corporate Change 13:369-400. Burt, Ronald S. 1976. "Positions in Networks." Social Forces 55:93-122. —. 1987. "Social Contagion and Innovation: Cohesion Versus Structural Equivalence."
American Journal of Sociology 92:1287-335.
30
Burt, Ronald S., and Marc Knez. 1995. "Kinds of Third-Party Effects on Trust." Rationality and Society 7:255-92.
Callon, Michel (Ed.). 1998. The Laws of the Markets. Oxford: Blackwell. Camerer, Colin, George Loewenstein, and Matthew Rabin. 2004. Advances in Behavioral
Economics. New York: Princeton University Press. Chandler, Jr., Alfred D. 1977. The Visible Hand: The Managerial Revolution in American
Business. Cambridge, MA: Belknap, Harvard University Press. Cournot, A. A., and Irving Fisher. 1927. Researches into the Mathematical Principles of the
Theory of Wealth, 1838. New York: Macmillan. David, Paul. 1987. "Some New Standards for the Economics of Standardization in the
Information Age." Pp. 206-40 in Economic Policy and Technological Performance, edited by Partha Dasgupta and Paul Stoneman. Cambridge: Cambridge University Press.
Davis, Gerald F. 1991. "Agents Without Principles?: The Spread of the Poison Pill Through the Intercorporate Network." Administrative Science Quarterly 36:583-613.
Davis, Gerald, Mina Yoo, and Wayne Baker. 2003. "The Small World of the American Corporate Elite, 1982-2001." Strategic Organization 1:301-326.
Degenne, Alain, and Michel Forsé. 1999. Introducing Social Networks. Thousand Oaks: CA: Sage Publications.
DiMaggio, Paul J. 1991. "Constructing an Organizational Field as a Professional Project: U.S. Art Museums, 1920-1940." Pp. 267-92 in The New Institutionalism in Organizational Analysis, edited by Walter W. Powell and Paul J. DiMaggio. Chicago, IL: University of Chicago Press.
DiMaggio, Paul, and Walter W. Powell. 1983. "Iron Cage Revisited: Institutional Isomorphism and Collective Rationality." American Sociological Review 48:147-160.
Dobbin, Frank (Ed.). 2004. The Sociology of the Economy. New York: Russell Sage Foundation. Eccles, Robert, and Dwight Crane. 1988. Doing Deals: Investment Bank at Work. Cambridge,
MA: Harvard Business School Press. Eccles, Robert G. 1981. "The Quasifirm in the Construction Industry." Journal of Economic
Behavior and Organization 2:335-57. Fama, Eugene F. 1980. "Agency Problems and the Theory of the Firm." Journal of Political
Economy 88:288-307. Fligstein, Neil. 2001. The Architecture of Markets: An Economic Sociology of Twenty-First-
Century Capitalist Societies. Princeton, N.J.: Princeton University Press. Freeman, Linton C. 1977. "A Set of Measures of Centrality Based on Betweenness." Sociometry
40:35-41. —. 1979. "Centrality in Social Networks: Conceptual Clarification." Social Networks 1:215-239. —. 2004. The Development of Social Network Analysis. Vancouver: Empirical Press. Geertz, Clifford. 1992. "The Bazaar Economy: Information and Search in Peasant Marketing."
Pp. 225-32 in The Sociology of Economic Life, edited by Mark Granovetter and Richard Swedberg. New York: Westview Press.
Goldstein, Michel L., Steven A. Morris, and Gary G. Yen. 2004. "Problems with Fitting to the Power-Law Distribution." The European Physical Journal B - Condensed Matter 41:255-258.
Goodman, Edward, and Julia Bamford (Eds.). 1989. Small Firms and Industrial Districts in Italy. London: Routledge.
31
Granovetter, Mark S. 1985. "Economic Action and Social Structure: The Problem of Embeddedness." American Journal of Sociology 91:481-510.
—. 1992. "Problems of Explanation in Economic Sociology." Pp. 25-56 in Networks and Organizations: Structure, Form, and Action, edited by Nitin Nohria and Robert G. Eccles. Boston, MA: Harvard Business School Press.
Granovetter, Mark S., and Richard Swedberg (Eds.). 2001. The Sociology of Economic Life. Boulder, Colo.: Westview Press.
Guillén, Mauro F. 2002. The New Economic Sociology: Developments in an Emerging Field. New York: Russell Sage.
Gulati, Ranjay. 1995. "Social Structure and Alliance Formation Patterns: A Longitudinal Analysis." Administrative Science Quarterly 40:619-52.
Hage, Per, and Frank Harary. 1996. Island Networks: Communication, Kinship, and Classification Structures in Oceania. Cambridge: Cambridge University Press.
Hanneman, Robert A. 2001. "Introduction to Social Network Methods." Pp. 1-151. Riverside, CA: Department of Sociology, University of California-Riverside.
Harary, Frank. 1969. Graph Theory. New York: Addison-Wesley. Hirsch, Paul M. 1972. "Processing Fads and Fashions: An Organization-set Analysis of Cultural
Industry Systems." American Journal of Sociology 77:639-59. Hollingsworth, J. Rogers, and Robert Boyer (Eds.). 1997. Contemporary Capitalism: The
Embeddedness of Institutions. New York, NY: Cambridge University Press. Jensen, Michael. 2003. "The Role of Network Resources in Market Entry: Commercial Bank's
Entry into Investment Banking 1991-1997." Administrative Science Quarterly 48:466-497.
Klemperer, Paul. 2004. Auctions: Theory and Practice. Princeton, N.J.: Princeton University Press.
Knight, Frank. 1921. Risk, Uncertainty, and Profit. Chicago, IL: University of Chicago Press. Knorr-Cetina, K., and Alex Preda (Eds.). 2005. The Sociology of Financial Markets. Oxford:
Oxford University Press. Knorr Cetina, Karin. 2004. "Capturing Markets? A Review Essay on Harrison White on
Producer Markets." Socio-Economic Review 2:137-148. Lane, David A. 2002. "Complexity and Local Interactions: Toward a Theory of Industrial
Districts." Pp. 65-82 in Complexity and Industrial Clusters: Dynamics and Models in Theory and Practice, edited by Quadrio A. Curzio and Marco Fortis. Heidelberg; New York: Physica-Verlag.
Lazerson, Mark. 1995. "A New Phoenix?: Modern Putting-out in the Modena Knitwear Industry." Administrative Science Quarterly 40:34-59.
Leifer, Eric M, and Harrison C. White. 1987. "A Structural Approach to Markets." Pp. 85-108 in Intercorporate Relations: The Structural Analysis of Business, edited by Mark S. Mizruchi and Michael Schwartz. Cambridge: Cambridge University Press.
Lie, John. 1997. "Sociology of Markets." Annual Review of Sociology 23:341-360. Locke, John. 1995. Remaking the Italian Economy. Ithaca: Cornell University Press. Macaulay, Stuart. 1963. "Non-Contractual Relations in Business: A Preliminary Study."
American Sociological Review 28:53-67. March, James G., and Herbert A. Simon. 1958. Organizations. New York: Wiley. Meyer, John W., and Brian Rowan. 1977. "Institutionalized Organizations: Formal Structure as
Myth and Ceremony." American Journal of Sociology: 340-63.
32
Moody, James, and Douglas R. White. 2003. "Structural Cohesion and Embeddedness: A Hierarchical Concept of Social Groups." American Sociological Review 68:103-127.
Nakano, Tsutomu, and Douglas R. White. 2006a. "The Large-Scale Network of a Tokyo Industrial District: Small-World, Scale-Free, or Depth Hierarchy?" Pp. 1-48.
—. 2006b. "Power-Law and 'Elite Club' in a Complex Supplier-Buyer Network: Flexible Specialization or Dual Economy?" Working Paper, Center on Organizational Innovation, Institute for Social and Economic Research and Policy (ISERP), Columbia University, New York. Pp. 1-45.
Nee, Victor, and Richard Swedberg (Eds.). 2005. The economic sociology of capitalism. Princeton, N.J.: Princeton University Press.
Newman, Mark E.J. 2002. "Assortative Mixing in Networks." Phys. Rev. Lett. 89:1-5. Nishiguchi, Toshihiro. 1994. Strategic Industrial Sourcing: The Japanese Advantage. Oxford:
Oxford University Press. Ohta-ku Sangyo Shinko Kyokai. 1997a. Ohta-ku Kigyo Akusesu Deta 1 (Access Data to Firms in
Ohta-ward). Tokyo: Tokyo-to Ohta-ku Sangyo Keizai-bu (Plaza Industry Ohta, Tokyo Metropolitan Authority).
—. 1997b. Ohta-ku Kigyo Akusesu Deta 2 (Access Data to Firms in Ohta-ward). Tokyo: Tokyo-to Ohta-ku Sangyo Keizai-bu (Plaza Industry Ohta, Tokyo Metropolitan Authority).
Padgett, John F., and Christopher K. Ansell. 1993. "Robust Action and the Rise of the Medici, 1400-1434." American Journal of Sociology 98:1259-1319.
Piore, Michael J., and Charles Sabel. 1984. The Second Industrial Divide: Possibilities for Prosperity. New York: Basic Books.
Plott, Charles. R., and Steven Callander. 2002. "Networks: An Experimental Study." in Social Science Working Paper 1156. Pasadena, CA: California Institute of Technology.
Podolny, Joel. 1994. "Market Uncertainty and the Social Character of Economic Exchange." Administrative Science Quarterly 39:458-483.
Podolny, Joel M. 1993. "A Status-based Model of Market Competition." American Journal of Sociology 98:829-72.
—. 2001. "Networks as the Pipes and Prisms of the Market." American Journal of Sociology 107:33-60.
—. 2005. Status Signals: A Sociological Study of Market Competition. Princeton, N.J.: Princeton University Press.
Powell, Walter W. 1985. Getting into Print: The Decision Making Process in Scholarly Publishing. Chicago, IL: University of Chicago Press.
Powell, Walter W., and Laurel Smith-Doerr. 2005. "Networks and Economic Life." Pp. ix, 736 in The Handbook of Economic Sociology, edited by Niel. J. Smelser and Richard Swedberg. New York: Princeton University Press.
Powell, Walter W., Douglas R. White, Kenneth W. Koput, and Jason Owen-Smith. 2005. "Network Dynamics and Field Evolution: The Growth of Interorganizational Collaboration in the Life Sciences." American Journal of Sociology 110:1132-1207.
Pyke, Frank, Giacomo Becattini, and Werner Sengenberger (Eds.). 1990. Industrial Districts and Inter-firm Co-operation in Italy. Geneva: Switzerland: International Institute for Labour Studies, Geneva.
Rauch, James E., and Alessandra Casellat (Eds.). 2001. Networks and Markets. New York: Russell Sage.
33
Robins, Garry, Philippa Pattison, and Jodie Woolcock. 2005. "Small and Other Worlds: Global Network Structures from Local Processes." American Journal of Sociology 110:894-936.
Sabel, Charles F., and Jonathan Zeitlin. 1997. "Stories, Strategies, Structures: Rethinking Historical Alternative to Mass Production." Pp. 1-36 in World of Possibilities: Flexibility and Mass Production in Western Industrialization, edited by Charles F. Sabel and Jonathan Zeitlin. Cambridge: Cambridge University Press.
Saxenian, AnnaLee. 1994. Regional Advantage: Culture and Competition in Silicon Valley and Route 128. Cambridge, MA: Harvard University Press.
Scott, John. 2000. Social Network Analysis: A Handbook. Thousand Oaks: SAGE Publications. Seki, Mitsuhiro, and Hideo Kato. 1990. Gendai Nihon no Chusho Kikai Kogyo: Nashonaru
Tekuno-porisu no Keisei (Small- and Medium-sized Machine Tools Industry in Contemporary Japan: Formation of National Technopolis). Tokyo: Shinhyoron.
Smelser, Neil J., and Richard Swedberg (Eds.). 2005. The Handbook of Economic Sociology. Princeton, N.J.: Princeton University Press.
Smith, Adam. 1776. An Inquiry into the Nature and Causes of the Wealth of Nations. London: Printed for W. Strahan; and T. Cadell.
Stiglitz, Joseph E., and Bruce C. N. Greenwald. 2003. Towards a New Paradigm in Monetary Economics. Cambridge, U.K.; New York: Cambridge University Press.
Stinchcombe, Arthur L. 1959. "Bureaucratic and Craft Administration of Production: A Comparative Study." Administrative Science Quarterly 4:168-187.
Swedberg, Richard. 2002. Principles of Economic Sociology. Princeton, N.J. Woodstock: Princeton University Press.
Uzzi, Brian. 1999. "Embeddedness in the Making of Financial Capital: How Social Relations and Networks Benefit Firms Seeking Financing." American Sociological Review 64:481-505.
Uzzi, Brian, and Ryon Lancaster. 2004. "Embeddedness and Price Formation in the Corporate Law Market." American Sociological Review 69:319-344.
Uzzi, Brian, and Jarret Spiro. 2005. "Collaboration and Creativity: The Small World Problem." American Journal of Sociology 111:447-504.
Wasserman, Stanley, and Katherine Faust. 1994. Social Network Analysis: Methods and Applications. Cambridge: Cambridge University Press.
White, Douglas R. 2004. "Ring Cohesion Theory in Marriage and Social Networks." Mathématiques et Sciences Humaines 168:5-28.
White, Douglas R., and Frank Harary. 2001. "The Cohesiveness of Blocks in Social Networks: Node Connectivity and Conditional Density." Sociological Methodology 31:305-59.
White, Douglas R., and Ulla C. Johansen. 2005. Network Analysis and Ethnographic Problems: Process Models of a Turkish Nomad Clan. Lanham, Md.: Lexington Books.
White, Douglas R., Jason Owen-Smith, James Moody, and Walter Powell. 2005. "Networks, Fields and Organizations: Micro-Dynamics, Scale and Cohesive Embeddings." Computational and Mathematical Organization Theory 10:95-117.
White, Harrison C. 1981. "Where Do Markets Come From?" American Journal of Sociology 87:517-47.
—. 2002a. "Appendix 2: Markets from Networks - precis of the book." in Markets from Networks: Socioeconomic Models of Production. Princeton, NJ: Princeton University Press.
34

—. 2002b. Markets from Networks: Socioeconomic Models of Production. Princeton, NJ: Princeton University Press.
—. 2003. "Businesses Mobilize Production through Markets: Parametric Modeling of Path-Dependent Outcomes in Oriented Network Flows." Complexity 8:87-95.
White, Harrison C., Scott A. Boorman, and Ronald L. Breiger. 1973. "Social Structure from Multiple Networks: I. Blockmodels of Roles and Positions." American Journal of Sociology 81:730-80.
Whittaker, D. Hugh. 1997. Small Firms in the Japanese Economy. Cambridge: Cambridge University Press.
Williamson, Oliver E. 1981. "The Economics of Organization: The Transaction Cost Approach." American Journal of Sociology 87:548-77.
—. 1985. The Economic Institutions of Capitalism: Firms, Markets, Relational Contracting. New York: Free Press.
Winship, Christopher, and Michael Mandel. 1983. "Roles and Positions: A Critique and Extension of the Blockmodeling Approach." Pp. 314-45 in Sociological Methodology, 1983-1984, edited by Samuel Leinhardt. San Francisco: Jossey-Bass.
Zajac, Edward J., and James D. Westphal. 2004. "The Social Construction of Market Value: Institutionalization and Learning Perspectives on Stock Market Reactions." American Sociological Review 69:433-457.
Zelizer, Viviana A. 1978. "Human Values and the Market: The Case of Life Insurance and Death in 19th-Century America." American Journal of Sociology 84:591-610.
—. 1994. The Social Meaning of Money. New York: Basic Books. Zuckerman, Ezra W. 2004. "Structural Incoherence and Stock Market Activity." American
Sociological Review 69:405-432.
35
Related Documents