THE UX OF DATA jQuery Conference 2015 in Berlin Responsive Datenvisualisierung mit jQuery @webinterface

Welcome message from author
This document is posted to help you gain knowledge. Please leave a comment to let me know what you think about it! Share it to your friends and learn new things together.
Transcript

THE UX OF DATA
jQuery Conference 2015 in Berlin
Responsive Datenvisualisierung mit jQuery
@webinterface

Peter Rozek
Work at ecx.io (Digital Agency)
Skills: UX
Usability Accessibility
Frontend
@webinterface
@webinterface
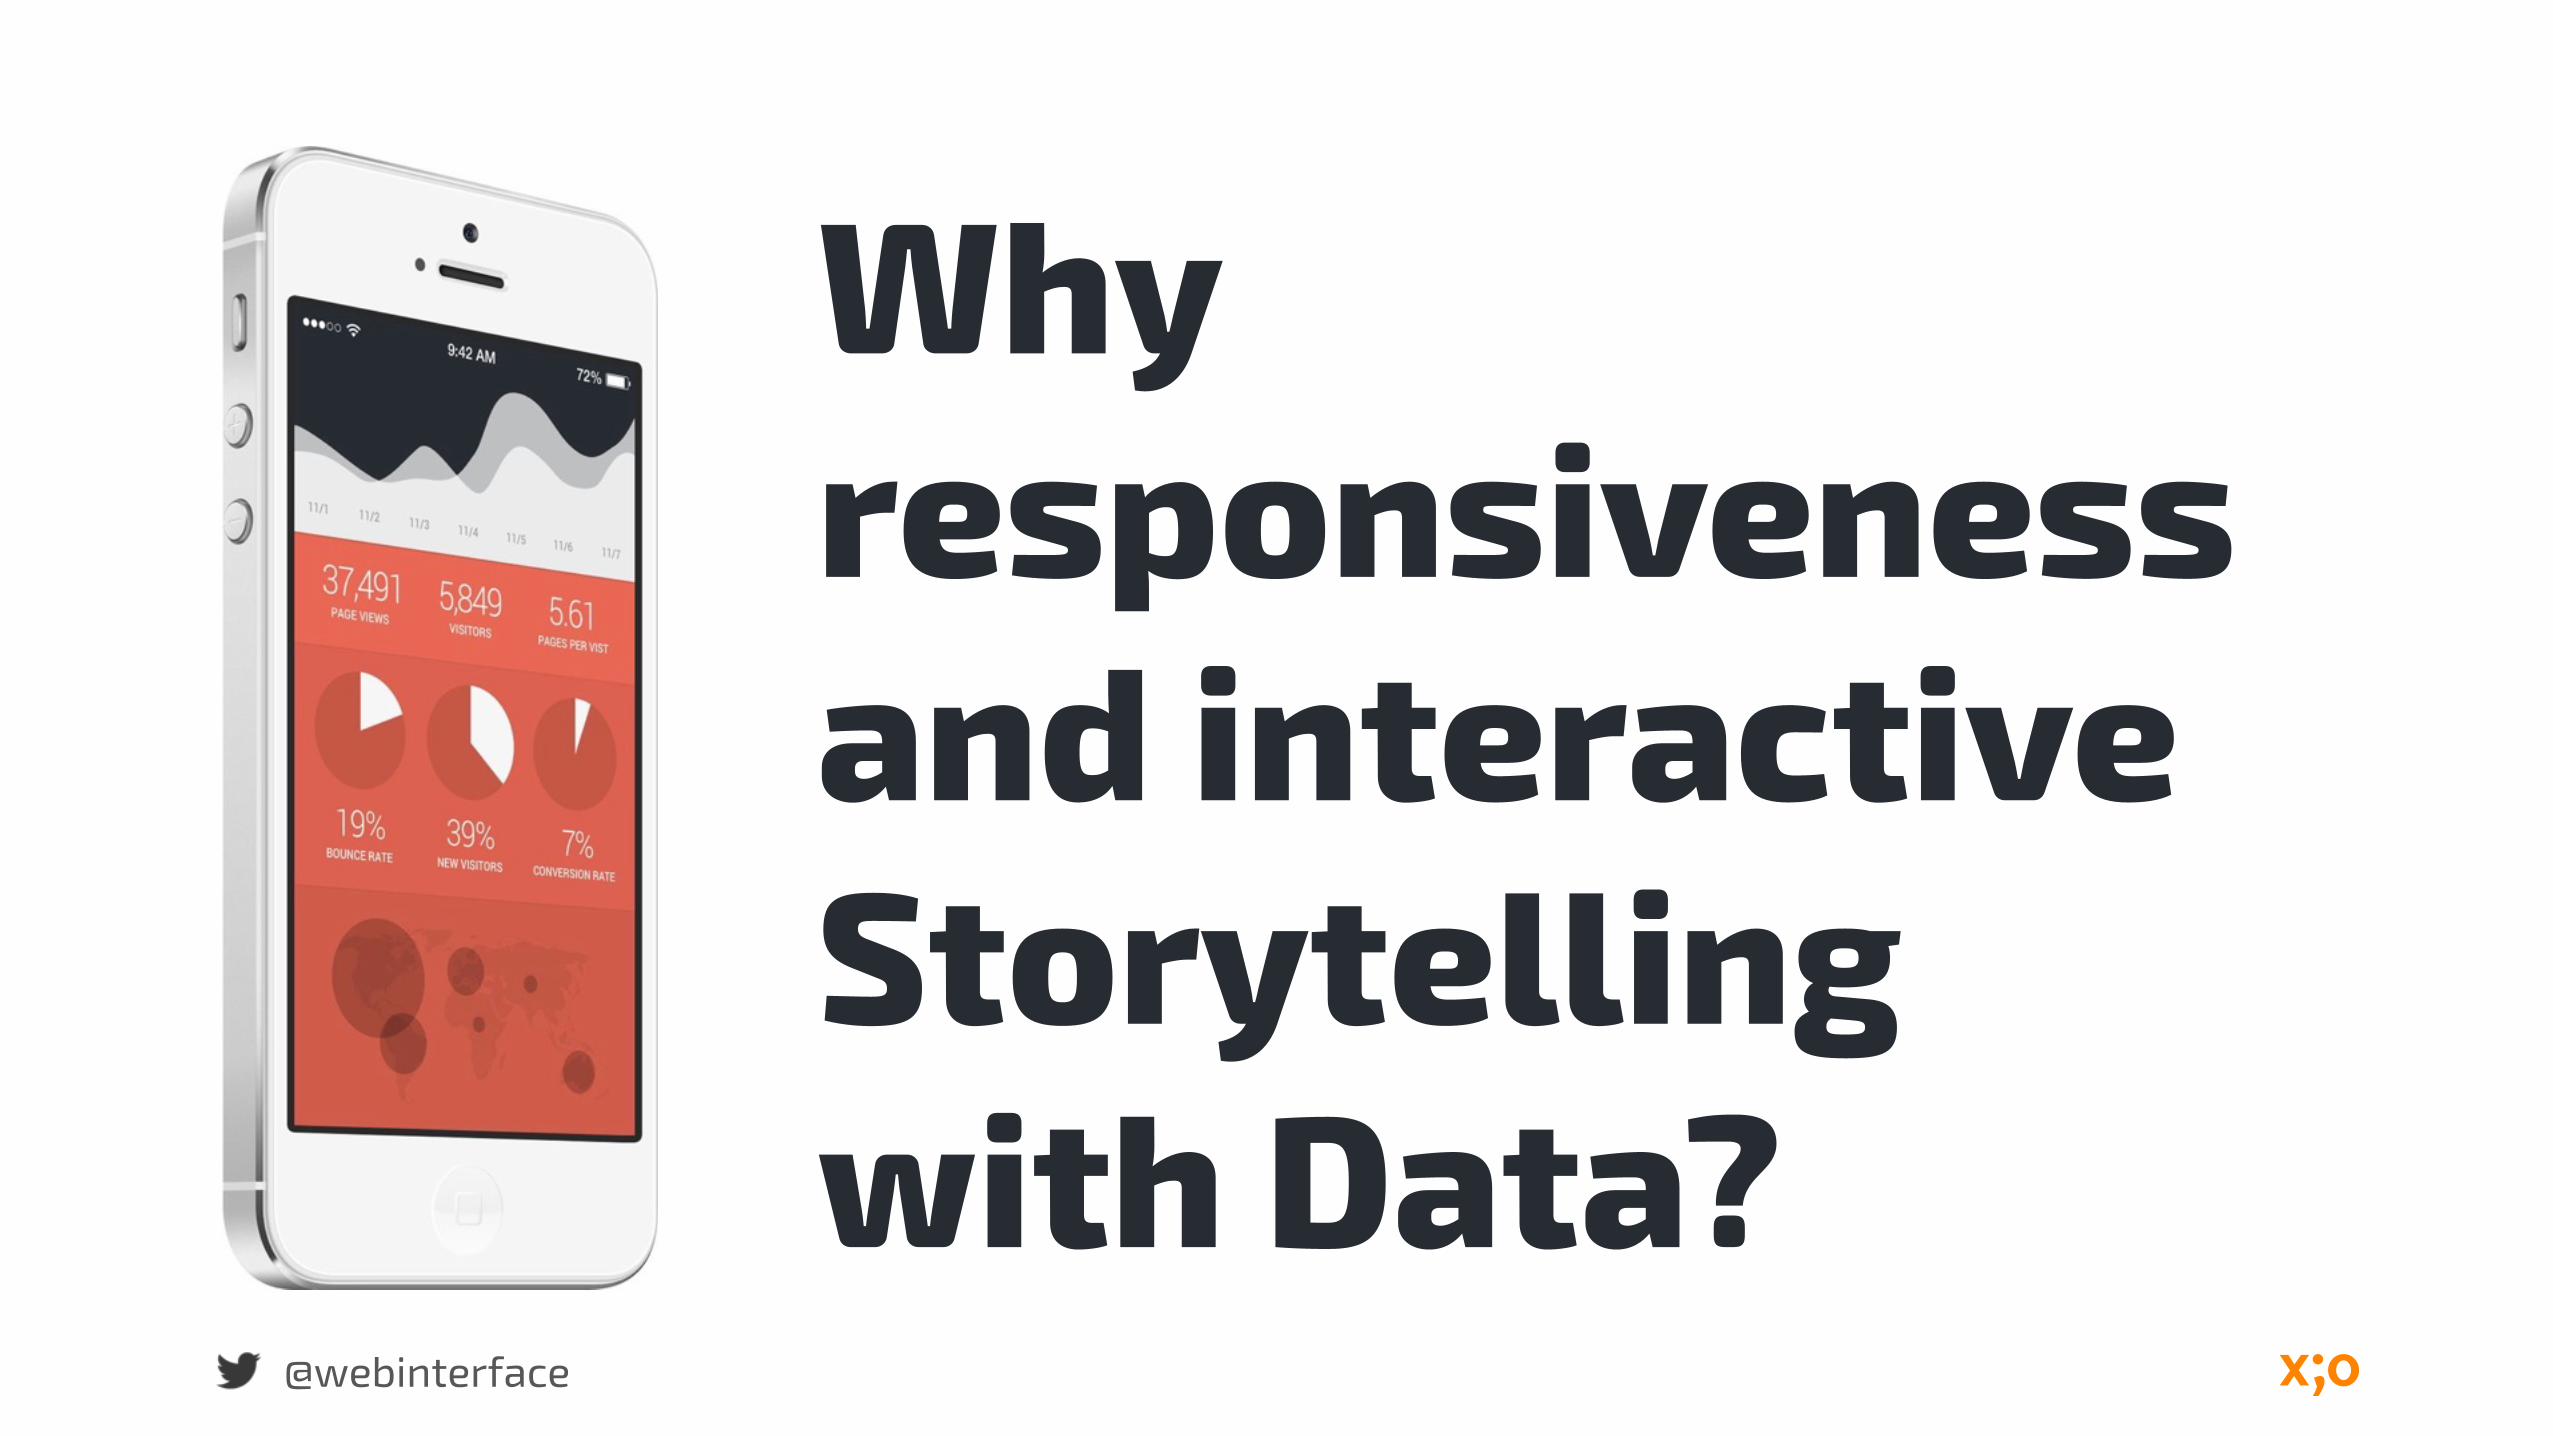
Why responsivenessand interactiveStorytelling with Data?
@webinterface
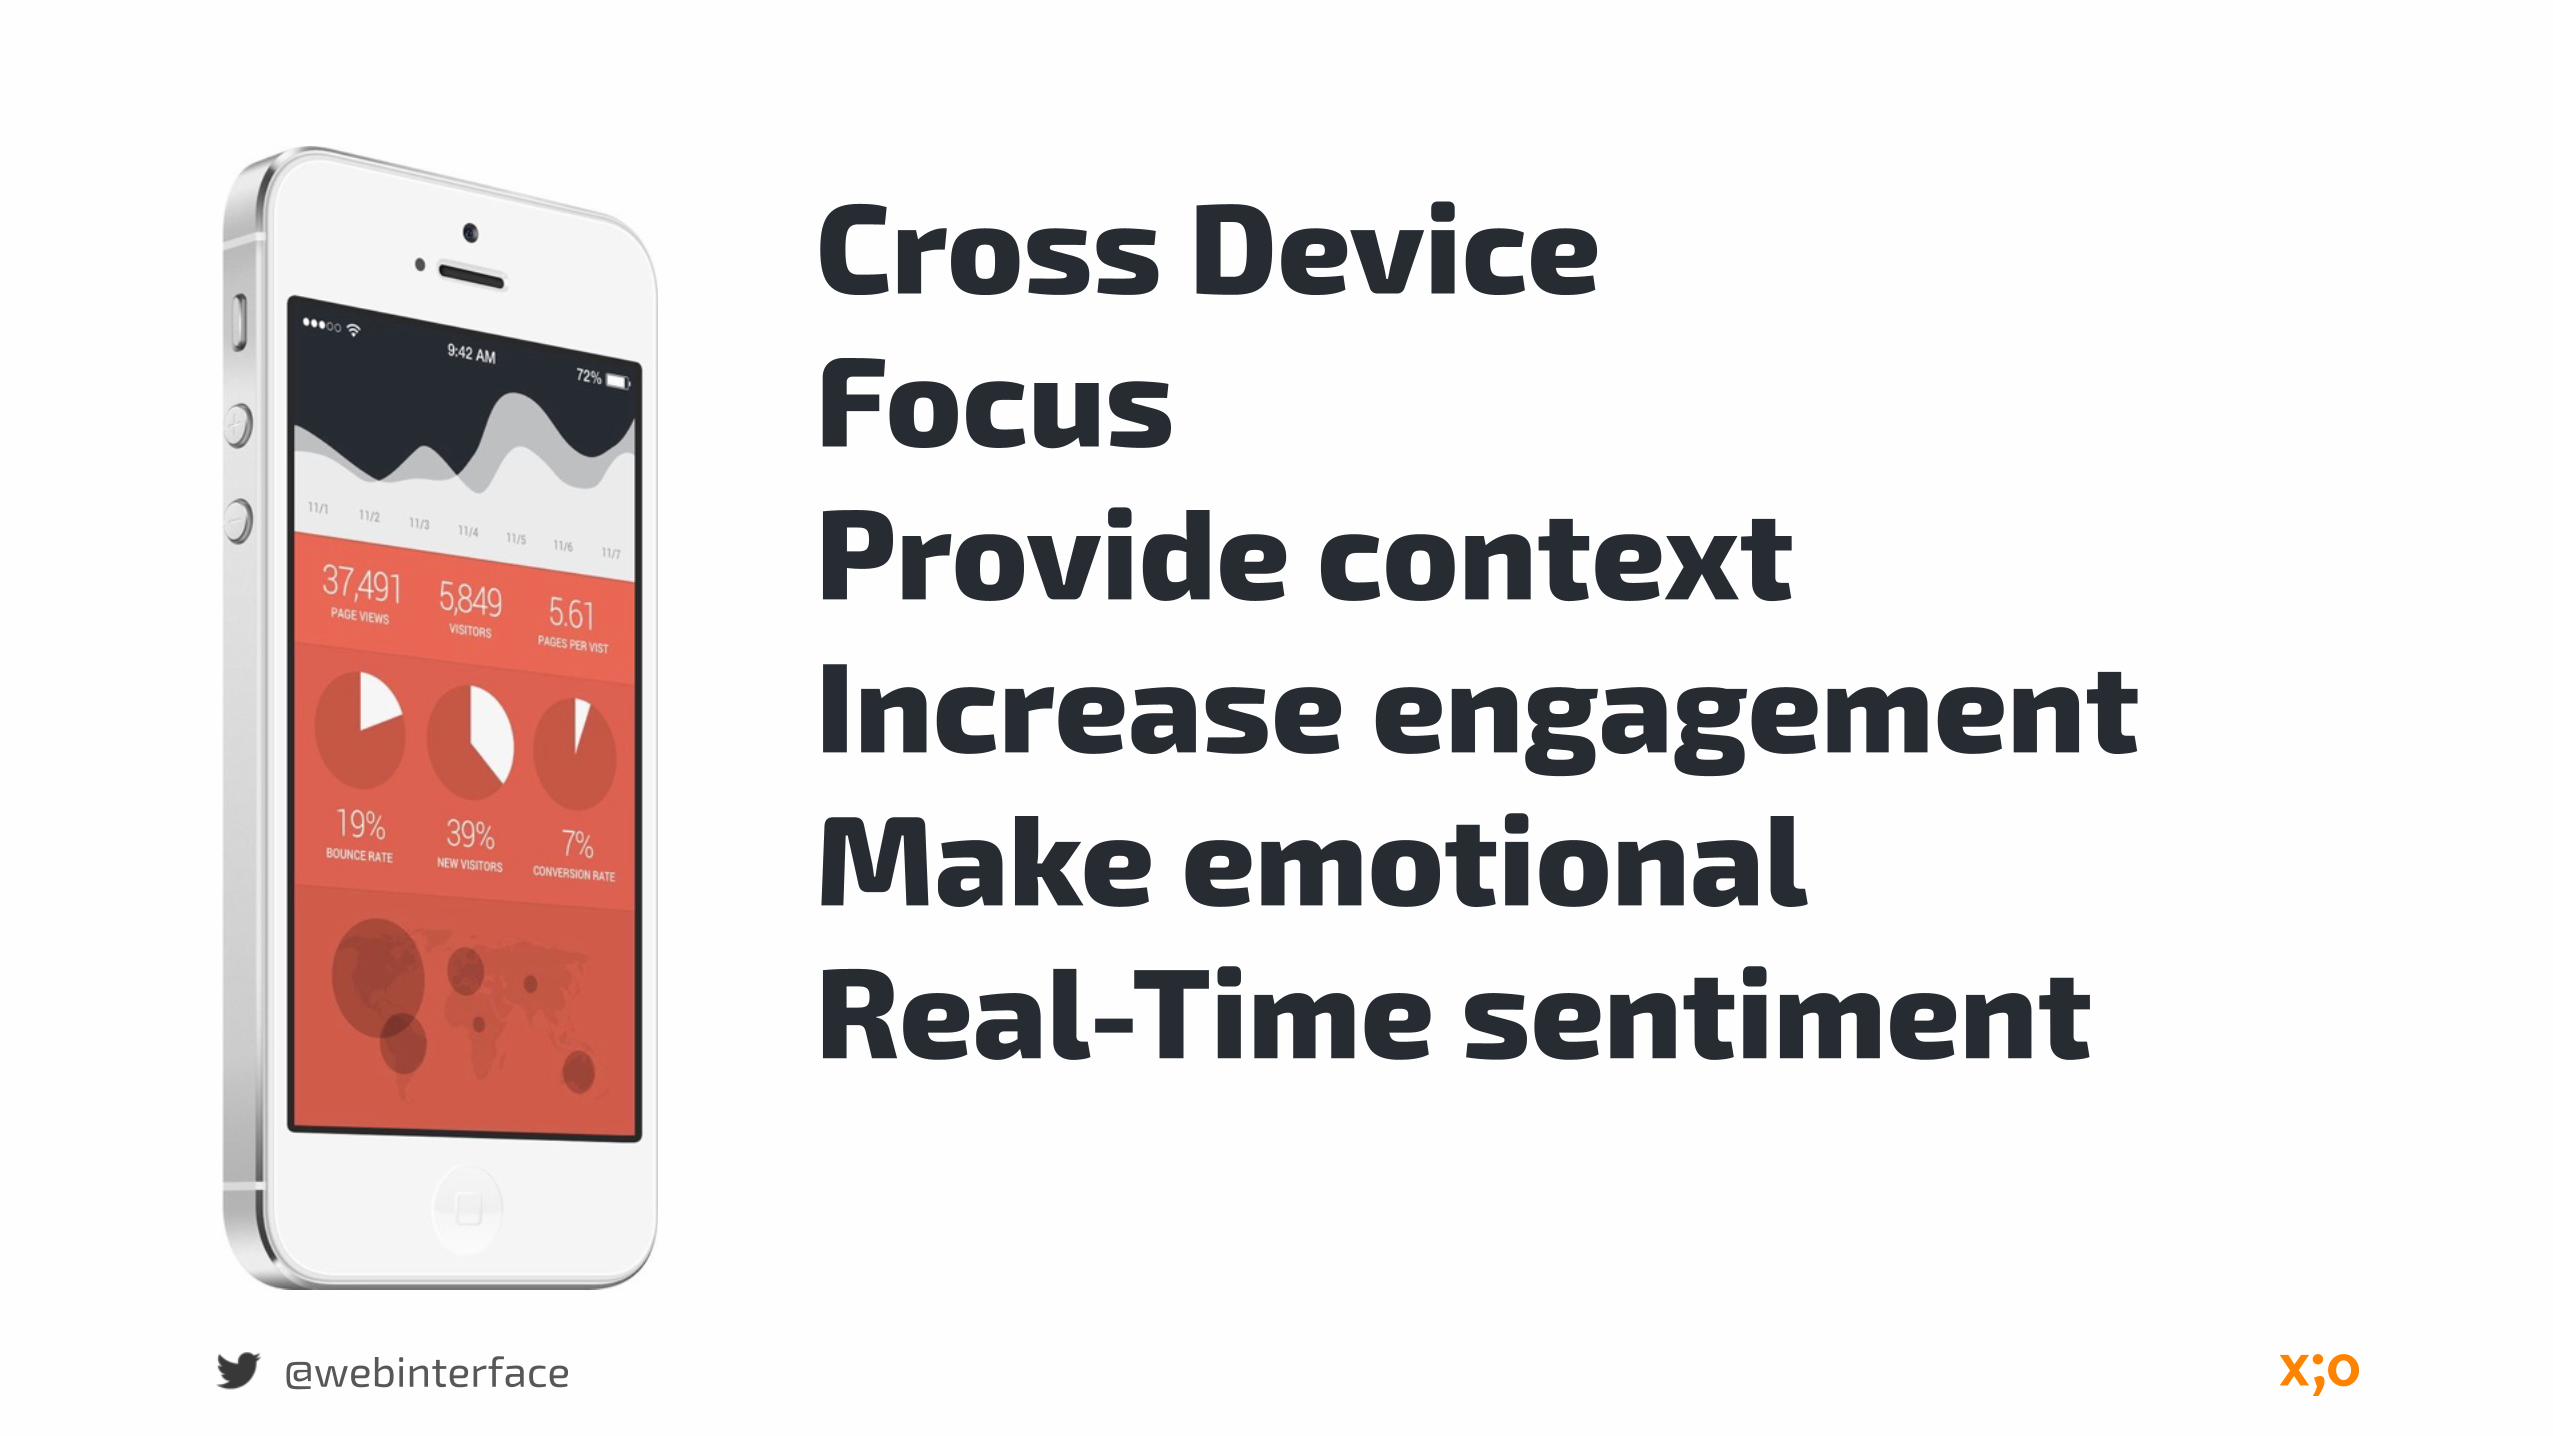
Cross Device Focus Provide contextIncrease engagement Make emotional Real-Time sentiment
„Above all else, show the data.”
@webinterface
Edward Tufte
Source: The Visual Display of Quantitative Information
„More Than 50 Percent of Users Will Use a Tablet or Smartphone First for All Online Activities“
@webinterface
Gartner
Source: http://www.gartner.com/newsroom/id/2939217
@webinterface
The human is brain especially at recognizing shapes and patterns.
@webinterface
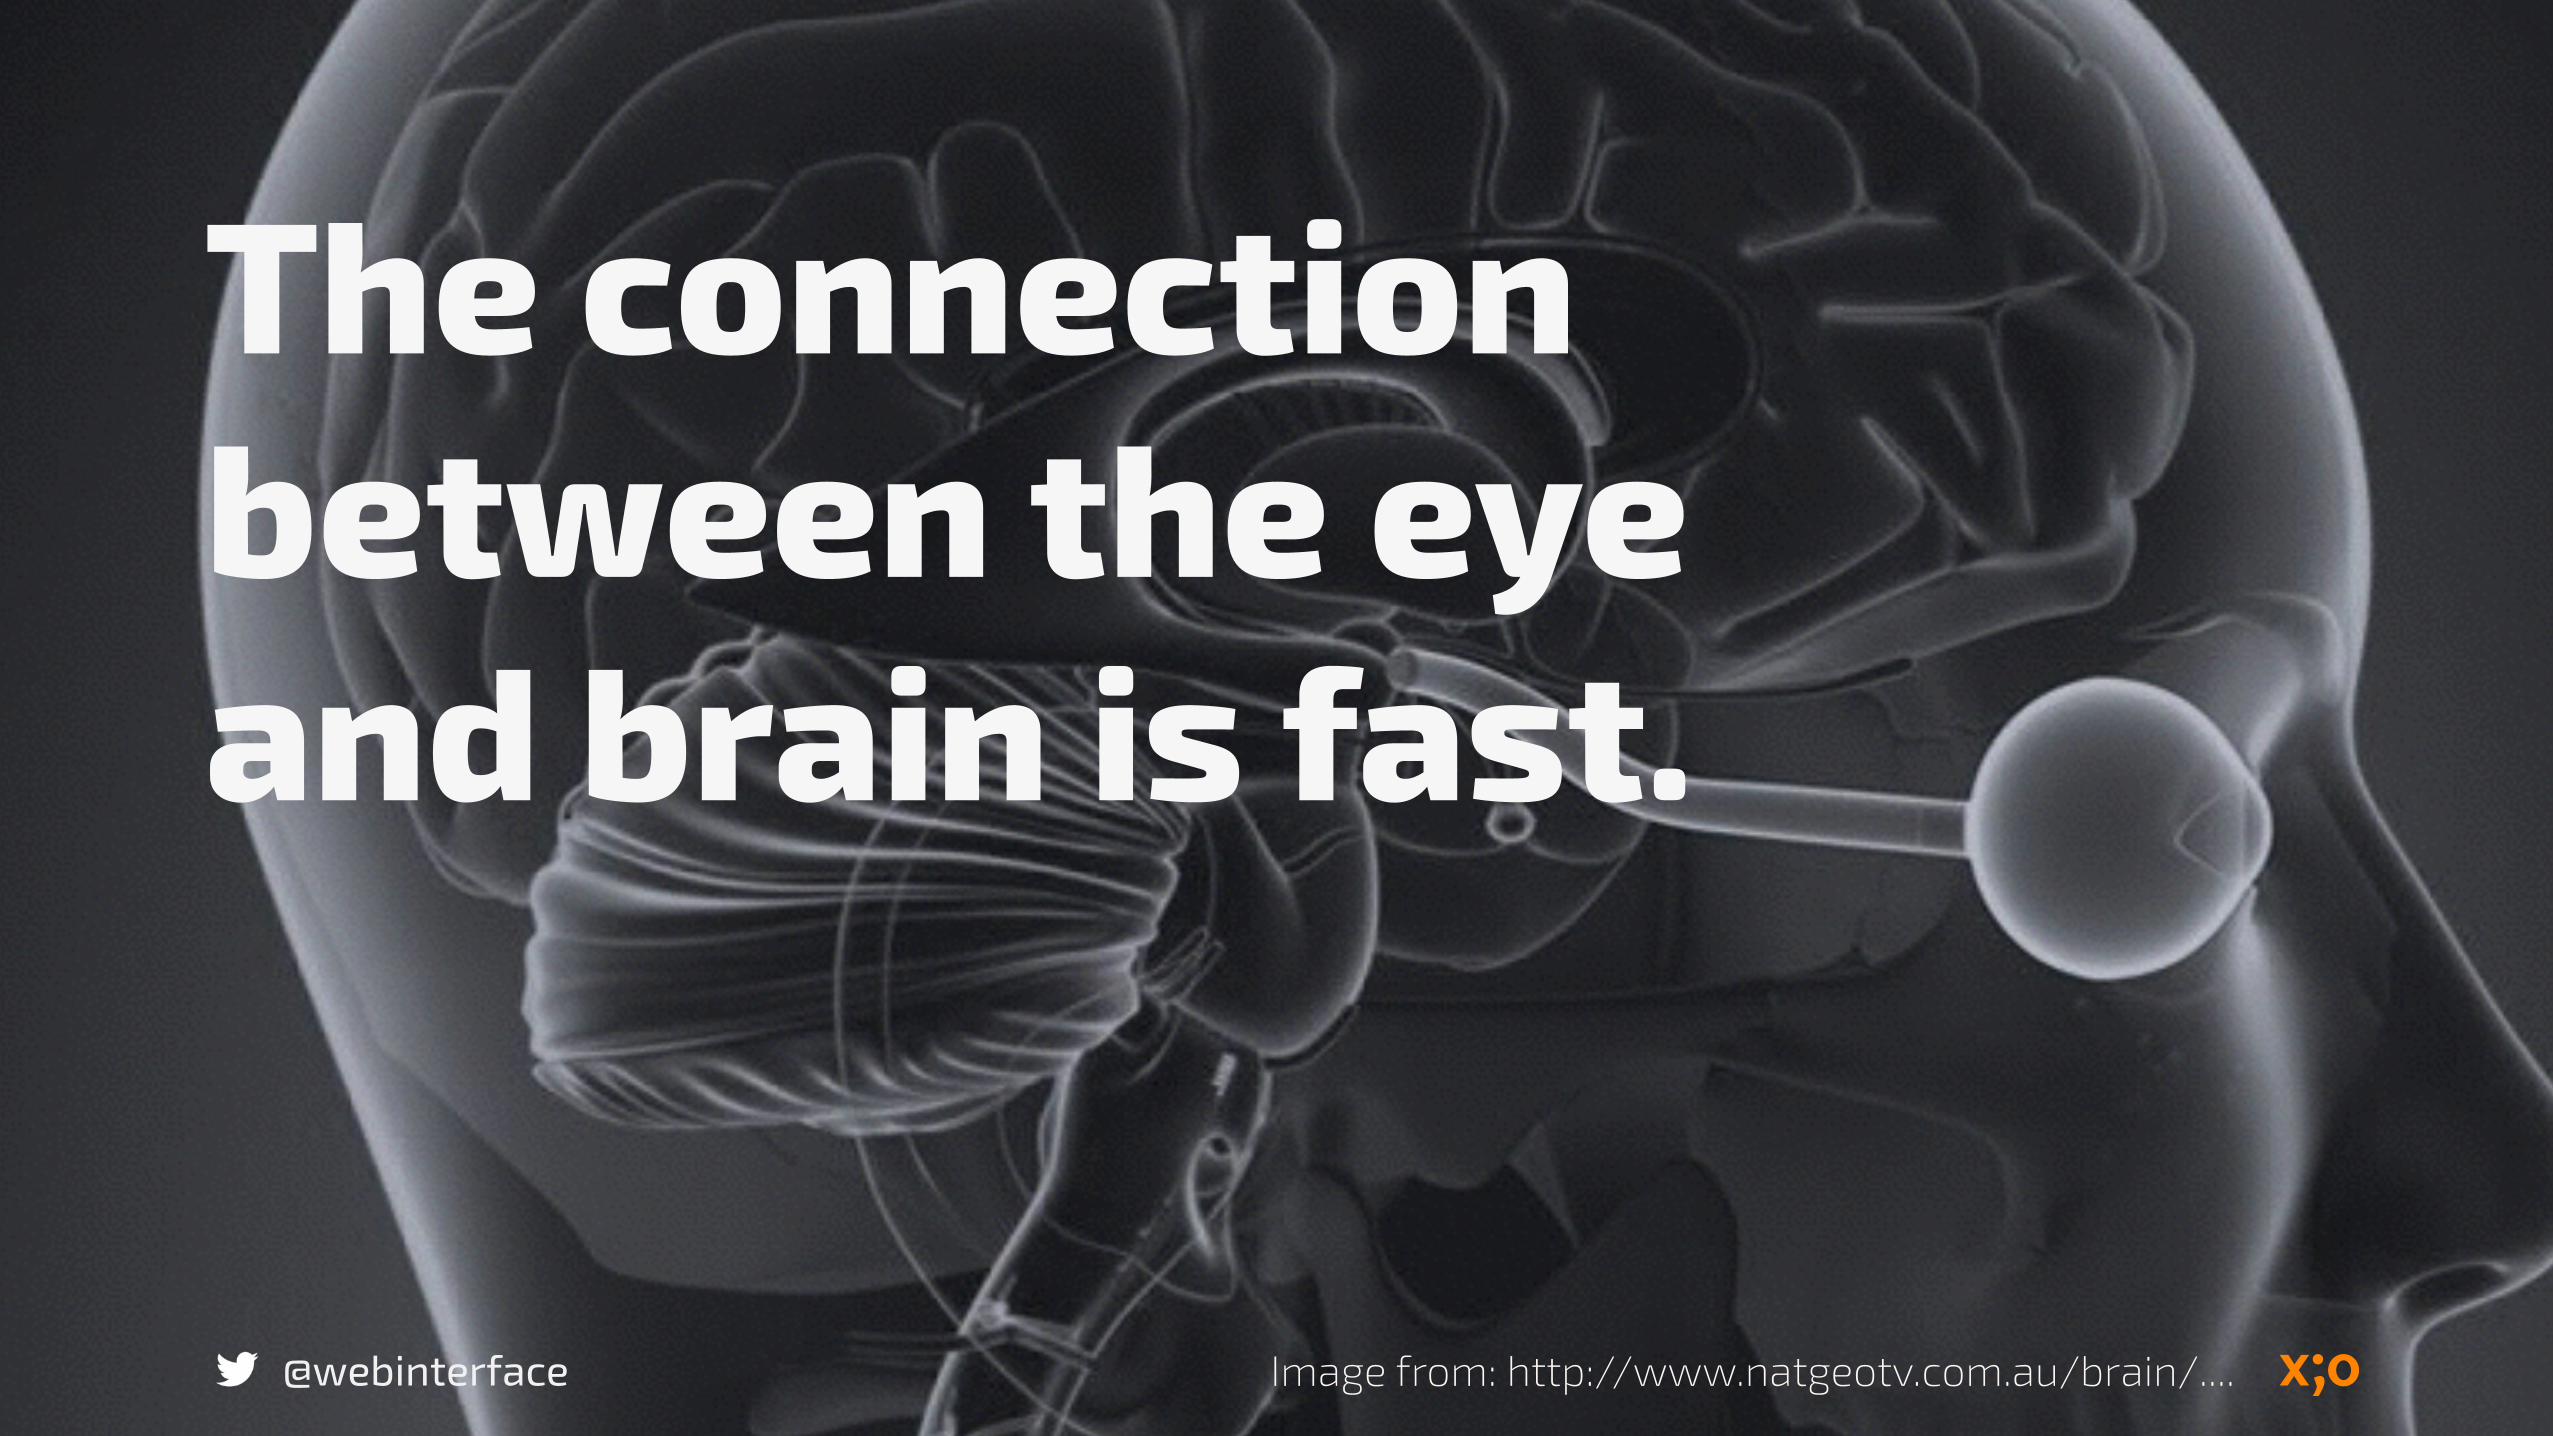
The connection between the eye and brain is fast.
Image from: http://www.natgeotv.com.au/brain/....
@webinterface
The brain receives 8.96 megabits of data from the eye every second.
@webinterface
The average person comprehends 120 words per minute reading.
@webinterface
That is equivalent to 81.6 bits of data per second.
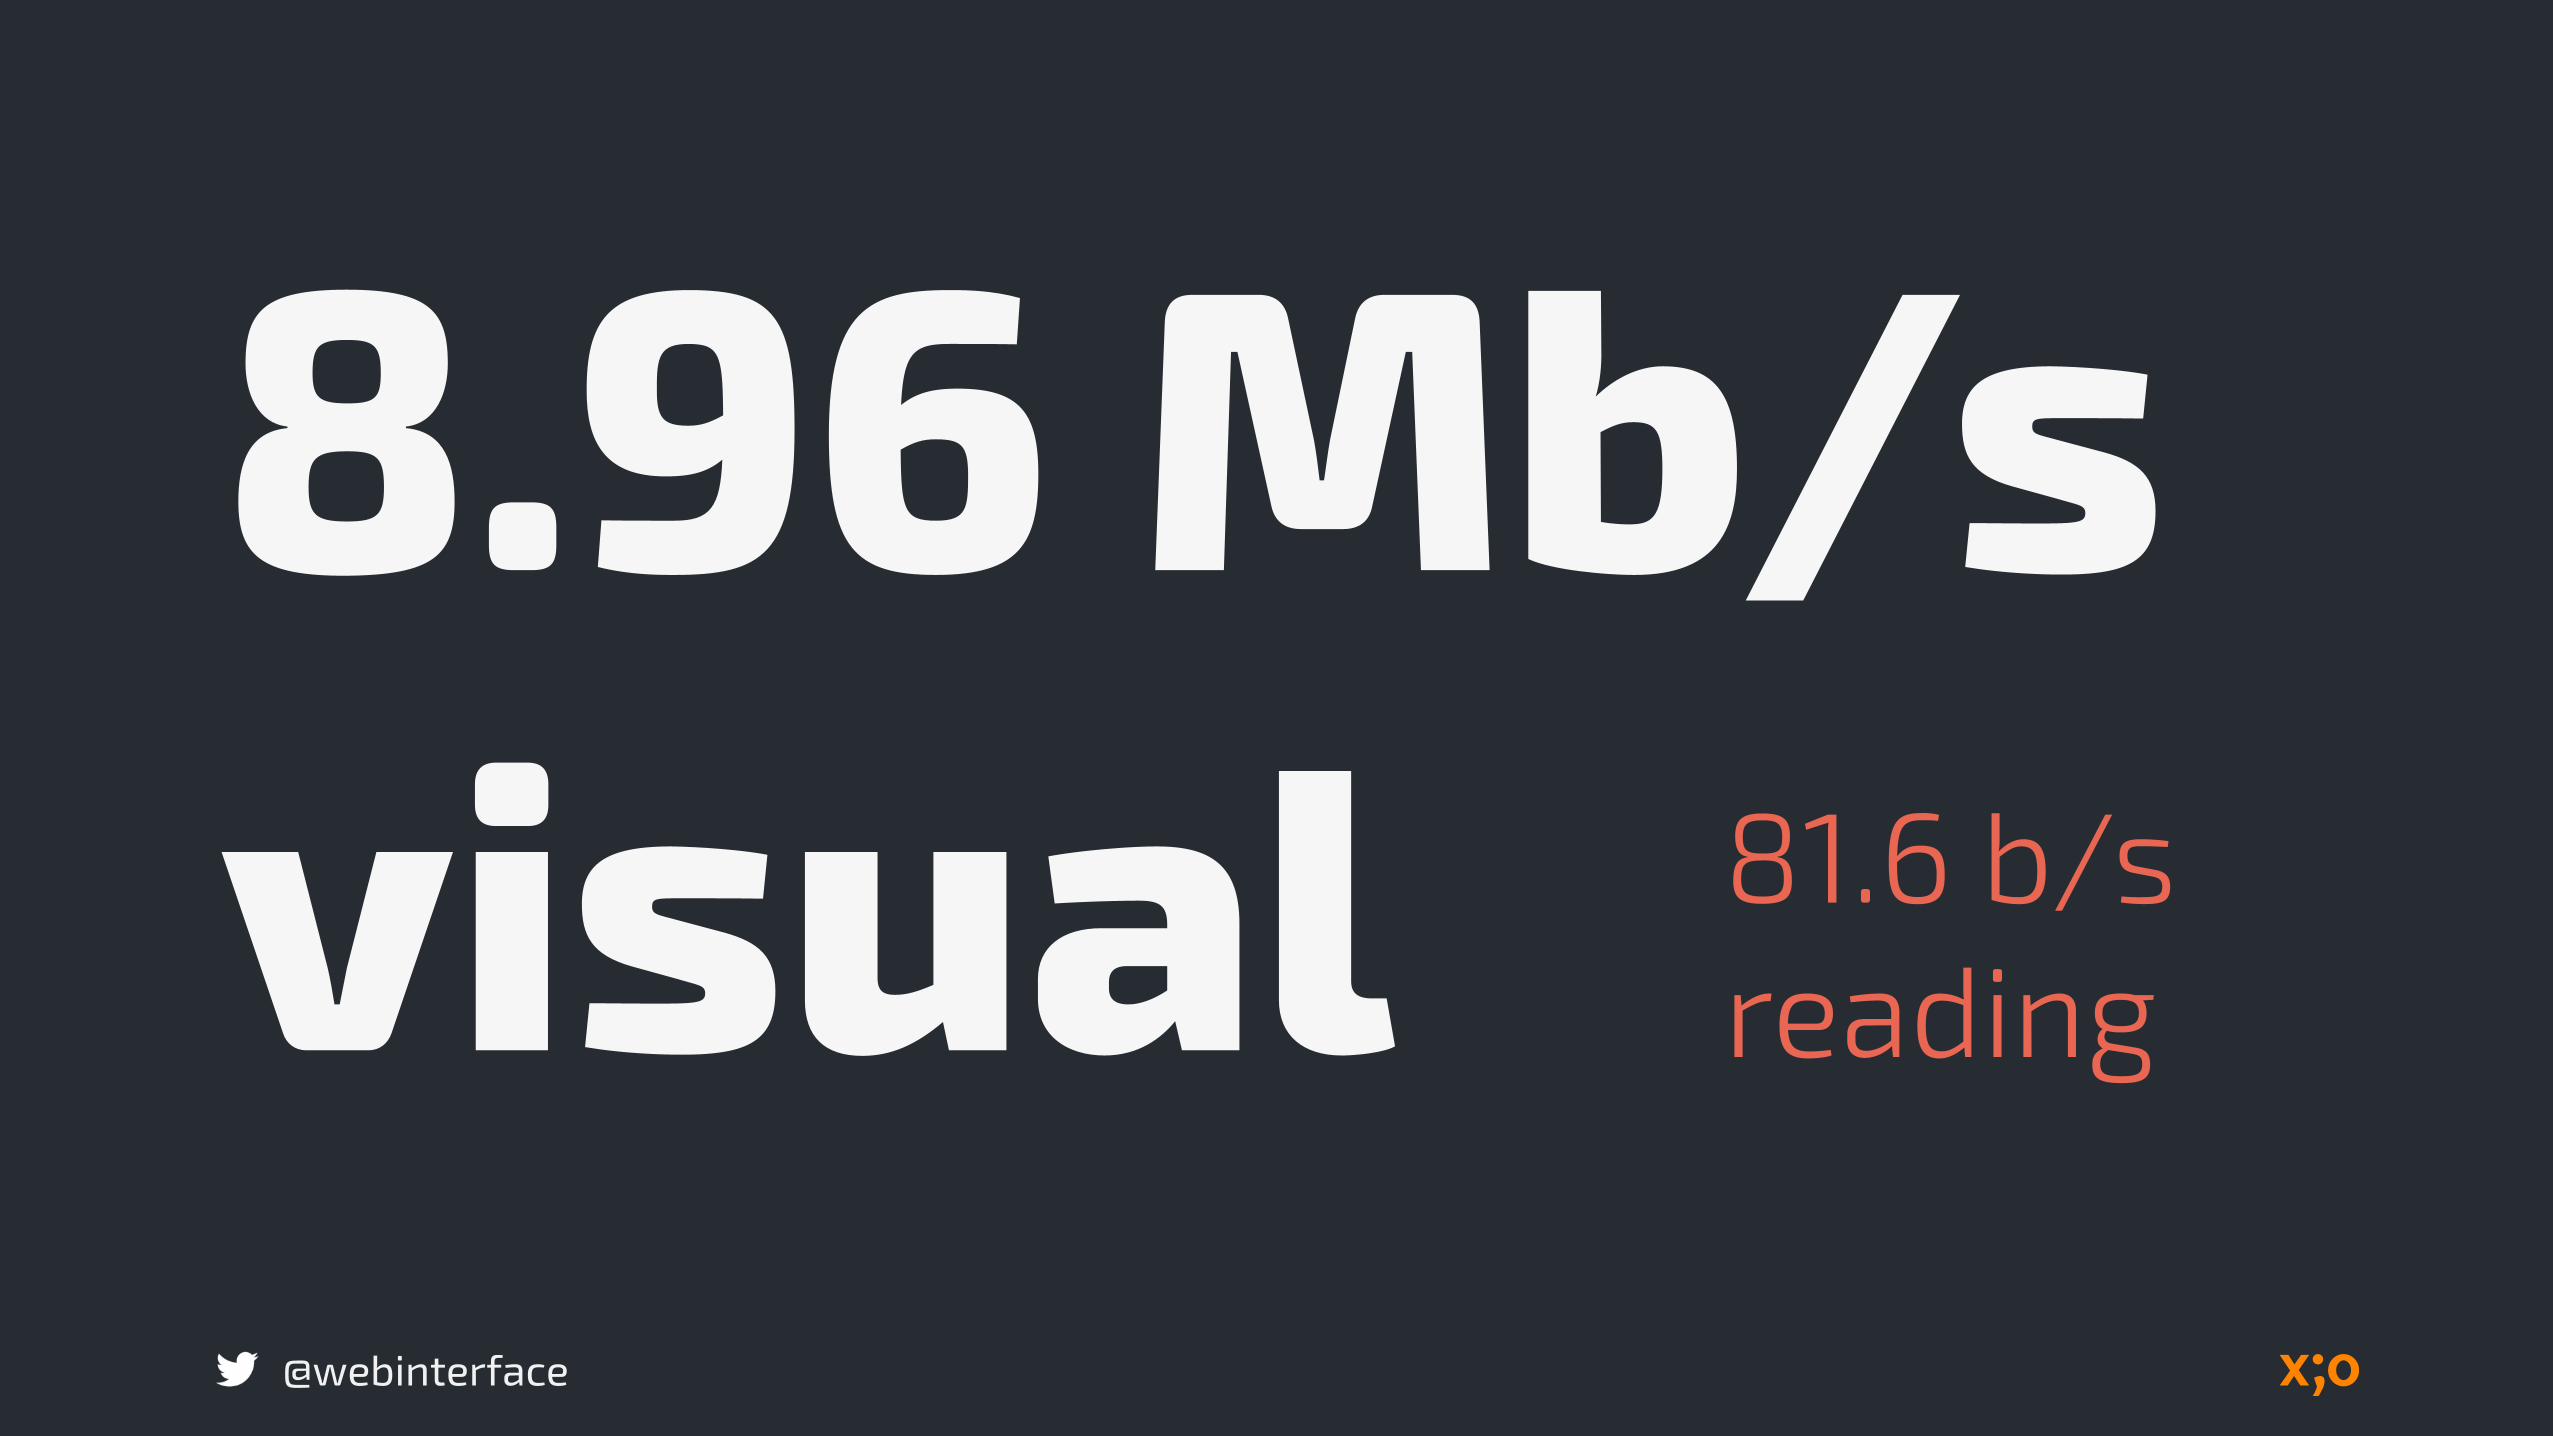
8.96 Mb/s visual
@webinterface
81.6 b/s reading
@webinterface
We are not wired to read fast.
@webinterface
We are wired to visualize fast.
@webinterface
Storytelling changes with technology.
@webinterface Image from: https://de.wikipedia.org/wiki/Paideia
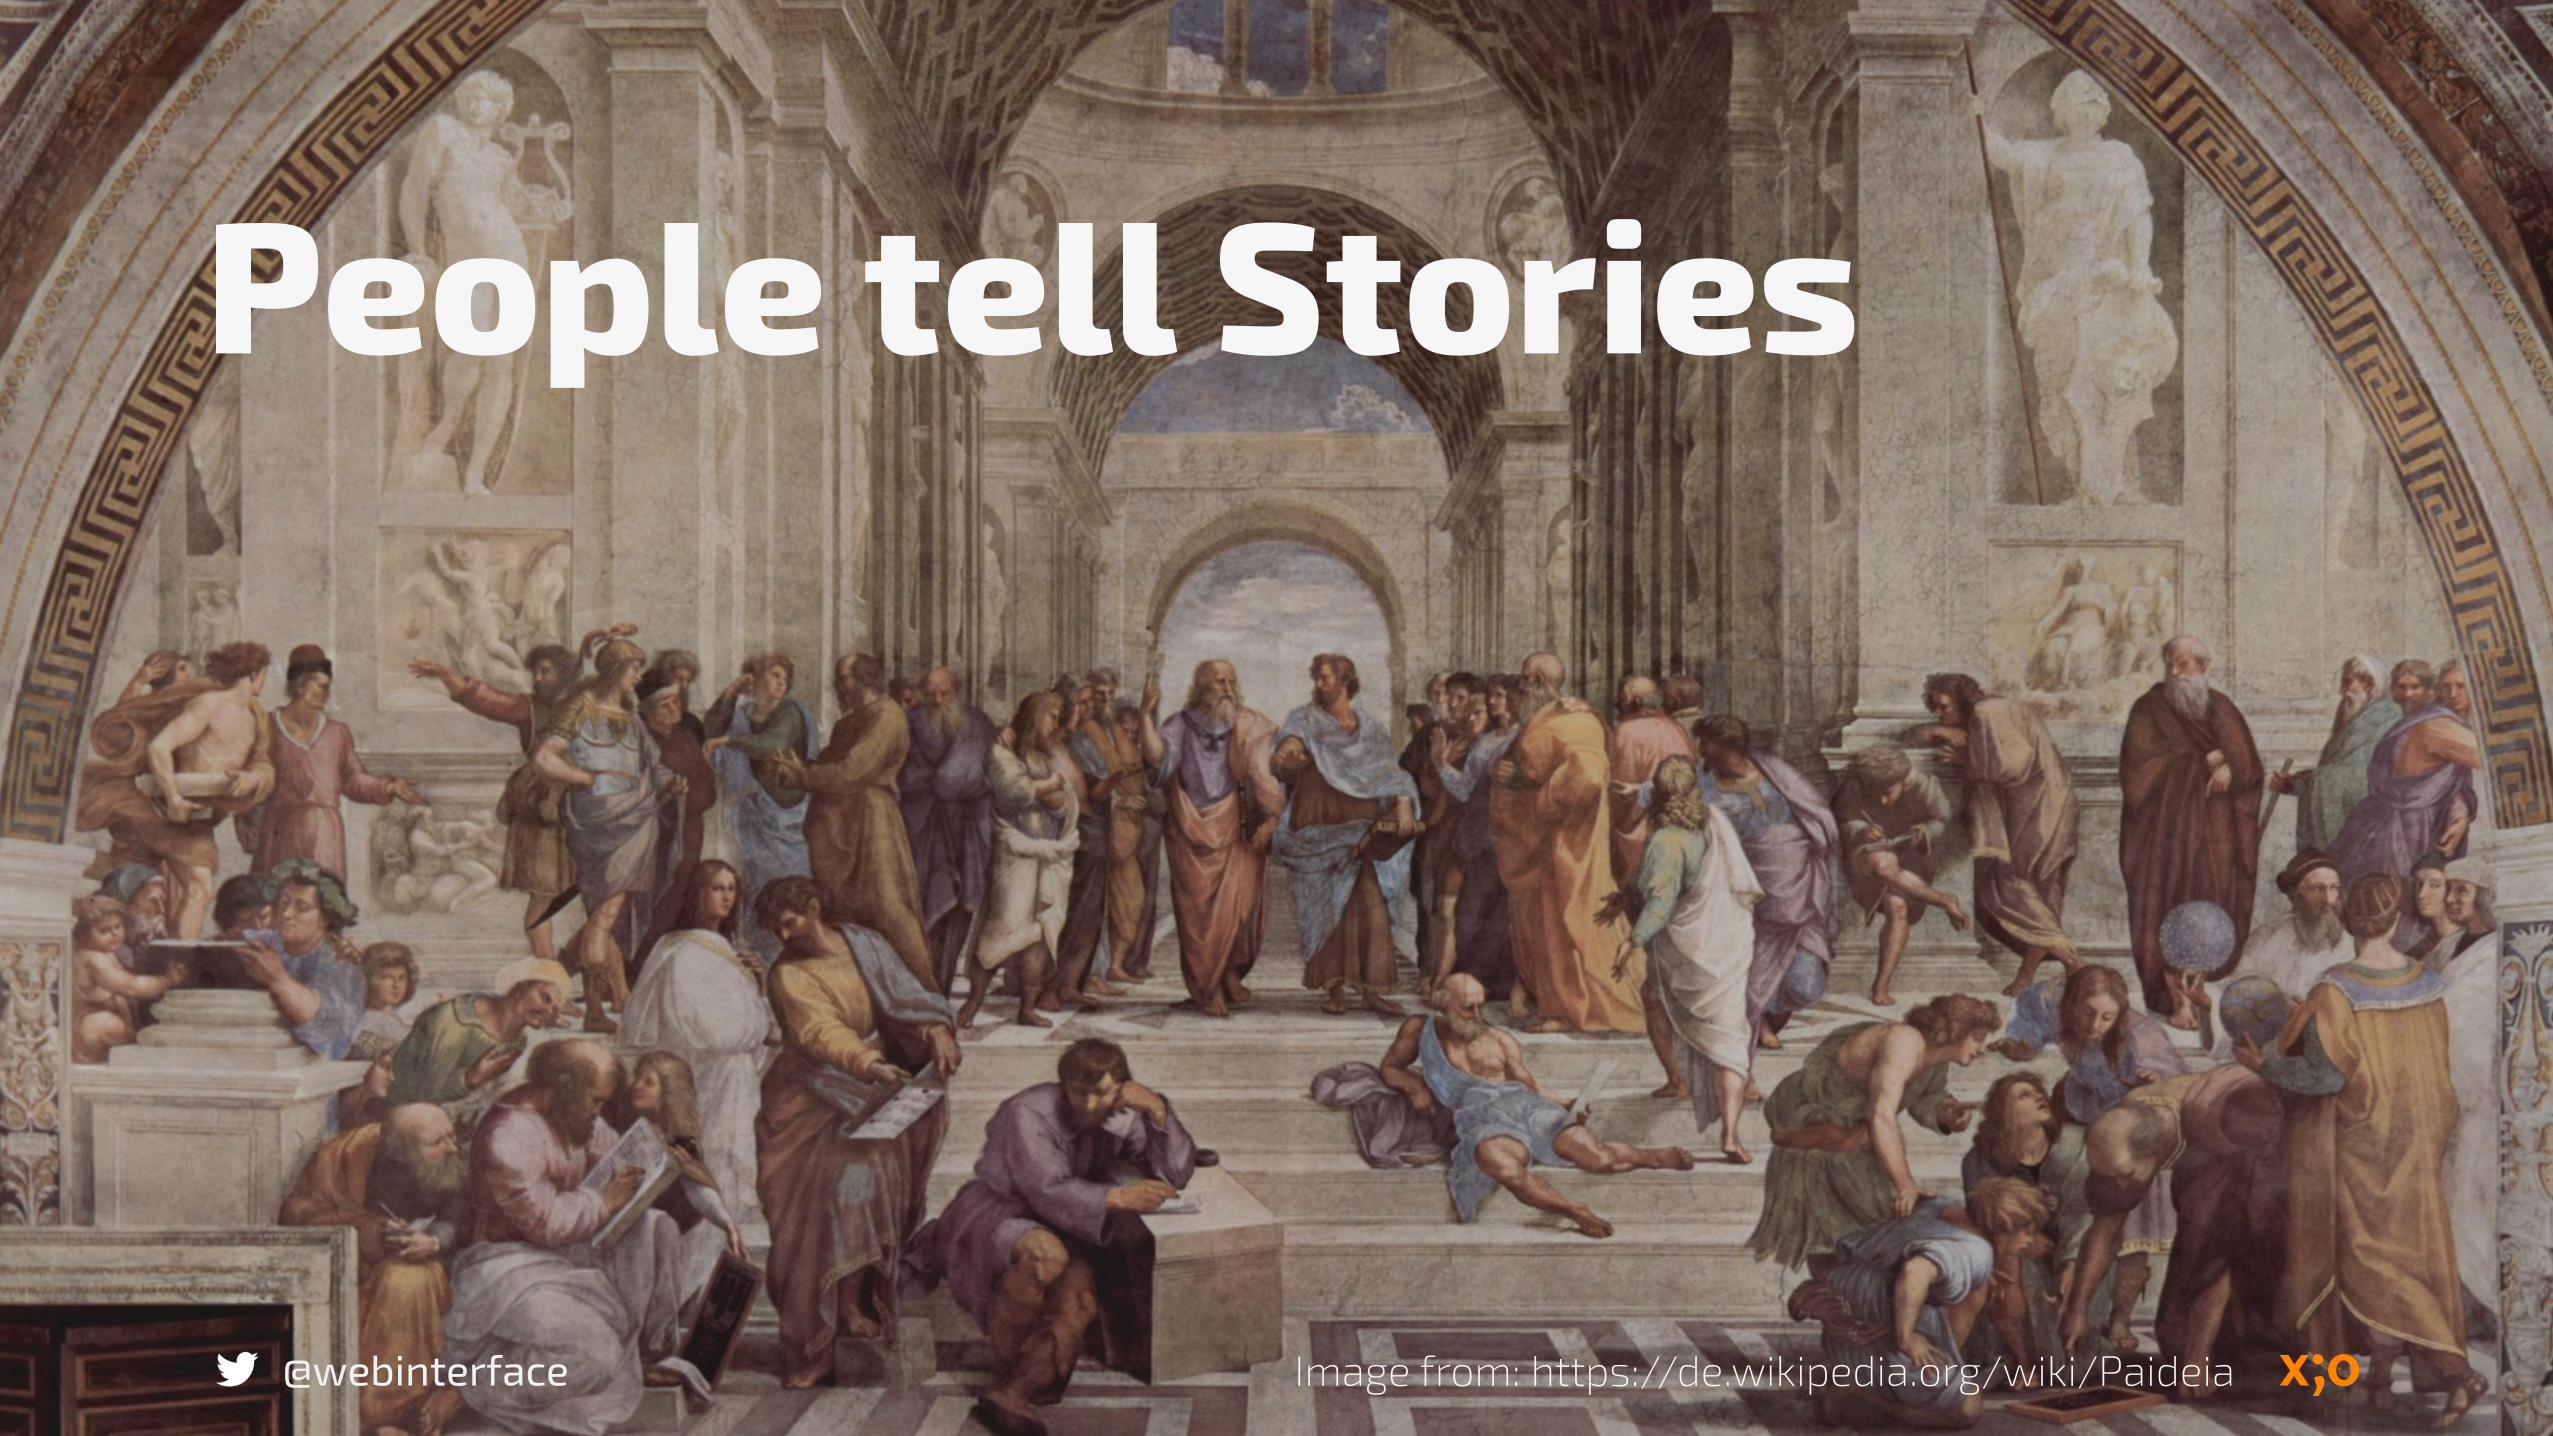
People tell Stories

@webinterface
Words tell Stories
Image from: https://de.wikipedia.org/wiki/Geschichte_des_Buchdrucks

@webinterface
Images tell Stories
@webinterface
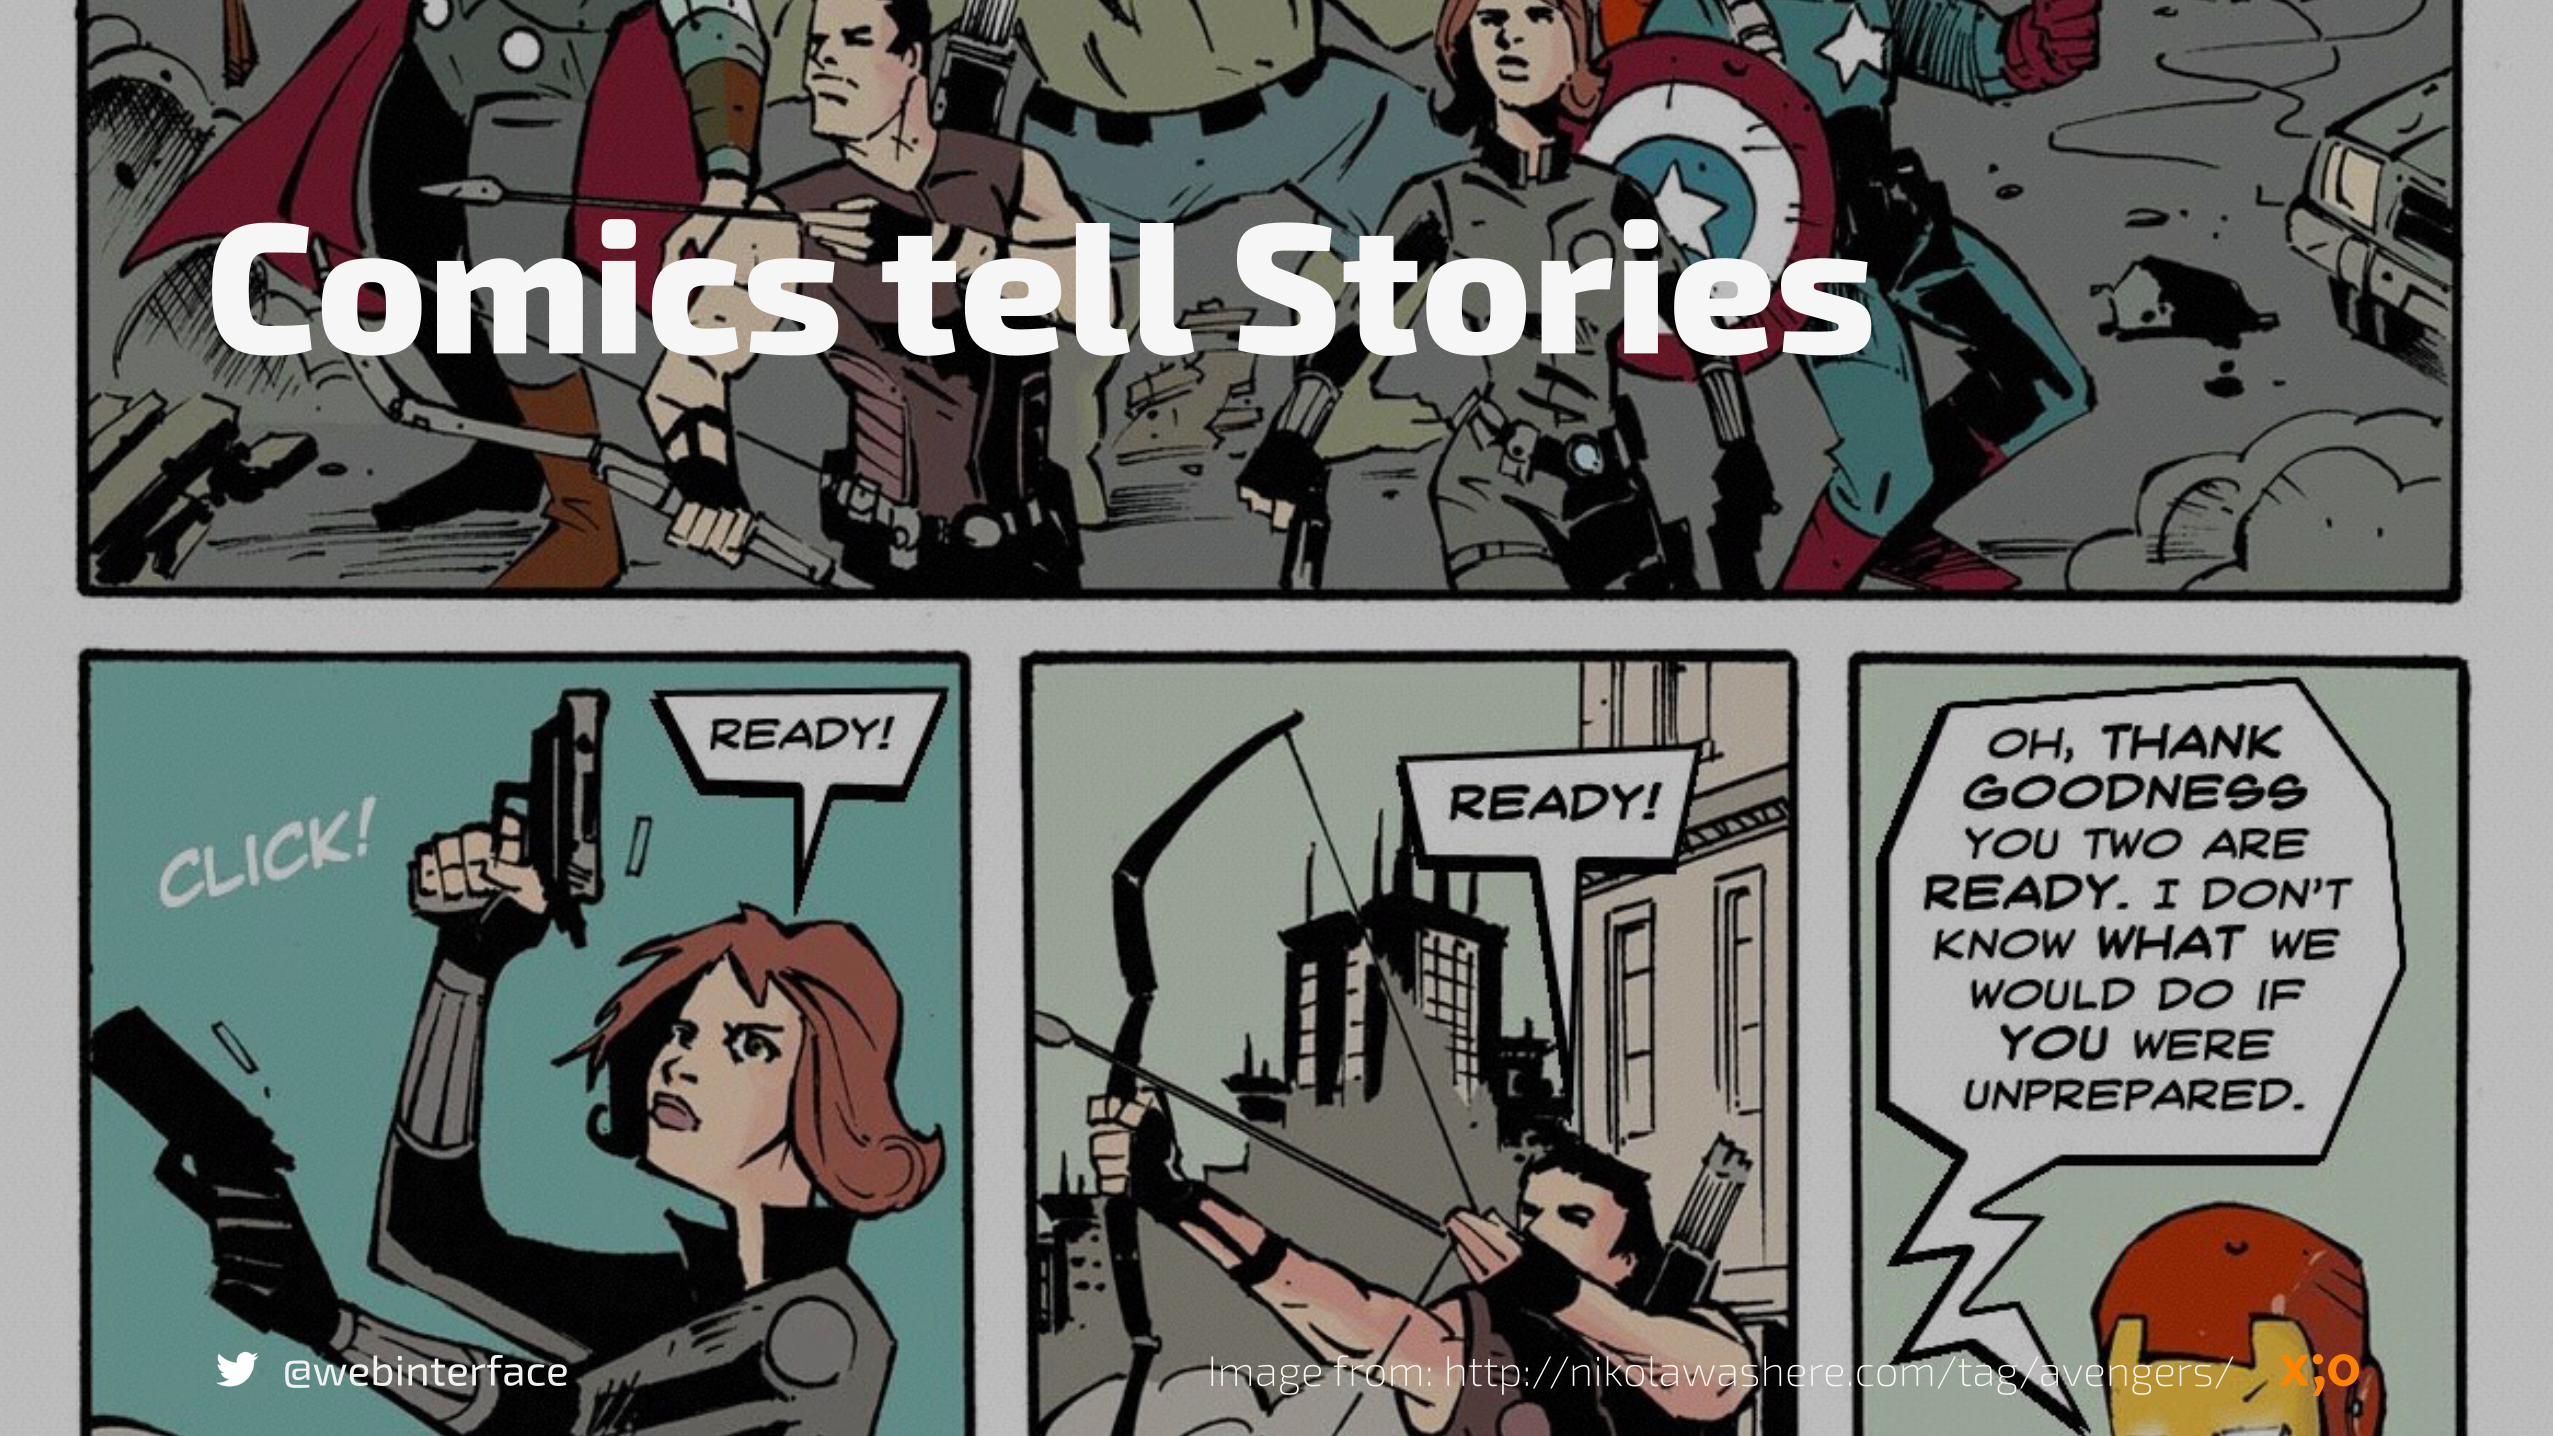
Comics tell Stories
Image from: http://nikolawashere.com/tag/avengers/

@webinterface
Movies tell Stories
Image from: http://www.giga.de/filme/...
@webinterface
Data visualizations effectively
@webinterface
Analyze and make decisions.
@webinterface
How can we tell Stories with Data ?
@webinterface
What information does the reader need to be successful? How much detail does the reader need?
@webinterface
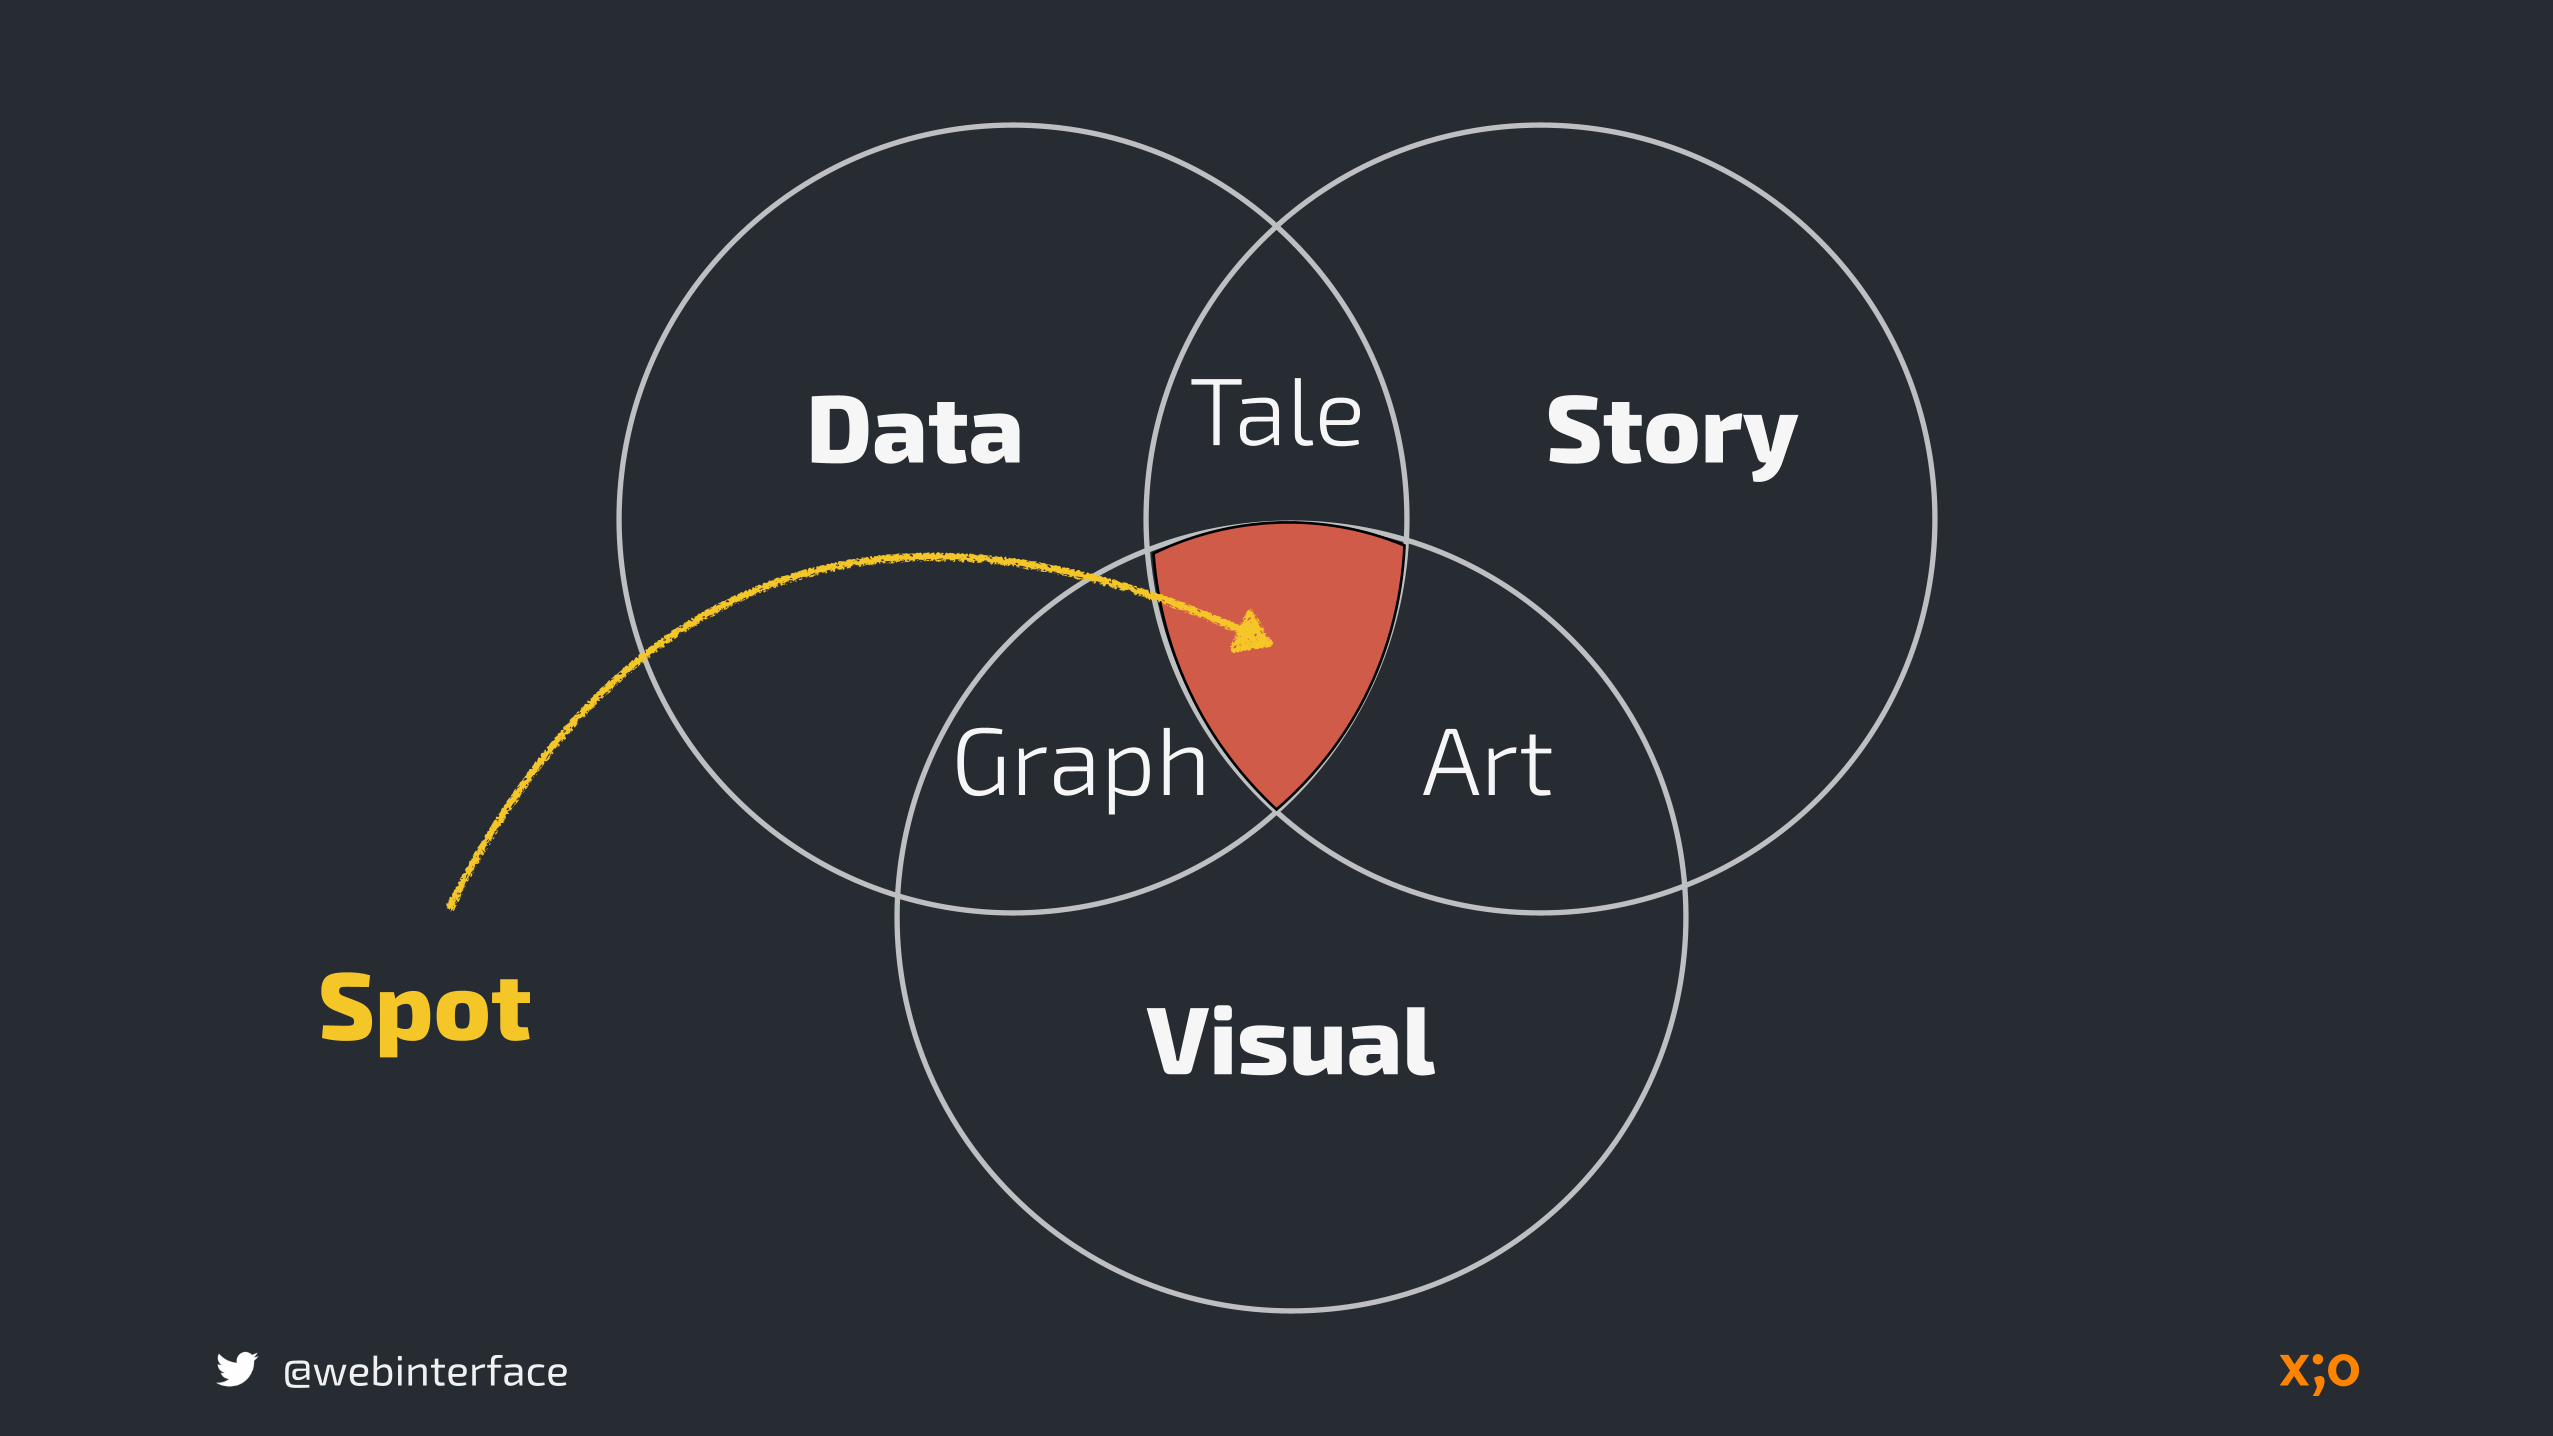
Data Story
Visual
Tale
ArtGraph
Spot
@webinterface
The right data visualization can
emphasize key points provide context engage the audience
„Creative field melding the skills of computer science, statistics, artistic design and storytelling“
@webinterface
the economist 2010
Quote: http://www.economist.com/node/15557455
“I think people have begun to forget how powerful human stories are, exchanging their sense of empathy for a fetishistic fascination with data, networks, patterns, and total information… Really, the data is just part of the story. The human stuff is the main stuff, and the data should enrich it.”
@webinterface
Jonathan Harris
@webinterface
Design Principles for Data
@webinterface
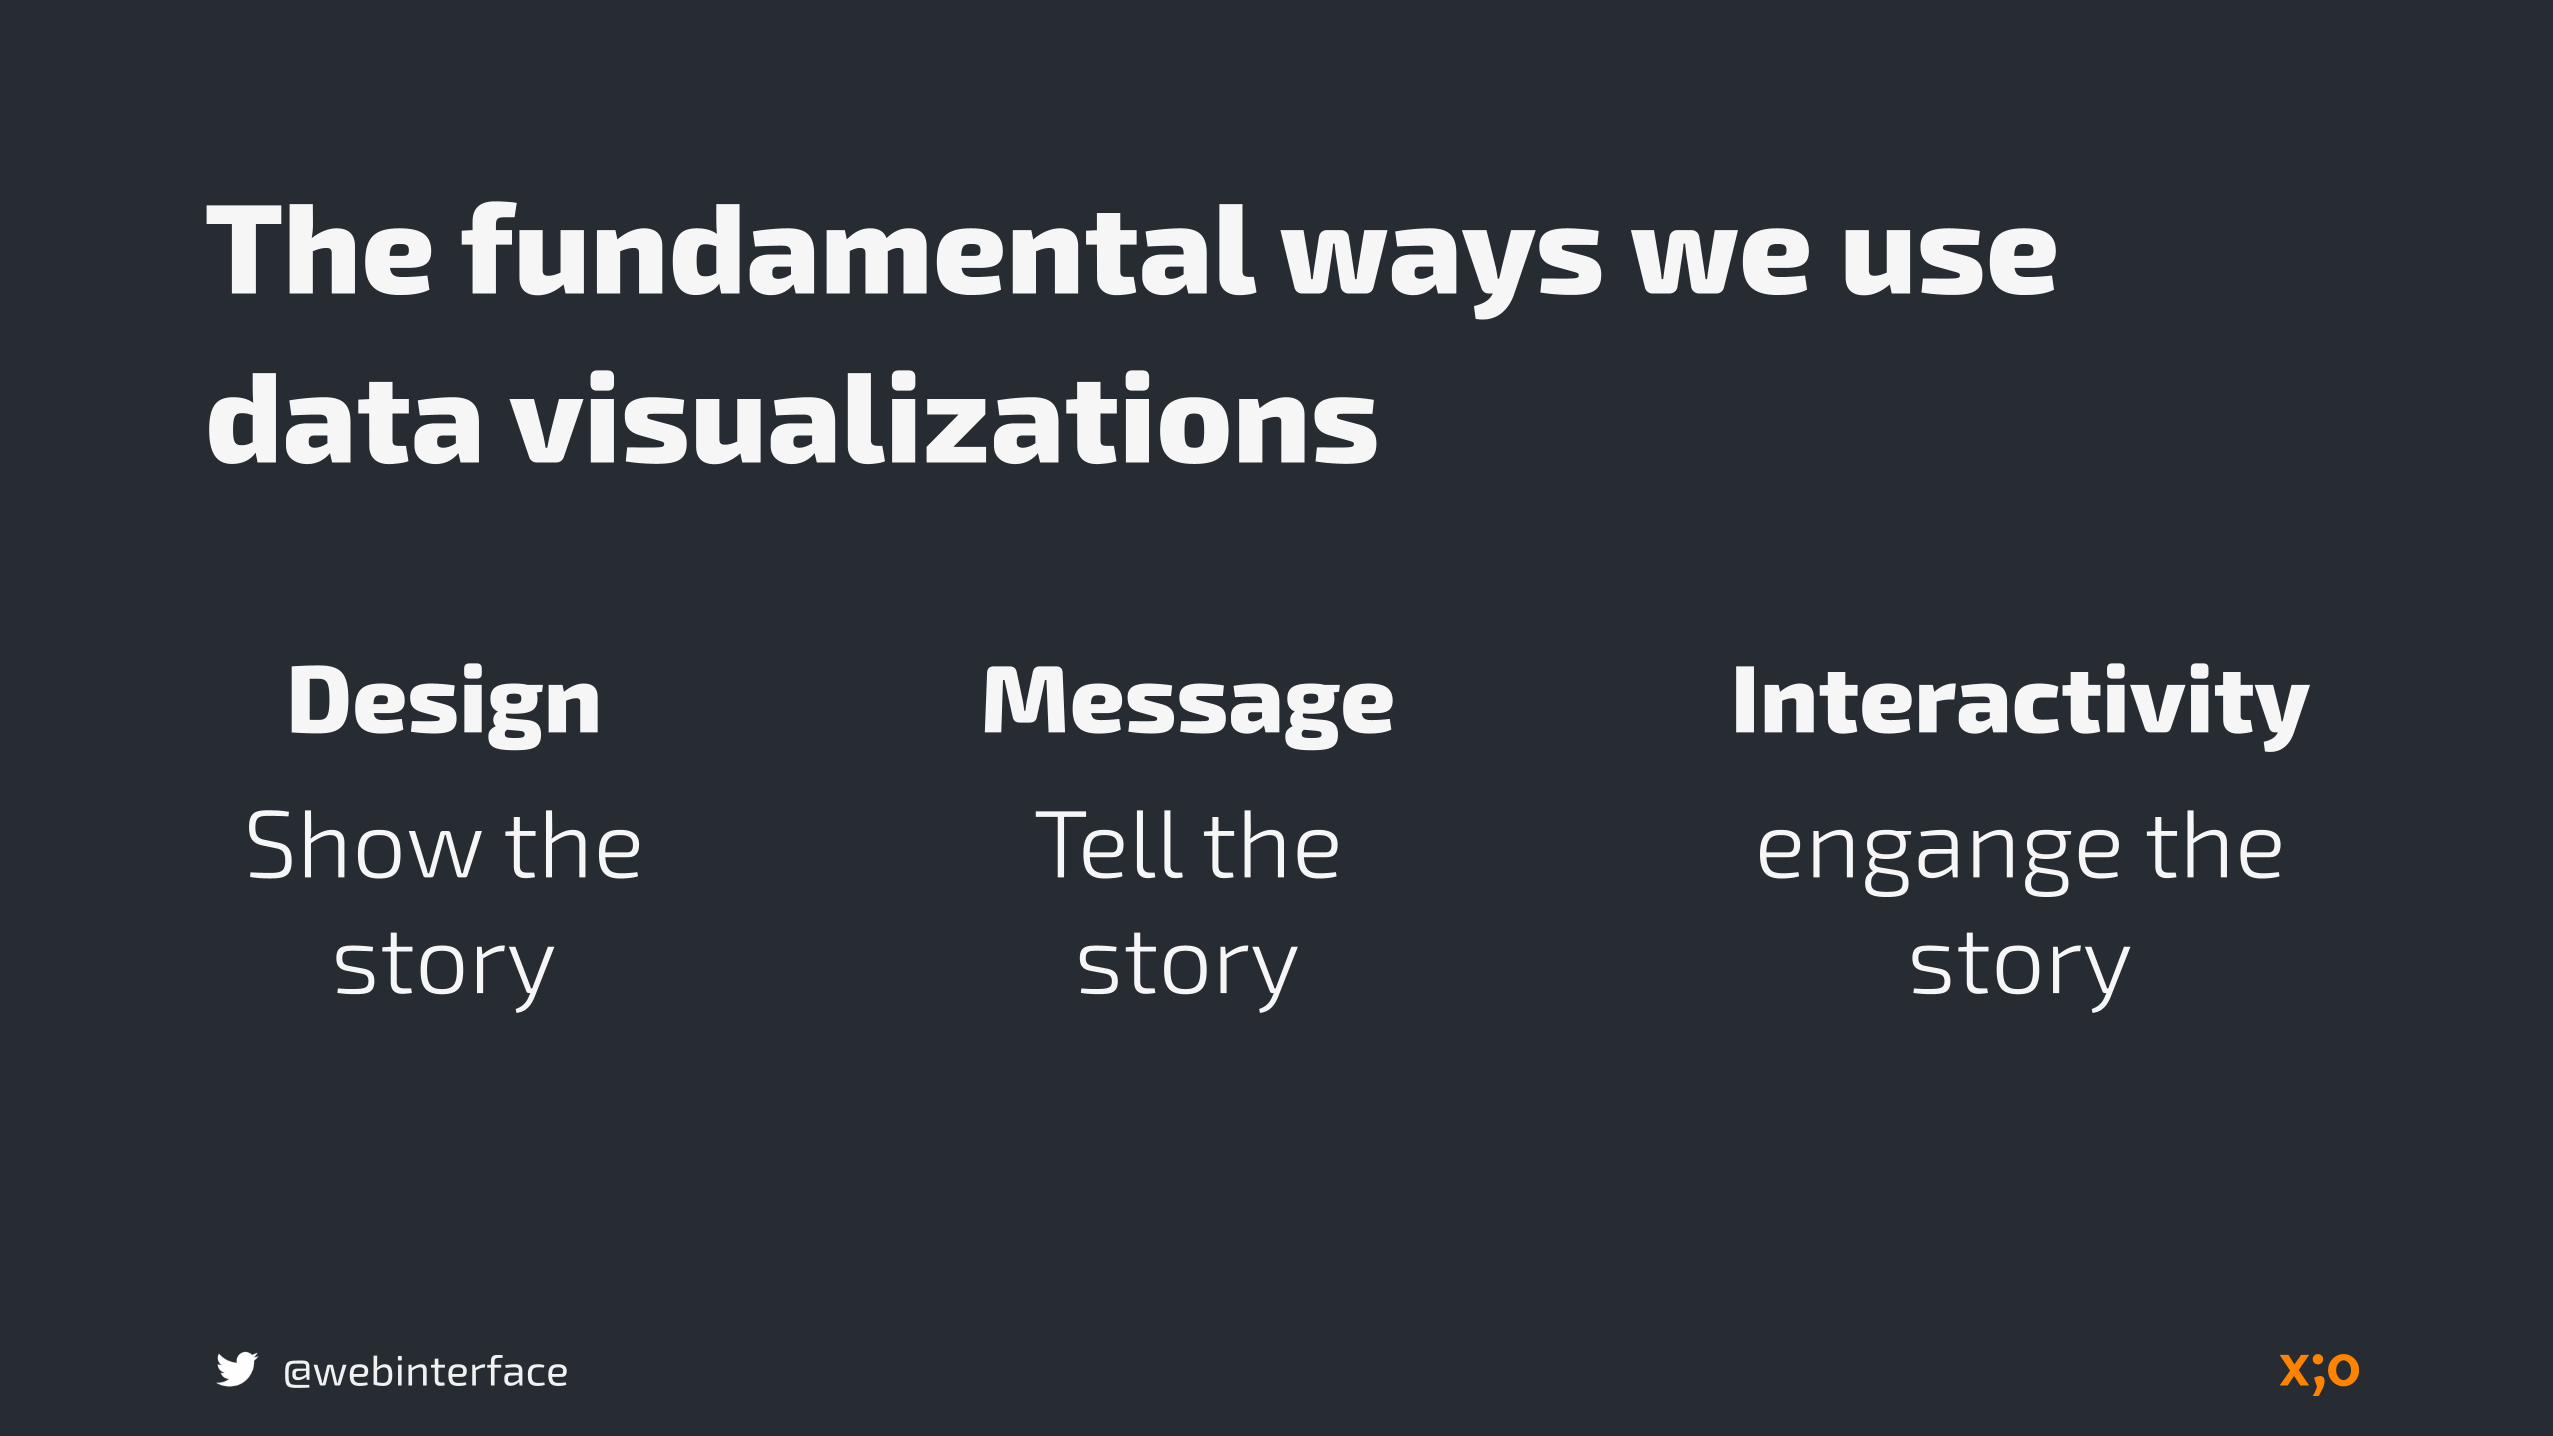
Design Message InteractivityShow the
storyTell the story
engange the story
The fundamental ways we use data visualizations
@webinterface
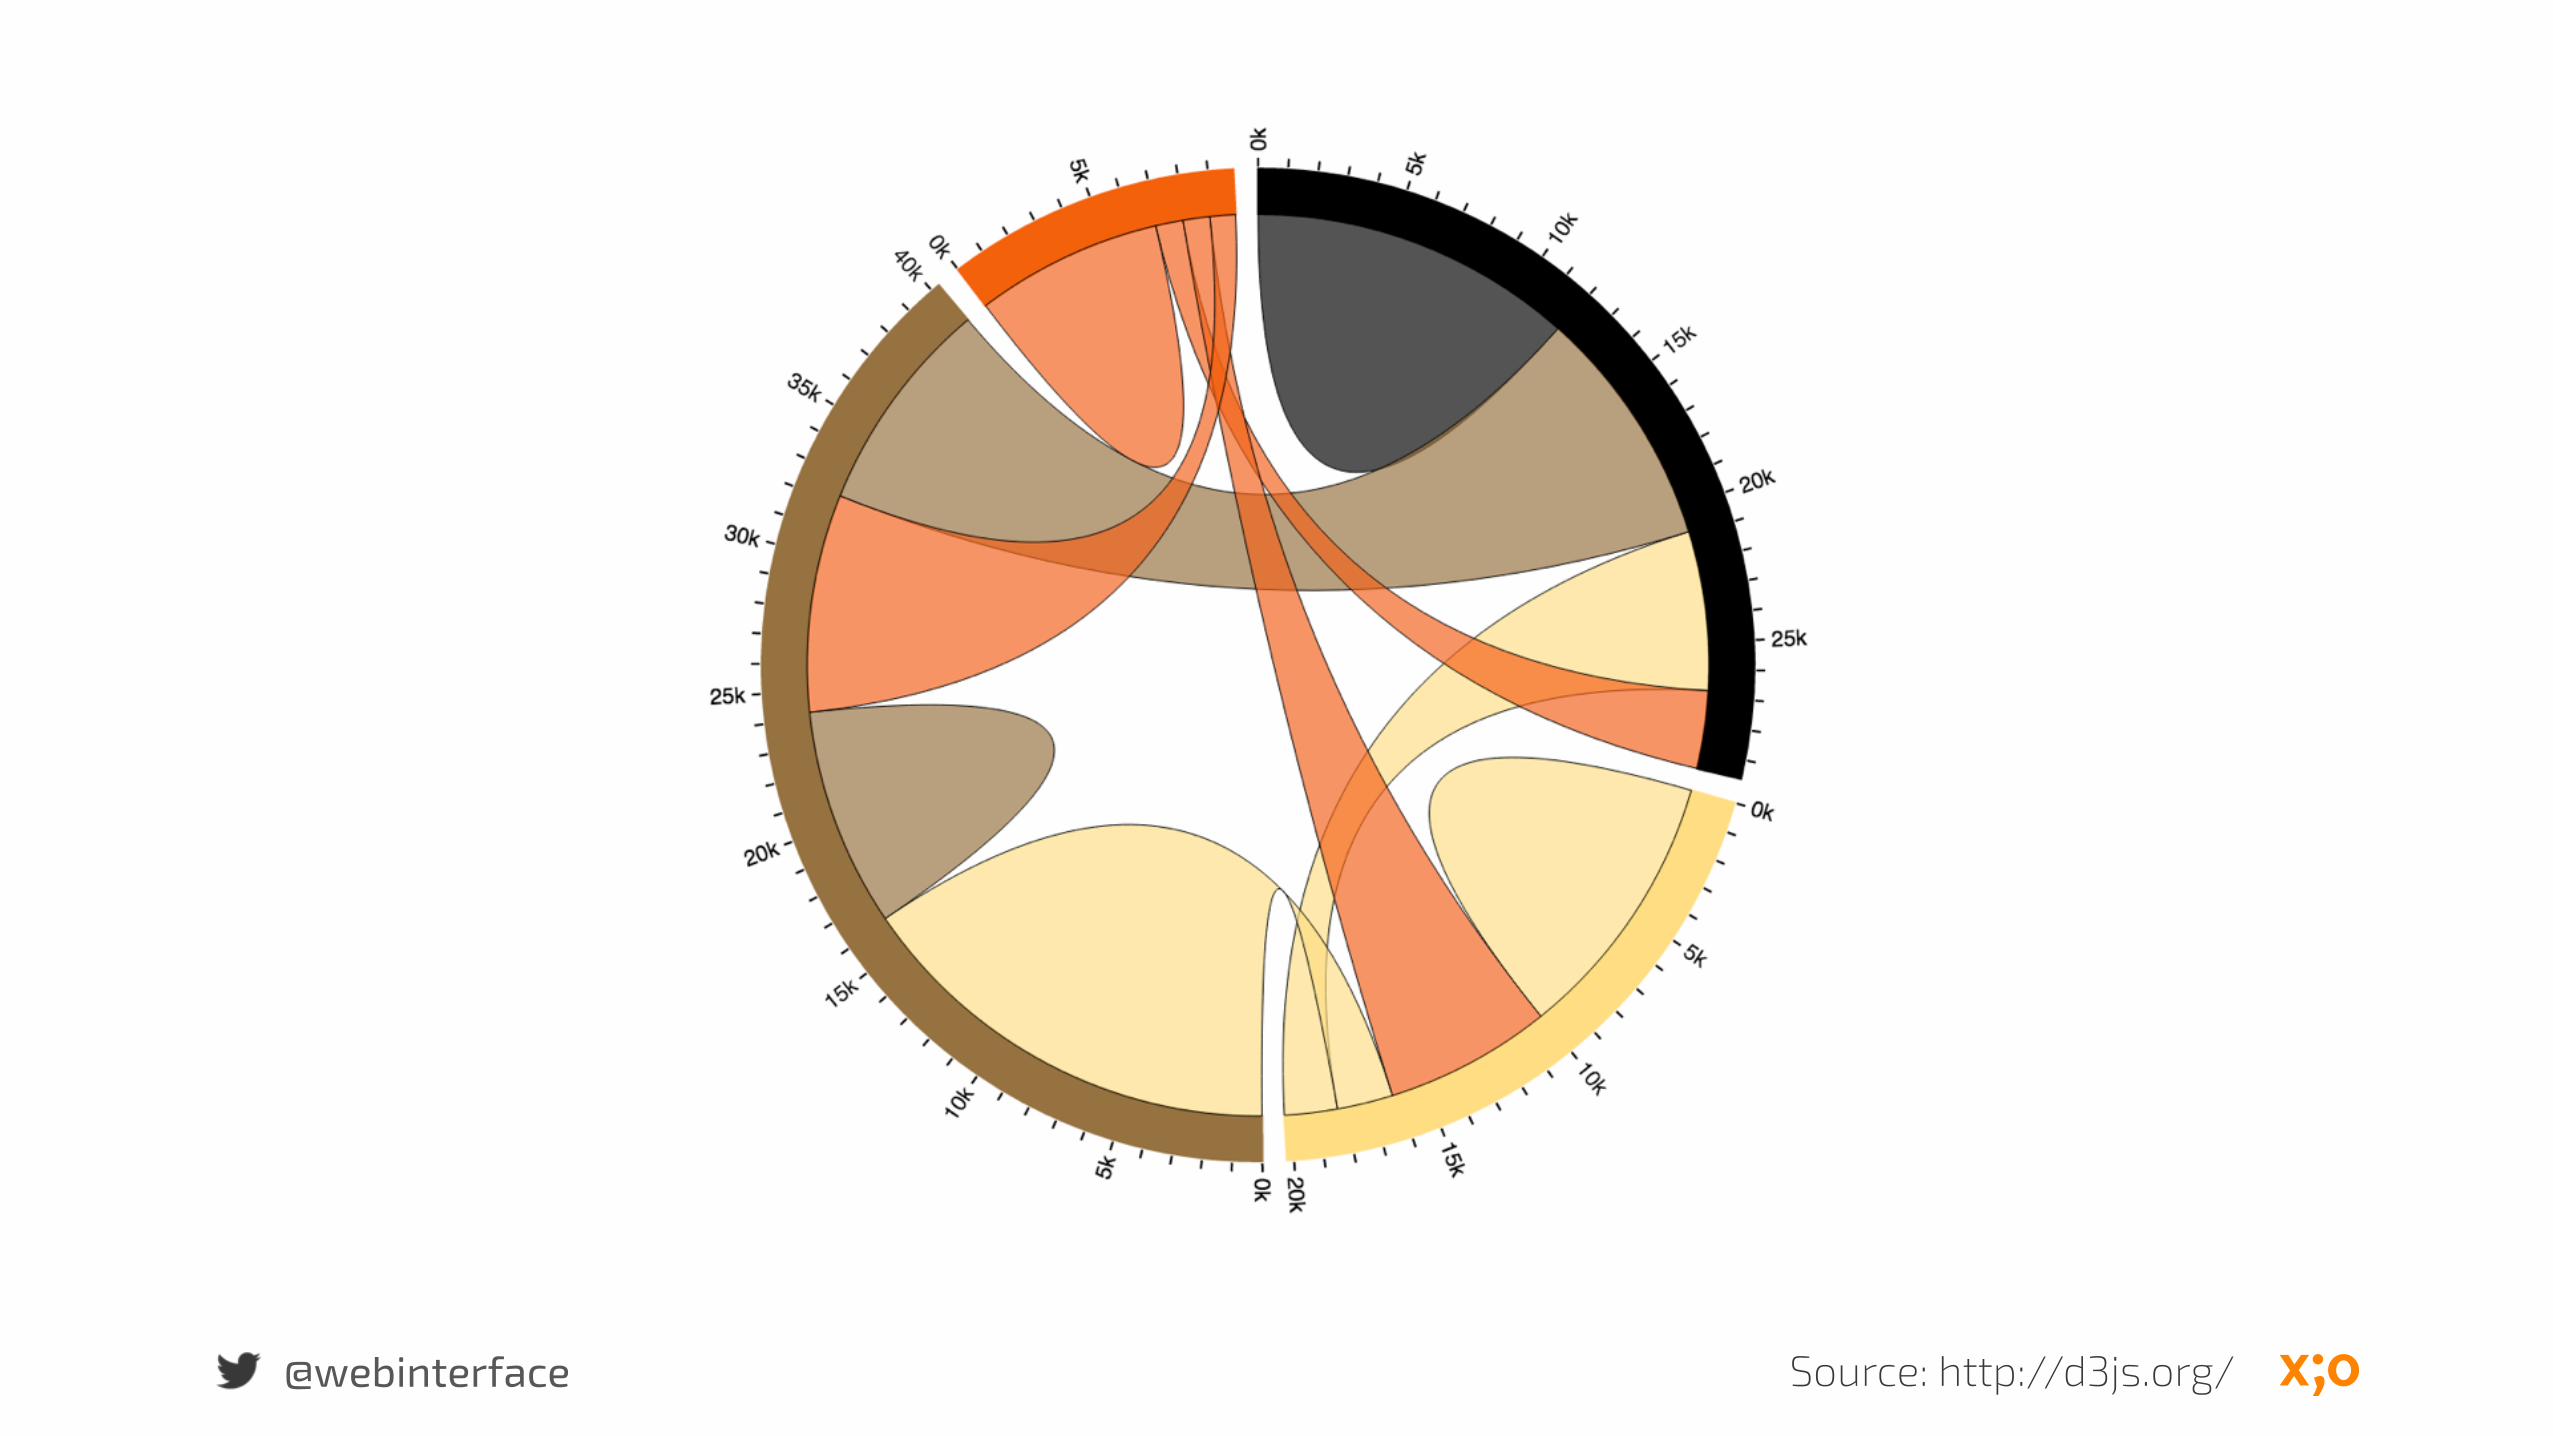
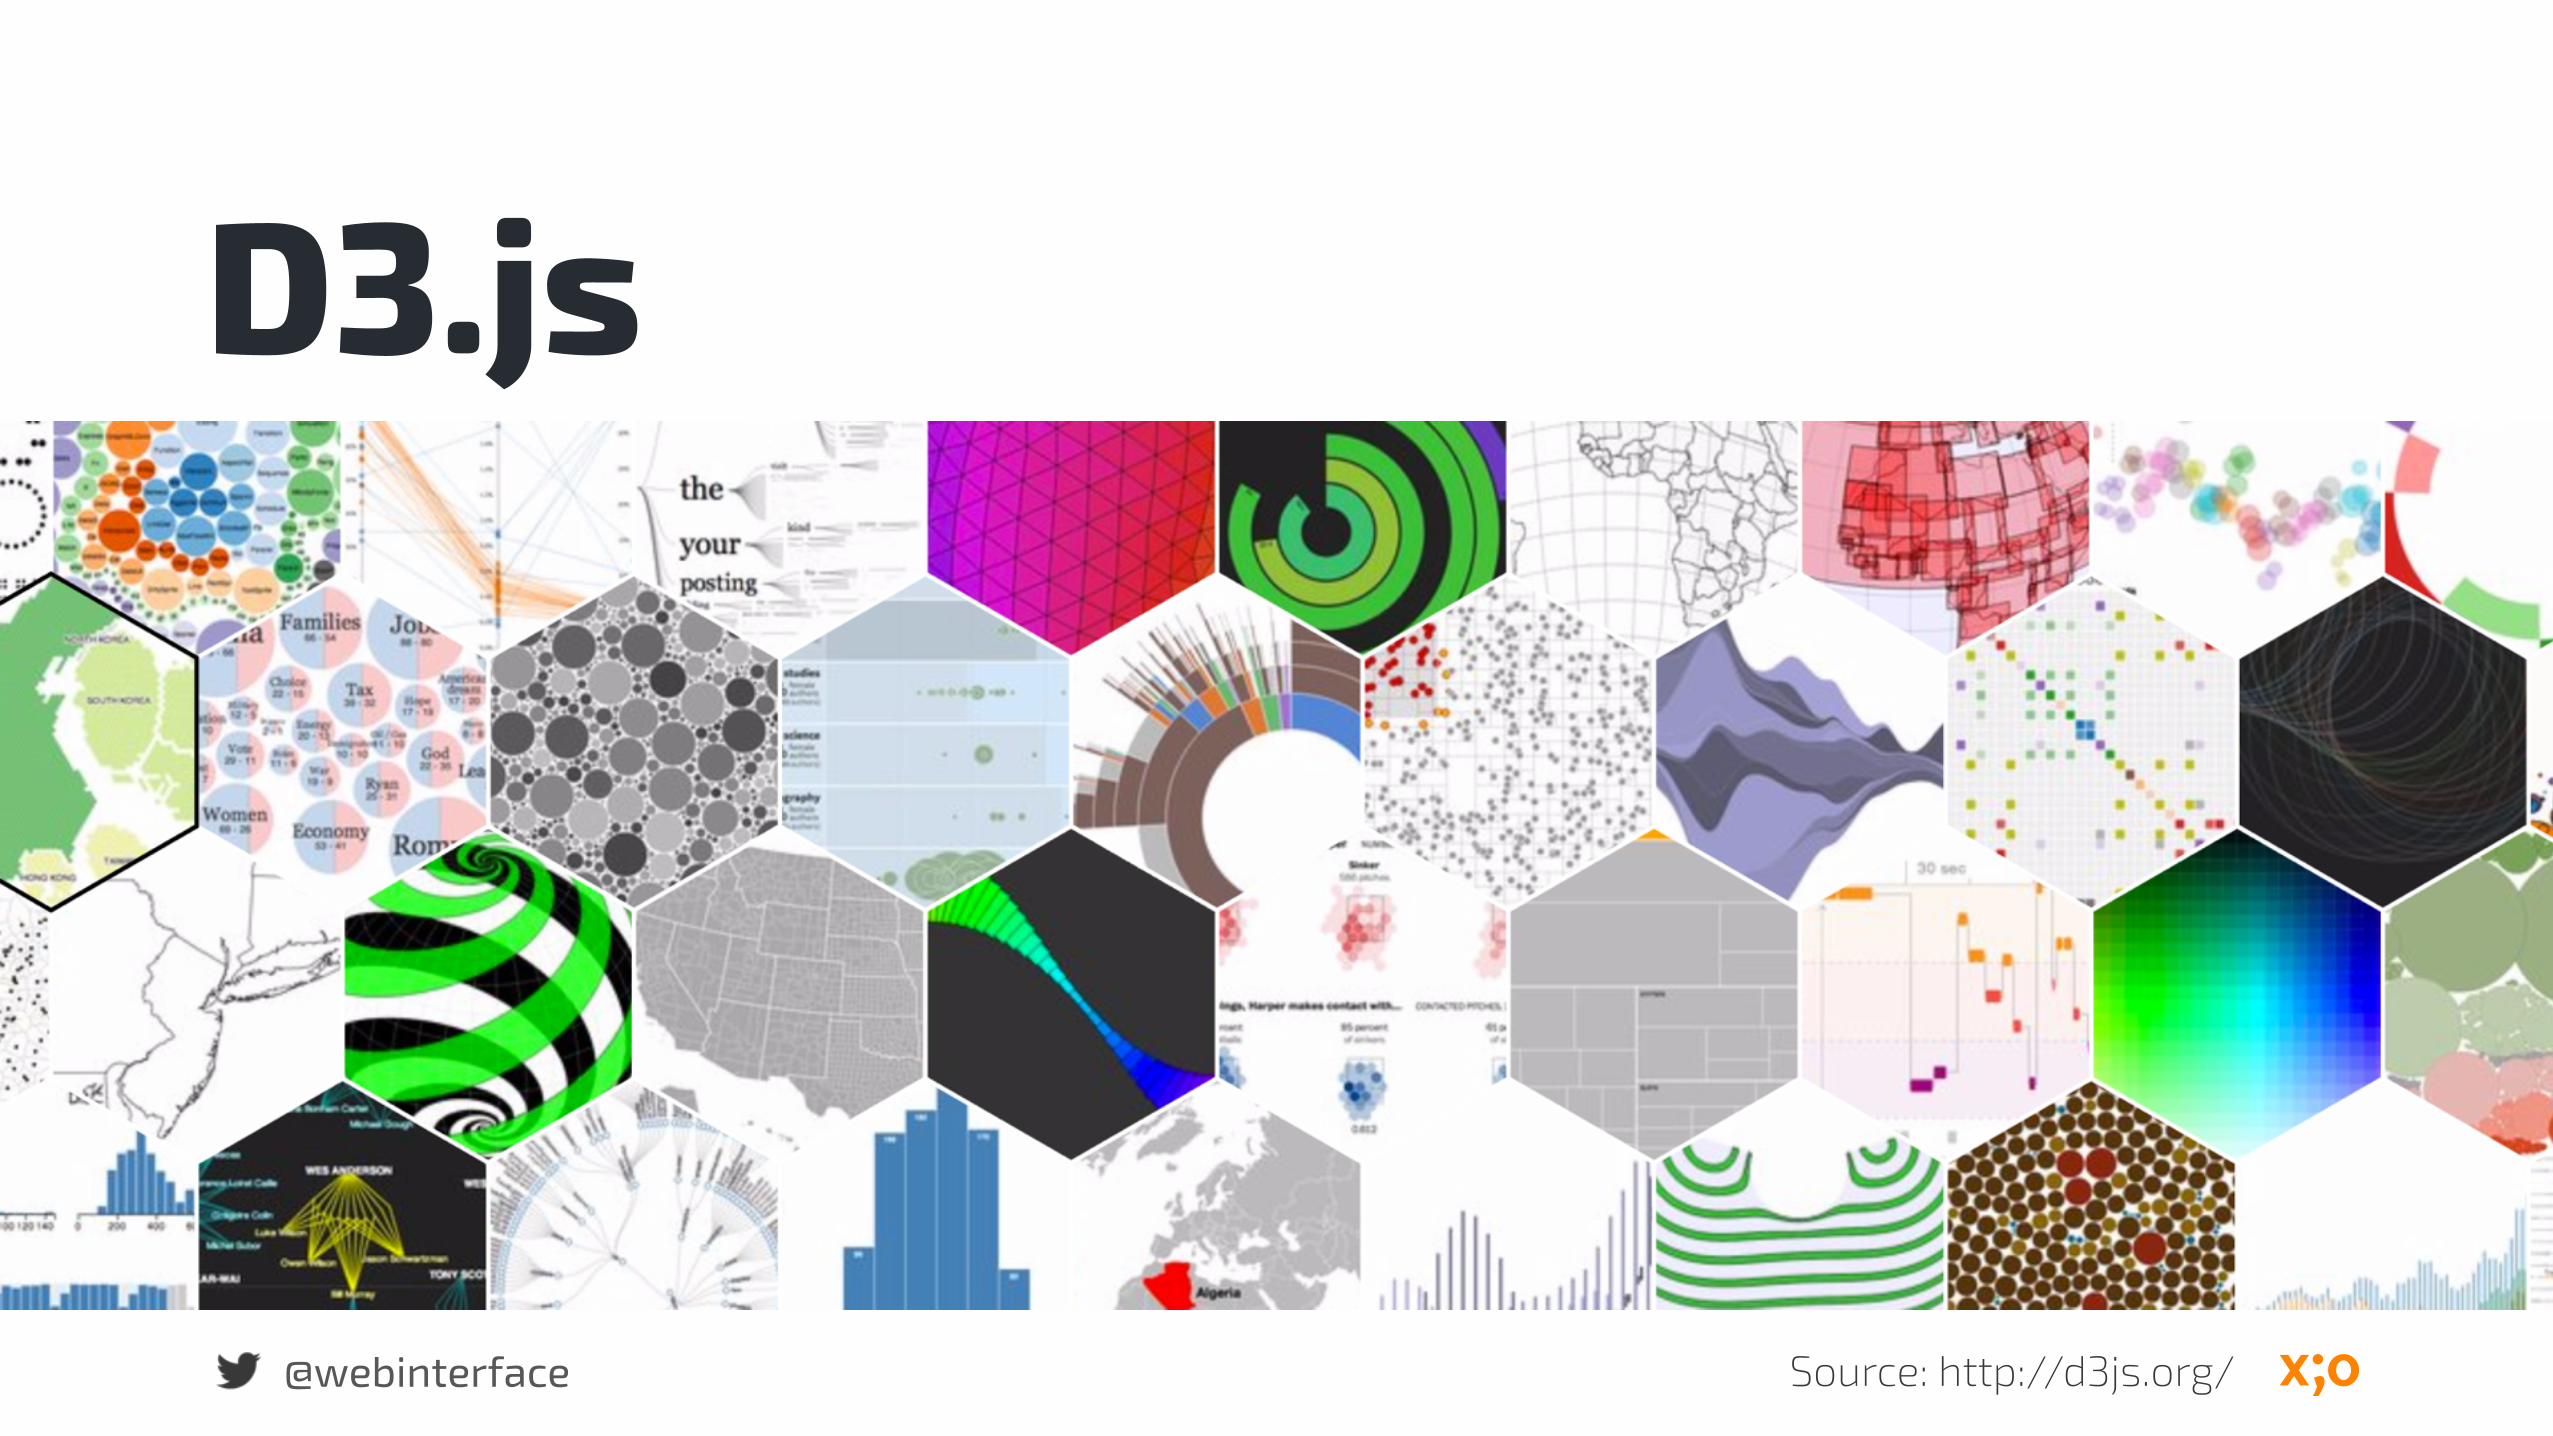
JavaScript library for manipulating documents based on data.Using HTML, SVG, and CSS, CSS3 Transitions.
Emphasis on web standards.
Full capabilities of modern browsers.

@webinterface
D3 is tested
IE 9+
„…so if your browser doesn't support standards, you're out of luck. Sorry!“
@webinterface
D3 documentation
Source: https://github.com/mbostock/d3/wiki
@webinterface
@webinterface
@webinterface
HTML 5 basedSimple and flexibleResponsiveModularInteractive
@webinterface
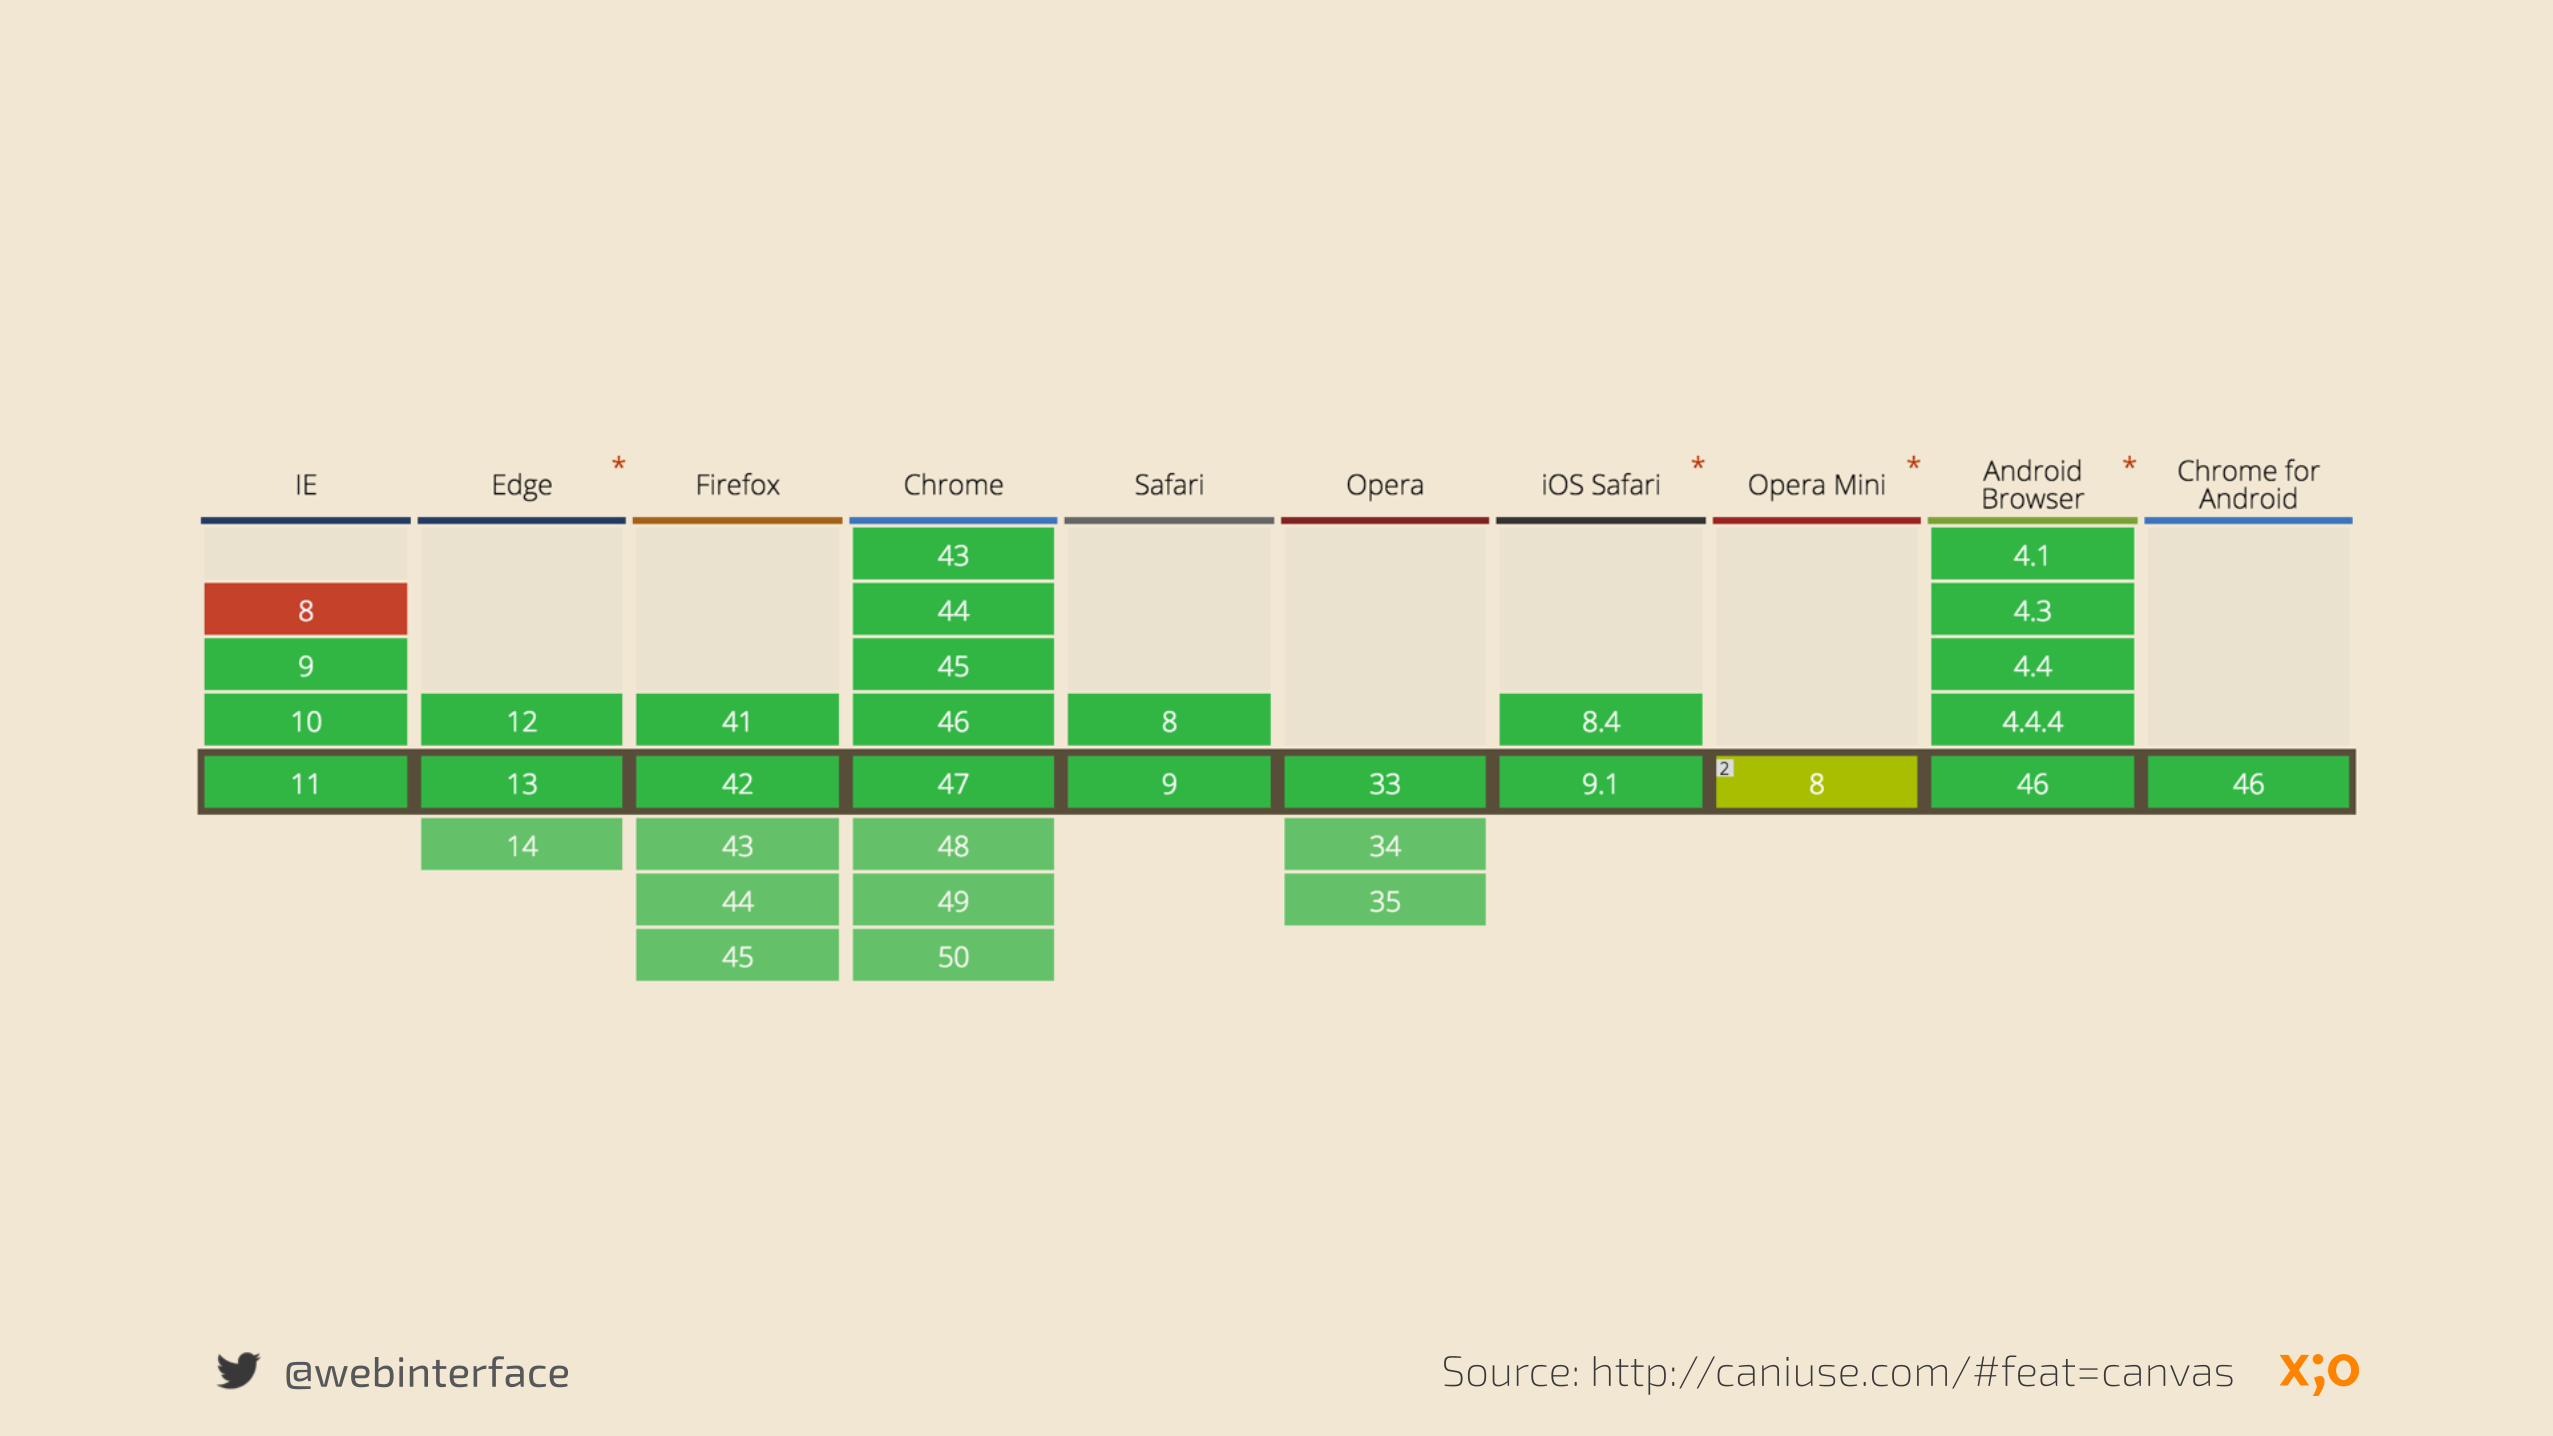
Browser support for the canvas element is available in all modern & major mobile browsers.
@webinterface
All six core chart types are only 11.01kb when minified.
@webinterface
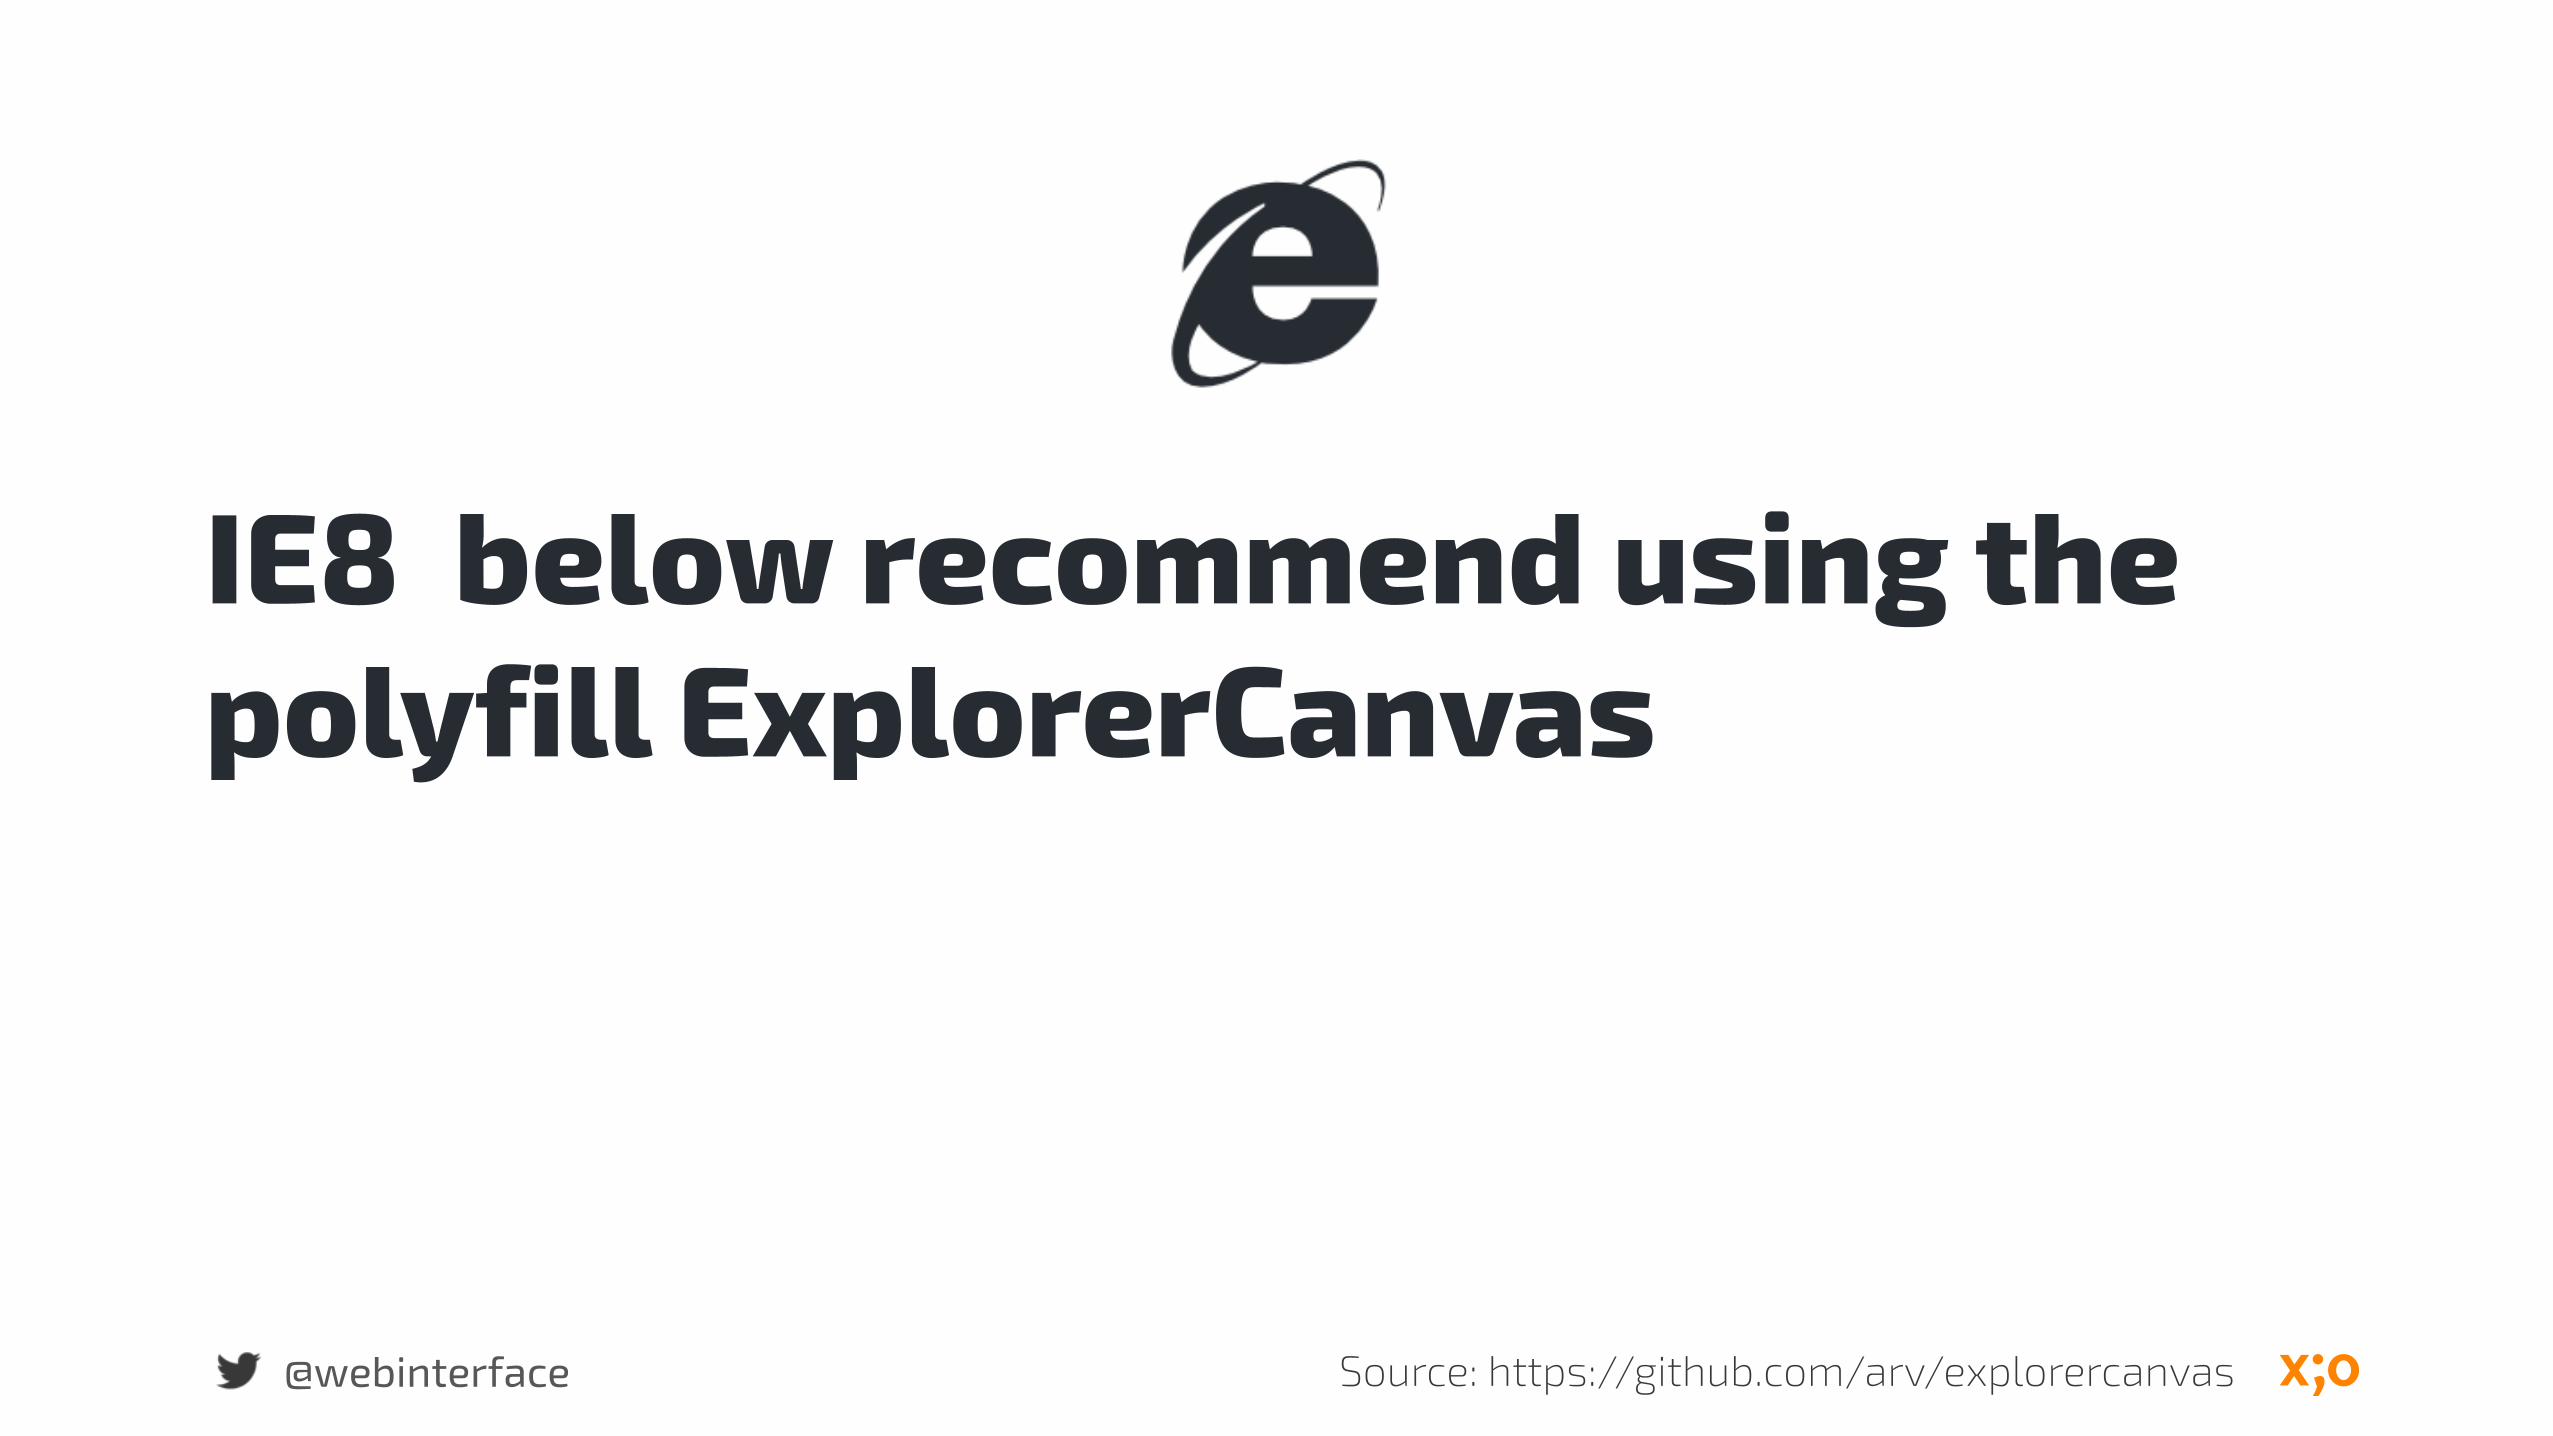
IE8 below recommend using the polyfill ExplorerCanvas
Source: https://github.com/arv/explorercanvas
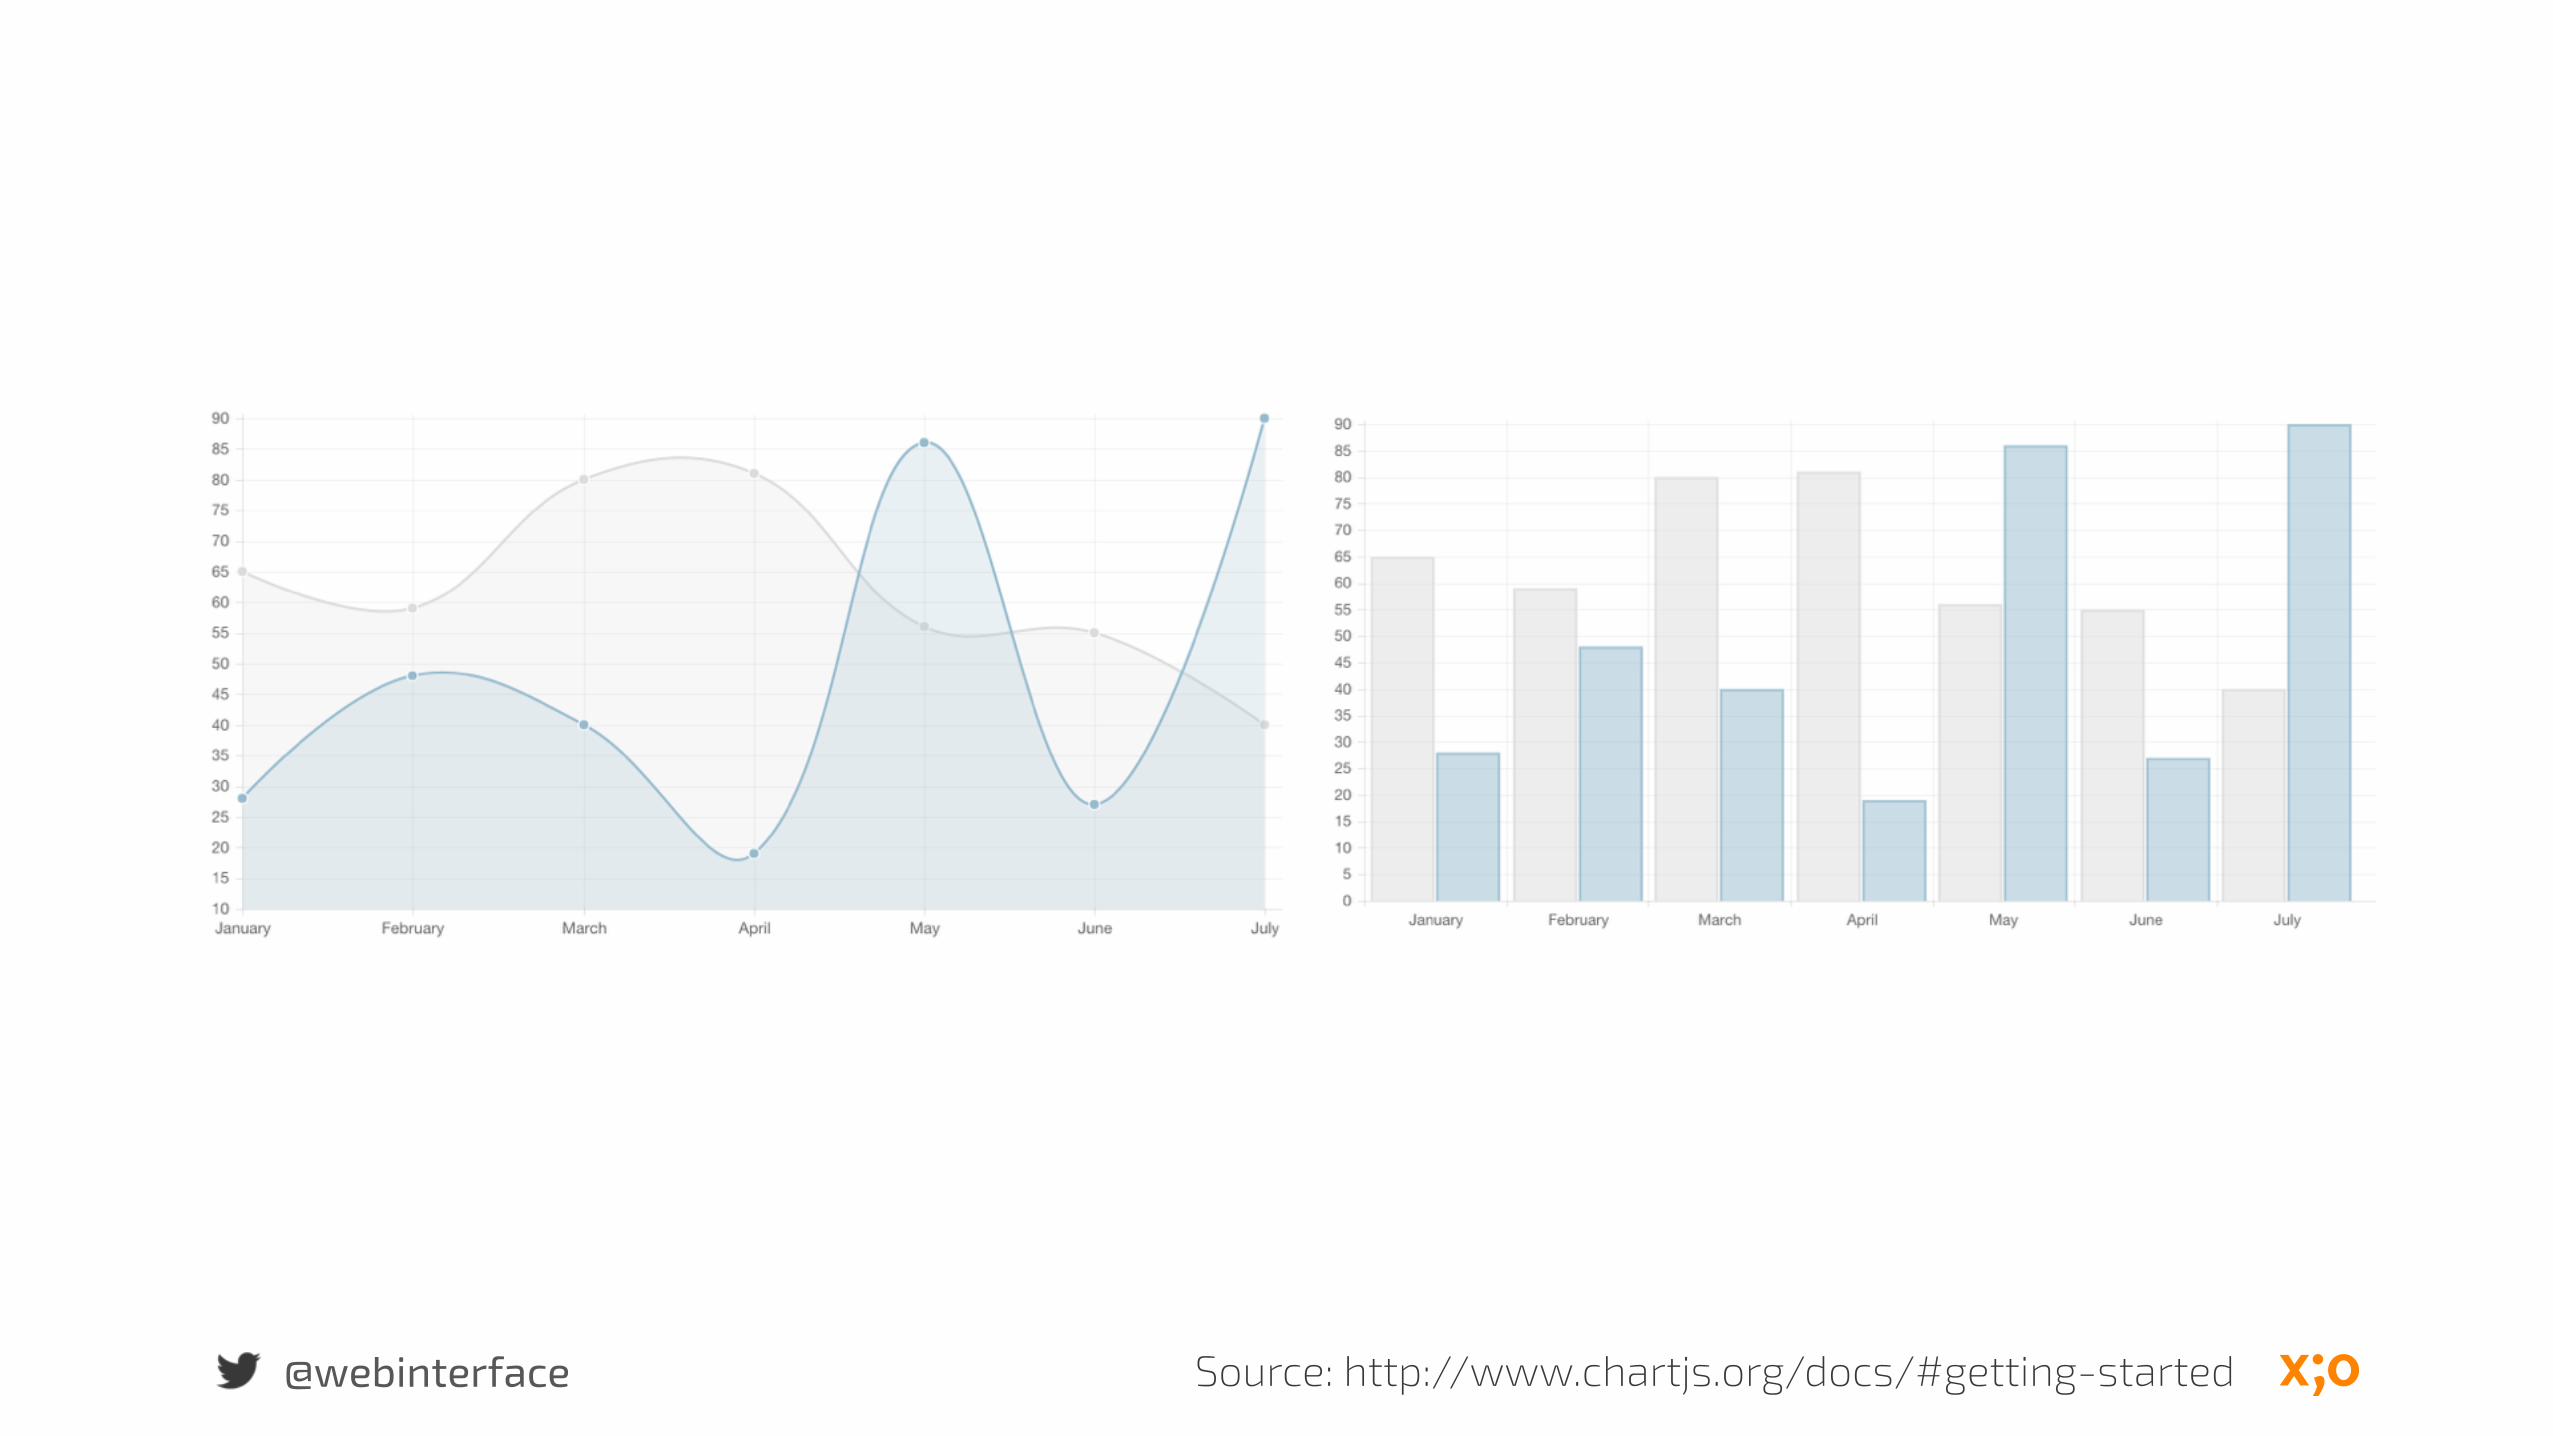
@webinterface Source: http://www.chartjs.org/docs/#getting-started
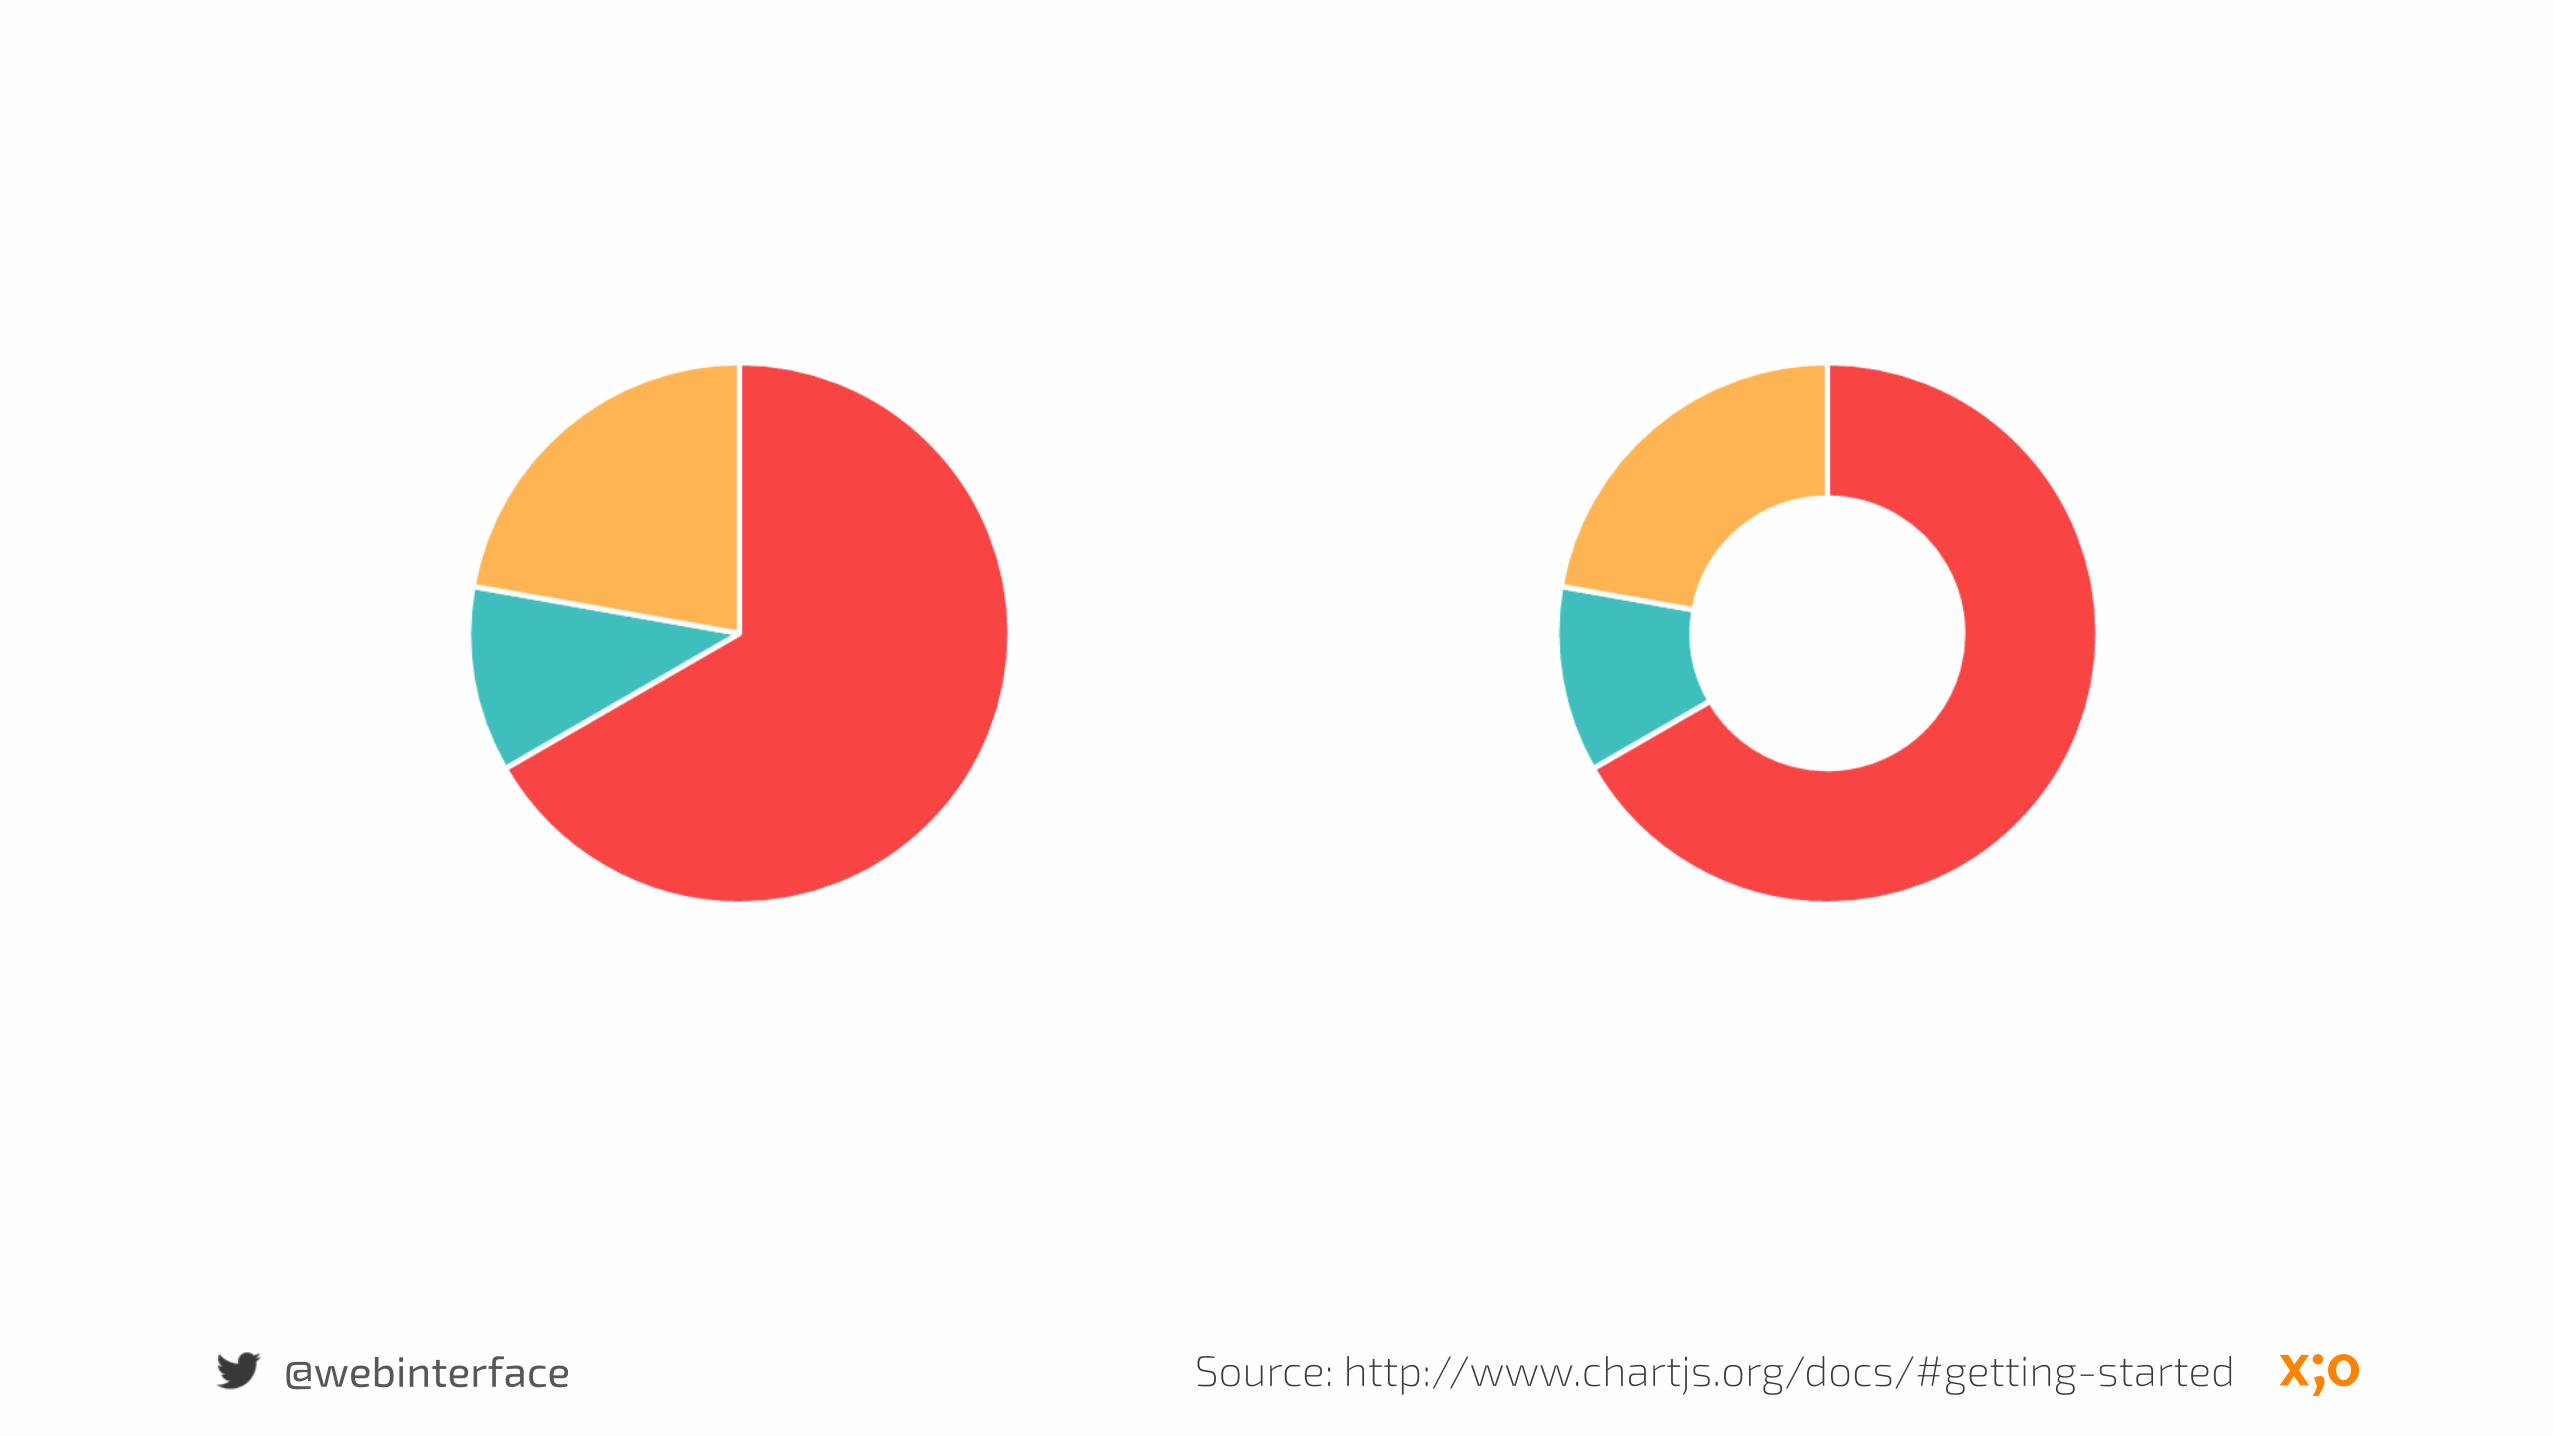
@webinterface Source: http://www.chartjs.org/docs/#getting-started
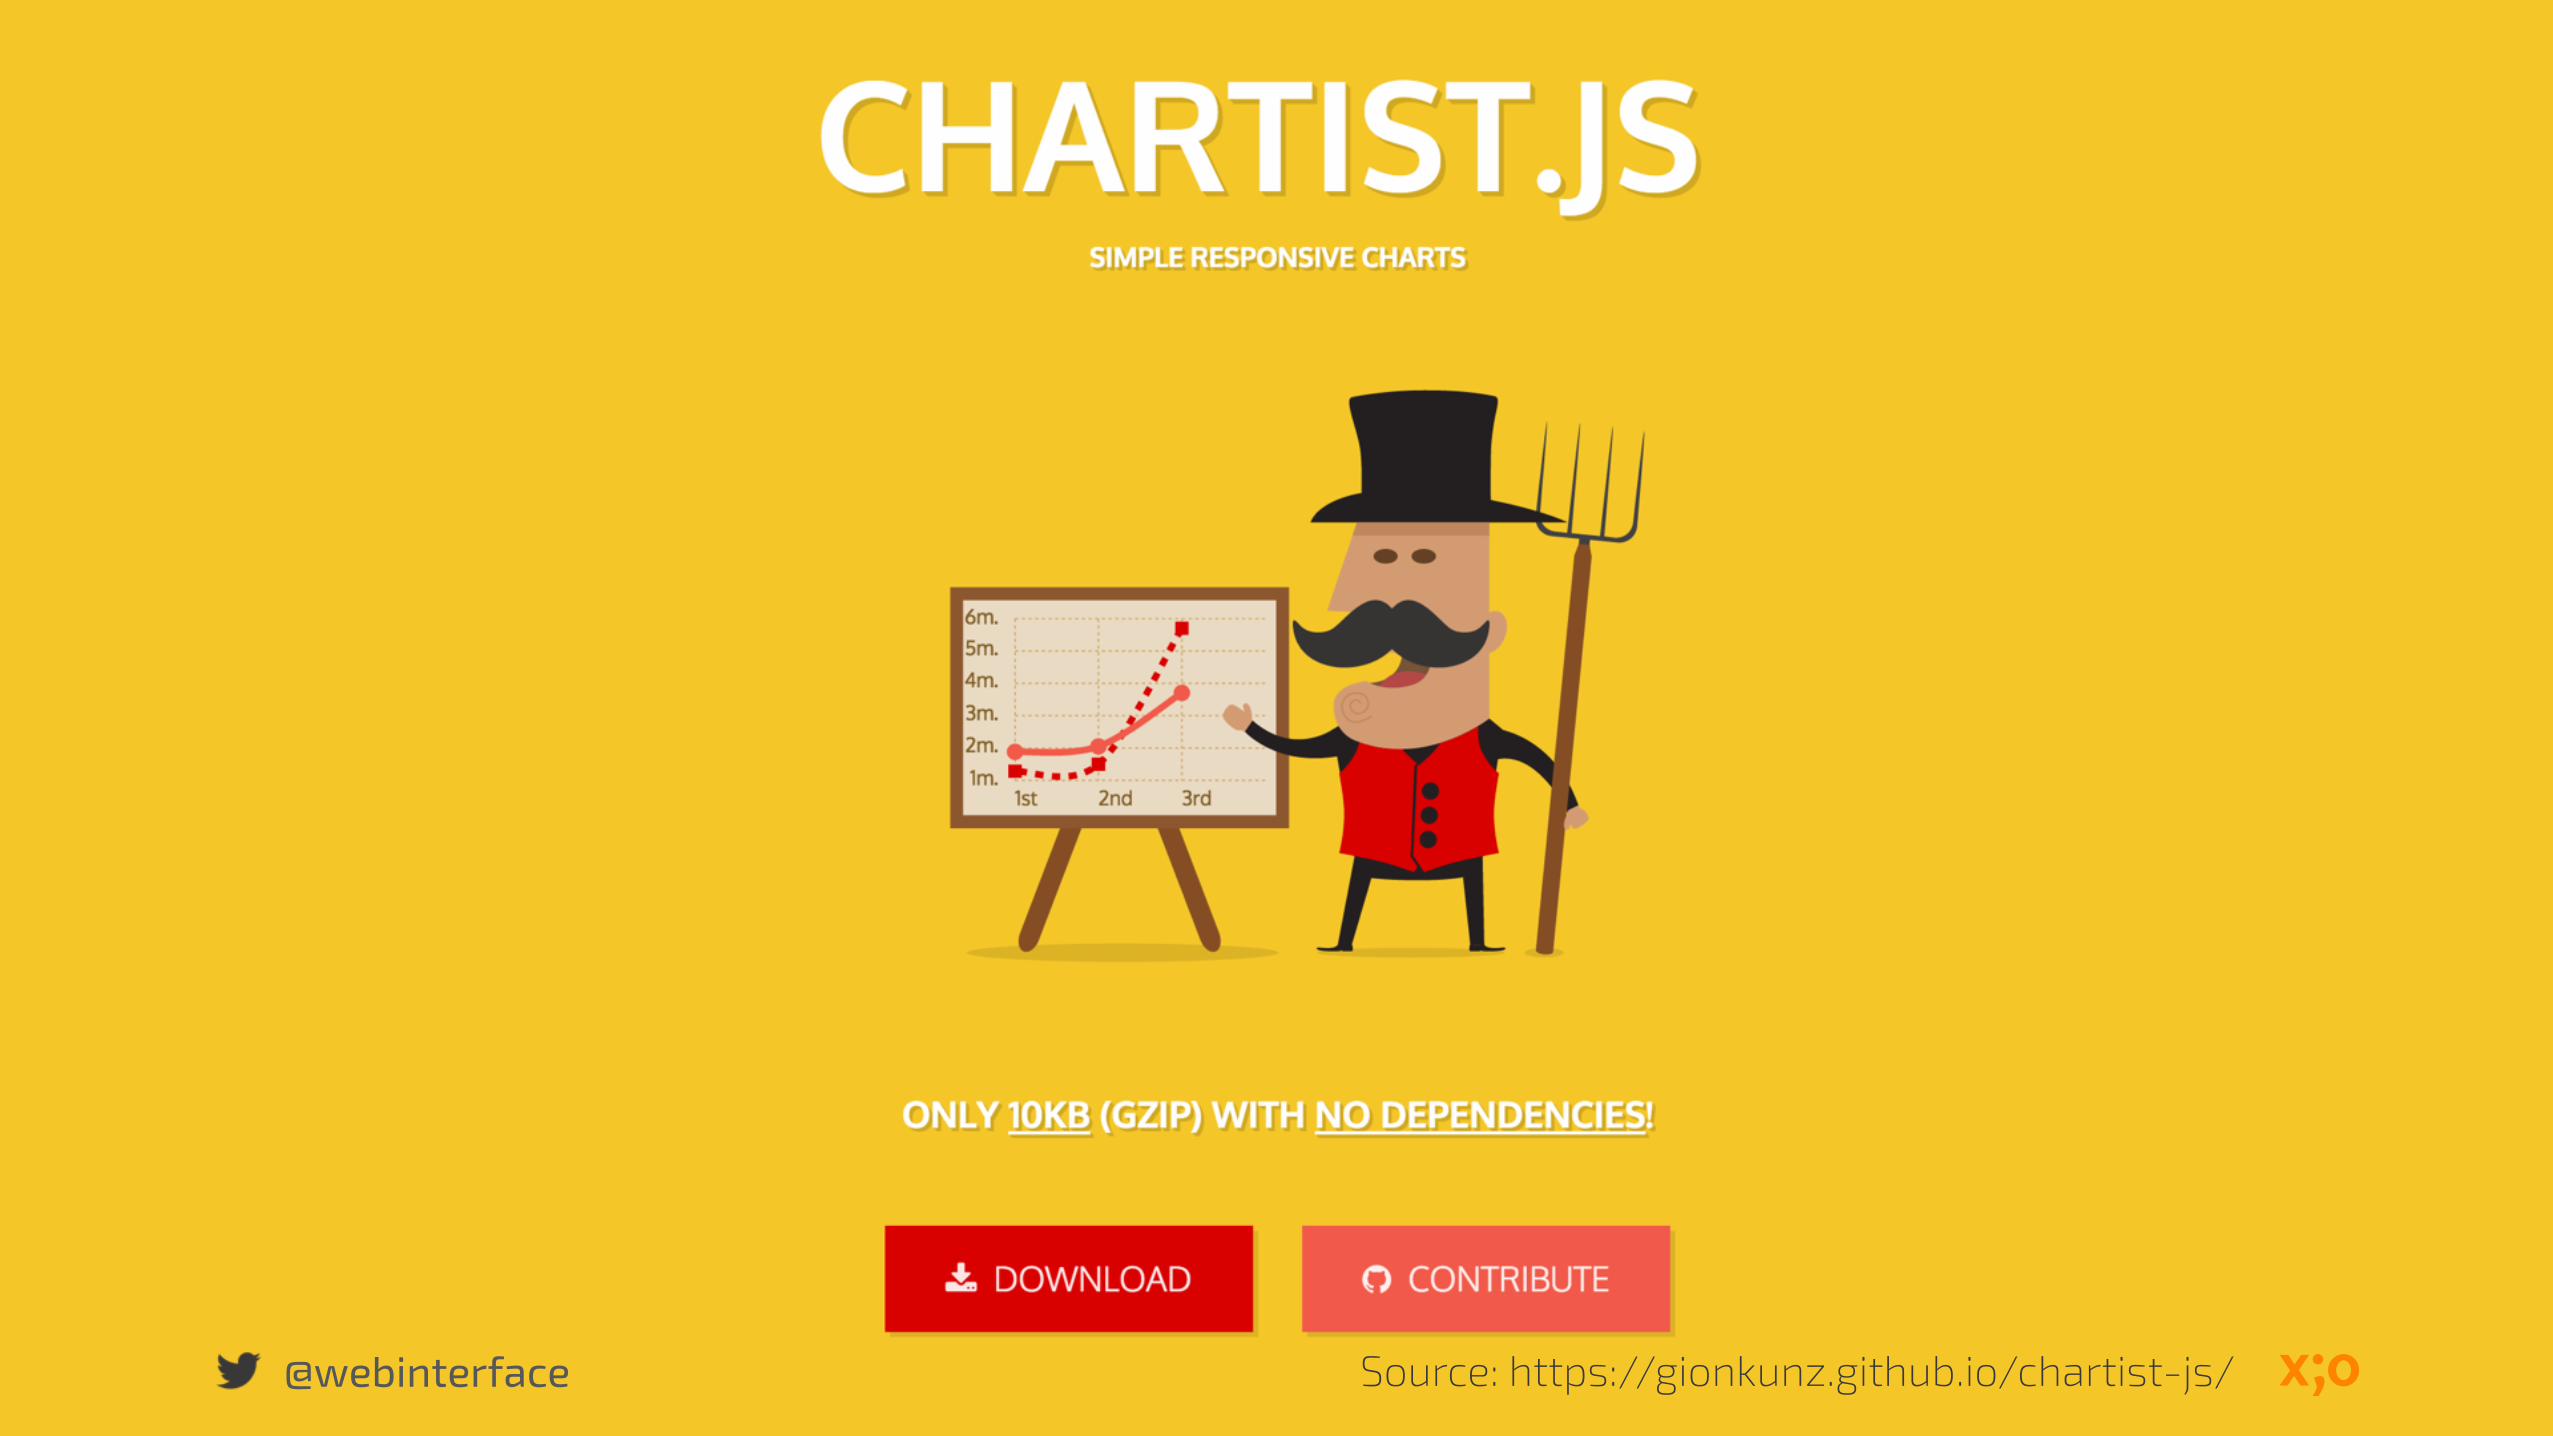
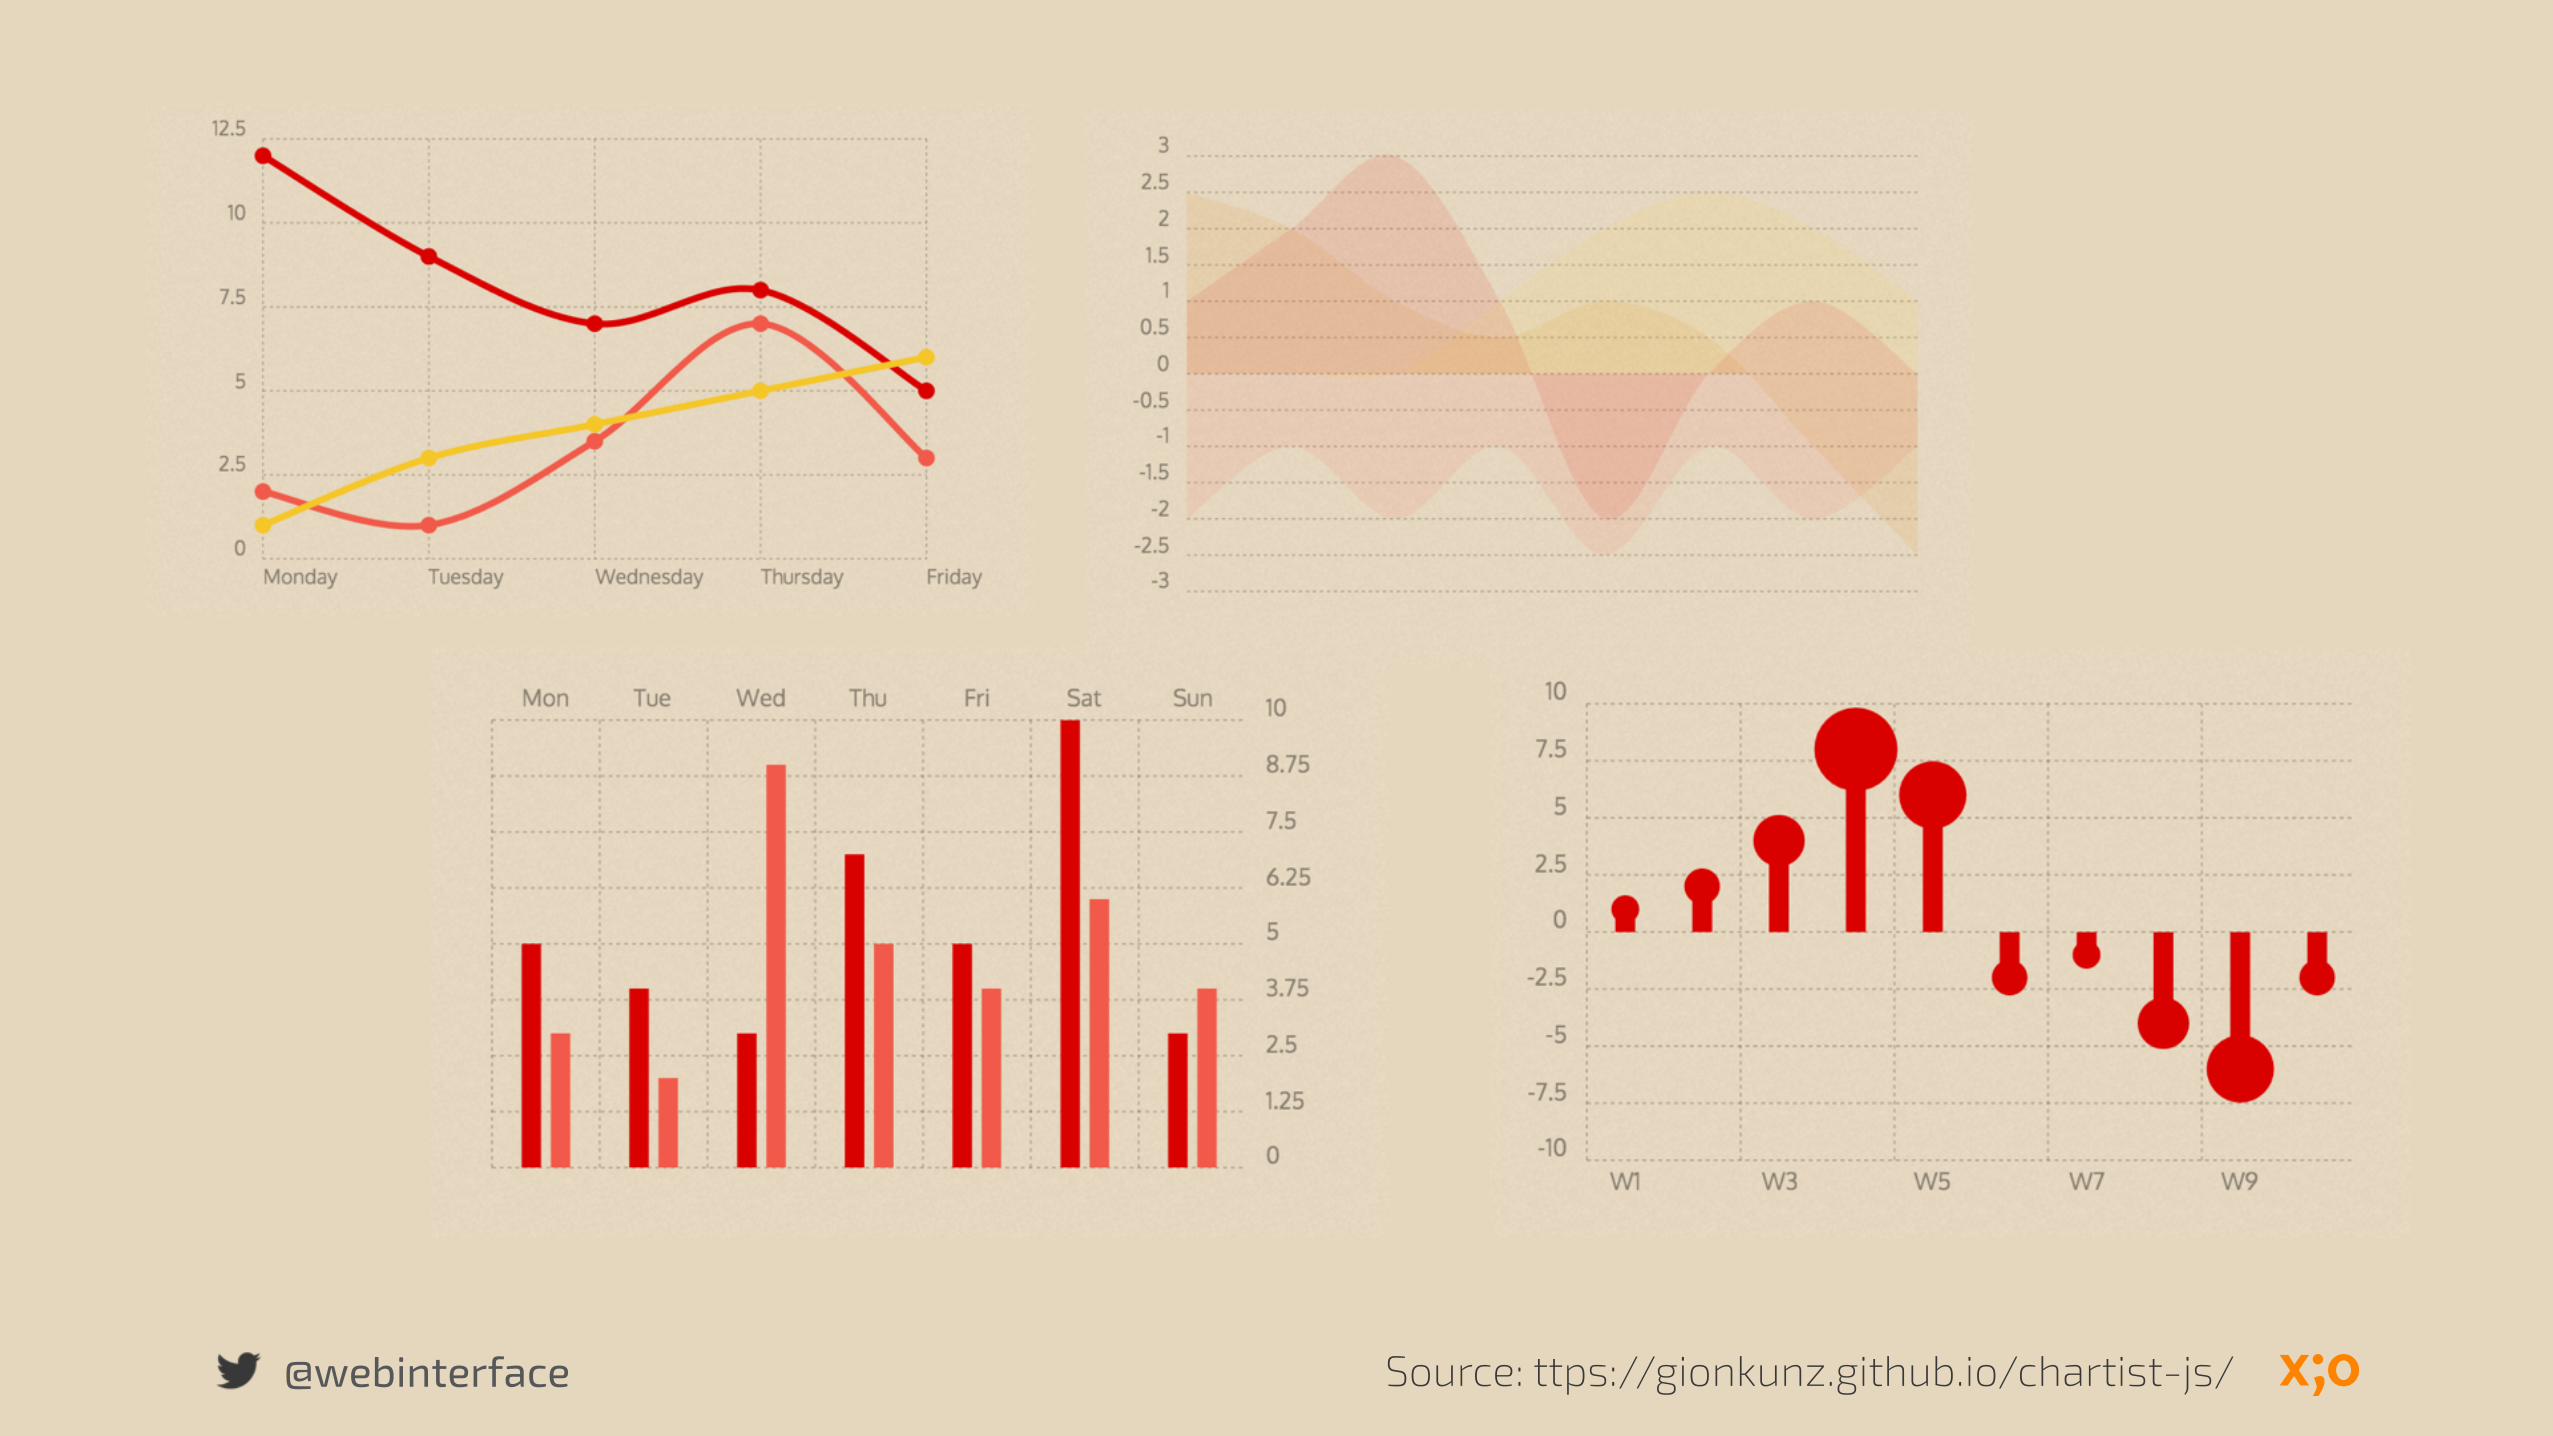
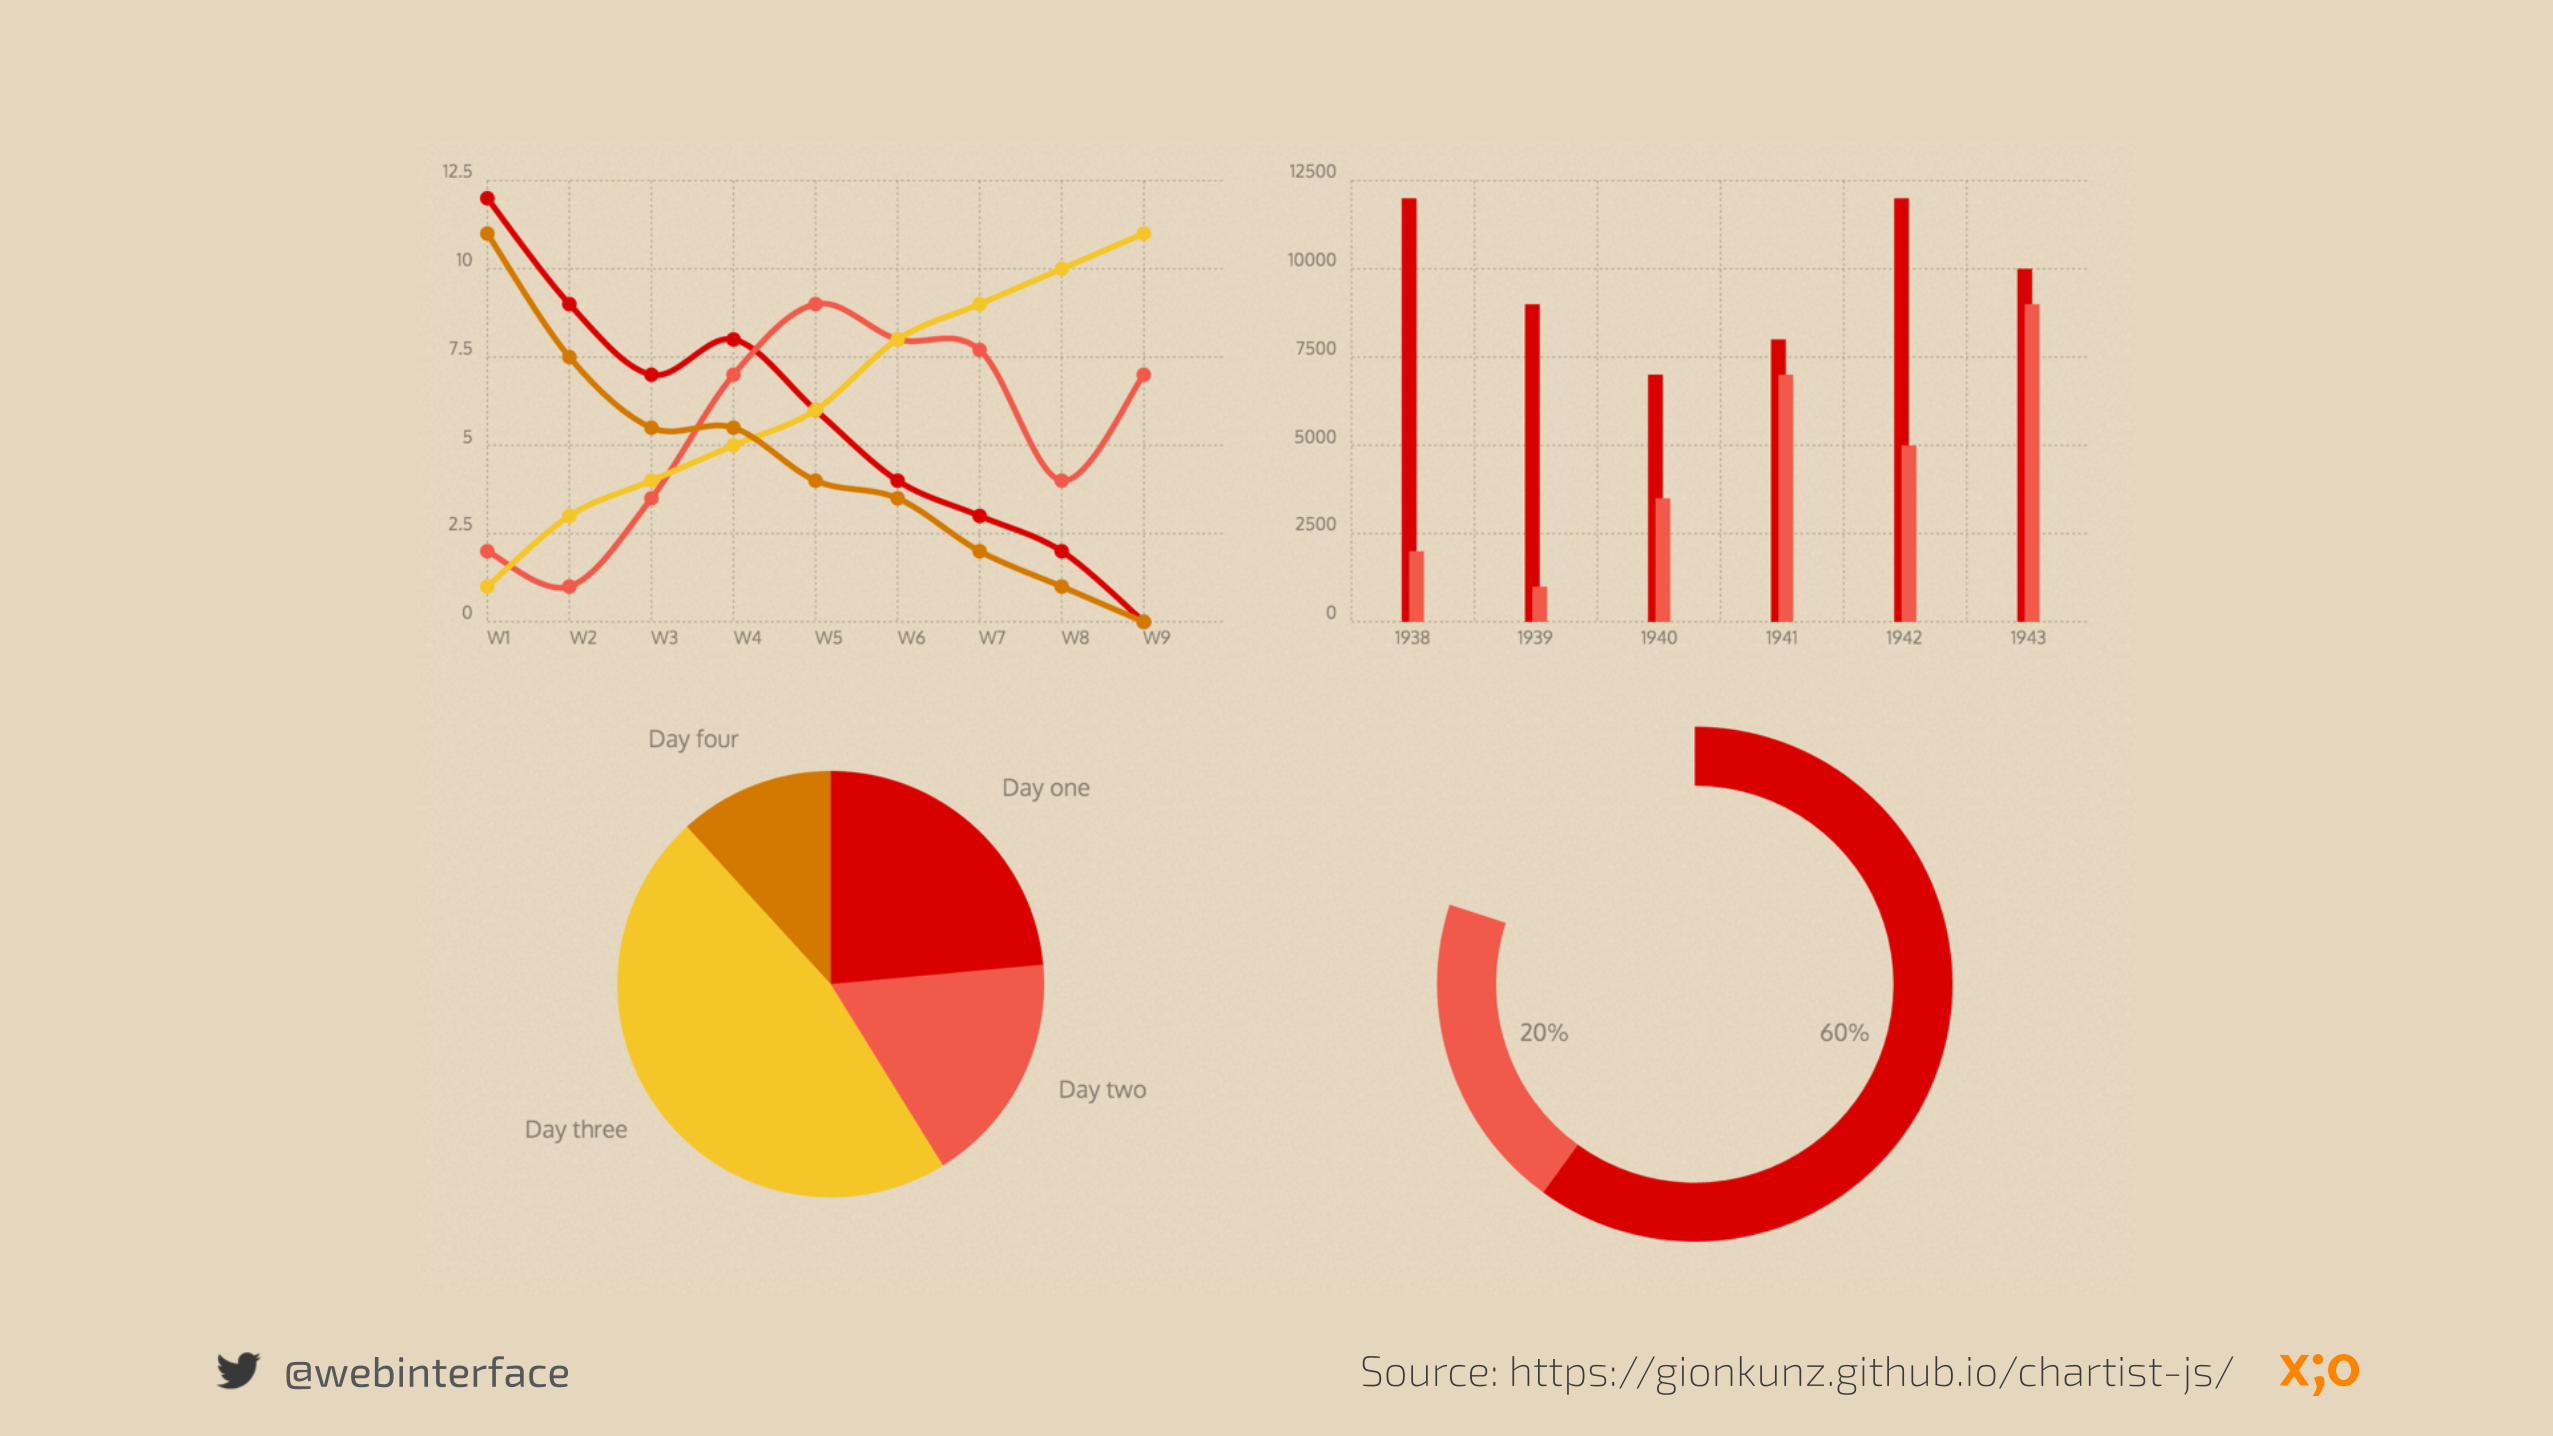
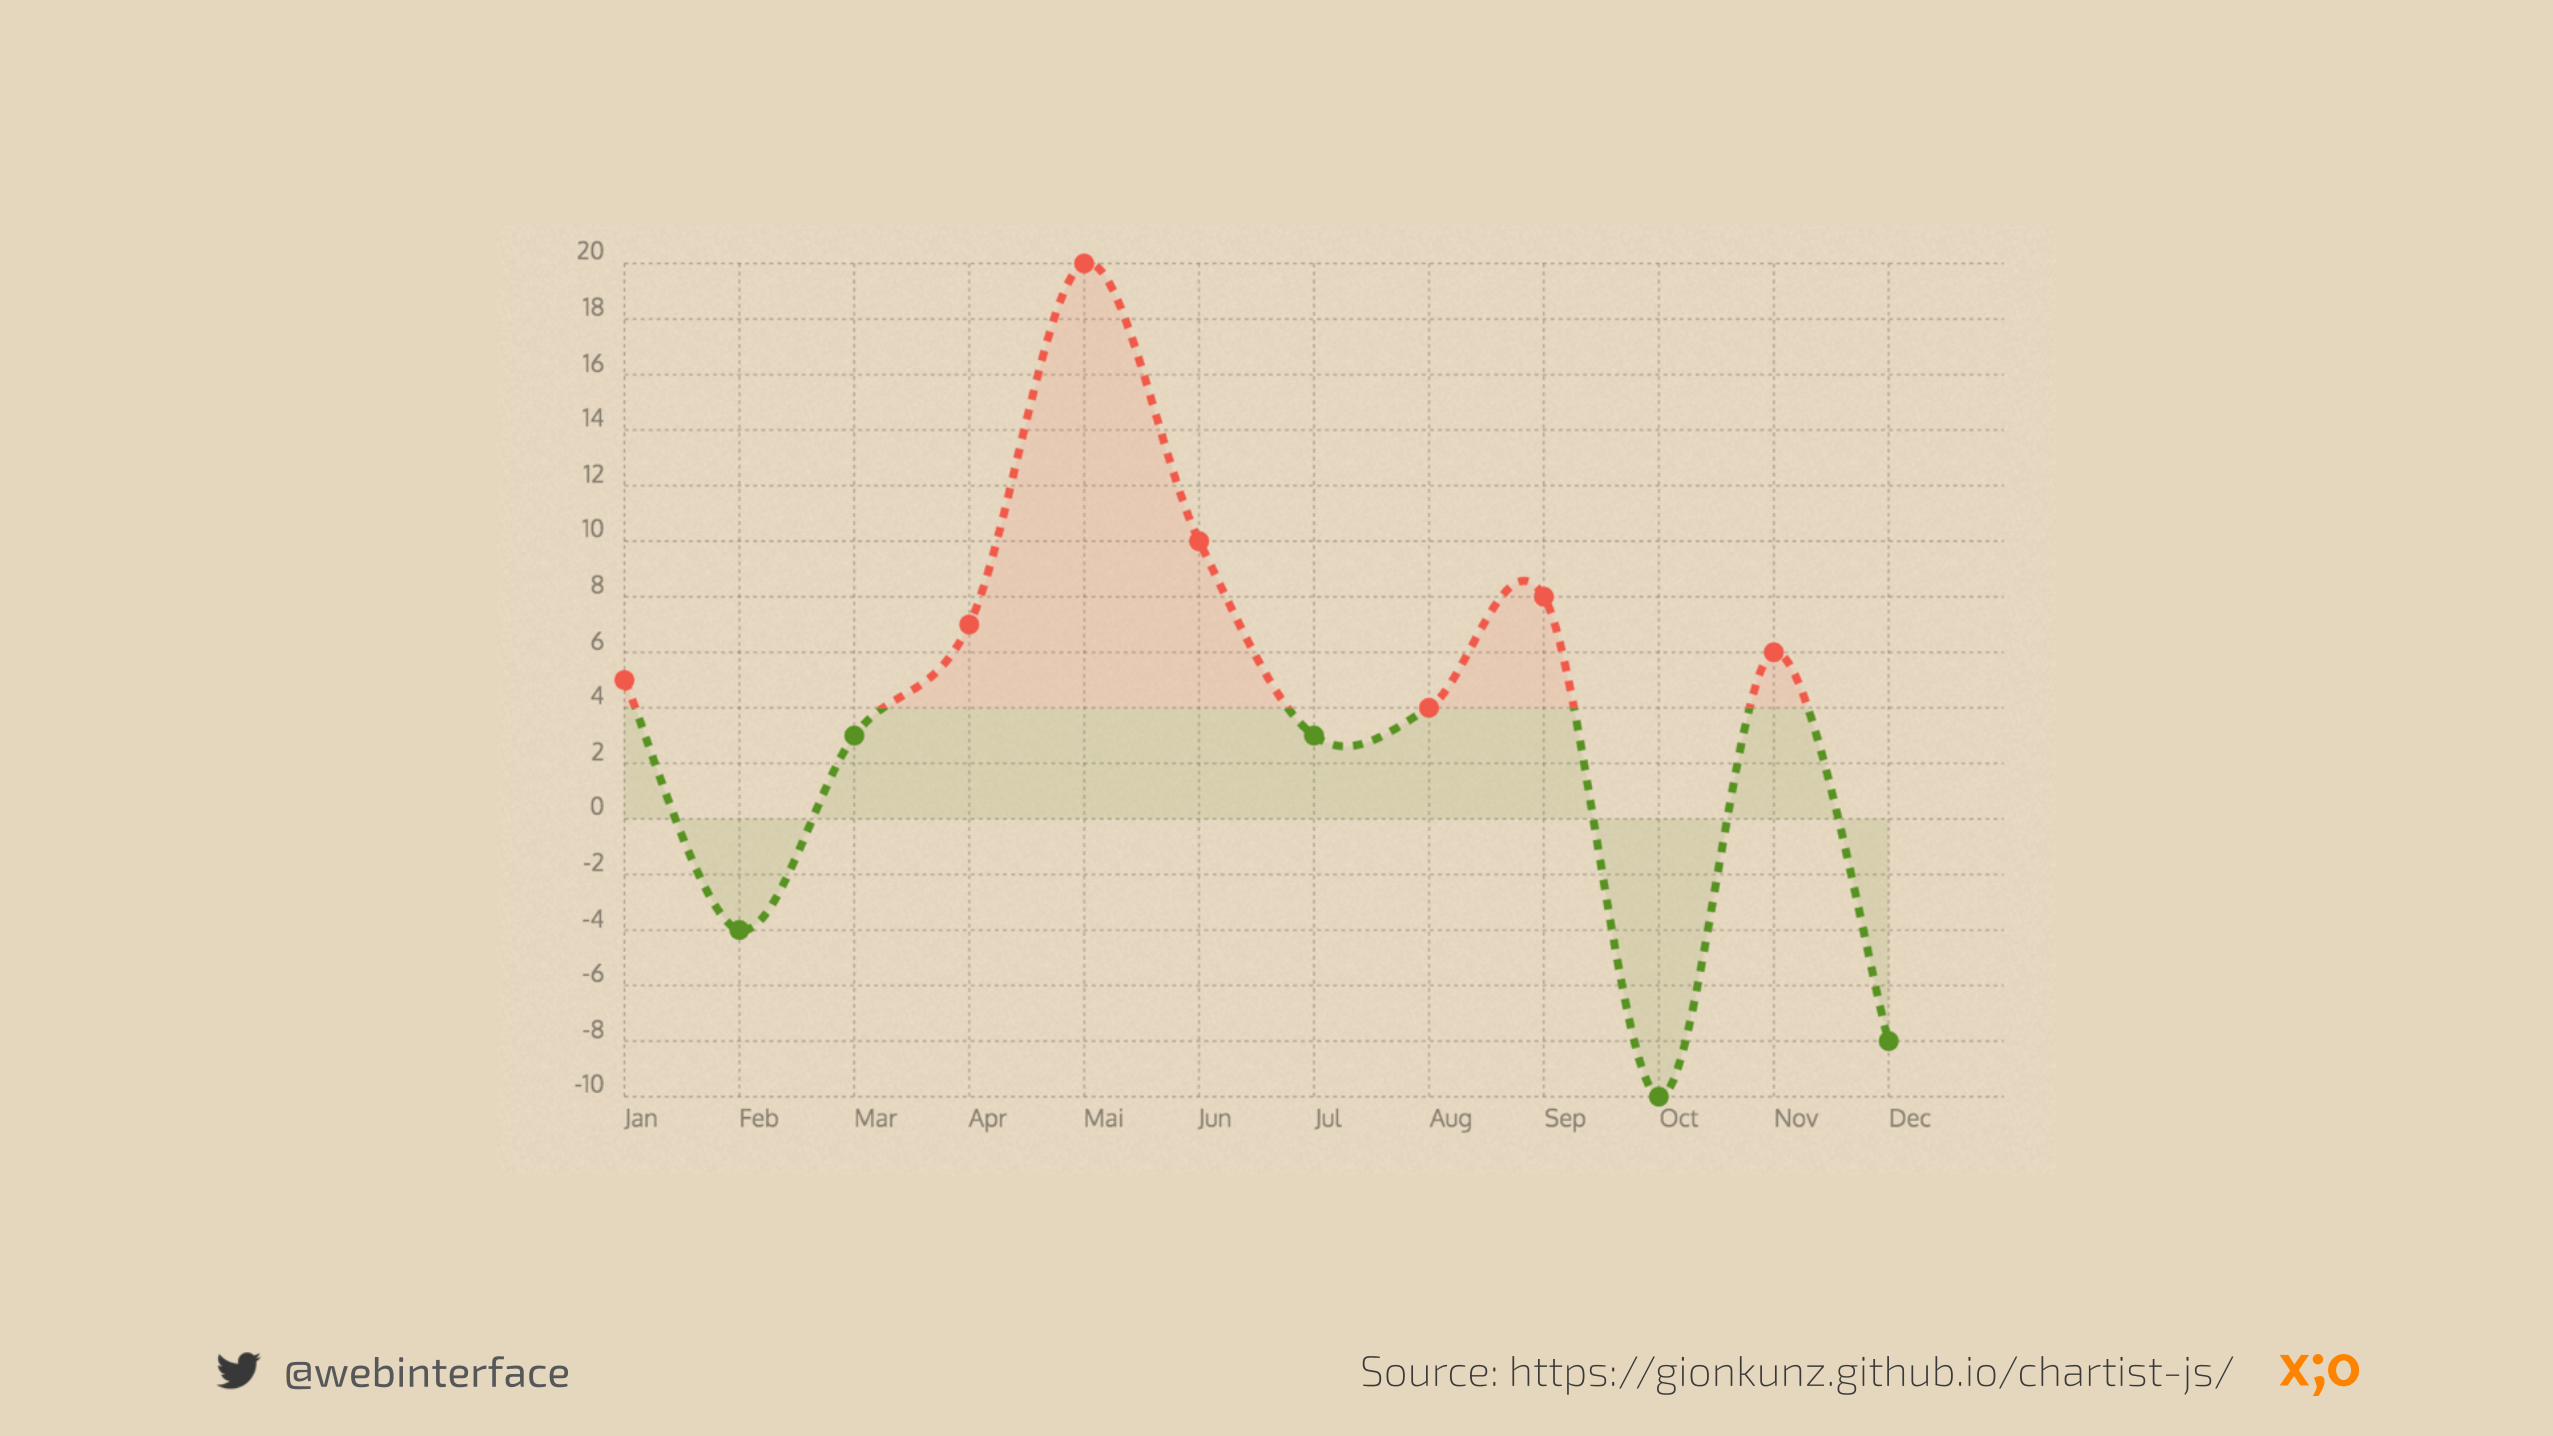
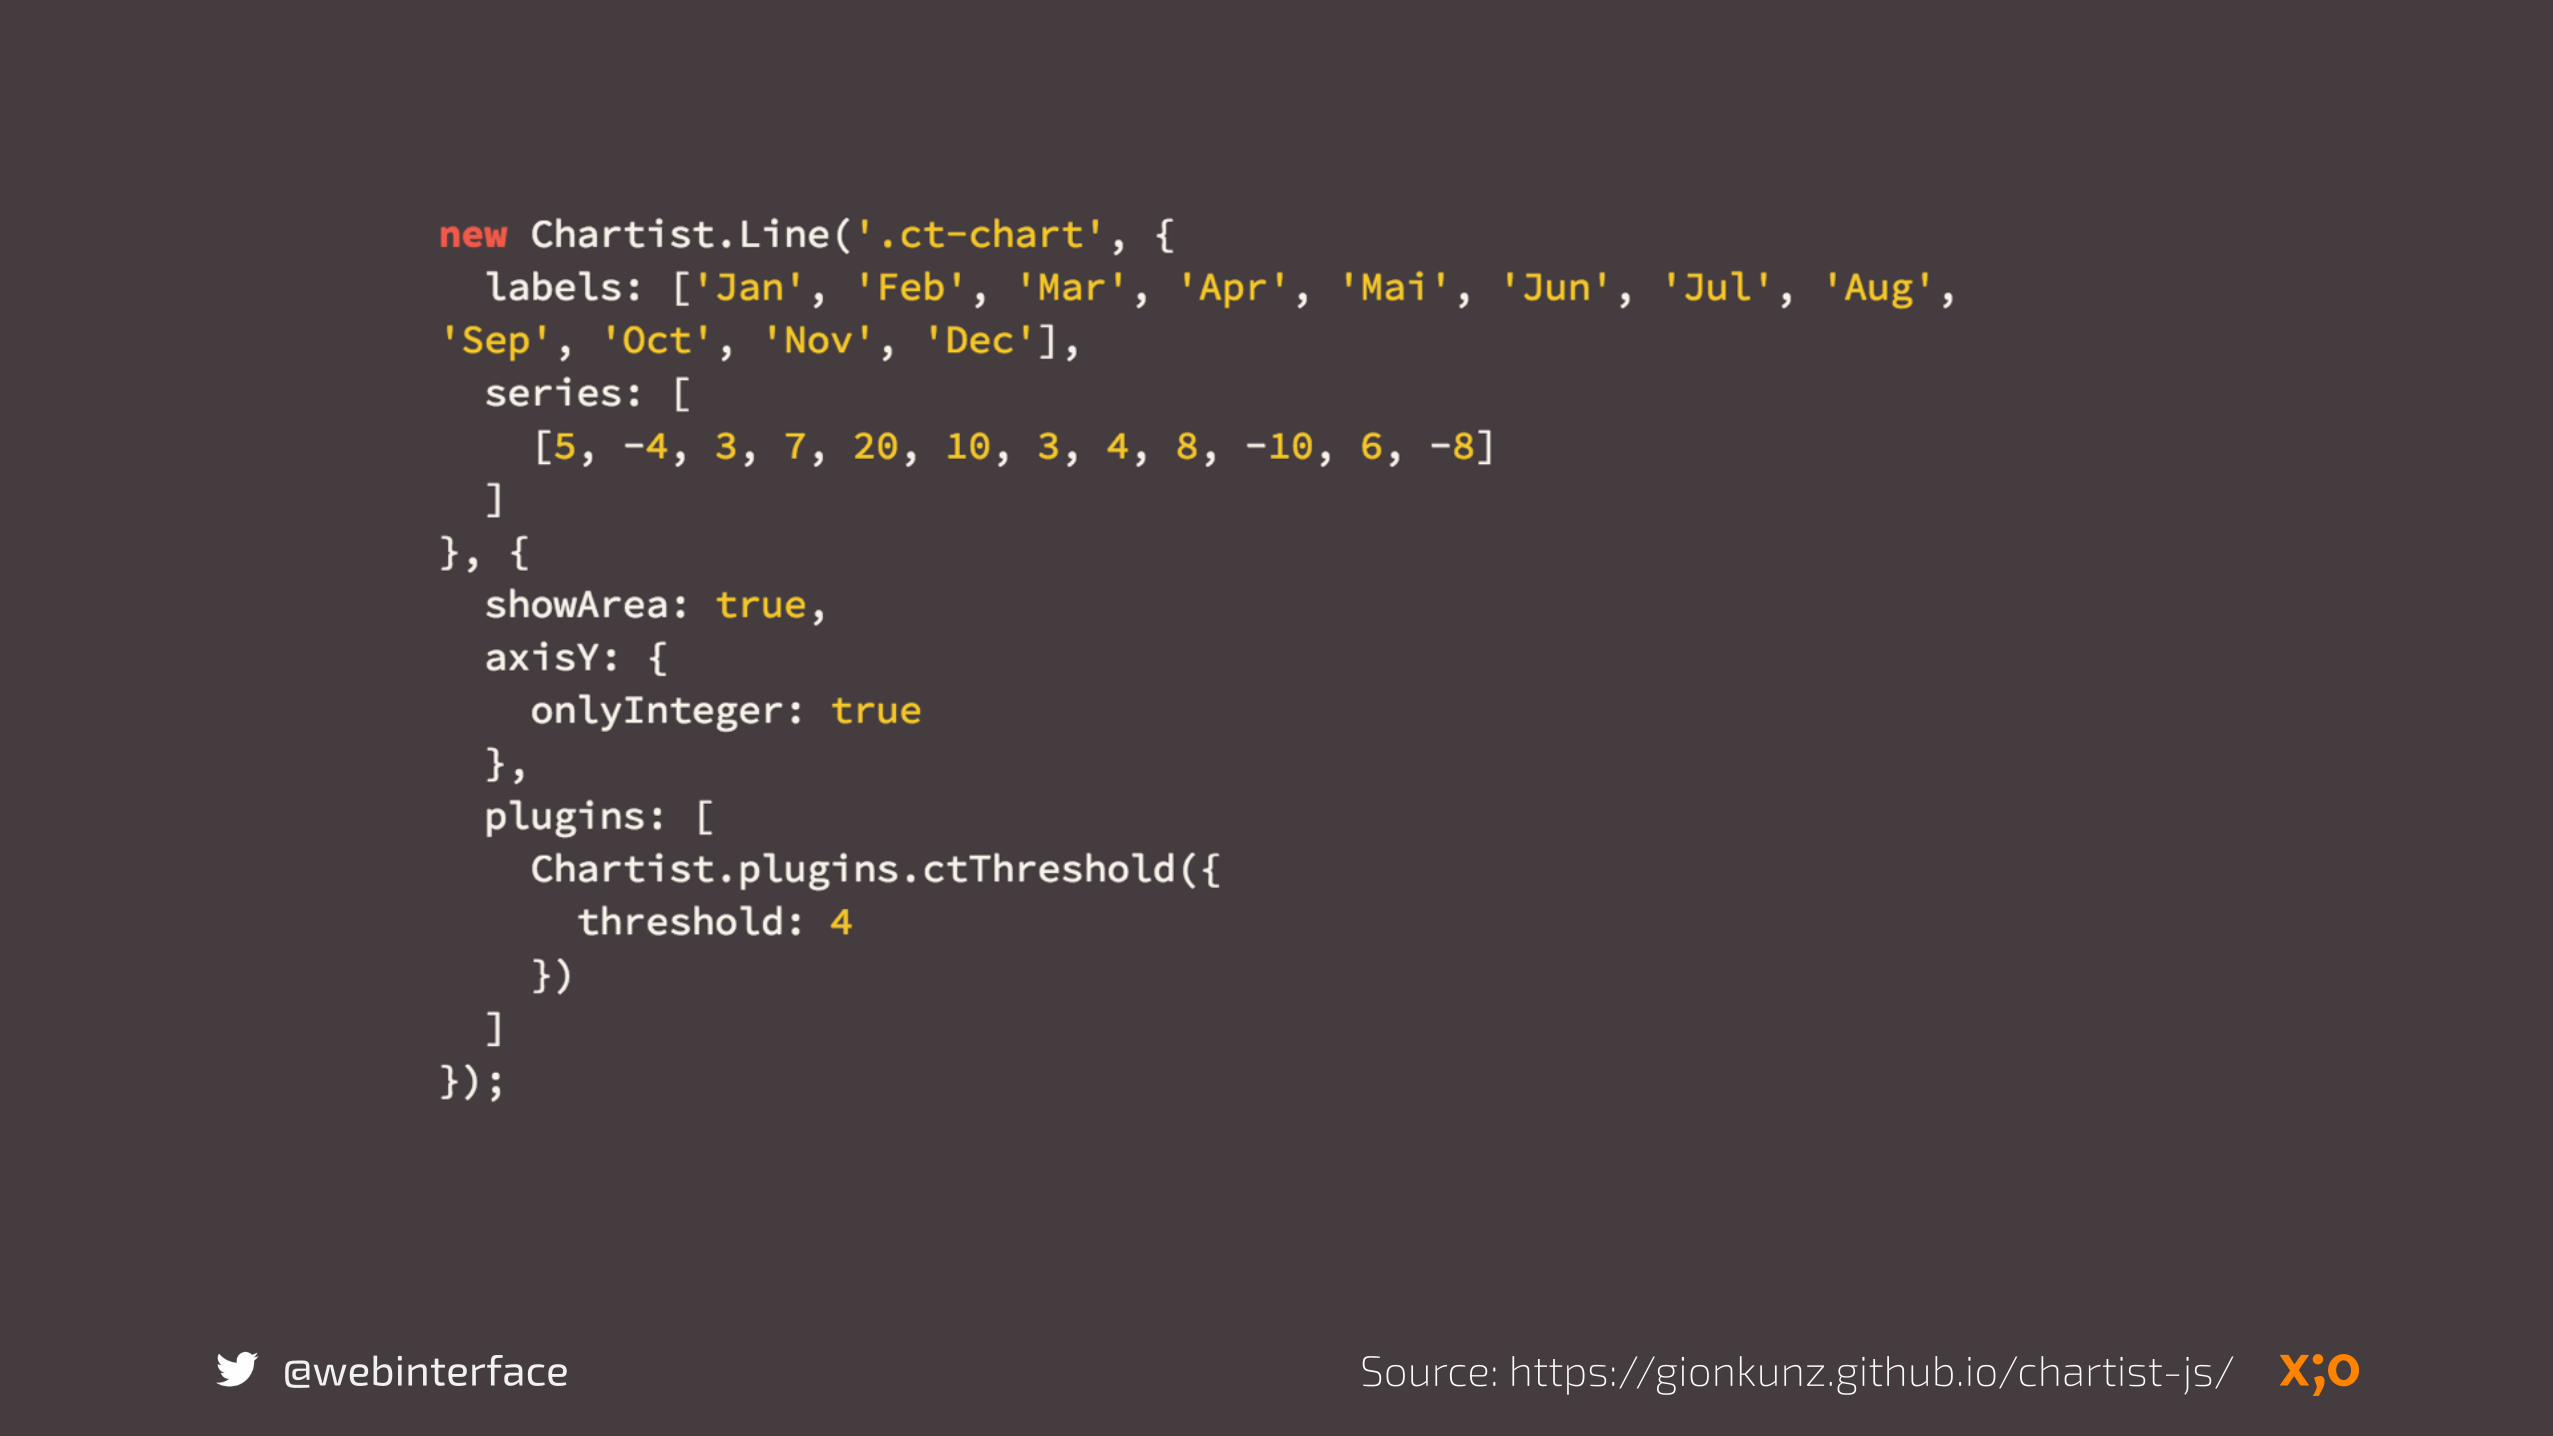
@webinterface Source: https://gionkunz.github.io/chartist-js/
@webinterface Source: https://gionkunz.github.io/chartist-js/
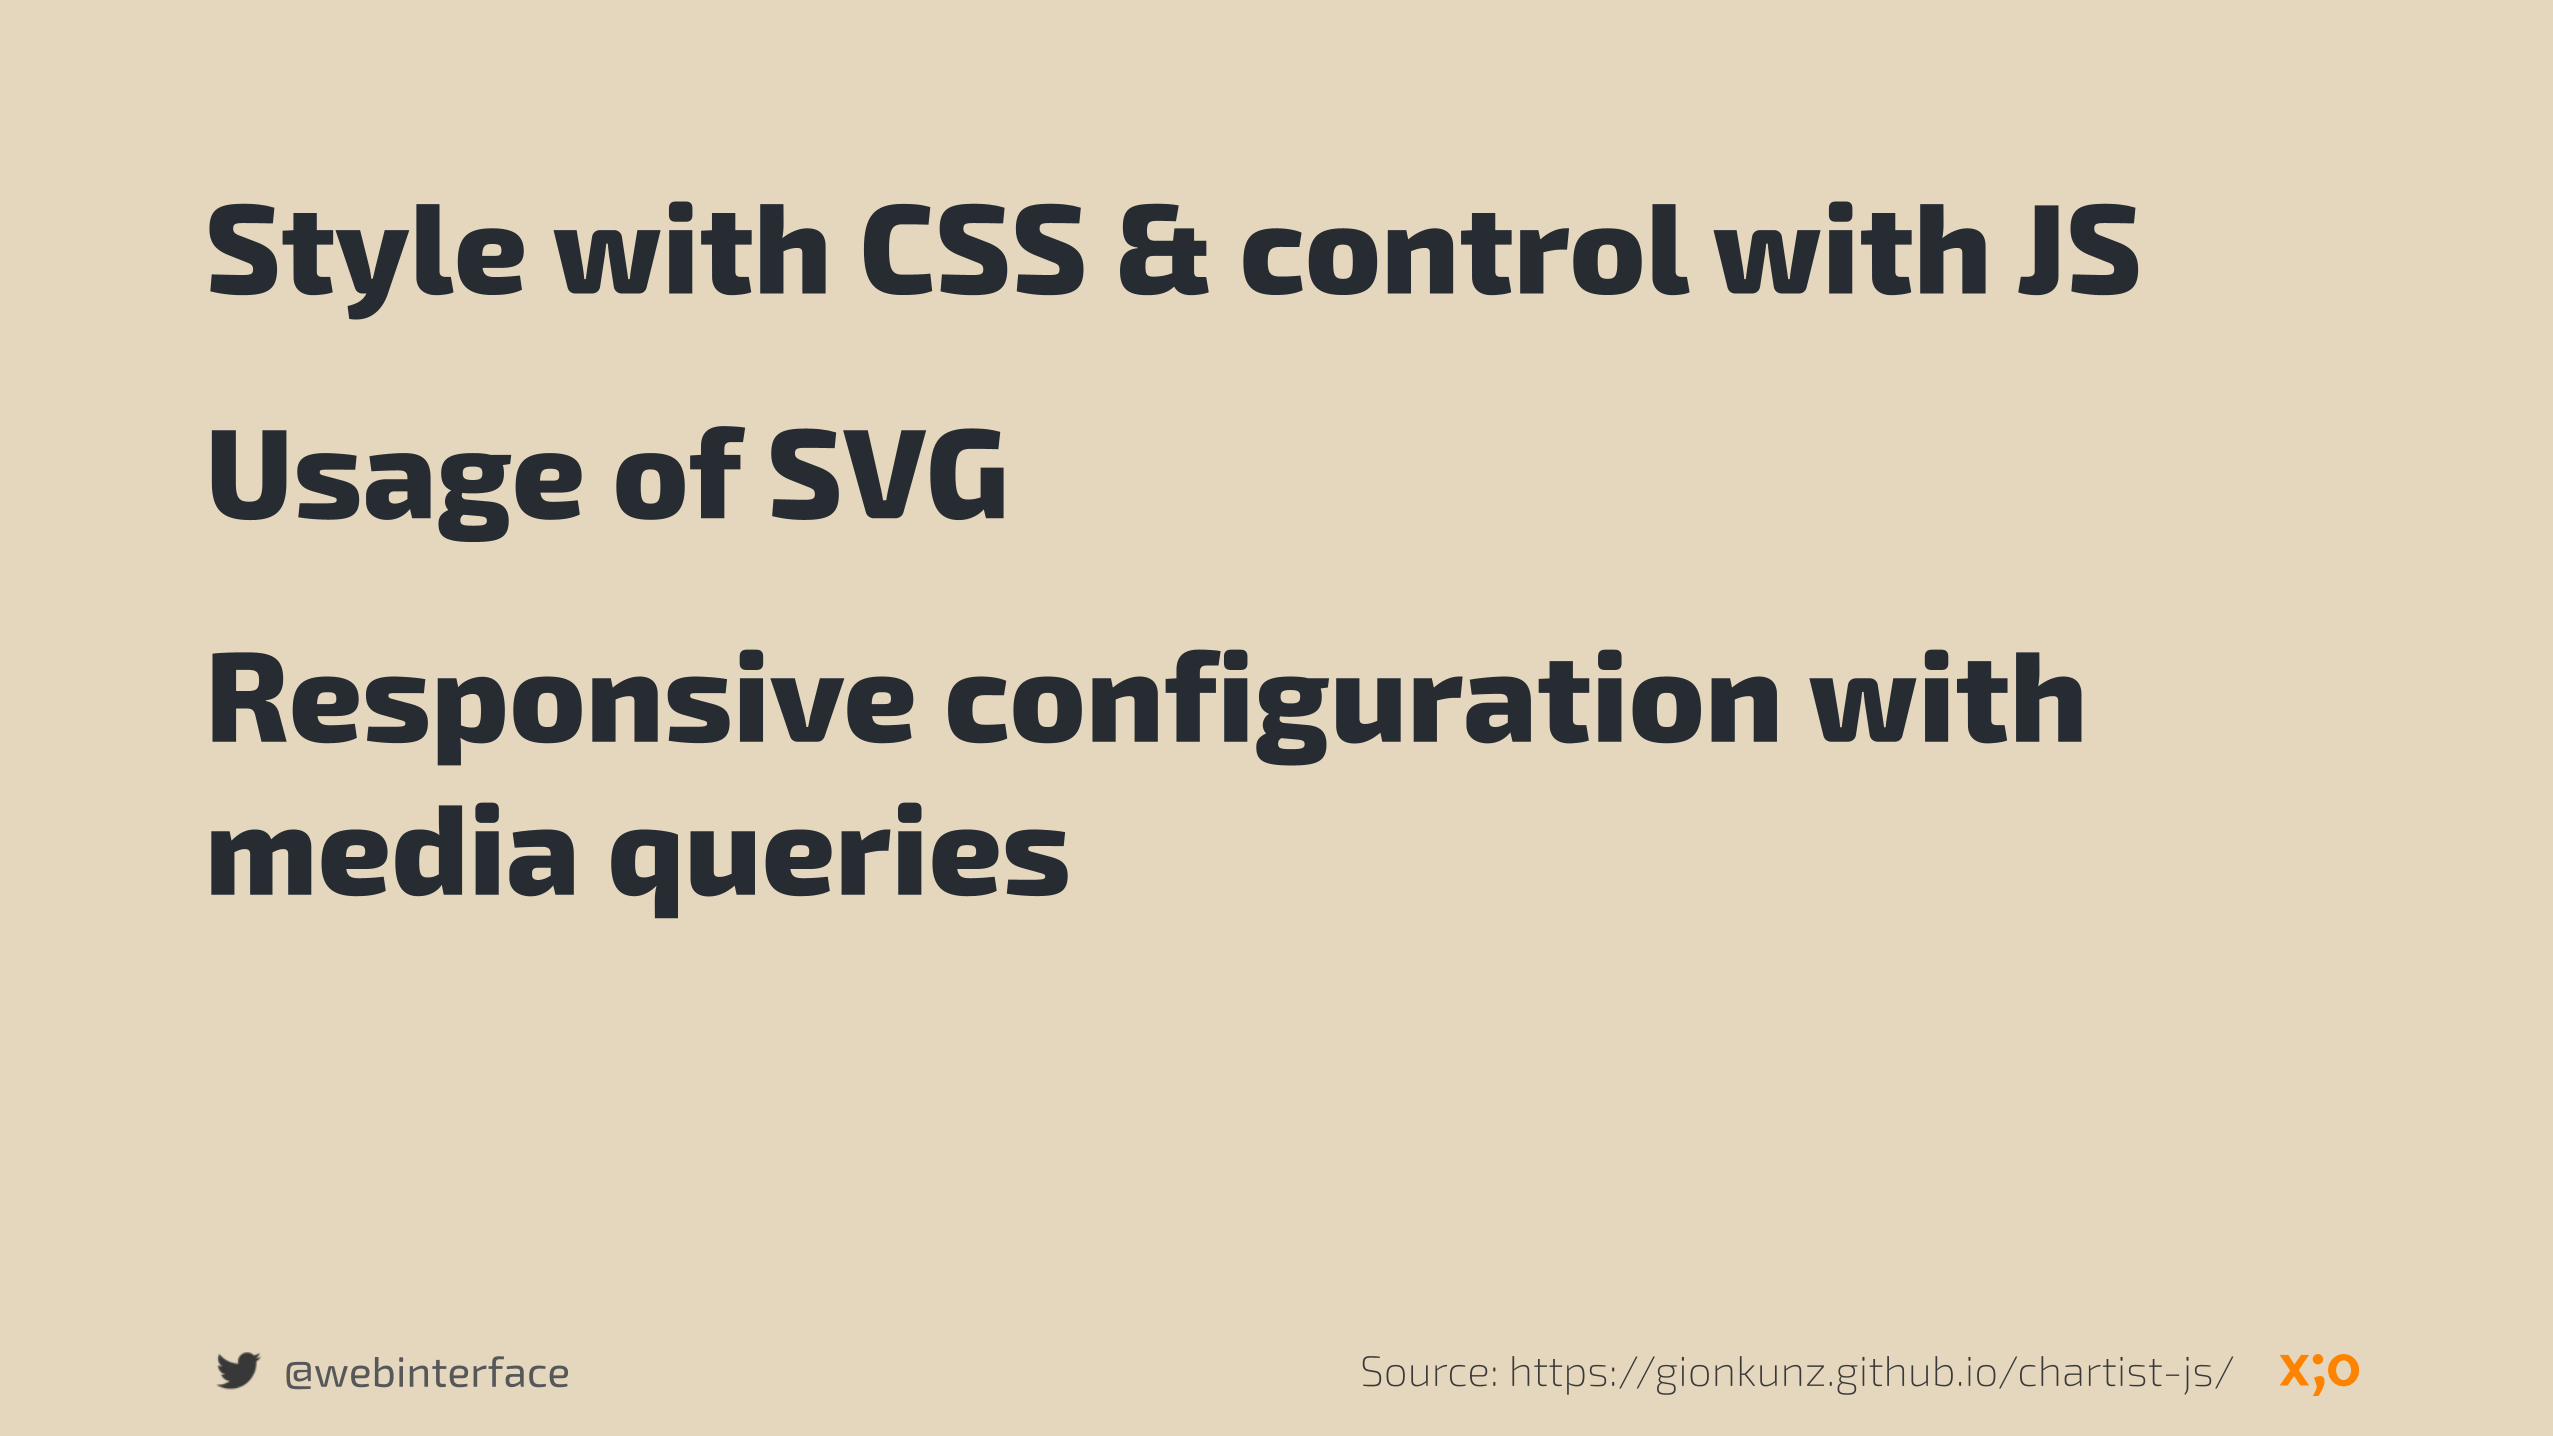
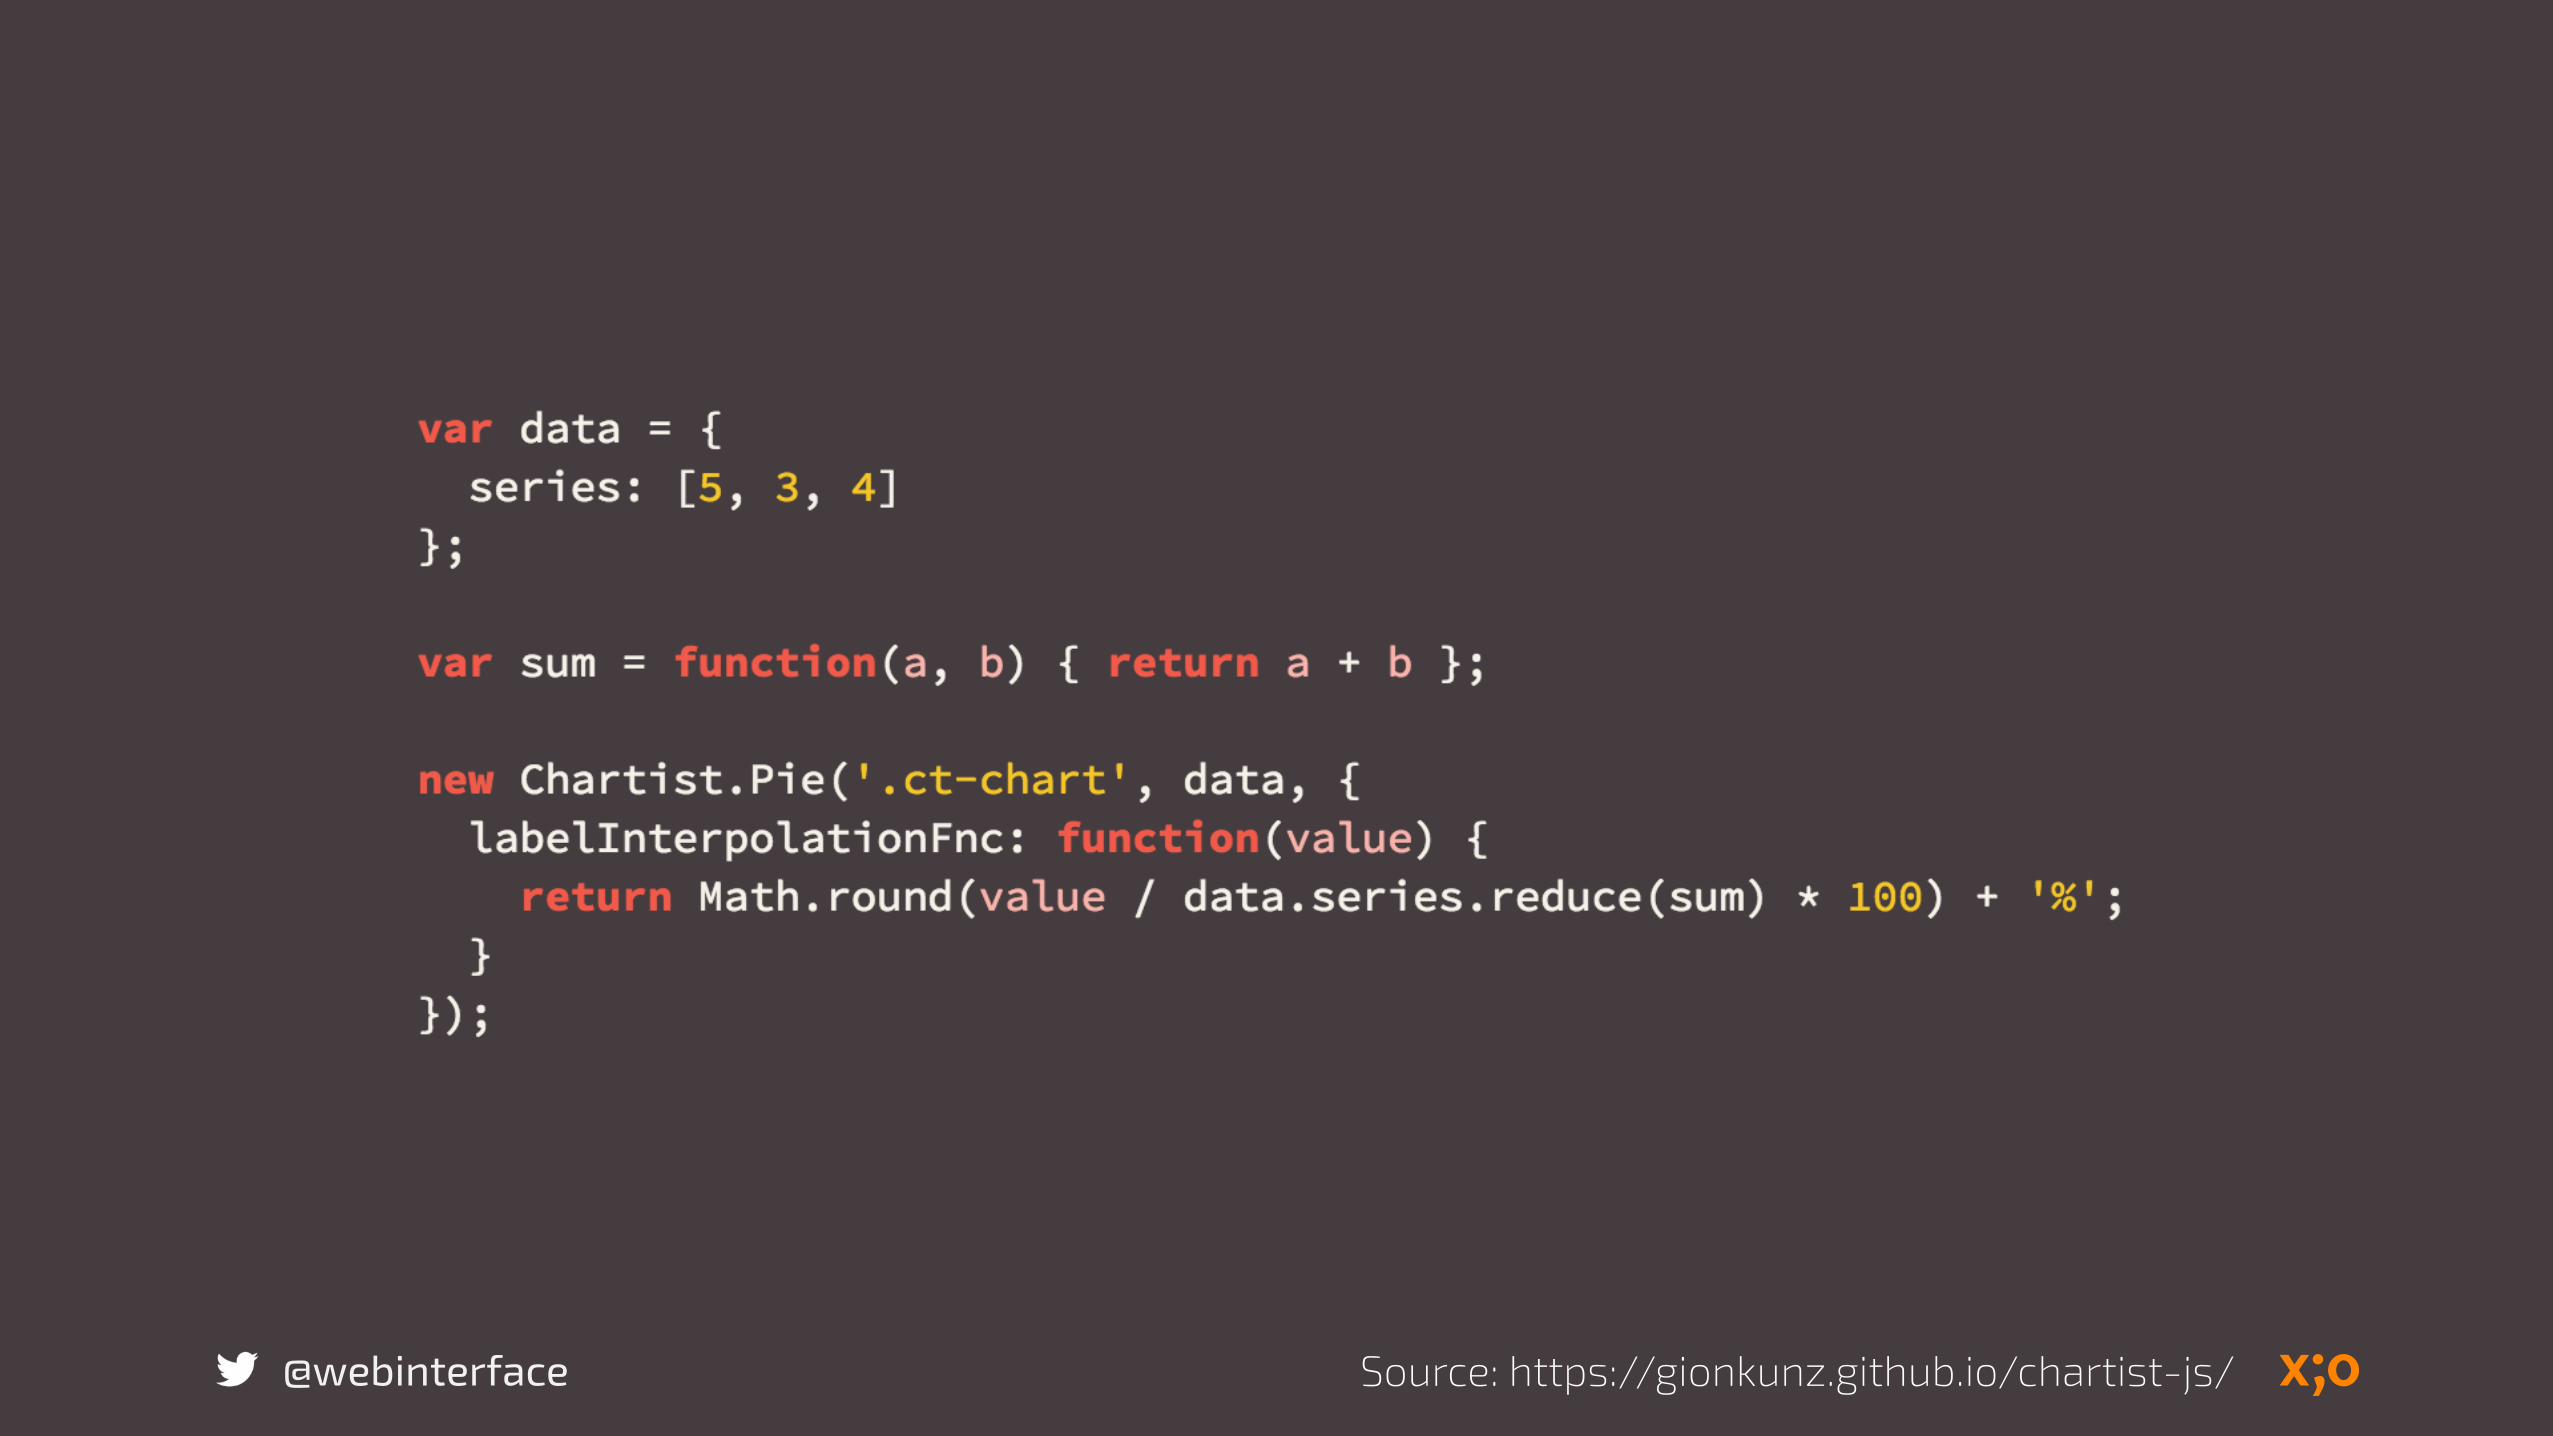
Style with CSS & control with JS
Usage of SVG
Responsive configuration with media queries
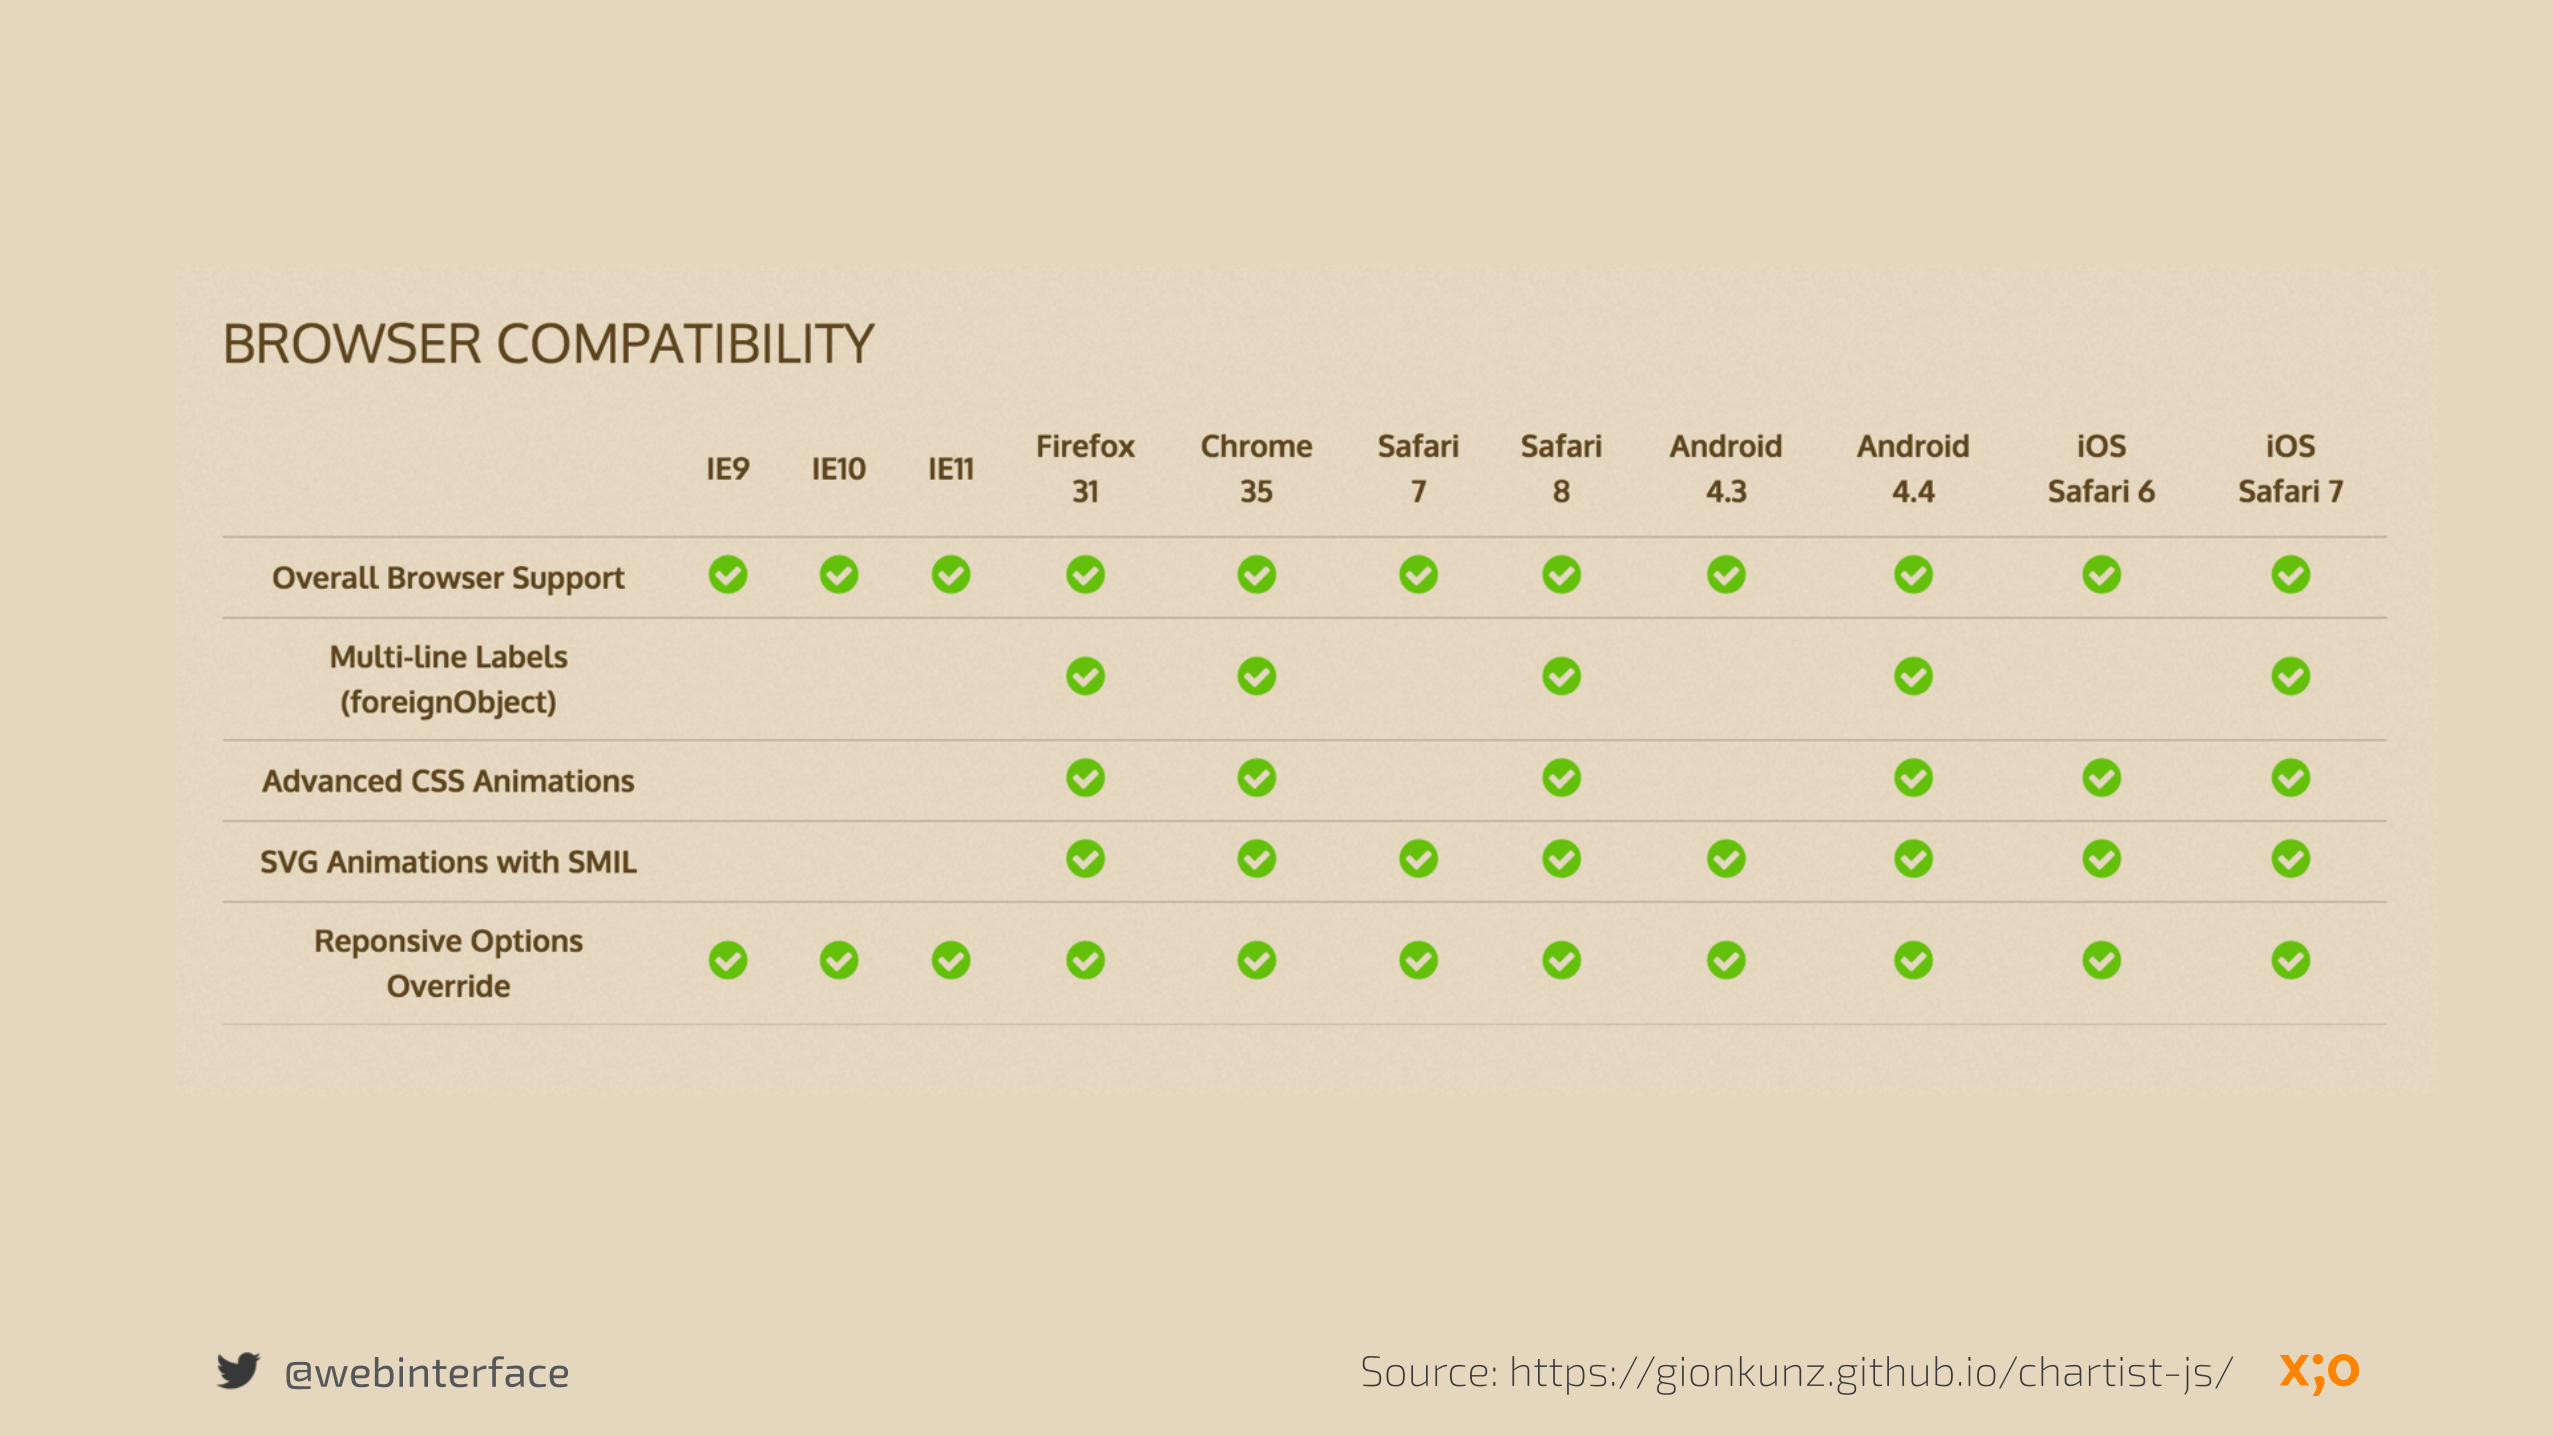
@webinterface Source: https://gionkunz.github.io/chartist-js/
@webinterface Source: https://gionkunz.github.io/chartist-js/
@webinterface Source: https://gionkunz.github.io/chartist-js/
Source: https://gionkunz.github.io/chartist-js/@webinterface Source: https://gionkunz.github.io/chartist-js/
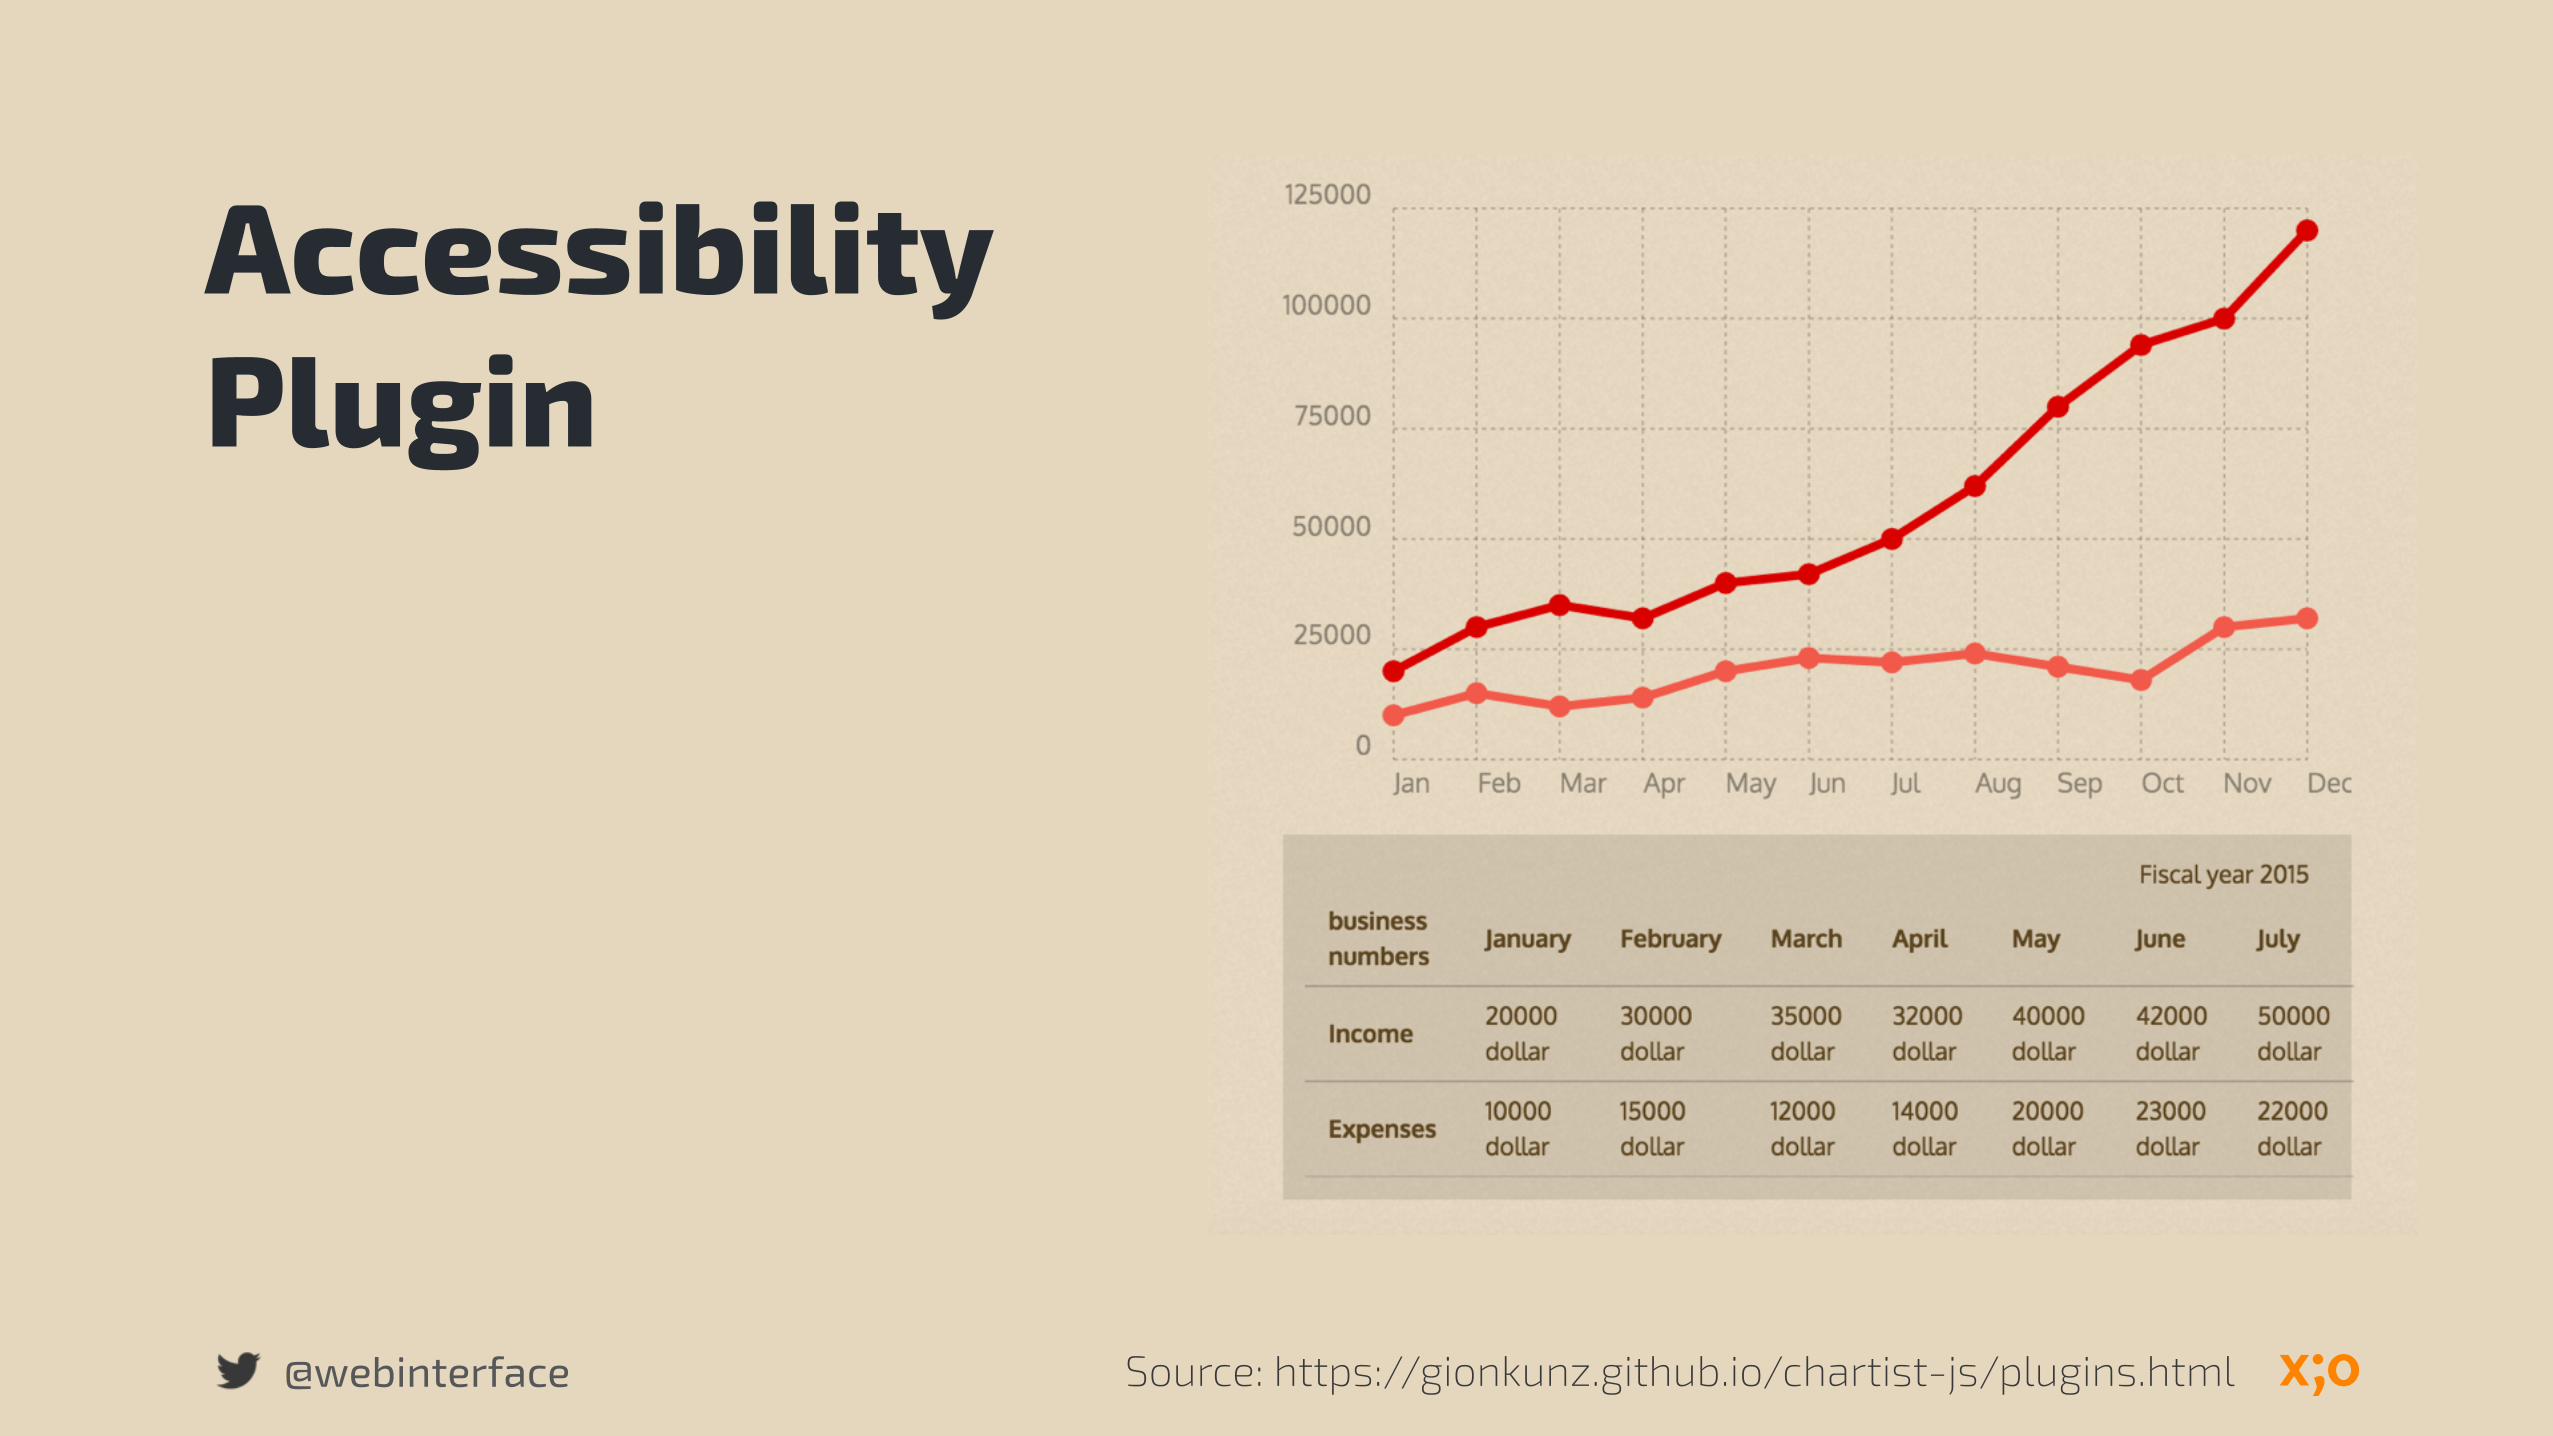
@webinterface Source: https://gionkunz.github.io/chartist-js/plugins.html
Accessibility Plugin
@webinterface Source: https://gionkunz.github.io/chartist-js/
Source: https://gionkunz.github.io/chartist-js/@webinterface Source: https://gionkunz.github.io/chartist-js/
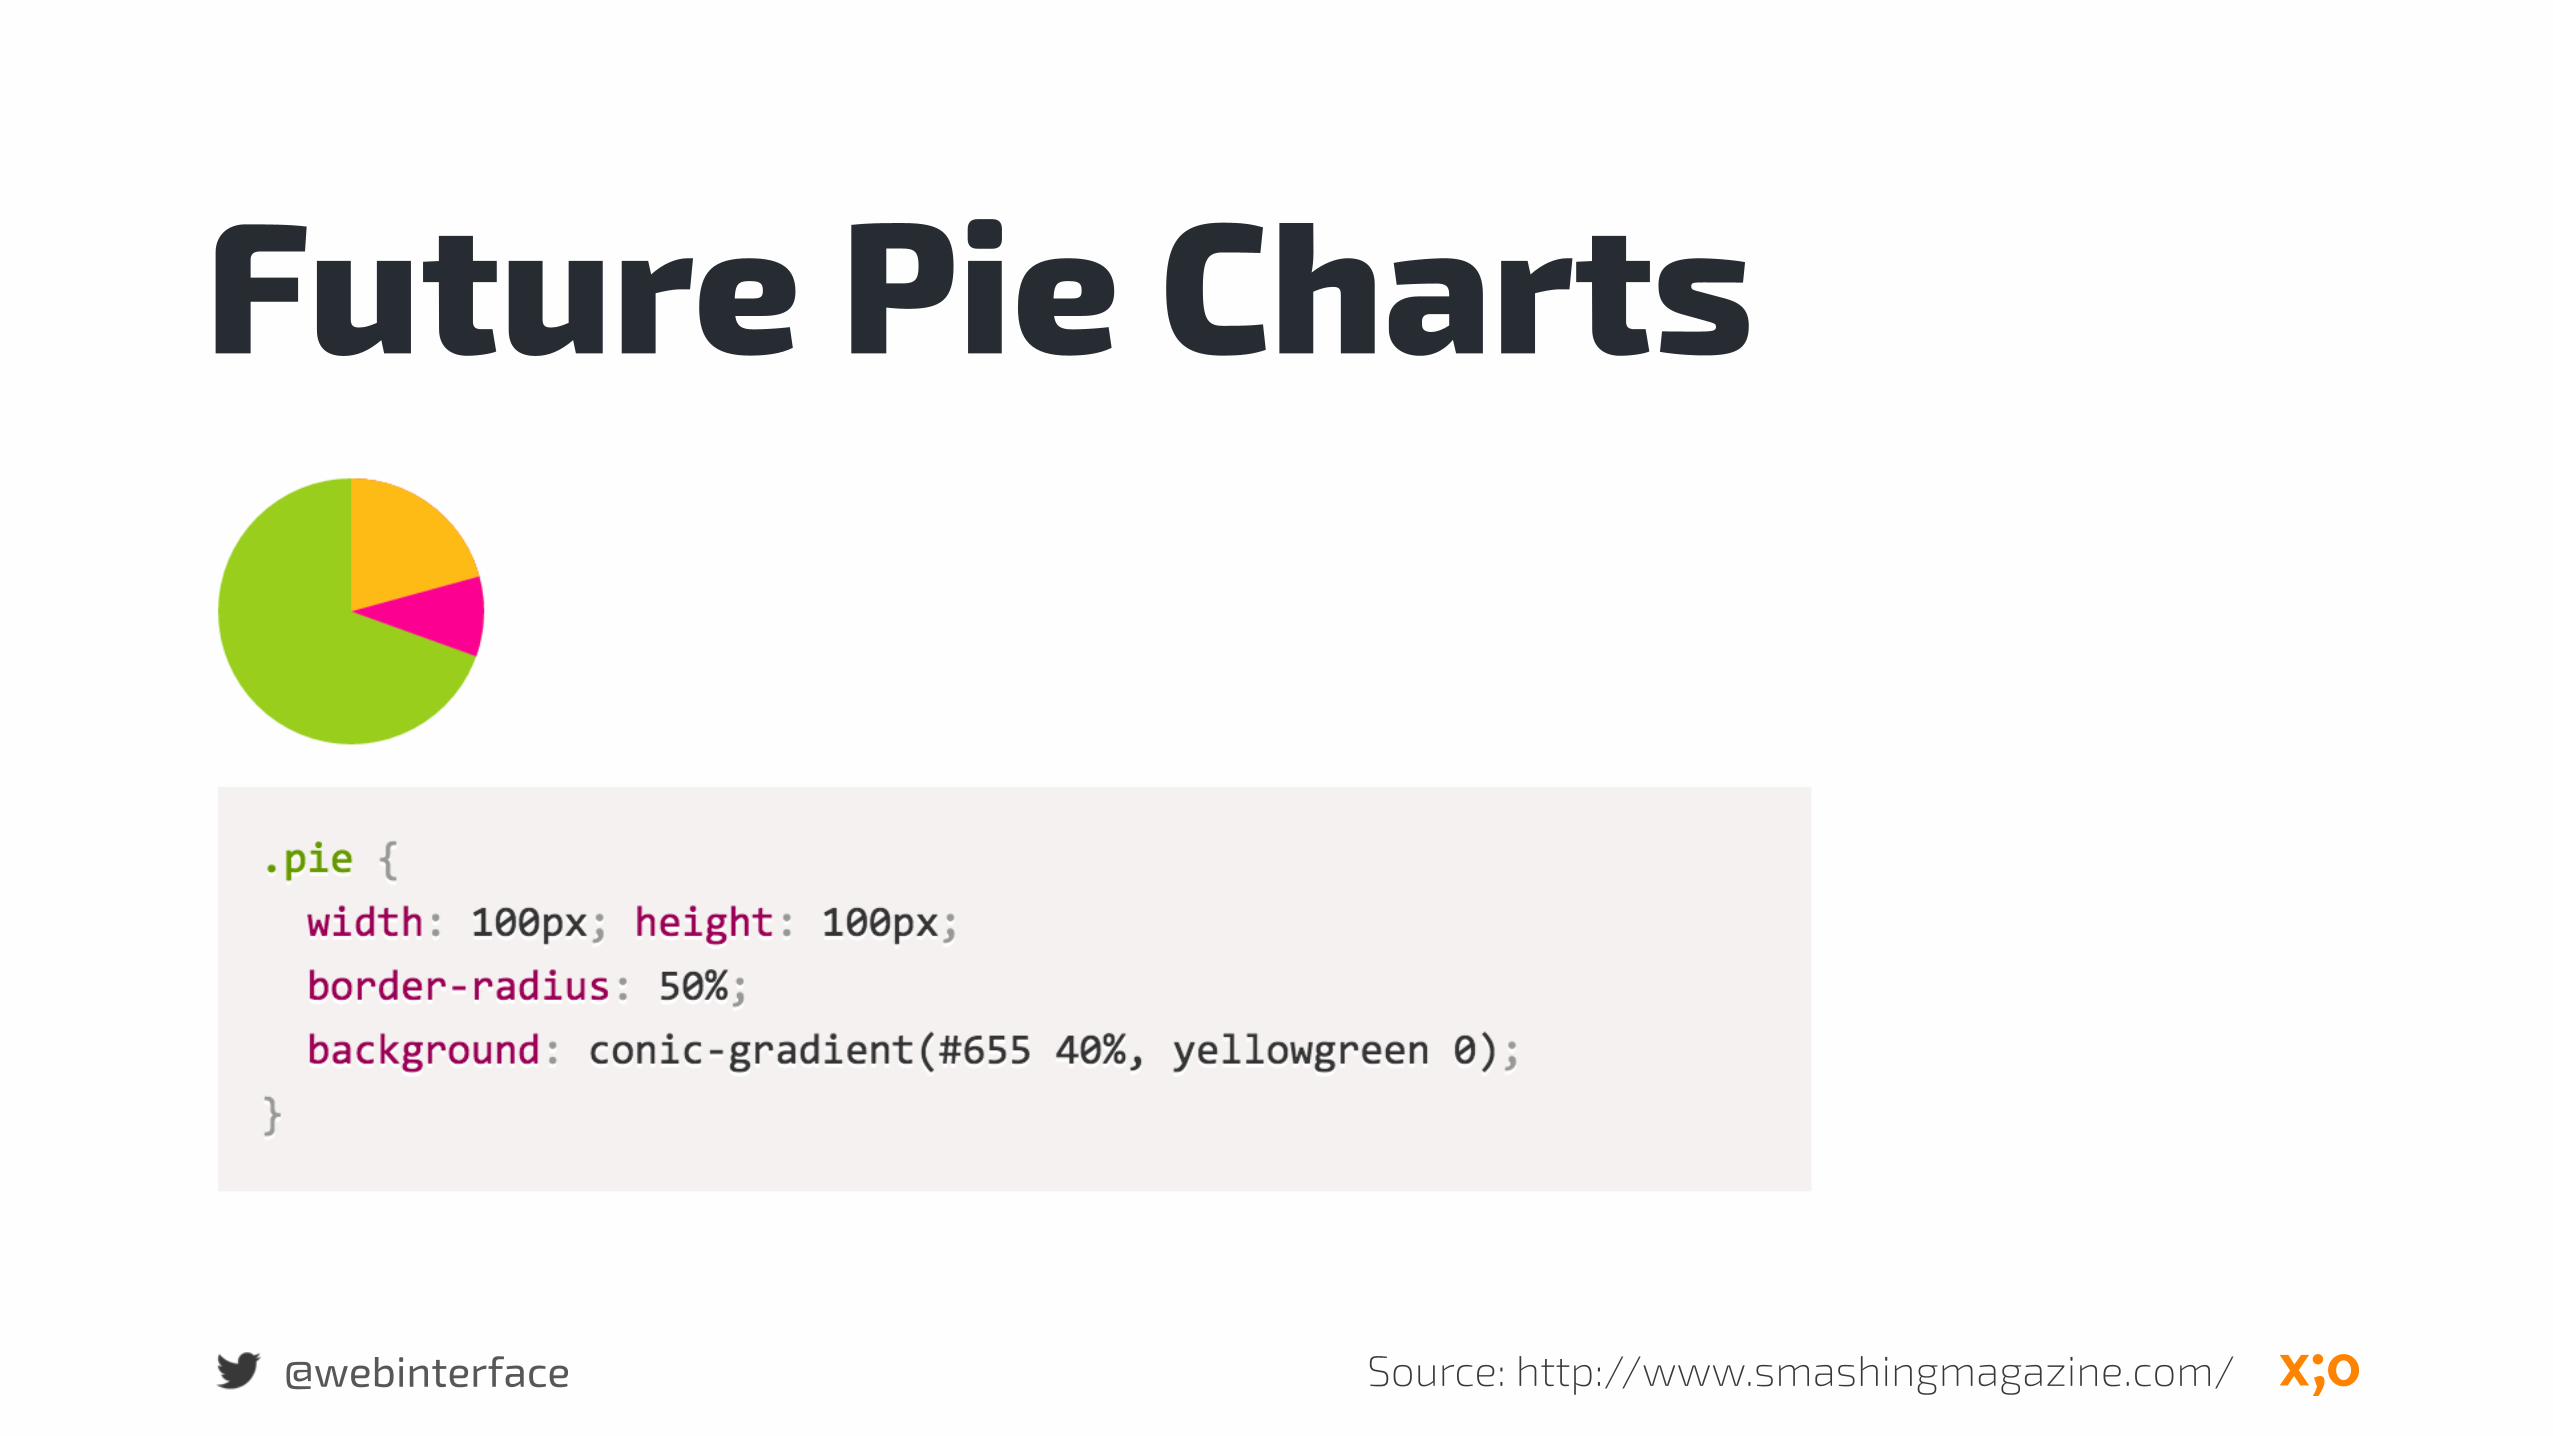
@webinterface Source: http://www.smashingmagazine.com/
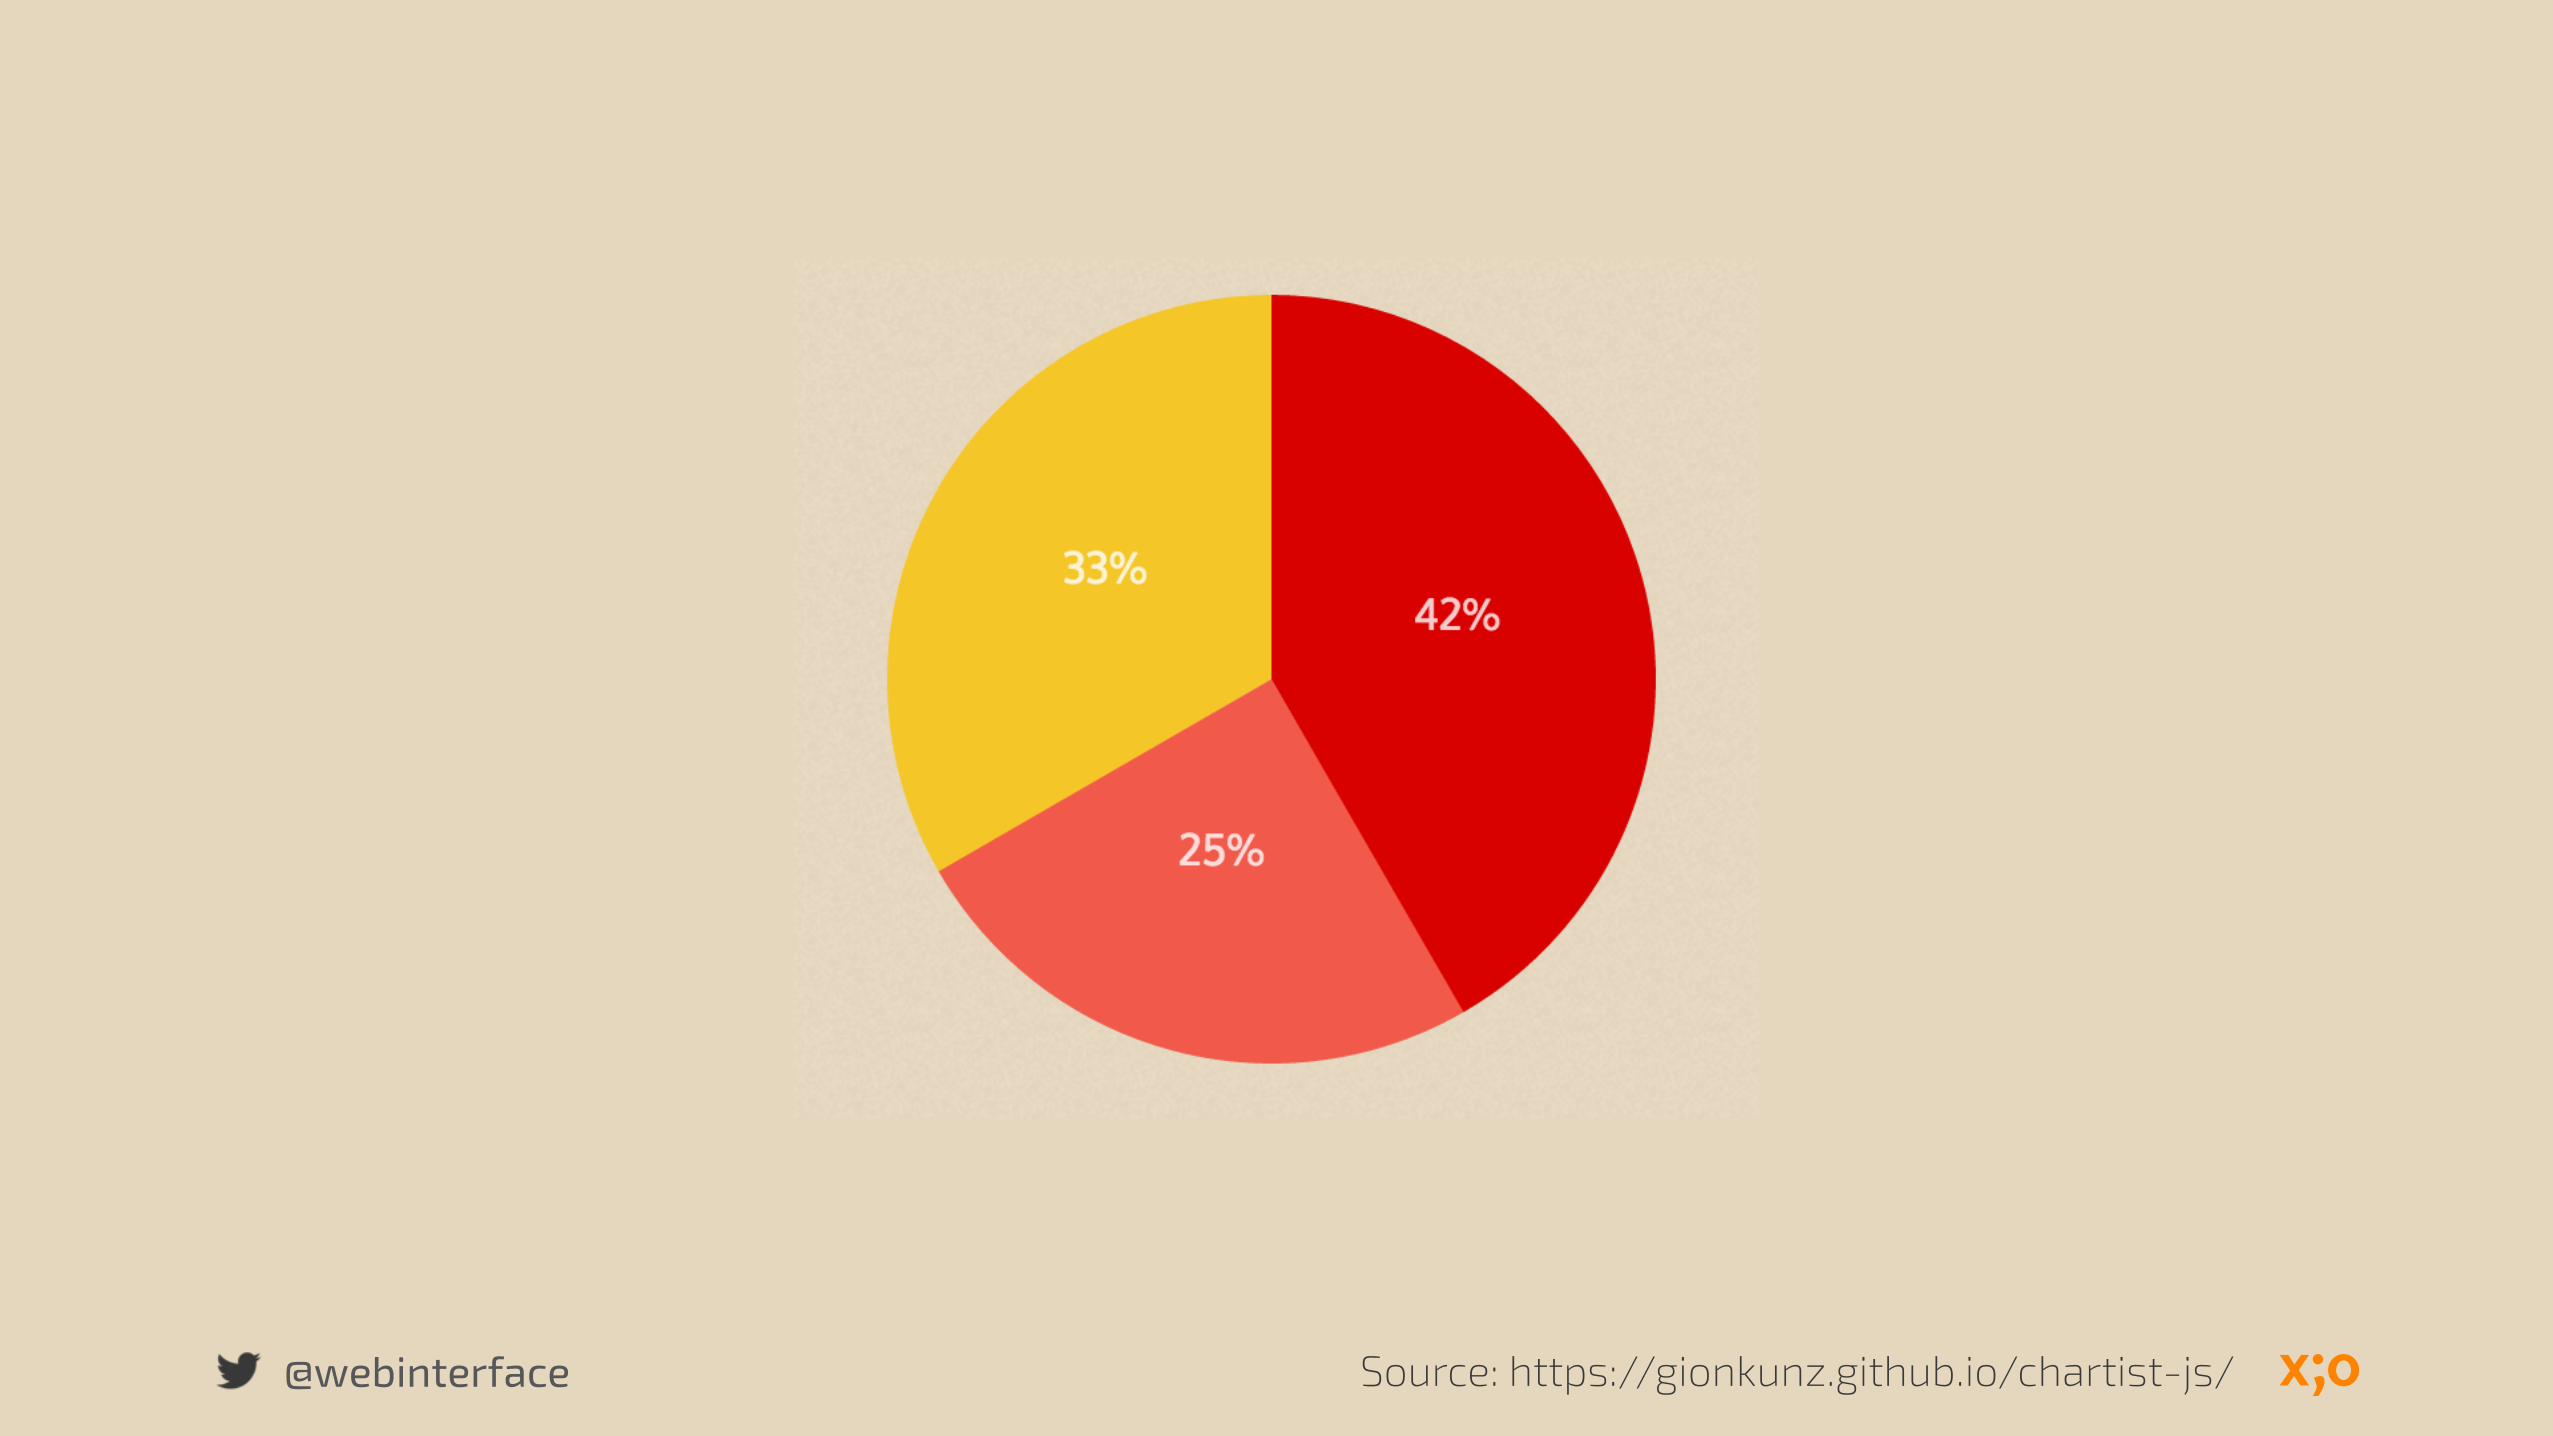
Future Pie Charts
@webinterface
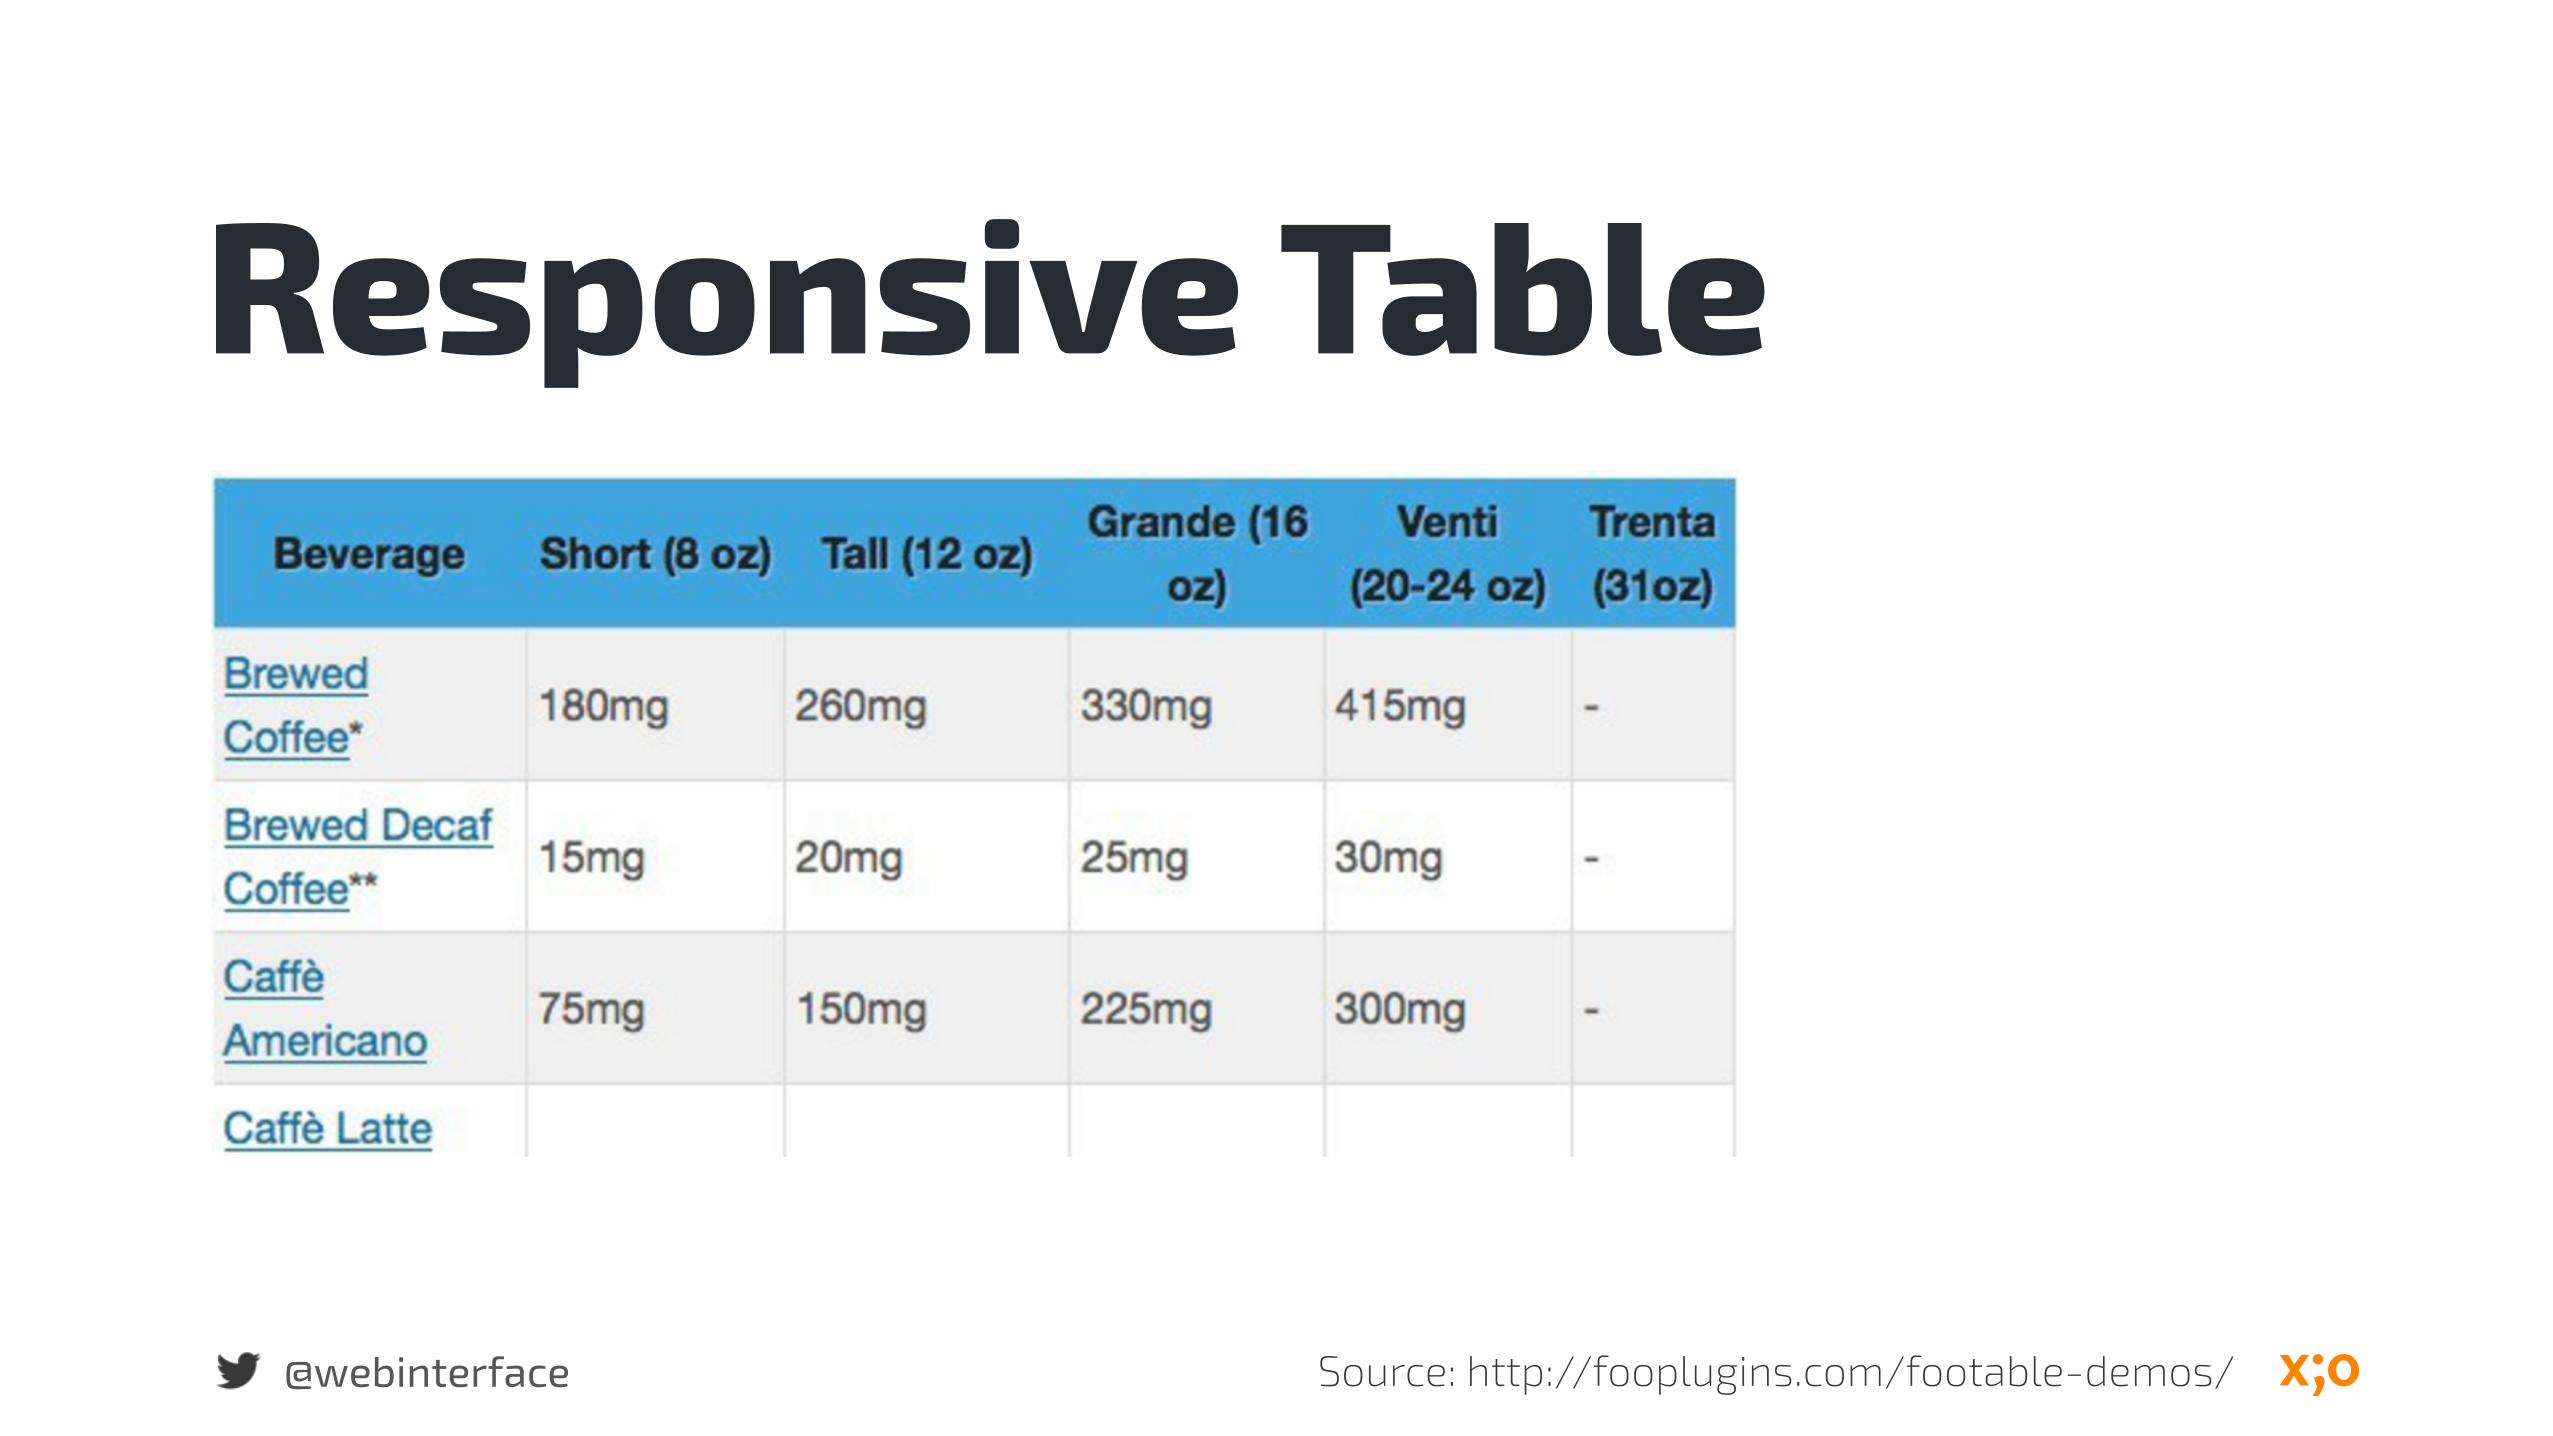
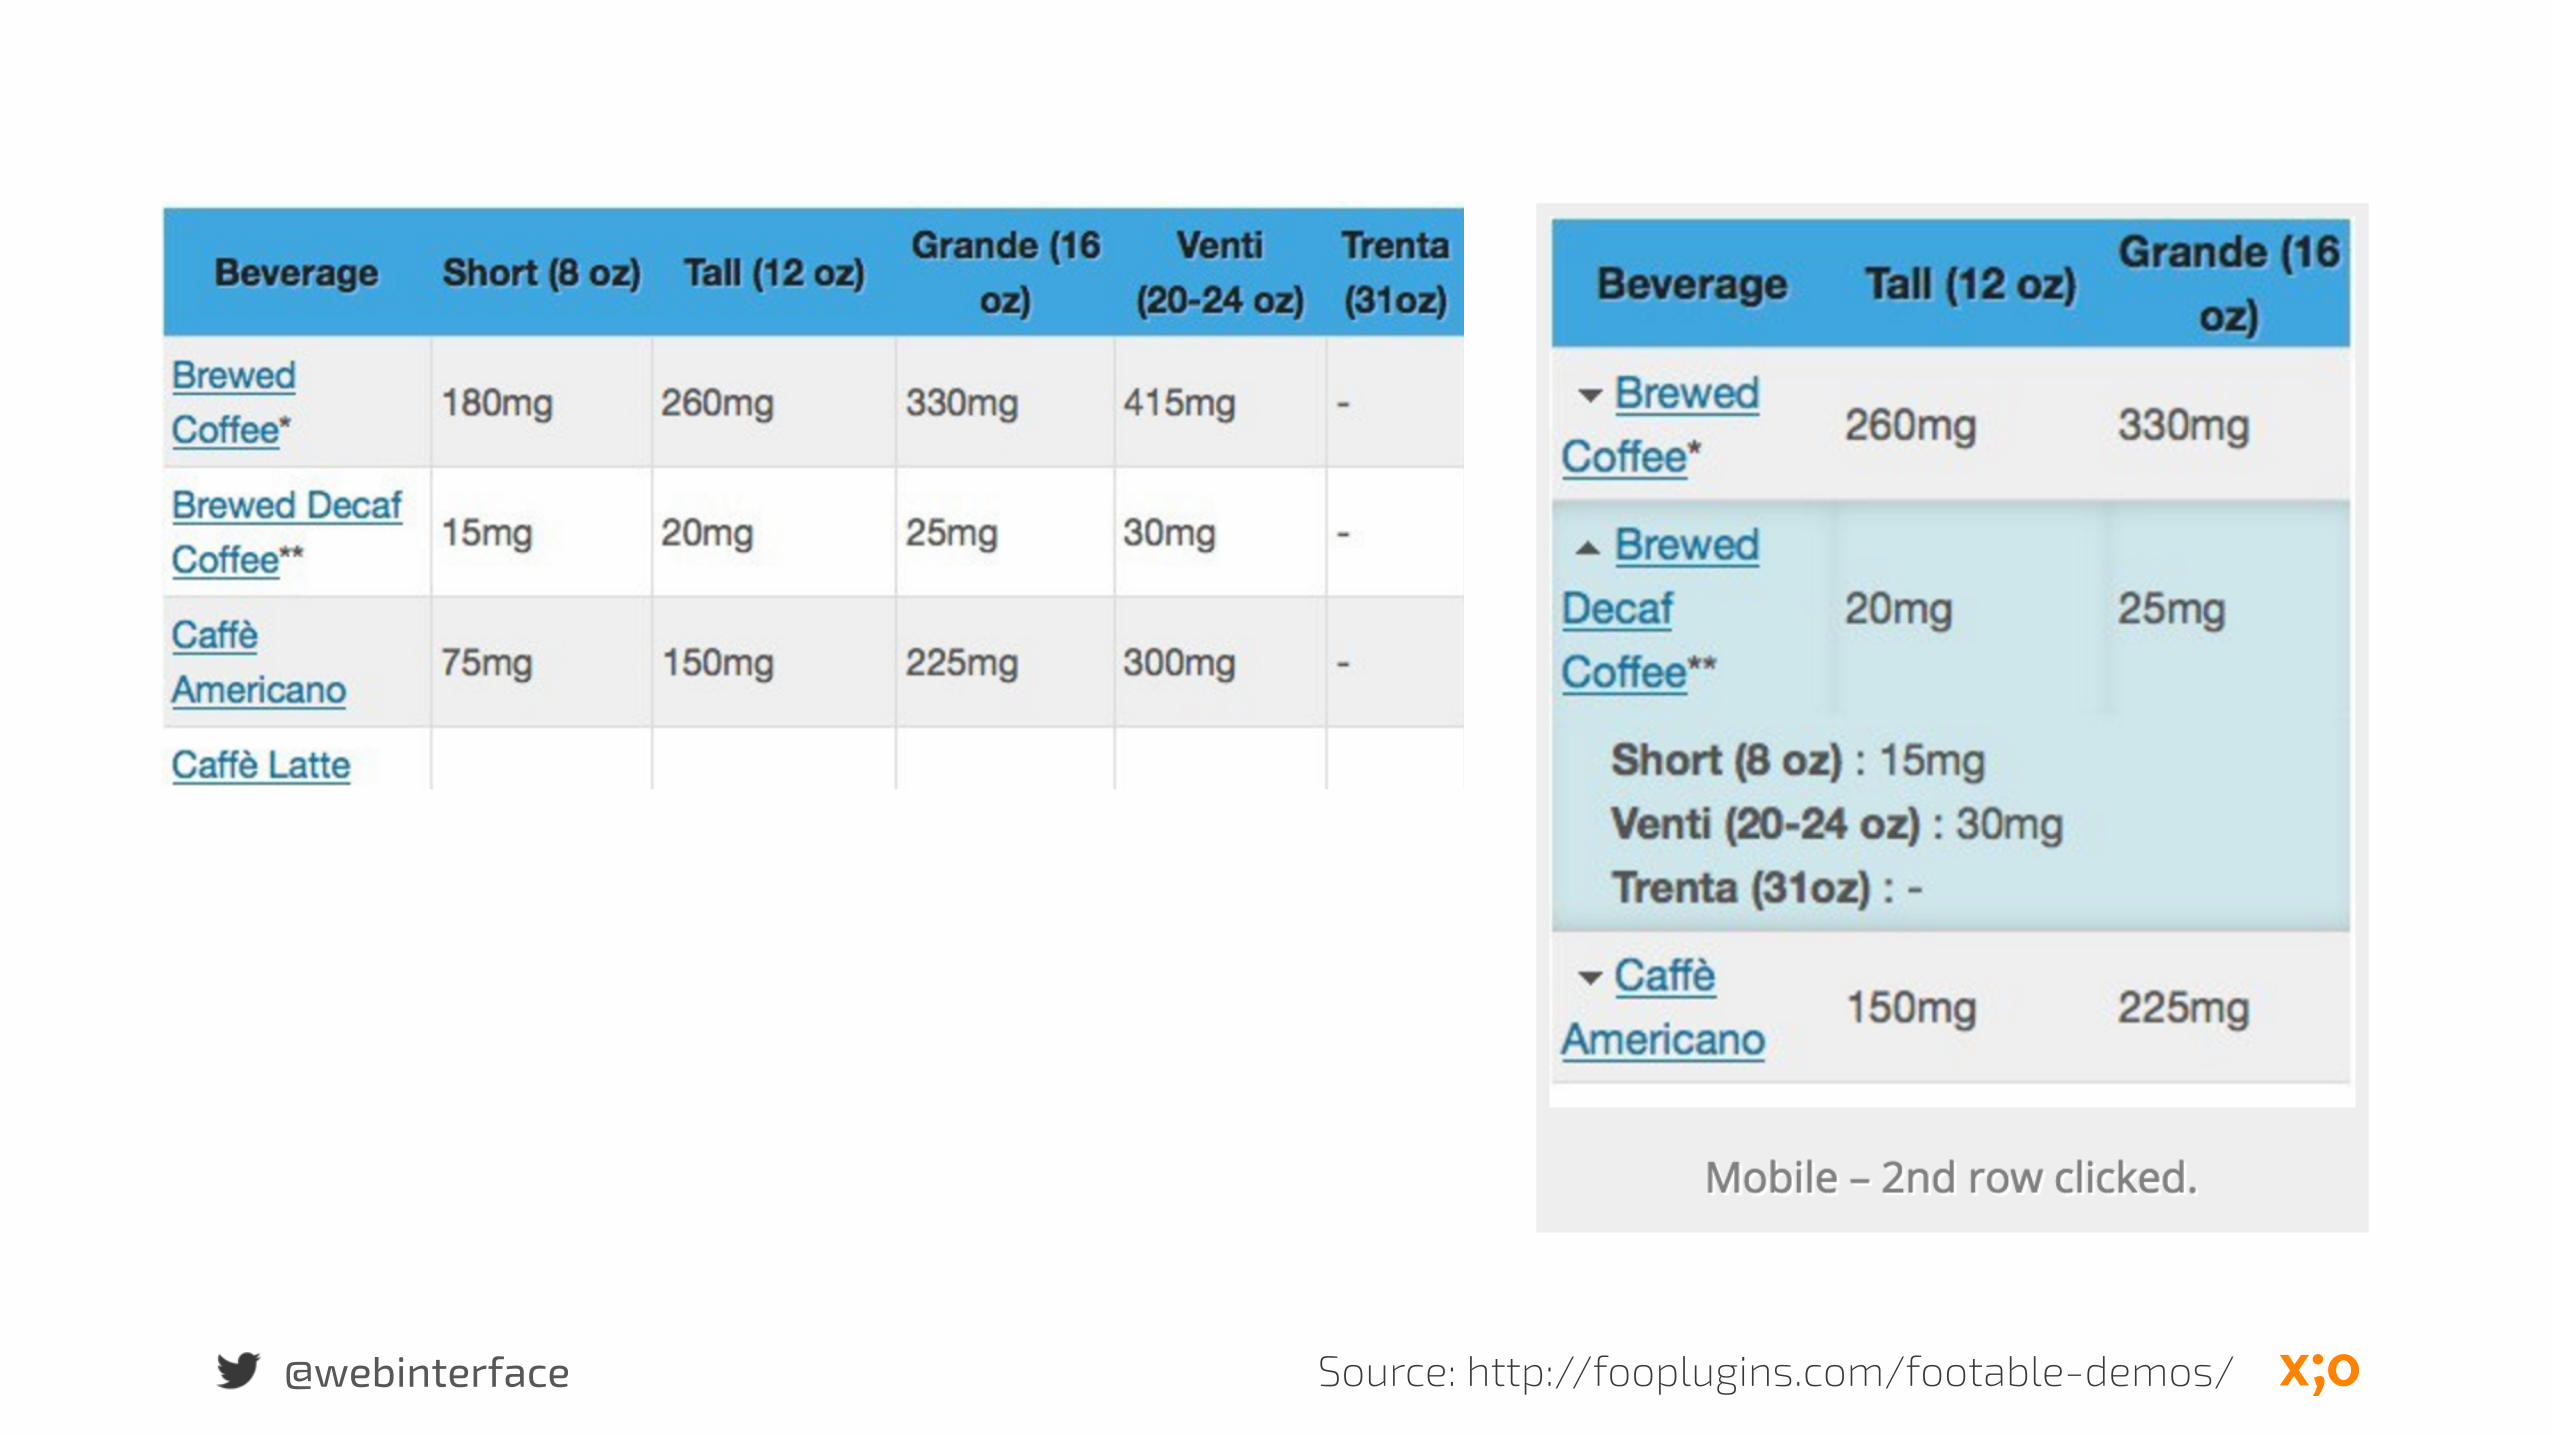
Responsive Table
Source: http://fooplugins.com/footable-demos/

@webinterface
Last Words
@webinterface
We learn from visuals.
@webinterface
Our brains perform more efficiently and more information from visuals.
@webinterface
Responsiveness data visualizations can be awesome when we understand the priority.
@webinterface
Use visuals to make the story memorable.

Thanks
@webinterface
…dear Ellen
Related Documents


![(jQuery Fundamentals) Fundamentos de jQuery191.13.234.92/.../Arquivos/LPA/JQuery/apostilas/apostila-jquery-br.pdf · Fundamentos de jQuery (jQuery Fundamentals) Rebecca Murphey []](https://static.cupdf.com/doc/110x72/6077fbbcb4f4d25f0363d510/jquery-fundamentals-fundamentos-de-jquery1911323492arquivoslpajqueryapostilasapostila-jquery-brpdf.jpg)


