The University of Nevada Brazilian Petroleum Logistics Course May 28, 2010

The University of Nevada Brazilian Petroleum Logistics Course May 28, 2010.
Dec 22, 2015
Welcome message from author
This document is posted to help you gain knowledge. Please leave a comment to let me know what you think about it! Share it to your friends and learn new things together.
Transcript
The University of Nevada Brazilian Petroleum Logistics
CourseMay 28, 2010
2
Agenda
Industry OverviewBNSF OverviewWhy Rail?Why BNSF?
3
Rail Industry Overview
4
Industry Overview
America’s Railroad Industry
U.S. railroads operate over 140,000 miles of track and earn an aggregate freight revenue of nearly $57 billion
In the United States, railroads account for more than 40%* of all freight (more than trucks, boats, barges or planes) *Measured in Ton Miles
70% of all autos produced in America move by rail 30% of all U.S. grain moves by rail 65% of the coal is moved by rail which in turn produces half of
America’s electricity U.S. Railroads move enough:
Wheat to provide every person with a loaf of bread 6 days/week Concrete to build 45 miles of new highway every day
Railroads remain the backbone of America’s freight transportation network
North American railroads form the world’s most efficient and lowest-cost freight network
Source: American Association of Railroads (AAR)
5
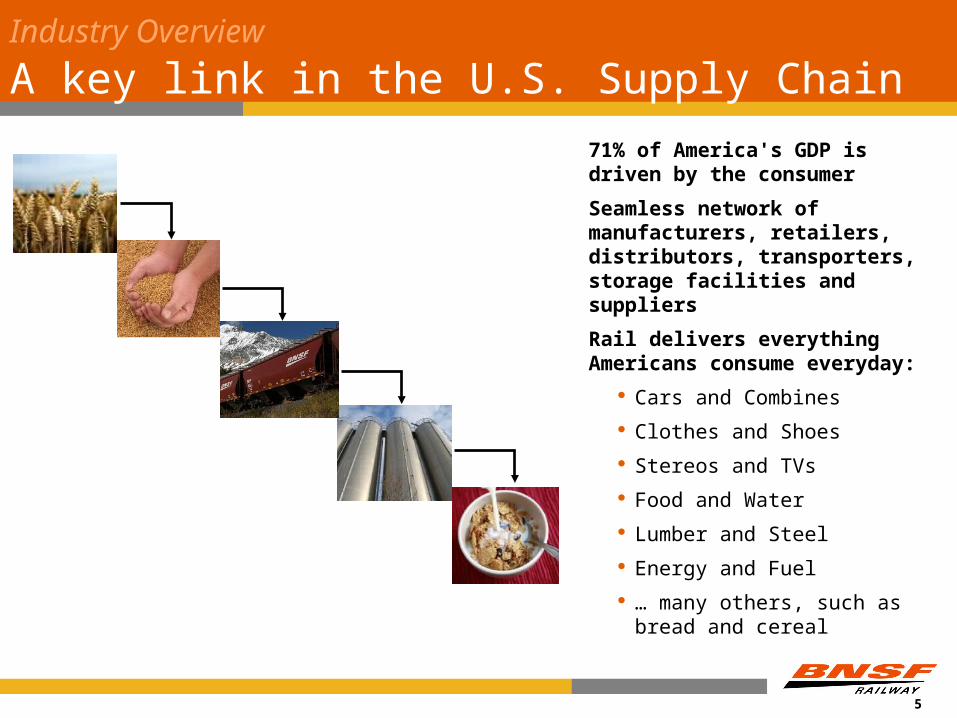
Industry Overview A key link in the U.S. Supply Chain
71% of America's GDP is driven by the consumer
Seamless network of manufacturers, retailers, distributors, transporters, storage facilities and suppliers
Rail delivers everything Americans consume everyday:
Cars and Combines
Clothes and Shoes
Stereos and TVs
Food and Water
Lumber and Steel
Energy and Fuel
… many others, such as bread and cereal
6
Industry Overview
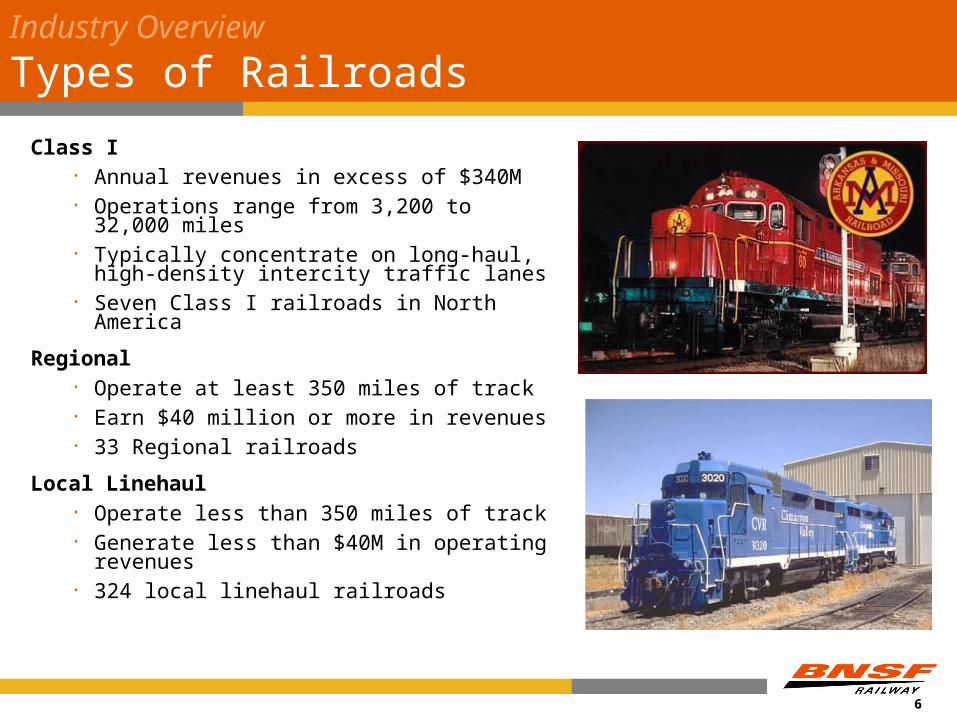
Types of Railroads
Class I • Annual revenues in excess of $340M• Operations range from 3,200 to 32,000
miles• Typically concentrate on long-haul, high-
density intercity traffic lanes• Seven Class I railroads in North America
Regional• Operate at least 350 miles of track • Earn $40 million or more in revenues• 33 Regional railroads
Local Linehaul• Operate less than 350 miles of track• Generate less than $40M in operating
revenues• 324 local linehaul railroads
7
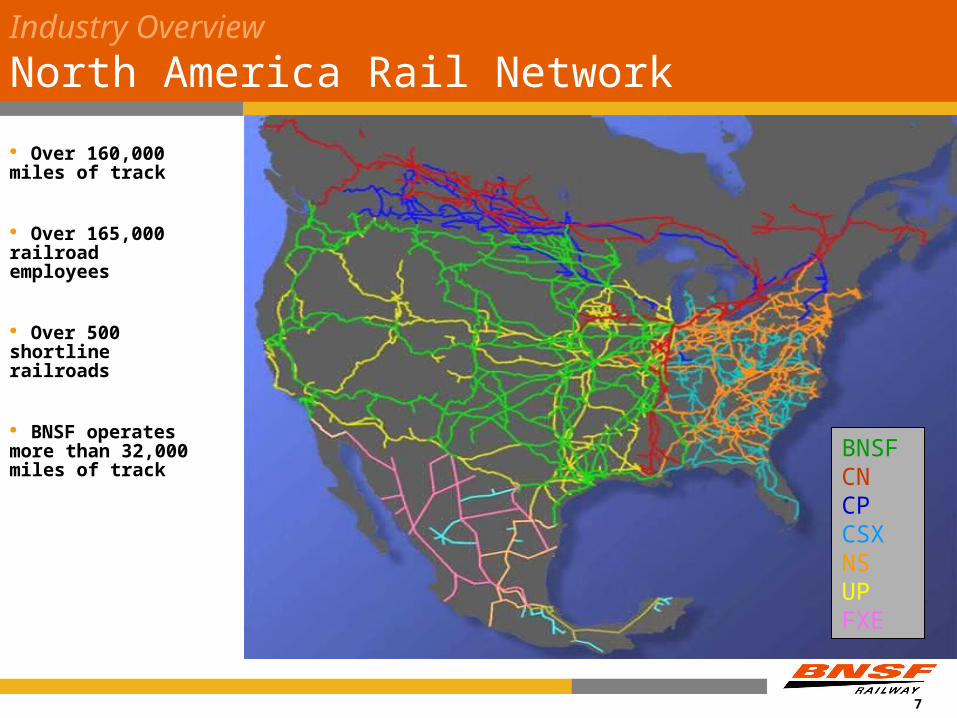
Industry Overview
North America Rail Network
BNSFCNCPCSXNSUPFXE
Over 160,000 miles of track
Over 165,000 railroad employees
Over 500 shortline railroads
BNSF operates more than 32,000 miles of track
8
ChallengesChallengesHighway Congestion
Driver Shortage
Fuel Efficiency
Rail Capacity
Environmental Solutions
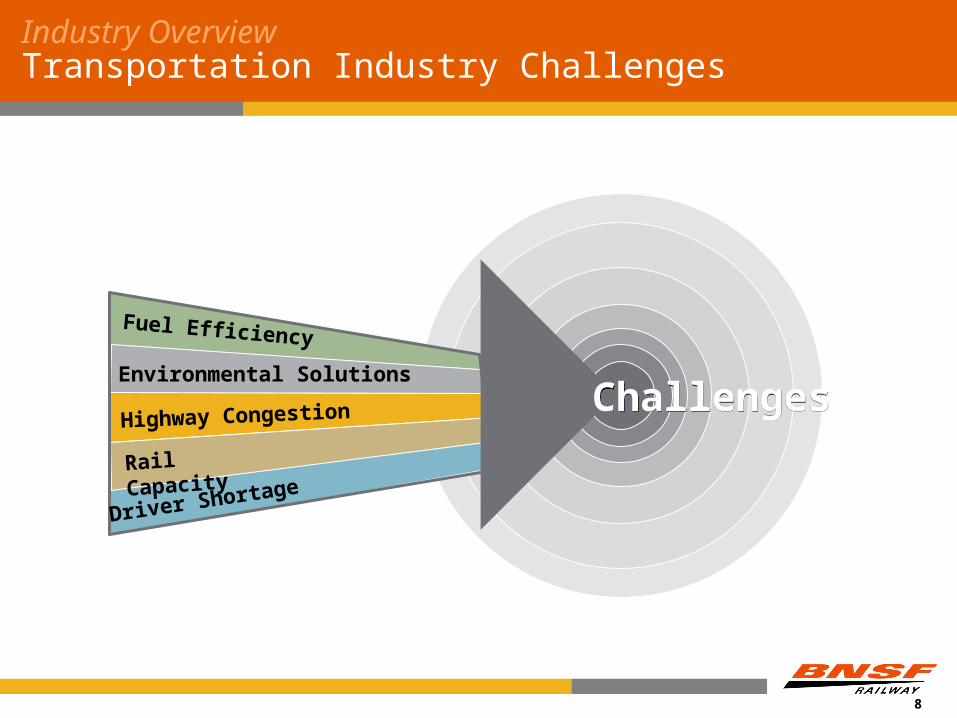
Industry Overview Transportation Industry Challenges
9
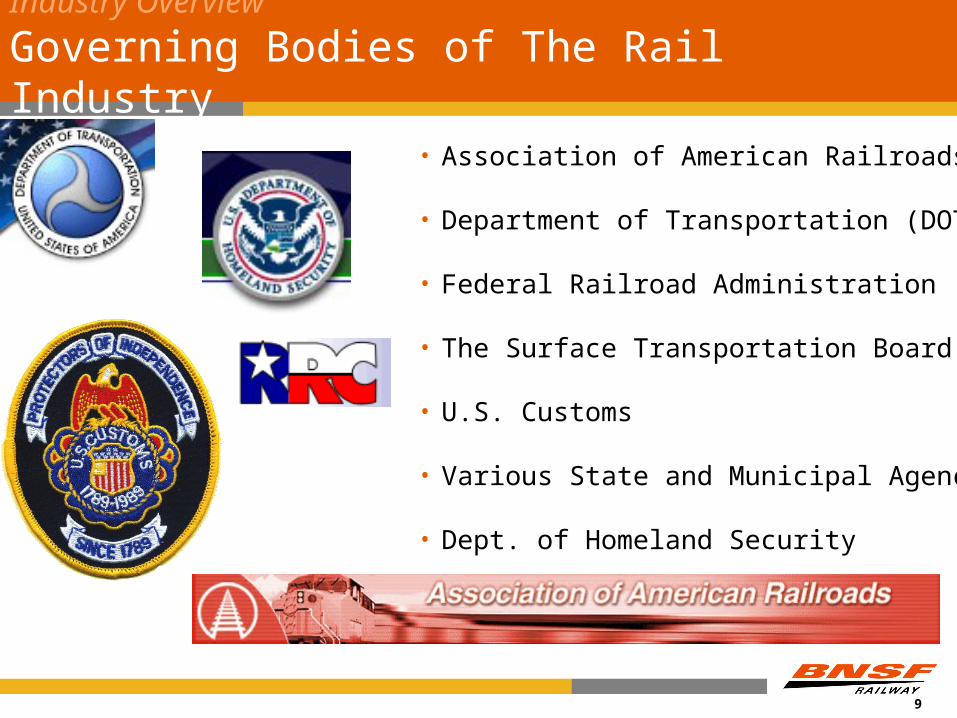
Industry Overview
Governing Bodies of The Rail Industry
• Association of American Railroads (AAR)
• Department of Transportation (DOT)
• Federal Railroad Administration (FRA)
• The Surface Transportation Board (STB)
• U.S. Customs
• Various State and Municipal Agencies
• Dept. of Homeland Security
10
BNSF Overview
11
BNSF Overview
About Us
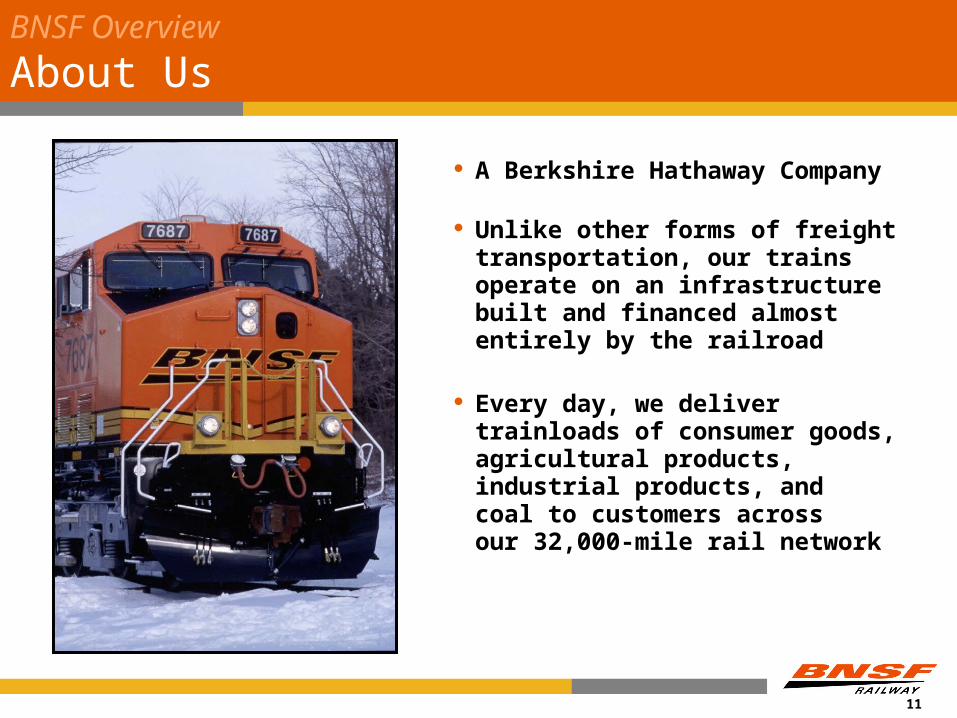
A Berkshire Hathaway Company
Unlike other forms of freight transportation, our trains operate on an infrastructure built and financed almost entirely by the railroad
Every day, we deliver trainloads of consumer goods, agricultural products, industrial products, and coal to customers acrossour 32,000-mile rail network
12
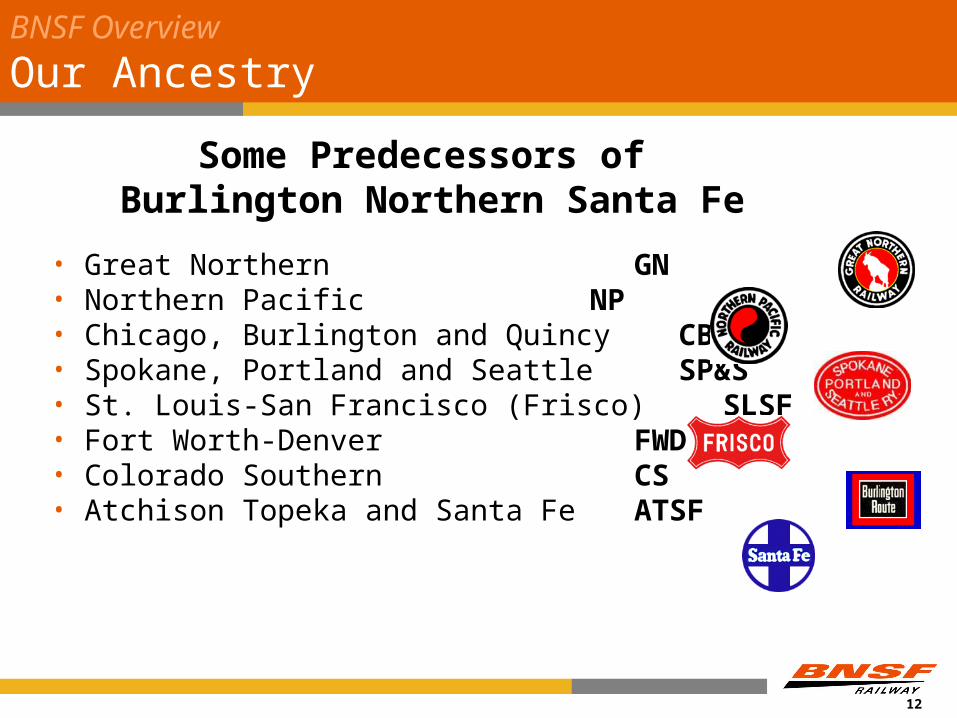
Some Predecessors of Burlington Northern Santa Fe
• Great Northern GN• Northern Pacific NP• Chicago, Burlington and Quincy CB&Q• Spokane, Portland and Seattle SP&S• St. Louis-San Francisco (Frisco) SLSF• Fort Worth-Denver FWD• Colorado Southern CS• Atchison Topeka and Santa Fe ATSF
BNSF Overview
Our Ancestry
13
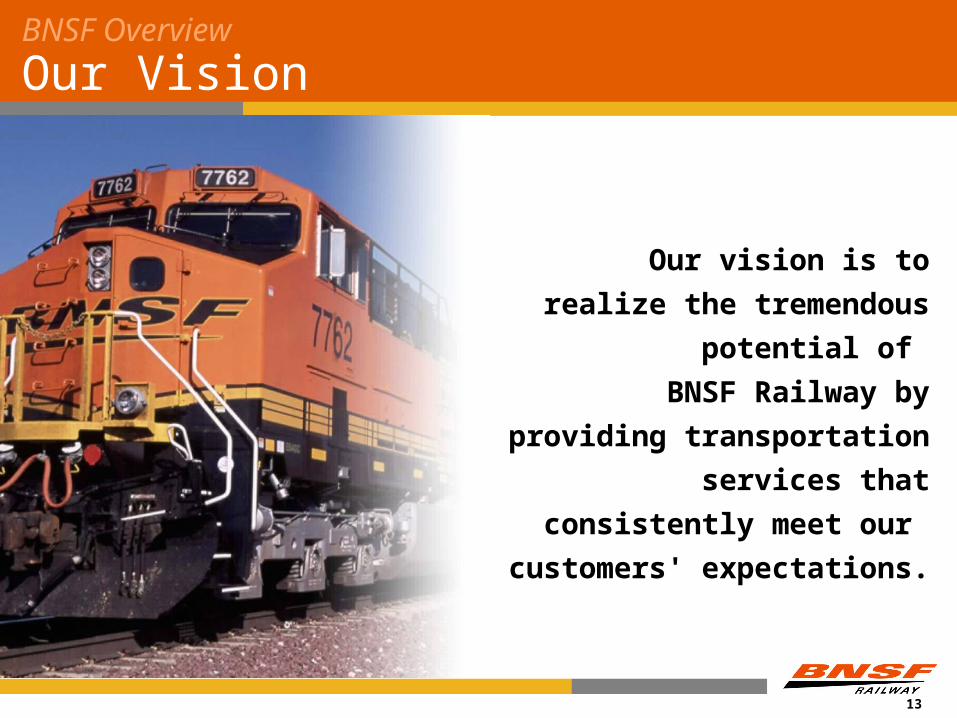
Our vision is to realize
the tremendous potential of
BNSF Railway by providing
transportation services that
consistently meet our
customers' expectations.
BNSF Overview Our Vision
14
BNSF Overview BNSF Network
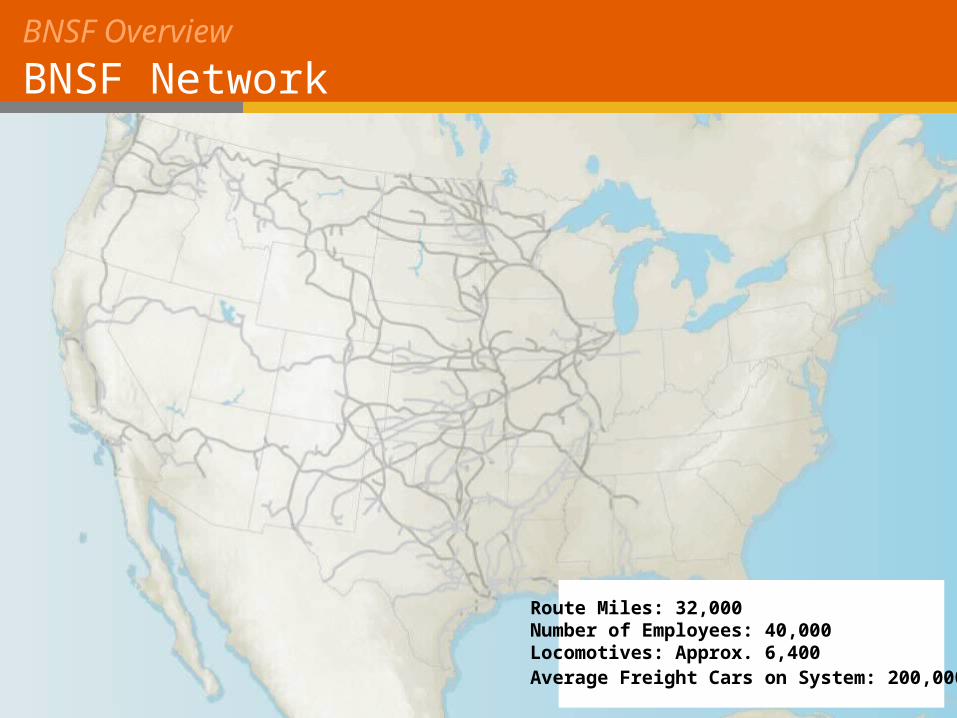
Route Miles: 32,000 Number of Employees: 40,000 Locomotives: Approx. 6,400 Average Freight Cars on System: 200,000
15
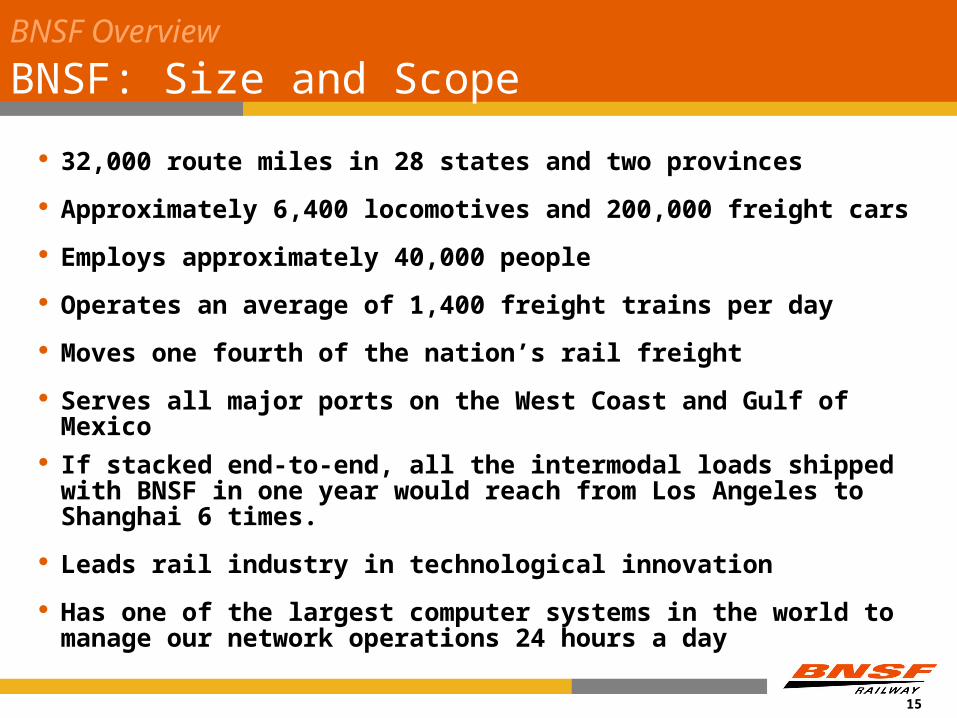
BNSF Overview BNSF: Size and Scope
32,000 route miles in 28 states and two provinces
Approximately 6,400 locomotives and 200,000 freight cars
Employs approximately 40,000 people
Operates an average of 1,400 freight trains per day
Moves one fourth of the nation’s rail freight
Serves all major ports on the West Coast and Gulf of Mexico If stacked end-to-end, all the intermodal loads shipped with BNSF
in one year would reach from Los Angeles to Shanghai 6 times.
Leads rail industry in technological innovation
Has one of the largest computer systems in the world to manage our network operations 24 hours a day
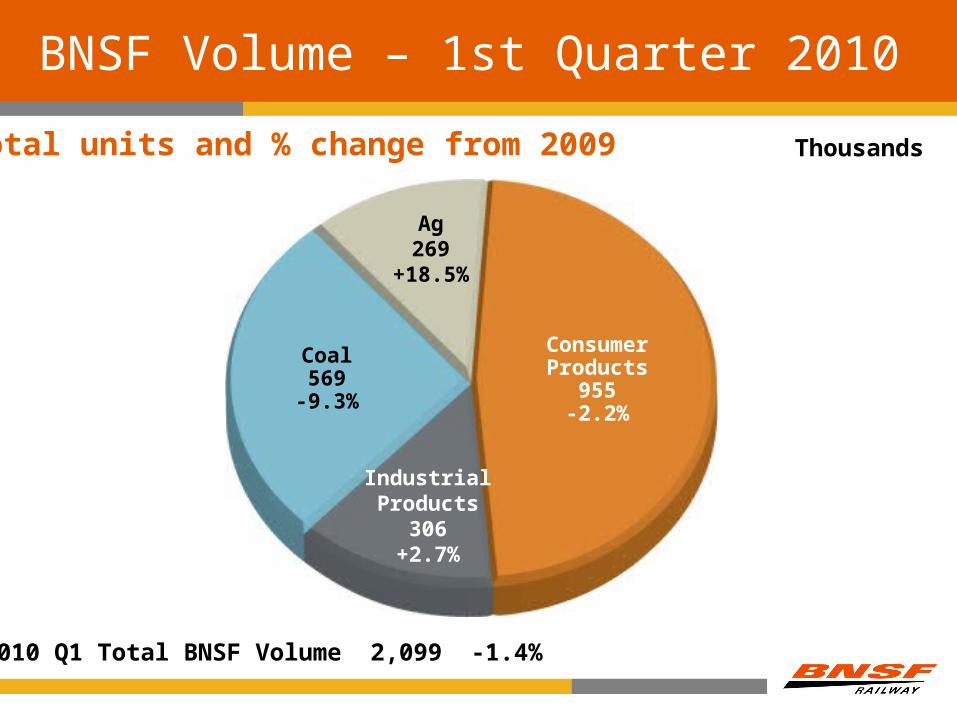
BNSF Volume – 1st Quarter 2010
Total units and % change from 2009
2010 Q1 Total BNSF Volume 2,099 -1.4%
Thousands
ConsumerProducts
955-2.2%
IndustrialProducts
306+2.7%
Ag269
+18.5%
Coal569
-9.3%
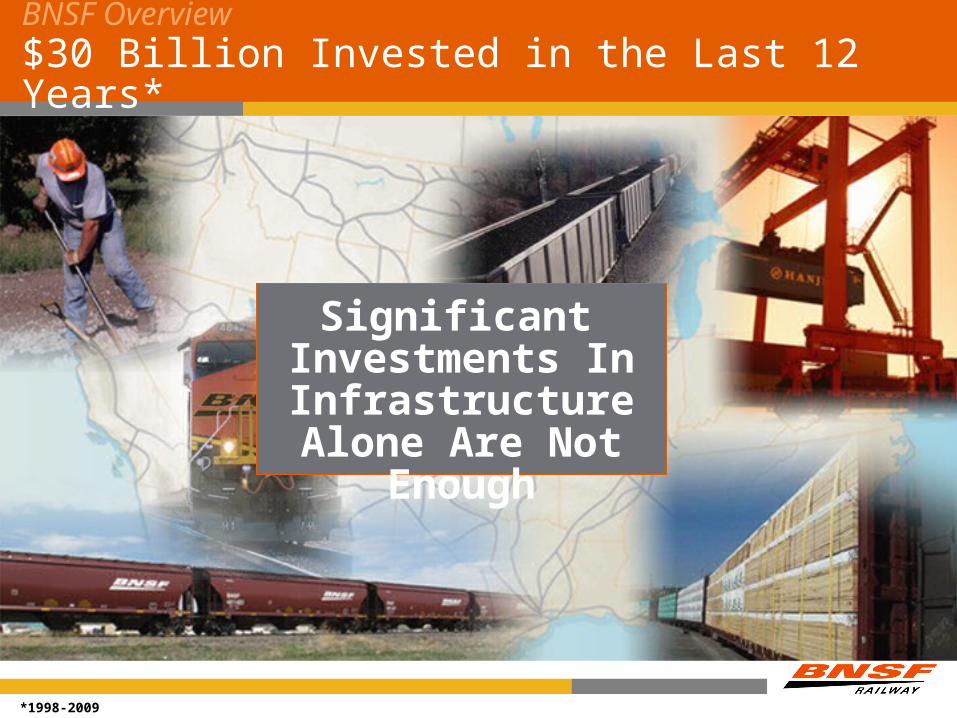
Significant Investments In
Infrastructure Alone Are Not Enough
*1998-2009
BNSF Overview $30 Billion Invested in the Last 12 Years*
18
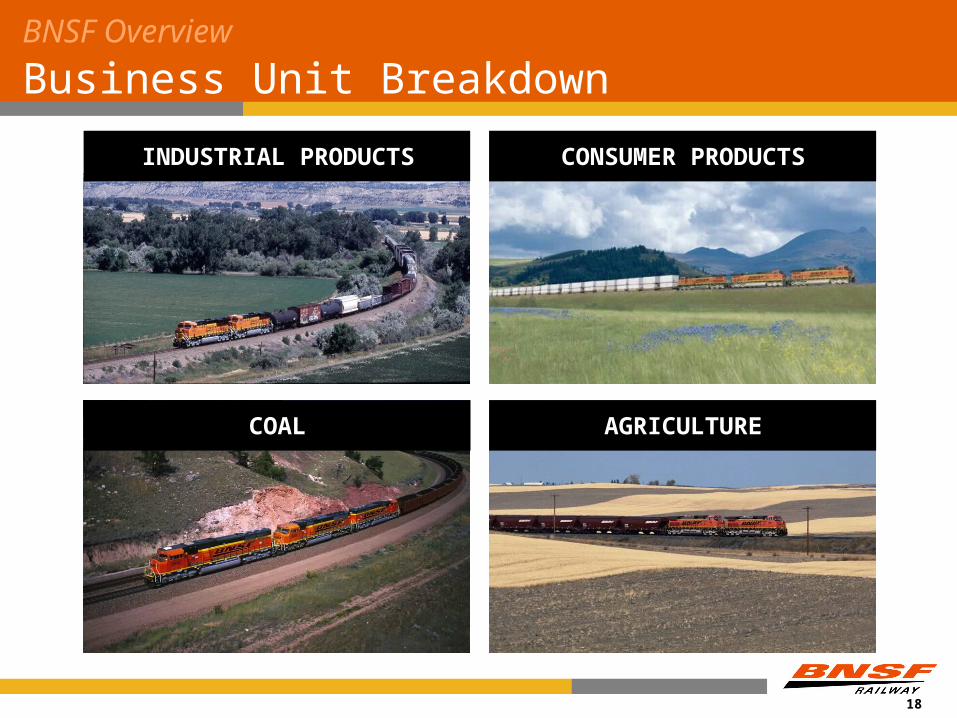
BNSF Overview Business Unit Breakdown
INDUSTRIAL PRODUCTS CONSUMER PRODUCTS
AGRICULTURECOAL
19
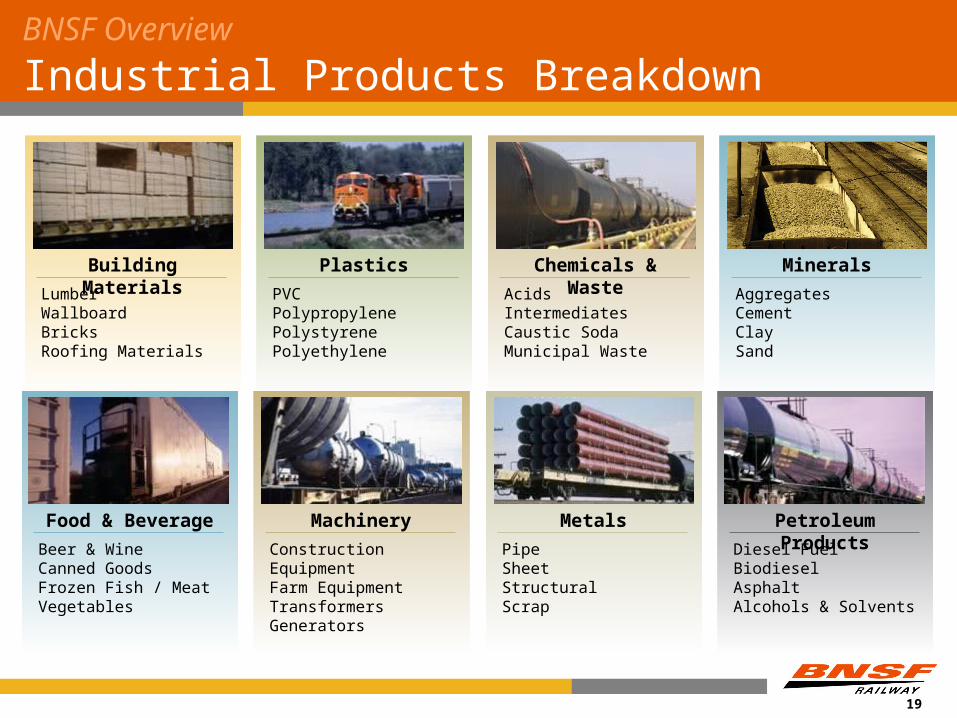
BNSF Overview Industrial Products Breakdown
Building Materials
LumberWallboardBricksRoofing Materials
Plastics
PVCPolypropylenePolystyrenePolyethylene
Chemicals & Waste
AcidsIntermediatesCaustic SodaMunicipal Waste
Minerals
AggregatesCementClaySand
Food & Beverage
Beer & WineCanned GoodsFrozen Fish / Meat Vegetables
Machinery
Construction EquipmentFarm EquipmentTransformersGenerators
Metals
PipeSheetStructuralScrap
Petroleum Products
Diesel FuelBiodieselAsphaltAlcohols & Solvents
20
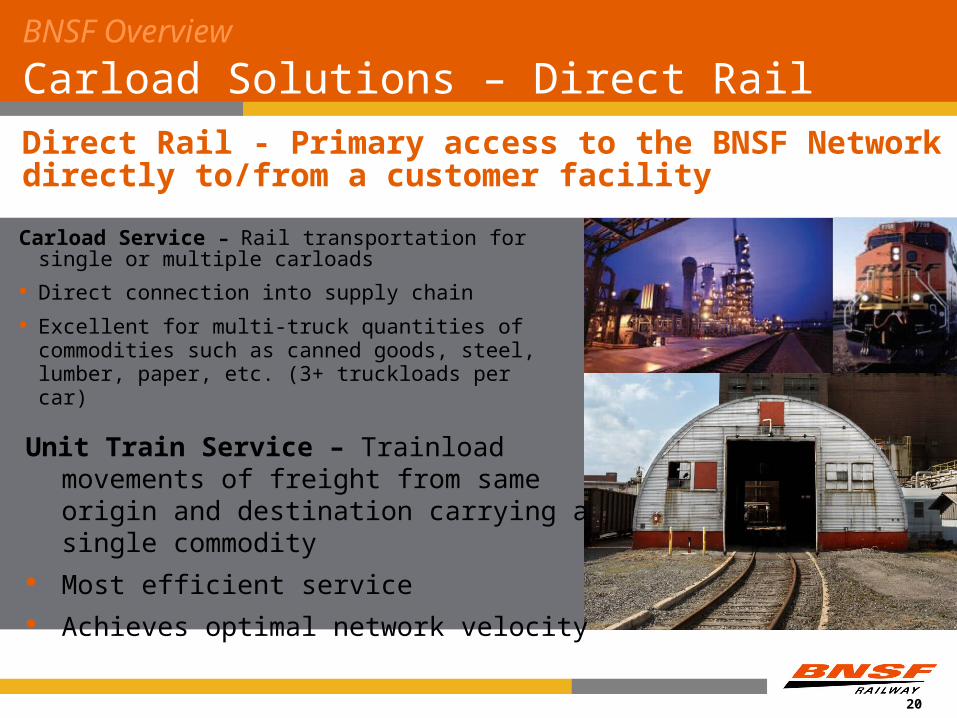
BNSF Overview Carload Solutions – Direct Rail
Carload Service – Rail transportation for single or multiple carloads
Direct connection into supply chain
Excellent for multi-truck quantities of commodities such as canned goods, steel, lumber, paper, etc. (3+ truckloads per car)
Direct Rail - Primary access to the BNSF Network directly to/from a customer facility
Unit Train Service – Trainload movements of freight from same origin and destination carrying a single commodity
Most efficient service Achieves optimal network velocity
21
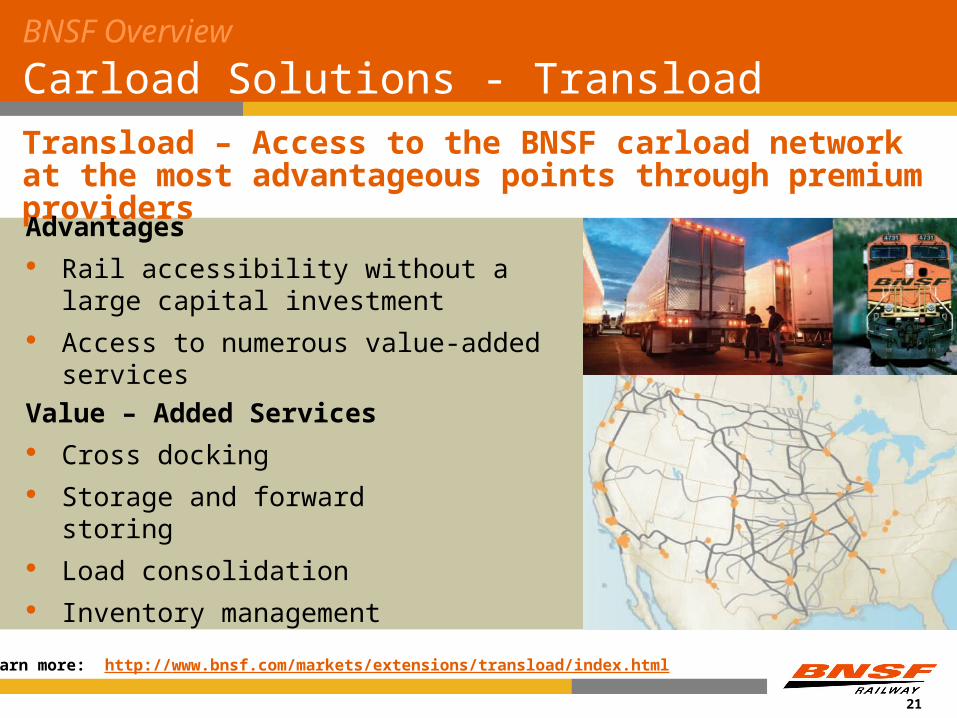
BNSF Overview Carload Solutions - Transload
Value – Added Services Cross docking Storage and forward storing Load consolidation Inventory management
Transload – Access to the BNSF carload network at the most advantageous points through premium providers
Advantages Rail accessibility without a large capital
investment Access to numerous value-added services
To learn more: http://www.bnsf.com/markets/extensions/transload/index.html
22
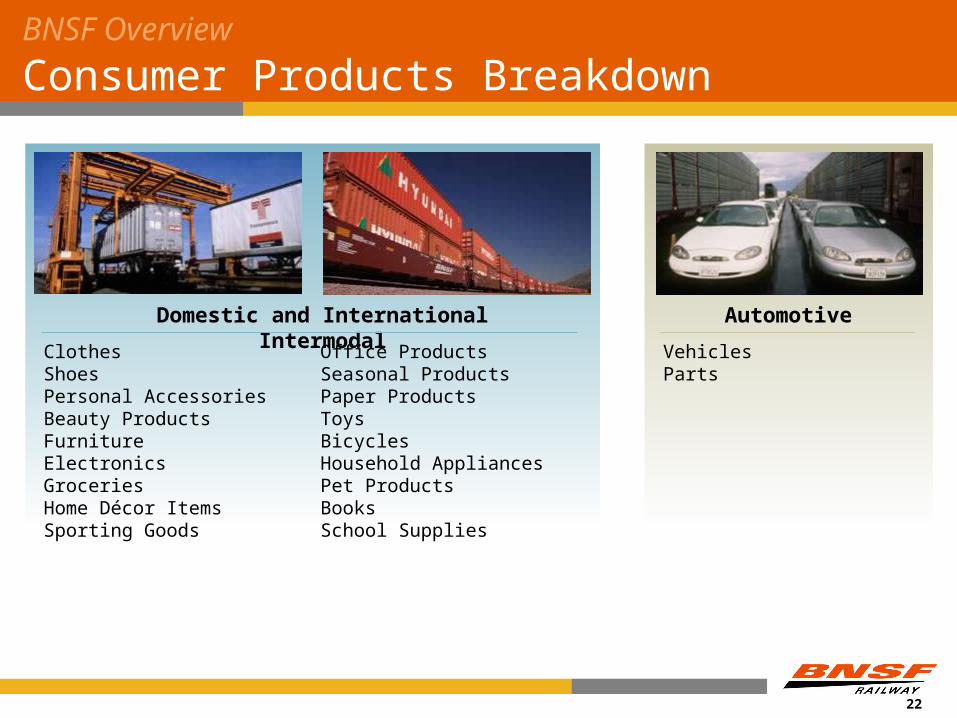
BNSF Overview Consumer Products Breakdown
Domestic and International Intermodal
ClothesShoesPersonal AccessoriesBeauty ProductsFurnitureElectronicsGroceriesHome Décor ItemsSporting Goods
Automotive
VehiclesParts
Office ProductsSeasonal ProductsPaper ProductsToysBicyclesHousehold AppliancesPet ProductsBooksSchool Supplies
23
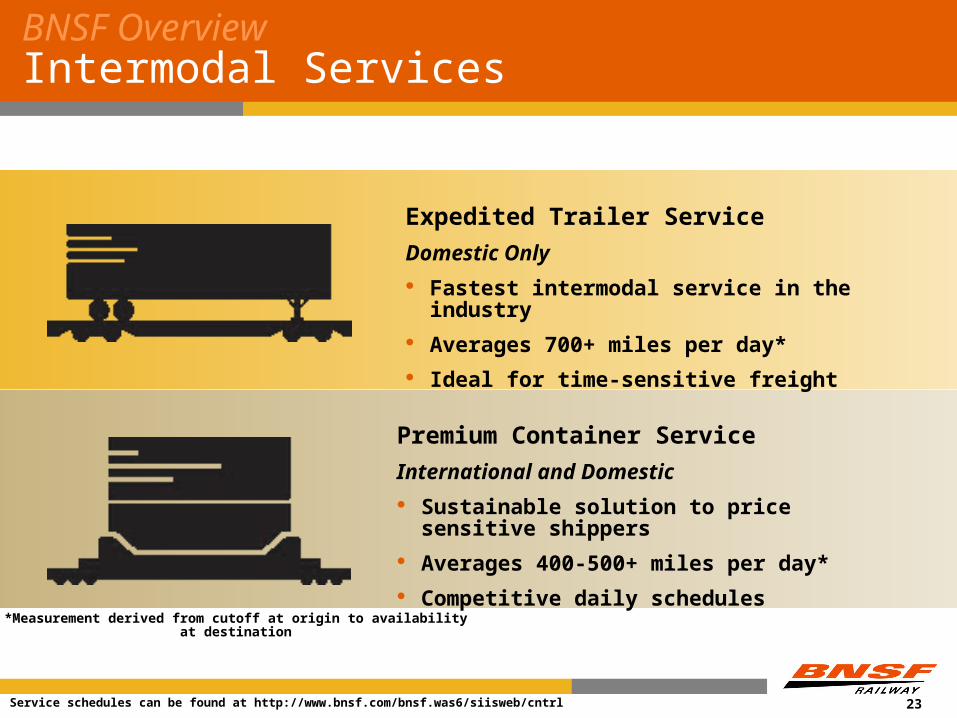
BNSF OverviewIntermodal Services
Premium Container Service
International and Domestic Sustainable solution to price sensitive shippers Averages 400-500+ miles per day* Competitive daily schedules
Expedited Trailer Service
Domestic Only Fastest intermodal service in the industry Averages 700+ miles per day* Ideal for time-sensitive freight
*Measurement derived from cutoff at origin to availability at destination
Service schedules can be found at http://www.bnsf.com/bnsf.was6/siisweb/cntrl
24
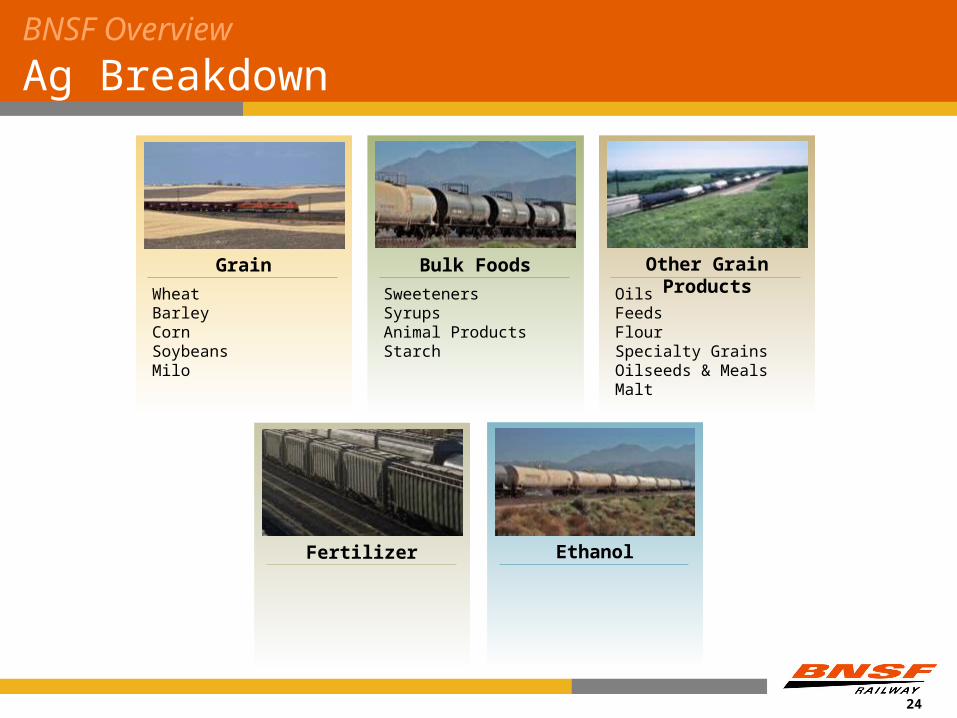
BNSF Overview Ag Breakdown
Grain
WheatBarleyCornSoybeansMilo
Bulk Foods
SweetenersSyrupsAnimal ProductsStarch
Other Grain Products
OilsFeedsFlourSpecialty GrainsOilseeds & MealsMalt
EthanolFertilizer
25
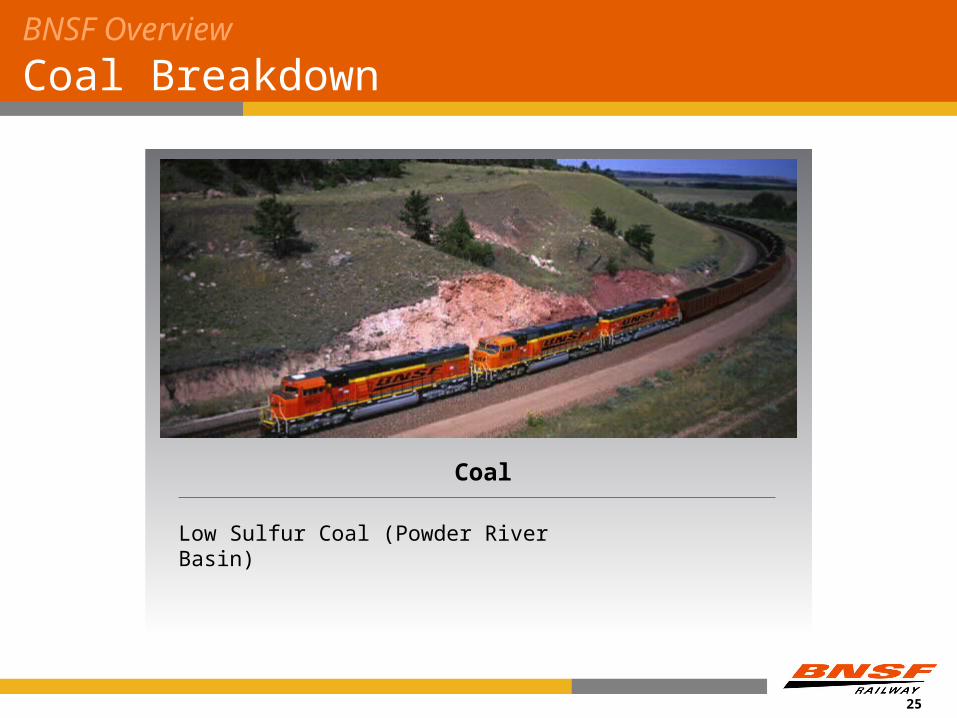
BNSF Overview Coal Breakdown
Coal
Low Sulfur Coal (Powder River Basin)
26
Why Rail?
27
Why Rail? Key Benefits
Fuel Efficiency – On average, railroads are three or more times more fuel efficient than trucks.
Highway Gridlock Reduction – A typical train takesthe freight equivalent of several hundred trucks off our highways.
Cost Efficiency – In general, shippers pay less for shipping freight via rail, rather than other forms of land transportation.
Environmental Friendliness – The EPA estimates that for every ton-mile, locomotives emit roughly one-third the amount of nitrogen oxides and particulates.
Source: AAR
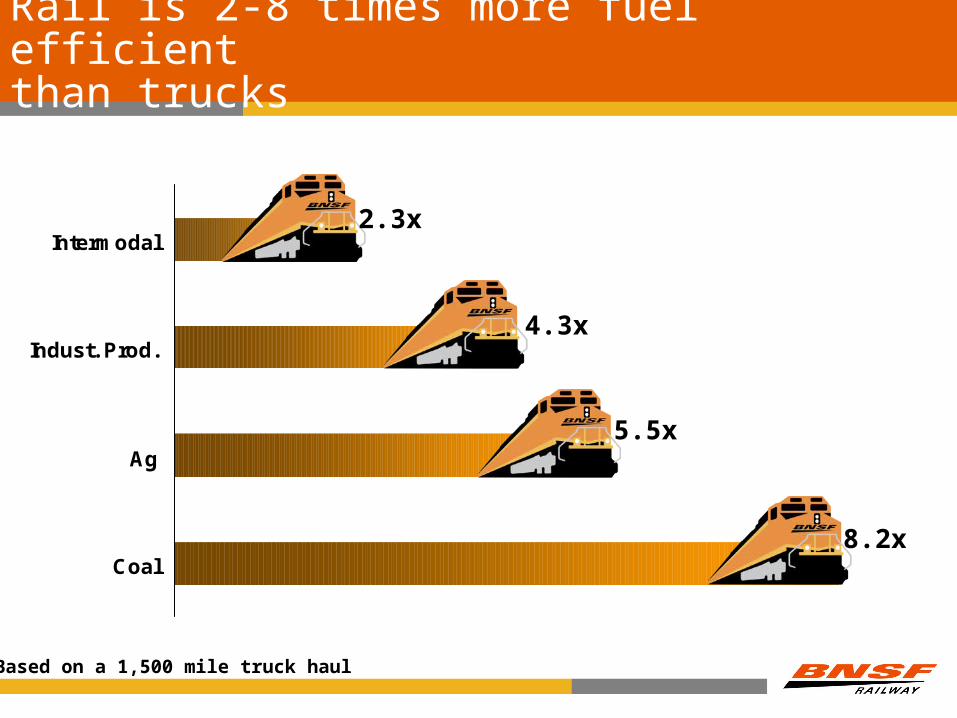
Rail is 2-8 times more fuel efficient than trucks
Coal
Ag
Indust. Prod.
Intermodal
*Based on a 1,500 mile truck haul
8.2x
5.5x
4.3x
2.3x
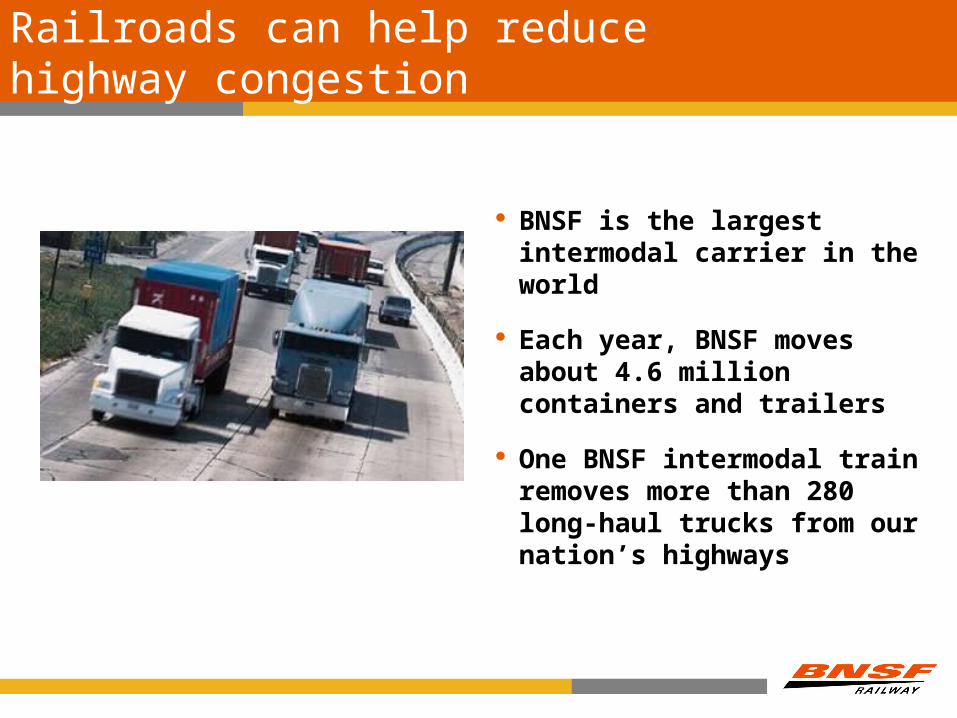
Railroads can help reduce highway congestion
BNSF is the largest intermodal carrier in the world
Each year, BNSF moves about 4.6 million containers and trailers
One BNSF intermodal train removes more than 280 long-haul trucks from our nation’s highways
30
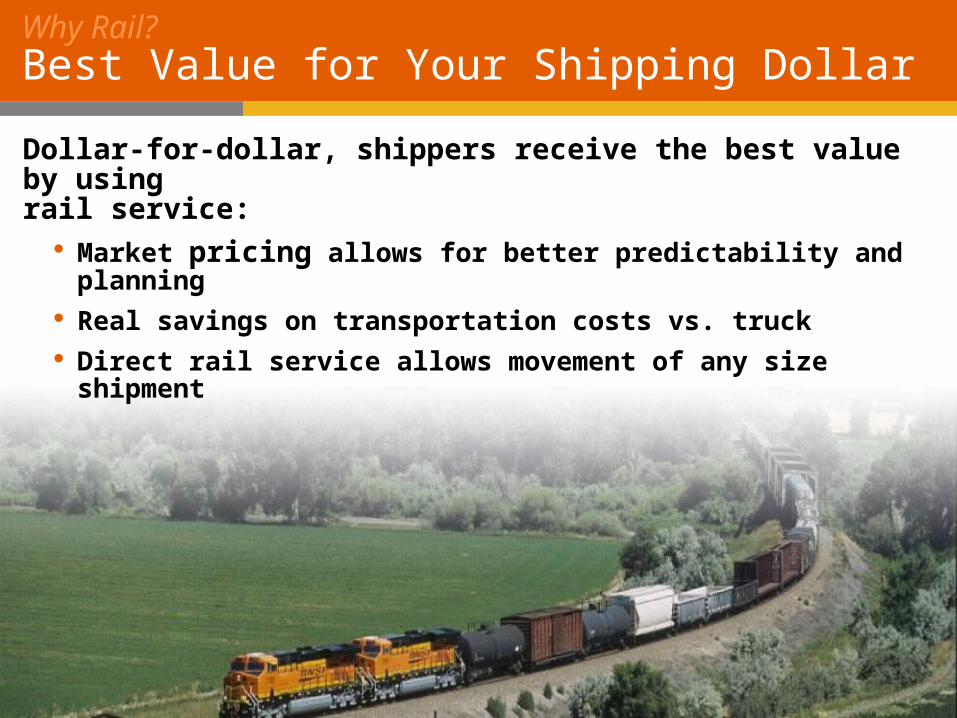
Dollar-for-dollar, shippers receive the best value by usingrail service:
Market pricing allows for better predictability and planning Real savings on transportation costs vs. truck Direct rail service allows movement of any size shipment
Why Rail? Best Value for Your Shipping Dollar
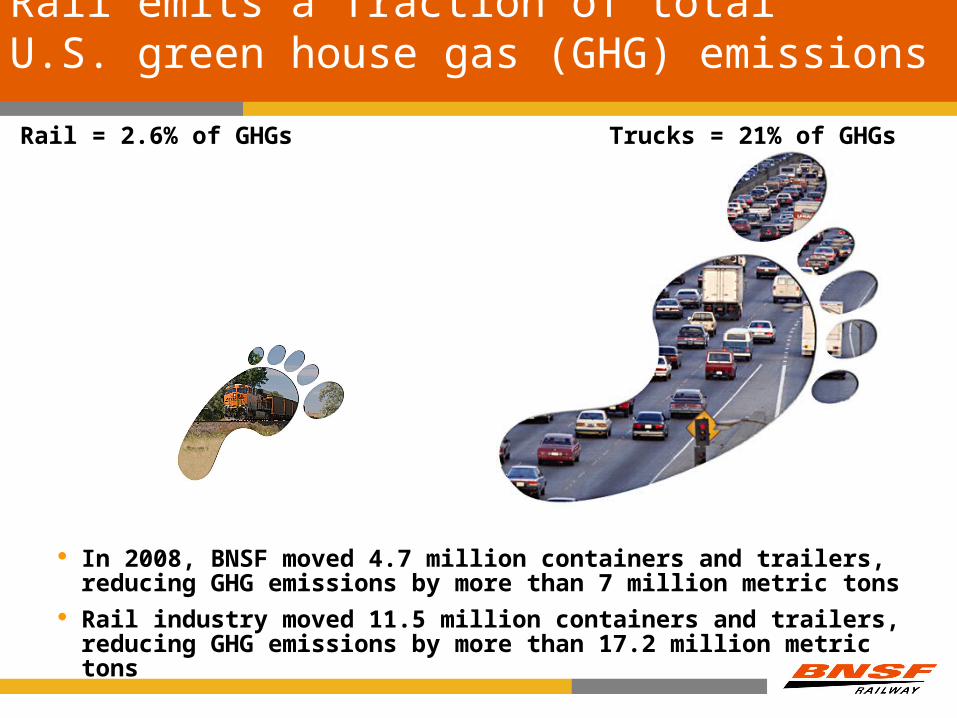
Rail emits a fraction of total U.S. green house gas (GHG) emissions
Rail = 2.6% of GHGs Trucks = 21% of GHGs
In 2008, BNSF moved 4.7 million containers and trailers, reducing GHG emissions by more than 7 million metric tons
Rail industry moved 11.5 million containers and trailers, reducing GHG emissions by more than 17.2 million metric tons
32
Why BNSF?
33
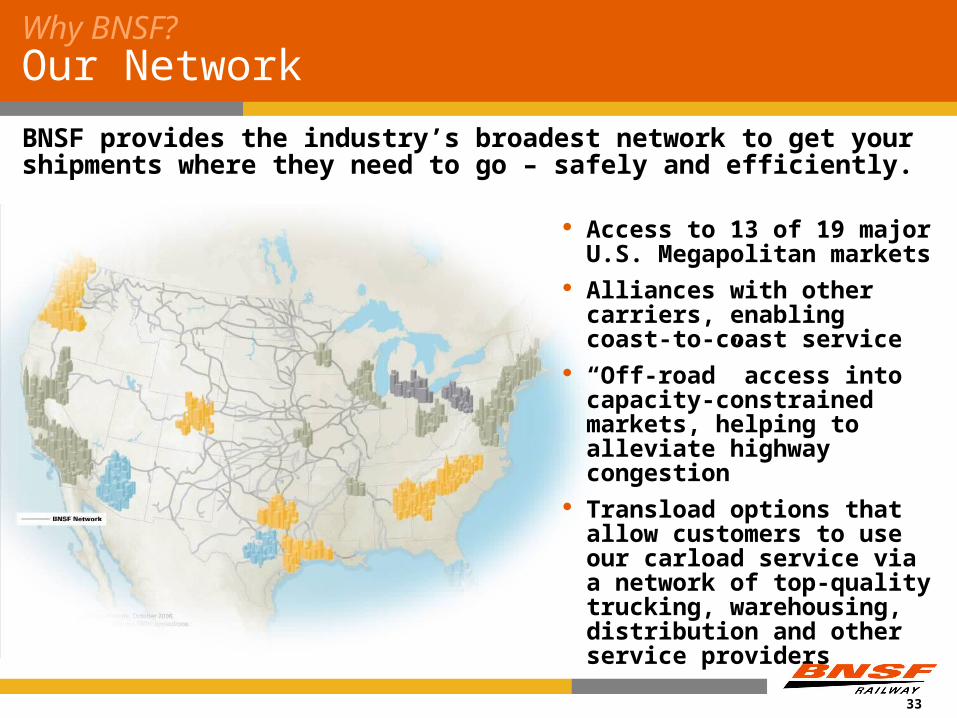
BNSF provides the industry’s broadest network to get your shipments where they need to go – safely and efficiently.
Access to 13 of 19 major U.S. Megapolitan markets
Alliances with other carriers, enabling coast-to-coast service
“Off-road” access into capacity-constrained markets, helping to alleviate highway congestion
Transload options that allow customers to use our carload service via a network of top-quality trucking, warehousing, distribution and other service providers
Why BNSF?Our Network
34
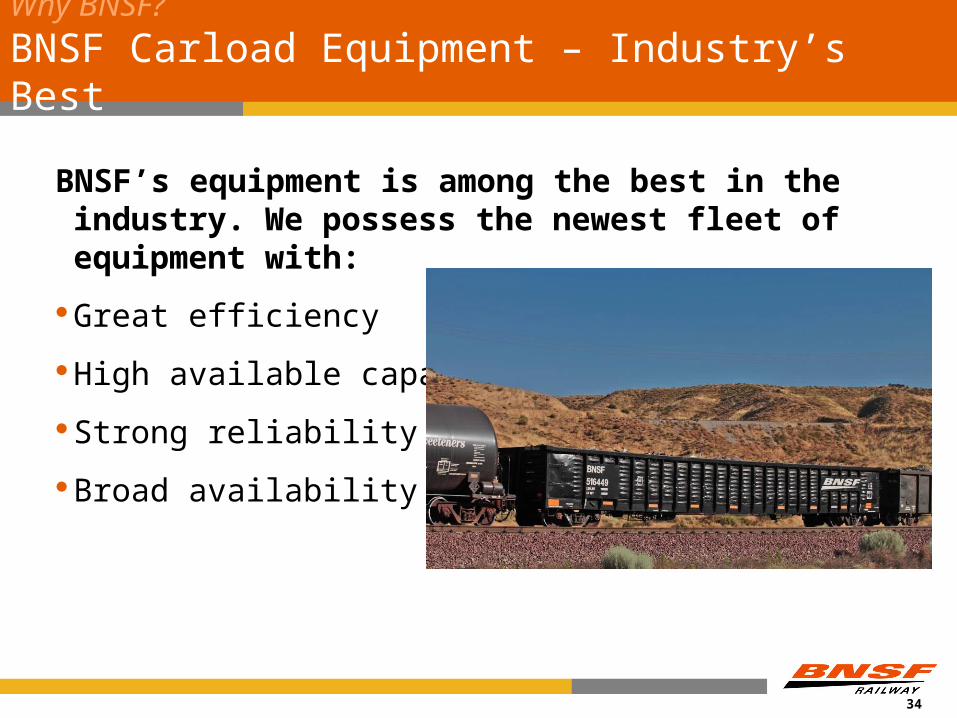
Why BNSF?BNSF Carload Equipment – Industry’s Best
BNSF’s equipment is among the best in the industry. We possess the newest fleet of equipment with:
Great efficiency
High available capacity
Strong reliability
Broad availability
3535
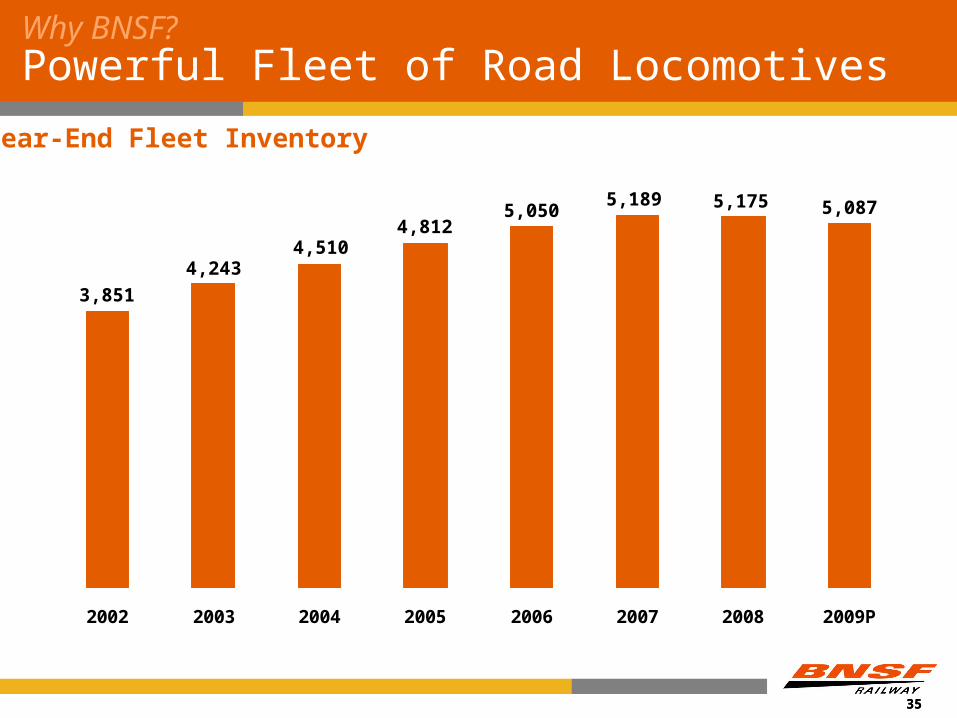
2002 2003 2004 2005 2006 2007 2008 2009P
Year-End Fleet Inventory
Why BNSF? Powerful Fleet of Road Locomotives
3,851
4,2434,510
4,8125,050
5,189 5,175 5,087
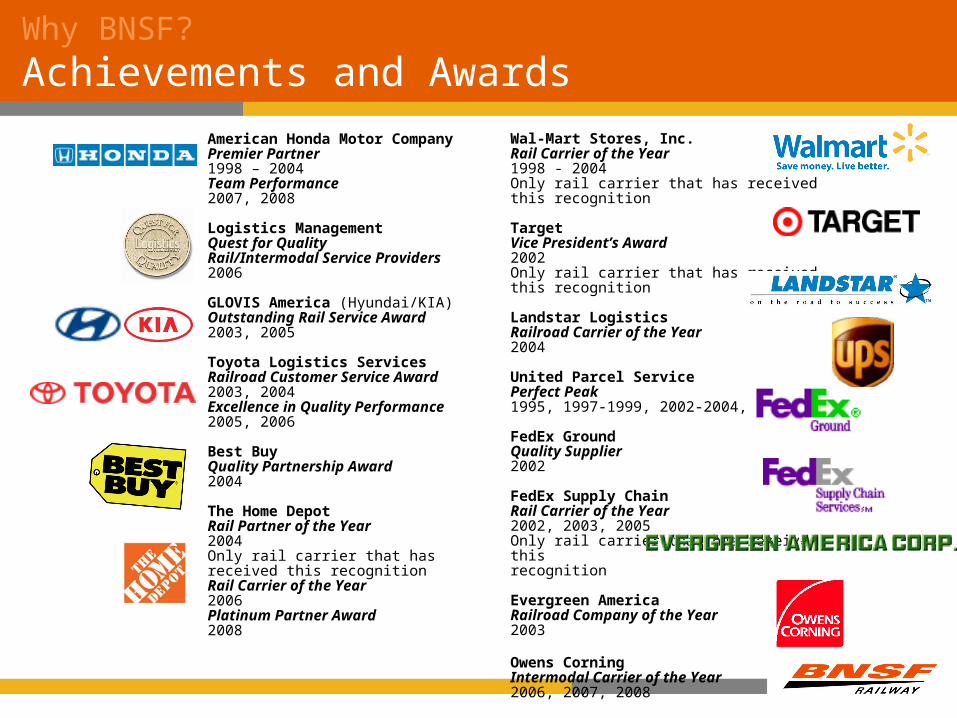
American Honda Motor CompanyPremier Partner1998 – 2004Team Performance2007, 2008
Logistics ManagementQuest for Quality Rail/Intermodal Service Providers2006
GLOVIS America (Hyundai/KIA)Outstanding Rail Service Award 2003, 2005
Toyota Logistics Services Railroad Customer Service Award 2003, 2004Excellence in Quality Performance2005, 2006
Best BuyQuality Partnership Award 2004
The Home DepotRail Partner of the Year2004Only rail carrier that has received this recognitionRail Carrier of the Year2006Platinum Partner Award2008
Wal-Mart Stores, Inc.Rail Carrier of the Year1998 - 2004Only rail carrier that has received this recognition
TargetVice President’s Award 2002Only rail carrier that has received this recognition
Landstar LogisticsRailroad Carrier of the Year 2004
United Parcel ServicePerfect Peak1995, 1997-1999, 2002-2004, 2007
FedEx GroundQuality Supplier 2002
FedEx Supply ChainRail Carrier of the Year 2002, 2003, 2005Only rail carrier that has received this recognition
Evergreen AmericaRailroad Company of the Year 2003
Owens CorningIntermodal Carrier of the Year2006, 2007, 2008
Why BNSF?Achievements and Awards
37
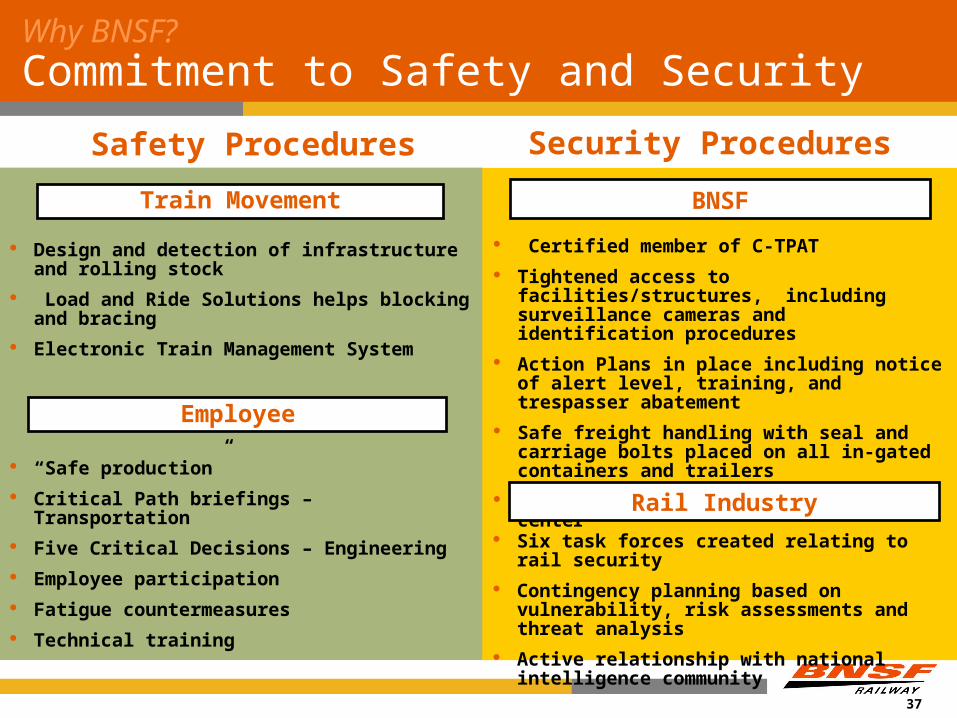
“Safe production” Critical Path briefings – Transportation Five Critical Decisions – Engineering Employee participation Fatigue countermeasures Technical training
Employee
Train Movement
Design and detection of infrastructure and rolling stock
Load and Ride Solutions helps blocking and bracing
Electronic Train Management System
BNSF
Certified member of C-TPAT Tightened access to facilities/structures,
including surveillance cameras and identification procedures
Action Plans in place including notice of alert level, training, and trespasser abatement
Safe freight handling with seal and carriage bolts placed on all in-gated containers and trailers
24-hour resource operations call center
Rail Industry Six task forces created relating to rail security Contingency planning based on vulnerability,
risk assessments and threat analysis Active relationship with national intelligence
community
Safety Procedures Security Procedures
Why BNSF? Commitment to Safety and Security
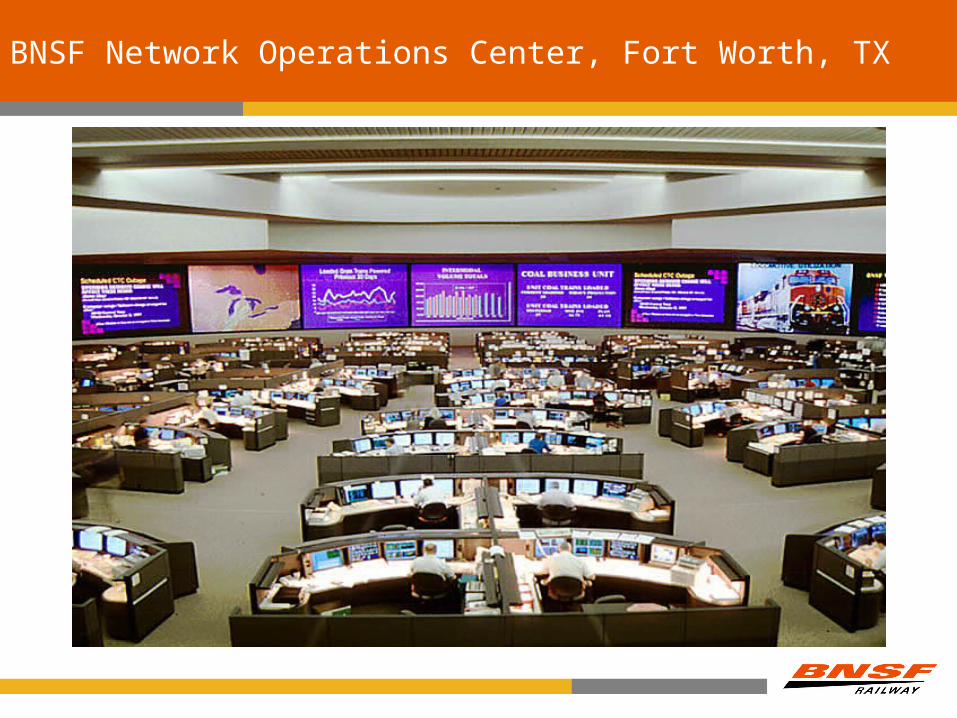
BNSF Network Operations Center, Fort Worth, TX

Thank you for your time.
Q&A
Related Documents