© 2003 The National Institute for Early Education Research By W. Steven Barnett, Ph.D., Kenneth B. Robin, Psy.M., Jason T. Hustedt, Ph.D., and Karen L. Schulman, M.P.P. THE STATE OF PRESCHOOL 2003 STATE PRESCHOOL YEARBOOK

Welcome message from author
This document is posted to help you gain knowledge. Please leave a comment to let me know what you think about it! Share it to your friends and learn new things together.
Transcript
© 2003 The National Institute for Early Education Research
By W. Steven Barnett, Ph.D., Kenneth B. Robin, Psy.M., Jason T. Hustedt, Ph.D., and Karen L. Schulman, M.P.P.
THE S TAT E O F P R E S CHOOL
2003 S TAT E PRE S CHOOL Y E ARBOOK
4
The State of Preschool: 2003 State Preschool Yearbook demonstrates that state preschool programs are failing the
nation’s children. Few set high standards and fewer still provide adequate funding. Even the disadvantaged
children targeted by most state preschool initiatives are not assured of access to high-quality programs. Most
children and their families receive even less help. Children’s learning and development suffers as a result. This
must change. Several states are leading the way, but the rest must follow if all our children are to receive
the early education they deserve.
In the 21st century no topic in education is more important than the education of our young children,
which is far different today than it was just a few decades ago.Today most children attend a preschool program
prior to kindergarten.Yet, they do so in a “system” that is highly uneven in access, educational quality, and
the financial burdens imposed on families. State governments have begun to create programs to increase
access, improve quality, and invest public resources in preschool education. As they do so, it is essential
that the public be well informed so that government can be held accountable. This State Preschool Yearbook
reports on the first of what will be annual check-ups on the programs funded by state governments to
educate America’s children at ages 3 and 4. The Yearbook clearly points out the state policies that impact
the level of access children have to preschool, the quality of preschool programs offered, and the commitment
of the state to resources for these programs.
Access
- Forty states funded 45 state preschool programs in the 2001–2002 school year. The 38 states providing
data enrolled approximately 700,000 children, almost all of whom were ages 3 and 4.
- The vast majority of children served by state prekindergarten programs were 4-year-olds, with 581,705,
or 14.8 percent, of the nation’s 4’s enrolled. Only Massachusetts and New Jersey enrolled more than 10
percent of their 3-year-olds.
- Two states sought to provide universal access to preschool, Georgia and Oklahoma.They enrolled more
than half of their 4-year-olds in state preschool programs. Seven other states enrolled more than 20 percent
of their 4’s, eight states enrolled 10–20 percent, and 20 states enrolled less than 10 percent. Insufficient
information was available from three states to determine the percentage of 4-year-olds served.
Qual ity
- All states needed to improve their quality standards. State quality standards varied widely. Most states
did not meet a majority of our research-based benchmarks for minimum state standards.
- Although no state met all 10 benchmarks for state quality standards, three state programs met nine out
of 10: Arkansas, Illinois and New Jersey’s “Abbott District” program.
- Only 18 states required preschool teachers in all of the programs they funded to have the four-year college
degree that every state requires of kindergarten teachers and that has been recommended by the National
Research Council for every preschool education classroom.
5
Resources
- Total state spending for state-funded prekindergarten exceeded $2.4 billion in 2001–2002. Ten states
accounted for 83 percent of all spending. Limited access resulted from limited funding.
- In most states, spending per child was far too low to assure quality. Only two states spent at least as much
per child enrolled as Head Start. On average, federal Head Start programs received nearly $3,500 more
per child than states provided to their preschool programs.
- Low state funding suggests that many states implicitly relied on local schools, parents, and others to share
the costs. This likely produces inequities in access to quality because the less a state spends the more
quality depends on financial capacity of local schools and parents.
- Most states allowed their preschool programs to be operated under a variety of auspices including public
schools, Head Start centers, and private child care centers. This permitted states to maximize their use
of existing resources when expanding state programs.
Conclusions and Recommendations
- Three state preschool programs stand out as exemplary in one or more ways that make them useful
models for other states. Georgia and Oklahoma provide far more access than any other states, and
Oklahoma requires that all its preschool teachers be certified. New Jersey’s “Abbott District” preschool
program sets the highest standards in the nation and is required to provide free preschool to all, beginning
at age 3, in 30 of the state’s largest and most disadvantaged school districts.
- Low state quality standards and funding levels in many states raise serious concerns about state commitment
to providing a good education to our young children. Recognizing that many states currently do not have
the resources to fully fund high-quality preschool, the federal government must make a major new
commitment to investing in prekindergarten programs. This federal effort should be designed, not just
to supplement, but to leverage new state funding.
- States need to improve their preschool data systems. It is impossible to obtain an unduplicated count
of children served or to track the amount of public funds spent on each child across the various federal
and state programs or to account for local efforts.
This report may be v iewed in i ts ent irety on the NIEER website at www.nieer.org.The information is also provided on the website in an interactive format for ease of use.
6
America has changed the way we educate young children. As recently as 1960 it was rare for children under
5 to be educated outside the home. Today, most children spend time in a preschool prior to kindergarten.
In 2001, 52 percent of 3- and 4-year-olds were in a nursery school or kindergarten classroom, and the
enrollment rate for 4-year-olds in 2001 had nearly matched the enrollment rate for 5-year-olds in 1970.1
Many social, economic and demographic trends have contributed to this dramatic change, as has scientific
progress demonstrating the importance of early learning for the development and future success of
our children.2
The State Preschool Yearbook has been developed by NIEER to provide information on one important
contributor to change in the education of young children—state-funded prekindergarten programs. This
2003 Yearbook is the first in an annual series reporting on programs funded by state governments to
educate children at ages 3 and 4. Primary responsibility for education in the United States resides with
state and local governments, and state prekindergarten programs will play an important role in the
education of young children in the 21st century. We recognize that other types of programs serve young
children under a variety of names and auspices, including the federal Head Start program and privately-
and publicly-funded child care. This report seeks to improve the public’s knowledge and understanding of
state prekindergarten programs in that larger array of programs.
This first State Preschool Yearbook describes state-funded prekindergarten programs in the 2001–2002
school year and establishes a baseline against which to compare future progress. The Yearbook data were
collected from an intensive survey of the states. Information is presented on three key characteristics of
prekindergarten programs: access, quality standards, and resources.
- Access: Access remains far from universal across the country and varies both across and within states.
The ability to attend preschool depends greatly on what parents can afford and where they live. We use
enrollment of children at ages 3 and 4 to measure the extent to which states expand opportunities for
preschool participation.
- Quality Standards: The quality of preschool education determines its educational value.Yet, many preschool
programs in the United States are poor to mediocre. State standards are essential for ensuring that preschool
programs provide quality education.The Yearbook compares state quality standards against a research-based
checklist of benchmarks.
- Resources: Resources, as measured by state expenditures for preschool, indicate each state’s commitment
to expanding access and ensuring educational adequacy. State spending per child in the prekindergarten
program is a key determinant of program quality and a measure of state support for equal access to a
good preschool education.
This Yearbook is organized into three major sections. The first section provides background information
on preschool education in the United States, a description of our data collection and analytical methods,
a national summary of our findings, and national policy recommendations. The second section presents
detailed reports identifying each state’s policies with respect to preschool access, quality standards, and
resources. In addition to basic program descriptions, these state pages describe unique features of state
programs and recent changes that can be expected to alter the future Yearbook data on these programs.
Finally, the last section contains the appendices, including tables that report all of the survey data obtained
from every state, as well as Head Start and child care data.
Over view of Preschool Education in the United StatesIn 1960, just 10 percent of the nation’s 3- and 4-year-old children were enrolled in any type of classroom.
The percentage of young children enrolled in preschool classrooms doubled by 1970 and doubled again
prior to 1990. It continued to rise through the 1990s, peaking in 1997 at just over 50 percent, a level that
remained steady through 2001.3 As shown in Figure 1 (page 10), increased maternal employment is only
one part of the explanation for increased enrollments. The upward trend was just as rapid for children of
stay-at-home mothers as for children with mothers in the labor force, leading to the conclusion that
increases in preschool enrollment were driven by a desire for a better early education. Increases in
parental education and income together with decreasing numbers of children per family increased the
inclination and ability of families to pay for education outside the home.
In the years since 1960, state-funded prekindergarten has emerged as one part of a complicated collection
of education and child care arrangements adopted by families. In sharp contrast to elementary school and
even kindergarten, preschool classrooms are primarily outside the public schools. Prekindergarten education
takes place in private programs, Head Start, and the public schools.Young children also spend time in family
home care—either in their own home or others’—with care provided by relatives, neighbors, or professional
child care providers. Many young children spend time in more than one type of education or care arrangement,
for example combining a part-day preschool program with family home child care. Parents remain the most
important influences on young children, and preschool programs support rather than replace parents.
7
8
Private Preschool Programs
In 1970, 70 percent of 3’s and 4’s attending preschool were enrolled in private programs. The provision of
preschool education expanded in both private and public sectors in the following decades, with the public
sector gaining only slightly on the private sector in terms of enrollment. In 1990, private programs still
served 64 percent of the children attending preschool programs. However, during the 1990s, the private
sector grew more slowly than the public sector. By 1995, only 52 percent of the children attending preschool
were in private programs. Private programs maintained a very small edge in total preschool enrollment
through 2001.4 Private preschools are operated by for-profits, independent nonprofits, and programs
sponsored by religious organizations. These operate under a wide variety of names including nursery
school, preschool, day care, and child care, and most are part-day programs. Regulation is primarily by
state child care agencies, but varies by state and within states by auspice. Some states exempt religious or
private school programs from child care licensing standards. Like their regulation and funding, the educational
quality of private programs is highly variable and tends to be lower on average than for public programs.5
About 20 percent of 3- and 4-year-olds are not enrolled in a preschool program, but do attend a family
home day care or receive in-home child care by relatives and others.6 Research has failed to find the kinds
of educational benefits from these kinds of child care arrangements that have been found for preschool
classes.This is an important source of concern because federal policy requires states to ensure that parents
receiving child care subsidies can choose these types of care, and state-funded prekindergarten programs
may permit services to be provided by family child care homes.
Head Start
The federal Head Start program has provided many low-income families across the nation with free
education for their young children since 1965. From 1975 to 1990 the program grew slowly. In 1975, Head
Start enrolled 5 percent of the nation’s 3- and 4-year-olds. By 1990 enrollment had risen to 7 percent.
Head Start grew faster in the 1990s and in the year 2000 served 11 percent of all 3- and 4-year-olds. In
2001, Head Start reported funding over 900,000 children,7 712,216 at ages 3 and 4. Despite this growth,
Head Start cannot reach all of the eligible children. Moreover, Head Start’s program standards fall short
of what is required to ensure that programs are highly effective. Head Start teacher qualifications and
compensation are of particular concern. Only recently has Congress required that half of Head Start
teachers have even a two-year college degree. And, Head Start teachers earn about half the average public
school teacher’s salary.Without fully-qualified teachers (BA degrees with a specialization in early childhood
education) who are adequately paid, Head Start is unlikely to ever be highly effective.8
9
1 Current Population Survey, October 2001, and U.S. Statistical Abstract 2000, Table No. 259.2 Bowman, B., Donovan, M., & Burns, S. (Eds.) (2001). Eager to Learn: Educating our preschoolers. Washington, DC: National Academy Press. Shonkoff, J.P. & Phillips, D.A. (Eds.) (2000). From neurons
to neighborhoods: The science of early childhood development. Washington, DC: National Academy Press.3 U.S. Statistical Abstract and Current Population Survey, October 2001. The CPS tracks “nursery school” enrollment. Comparison with data from the National Household Education Survey conducted
by the National Center for Education Statistics for all center-based programs suggests that perhaps 10 percent of child care center enrollment is not reported as nursery school.4 U.S. Statistical Abstract and Current Population Survey, October 2001. It seems likely that the CPS numbers may underestimate the percentage of children in private child care.5 Barnett, W.S., Tarr, J., Lamy, C., & Frede, E. (2001). Fragile lives, shattered dreams: A report on implementation of preschool education in New Jersey’s Abbott districts. New Brunswick, NJ:
National Institute for Early Education Research, Rutgers University. Cost, Quality and Outcomes Study Team. (1995). Cost, quality, and outcomes in child care centers: Public Report. Denver :University of Colorado at Denver, Economics Department. Zill, N., Resnick, G., Kim, K., Hubbell McKey, R., Clark, C., Pai-Samant, S., Connell, D., Vaden-Kiernan, M., O'Brien, R., D'Elio, M. (2001).Head Start FACES: Longitudinal Findings on Program Performance, Third Progress Report. Washington, DC: Research, Demonstration and Evaluation Branch & Head Start Bureau, Administrationon Children, Youth and Families, U.S. Department of Health and Human Services.
6 National Center for Educational Statistics (2001). National Household Education Survey. Washington, DC: National Center for Educational Statistics.7 Head Start Bureau (2003) Head Start Statistical Fact Sheets 2000–2003. http://www.acf.hhs.gov/programs/hsb/research/factsheets.htm 8 Barnett, W.S. (2003). Better teachers, better preschools: Student achievement linked to teacher qualifications. Preschool Policy Matters, 2. New Brunswick, NJ: National Institute for Early
Education Research. National Institute for Early Education Research (2003). Investing in Head Start teachers. Preschool Policy Matters, 4. New Brunswick, NJ: National Institute for EarlyEducation Research.
9 Trohanis, P. (2002). Progress in providing services to young children with special needs and their families. NECTAC Notes, 12, 1–18. Chapel Hill, NC: National Early Childhood TechnicalAssistance Center.
10 Mitchell, A.W. (2001). Education for all children: The role of states and the federal government in promoting prekindergarten and kindergarten. FCD Working Paper. NY: Foundation for Child Development. Schulman, K., Blank, H., & Ewen, D. (1999). Seeds of success: State prekindergarten initiatives 1998–99. Washington, DC: Children’s Defense Fund.
State Prekindergarten Programs
For the most part, states came late to the preschool education revolution. When they did, most followed
Head Start’s lead and targeted children with the greatest needs. They did so with two types of programs,
one providing preschool special education for children with disabilities and the other providing regular
preschool education to children in low-income families or otherwise identified as being at high risk for
school failure. This administrative structure parallels the structure already in place in K–12 education.
In the 1970s, states began to create entitlements to a free education for 3- to 5-year-old children with
disabilities. Illinois, Michigan and Wisconsin were the first states to do so in 1973–1974.9 Federal legislation
in 1986 provided federal funds as incentives for all states to provide a free appropriate education to young
children with disabilities by 1991–1992. The legislation was highly effective: the 24 states providing such
services prior to the legislation were joined by 25 more in 1991–1992, and one remaining state mandated
services in 1992–1993. Enrollment rose steadily over the years and by 2001 reached 353,238 in the 50
states (357,495 in states, US territories and military bases), or 4.6 percent of all 3- and 4-year-olds. Most
were served in public schools, but some were served in Head Start and private programs.
States began to create programs for children in poverty or otherwise determined to be at high risk of
poor academic progress in the mid-1960s, but the number of states and enrollments in their programs did
not grow substantially until the mid-1980s. Rapid growth accelerated through the 1990s. Prior to 1980
only seven states funded preschool programs.10 By 1991, this had climbed to 28 states with about 290,000
children being served. In 2001, 40 states funded preschool programs and served about 700,000 3- and 4-
year-olds. In recent years, states also began to expand eligibility from an “at-risk” group to all children.
Georgia created the first statewide universal Pre-K (UPK) program in 1995. Oklahoma, New York, and
West Virginia followed, though New York has not fully funded its program and West Virginia will phase it
in by 2012. In 2002, Florida voters approved a constitutional amendment that entitles all 4-year-olds to a
free, high-quality prekindergarten education by 2005.
By the 2001–2002 program year, states were providing an array of state-funded prekindergarten programs
to children. This Yearbook is brought to you in an effort to compare the similarities and dissimilarities, the
strengths and weaknesses and the opportunities and challenges ahead for these programs.
10
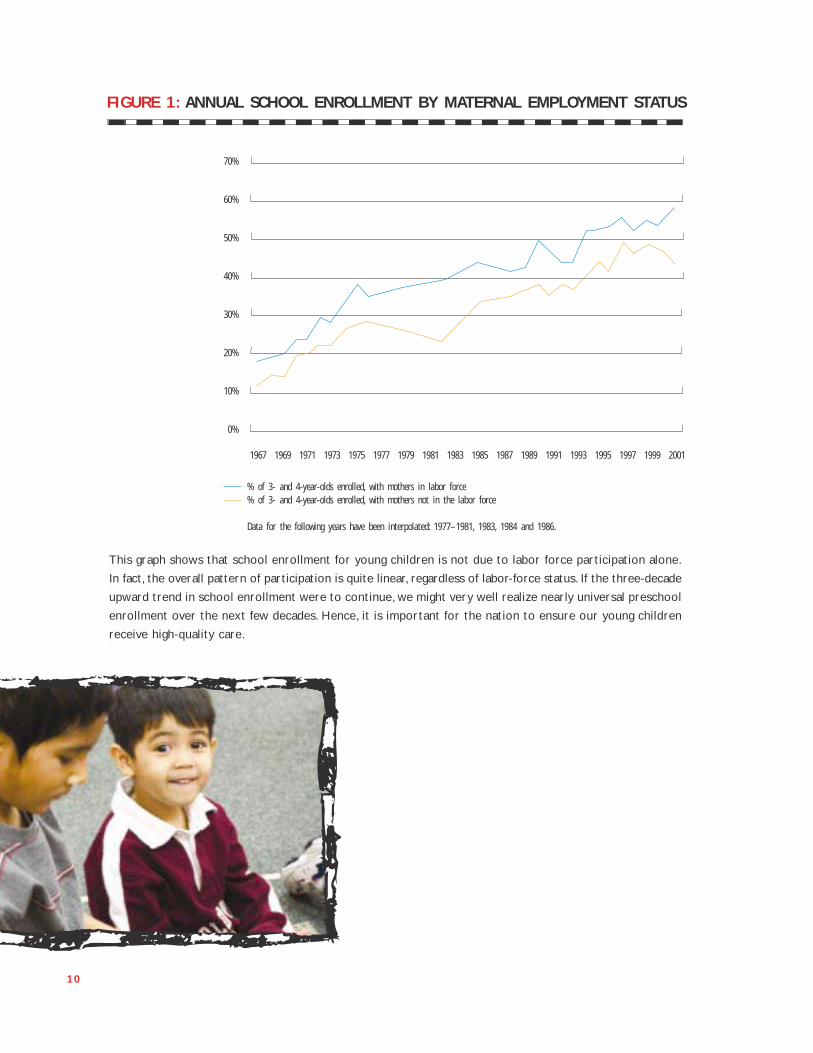
FIGURE 1: ANNUAL SCHOOL ENROLLMENT BY MATERNAL EMPLOYMENT STATUS
% of 3- and 4-year-olds enrolled, with mothers in labor force% of 3- and 4-year-olds enrolled, with mothers not in the labor force
Data for the following years have been interpolated: 1977–1981, 1983, 1984 and 1986.
70%
60%
50%
40%
30%
20%
10%
0%
1967 1969 1971 1973 1975 1977 1979 1981 1983 1985 1987 1989 1991 1993 1995 1997 1999 2001
This graph shows that school enrollment for young children is not due to labor force participation alone.
In fact, the overall pattern of participation is quite linear, regardless of labor-force status. If the three-decade
upward trend in school enrollment were to continue, we might very well realize nearly universal preschool
enrollment over the next few decades. Hence, it is important for the nation to ensure our young children
receive high-quality care.
Our report focuses on state-funded preschool initiatives as defined by the following criteria:
- The initiative is state-funded.
- The focus of the initiative is on the child. This does not exclude programs that have a parent education
component, but does exclude programs whose major component is parent education.
- The initiative serves children of prekindergarten age, usually 3 and/or 4. Some initiatives may serve broader
age ranges, but programs that serve only infants and toddlers are excluded.
- Funds for the initiative support a group learning experience for children two or more days per week.
- The initiative is distinct from the state’s child care subsidy system, although the prekindergarten initiative
may be closely coordinated with the subsidy program.
- The initiative is not primarily designed to serve children with disabilities.
- State supplements to the federal Head Start program were considered to constitute de facto state pre-
school programs if they substantially expanded the number of children served. State supplements to fund
quality improvements, extended days, or other program enhancements and that expanded enrollment
minimally were not considered equivalent to a state preschool program.
11
WHAT QUA L I F I E S A S A S TAT E P R E S CHOOL PROGRAM ?
12
Children who attend high-quality preschool programs gain experiences that can dramatically change their
lives for the better. The first five years of life are a unique period of growth and development in which
children acquire the foundational capabilities that prepare them for later success in school and life
generally. Many studies find that high-quality preschool programs produce large gains in school readiness
for economically disadvantaged children. These gains translate into improved achievement and behavior in
school. Later, follow-up research with the children at older ages finds that the former disadvantaged
preschoolers earn more money, experience more stable home lives and become more responsible citizens
than they would otherwise.1 There is growing evidence that preschool has similar, though most likely smaller,
benefits for children who are not poor.2 The significant gains enjoyed beyond the children themselves
include benefits for their families and communities—indeed, the nation as a whole.
Yet, few programs exist of the quality necessary to bring about the benefits promised by research. Public
financial support is limited, and parents face high costs for quality programs. The public programs that do
exist are primarily targeted to reach the most disadvantaged children, and even many of these children
remain unserved. Parents in the United States bear twice as much of the cost of early care and education
as their counterparts in other developed countries.3 The costs of a high-quality program can surpass the
costs of education at a public university. Two-earner families may be caught in a bind because of the long
hours of child care they must pay for, while single-earner families can find it difficult to afford even a good
part-day program. Too many children in the United States lack access to any preschool program at all and
too many others do not have access to a high-quality educational program.
A national poll of 3,230 voters conducted for NIEER in 2001 revealed strong public sentiment for
increased state responsibility for high-quality preschool programs. Nearly 90 percent supported the view
that states should provide funding for preschool programs so all parents could afford to enroll their children
in high-quality programs. In addition, 85 percent agreed that states should ensure the quality of preschool
programs by setting standards for learning and teacher qualifications.
WHY SHOULD STATES SUPPORT HIGH-QUALITY PRESCHOOL PROGRAMS?
“It is irrefutable that some children are better prepared for school than others. No
one would expect a youngster to play Chopin’s “Etudes” without first taking piano lessons.
Those with more enriching experiences, who have a sense of order and sequence and
understand the routines that often are crucial to learning, enjoy an advantage.”
Gene I. Maeroff, Universal Pre-Kindergarten: State of Play
13
1 Barnett, W. S. (1998). Long-term effects on cognitive development and school success. In W. S. Barnett & S. S. Boocock (Eds.), Early care and education for children in poverty: Promises, programs,and long-term results (pp. 11–44). Albany, NY: SUNY Press. Bowman, B. T., Donovan, M. S., & Burns, M.S. (Eds.). (2001). Eager to learn: Educating our preschoolers. Washington, DC: NationalAcademy Press.
2 Innes, F., Denton, K., & West, J. (2001, April). Child care factors and kindergarten outcomes: Findings from a national study of children. Paper presented at the Annual Meeting of the Society for Research in Child Development, Minneapolis, MN. Peisner-Feinberg, E., Burchinal, M.R., Clifford, R.M., Culkin, M.L., Howes, C., Kagan, S.L., Yazejian, N., Byler, P., Rustici, J., & Zelazo, J. (1999).The Children of the Cost, Quality, and Outcomes Study Go to School. Chapel Hill: University of North Carolina at Chapel Hill, Frank Porter Graham Child Development Center. Sammons, P., Sylva,K., Melhuish, E., Siraj-Blatchford, I., Taggart, B., & Elliot, K. (2002). Measuring the impact of preschool on children’s cognitive progress over the pre-school period. (Technical paper 8a). London:Institute of Education, University of London. Sammons, P., Sylva, K., Melhuish, E., Siraj-Blatchford, I., Taggart, B., & Elliot, K. (2003). Measuring the impact of preschool on children’s social/behavioraldevelopment over the pre-school period. (Technical report 8b). London: Institute of Education, University of London.
3 Kagan, S., & Neuman, M. (2003). Integrating early care and education. Educational Leadership, 60 (7), 58–63.
Long-Term Educational / Societal Benef its
Numerous studies show that high-quality preschool programs increase test scores and decrease grade
repetition and special education placements for economically disadvantaged children.This includes research
conducted at the Chicago Child Parent Centers in Illinois; High/Scope Educational Research Foundation in
Ypsilanti, Michigan; and the Abecedarian Preschool Project in Chapel Hill, North Carolina. Results of these
long-term follow-up studies included higher high school graduation rates, increased college attendance,
decreased crime and delinquency, and improved employment and earnings. Even though most research has
focused on the education gains achieved by children in lower-income families, there is also evidence of
gains in school readiness and achievement for the rest of the population from high-quality preschool programs.
Invest ing in Pre-K: An Economic Development Strategy
States searching for economic development strategies should first look to high-quality preschool, which
can provide higher educational returns to the students, greater financial returns to our communities and
families, and a more productive workforce to help shoulder future financial responsibilities. Cost-benefit
analyses and other rigorous research demonstrate that preschool programs can be sound public investments
with real, inflation-adjusted public returns as high as 12 percent, and combined public and private returns
of 16 percent.The Federal Reserve Bank of Minneapolis urges states to invest in early education programs
as an economic development strategy based on the exceptionally high payoff. In its economic research, the
Federal Reserve Bank found that early childhood investments make more sense than spending on venture
capital funds, subsidizing new industries such as biotechnology, building new stadiums or providing tax
incentives for businesses.
14
Data included in the state profiles were primarily collected from state prekindergarten administrators in
2003. After using various published studies to identify state prekindergarten initiatives, we sent surveys to
the state-level administrators of these initiatives. Administrators were first asked to confirm that their
program fit our definition of a state prekindergarten initiative and to inform us about any other initiatives in
their states that met the definition. We defined state prekindergarten initiatives as state-funded programs
that support a group learning experience for prekindergarten-age children, usually 3- and/or 4-year-olds.
See “What Qualifies as a State Preschool Program” (page 11) for more details about the definition.
The NIEER survey requested program information for the 2001–2002 school year. It primarily consisted
of questions that asked administrators to select an answer from a few specific choices, or that asked
administrators to provide a short response. The survey was divided into sections on access, eligibility
requirements, equity of access, program standards, personnel and resources.
Once administrators returned their completed surveys to us, we contacted them with follow-up questions
about any information requiring clarification. Each administrator was given the opportunity to verify the
summary of their program included in the state profiles as well as the data included in Appendix A and
used as the basis for the state profiles. When contacted to verify the information, administrators were
asked to provide updated information about funding and enrollment for 2002–2003. The administrators’
answers to each survey question, including several for which data were not presented in the state profiles,
are provided in Appendix A.
A few items reported in the state profiles are derived from other sources. Data on curriculum standards
were obtained from a survey and analysis conducted by Mid-continent Research for Education and
Learning (McREL) for NIEER in 2003. McREL surveyed states to identify their prekindergarten standards
and then reviewed documents outlining those standards as of 2003 for each state. Only standards specific
to prekindergarten were included in the analysis and not, for instance, standards for a broad grade range
such as prekindergarten through fourth grade, which were viewed as too general to provide effective guidance.
Data on federal Head Start enrollment for 2001–2002 were provided by the Head Start Bureau in the U.S.
Department of Health and Human Services. Spending and enrollment data used to calculate federal Head
Start spending per child for each state were also provided by the Head Start Bureau. Appendix B provides
additional Head Start data. Data on special education enrollment in the Individuals with Disabilities
Education Act Preschool Grants program (IDEA Section 619 of Part B) were obtained from the U.S. Office
of Special Education Programs,1 and are reported in Appendix C.
Total federal, state, and local expenditures on K–12 were calculated by NIEER using data from the National
Education Association (NEA). Federal, state, and local spending as percentages of total spending were
provided in the NEA’s May 2003 report, “Rankings and Estimates: Rankings of the States 2002 and
Estimates of School Statistics 2003.” These data are consistent with, but more up-to-date than federal
government statistics on K–12 expenditures.
15
Total expenditures include capital outlays and interest on debt as well as current operating expenditures.
Although current operating expenditures are more commonly reported as an indicator of the cost of
K–12 education, they underestimate the full cost of K–12 education.Thus, we calculated total expenditure
per K–12 pupil for each state by adding an estimate of annual capital outlays and interest on debt to current
expenditures. This added amount was calculated based on the national average percentage of K–12
expenditures accounted for by capital outlays and interest on debt. In some cases, preschool programs
may have other sources of state funding for facilities, but in many states (particularly for private programs
and Head Start) per child funding from states must cover all costs.
The percentages of children served in state preschool programs, federal Head Start, and special education
are provided separately for 3- and 4-year-olds for every state. However, not every state reported enrollment
separately by age.When this was the case, we estimated age breakdowns based on the average proportion
of enrollees at each age in states that serve 3-year-olds and report enrollment by age. Total population
numbers were obtained from the Census 2000 for total state population at each age.
State prekindergarten spending per 3- and 4-year-old living in the state was calculated from spending data
provided by the states and population data from the 2000 Census. If a state program served both 3- and
4-year-olds, then total state spending was divided between age groups according to the proportion of the
enrolled population at each age. For example, if 30 percent of children served in a program were 3 years
old, then we considered 30 percent of total state spending to be directed toward services for 3-year-olds.
We then divided the appropriate estimate of state spending by the total state population at the corre-
sponding age.
States are ranked separately on three measures: percentage of 4-year-olds enrolled in state-funded
preschool programs, percentage of 3-year-olds enrolled in state-funded preschool programs, and state
spending per child enrolled in state-funded preschool programs. The first two rankings were obtained
using enrollment figures provided by the states and Census 2000 data, while the third represents total
state spending divided by enrollment, using data reported by the states. All states that provided data
receive a rank, beginning at “1” for the state with the highest percentage of children served or the highest
per child spending figure. Florida, Minnesota, and Rhode Island did not provide the information necessary
to be ranked, and are listed in the rankings tables as “NA” (not available). In addition, the spending-per-child
rank for Pennsylvania is presented as “NA” because the state did not report total funding for 2001–2002.
The 10 states that do not fund a preschool initiative receive rankings of “50.”
Distr ict of Columbia
Data for the District of Columbia are presented following the state pages. As the District of Columbia is
the only city that is not part of a state, it has unique implications for a report on state programs. Many
city school districts in the United States fund prekindergarten. In fact, population density is a strong pre-
dictor of preschool program enrollment. However, children enrolled in local school district prekinder-
garten programs that are not state-funded are not included in this report. Nor are city school district
funds that support children in state prekindergarten programs included in the funding totals. Given the
District’s unique status, we report its information but do not include the District in multi-state compar-
isons because it is not a state; for policy purposes, it would be more appropriately compared to other
major urban school districts.
1 Data are available on the Internet at www.ideadata.org.
16
This section of the Yearbook provides a detailed summary of findings on access, quality standards, and
resources, with each section discussed separately in the following pages.
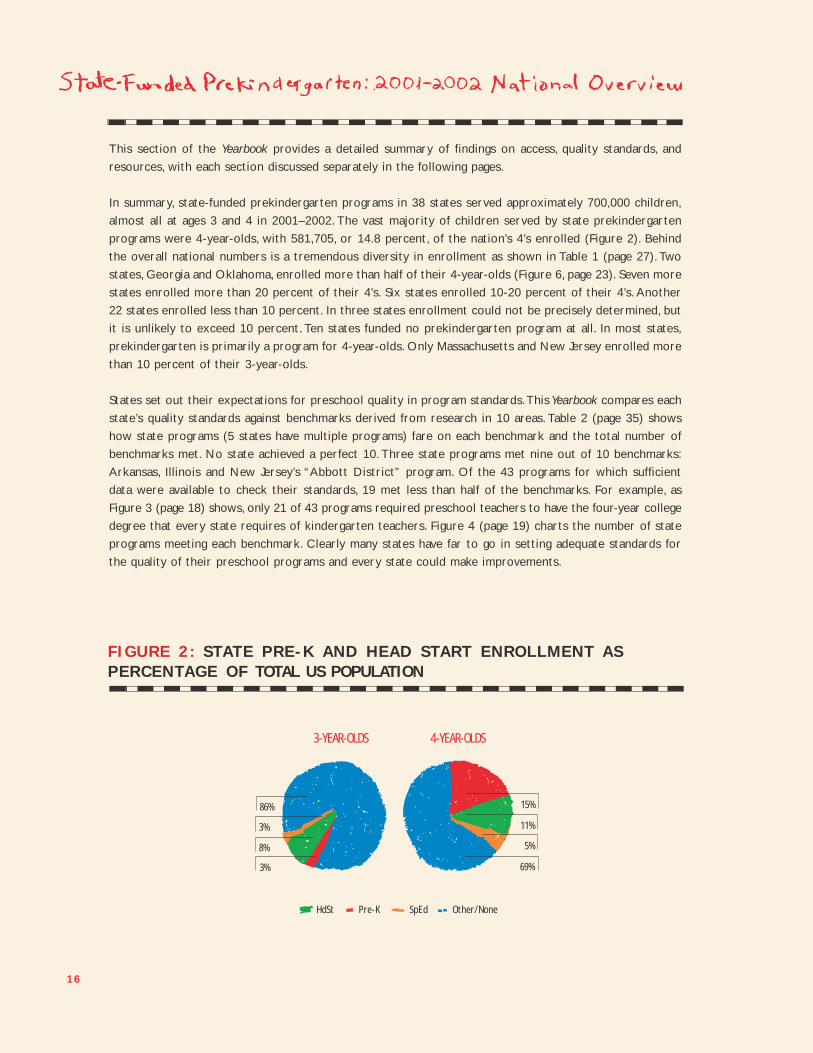
In summary, state-funded prekindergarten programs in 38 states served approximately 700,000 children,
almost all at ages 3 and 4 in 2001–2002. The vast majority of children served by state prekindergarten
programs were 4-year-olds, with 581,705, or 14.8 percent, of the nation’s 4’s enrolled (Figure 2). Behind
the overall national numbers is a tremendous diversity in enrollment as shown in Table 1 (page 27). Two
states, Georgia and Oklahoma, enrolled more than half of their 4-year-olds (Figure 6, page 23). Seven more
states enrolled more than 20 percent of their 4’s. Six states enrolled 10-20 percent of their 4’s. Another
22 states enrolled less than 10 percent. In three states enrollment could not be precisely determined, but
it is unlikely to exceed 10 percent. Ten states funded no prekindergarten program at all. In most states,
prekindergarten is primarily a program for 4-year-olds. Only Massachusetts and New Jersey enrolled more
than 10 percent of their 3-year-olds.
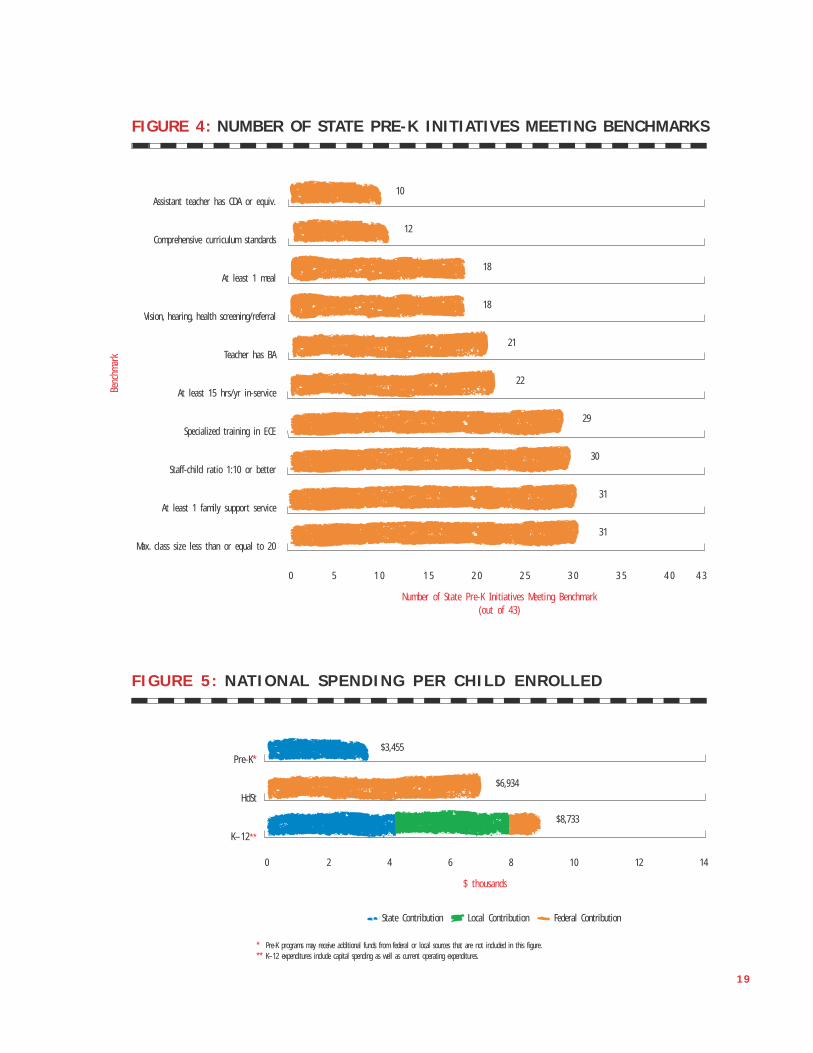
States set out their expectations for preschool quality in program standards. This Yearbook compares each
state’s quality standards against benchmarks derived from research in 10 areas. Table 2 (page 35) shows
how state programs (5 states have multiple programs) fare on each benchmark and the total number of
benchmarks met. No state achieved a perfect 10. Three state programs met nine out of 10 benchmarks:
Arkansas, Illinois and New Jersey’s “Abbott District” program. Of the 43 programs for which sufficient
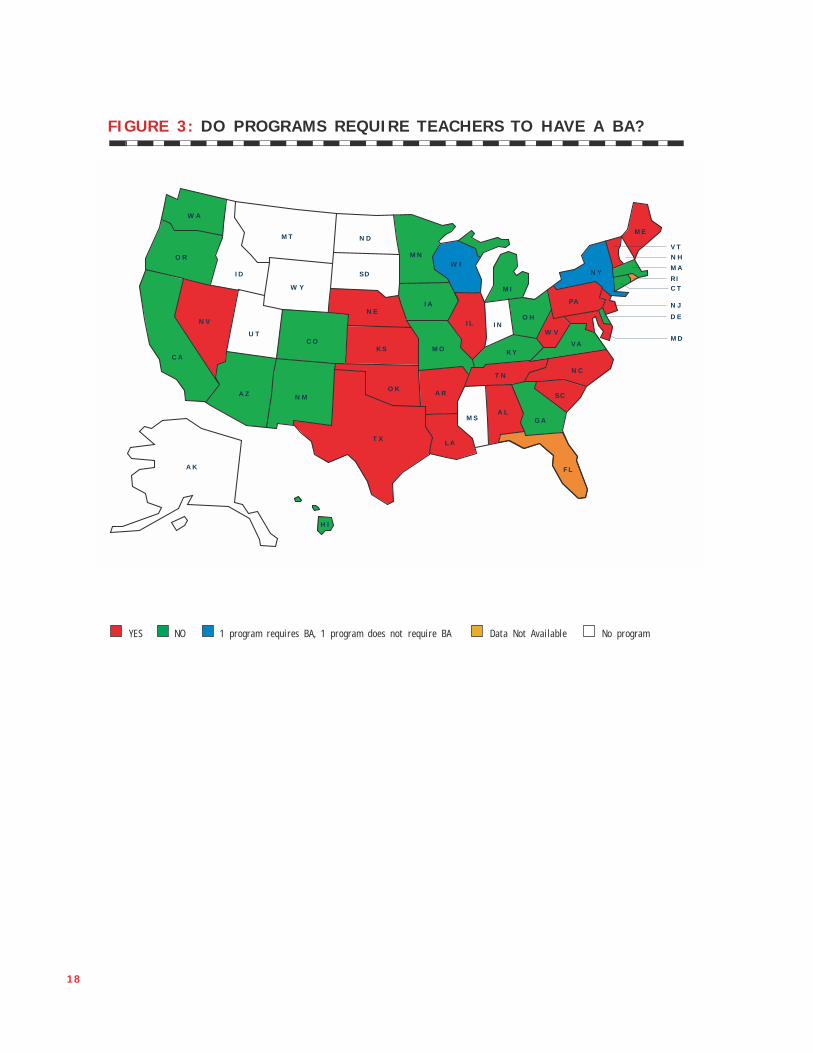
data were available to check their standards, 19 met less than half of the benchmarks. For example, as
Figure 3 (page 18) shows, only 21 of 43 programs required preschool teachers to have the four-year college
degree that every state requires of kindergarten teachers. Figure 4 (page 19) charts the number of state
programs meeting each benchmark. Clearly many states have far to go in setting adequate standards for
the quality of their preschool programs and every state could make improvements.
F I GURE 2 : S TAT E P R E - K AND HEAD S TART ENROL LMENT A SP ERC ENTAGE O F TOTAL US POPULATION
3-YEAR-OLDS 4-YEAR-OLDS
8%
3%
3%
15%
11%
5%
69%
Hd S t P r e - K S p E d O t h e r / N o n e
86%
17
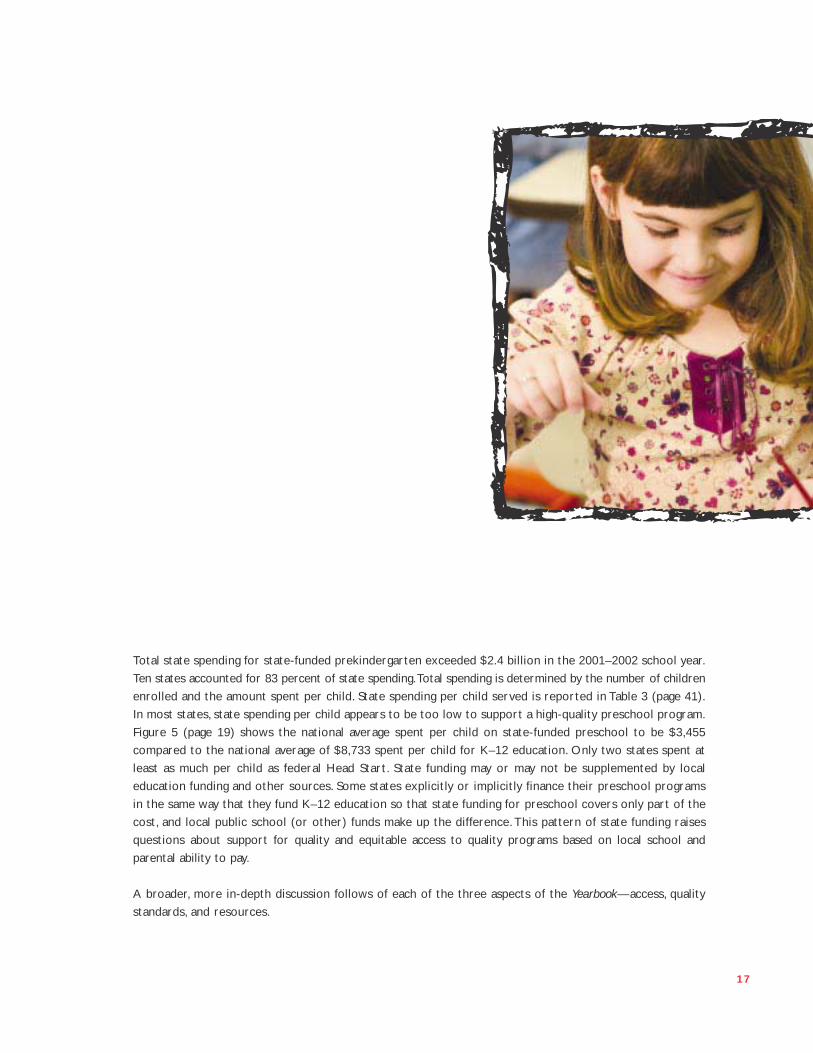
Total state spending for state-funded prekindergarten exceeded $2.4 billion in the 2001–2002 school year.
Ten states accounted for 83 percent of state spending.Total spending is determined by the number of children
enrolled and the amount spent per child. State spending per child served is reported in Table 3 (page 41).
In most states, state spending per child appears to be too low to support a high-quality preschool program.
Figure 5 (page 19) shows the national average spent per child on state-funded preschool to be $3,455
compared to the national average of $8,733 spent per child for K–12 education. Only two states spent at
least as much per child as federal Head Start. State funding may or may not be supplemented by local
education funding and other sources. Some states explicitly or implicitly finance their preschool programs
in the same way that they fund K–12 education so that state funding for preschool covers only part of the
cost, and local public school (or other) funds make up the difference. This pattern of state funding raises
questions about support for quality and equitable access to quality programs based on local school and
parental ability to pay.
A broader, more in-depth discussion follows of each of the three aspects of the Yearbook—access, quality
standards, and resources.
18
M A
R IC T
N H
N J
D E
M D
V T
WA
O R
C A
N V
I D
M T N D
S D
W Y
U T
A Z
C O
N M
T X
O K
K S
N E
M N
I A
M O
A R
L A
M SA L
G A
F L
S C
N C
VA
T N
K Y
I L
W I
M I
I NO H
PA
W V
N Y
M E
A K
H I
Y E S NO 1 p r og r am r e q u i r e s B A , 1 p r og r am d o e s n o t r e q u i r e B A D a t a N o t A v a i l a b l e N o p r og r am
F IGURE 3 : DO PROGRAMS R EQU I R E T E A CHER S TO HAVE A B A ?
19
FIGURE 4: NUMBER OF STATE PRE-K INITIATIVES MEETING BENCHMARKS
Assistant teacher has CDA or equiv.
Comprehensive curriculum standards
At least 1 meal
Vision, hearing, health screening/referral
Teacher has BA
At least 15 hrs/yr in-service
Specialized training in ECE
Staff-child ratio 1:10 or better
At least 1 family support service
Max. class size less than or equal to 20
10
12
18
18
21
22
29
30
31
31
0 5 1 0 1 5 2 0 2 5 3 0 3 5 4 0 4 3
Number of State Pre-K Initiatives Meeting Benchmark(out of 43)
Benc
hmar
k
F IGURE 5 : NAT IONAL S P END ING P ER CH I LD ENROLLED
State Contribution Local Contribution Federal Contribution
* Pre-K programs may receive additional funds from federal or local sources that are not included in this figure.** K–12 expenditures include capital spending as well as current operating expenditures.
0 2 4 6 8 10 12 14
$ thousands
Pre-K*
HdSt
K–12**
$3,455
$6,934
$8,733
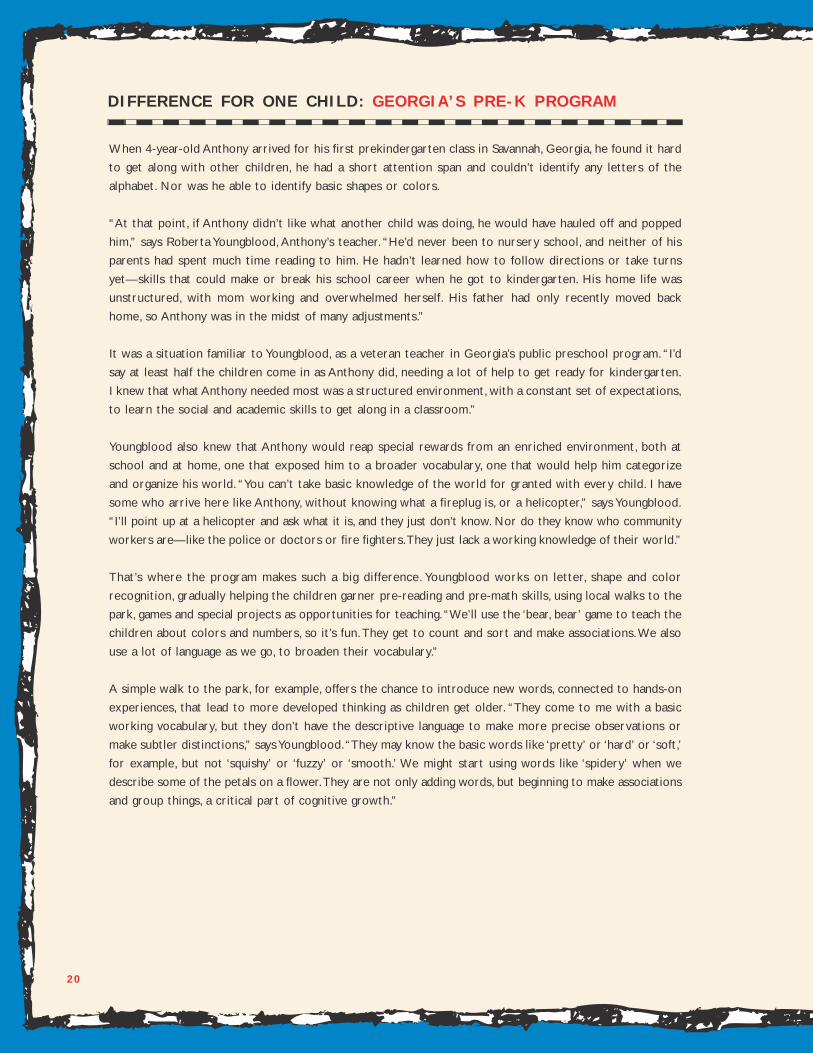
D I F F E R ENCE FOR ONE CH I LD : G EORG I A ’ S P R E - K P ROGRAM
20
When 4-year-old Anthony arrived for his first prekindergarten class in Savannah, Georgia, he found it hard
to get along with other children, he had a short attention span and couldn’t identify any letters of the
alphabet. Nor was he able to identify basic shapes or colors.
“At that point, if Anthony didn’t like what another child was doing, he would have hauled off and popped
him,” says Roberta Youngblood, Anthony’s teacher. “He’d never been to nursery school, and neither of his
parents had spent much time reading to him. He hadn’t learned how to follow directions or take turns
yet—skills that could make or break his school career when he got to kindergarten. His home life was
unstructured, with mom working and overwhelmed herself. His father had only recently moved back
home, so Anthony was in the midst of many adjustments.”
It was a situation familiar to Youngblood, as a veteran teacher in Georgia’s public preschool program. “I’d
say at least half the children come in as Anthony did, needing a lot of help to get ready for kindergarten.
I knew that what Anthony needed most was a structured environment, with a constant set of expectations,
to learn the social and academic skills to get along in a classroom.”
Youngblood also knew that Anthony would reap special rewards from an enriched environment, both at
school and at home, one that exposed him to a broader vocabulary, one that would help him categorize
and organize his world. “You can’t take basic knowledge of the world for granted with every child. I have
some who arrive here like Anthony, without knowing what a fireplug is, or a helicopter,” says Youngblood.
“I’ll point up at a helicopter and ask what it is, and they just don’t know. Nor do they know who community
workers are—like the police or doctors or fire fighters.They just lack a working knowledge of their world.”
That’s where the program makes such a big difference. Youngblood works on letter, shape and color
recognition, gradually helping the children garner pre-reading and pre-math skills, using local walks to the
park, games and special projects as opportunities for teaching. “We’ll use the ‘bear, bear’ game to teach the
children about colors and numbers, so it’s fun. They get to count and sort and make associations. We also
use a lot of language as we go, to broaden their vocabulary.”
A simple walk to the park, for example, offers the chance to introduce new words, connected to hands-on
experiences, that lead to more developed thinking as children get older. “They come to me with a basic
working vocabulary, but they don’t have the descriptive language to make more precise observations or
make subtler distinctions,” says Youngblood. “They may know the basic words like ‘pretty’ or ‘hard’ or ‘soft,’
for example, but not ‘squishy’ or ‘fuzzy’ or ‘smooth.’ We might start using words like ‘spidery’ when we
describe some of the petals on a flower.They are not only adding words, but beginning to make associations
and group things, a critical part of cognitive growth.”

21
In Anthony’s case, Youngblood also worked with his parents, teaching them how to work with Anthony at
home, playing word games, reading and taking on some projects that helped extend Anthony’s attention
span, build his sense of success and accomplishment and engage him in learning. “In our program we really
try to get parents involved, and then you see the kids just zoom.You also see the parents blossom, as they
learn how to teach their children new skills.”
So it was that Anthony began to settle down at school, follow directions, and as importantly, learn how to
get along with his peers. “The emphasis on language in our program gave him a new way to communicate
with his peers. Rather than hauling off and hitting them, he could put his feelings and needs into words.
That makes a huge difference.”
Indeed, the new power of self-control gave Anthony the ability to focus. “You could just see it. It was like
a relief for him. Without the shoving and hitting, he could pay attention to what was going on, and gradually,
step by step, as he experienced success, he could focus better and better.”
Day by day, he grew more involved in the lessons and with the other children, learning as he went. “He
began to identify letters, learned to count and to know his colors. With each gain, he practiced more and
then added new skills.”
By year’s end, Anthony could identify all his colors, knew the entire alphabet in upper case, some lower-case
letters, and could count and categorize with great ease. “He was just a different child than the one who
came to me at the beginning of the year. I remember, at the end of last year, we were sitting in a circle and
I was reading. A child next to Anthony started to talk and interrupt the story, and Anthony put his fingers
to his lips and pointed at the book, to let the other child know to pay attention.”
Even better,Youngblood says, is Anthony’s joy in his own success. “He laughs as he tells me the right answer.
He’s proud of what he’s learned. He chimes right in, tells me the answer to a question and then just laughs
with joy at his accomplishment. That’s the kind of attitude that is going to help him succeed in school.”
…by Betty Holcomb
22
Children who attend high-quality prekindergarten programs are better prepared for school, academically,
socially and emotionally. Over the past few decades, more states have begun funding prekindergarten
programs and these state prekindergarten programs have served an increasing number of children.
However, many children continue to lack access to prekindergarten. Children may not be able to participate
because they do not meet the eligibility criteria or the state does not fund a program in their district.
Nearly 700,000 children were participating in state prekindergarten programs in 2001–2002. Enrollment
in each of the states varied widely—from just 432 children in Nevada to more than 147,000 children in
Texas. This variation was not simply a factor of the size of the state—for example, West Virginia has a
population of 3- and 4-year-olds similar to Nebraska, but its prekindergarten program served 14 times as
many children.
Preschool for Al l Versus Limited Access
A few states have established or are taking steps toward establishing universal prekindergarten. Georgia
currently provides funding and sets eligibility criteria to make prekindergarten available to all 4-year-olds
whose families want them to participate. Under Oklahoma’s prekindergarten program, all 4-year-olds are
eligible to participate and the state reimburses districts for each child enrolled in prekindergarten, in
those districts that offer prekindergarten classes.
New York established a “Universal Prekindergarten” program several years ago that was expected to begin
with a limited number of children and expand to be available to all children within five years. However, the
program has not received funding increases as originally scheduled and it generally remains available only
to children in low-income families and children who have other risk factors.
A few other states have long-term plans for moving toward universal prekindergarten.West Virginia passed
legislation to make prekindergarten available to all 4-year-olds by 2012, and Florida is required by a 2002
constitutional amendment to make prekindergarten universally available for 4-year-olds by 2005. These
plans are still in the very early stages of implementation.
El ig ibi l i ty Criter ia
Most states do not offer access to all preschool-age children, choosing to target their prekindergarten
programs at children in low-income families or those who have other factors that place them at greatest
risk of educational difficulties and school failure. These risk factors may include having a disability, being
a child of teen parents, or having limited English proficiency. Some states employ screening tests to
identify children whose early development and learning suggest they will have school readiness problems.
In targeting their programs toward children considered at-risk, states may take one of a variety of
approaches—a state may:
- set a specific income cutoff that applies to all children;
- allow children to qualify if they meet specified income criteria or have some other identified risk; or
- leave it up to individual districts or programs to decide which children to prioritize.
Slightly less than half of the states’ prekindergarten initiatives set income criteria that at least a certain
portion of enrolled children must meet to qualify for participation. States use a wide range of income cutoffs
to define who qualifies as “low-income.” Cutoffs as of 2001–2002 were as low as the federal poverty level
($15,020 for a family of three in 2002) for the state-funded Head Start models in Delaware, Minnesota,
Ohio, Oregon, and Wisconsin, and as high as 125 percent of state median income in Massachusetts ($75,270
for a family of three in 2002).1
A C C E S S
23
M A
R IC T
N H
N J
D E
M D
V T
WA
O R
C A
N V
I D
M T N D
S D
W Y
U T
A Z
C O
N M
T X
O K
K S
N E
M N
I A
M O
A R
L A
M SA L
G A
F L
S C
N C
VA
T N
K Y
I L
W I
M I
I NO H
PA
W V
N Y
M E
A K
H I
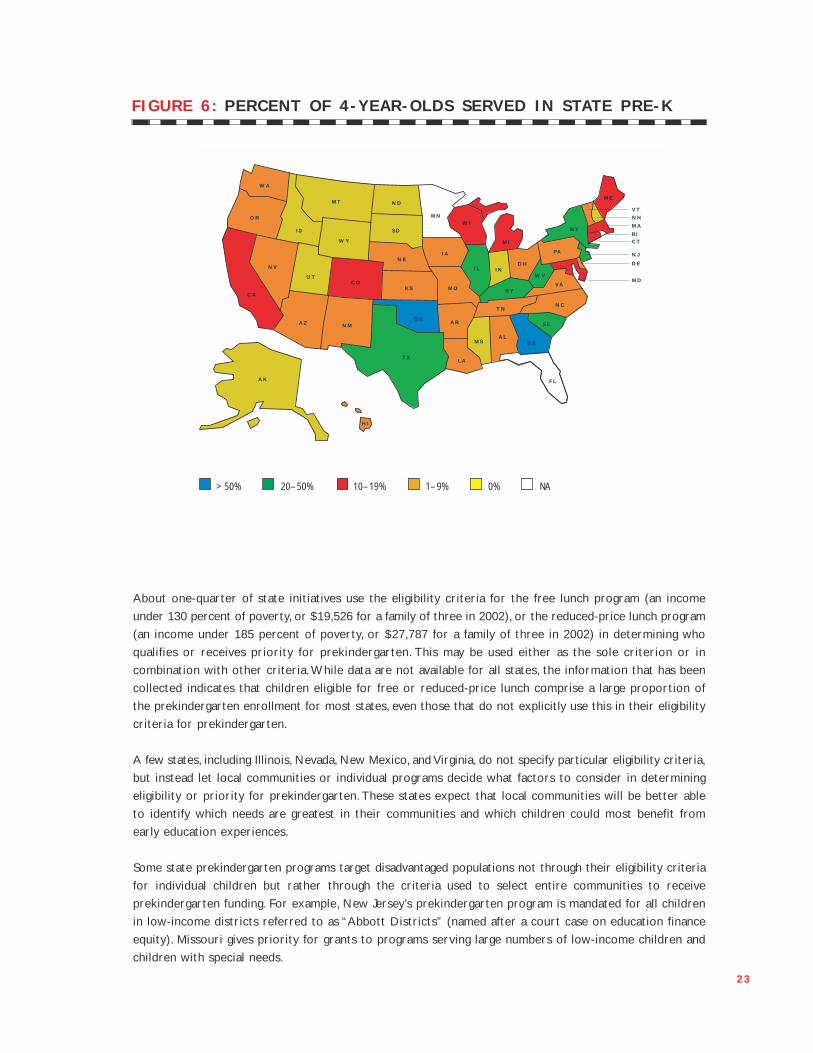
F IGURE 6 : P ERCENT O F 4 - Y EAR -O LD S S ERVED I N S TATE PRE -K
>50% 2 0–50% 1 0–19% 1–9% 0% NA
About one-quarter of state initiatives use the eligibility criteria for the free lunch program (an income
under 130 percent of poverty, or $19,526 for a family of three in 2002), or the reduced-price lunch program
(an income under 185 percent of poverty, or $27,787 for a family of three in 2002) in determining who
qualifies or receives priority for prekindergarten. This may be used either as the sole criterion or in
combination with other criteria. While data are not available for all states, the information that has been
collected indicates that children eligible for free or reduced-price lunch comprise a large proportion of
the prekindergarten enrollment for most states, even those that do not explicitly use this in their eligibility
criteria for prekindergarten.
A few states, including Illinois, Nevada, New Mexico, and Virginia, do not specify particular eligibility criteria,
but instead let local communities or individual programs decide what factors to consider in determining
eligibility or priority for prekindergarten. These states expect that local communities will be better able
to identify which needs are greatest in their communities and which children could most benefit from
early education experiences.
Some state prekindergarten programs target disadvantaged populations not through their eligibility criteria
for individual children but rather through the criteria used to select entire communities to receive
prekindergarten funding. For example, New Jersey’s prekindergarten program is mandated for all children
in low-income districts referred to as “Abbott Districts” (named after a court case on education finance
equity). Missouri gives priority for grants to programs serving large numbers of low-income children and
children with special needs.
24
Age Requirements
Over half of the state prekindergarten initiatives allow both 3- and 4-year-olds to participate. However, in
many of these states, actual enrollment primarily consists of 4-year-olds, with openings for 3-year-olds
being more limited. For example, Texas requires 4-year-olds who meet other eligibility criteria to have
access to prekindergarten, if there are enough eligible children in a district for a class, but serving 3-year-olds
is optional for districts. Kentucky only serves 3-year-olds if they have a disability.
Sixteen state prekindergarten initiatives—those in Alabama, Arizona,2 Delaware, Georgia, Kansas, Louisiana,
Maine, Maryland, Michigan, New York (Universal Prekindergarten),3 North Carolina, Oklahoma, Pennsylvania,
South Carolina, Virginia, and Wisconsin (Four-Year-Old Kindergarten)4—serve only 4-year-olds.
On the other hand, a few states—including Arkansas, Nebraska, Nevada, and New Mexico—serve a broader
age range, enrolling not only preschoolers, but infants and toddlers as well. In these states, state funds
might be used not only for a typical prekindergarten classroom model but also for other models, such as
home-visiting and family support, designed for younger children.
Avai labi l i ty of Prekindergarten Across Communit ies
States differ widely in the proportion of their communities covered by the prekindergarten programs. In
some states, a child would have access to a state-funded prekindergarten program no matter where he or
she lived, while in other states a child would have to be very lucky to happen to have a program available
nearby. A number of states, including Georgia, Hawaii, Kentucky, Louisiana, Maryland, Minnesota, and South
Carolina, have prekindergarten programs in all, or virtually all, of their districts. In contrast, only 2 percent
of Nebraska’s districts and 6 percent of Pennsylvania’s have prekindergarten. About half of states for which
data are available fund prekindergarten in less than 50 percent of their districts.
Parent Fees
The majority of states do not charge for participation in their prekindergarten programs. The states that
do charge fees often charge only for particular groups, such as those with higher incomes, or in specific
circumstances, such as if a family is working full time and needs extended hours of programming. Iowa and
Kentucky allow localities to charge fees to participating families who do not meet the income eligibility
criteria (which in both states is the same as the eligibility limit for free lunch, or 130 percent of the federal
poverty level). Other states, such as Connecticut, Hawaii, Massachusetts, Minnesota (for its School Readiness
Program), Missouri, Nebraska, and Ohio (for its Public School Preschool Program), also charge parent fees,
using a sliding payment scale. In Virginia, districts may choose whether to apply a sliding fee scale.
25
Operating Schedule
More than one-quarter of the state prekindergarten initiatives operate on a half-day basis, with classes
often lasting only about two or three hours. Less than one-quarter operate for a full school day—about
six hours. For the remaining state prekindergarten initiatives, operating schedules are determined at the
local level. This local flexibility in setting operating hours produces different patterns in each state. For
example, most programs in Missouri choose to operate for a full school day while the majority of programs
in Kentucky operate for a half day.
While the majority of state prekindergarten initiatives have most or all of their programs operating five
days a week, several states have most or all of their programs operating four or fewer days a week (Colorado,
Michigan, Minnesota’s School Readiness Program, Nevada, Ohio’s Public School Preschool Program, Oregon,
and Washington).5 In addition, only a few states have programs operating on a year-round basis. Hawaii’s
prekindergarten programs are open 12 months a year, as are the majority of programs in Connecticut,
Massachusetts, and New Mexico. All children participating in New Jersey’s “Abbott District” preschool
program are eligible for free summer and wrap-around services. Other states that enable at least some
children to attend full-year programs include Nebraska, Nevada, Oregon, and Vermont.
When schedules are less than full-day, year round, many working families may not find it feasible to participate
in a prekindergarten program even though they are eligible.There are ways for states to address this issue.
States may try to coordinate their prekindergarten programs with child care assistance programs that help
cover the cost of additional hours of care for parents who work full-time. States may also offer
prekindergarten in child care centers so that children can remain at the same setting for the extended
hours and their families do not have to worry about transportation between different programs.
26
Program Sett ings
Most states allow the prekindergarten programs they fund to be operated in a variety of settings, including
public schools, Head Start centers, and private child care centers. This approach enables states to take
advantage of existing preschool resources including experienced staff, buildings, playgrounds and other
resources. It also permits them to piggy-back on funding from other government programs including Head
Start and child care.
For about one-quarter of the state prekindergarten initiatives, 50 percent or more of participating children
attend prekindergarten programs in settings outside of the public schools. For example, in Connecticut,
14 percent of children are in schools, 26 percent are in Head Start centers, 14 percent are in for-profit
centers, and 47 percent are in nonprofit centers.
For about one-third of the state initiatives, at least some children attend prekindergarten classes in settings
other than public schools, but the majority of children still go to prekindergarten in public school settings.
Several additional states (including Minnesota, New Mexico, North Carolina, and Virginia) allow state-funded
prekindergarten programs in community-based settings outside the public schools, but did not provide
data about the percentage of prekindergarten children in each type of setting. For about one-third of state
prekindergarten initiatives, it was reported that programs are only located in public schools.
1 While Massachusetts allows families with incomes up to 125 percent of state median income to be served, families with incomes above 100 percent of state median income can only be servedafter all families with incomes below 100 percent of state median income have been served.
2 Arizona does not explicitly limit its program to 4-year-olds, and the state’s only age requirement is that children must not yet be eligible for kindergarten. However, attendance is generally limitedto one year and almost all children enrolled in the program are 4 years old.
3 New York’s Experimental Prekindergarten program is open to 3- and 4-year-olds.4 Wisconsin’s State-Funded Head Start Model is open to 3- and 4-year-olds.5 Many states allow local programs to determine their own operating schedules and were not able to provide information about whether programs typically choose to operate five days a week.
Access for Percent Enrolled in State Prekindergar ten, Head Star t,
4-Year-Olds Rank State Percent Enrolled in State Prekindergarten (2001-2002) or IDEA Preschool Grants Programs (2001-2002)
––––––––––––––––––––––––––––––––––––––––––––––––––––––––––––––––––––––––––––––––––––––––––––––––––––––––––––––––––––––––––––––––––––––––––––––––––––––––––––––––––4-year-olds 3-year-olds Total (3’s and 4’s) 4-year-olds 3-year-olds Total (3’s and 4’s)
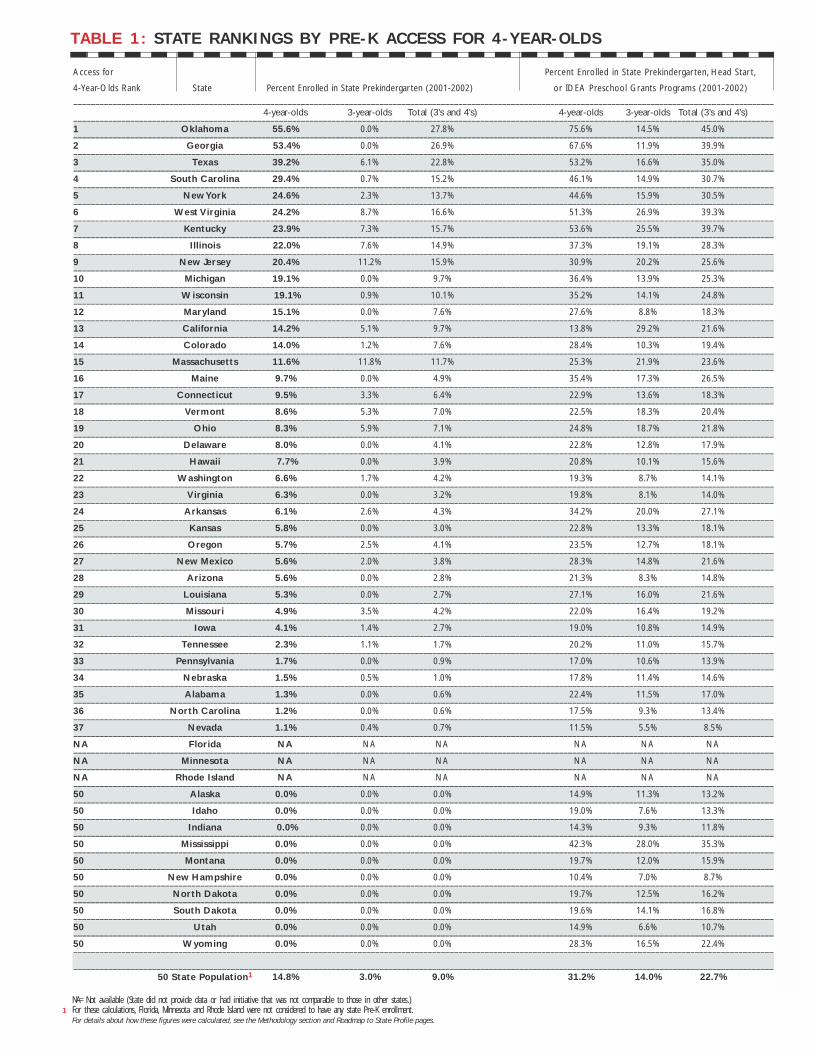
––––––––––––––––––––––––––––––––––––––––––––––––––––––––––––––––––––––––––––––––––––––––––––––––––––––––––––––––––––––––––––––––––––––––––––––––––––––––––––––––––1 Oklahoma 55.6% 0.0% 27.8% 75.6% 14.5% 45.0%––––––––––––––––––––––––––––––––––––––––––––––––––––––––––––––––––––––––––––––––––––––––––––––––––––––––––––––––––––––––––––––––––––––––––––––––––––––––––––––––––2 Georgia 53.4% 0.0% 26.9% 67.6% 11.9% 39.9%––––––––––––––––––––––––––––––––––––––––––––––––––––––––––––––––––––––––––––––––––––––––––––––––––––––––––––––––––––––––––––––––––––––––––––––––––––––––––––––––––3 Texas 39.2% 6.1% 22.8% 53.2% 16.6% 35.0%––––––––––––––––––––––––––––––––––––––––––––––––––––––––––––––––––––––––––––––––––––––––––––––––––––––––––––––––––––––––––––––––––––––––––––––––––––––––––––––––––4 South Carolina 29.4% 0.7% 15.2% 46.1% 14.9% 30.7%––––––––––––––––––––––––––––––––––––––––––––––––––––––––––––––––––––––––––––––––––––––––––––––––––––––––––––––––––––––––––––––––––––––––––––––––––––––––––––––––––5 New York 24.6% 2.3% 13.7% 44.6% 15.9% 30.5%––––––––––––––––––––––––––––––––––––––––––––––––––––––––––––––––––––––––––––––––––––––––––––––––––––––––––––––––––––––––––––––––––––––––––––––––––––––––––––––––––6 West Virginia 24.2% 8.7% 16.6% 51.3% 26.9% 39.3%––––––––––––––––––––––––––––––––––––––––––––––––––––––––––––––––––––––––––––––––––––––––––––––––––––––––––––––––––––––––––––––––––––––––––––––––––––––––––––––––––7 Kentucky 23.9% 7.3% 15.7% 53.6% 25.5% 39.7%––––––––––––––––––––––––––––––––––––––––––––––––––––––––––––––––––––––––––––––––––––––––––––––––––––––––––––––––––––––––––––––––––––––––––––––––––––––––––––––––––8 Illinois 22.0% 7.6% 14.9% 37.3% 19.1% 28.3%––––––––––––––––––––––––––––––––––––––––––––––––––––––––––––––––––––––––––––––––––––––––––––––––––––––––––––––––––––––––––––––––––––––––––––––––––––––––––––––––––9 New Jersey 20.4% 11.2% 15.9% 30.9% 20.2% 25.6%––––––––––––––––––––––––––––––––––––––––––––––––––––––––––––––––––––––––––––––––––––––––––––––––––––––––––––––––––––––––––––––––––––––––––––––––––––––––––––––––––10 Michigan 19.1% 0.0% 9.7% 36.4% 13.9% 25.3%––––––––––––––––––––––––––––––––––––––––––––––––––––––––––––––––––––––––––––––––––––––––––––––––––––––––––––––––––––––––––––––––––––––––––––––––––––––––––––––––––11 Wisconsin 19.1% 0.9% 10.1% 35.2% 14.1% 24.8%––––––––––––––––––––––––––––––––––––––––––––––––––––––––––––––––––––––––––––––––––––––––––––––––––––––––––––––––––––––––––––––––––––––––––––––––––––––––––––––––––12 Maryland 15.1% 0.0% 7.6% 27.6% 8.8% 18.3%––––––––––––––––––––––––––––––––––––––––––––––––––––––––––––––––––––––––––––––––––––––––––––––––––––––––––––––––––––––––––––––––––––––––––––––––––––––––––––––––––13 California 14.2% 5.1% 9.7% 13.8% 29.2% 21.6%––––––––––––––––––––––––––––––––––––––––––––––––––––––––––––––––––––––––––––––––––––––––––––––––––––––––––––––––––––––––––––––––––––––––––––––––––––––––––––––––––14 Colorado 14.0% 1.2% 7.6% 28.4% 10.3% 19.4%––––––––––––––––––––––––––––––––––––––––––––––––––––––––––––––––––––––––––––––––––––––––––––––––––––––––––––––––––––––––––––––––––––––––––––––––––––––––––––––––––15 Massachusetts 11.6% 11.8% 11.7% 25.3% 21.9% 23.6%––––––––––––––––––––––––––––––––––––––––––––––––––––––––––––––––––––––––––––––––––––––––––––––––––––––––––––––––––––––––––––––––––––––––––––––––––––––––––––––––––16 Maine 9.7% 0.0% 4.9% 35.4% 17.3% 26.5%––––––––––––––––––––––––––––––––––––––––––––––––––––––––––––––––––––––––––––––––––––––––––––––––––––––––––––––––––––––––––––––––––––––––––––––––––––––––––––––––––17 Connecticut 9.5% 3.3% 6.4% 22.9% 13.6% 18.3%––––––––––––––––––––––––––––––––––––––––––––––––––––––––––––––––––––––––––––––––––––––––––––––––––––––––––––––––––––––––––––––––––––––––––––––––––––––––––––––––––18 Vermont 8.6% 5.3% 7.0% 22.5% 18.3% 20.4%––––––––––––––––––––––––––––––––––––––––––––––––––––––––––––––––––––––––––––––––––––––––––––––––––––––––––––––––––––––––––––––––––––––––––––––––––––––––––––––––––19 Ohio 8.3% 5.9% 7.1% 24.8% 18.7% 21.8%––––––––––––––––––––––––––––––––––––––––––––––––––––––––––––––––––––––––––––––––––––––––––––––––––––––––––––––––––––––––––––––––––––––––––––––––––––––––––––––––––20 Delaware 8.0% 0.0% 4.1% 22.8% 12.8% 17.9%––––––––––––––––––––––––––––––––––––––––––––––––––––––––––––––––––––––––––––––––––––––––––––––––––––––––––––––––––––––––––––––––––––––––––––––––––––––––––––––––––21 Hawaii 7.7% 0.0% 3.9% 20.8% 10.1% 15.6%––––––––––––––––––––––––––––––––––––––––––––––––––––––––––––––––––––––––––––––––––––––––––––––––––––––––––––––––––––––––––––––––––––––––––––––––––––––––––––––––––22 Washington 6.6% 1.7% 4.2% 19.3% 8.7% 14.1%––––––––––––––––––––––––––––––––––––––––––––––––––––––––––––––––––––––––––––––––––––––––––––––––––––––––––––––––––––––––––––––––––––––––––––––––––––––––––––––––––23 Virginia 6.3% 0.0% 3.2% 19.8% 8.1% 14.0%––––––––––––––––––––––––––––––––––––––––––––––––––––––––––––––––––––––––––––––––––––––––––––––––––––––––––––––––––––––––––––––––––––––––––––––––––––––––––––––––––24 Arkansas 6.1% 2.6% 4.3% 34.2% 20.0% 27.1%––––––––––––––––––––––––––––––––––––––––––––––––––––––––––––––––––––––––––––––––––––––––––––––––––––––––––––––––––––––––––––––––––––––––––––––––––––––––––––––––––25 Kansas 5.8% 0.0% 3.0% 22.8% 13.3% 18.1%––––––––––––––––––––––––––––––––––––––––––––––––––––––––––––––––––––––––––––––––––––––––––––––––––––––––––––––––––––––––––––––––––––––––––––––––––––––––––––––––––26 Oregon 5.7% 2.5% 4.1% 23.5% 12.7% 18.1%––––––––––––––––––––––––––––––––––––––––––––––––––––––––––––––––––––––––––––––––––––––––––––––––––––––––––––––––––––––––––––––––––––––––––––––––––––––––––––––––––27 New Mexico 5.6% 2.0% 3.8% 28.3% 14.8% 21.6%––––––––––––––––––––––––––––––––––––––––––––––––––––––––––––––––––––––––––––––––––––––––––––––––––––––––––––––––––––––––––––––––––––––––––––––––––––––––––––––––––28 Arizona 5.6% 0.0% 2.8% 21.3% 8.3% 14.8%––––––––––––––––––––––––––––––––––––––––––––––––––––––––––––––––––––––––––––––––––––––––––––––––––––––––––––––––––––––––––––––––––––––––––––––––––––––––––––––––––29 Louisiana 5.3% 0.0% 2.7% 27.1% 16.0% 21.6%––––––––––––––––––––––––––––––––––––––––––––––––––––––––––––––––––––––––––––––––––––––––––––––––––––––––––––––––––––––––––––––––––––––––––––––––––––––––––––––––––30 Missouri 4.9% 3.5% 4.2% 22.0% 16.4% 19.2%––––––––––––––––––––––––––––––––––––––––––––––––––––––––––––––––––––––––––––––––––––––––––––––––––––––––––––––––––––––––––––––––––––––––––––––––––––––––––––––––––31 Iowa 4.1% 1.4% 2.7% 19.0% 10.8% 14.9%––––––––––––––––––––––––––––––––––––––––––––––––––––––––––––––––––––––––––––––––––––––––––––––––––––––––––––––––––––––––––––––––––––––––––––––––––––––––––––––––––32 Tennessee 2.3% 1.1% 1.7% 20.2% 11.0% 15.7%––––––––––––––––––––––––––––––––––––––––––––––––––––––––––––––––––––––––––––––––––––––––––––––––––––––––––––––––––––––––––––––––––––––––––––––––––––––––––––––––––33 Pennsylvania 1.7% 0.0% 0.9% 17.0% 10.6% 13.9%––––––––––––––––––––––––––––––––––––––––––––––––––––––––––––––––––––––––––––––––––––––––––––––––––––––––––––––––––––––––––––––––––––––––––––––––––––––––––––––––––34 Nebraska 1.5% 0.5% 1.0% 17.8% 11.4% 14.6%––––––––––––––––––––––––––––––––––––––––––––––––––––––––––––––––––––––––––––––––––––––––––––––––––––––––––––––––––––––––––––––––––––––––––––––––––––––––––––––––––35 Alabama 1.3% 0.0% 0.6% 22.4% 11.5% 17.0%––––––––––––––––––––––––––––––––––––––––––––––––––––––––––––––––––––––––––––––––––––––––––––––––––––––––––––––––––––––––––––––––––––––––––––––––––––––––––––––––––36 North Carolina 1.2% 0.0% 0.6% 17.5% 9.3% 13.4%––––––––––––––––––––––––––––––––––––––––––––––––––––––––––––––––––––––––––––––––––––––––––––––––––––––––––––––––––––––––––––––––––––––––––––––––––––––––––––––––––37 Nevada 1.1% 0.4% 0.7% 11.5% 5.5% 8.5%––––––––––––––––––––––––––––––––––––––––––––––––––––––––––––––––––––––––––––––––––––––––––––––––––––––––––––––––––––––––––––––––––––––––––––––––––––––––––––––––––NA Florida NA NA NA NA NA NA––––––––––––––––––––––––––––––––––––––––––––––––––––––––––––––––––––––––––––––––––––––––––––––––––––––––––––––––––––––––––––––––––––––––––––––––––––––––––––––––––NA Minnesota NA NA NA NA NA NA––––––––––––––––––––––––––––––––––––––––––––––––––––––––––––––––––––––––––––––––––––––––––––––––––––––––––––––––––––––––––––––––––––––––––––––––––––––––––––––––––NA Rhode Island NA NA NA NA NA NA––––––––––––––––––––––––––––––––––––––––––––––––––––––––––––––––––––––––––––––––––––––––––––––––––––––––––––––––––––––––––––––––––––––––––––––––––––––––––––––––––50 Alaska 0.0% 0.0% 0.0% 14.9% 11.3% 13.2%––––––––––––––––––––––––––––––––––––––––––––––––––––––––––––––––––––––––––––––––––––––––––––––––––––––––––––––––––––––––––––––––––––––––––––––––––––––––––––––––––50 Idaho 0.0% 0.0% 0.0% 19.0% 7.6% 13.3%––––––––––––––––––––––––––––––––––––––––––––––––––––––––––––––––––––––––––––––––––––––––––––––––––––––––––––––––––––––––––––––––––––––––––––––––––––––––––––––––––50 Indiana 0.0% 0.0% 0.0% 14.3% 9.3% 11.8%––––––––––––––––––––––––––––––––––––––––––––––––––––––––––––––––––––––––––––––––––––––––––––––––––––––––––––––––––––––––––––––––––––––––––––––––––––––––––––––––––50 Mississippi 0.0% 0.0% 0.0% 42.3% 28.0% 35.3%––––––––––––––––––––––––––––––––––––––––––––––––––––––––––––––––––––––––––––––––––––––––––––––––––––––––––––––––––––––––––––––––––––––––––––––––––––––––––––––––––50 Montana 0.0% 0.0% 0.0% 19.7% 12.0% 15.9%––––––––––––––––––––––––––––––––––––––––––––––––––––––––––––––––––––––––––––––––––––––––––––––––––––––––––––––––––––––––––––––––––––––––––––––––––––––––––––––––––50 New Hampshire 0.0% 0.0% 0.0% 10.4% 7.0% 8.7%––––––––––––––––––––––––––––––––––––––––––––––––––––––––––––––––––––––––––––––––––––––––––––––––––––––––––––––––––––––––––––––––––––––––––––––––––––––––––––––––––50 North Dakota 0.0% 0.0% 0.0% 19.7% 12.5% 16.2%––––––––––––––––––––––––––––––––––––––––––––––––––––––––––––––––––––––––––––––––––––––––––––––––––––––––––––––––––––––––––––––––––––––––––––––––––––––––––––––––––50 South Dakota 0.0% 0.0% 0.0% 19.6% 14.1% 16.8%––––––––––––––––––––––––––––––––––––––––––––––––––––––––––––––––––––––––––––––––––––––––––––––––––––––––––––––––––––––––––––––––––––––––––––––––––––––––––––––––––50 Utah 0.0% 0.0% 0.0% 14.9% 6.6% 10.7%––––––––––––––––––––––––––––––––––––––––––––––––––––––––––––––––––––––––––––––––––––––––––––––––––––––––––––––––––––––––––––––––––––––––––––––––––––––––––––––––––50 Wyoming 0.0% 0.0% 0.0% 28.3% 16.5% 22.4%––––––––––––––––––––––––––––––––––––––––––––––––––––––––––––––––––––––––––––––––––––––––––––––––––––––––––––––––––––––––––––––––––––––––––––––––––––––––––––––––––
––––––––––––––––––––––––––––––––––––––––––––––––––––––––––––––––––––––––––––––––––––––––––––––––––––––––––––––––––––––––––––––––––––––––––––––––––––––––––––––––––50 State Population1 14.8% 3.0% 9.0% 31.2% 14.0% 22.7%
TABLE 1 : STATE RANKINGS BY PRE-K ACCESS FOR 4-YEAR-OLDS
NA=Not available (State did not provide data or had initiative that was not comparable to those in other states.)1 For these calculations, Florida, Minnesota and Rhode Island were not considered to have any state Pre-K enrollment.
For details about how these figures were calculated, see the Methodology section and Roadmap to State Profile pages.

POWER O F UN I V ER S A L P R E - K : OK LAHOMA
28
At Sunlight Preschool in Norman County, Oklahoma, the value of universal prekindergarten is easy to see,
from the moment one sets foot in a classroom. Here, everything in the classroom, from the diversity of
the children’s backgrounds, to the diversity of materials and learning experiences, is consciously constructed
to broaden every child’s horizons.
“We know that each child brings different strengths, styles and experiences into the mix, and that sparks
cognitive growth. The diversity in experience and knowledge among the children naturally creates a larger
scaffolding for learning, expanding a child’s base of knowledge and problem-solving skills,” says Steffani
Allen, director of early childhood education for Norman, a suburb of Oklahoma City. “That’s why so many
of us believed so strongly in the concept of universal preschool, instead of just targeting kids based on
need. We recognized that if you put peers together in a classroom—all at-risk or all wealthy, all black or
all white—you would automatically limit their experience and their learning. We wanted children to develop
the broadest possible scaffolding for learning in the critical early years.”
That goal was particularly important to Allen, who had worked as a reading recovery specialist for years,
trying to help children in the older grades catch up. “When you really work with children who never had
the exposure to preschool, you really appreciate the difference it can make. Children were coming to me
without basic literacy and language, and it was so hard to try to catch them up later. They just didn’t have
the basic foundation skills they needed, so everything was a struggle,” Allen says. “I moved to early education
to help see to it that all children started kindergarten with basic foundation skills, the ones they learn
through exposure and experience before they even get to kindergarten.”
So it is in Oklahoma that the children of the wealthy arrive right alongside those from low-income and
even transient families—with each child teaching the rest new lessons, offering new perspectives and
experiences. After all, underachievement is not just a problem of the poor. “It’s so wonderful to see how
the idea of universal preschool works, in the classroom, among individual children,” says Allen. “Those
individual talents and experiences enrich the whole class, as they share with each other.”
A shy child from a privileged family, for example, might learn a lot about how to communicate with adults
from a less-privileged, but very outgoing child who’s lived in a highly transient environment and had to
learn to speak up for what she needs. “I have seen this happen. It’s wonderful to watch. That child who’s
had to deal with lots of change may have developed very sophisticated social skills, the ability to be very
charming and articulate in communicating with adults, because it’s a matter of survival, part of their chang-
ing daily life, if they are going to get their needs met,” says Allen.
29
When that child is in a classroom with the shy child, instant learning takes place, benefiting both children.
“Once these children buddy up, the outgoing child becomes a role model for the shy one. The shy one
might even say, ‘How did you do that?’ or ‘I like the way you did that!’ or you will just see the shy child
start to try out some of those strategies, walking up to me or another teacher and using language to get
what she needs. She may have a lot more possessions, but until she met this peer, she’s been at a loss about
how to get what she wants from adults she doesn’t know well,” says Allen.
And, Allen adds, the model of a peer is far more powerful than any words or lessons she might impart.
“That modeling by the transient child is really a lesson in problem-solving, a demonstration of how to use
language in social interactions to get needs met, negotiate and get along,” says Allen. “We do structure
those lessons into the classroom as much as we can, using language constantly—but there’s nothing like a
peer, a buddy, to learn from. A child then sees exactly how to do it, what works and what doesn’t, from
someone on his own level. That makes a huge difference.”
The transient child, for his part, learns about entirely new aspects of life from his more-privileged classmates.
“The child who never had a pet will learn a lot about animals and how to care for them from the children
who have a more stable home life and a lot of experience with pets,” Allen says. “That adds to the classroom
lessons and again, broadens a child’s basic scaffolding for learning, by broadening his experiences. For
example, if we have a lizard in the classroom, any child might learn a lot about lizards—that they shed their
skin, what they eat and so on. But once he has a friend with a lizard or any other pet, he’ll start looking
at animals differently. He’ll understand more about what it means to be attached to an animal, take care
of it and meet its needs, even about veterinarians, where to buy pet food, that sort of thing—all sorts of
life lessons that will enlarge his sense of the world and how to operate in the world.”
That kind of give-and-take among the children is one of the primary reasons why Oklahoma decided to
take a universal approach to prekindergarten rather than create a targeted program, only for children at
risk. “We know, from all the research, that children are developing a scaffolding for later learning in these
early years.Their brains are taking in experience and knowledge, and they are literally laying the groundwork
for learning as they get older,” says Allen. “And we know that children are constantly sharing perspectives
and experiences, which contributes to their school readiness and overall chances for success. If we group
them homogeneously, then their learning is going to be more limited—because the experiences coming
into the classroom are going to be more limited. And, although children from higher income families may
have more access to preschool programs than poor children, the quality of most of the programs they
attend is usually not high. That’s what we wanted to avoid by taking the universal approach.”
…by Betty Holcomb
30
Research finds that children have greater success in kindergarten if they have already participated in
high-quality preschool education programs. The quality of preschool programs depends to a great degree
upon the requirements for teaching staff and the way in which programs are structured. For example, high
levels of teacher education and low staff-child ratios are associated with more positive outcomes for
preschoolers. Although standards for quality sometimes are set at the local level, states typically specify
the minimum requirements.These minimum requirements sometimes vary with program settings. In particular,
many states have higher standards for programs in public schools than those in private settings.
Our survey of the states requested information about requirements regarding the following
program characteristics:
- degree requirements for teachers, assistant teachers, principals, and center/site directors;
- training in early childhood education;
- teacher licensing;
- in-service professional development;
- class size;
- staff-child ratios;
- meals provided;
- screening and referral services;
- parent involvement and support services for families;
- transition to kindergarten activities;
- standards for English Language Learners.
We also collected data about the extent to which programs served children with individualized educational
plans (IEPs) and whether programs received higher levels of funding when meeting state standards. Finally,
we incorporated information from a separate study on the status of preschool curriculum standards.
Overall, we find that quality standards varied tremendously from state to state. Unlike Head Start, a federal
program that sets consistent standards for classrooms across the U.S., state-financed preschool programs
differed widely in terms of personnel requirements, maximum allowable class size, the services provided
to children and families, and program standards. The findings from our survey highlight the variability
across state-funded prekindergarten initiatives during the 2001–2002 program year.
QUAL I T Y S TANDARD S
31
Qual ity Standards Checkl ist
To better summarize quality standards across different state prekindergarten initiatives, we designed a 10-item
Quality Standards Checklist. The items included in this checklist have been found by research to contribute
to the quality of prekindergarten programs. Benchmarks were developed for each item, and for each
prekindergarten program we determined whether or not state policy met the relevant benchmark. These
benchmarks do not represent a high standard of excellence, but are viewed as important minimums for an
educationally effective preschool program, particularly programs that serve educationally disadvantaged
children. (This checklist should not be interpreted as implying that these are the only aspects of a program
that are important for quality.) Each prekindergarten initiative received a summary score based on the total
number of benchmarks that were met, ranging from a minimum of zero to a maximum of 10. This scoring
system is merely a count of the items and is not meant to imply that all of the items are of
equal value or interchangeable. For example, providing a meal does not offset the effects of failing to
require that teachers have a college degree and vice versa. Thus, state policies should be evaluated and
compared based on their standards for each of the 10 items and not simply based on the number of items
for which they meet benchmarks. The following items and associated benchmarks were used in the Quality
Standards Checklist:
- Curr iculum standards—the state must have comprehensive curriculum standards that are exclusive to
prekindergarten and cover the domains of language/literacy, mathematics, science, social/emotional skills,
cognitive development, health and physical development, and social studies.1
- Teacher degree requirement—lead teachers are required to hold at least a BA in both public and private
program settings.2
- Teacher specialized training requirement—pre-service requirements for lead teachers must include specialized
training in early childhood. Such training might involve licensure/endorsement in the prekindergarten area
or a degree or credential in early childhood, such as a CDA. Elementary teaching certificates and kindergarten
endorsements were not considered to qualify as specialized training in early childhood.2
- Assistant teacher degree requirement—assistant teachers are required to hold at least a CDA or equivalent
(24 credits in early childhood), in both public and private settings.3
- Teacher in-service requirement—teachers must be required to receive an average of at least 15 clock hours
of professional development annually.4
- Maximum class size—class sizes must be limited to no more than 20 children, for both 3- and 4-year-olds.5
- Staff-child ratio—classrooms are required to have at least one staff member present per 10 children
attending, for both 3- and 4-year-olds.6
- Screening/referral requirements—programs are required to provide both screening and referral services
that cover at least vision, hearing and health.7
- Family support services—programs must offer at least one type of support service for families of participants.
Services may include parent conferences or adult education, referral to social services for families, or
information relating to nutrition.8
- Meal requirements—programs are required to provide participants with at least one meal daily. Snacks
were not counted as meals.9
State-financed prekindergarten initiatives varied greatly with respect to the number of items on the
Quality Standards Checklist for which they met benchmarks. Summary scores were as high as 9 in Arkansas,
Illinois, and the New Jersey “Abbott District” program, and as low as 2 in Kansas, New Mexico and Texas.
The summary scores for each of the 43 state-funded initiatives and the District of Columbia’s initiative are
shown in Table 2 (page 35). State standards relative to each individual benchmark are discussed below.
Serious concerns are raised by the failure of most state programs to meet the benchmarks for comprehensive
curriculum standards and teacher qualifications.
32
Curriculum StandardsThe decision to adopt comprehensive curriculum standards provides evidence that a state has identifiedand prioritized specific content areas to be covered by preschool education programs. Curriculum standardsare specified at the statewide level. As a result, the states with multiple prekindergarten initiatives employa single set of curriculum standards across all state-financed programs. Comprehensive curriculum standardswere in place in 10 of the 38 states profiled in our report.
Personnel RequirementsPersonnel requirements can be used as an index of a state’s commitment to providing quality preschool.More educated teachers and staff are more likely to provide a high-quality learning environment for theirstudents. Our study findings suggest that children who live in different states receive preschool educationsthat dramatically vary in quality.
Teachers were required to hold a bachelor’s degree in 21 of the 43 state-financed prekindergarten initiativescovered by our report. Minimum teacher degree requirements generally depended upon a program’s setting.When state prekindergarten programs operated in public schools, teachers were usually required to have atleast a bachelor’s degree. New York’s public preschool programs had the most stringent educationalrequirements, as teachers trained after 1978 were required to have master’s degrees. States not requiring aBA in public school settings mandated that teachers have an AA, a CDA, or equivalent training—except NewMexico, which did not have any minimum degree requirement for prekindergarten teachers in public schools.
Prekindergarten teachers in only about one-third of the programs that operated in private settings wererequired to have a BA. Most commonly, teachers in private settings were required to have a CDA, althoughsome states required an AA and others required specific training that was less than a CDA. In five state-fundedinitiatives, there were no minimum degree requirements for prekindergarten teachers in private schools.
Teachers in 29 of the 43 state-financed prekindergarten initiatives were required to have specialized trainingin early childhood. In state-funded programs that required teachers to have a BA, this training often tookthe form of earning a certificate, license, or endorsement in early childhood or a closely related area. Inprograms that did not implement a BA requirement for teachers, this specialized training generally involvedthe attainment of a CDA.
Minimum requirements for assistant teachers were always less stringent than those for lead teachers(except in New Mexico, which had no educational requirements for lead or assistant preschool teachers).Only 10 states required all assistant teachers to earn a CDA or receive an equivalent level of training.Educational requirements for assistant teachers tended to be fairly uniform across public and private settings.In all cases in which they differed, the requirements were less stringent in private settings.The most commoneducational requirement for assistant teachers was a high school diploma or GED (occasionally with someminimal additional training), although a wide range of requirements was used across different states.Vermont had the most stringent requirements for assistant teachers in public schools, as assistant teachersin public settings were required to have a BA. In 11 other state-financed programs there were no specifiededucational requirements for at least some assistant teachers. Massachusetts allowed 16-year-olds to serveas assistant teachers in nonpublic settings when under constant supervision.
Specific requirements for annual in-service training varied across the states. Overall, slightly more thanhalf of the state initiatives mandated that teachers receive an average of at least 15 clock hours per year.(In some cases, statewide in-service requirements for recertification are reported, when programs weresubject to these requirements but did not set specific requirements of their own.) In-service requirementswere as high as 40 clock hours per year in Alabama, although eight states had no in-service requirements.
33
Program Structure and Ser vice StandardsResponses to our survey show great variability in state policies relating to program structure and services,providing further evidence that children in different states may receive vastly different types of state-financedprekindergarten services.
Lower class sizes are generally associated with more effective early education programs. In general,state-financed prekindergarten programs placed a priority on limiting classrooms to 20 or fewer students:this benchmark was met by 31 of the 43 state-financed initiatives covered in our report. Among programsthat served both 3- and 4-year-olds, the requirements for class size generally did not differ by the age ofthe child. However, when requirements differed, maximum class sizes were always smaller for 3-year-oldsthan for 4-year-olds. Maximum class sizes were as low as 15 children in Colorado and the New Jersey“Abbott District” programs. In several initiatives there was no required limit on the maximum number ofchildren in a classroom, although many of these initiatives offered specific recommendations, such asthe recommendation that programs follow guidelines of the National Association for the Education ofYoung Children.
As with class sizes, lower staff-child ratios are associated with higher levels of quality. Staff-child ratios of1:10 or better were mandated in 30 of the state preschool initiatives. In most programs that served both3- and 4-year-olds, ratio requirements did not differ by the age of child. In states where the requirementsdiffered, without exception, they specified lower staff-child ratios for 3-year-olds. Staff-child ratios were aslow as 3:20 for children in New York State’s Universal Prekindergarten and Experimental Prekindergartenprograms, and 2:15 for children attending the New Jersey “Abbott District” program. Six state-financedprograms specified no maximum staff-child ratio. In the Wisconsin Four-Year-Old Kindergarten programstaff-child ratios were determined at the local level.
34
Services such as health screenings and referrals, family support services, and meals also contribute to aprogram’s effectiveness in promoting child development and learning. Eighteen of the state-financed initiativesmandated screening and referral for vision, hearing, and health. Twenty additional initiatives mandated atleast one type of screening or referral, or allowed programs to determine screening and referral requirementsat the local level. Five state initiatives had no specific requirements for screening and referral services.
Support services were offered to families of enrollees in 31 of the state preschool initiatives. Many statesoffered more than one service. Family support services were generally targeted toward parents—includingparent conferences, parenting education, adult education, and job training services. However, occasionallysupport services focused more directly on enrolled children—such as services that help children make thetransition into preschool.
Finally, 18 of the state-financed prekindergarten initiatives offered at least one meal per day. Of the initiativesthat did require meals, some specified which meals should be provided, while in other initiatives the mealsto be offered were determined by local factors such as the provider’s hours of operation.
Qual ity Standards Over viewAlthough each individual benchmark in our Quality Standards Checklist was met by at least 10 state-financedpreschool initiatives, none of the initiatives met all of the benchmarks. Even among the three initiativesmeeting the most benchmarks—Arkansas, Illinois, and the New Jersey “Abbott District” program—therewas variability in which benchmarks were met. Overall, quality standards in state preschool programs varieddramatically from state to state. The data strongly illustrate that children in the U.S. are not guaranteed ahigh-quality preschool education. Even though actual quality may exceed state standards on average, whenquality standards are lacking, some children (particularly the most disadvantaged) are likely to receive verypoor quality programs.
1 Too often current practice underestimates children’s capabilities to learn in the preschool years. Clear and appropriate expectations for learning and development across all domains are essentialto an educationally effective preschool program. Bowman, B. T., Donovan, M. S., & Burns, M.S. (Eds.). (2001). Eager to learn: Educating our preschoolers. Washington, DC: National Academy Press.Frede, E. C. (1998). Preschool program quality in programs for children in poverty. In W. S. Barnett & S. S. Boocock (Eds.), Early care and education for children in poverty: Promises, programs,and long-term results (pp. 77–98). Albany, NY: SUNY Press. Kendall, J. S. (2003). Setting standards in early childhood education. Educational Leadership, 60(7), 64–68.
2 Based on a review of the evidence, a committee of the National Research Council recommended that preschool teachers have a BA with specialization in early childhood education (Bowman et al.,2001). Barnett, W. S. (2003). Better teachers, better preschools: Student achievement linked to teacher qualifications. Preschool Policy Matters, 2. New Brunswick, NJ: National Institute for EarlyEducation Research. Burchinal, M. R., Cryer, D., Clifford, R. M., & Howes, C. (2002). Caregiver training and classroom quality in child care centers. Applied Developmental Science, 6, 2–11.Whitebook, M., Howes, C., & Phillips, D. (1989). Who cares? Child care teachers and the quality of care in America. (Final report of the National Child Care Staffing Study). Oakland, CA: ChildCare Employee Project.
3 Preschool classrooms typically are taught by teams of a teacher and an assistant. While research specifically on the qualifications of assistants is rare, the available evidence points to a relationshipbetween assistant qualifications and teaching quality and there is much evidence on the educational importance of the qualifications of teaching staff generally. Bowman et al. (2001). Burchinalet al. (2002). Barnett (2003). Whitebook et al. (1989). The CDA has been recommended to prepare assistant teachers who may be viewed as starting on a career path to become teachers rather than permanent assistants. Kagan, S. L., & Cohen, N. E. (1997). Not by chance: Creating an early care and education system for America's children. Abridged report. New Haven, CT:Yale University, Bush Center in Child Development and Social Policy.
4 Good teachers are actively engaged in their continuing development. Bowman et al. (2001). Frede (1998). Whitebook et al. (1989) found that teachers with more than 15 hours were more appropriate, positive, and engaged with children in their teaching practices.
5 The importance of class size has been demonstrated for preschool and kindergarten. A class size of 20 is larger than that which research has shown to produce large gains for disadvantagedchildren. Barnett, W. S. (1998). Long-term effects on cognitive development and school success. In W. S. Barnett & S. S. Boocock (Eds.), Early care and education for children in poverty:Promises, programs, and long-term results (pp. 11–44). Albany, NY: SUNY Press. Bowman et al. (2001). Finn, J. D. (2002). Class-size reduction in grades K–3. In A. Molnar (Ed.), School reform proposals: The research evidence (pp. 27–48). Greenwich, CT: Information Age Publishing. Frede (1998). NICHD Early Child Care Research Network. (1999). Child outcomes when child care centerclasses meet recommended standards for quality. American Journal of Public Health, 89, 1072–1077. National Association for the Education of Young Children. (1998). Accreditation criteria and procedures of the National Association for the Education of Young Children. Washington, DC: National Association for the Education of Young Children.
6 A large literature establishes the links between ratio and program quality and child outcomes. A ratio of 1:10 is larger than in programs that have demonstrated large gains for disadvantagedchildren and is the largest generally accepted by professional opinion. Barnett (1998). Bowman et al. (2001). Frede (1998). NICHD Early Child Care Research Network (1999). National Associationfor the Education of Young Children (1998).
7 For some children, preschool may be the first opportunity to detect vision, hearing, and health problems that may impair a child’s learning and development. This is an opportunity that shouldnot be missed. Meisels, S. J., & Atkins-Burnett, S. (2000). The elements of early childhood assessment. In J. P. Shonkoff & S. J. Meisels (Eds.), Handbook of early childhood intervention (pp. 231–257).New York: Cambridge University Press.
8 Families are the primary source of support for child development and the most effective programs have partnered with parents. Bowman et al. (2001). Frede (1998).9 Good nutrition is essential for healthy development of the brain and for children’s learning. Shonkoff, J. P., & Phillips, D. A. (Eds.). (2000). From neurons to neighborhoods: The science of early
childhood development. Washington, DC: National Academy Press.
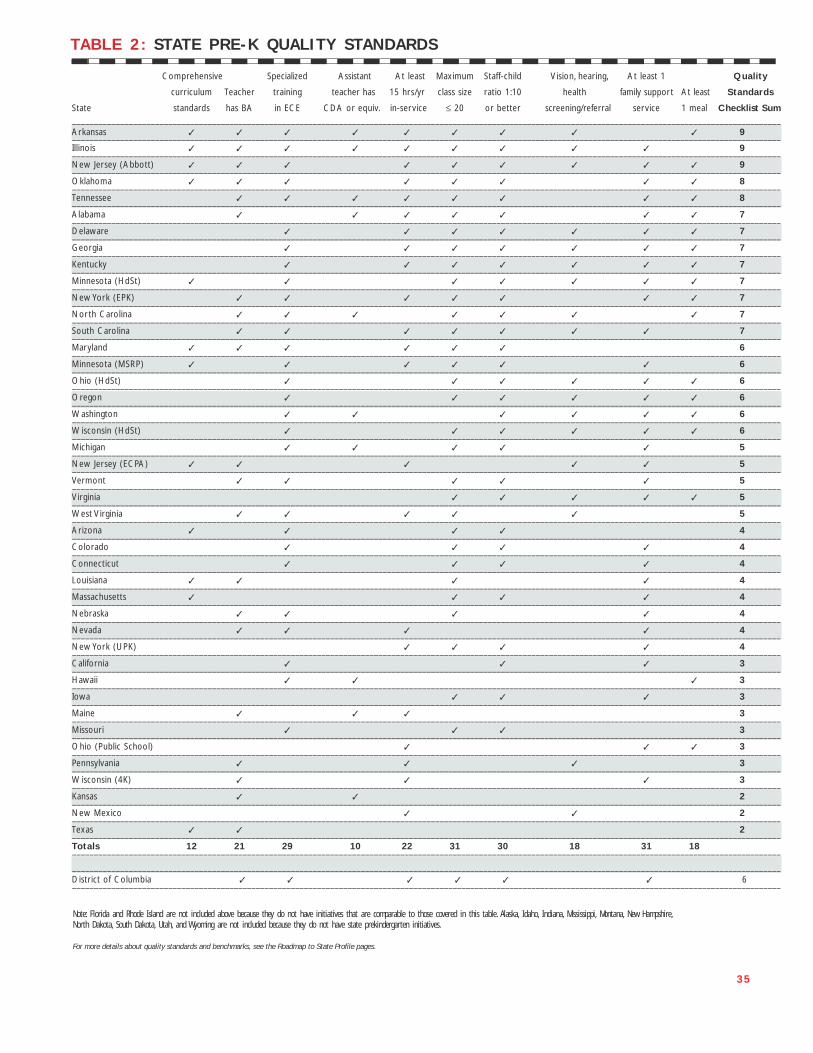
35
Note: Florida and Rhode Island are not included above because they do not have initiatives that are comparable to those covered in this table. Alaska, Idaho, Indiana, Mississippi, Montana, New Hampshire,North Dakota, South Dakota, Utah, and Wyoming are not included because they do not have state prekindergarten initiatives.
For more details about quality standards and benchmarks, see the Roadmap to State Profile pages.
TABLE 2 : STATE PRE-K QUALITY STANDARDS
Comprehensive Specialized Assistant At least Maximum Staff-child Vision, hearing, At least 1 Quality
curriculum Teacher training teacher has 15 hrs/yr class size ratio 1:10 health family support At least Standards
State standards has BA in ECE CDA or equiv. in-service ≤ 20 or better screening/referral service 1 meal Checklist Sum
––––––––––––––––––––––––––––––––––––––––––––––––––––––––––––––––––––––––––––––––––––––––––––––––––––––––––––––––––––––––––––––––––––––––––––––––––––––––––––––––––Arkansas ✓ ✓ ✓ ✓ ✓ ✓ ✓ ✓ ✓ 9––––––––––––––––––––––––––––––––––––––––––––––––––––––––––––––––––––––––––––––––––––––––––––––––––––––––––––––––––––––––––––––––––––––––––––––––––––––––––––––––––Illinois ✓ ✓ ✓ ✓ ✓ ✓ ✓ ✓ ✓ 9––––––––––––––––––––––––––––––––––––––––––––––––––––––––––––––––––––––––––––––––––––––––––––––––––––––––––––––––––––––––––––––––––––––––––––––––––––––––––––––––––New Jersey (Abbott) ✓ ✓ ✓ ✓ ✓ ✓ ✓ ✓ ✓ 9––––––––––––––––––––––––––––––––––––––––––––––––––––––––––––––––––––––––––––––––––––––––––––––––––––––––––––––––––––––––––––––––––––––––––––––––––––––––––––––––––Oklahoma ✓ ✓ ✓ ✓ ✓ ✓ ✓ ✓ 8––––––––––––––––––––––––––––––––––––––––––––––––––––––––––––––––––––––––––––––––––––––––––––––––––––––––––––––––––––––––––––––––––––––––––––––––––––––––––––––––––Tennessee ✓ ✓ ✓ ✓ ✓ ✓ ✓ ✓ 8––––––––––––––––––––––––––––––––––––––––––––––––––––––––––––––––––––––––––––––––––––––––––––––––––––––––––––––––––––––––––––––––––––––––––––––––––––––––––––––––––Alabama ✓ ✓ ✓ ✓ ✓ ✓ ✓ 7––––––––––––––––––––––––––––––––––––––––––––––––––––––––––––––––––––––––––––––––––––––––––––––––––––––––––––––––––––––––––––––––––––––––––––––––––––––––––––––––––Delaware ✓ ✓ ✓ ✓ ✓ ✓ ✓ 7––––––––––––––––––––––––––––––––––––––––––––––––––––––––––––––––––––––––––––––––––––––––––––––––––––––––––––––––––––––––––––––––––––––––––––––––––––––––––––––––––Georgia ✓ ✓ ✓ ✓ ✓ ✓ ✓ 7––––––––––––––––––––––––––––––––––––––––––––––––––––––––––––––––––––––––––––––––––––––––––––––––––––––––––––––––––––––––––––––––––––––––––––––––––––––––––––––––––Kentucky ✓ ✓ ✓ ✓ ✓ ✓ ✓ 7––––––––––––––––––––––––––––––––––––––––––––––––––––––––––––––––––––––––––––––––––––––––––––––––––––––––––––––––––––––––––––––––––––––––––––––––––––––––––––––––––Minnesota (HdSt) ✓ ✓ ✓ ✓ ✓ ✓ ✓ 7––––––––––––––––––––––––––––––––––––––––––––––––––––––––––––––––––––––––––––––––––––––––––––––––––––––––––––––––––––––––––––––––––––––––––––––––––––––––––––––––––New York (EPK) ✓ ✓ ✓ ✓ ✓ ✓ ✓ 7––––––––––––––––––––––––––––––––––––––––––––––––––––––––––––––––––––––––––––––––––––––––––––––––––––––––––––––––––––––––––––––––––––––––––––––––––––––––––––––––––North Carolina ✓ ✓ ✓ ✓ ✓ ✓ ✓ 7––––––––––––––––––––––––––––––––––––––––––––––––––––––––––––––––––––––––––––––––––––––––––––––––––––––––––––––––––––––––––––––––––––––––––––––––––––––––––––––––––South Carolina ✓ ✓ ✓ ✓ ✓ ✓ ✓ 7––––––––––––––––––––––––––––––––––––––––––––––––––––––––––––––––––––––––––––––––––––––––––––––––––––––––––––––––––––––––––––––––––––––––––––––––––––––––––––––––––Maryland ✓ ✓ ✓ ✓ ✓ ✓ 6––––––––––––––––––––––––––––––––––––––––––––––––––––––––––––––––––––––––––––––––––––––––––––––––––––––––––––––––––––––––––––––––––––––––––––––––––––––––––––––––––Minnesota (MSRP) ✓ ✓ ✓ ✓ ✓ ✓ 6––––––––––––––––––––––––––––––––––––––––––––––––––––––––––––––––––––––––––––––––––––––––––––––––––––––––––––––––––––––––––––––––––––––––––––––––––––––––––––––––––Ohio (HdSt) ✓ ✓ ✓ ✓ ✓ ✓ 6––––––––––––––––––––––––––––––––––––––––––––––––––––––––––––––––––––––––––––––––––––––––––––––––––––––––––––––––––––––––––––––––––––––––––––––––––––––––––––––––––Oregon ✓ ✓ ✓ ✓ ✓ ✓ 6––––––––––––––––––––––––––––––––––––––––––––––––––––––––––––––––––––––––––––––––––––––––––––––––––––––––––––––––––––––––––––––––––––––––––––––––––––––––––––––––––Washington ✓ ✓ ✓ ✓ ✓ ✓ 6––––––––––––––––––––––––––––––––––––––––––––––––––––––––––––––––––––––––––––––––––––––––––––––––––––––––––––––––––––––––––––––––––––––––––––––––––––––––––––––––––Wisconsin (HdSt) ✓ ✓ ✓ ✓ ✓ ✓ 6––––––––––––––––––––––––––––––––––––––––––––––––––––––––––––––––––––––––––––––––––––––––––––––––––––––––––––––––––––––––––––––––––––––––––––––––––––––––––––––––––Michigan ✓ ✓ ✓ ✓ ✓ 5––––––––––––––––––––––––––––––––––––––––––––––––––––––––––––––––––––––––––––––––––––––––––––––––––––––––––––––––––––––––––––––––––––––––––––––––––––––––––––––––––New Jersey (ECPA) ✓ ✓ ✓ ✓ ✓ 5––––––––––––––––––––––––––––––––––––––––––––––––––––––––––––––––––––––––––––––––––––––––––––––––––––––––––––––––––––––––––––––––––––––––––––––––––––––––––––––––––Vermont ✓ ✓ ✓ ✓ ✓ 5––––––––––––––––––––––––––––––––––––––––––––––––––––––––––––––––––––––––––––––––––––––––––––––––––––––––––––––––––––––––––––––––––––––––––––––––––––––––––––––––––Virginia ✓ ✓ ✓ ✓ ✓ 5––––––––––––––––––––––––––––––––––––––––––––––––––––––––––––––––––––––––––––––––––––––––––––––––––––––––––––––––––––––––––––––––––––––––––––––––––––––––––––––––––West Virginia ✓ ✓ ✓ ✓ ✓ 5––––––––––––––––––––––––––––––––––––––––––––––––––––––––––––––––––––––––––––––––––––––––––––––––––––––––––––––––––––––––––––––––––––––––––––––––––––––––––––––––––Arizona ✓ ✓ ✓ ✓ 4––––––––––––––––––––––––––––––––––––––––––––––––––––––––––––––––––––––––––––––––––––––––––––––––––––––––––––––––––––––––––––––––––––––––––––––––––––––––––––––––––Colorado ✓ ✓ ✓ ✓ 4––––––––––––––––––––––––––––––––––––––––––––––––––––––––––––––––––––––––––––––––––––––––––––––––––––––––––––––––––––––––––––––––––––––––––––––––––––––––––––––––––Connecticut ✓ ✓ ✓ ✓ 4––––––––––––––––––––––––––––––––––––––––––––––––––––––––––––––––––––––––––––––––––––––––––––––––––––––––––––––––––––––––––––––––––––––––––––––––––––––––––––––––––Louisiana ✓ ✓ ✓ ✓ 4––––––––––––––––––––––––––––––––––––––––––––––––––––––––––––––––––––––––––––––––––––––––––––––––––––––––––––––––––––––––––––––––––––––––––––––––––––––––––––––––––Massachusetts ✓ ✓ ✓ ✓ 4––––––––––––––––––––––––––––––––––––––––––––––––––––––––––––––––––––––––––––––––––––––––––––––––––––––––––––––––––––––––––––––––––––––––––––––––––––––––––––––––––Nebraska ✓ ✓ ✓ ✓ 4––––––––––––––––––––––––––––––––––––––––––––––––––––––––––––––––––––––––––––––––––––––––––––––––––––––––––––––––––––––––––––––––––––––––––––––––––––––––––––––––––Nevada ✓ ✓ ✓ ✓ 4––––––––––––––––––––––––––––––––––––––––––––––––––––––––––––––––––––––––––––––––––––––––––––––––––––––––––––––––––––––––––––––––––––––––––––––––––––––––––––––––––New York (UPK) ✓ ✓ ✓ ✓ 4––––––––––––––––––––––––––––––––––––––––––––––––––––––––––––––––––––––––––––––––––––––––––––––––––––––––––––––––––––––––––––––––––––––––––––––––––––––––––––––––––California ✓ ✓ ✓ 3––––––––––––––––––––––––––––––––––––––––––––––––––––––––––––––––––––––––––––––––––––––––––––––––––––––––––––––––––––––––––––––––––––––––––––––––––––––––––––––––––Hawaii ✓ ✓ ✓ 3––––––––––––––––––––––––––––––––––––––––––––––––––––––––––––––––––––––––––––––––––––––––––––––––––––––––––––––––––––––––––––––––––––––––––––––––––––––––––––––––––Iowa ✓ ✓ ✓ 3––––––––––––––––––––––––––––––––––––––––––––––––––––––––––––––––––––––––––––––––––––––––––––––––––––––––––––––––––––––––––––––––––––––––––––––––––––––––––––––––––Maine ✓ ✓ ✓ 3––––––––––––––––––––––––––––––––––––––––––––––––––––––––––––––––––––––––––––––––––––––––––––––––––––––––––––––––––––––––––––––––––––––––––––––––––––––––––––––––––Missouri ✓ ✓ ✓ 3––––––––––––––––––––––––––––––––––––––––––––––––––––––––––––––––––––––––––––––––––––––––––––––––––––––––––––––––––––––––––––––––––––––––––––––––––––––––––––––––––Ohio (Public School) ✓ ✓ ✓ 3––––––––––––––––––––––––––––––––––––––––––––––––––––––––––––––––––––––––––––––––––––––––––––––––––––––––––––––––––––––––––––––––––––––––––––––––––––––––––––––––––Pennsylvania ✓ ✓ ✓ 3––––––––––––––––––––––––––––––––––––––––––––––––––––––––––––––––––––––––––––––––––––––––––––––––––––––––––––––––––––––––––––––––––––––––––––––––––––––––––––––––––Wisconsin (4K) ✓ ✓ ✓ 3––––––––––––––––––––––––––––––––––––––––––––––––––––––––––––––––––––––––––––––––––––––––––––––––––––––––––––––––––––––––––––––––––––––––––––––––––––––––––––––––––Kansas ✓ ✓ 2––––––––––––––––––––––––––––––––––––––––––––––––––––––––––––––––––––––––––––––––––––––––––––––––––––––––––––––––––––––––––––––––––––––––––––––––––––––––––––––––––New Mexico ✓ ✓ 2––––––––––––––––––––––––––––––––––––––––––––––––––––––––––––––––––––––––––––––––––––––––––––––––––––––––––––––––––––––––––––––––––––––––––––––––––––––––––––––––––Texas ✓ ✓ 2––––––––––––––––––––––––––––––––––––––––––––––––––––––––––––––––––––––––––––––––––––––––––––––––––––––––––––––––––––––––––––––––––––––––––––––––––––––––––––––––––Totals 12 21 29 10 22 31 30 18 31 18––––––––––––––––––––––––––––––––––––––––––––––––––––––––––––––––––––––––––––––––––––––––––––––––––––––––––––––––––––––––––––––––––––––––––––––––––––––––––––––––––
––––––––––––––––––––––––––––––––––––––––––––––––––––––––––––––––––––––––––––––––––––––––––––––––––––––––––––––––––––––––––––––––––––––––––––––––––––––––––––––––––District of Columbia ✓ ✓ ✓ ✓ ✓ ✓ 6––––––––––––––––––––––––––––––––––––––––––––––––––––––––––––––––––––––––––––––––––––––––––––––––––––––––––––––––––––––––––––––––––––––––––––––––––––––––––––––––––
QUALITY MAKES A DIFFERENCE: NEW JERSEY
36
There’s a pervasive sense of joy at the Vailsburg prekindergarten program in Newark, a sense that both
the faculty and the 4-year-olds are not only learning, but also genuinely and generously engaged with each
other, as they tumble along through the day. Transitions between activities, from the playground to circle
time, flow easily due to the consistent natural order of the day. With the simple teacher guidance, “Let’s
all walk as quietly as a mouse,” the children are able to gather themselves from the full force of a game
of tag, line up with relative calmness, walk a block to the classroom, wash hands, sit in a circle and then
focus on a game of “Uno” without a sharp word or constant directions from the teachers.
And it is only the third week of the year.
“I do see how the training makes a difference with my teachers,” says Dale Goodwin, director of the program
and a veteran of nearly three decades in early education. “It looks easy, but it’s not, of course. It is drawn
from understanding how children develop, and then learning to respond to their behavior in a positive way.
That kind of response from the adults in their lives helps build the children’s confidence and create an
environment where real learning takes place. That’s where it all starts, with the teachers’ knowledge and
a positive attitude.”
The teachers in Goodwin’s program, like those in others across New Jersey, are in the process of meeting
broad new state requirements for teacher training. Under a new state mandate, preschool programs in the
state’s poorest districts must be of high quality which means providing a good curriculum, small classes,
screening and referral programs, meals and family support services. But most would agree that the most
important requirement is that every Pre-K teacher must have not only a bachelor’s degree, but also
certification in early childhood development by fall 2004.
To make sure it happens, the state is underwriting college costs for many teachers, through a system of
grants and loan forgiveness agreements.That has meant that a few of the teachers on Goodwin’s staff have
had to return to school, but she believes this has only enhanced the program—and prospects for the
teachers themselves.
“It’s a plus for the program and for the teachers,” she says. “They will take this training wherever they go,
and the credentials will allow them to earn a living wage—something that was hard to do in this field in
the past.” And that, she adds, should help keep teachers on the job, build continuity for the children, and
stabilize the prekindergarten program as it expands across the state. “The move to make the field more
professional is very positive for everyone, especially the children,” Goodwin says. “With that background
in early childhood, there is a big difference in the way the teachers communicate with the children and the
activities they choose.They know what’s age-appropriate.They know how long children can pay attention.They
know how to respond to a child who is acting out and keep things positive. It makes a difference all around.”
So it is with “small group” time, as the teachers gather groups of seven or eight children on the rug to play
number games. Today the children have chosen “Uno,” which helps develop math skills, number recognition
and social skills like turn-taking and planning ahead. As one child counts out the cards for her classmates
the teacher quickly reviews the rules of the game.

37
As soon as they begin playing the game it is clear that although the teacher is playing alongside the children
she is also planfully weaving skills and concepts into the activity. She reinforces the names of the numerals
as the children place the cards, “I see Laila put down a seven, if your turn is coming up you should be
thinking about whether you have a seven,” and encourages children in their attempts to get along with
each other by saying things like, “Gregory, I appreciate the way you reminded Kayla that it was her turn.”
As simple as the 20-minute activity might appear to the casual observer, Goodwin and her staff know it
takes years of training and hours of planning each week to create the activities that spur school readiness
skills, from number recognition to taking turns. “I have always emphasized the importance of training and
preparation among my staff, because I know what a difference it makes,” says Goodwin. “But the great
thing today is that the State of New Jersey has put that on the agenda, and is not only requiring teacher
training – but starting to compensate the teachers and reward them as they get additional training.”
Starting this year, teachers in her program will earn as much as public school teachers, up to $40,000 in
annual salary with experience. “Up until now, head teachers were making $25,000 a year, barely enough to
live on in New Jersey. I know that when I started out, I had to live with my parents. The fact that teachers
couldn’t earn enough to support themselves played out in many programs, causing high rates of staff
turnover. You can see that things are stabilizing around Newark, as the state raises standards and pays
teachers better,” she says.
That stability translates into a sense of community and support at Vailsburg, with teachers returning year
after year, enhancing the classrooms, learning new techniques and building relationships with the children
and families they serve. A resource center full of special notebooks with model lesson plans, articles on
the latest findings in child development research and general information on children’s emotional and
mental health sits at the core of the program, an easy place for teachers to drop by and spend some time
on break, over lunch or at day’s end, if they need some new ideas.
In addition, the halls and walls throughout the center sport inspirational sayings for teachers and families
alike, reminding everyone of the power of respect and high expectations. “There’s no substitute for a good
relationship in this work,” says Goodwin. “Everything flows from that. Once the teachers know how to
respond and build a child’s trust and confidence, then learning takes place. And the background in early
childhood helps them frame a positive response, from the tone they use to the words they choose.”
So it is as two children spill off the playground and run into each other on the way to circle time. There
are tears, but within moments, teacher Tanya and her assistant have delivered hugs, reassuring words that
acknowledge the brief hurt, but turn the exchange into something positive. “Oh, I know that must have
hurt, but you two have such fun together. How about a hug? How about you two hold hands on the way
to ‘Uno?’ I know you are both winners at that game!”
Smiles ensue, and the two join their classmates, hand-in-hand, to play “Uno.” And learn their numbers, how
to take turns and count, along the way.
…by Betty Holcomb
38
The quantity of resources that a state devotes to preschool education impacts both the number of children
that can be served and the quality of service that they receive. By devoting more resources, states may
improve access to preschool either by providing additional slots or extending hours of program operation,
and may enhance quality by allowing programs to offer comprehensive services or pay salaries of highly
qualified teachers. Resources may be used with varying levels of efficiency, but as a general rule, the largest
and highest quality programs tend to be the best funded. Though overall spending on state preschool
has increased in recent years, funding for these programs remains low relative to K–12 and Head Start
spending. Substantial additional funding will be required to significantly increase access and quality.
In this report, we examine resources as a reflection of state commitment to high-quality preschool. For
each program, we asked states to report total state funding and also to indicate funds received from federal
sources such as Temporary Assistance for Needy Families (TANF) or the Child Care and Development
Fund (CCDF). We also collected information regarding local match requirements. Data were obtained at
the state level in three other areas: information about scholarships awarded to preschool teachers, policies
regarding teacher certification in early childhood education, and number of full-time staff employed to
administer preschool or early childhood special education.
State Spending
Total state spending figures presented on the state profile pages do not include all money received from
federal or local sources, and are not estimates of full program cost.The state figures include some flow-through
money from federal sources when such funds were reported as part of state spending, and were used to
serve children enrolled in a program that also received state money. States are ranked according to state
spending per child enrolled, calculated by dividing the total program funding figure by total enrollment. As
an indication of per capita spending on preschool education, we report state spending per 3-year-old, and
state spending per 4-year-old, derived by dividing a portion of funding (based on the age-breakdown of
enrollees) by total state population at each age.
States contributed a total of about $2,435,000,000 to preschool programs during 2001–2002. Individual
state spending varied considerably, from $650,000 in Maine to over $300,000,000 in California, New
Jersey, and Texas, with an average of just over $65,000,000 for 37 states that reported funding. While the
largest state contributions tended to come from the most populous states, funding figures did not depend
entirely upon the size of the 3- and 4-year-old populations. For example, South Carolina put more money
into preschool than eight states with larger populations of 3- and 4-year-olds. As shown in Table 3 (page
41), spending per child enrolled in state preschool programs ranged from $451 in Maine to $10,088 in
New Jersey, with a mean of about $3,450 per child. The majority of states that funded programs provided
between $2,000 and $4,000 per child, but six states spent over $5,000, three of which offer state Head
Start model programs (Delaware, Ohio and Oregon). New Jersey enrolls far more children in state preschool
compared to the five other states that spend more than $5,000 per child.
RE SOURCE S
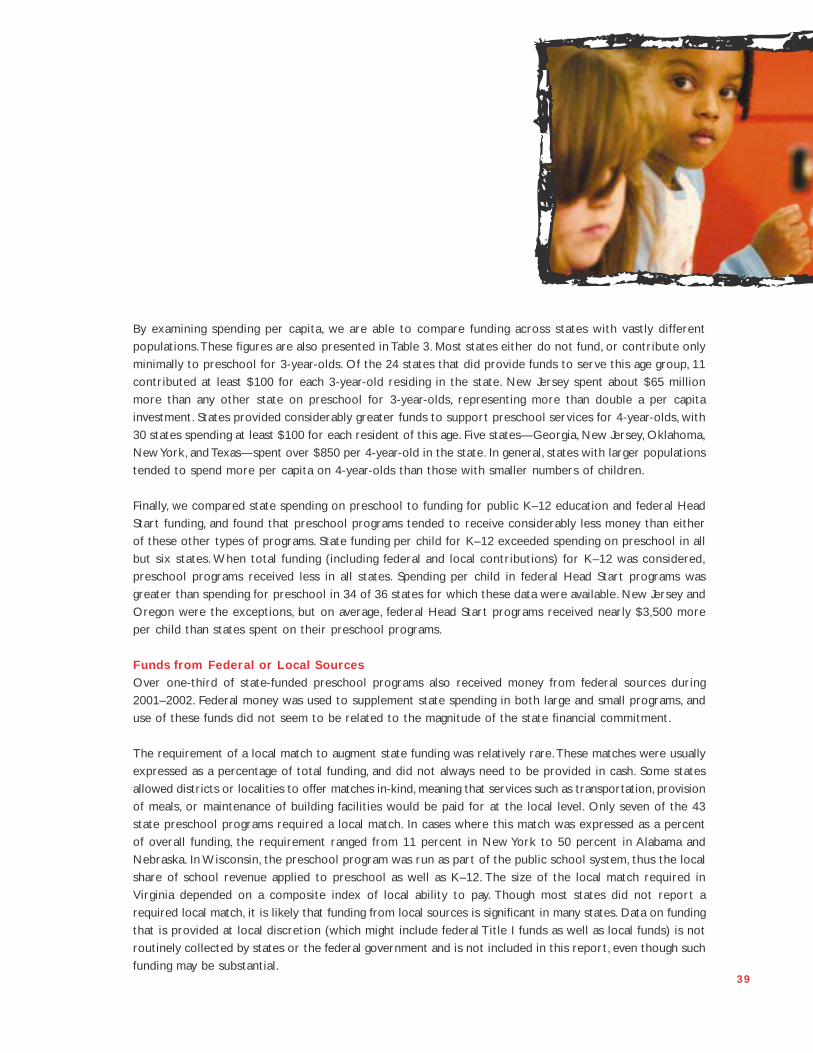
39
By examining spending per capita, we are able to compare funding across states with vastly different
populations.These figures are also presented in Table 3. Most states either do not fund, or contribute only
minimally to preschool for 3-year-olds. Of the 24 states that did provide funds to serve this age group, 11
contributed at least $100 for each 3-year-old residing in the state. New Jersey spent about $65 million
more than any other state on preschool for 3-year-olds, representing more than double a per capita
investment. States provided considerably greater funds to support preschool services for 4-year-olds, with
30 states spending at least $100 for each resident of this age. Five states—Georgia, New Jersey, Oklahoma,
New York, and Texas—spent over $850 per 4-year-old in the state. In general, states with larger populations
tended to spend more per capita on 4-year-olds than those with smaller numbers of children.
Finally, we compared state spending on preschool to funding for public K–12 education and federal Head
Start funding, and found that preschool programs tended to receive considerably less money than either
of these other types of programs. State funding per child for K–12 exceeded spending on preschool in all
but six states. When total funding (including federal and local contributions) for K–12 was considered,
preschool programs received less in all states. Spending per child in federal Head Start programs was
greater than spending for preschool in 34 of 36 states for which these data were available. New Jersey and
Oregon were the exceptions, but on average, federal Head Start programs received nearly $3,500 more
per child than states spent on their preschool programs.
Funds from Federal or Local Sources
Over one-third of state-funded preschool programs also received money from federal sources during
2001–2002. Federal money was used to supplement state spending in both large and small programs, and
use of these funds did not seem to be related to the magnitude of the state financial commitment.
The requirement of a local match to augment state funding was relatively rare. These matches were usually
expressed as a percentage of total funding, and did not always need to be provided in cash. Some states
allowed districts or localities to offer matches in-kind, meaning that services such as transportation, provision
of meals, or maintenance of building facilities would be paid for at the local level. Only seven of the 43
state preschool programs required a local match. In cases where this match was expressed as a percent
of overall funding, the requirement ranged from 11 percent in New York to 50 percent in Alabama and
Nebraska. In Wisconsin, the preschool program was run as part of the public school system, thus the local
share of school revenue applied to preschool as well as K–12. The size of the local match required in
Virginia depended on a composite index of local ability to pay. Though most states did not report a
required local match, it is likely that funding from local sources is significant in many states. Data on funding
that is provided at local discretion (which might include federal Title I funds as well as local funds) is not
routinely collected by states or the federal government and is not included in this report, even though such
funding may be substantial.
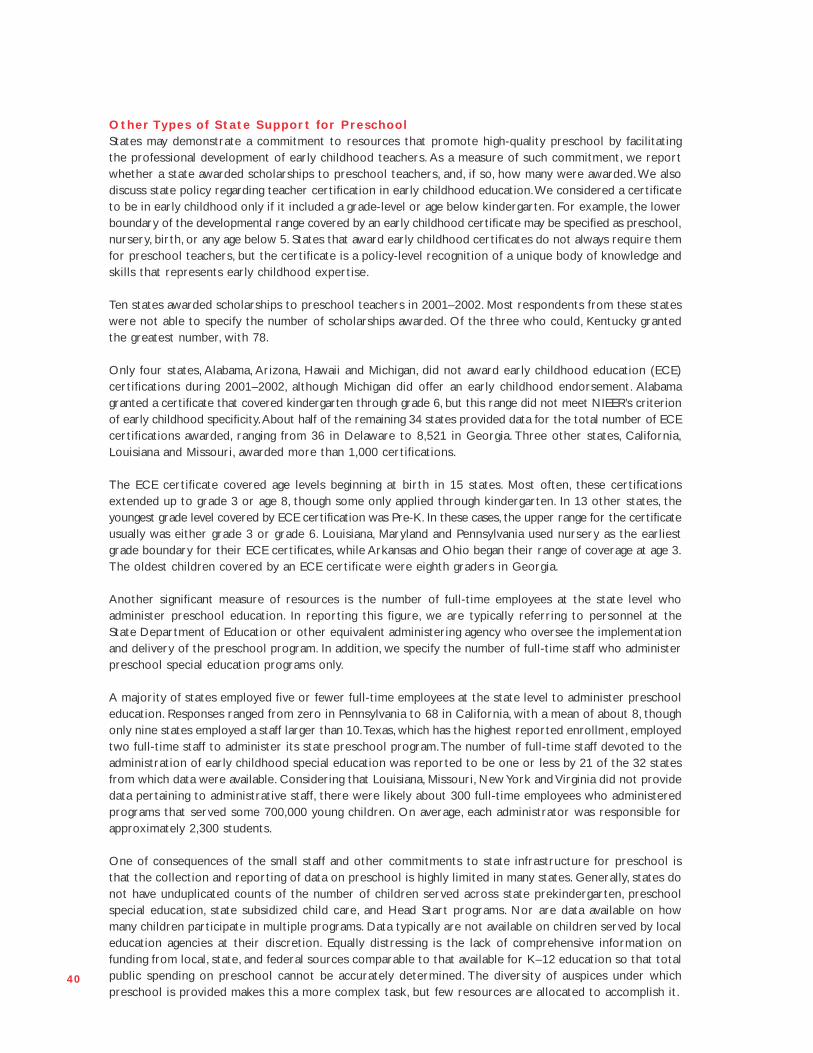
40
Other Types of State Support for PreschoolStates may demonstrate a commitment to resources that promote high-quality preschool by facilitatingthe professional development of early childhood teachers. As a measure of such commitment, we reportwhether a state awarded scholarships to preschool teachers, and, if so, how many were awarded. We alsodiscuss state policy regarding teacher certification in early childhood education.We considered a certificateto be in early childhood only if it included a grade-level or age below kindergarten. For example, the lowerboundary of the developmental range covered by an early childhood certificate may be specified as preschool,nursery, birth, or any age below 5. States that award early childhood certificates do not always require themfor preschool teachers, but the certificate is a policy-level recognition of a unique body of knowledge andskills that represents early childhood expertise.
Ten states awarded scholarships to preschool teachers in 2001–2002. Most respondents from these stateswere not able to specify the number of scholarships awarded. Of the three who could, Kentucky grantedthe greatest number, with 78.
Only four states, Alabama, Arizona, Hawaii and Michigan, did not award early childhood education (ECE)certifications during 2001–2002, although Michigan did offer an early childhood endorsement. Alabamagranted a certificate that covered kindergarten through grade 6, but this range did not meet NIEER’s criterionof early childhood specificity.About half of the remaining 34 states provided data for the total number of ECEcertifications awarded, ranging from 36 in Delaware to 8,521 in Georgia. Three other states, California,Louisiana and Missouri, awarded more than 1,000 certifications.
The ECE certificate covered age levels beginning at birth in 15 states. Most often, these certificationsextended up to grade 3 or age 8, though some only applied through kindergarten. In 13 other states, theyoungest grade level covered by ECE certification was Pre-K. In these cases, the upper range for the certificateusually was either grade 3 or grade 6. Louisiana, Maryland and Pennsylvania used nursery as the earliestgrade boundary for their ECE certificates, while Arkansas and Ohio began their range of coverage at age 3.The oldest children covered by an ECE certificate were eighth graders in Georgia.
Another significant measure of resources is the number of full-time employees at the state level whoadminister preschool education. In reporting this figure, we are typically referring to personnel at theState Department of Education or other equivalent administering agency who oversee the implementationand delivery of the preschool program. In addition, we specify the number of full-time staff who administerpreschool special education programs only.
A majority of states employed five or fewer full-time employees at the state level to administer preschooleducation. Responses ranged from zero in Pennsylvania to 68 in California, with a mean of about 8, thoughonly nine states employed a staff larger than 10.Texas, which has the highest reported enrollment, employedtwo full-time staff to administer its state preschool program. The number of full-time staff devoted to theadministration of early childhood special education was reported to be one or less by 21 of the 32 statesfrom which data were available. Considering that Louisiana, Missouri, New York and Virginia did not providedata pertaining to administrative staff, there were likely about 300 full-time employees who administeredprograms that served some 700,000 young children. On average, each administrator was responsible forapproximately 2,300 students.
One of consequences of the small staff and other commitments to state infrastructure for preschool isthat the collection and reporting of data on preschool is highly limited in many states. Generally, states donot have unduplicated counts of the number of children served across state prekindergarten, preschoolspecial education, state subsidized child care, and Head Start programs. Nor are data available on howmany children participate in multiple programs. Data typically are not available on children served by localeducation agencies at their discretion. Equally distressing is the lack of comprehensive information onfunding from local, state, and federal sources comparable to that available for K–12 education so that totalpublic spending on preschool cannot be accurately determined. The diversity of auspices under whichpreschool is provided makes this a more complex task, but few resources are allocated to accomplish it.
NA=Not available (State did not provide data or had an early childhood initiative that was not comparable to those in other states.)For details about how these figures were calculated, see the Methodology section and Roadmap to State Prolife Pages.
TABLE 3: RANKINGS OF STATE PRE-K RESOURCES PER CHILD ENROLLED
$ per child
Resources enrolled in $ per 3-year-old $ per 4-year-old
Rank State state pre-k in the state in the state––––––––––––––––––––––––––––––––––––––––––––––––––––––––––––––––––––––––––––––––––––––––––––––––––––––––––––––––––––––––––––––––––––––––––––––––––––––––––––––––––1 New Jersey $10,088 $1,277 $1,922––––––––––––––––––––––––––––––––––––––––––––––––––––––––––––––––––––––––––––––––––––––––––––––––––––––––––––––––––––––––––––––––––––––––––––––––––––––––––––––––––2 Oregon $7,463 $184 $427––––––––––––––––––––––––––––––––––––––––––––––––––––––––––––––––––––––––––––––––––––––––––––––––––––––––––––––––––––––––––––––––––––––––––––––––––––––––––––––––––
FEDERAL HEAD START $6,934 FEDERAL HEAD START––––––––––––––––––––––––––––––––––––––––––––––––––––––––––––––––––––––––––––––––––––––––––––––––––––––––––––––––––––––––––––––––––––––––––––––––––––––––––––––––––3 Connecticut $6,727 $225 $637––––––––––––––––––––––––––––––––––––––––––––––––––––––––––––––––––––––––––––––––––––––––––––––––––––––––––––––––––––––––––––––––––––––––––––––––––––––––––––––––––4 North Carolina $5,242 $0 $61––––––––––––––––––––––––––––––––––––––––––––––––––––––––––––––––––––––––––––––––––––––––––––––––––––––––––––––––––––––––––––––––––––––––––––––––––––––––––––––––––5 Delaware $5,078 $0 $404––––––––––––––––––––––––––––––––––––––––––––––––––––––––––––––––––––––––––––––––––––––––––––––––––––––––––––––––––––––––––––––––––––––––––––––––––––––––––––––––––6 Ohio $5,015 $302 $407––––––––––––––––––––––––––––––––––––––––––––––––––––––––––––––––––––––––––––––––––––––––––––––––––––––––––––––––––––––––––––––––––––––––––––––––––––––––––––––––––7 Washington $4,908 $82 $325––––––––––––––––––––––––––––––––––––––––––––––––––––––––––––––––––––––––––––––––––––––––––––––––––––––––––––––––––––––––––––––––––––––––––––––––––––––––––––––––––8 Massachusetts $4,826 $571 $558––––––––––––––––––––––––––––––––––––––––––––––––––––––––––––––––––––––––––––––––––––––––––––––––––––––––––––––––––––––––––––––––––––––––––––––––––––––––––––––––––9 Arizona $4,559 $0 $255––––––––––––––––––––––––––––––––––––––––––––––––––––––––––––––––––––––––––––––––––––––––––––––––––––––––––––––––––––––––––––––––––––––––––––––––––––––––––––––––––10 Georgia $3,721 $0 $1,987––––––––––––––––––––––––––––––––––––––––––––––––––––––––––––––––––––––––––––––––––––––––––––––––––––––––––––––––––––––––––––––––––––––––––––––––––––––––––––––––––11 New York $3,622 $78 $896––––––––––––––––––––––––––––––––––––––––––––––––––––––––––––––––––––––––––––––––––––––––––––––––––––––––––––––––––––––––––––––––––––––––––––––––––––––––––––––––––12 Wisconsin $3,518 $46 $654––––––––––––––––––––––––––––––––––––––––––––––––––––––––––––––––––––––––––––––––––––––––––––––––––––––––––––––––––––––––––––––––––––––––––––––––––––––––––––––––––13 Iowa $3,291 $45 $134––––––––––––––––––––––––––––––––––––––––––––––––––––––––––––––––––––––––––––––––––––––––––––––––––––––––––––––––––––––––––––––––––––––––––––––––––––––––––––––––––14 Michigan $3,205 $0 $613––––––––––––––––––––––––––––––––––––––––––––––––––––––––––––––––––––––––––––––––––––––––––––––––––––––––––––––––––––––––––––––––––––––––––––––––––––––––––––––––––15 Virginia $3,194 $0 $201––––––––––––––––––––––––––––––––––––––––––––––––––––––––––––––––––––––––––––––––––––––––––––––––––––––––––––––––––––––––––––––––––––––––––––––––––––––––––––––––––16 Alabama $3,175 $0 $40––––––––––––––––––––––––––––––––––––––––––––––––––––––––––––––––––––––––––––––––––––––––––––––––––––––––––––––––––––––––––––––––––––––––––––––––––––––––––––––––––17 Illinois $3,094 $250 $665––––––––––––––––––––––––––––––––––––––––––––––––––––––––––––––––––––––––––––––––––––––––––––––––––––––––––––––––––––––––––––––––––––––––––––––––––––––––––––––––––18 California $3,080 $158 $437––––––––––––––––––––––––––––––––––––––––––––––––––––––––––––––––––––––––––––––––––––––––––––––––––––––––––––––––––––––––––––––––––––––––––––––––––––––––––––––––––19 Hawaii $3,059 $0 $235––––––––––––––––––––––––––––––––––––––––––––––––––––––––––––––––––––––––––––––––––––––––––––––––––––––––––––––––––––––––––––––––––––––––––––––––––––––––––––––––––20 Nevada $2,950 $21 $73––––––––––––––––––––––––––––––––––––––––––––––––––––––––––––––––––––––––––––––––––––––––––––––––––––––––––––––––––––––––––––––––––––––––––––––––––––––––––––––––––21 Kentucky $2,776 $204 $662––––––––––––––––––––––––––––––––––––––––––––––––––––––––––––––––––––––––––––––––––––––––––––––––––––––––––––––––––––––––––––––––––––––––––––––––––––––––––––––––––22 Nebraska $2,708 $14 $41––––––––––––––––––––––––––––––––––––––––––––––––––––––––––––––––––––––––––––––––––––––––––––––––––––––––––––––––––––––––––––––––––––––––––––––––––––––––––––––––––23 Colorado $2,682 $33 $375––––––––––––––––––––––––––––––––––––––––––––––––––––––––––––––––––––––––––––––––––––––––––––––––––––––––––––––––––––––––––––––––––––––––––––––––––––––––––––––––––24 West Virginia $2,486 $240 $672––––––––––––––––––––––––––––––––––––––––––––––––––––––––––––––––––––––––––––––––––––––––––––––––––––––––––––––––––––––––––––––––––––––––––––––––––––––––––––––––––25 Oklahoma $2,428 $0 $1,350––––––––––––––––––––––––––––––––––––––––––––––––––––––––––––––––––––––––––––––––––––––––––––––––––––––––––––––––––––––––––––––––––––––––––––––––––––––––––––––––––26 Missouri $2,407 $84 $118––––––––––––––––––––––––––––––––––––––––––––––––––––––––––––––––––––––––––––––––––––––––––––––––––––––––––––––––––––––––––––––––––––––––––––––––––––––––––––––––––27 Louisiana $2,389 $0 $128––––––––––––––––––––––––––––––––––––––––––––––––––––––––––––––––––––––––––––––––––––––––––––––––––––––––––––––––––––––––––––––––––––––––––––––––––––––––––––––––––28 Tennessee $2,226 $25 $51––––––––––––––––––––––––––––––––––––––––––––––––––––––––––––––––––––––––––––––––––––––––––––––––––––––––––––––––––––––––––––––––––––––––––––––––––––––––––––––––––29 Texas $2,186 $134 $857––––––––––––––––––––––––––––––––––––––––––––––––––––––––––––––––––––––––––––––––––––––––––––––––––––––––––––––––––––––––––––––––––––––––––––––––––––––––––––––––––30 Arkansas $2,028 $52 $123––––––––––––––––––––––––––––––––––––––––––––––––––––––––––––––––––––––––––––––––––––––––––––––––––––––––––––––––––––––––––––––––––––––––––––––––––––––––––––––––––31 Kansas $2,018 $0 $118––––––––––––––––––––––––––––––––––––––––––––––––––––––––––––––––––––––––––––––––––––––––––––––––––––––––––––––––––––––––––––––––––––––––––––––––––––––––––––––––––32 Maryland $1,751 $0 $264––––––––––––––––––––––––––––––––––––––––––––––––––––––––––––––––––––––––––––––––––––––––––––––––––––––––––––––––––––––––––––––––––––––––––––––––––––––––––––––––––33 South Carolina $1,473 $10 $433––––––––––––––––––––––––––––––––––––––––––––––––––––––––––––––––––––––––––––––––––––––––––––––––––––––––––––––––––––––––––––––––––––––––––––––––––––––––––––––––––34 Vermont $1,379 $73 $119––––––––––––––––––––––––––––––––––––––––––––––––––––––––––––––––––––––––––––––––––––––––––––––––––––––––––––––––––––––––––––––––––––––––––––––––––––––––––––––––––35 New Mexico $782 $16 $44––––––––––––––––––––––––––––––––––––––––––––––––––––––––––––––––––––––––––––––––––––––––––––––––––––––––––––––––––––––––––––––––––––––––––––––––––––––––––––––––––36 Maine $451 $0 $44––––––––––––––––––––––––––––––––––––––––––––––––––––––––––––––––––––––––––––––––––––––––––––––––––––––––––––––––––––––––––––––––––––––––––––––––––––––––––––––––––NA Florida NA NA NA––––––––––––––––––––––––––––––––––––––––––––––––––––––––––––––––––––––––––––––––––––––––––––––––––––––––––––––––––––––––––––––––––––––––––––––––––––––––––––––––––NA Minnesota NA $143 $255––––––––––––––––––––––––––––––––––––––––––––––––––––––––––––––––––––––––––––––––––––––––––––––––––––––––––––––––––––––––––––––––––––––––––––––––––––––––––––––––––NA Pennsylvania NA NA NA––––––––––––––––––––––––––––––––––––––––––––––––––––––––––––––––––––––––––––––––––––––––––––––––––––––––––––––––––––––––––––––––––––––––––––––––––––––––––––––––––NA Rhode Island NA NA NA––––––––––––––––––––––––––––––––––––––––––––––––––––––––––––––––––––––––––––––––––––––––––––––––––––––––––––––––––––––––––––––––––––––––––––––––––––––––––––––––––50 Alaska $0 $0 $0––––––––––––––––––––––––––––––––––––––––––––––––––––––––––––––––––––––––––––––––––––––––––––––––––––––––––––––––––––––––––––––––––––––––––––––––––––––––––––––––––50 Idaho $0 $0 $0––––––––––––––––––––––––––––––––––––––––––––––––––––––––––––––––––––––––––––––––––––––––––––––––––––––––––––––––––––––––––––––––––––––––––––––––––––––––––––––––––50 Indiana $0 $0 $0––––––––––––––––––––––––––––––––––––––––––––––––––––––––––––––––––––––––––––––––––––––––––––––––––––––––––––––––––––––––––––––––––––––––––––––––––––––––––––––––––50 Mississippi $0 $0 $0––––––––––––––––––––––––––––––––––––––––––––––––––––––––––––––––––––––––––––––––––––––––––––––––––––––––––––––––––––––––––––––––––––––––––––––––––––––––––––––––––50 Montana $0 $0 $0––––––––––––––––––––––––––––––––––––––––––––––––––––––––––––––––––––––––––––––––––––––––––––––––––––––––––––––––––––––––––––––––––––––––––––––––––––––––––––––––––50 New Hampshire $0 $0 $0––––––––––––––––––––––––––––––––––––––––––––––––––––––––––––––––––––––––––––––––––––––––––––––––––––––––––––––––––––––––––––––––––––––––––––––––––––––––––––––––––50 North Dakota $0 $0 $0––––––––––––––––––––––––––––––––––––––––––––––––––––––––––––––––––––––––––––––––––––––––––––––––––––––––––––––––––––––––––––––––––––––––––––––––––––––––––––––––––50 South Dakota $0 $0 $0––––––––––––––––––––––––––––––––––––––––––––––––––––––––––––––––––––––––––––––––––––––––––––––––––––––––––––––––––––––––––––––––––––––––––––––––––––––––––––––––––50 Utah $0 $0 $0––––––––––––––––––––––––––––––––––––––––––––––––––––––––––––––––––––––––––––––––––––––––––––––––––––––––––––––––––––––––––––––––––––––––––––––––––––––––––––––––––50 Wyoming $0 $0 $0––––––––––––––––––––––––––––––––––––––––––––––––––––––––––––––––––––––––––––––––––––––––––––––––––––––––––––––––––––––––––––––––––––––––––––––––––––––––––––––––––
41
42
Three state preschool programs stand out as exemplary in one or more ways that provide interesting
models for other states. These states illustrate that it is feasible for even states of modest means to offer
preschool programs to all children and that high-quality preschool programs can be delivered to all children
on a large scale. None of these states provides a perfect program, but each is far above average in its
commitment to assuring that children receive a good early education.
Georgia was the first state to offer preschool to all 4-year-old children.The program is supported by lottery
funds, and over half of the state’s 4-year-olds enrolled in 2001–02. Georgia does not require that teachers
have a college degree or early childhood certification. However, the state has a tiered reimbursement system
that pays more per child to programs whose teachers have higher qualifications. As a result, 80 percent of
its preschool teachers are certified. Georgia could upgrade its qualifications requirements at relatively little
cost so as to ensure that every child has a qualified teacher.
Oklahoma was the second state to open its preschool program to all 4-year-olds. As the program is
offered to all districts, but districts are not required to participate, the program is not yet available everywhere
in the state. Nevertheless, Oklahoma enrolls a higher percentage of its 4-year-olds than any other state:
56 percent in 2001–2002 and 60 percent in 2002–2003. Including Head Start and preschool special education,
combined enrollment may have exceeded 75 percent in 2001–2002. In addition, all preschool teachers are
certified and receive the same salaries and benefits as other public school teachers, even when they teach
outside the public schools. State funding is provided through the regular education funding formula, which
lends financial stability to the program. Districts can partner to provide services through Head Start and
private programs in Oklahoma without lowering standards.
New Jersey’s “Abbott District” preschool program sets the highest standards in the nation and provides
preschool free to all beginning at age 3 in 30 of the state’s largest and most disadvantaged school districts.The
program is the combined result of a court order, legislation, and the policy decisions of both Republican and
Democratic governors. The "Abbott District" preschool program provides a certified teacher (paid a public
school salary) and an assistant to each class of 15 children. Department of Education funds pay for a 6-hour
day during the school year. Human Services funds pay for extended hours and additional days up to 245 per
year. New Jersey also provides funds for half-day preschool (and full-day kindergarten) to 102 more school
districts. Even though quality standards are lower in these districts than in the “Abbott District” program,
state spending per child enrolled remains in the top 10. In funding these programs, New Jersey commits
more money per child enrolled and more money per 3-year-old statewide than any other state and ranks
second in the nation for spending per 4-year-old.
S TAT E S W I TH EXEMPLARY PO L I C I E S

43
States to Watch
Ten additional states have pursued policies that show promise or peril for preschool education, but the
results will depend on future policy decisions. These states are poised to make important gains. However,
policy developments in these states should be closely watched to ensure that they lead to improvements
in access, quality and the resources required to implement educationally effective programs.
Alabama: In 2000, the state began a pilot Pre-K initiative for 4-year-olds. While still small, this program
is growing and may be able to serve a larger proportion of the population, since only the funding level
(rather than eligibility restrictions) prevents more children from enrolling.
Arkansas: The state has set higher quality standards than the vast majority of states and taken the unique
approach of supporting its high-quality preschool program with an excise tax on beer, passed in 2001.
California: In addition to funding the State Preschool Program, since 1998 California has been devoting
additional resources to preschool through the California Children and Families Act, which is funded by a
dedicated tobacco tax. It will be important to ensure that adequate quality standards are set when Los
Angeles and other counties implement preschool programs with this new funding.
Florida: In November 2002, Florida voters passed a ballot initiative specifying that all 4-year-olds in the
state should have access to free “high-quality” preschool programs by 2005. The state is now developing
plans for this initiative including setting quality standards and funding levels. It is essential that both quality
standards and funding be adequate to create a program that truly is high-quality for every child.
Illinois: Illinois is another state with relatively high quality standards. For fiscal year 2003–2004 Illinois
committed an additional $29.4 million to the block grant that funds its state-financed prekindergarten
program. This increased funding should allow the program to provide access to more of Illinois’ children.
As the state budget picture improves, increased commitment to access and quality could make Illinois a
true leader in early education.
Maryland: By the 2007–2008 school year, all local school systems in Maryland will be required to provide
preschool to 4-year-olds from disadvantaged families or who are homeless, following provisions of the
Bridge to Excellence in Public Schools Act passed in 2002. It will be important to monitor annual progress
toward this goal in terms of access, quality standards and resources.
44
New York: The state established a prekindergarten program in 1997 with the intention of making it
universally available to all 4-year-olds after five years. The program has received insufficient funding and
continues to be limited, for the most part, to children from low-income families. The state postponed
implementing a provision that would have required all classrooms to have a certified teacher by 2002.
A renewed commitment by New York to its preschool promises could transform the state into a model
for others.
Ohio: Until recently, Ohio invested a significant amount of state funds to supplement federal Head Start
funding. State-funded Head Start followed the comprehensive Head Start model in addressing children’s
full range of developmental needs, from health care to nutrition to social services to parent involvement.
However, Ohio has now replaced its own state funds with federal TANF funds. This is a potentially unstable
funding source. Ohio’s support for this program in the future may be judged in part by its continued com-
mitment of state as well as federal funds to maintain and expand the program.
Pennsylvania: Even though a major initiative was proposed this year in Pennsylvania to jump-start a state
preschool program, a much more limited and smaller initiative was passed. The proposal just passed will
make $175 million in block grants available in 2004–2005 for schools to use for any of a variety of purposes
that could include prekindergarten and full-day kindergarten. Individual school districts will determine
how to spend the new funds. State support for preschool barely exists currently, with only 2 percent of the
state’s children served in 4-year-old kindergarten, fewer than enroll in preschool special education. If
Pennsylvania provided funding specifically for a preschool program, it could change from a laggard to a
leader with respect to both access and quality standards.
West Virginia: State legislation passed in 2002 provides for 4-year-olds in West Virginia to have universal
access to prekindergarten by 2012. It is important that the state make steady annual progress toward that
goal while improving its quality standards.
More information about each of the state-financed preschool initiatives mentioned in this section can be
found in the “State Profiles” section later in this report.
45
Given the great variation in state-funded prekindergarten programs, policy makers and concerned citizens
within each state should reach their own conclusions about what should be done to improve their state’s
programs.We hope that this Yearbook will encourage public debate about state preschool programs.The states
have much to learn from each other and we expect that state policy debates will benefit from comparisons
across the states that this Yearbook facilitates. Nevertheless, we offer five general policy conclusions:
1. All states should provide adequate access to state-funded preschool programs. Twenty states serve
fewer than 10 percent of their 4-year-olds. Ten states serve none. The three states that have committed
to universal access do not in fact reach all 4-year-olds, and New York is far from its goal. European nations
that offer universal preschool programs routinely enroll nearly 100 percent of the children, and many
school districts in the United States that offer universal access to preschool have enrollment nearing 100
percent. A well-designed universal preschool program should have an enrollment rate at least as high as
public kindergarten.
2. All states need to improve their quality standards. While standards do not ensure quality, inadequate
standards permit substantial variation in quality at best and overall low quality at worst. Without quality,
children will not receive the educational benefits that states seek to provide, and some children may even
be harmed. Our checklist provides an evidence-based starting point for states to assess their quality standards.
Some states only need to make a few, relatively inexpensive changes to their standards. Others will require
more extensive improvements. However, the costs of these improvements can be more modest than they
appear at first. For example, Georgia does not require preschool teachers to have a BA degree, but as 80
percent of its preschool teachers already have a BA, the number of teachers who would need to upgrade
their credentials to meet this standard is modest.
3. Ten states spend nothing at all on preschool and state spending is embarrassingly low in many or even
most other states. The case for increased preschool funding is obvious. No other public expenditure can
reasonably claim to produce higher economic returns.Yet, limited state funding severely reduces the number
of children that can be served and the quality of programs. In addition, many states explicitly or implicitly
rely on local government and other funding (including parent fees) to cover a significant percentage of
costs. This approach seems likely to recreate in preschool programs the inequities that have plagued the
public school system more generally for decades.
4. In view of the problems with state quality standards and funding, one remedy could be for the federal
government to offer financial incentives to states for investing in quality preschool programs. Such a policy
might be implemented by offering to match state funds invested in preschool programs with high standards.
5. At least partly as a result of federal Head Start, special education, and child care policies, there is a lack of
coordination in state data-gathering. In most states it is impossible to obtain an unduplicated count of children
served or to track the total amount of public funds spent on each child across all levels of government. The
federal government should take steps to remedy this problem by providing states with incentives to collect
and report accurate data.
POL I C Y CONC LU S I ON S
Related Documents