The Political Legacy of American Slavery * Avidit Acharya † Matthew Blackwell ‡ Maya Sen § November 16, 2014 Abstract We show that contemporary differences in political attitudes across counties in the American South trace their origins to slavery’s prevalence more than 150 years ago. Whites who currently live in Southern counties that had high shares of slaves in 1860 are more likely to identify as a Republican, oppose affirmative action policies, and express racial resentment and colder feelings toward blacks. These results cannot be explained by existing theories, including the theory of racial threat. To explain the results, we offer evidence for a new theory involving the historical persistence of racial attitudes. We argue that, following the Civil War, Southern whites faced political and economic incentives to reinforce racist norms and institutions. This produced racially conservative political attitudes, which in turn have been passed down locally across generations. Our results challenge the interpretation of a vast literature on racial attitudes in the American South. JEL Classification Codes: N32, N91, O17 Key words: slavery, institutions, norms, persistence, development * We thank Stephen Ansolabehere, David Brookman, Cathy Cohen, Stanley Engerman, Gerald Gamm, Hein Goemans, Justin Grimmer, Steven Hahn, Jennifer Hochschild, Gary King, Corrine McConnaughy, Clayton Nall, Kevin Quinn, Karthick Ramakrishnan, Marc Ratkovic, John Roemer, Daria Roithmayr, Ken Shotts, Brandon Stewart, and seminar participants at BU, Columbia, Harvard Kennedy School, Harvard Law School, Princeton, Rochester, Stanford, Warwick, UC-Berkeley, UC-Riverside, UPenn, and USC for comments and suggestions. We are also grateful to Michael Haines, Eitan Hersh, and Heather O’Connell for sharing their data with us. † Assistant Professor of Political Science, Stanford University. email: [email protected], web: http: //stanford.edu/~avidit ‡ Assistant Professor of Government, Harvard University. email: [email protected], web: http://www.mattblackwell.org § Assistant Professor of Public Policy, Harvard University. email: [email protected], web: http://scholar.harvard.edu/msen

Welcome message from author
This document is posted to help you gain knowledge. Please leave a comment to let me know what you think about it! Share it to your friends and learn new things together.
Transcript
The Political Legacy of American Slavery∗
Avidit Acharya† Matthew Blackwell‡ Maya Sen§
November 16, 2014
Abstract
We show that contemporary differences in political attitudes across counties inthe American South trace their origins to slavery’s prevalence more than 150 yearsago. Whites who currently live in Southern counties that had high shares of slaves in1860 are more likely to identify as a Republican, oppose affirmative action policies,and express racial resentment and colder feelings toward blacks. These results cannotbe explained by existing theories, including the theory of racial threat. To explainthe results, we offer evidence for a new theory involving the historical persistenceof racial attitudes. We argue that, following the Civil War, Southern whites facedpolitical and economic incentives to reinforce racist norms and institutions. Thisproduced racially conservative political attitudes, which in turn have been passeddown locally across generations. Our results challenge the interpretation of a vastliterature on racial attitudes in the American South.
JEL Classification Codes: N32, N91, O17Key words: slavery, institutions, norms, persistence, development
∗We thank Stephen Ansolabehere, David Brookman, Cathy Cohen, Stanley Engerman, Gerald Gamm,Hein Goemans, Justin Grimmer, Steven Hahn, Jennifer Hochschild, Gary King, Corrine McConnaughy,Clayton Nall, Kevin Quinn, Karthick Ramakrishnan, Marc Ratkovic, John Roemer, Daria Roithmayr,Ken Shotts, Brandon Stewart, and seminar participants at BU, Columbia, Harvard Kennedy School,Harvard Law School, Princeton, Rochester, Stanford, Warwick, UC-Berkeley, UC-Riverside, UPenn, andUSC for comments and suggestions. We are also grateful to Michael Haines, Eitan Hersh, and HeatherO’Connell for sharing their data with us.†Assistant Professor of Political Science, Stanford University. email: [email protected], web: http:
//stanford.edu/~avidit‡Assistant Professor of Government, Harvard University. email: [email protected], web:
http://www.mattblackwell.org§Assistant Professor of Public Policy, Harvard University. email: [email protected], web:
http://scholar.harvard.edu/msen
1 Introduction
For the first 250 years of American history, white landowners, predominantly from theSouth, enslaved more than four million individuals of African descent. This “peculiar in-stitution,” as it was sometimes called, defined the social, economic, and political landscapeof the American South throughout this period. Slavery was so crucial to the South thatone Georgia newspaper editor wrote, “negro slavery is the South, and the South is negroslavery” (cited in Faust, 1988). Yet despite slavery’s prominence in shaping Americanhistory, and despite volumes written by historians on its consequences, social scientistshave largely overlooked how America’s slavery might continue influence its contemporarypolitics. Given recent findings on the long-term consequences of events and institutionsfrom the distant past (Dell, 2010; Nunn and Wantchekon, 2011; Acemoglu, García-Jimenoand Robinson, 2012; Voigtländer and Voth, 2012; Alesina, Giuliano and Nunn, 2013), itwould be surprising if such a fundamental aspect of American history had no persistentimpact on American politics.
In this paper, we estimate the effect of the local prevalence of slavery—an institu-tion that was abolished nearly 150 years ago—on present-day political attitudes in theAmerican South. Drawing on a sample of more than 36,000 Southern whites, we showthat whites who currently live in counties that had high concentrations of slaves in 1860are on average more conservative and express colder feelings toward African Americansthan whites who live elsewhere in the South. That is, the larger the number of slaves inhis or her county of residence in 1860, the greater the probability that a white South-erner today will identify as a Republican, express opposition to affirmative action, andexpress colder feelings towards African Americans. We show that these differences arerobust to accounting for a variety of factors, including geography and mid-19th centuryeconomic conditions and politics. These results also strengthen when we instrument forthe prevalence of slavery using geographic variation in cotton growing conditions. Toour knowledge, ours is the first paper to demonstrate quantitatively the lasting effects ofslavery’s prevalence on contemporary political attitudes in the United States.
Existing theories of American political behavior cannot explain our results. For ex-ample, given the correlation between slavery in 1860 and contemporary shares of blackpopulation, we consider the possibility that white racial attitudes vary with contempo-raneous proportions of black population today—the central finding of the literature onracial threat (Key, 1949; Blalock, 1967; Blumer, 1958). However, when we estimate thedirect effect of slavery on contemporary attitudes, we find that contemporary shares ofblack population explain very little of slavery’s effects. In addition, we also test various
other explanations, including the possibility that slavery’s effects are driven exclusively bypre-Civil War racism, post-Civil War population shifts, or persistent inequality betweenAfrican-Americans and whites. We find no evidence that these other factors can fullyaccount for our results.
To explain our results, we therefore present a new theory of the persistence of racialattitudes, which focuses on events that took place in the decades after the Civil War.We argue that emancipation was a cataclysmic event that undermined Southern whites’political and economic power. As suggested by Key (1949) and Du Bois ([1935] 1999), thesudden enfranchisement of blacks was politically threatening to whites, who for centurieshad enjoyed exclusive political power. In addition, emancipation undermined whites’ eco-nomic power by abruptly increasing black wages, raising labor costs, and threatening theviability of the Southern agricultural economy (Du Bois, [1935] 1999; Alston and Ferrie,1993). Taken together, these political and economic changes gave Southern white elitesan incentive to promote anti-black sentiment in their local communities by encouragingviolence towards blacks, racist attitudes, and the institutionalization of racist policiessuch as Black Codes and Jim Crow laws (Roithmayr, 2010). This intensified white racismin former slaveholding areas, and produced racially conservative political attitudes thathave been passed down locally, one generation to the next.
We provide empirical support for this theory by showing that areas of the Souththat were the earliest to eliminate the political and economic incentives for anti-blackviolence—for example, by adopting new technologies such as tractors that reduced thedemand for black farm labor—are also the areas in which slavery’s long term effects havemost attenuated. Furthermore, as evidence for cultural transmission being an importantpathway for the inter-generational transfer of attitudes, we show that a group that recentlysettled in the American South—the children of immigrants—do not meaningfully vary inpolitical attitudes across former slaveholding and non-slaveholding counties the way otherSouthern whites do.
The paper proceeds as follows. In Section 2, we motivate our hypothesis that thehistorical prevalence of slavery affects modern-day political attitudes. We discuss ourdata in Section 3, and present our core results linking the prevalence of slavery in 1860and contemporary attitudes in Section 4. In Section 5, we consider, and provide evidenceagainst three main competing theories. In Section 6, we provide evidence in favor of ourtheory of historical persistence, paying close attention to post-Reconstruction era politicaland economic incentives. Section 7 concludes by discussing the broader implications ofour research for the study of American political attitudes.
2
0-20%21-40%41-60%61-80%81-100%
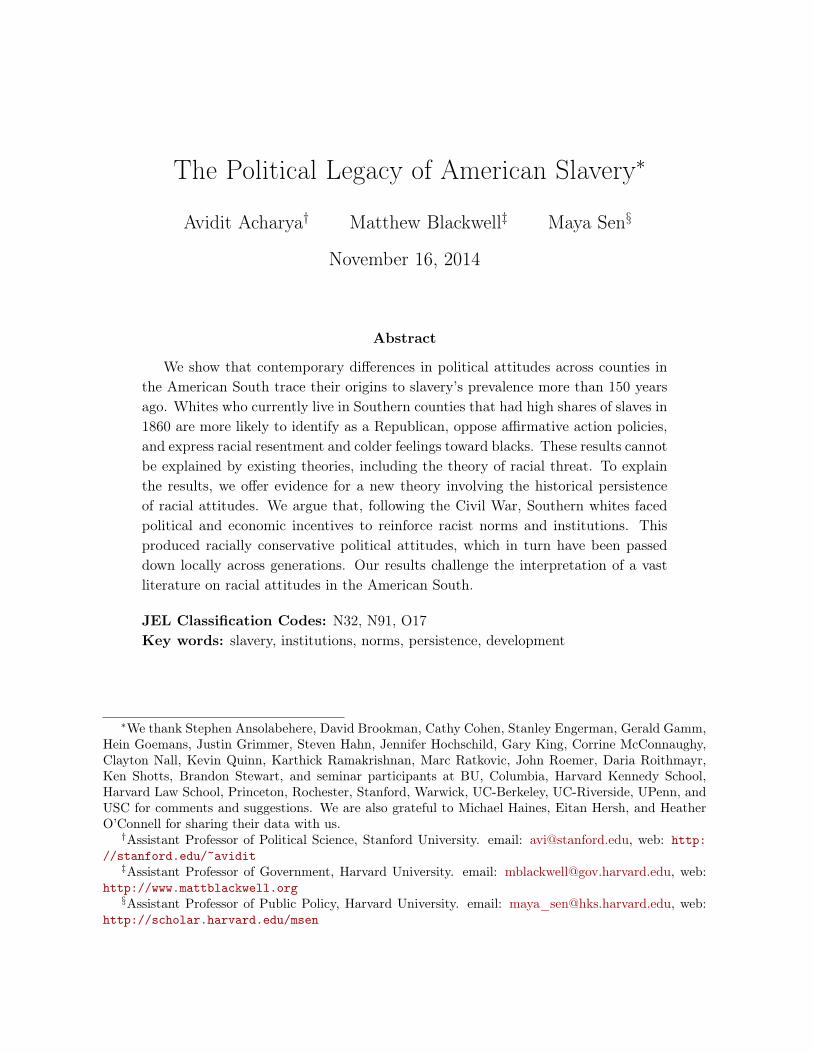
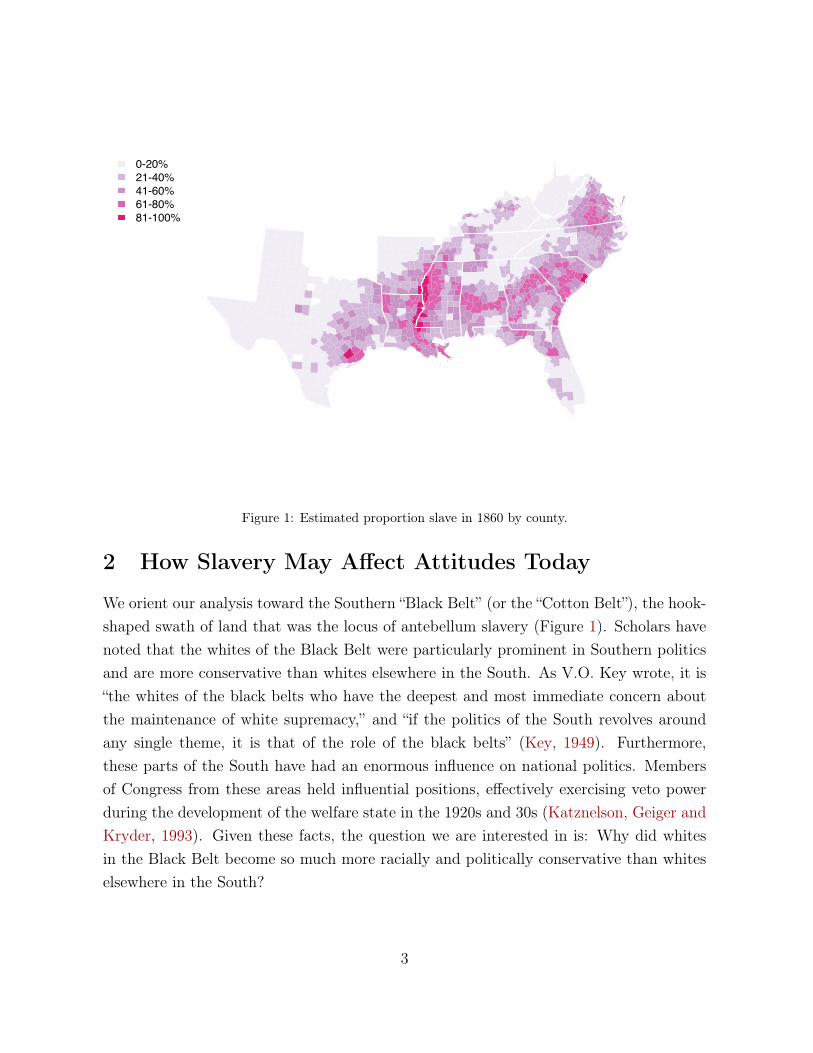
Figure 1: Estimated proportion slave in 1860 by county.
2 How Slavery May Affect Attitudes Today
We orient our analysis toward the Southern “Black Belt” (or the “Cotton Belt”), the hook-shaped swath of land that was the locus of antebellum slavery (Figure 1). Scholars havenoted that the whites of the Black Belt were particularly prominent in Southern politicsand are more conservative than whites elsewhere in the South. As V.O. Key wrote, it is“the whites of the black belts who have the deepest and most immediate concern aboutthe maintenance of white supremacy,” and “if the politics of the South revolves aroundany single theme, it is that of the role of the black belts” (Key, 1949). Furthermore,these parts of the South have had an enormous influence on national politics. Membersof Congress from these areas held influential positions, effectively exercising veto powerduring the development of the welfare state in the 1920s and 30s (Katznelson, Geiger andKryder, 1993). Given these facts, the question we are interested in is: Why did whitesin the Black Belt become so much more racially and politically conservative than whiteselsewhere in the South?
3
2.1 Post-bellum Incentives for Oppression and the Persistence ofPolitical Attitudes
Our hypothesis is that the Black Belt is today more conservative than other parts of theSouth largely due to the persistence of political attitudes that started to take shape indecades after the Civil War. After emancipation in 1865, Southern whites faced two inter-related threats. The first was political. The abrupt enfranchisement of blacks threatenedwhite control over local politics (Du Bois, [1935] 1999; Key, 1949; Kousser, 1974). Thisgave whites in former slaveholding counties an incentive to promote an environment ofviolence and intimidation against the new freedmen, with the purpose of disfranchisingthem (Du Bois, [1935] 1999; Kousser, 1974). Since black populations were greatest in for-mer slaveholding counties, it was in these counties that the Southern elite exerted greaterefforts toward repression and violence (Kousser, 1974).1 Such repression both requiredand supported social norms that put blacks in an inferior position to whites (Myrdal,1944; Logan, 1954; Du Bois, [1935] 1999). Importantly, whereas institutionalized slaveryonly required the support of the white political and economic elite, widespread repressionand political violence required the involvement of entire communities (Du Bois, [1935]1999) and was achieved via a cooperative strategy among whites to subjugate blacks(Roithmayr, 2010).
The second threat to white elites was economic. The emancipation of slaves after theCivil War was a major shock to the Southern economy: unlike in the slavery period, blacksnow had to be paid (closer to) market wages (Higgs, 1977). This raised labor costs sharply,threatening the Southern agricultural economy (Du Bois, [1935] 1999; Alston and Ferrie,1993). Whites therefore had an incentive to suppress blacks’ wages and to establish newforms of labor coercion that could replace slavery. White landowners encouraged violenceagainst blacks, as well as other social practices that could be used to suppress blackwages and mobility (Alston and Ferrie, 1993; Blackmon, 2008; Lichtenstein, 1996). Infact, even poor whites were complicit with the landowning elite, and would engage inviolence towards blacks (for example, by abducting and returning runaway blacks to theiremployers, in exchange for a bounty) even though such violence could presumably lowerwhite wages as well (Blackmon, 2008).
This violence intensified racially hostile attitudes, which expanded across local whitecommunities in a manner consistent with existing theories of the diffusion of political opin-
1Although they set up local formal and informal institutions such as Jim Crow laws, it was throughviolence that white Southerners initially repressed blacks. This violence was often organized, and perpe-trated by groups like the Ku Klux Klan, and it manifested itself in the many lynchings that took placeafter emancipation (Du Bois, [1935] 1999).
4
ions from elites to the public (e.g., Zaller, 1992; DeGroot, 1974).2 These attitudes werethen passed down from one generation to the next through both cultural and institutionalchannels, for example membership to organizations like the Ku Klux Klan (KKK), publicsupport for segregationist policies, and support for the implementation of Jim Crow laws.The intergenerational transfer of such preferences and attitudes is consistent both withtheories of inter-generational socialization that are rooted in the works of Boyd and Rich-erson (1988) and Bisin and Verdier (2000) in cultural anthropology and economics, andCampbell et al. (1980) and Jennings and Niemi (1968) in political science.3 Consequently,our theory is that the political and economic incentives following emancipation led to thepersistence of racially conservative political attitudes. Importantly, our argument is notthat racism did not exist before the Civil War, but that postbellum incentives exacerbatedthe political differences between former slaveholding and non-slaveholding areas.
Our argument is consistent with a growing literature demonstrating attitudinal per-sistence in other contexts (see Nunn, 2012, for an overview). For example, Nunn andWantchekon (2011) show that Africans whose ancestors were targeted by slave tradershave higher levels of mistrust today than other Africans. Voigtländer and Voth (2012)find that anti-Semitic pogroms during the Black Death predict anti-Semitism and sup-port for the Nazi party in the 20th century. Alesina, Giuliano and Nunn (2013) showthat areas of the world that adopted the plow in their agriculture in the distant pastare areas in which attitudes towards women are less favorable today. Our paper sharesmuch in common with this literature. For example, common to both our paper and thework of Voigtländer and Voth (2012) is the idea that violence can create persistently hos-tile cultural and political attitudes among members and descendants of the perpetratinggroup towards the victim group, and common to our work and that of Alesina, Giulianoand Nunn (2013) is the idea that geographic conditions (plow-suitability in their case andcotton suitability in ours) shaped cultural, political and economic incentives, which inturn drive attitudes.
2The political and economic incentives for racial violence and oppression is likely to have producedracially hostile attitudes among whites through psychological and other channels. For example, whitemight have developed racially hostile attitudes to minimize the “cognitive dissonance” associated withengaging in racially-targeted violence towards blacks. Theories in social psychology, beginning with thework of Festinger (1962), would suggest that engaging in violence could produce hostile attitudes amongmembers of the perpetrating group, towards the victim group, if individuals from the perpetrating groupseek to minimize such dissonance.
3Of course, in our theory, it is socio-political attitudes, rather than partisanship, that are passed downfrom parent to children. This makes our theory consistent with the partisan realignment that took placein the 1960s, given the assumption that partisanship depends at least in some part on attitudes.
5
2.2 Other Hypotheses
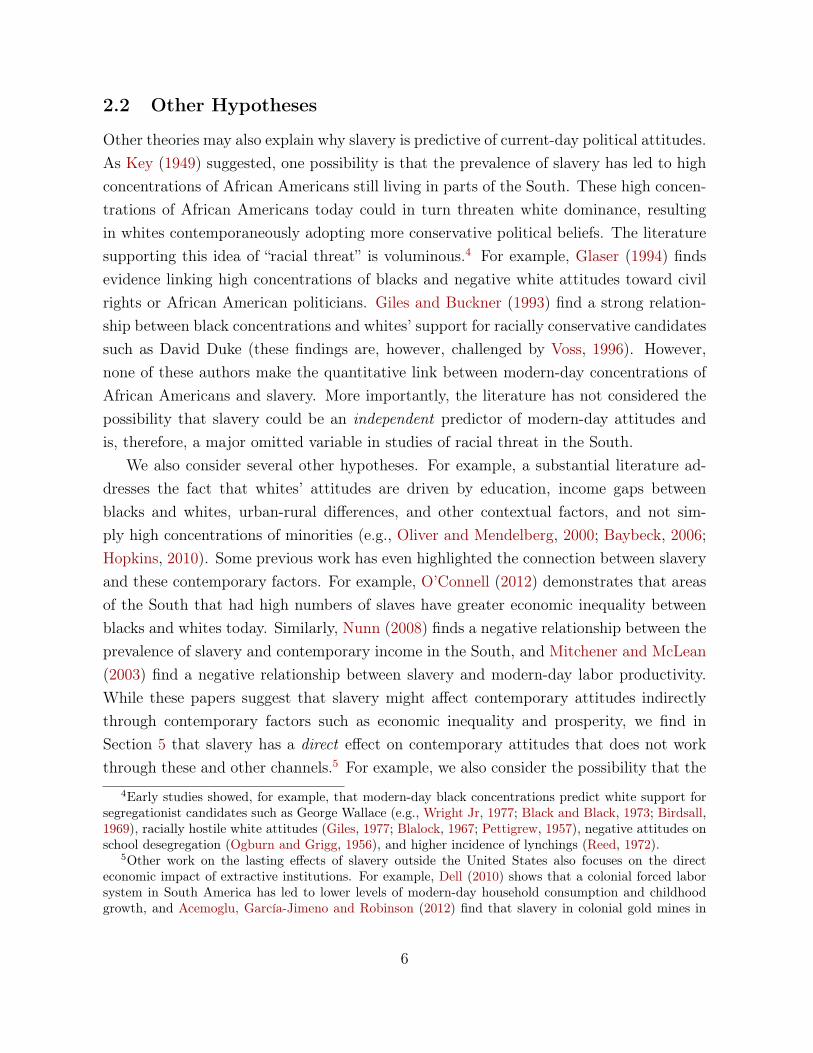
Other theories may also explain why slavery is predictive of current-day political attitudes.As Key (1949) suggested, one possibility is that the prevalence of slavery has led to highconcentrations of African Americans still living in parts of the South. These high concen-trations of African Americans today could in turn threaten white dominance, resultingin whites contemporaneously adopting more conservative political beliefs. The literaturesupporting this idea of “racial threat” is voluminous.4 For example, Glaser (1994) findsevidence linking high concentrations of blacks and negative white attitudes toward civilrights or African American politicians. Giles and Buckner (1993) find a strong relation-ship between black concentrations and whites’ support for racially conservative candidatessuch as David Duke (these findings are, however, challenged by Voss, 1996). However,none of these authors make the quantitative link between modern-day concentrations ofAfrican Americans and slavery. More importantly, the literature has not considered thepossibility that slavery could be an independent predictor of modern-day attitudes andis, therefore, a major omitted variable in studies of racial threat in the South.
We also consider several other hypotheses. For example, a substantial literature ad-dresses the fact that whites’ attitudes are driven by education, income gaps betweenblacks and whites, urban-rural differences, and other contextual factors, and not sim-ply high concentrations of minorities (e.g., Oliver and Mendelberg, 2000; Baybeck, 2006;Hopkins, 2010). Some previous work has even highlighted the connection between slaveryand these contemporary factors. For example, O’Connell (2012) demonstrates that areasof the South that had high numbers of slaves have greater economic inequality betweenblacks and whites today. Similarly, Nunn (2008) finds a negative relationship between theprevalence of slavery and contemporary income in the South, and Mitchener and McLean(2003) find a negative relationship between slavery and modern-day labor productivity.While these papers suggest that slavery might affect contemporary attitudes indirectlythrough contemporary factors such as economic inequality and prosperity, we find inSection 5 that slavery has a direct effect on contemporary attitudes that does not workthrough these and other channels.5 For example, we also consider the possibility that the
4Early studies showed, for example, that modern-day black concentrations predict white support forsegregationist candidates such as George Wallace (e.g., Wright Jr, 1977; Black and Black, 1973; Birdsall,1969), racially hostile white attitudes (Giles, 1977; Blalock, 1967; Pettigrew, 1957), negative attitudes onschool desegregation (Ogburn and Grigg, 1956), and higher incidence of lynchings (Reed, 1972).
5Other work on the lasting effects of slavery outside the United States also focuses on the directeconomic impact of extractive institutions. For example, Dell (2010) shows that a colonial forced laborsystem in South America has led to lower levels of modern-day household consumption and childhoodgrowth, and Acemoglu, García-Jimeno and Robinson (2012) find that slavery in colonial gold mines in
6
link between slavery and contemporary white attitudes could be driven by the fact thatformer slaveholding areas are more rural today, or that former slaveholding areas weremore likely to have incurred greater costs associated with the Civil War, making themmore anti-federal government. We also consider the possibility that geographic sortingmay also explain our results. For example, it could be that more racially conservativepeople have migrated into former slaveholding areas, while racial liberals have left. Fi-nally, we consider the possibility that Southern counties varied according to pre-Civil Warwealth, geography, and social and political beliefs, and that these—and not post-bellumincentives arising out of the abolition of slavery—are the sources of modern-day variationin white attitudes.
We find very limited empirical support for these alternative hypotheses. Therefore,although much of the public opinion literature focuses on contemporary or individual-level factors in explaining political beliefs, our evidence is in favor of the cultural andinstitutional persistence of historical, rather than contemporary, forces. We now turn toexploring these links.
3 Data
Our main explanatory variable and proxy for slavery’s prevalence is the proportion ofeach county’s 1860 population that was enslaved, as measured by the 1860 U.S. Census.Although slave counts were taken before 1860, we use measures from 1860 because theyrepresent the last record of slave counts before chattel slavery was abolished in 1865.Overall, we have in our data approximately four million slaves, constituting 32% of theSouthern population. Since county boundaries have shifted since 1860, we rely on thework of O’Connell (2012), who has mapped the 1860 Census boundaries onto modern-dayboundaries and provides slave proportion by modern county. Figure 1 depicts the data.6
We analyze three county-level outcome measures, all of which come from the Co-operative Congressional Election Study (CCES), a large survey of American adults (An-solabehere, 2010). We pool CCES data from the 2006, 2008, 2009, 2010, and 2011 surveysto create a combined data set of over 157,000 respondents. We subset these data to the
Colombia is associated with modern-day poverty and reduced school enrollment and vaccination rates.While extractive institutions like slavery have been shown to affect modern economic indicators in manycontexts (see Nunn, 2009, for an overview), our focus in this paper is on the persistence of politicalattitudes shaped by slave institutions.
6Admittedly, our measure takes slave institutions as homogeneous when they were hardly so. Slavesin the Black Belt mostly worked on cotton farms, while coastal plantations focused on tobacco and othercrops. These differences could be important, but we do not investigate them here.
7
former Confederate States,7 and to self-identified whites, leaving us with more than 36,000respondents across 1,224 of the 1,317 Southern counties. In addition to the CCES, we alsoinvestigate one individual-level outcome from waves of the American National ElectionSurvey (ANES) from 1984 until 1998, a time period where the ANES used both consis-tent sampling and also included county-level identification for respondents. After againrestricting the sample to Southern whites, we have an ANES sample of 3,049 individualsacross 63 counties in the South. This makes the ANES more restricted in its geographiccoverage, but it contains valuable direct questions on the subjective evaluation of racialgroups.
Our four outcome measures of interest are as follows.
Partisanship. This is the proportion of whites in each county who identify as Democrats.Such partisan identification could reflect not only explicit racial attitudes (including atti-tudes toward Barack Obama in the later surveys), but may also reflect race-related beliefson a variety of policy issues, including redistribution, education, crime, etc. We constructthis measure from a standard seven-point party identification question on the CCES.8
We operationalize the party variable as whether an individual identified at all with theDemocratic party (1 if Democrat; 0 otherwise).
Support for affirmative action. This is the proportion of whites who say that theysupport affirmative action, a policy seen by many as helping minorities, possibly at theexpense of whites. All of the CCES surveys ask respondents whether they support oroppose affirmative action policies, which are described as “programs [that] give preferenceto racial minorities and to women in employment and college admissions in order to correctfor discrimination” (2008 CCES). Although the question wording differs across years, wehave no reason to believe that these slight variations in wording affect our analysis. Weconstruct the outcome variable by using the four-point scale, from “strongly support”to “strongly oppose” affirmative action. The final variable is an indicator representingwhether the respondent demonstrated any level of support for affirmative action (1 forsupport; 0 otherwise).
7This includes Alabama, Arkansas, Florida, Georgia, Kentucky, Louisiana, Mississippi, North Car-olina, South Carolina, Tennessee, Texas, Virginia, and West Virginia. Kentucky was officially neutralduring the Civil War, but contained significant pro-Confederacy factions and was claimed by the Con-federacy.
8We use survey data as opposed to voter registration data because primaries in many Southern statesare open. Coupled with the dramatic changes in partisanship in the South over the last 40 years, thismeans voter registration data are unreliable measures of current partisan leanings. Finally, survey dataallows us to focus on the partisanship of whites voters only.
8
0.0 0.2 0.4 0.6 0.8
Proportion Slave, 1860
Pro
po
rtio
n D
emo
crat
0.0
0.2
0.4
0.6
0.8
1.0
0.0 0.2 0.4 0.6 0.8
Proportion Slave, 1860
Sup
po
rt f
or
Aff
irm
ativ
e A
ctio
n
0.0
0.2
0.4
0.6
0.8
1.0
0.0 0.2 0.4 0.6 0.8
Proportion Slave, 1860
Rac
ial R
esen
tmen
t
1
2
3
4
5
0.0 0.2 0.4 0.6 0.8
0
10
20
30
40
50
60
70
Proportion Slave, 1860
Wh
ite
- B
lack
Th
erm
om
eter
Sco
re
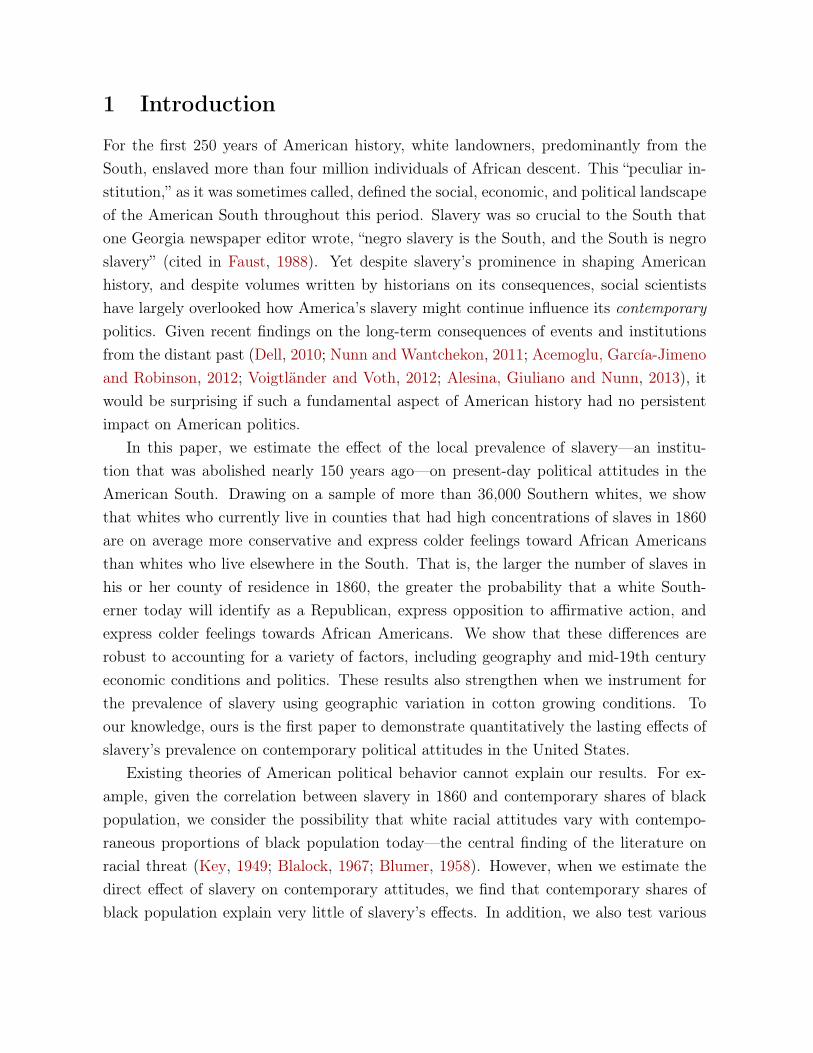
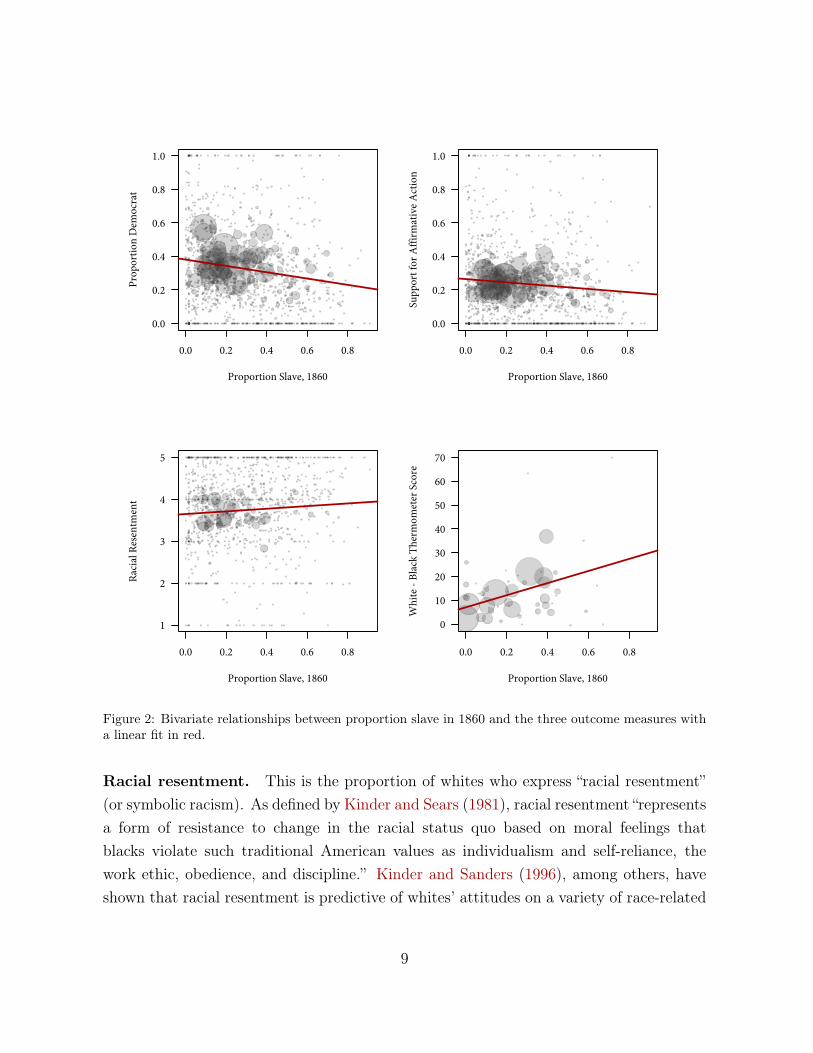
Figure 2: Bivariate relationships between proportion slave in 1860 and the three outcome measures witha linear fit in red.
Racial resentment. This is the proportion of whites who express “racial resentment”(or symbolic racism). As defined by Kinder and Sears (1981), racial resentment “representsa form of resistance to change in the racial status quo based on moral feelings thatblacks violate such traditional American values as individualism and self-reliance, thework ethic, obedience, and discipline.” Kinder and Sanders (1996), among others, haveshown that racial resentment is predictive of whites’ attitudes on a variety of race-related
9
issues, including crime, education, busing, and welfare. We measure racial resentmentusing a CCES question directly related to slavery that asks respondents, on a five-pointscale, whether they agree that “Generations of slavery and discrimination have createdconditions that make it difficult for Blacks to work their way out of the lower class.”Stronger disagreement indicates greater racial resentment.9
White-black thermometer difference. In many years, the ANES contains “feelingthermometer” questions, which ask respondents to evaluate their feelings about variouscandidates, politicians, and groups on a scale from 0 to 100.10 For most years, the ANESasked respondents to rate racial groups, such as whites and blacks. As a measure of rela-tive racial hostility, we take the difference between the respondents’ feeling thermometerratings toward whites and their feeling thermometer ratings towards blacks. Thus, a pos-itive difference would indicate that respondents have warmer feelings towards whites asopposed to blacks. Only using black thermometer scores yields similar results, but we usethe difference in case slavery has an overall effect on racial group thermometer ratings.
Appendix Table A.1 reports summary statistics for these and other data that we usein the paper. Figure 2 depicts the bivariate relationships between proportion slave in1860 and the four outcome measures from the CCES and ANES. It shows clear negativerelationships between slave prevalence and proportion Democrat and support for affir-mative action, and clear positive relationships with racial resentment and thermometerscore differences. These relationships are suggestive; we now turn to estimating the causaleffects of slave prevalence on these outcome measures.
4 Slavery’s Effects on Contemporary Outcomes
We begin by reporting in Table 1 the baseline estimates of slavery’s effect on the threeCCES outcomes conditional on various controls. All regressions in this table, and through-
9This question only appeared on the 2010 CCES. Using this measure in tandem with other racialresentment-type questions yields similar results.
10As an example, the 1984 ANES gave respondents the following instructions:
I’ll read the name of a person and I’d like you to rate the person using the feeling ther-mometer. Ratings between 50 degrees and 100 degrees mean that you feel favorable andwarm toward the person. Ratings between 0 degrees and 50 degrees mean that you don’tfeel favorable toward the person and that you don’t care too much for that person. Youwould rate the person at the 50 degree mark if you don’t feel particularly warm or coldtoward that person.
10
Prop. Democrat Affirm. Action Racial Resent.
(1) (2) (3) (4)
Prop. Slave, 1860 −0.187∗∗ −0.131∗∗ −0.137∗∗ 0.531∗∗(0.024) (0.046) (0.039) (0.200)
State Fixed Effects X X X1860 Covariates X X X
N 1,214 769 769 663R2 0.046 0.178 0.125 0.115∗p < .05; ∗∗p < .01
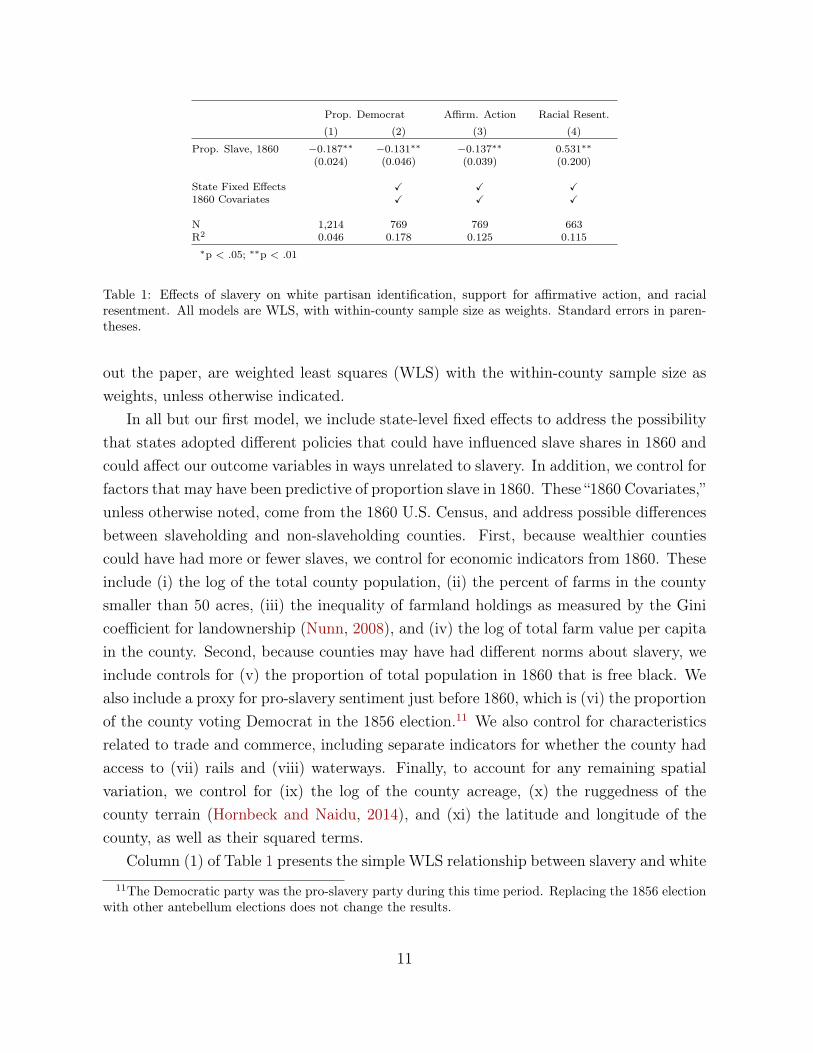
Table 1: Effects of slavery on white partisan identification, support for affirmative action, and racialresentment. All models are WLS, with within-county sample size as weights. Standard errors in paren-theses.
out the paper, are weighted least squares (WLS) with the within-county sample size asweights, unless otherwise indicated.
In all but our first model, we include state-level fixed effects to address the possibilitythat states adopted different policies that could have influenced slave shares in 1860 andcould affect our outcome variables in ways unrelated to slavery. In addition, we control forfactors that may have been predictive of proportion slave in 1860. These “1860 Covariates,”unless otherwise noted, come from the 1860 U.S. Census, and address possible differencesbetween slaveholding and non-slaveholding counties. First, because wealthier countiescould have had more or fewer slaves, we control for economic indicators from 1860. Theseinclude (i) the log of the total county population, (ii) the percent of farms in the countysmaller than 50 acres, (iii) the inequality of farmland holdings as measured by the Ginicoefficient for landownership (Nunn, 2008), and (iv) the log of total farm value per capitain the county. Second, because counties may have had different norms about slavery, weinclude controls for (v) the proportion of total population in 1860 that is free black. Wealso include a proxy for pro-slavery sentiment just before 1860, which is (vi) the proportionof the county voting Democrat in the 1856 election.11 We also control for characteristicsrelated to trade and commerce, including separate indicators for whether the county hadaccess to (vii) rails and (viii) waterways. Finally, to account for any remaining spatialvariation, we control for (ix) the log of the county acreage, (x) the ruggedness of thecounty terrain (Hornbeck and Naidu, 2014), and (xi) the latitude and longitude of thecounty, as well as their squared terms.
Column (1) of Table 1 presents the simple WLS relationship between slavery and white11The Democratic party was the pro-slavery party during this time period. Replacing the 1856 election
with other antebellum elections does not change the results.
11
partisan identification. Columns (2) - (4) further include state-level fixed effects as well asthe 1860 covariates described above. The conditional effects of slavery are meaningful andsignificant for all three outcome variables.12 To illustrate, a 20 percentage-point increasein the slave proportion (roughly a one standard-deviation change) is associated with a 2.6percentage-point decrease in the share of whites who currently identify as Democrats, a2.7 percentage-point decrease among those who currently support affirmative action, anda 0.11 point increase on the racial resentment scale. Each of these represent approximatelya 0.12 standard deviation change in the outcomes. Overall, these results are clear: slaveprevalence in 1860 has an effect on the political attitudes of Southern whites today.
In the baseline estimates of Table 1, we analyze our outcome data at the county levelbecause our explanatory variable (proportion slave in 1860) is a county-level measure.However, we show in Appendix Table A.2 that models run at the respondent level withadditional respondent-level controls commonly used in the public opinion literature, andstandard errors clustered at the county level, point to the same conclusions. While theseresults may be contaminated by post-treatment bias, they are consistent with the county-level analyses. We also show in Appendix Table A.3) that using a different measure ofslavery, the number of slaves per slaveholder in a county in 1860, generates very similarresults.
4.1 Instrumental Variables Analysis
There are two potential concerns with the above analysis. First, the 1860 slave data arehistorical and may be measured with error. Second, we may have inadequately controlledfor all of the pre-treatment covariates that simultaneously affect slave proportion in 1860and political attitudes today, which would result in omitted variable bias. To allay theseconcerns, we therefore present results from an alternative specification that instrumentsfor slave proportion in 1860 with county-level measures of the environmental suitabilityfor growing cotton. We constructed these measures using data from the Food and Agri-culture Organization (FAO).13 We exclude Florida from this particular analysis due to anextremely weak first-stage relationship in that state. (The weaknesses in the first-stage
12Results from a permutation-based Mantel test on the residuals of these models gives no indicationof spatial autocorrelation after conditioning on our geographic covariates (Barrios et al., 2012). Theone-sided p-values for positive spatial autocorrelation in models (2), (3), and (4) are 0.91, 0.58, and 0.49,respectively.
13These measures represent the maximum potential cotton yield based on soil, climate, and growingconditions. The estimates are based on climate averages from 1961 to 1990 and a “intermediate” level ofinputs, which refers to the effort required to extract the resource. We omit suitability for other crops,such as tobacco, because they have no relationship with slavery conditional on cotton suitability.
12
Prop Slavery Prop Democrat Affirm. Action Racial Resentment
(1) (2) (3) (4)
Cotton Suitability 0.289∗∗(0.036)
Prop. Slave, 1860 −0.537∗∗ −0.221† 1.657∗(0.172) (0.133) (0.829)
State Fixed Effects X X X XGeographic Controls X X X XFlorida Excluded X X X X
N 1,128 1,084 1,084 905F Statistic 74.531∗∗∗
(df = 19; 1108)
Model 2SLS 2SLS 2SLS 2SLSFirst Stage Second Stage Second Stage Second Stage
†p < .1; ∗p < .05; ∗∗p < .01
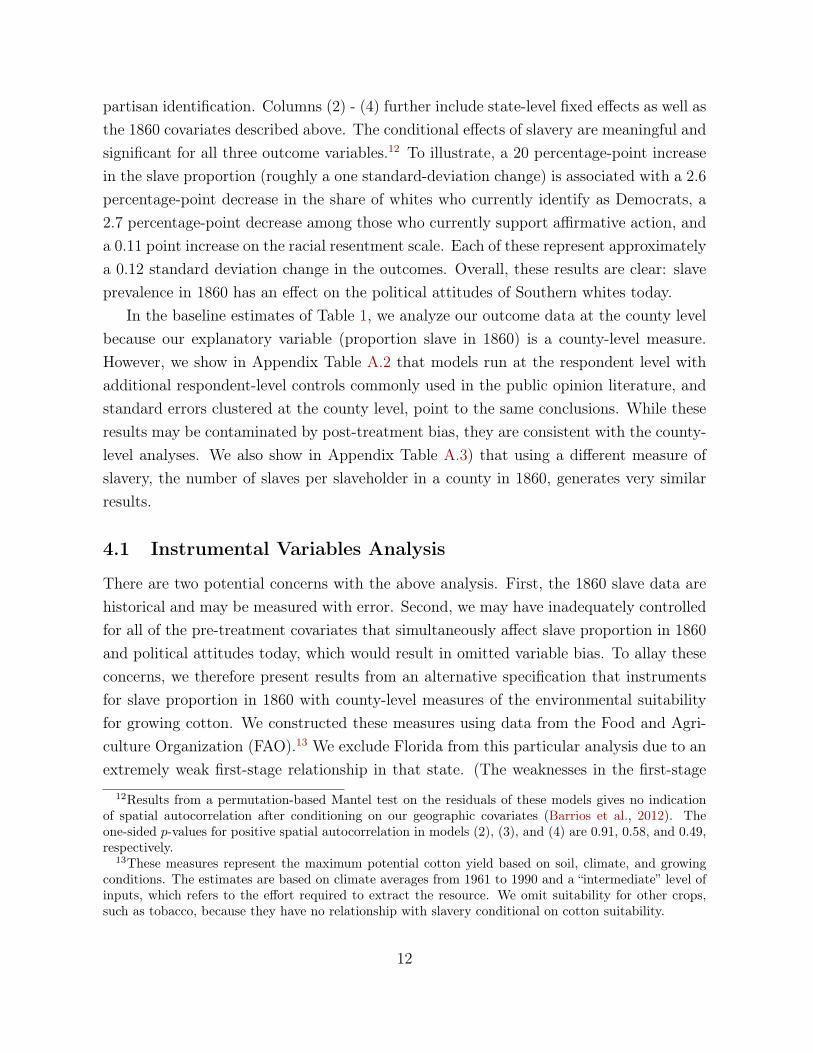
Table 2: Instrumental variables estimate of the effect of slavery on white partisan identification, views onaffirmative action, and racial resentment, using suitability for growing cotton as the instrument. Column(1) is the first stage. All models exclude Florida, for which the first-stage is extremely weak. Models thatinclude Florida are presented in Appendix Table A.4.
relationship is shown in column (1) of Appendix Table A.4.) Indeed, large swaths ofthe interior of Florida are suitable for growing cotton, but saw relatively little develop-ment due in part to conflict with the Seminole. Other parts of the state also suitable forthe growth of cotton were not settled until later, even as late as the early 20th century.We note that the results are qualitatively the same when we include Florida (AppendixTable A.4, columns (2) - (4)), but there is a striking increase in the uncertainty of theestimates.
Table 2 presents our instrumental variable (IV) estimates of the effects of proportionslave on the three outcome measures using a two-stage least squares (2SLS) model withstate-fixed effects, log of the county size, ruggedness of the terrain, latitude and longitude,and their squared terms included as controls in both stages. Column (1) presents thestrong first-stage relationship between cotton suitability and proportion slave. Columns(2) - (4) present the second stage estimates of the effect of proportion slave on the outcomemeasures. The results show second-stage estimates that are stronger than our baselineestimates, reported in Table 1.
For our IV approach to serve as a plausible identification strategy, cotton suitabilitymust have an effect on contemporary attitudes exclusively through slavery, an assumptionthat may not be satisfied. For example, cotton suitability could determine how rurala county is today, which in turn could affect political attitudes. While the exclusionrestriction is an untestable assumption, we assess its plausibility using a falsification
13
Prop. Democrat Affirm. Action Racial Resentment
(1) (2) (3) (4) (5) (6)
South North South North South North
FAO Cotton Suitability −0.136∗∗ 0.022 −0.056† 0.081∗ 0.376∗ −0.0003(0.040) (0.038) (0.033) (0.036) (0.179) (0.164)
State Fixed Effects X X X X X X1860 Covariates X X X X X X
N 1,084 474 1,084 474 905 395R2 0.154 0.293 0.084 0.114 0.058 0.208†p < .1; ∗p < .05; ∗∗p < .01
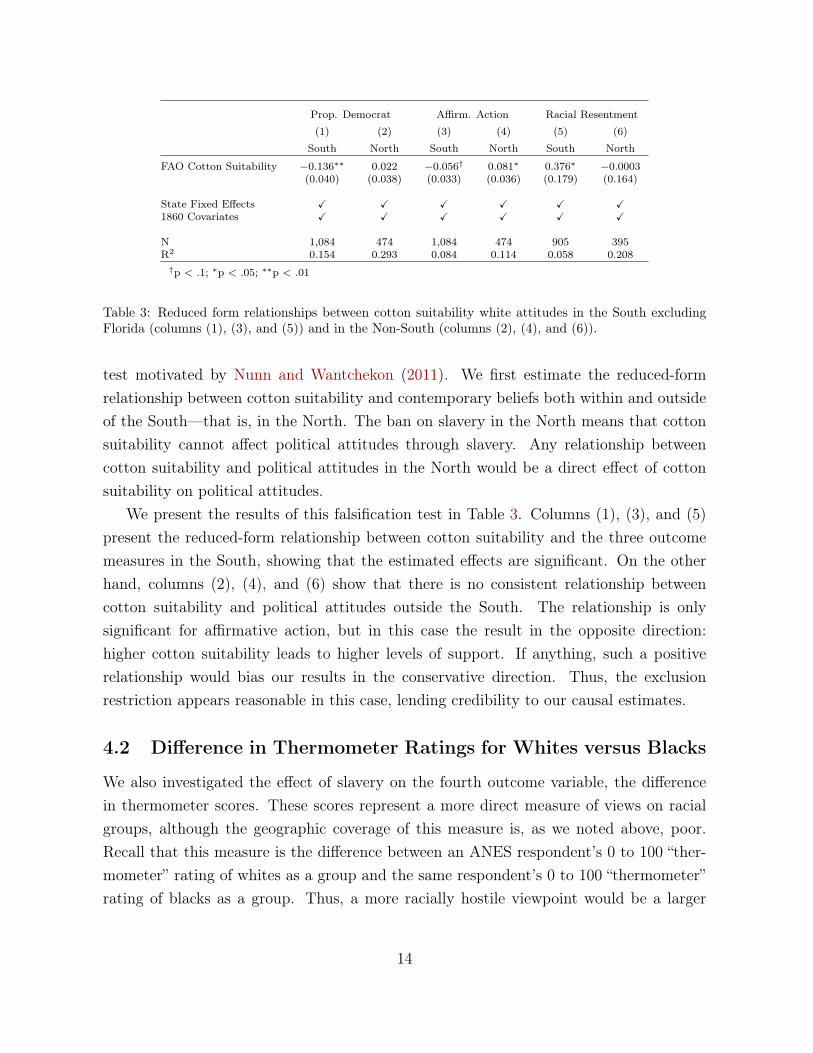
Table 3: Reduced form relationships between cotton suitability white attitudes in the South excludingFlorida (columns (1), (3), and (5)) and in the Non-South (columns (2), (4), and (6)).
test motivated by Nunn and Wantchekon (2011). We first estimate the reduced-formrelationship between cotton suitability and contemporary beliefs both within and outsideof the South—that is, in the North. The ban on slavery in the North means that cottonsuitability cannot affect political attitudes through slavery. Any relationship betweencotton suitability and political attitudes in the North would be a direct effect of cottonsuitability on political attitudes.
We present the results of this falsification test in Table 3. Columns (1), (3), and (5)present the reduced-form relationship between cotton suitability and the three outcomemeasures in the South, showing that the estimated effects are significant. On the otherhand, columns (2), (4), and (6) show that there is no consistent relationship betweencotton suitability and political attitudes outside the South. The relationship is onlysignificant for affirmative action, but in this case the result in the opposite direction:higher cotton suitability leads to higher levels of support. If anything, such a positiverelationship would bias our results in the conservative direction. Thus, the exclusionrestriction appears reasonable in this case, lending credibility to our causal estimates.
4.2 Difference in Thermometer Ratings for Whites versus Blacks
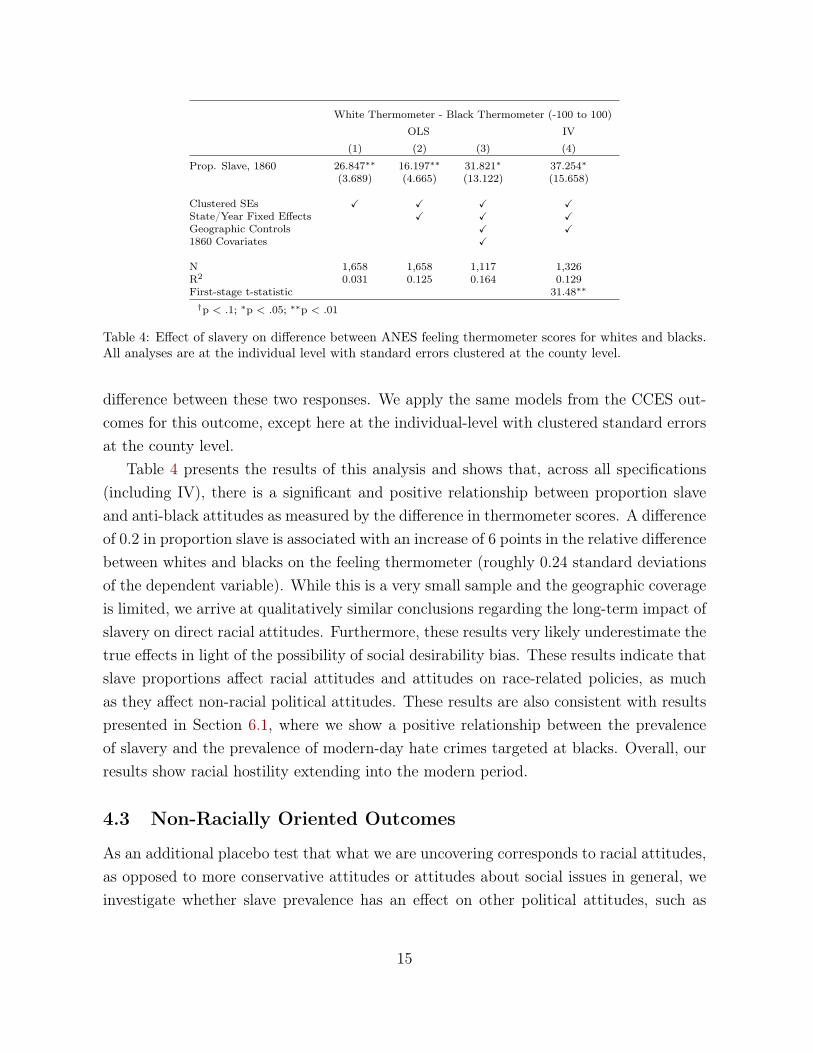
We also investigated the effect of slavery on the fourth outcome variable, the differencein thermometer scores. These scores represent a more direct measure of views on racialgroups, although the geographic coverage of this measure is, as we noted above, poor.Recall that this measure is the difference between an ANES respondent’s 0 to 100 “ther-mometer” rating of whites as a group and the same respondent’s 0 to 100 “thermometer”rating of blacks as a group. Thus, a more racially hostile viewpoint would be a larger
14
White Thermometer - Black Thermometer (-100 to 100)
OLS IV
(1) (2) (3) (4)
Prop. Slave, 1860 26.847∗∗ 16.197∗∗ 31.821∗ 37.254∗(3.689) (4.665) (13.122) (15.658)
Clustered SEs X X X XState/Year Fixed Effects X X XGeographic Controls X X1860 Covariates X
N 1,658 1,658 1,117 1,326R2 0.031 0.125 0.164 0.129First-stage t-statistic 31.48∗∗
†p < .1; ∗p < .05; ∗∗p < .01
Table 4: Effect of slavery on difference between ANES feeling thermometer scores for whites and blacks.All analyses are at the individual level with standard errors clustered at the county level.
difference between these two responses. We apply the same models from the CCES out-comes for this outcome, except here at the individual-level with clustered standard errorsat the county level.
Table 4 presents the results of this analysis and shows that, across all specifications(including IV), there is a significant and positive relationship between proportion slaveand anti-black attitudes as measured by the difference in thermometer scores. A differenceof 0.2 in proportion slave is associated with an increase of 6 points in the relative differencebetween whites and blacks on the feeling thermometer (roughly 0.24 standard deviationsof the dependent variable). While this is a very small sample and the geographic coverageis limited, we arrive at qualitatively similar conclusions regarding the long-term impact ofslavery on direct racial attitudes. Furthermore, these results very likely underestimate thetrue effects in light of the possibility of social desirability bias. These results indicate thatslave proportions affect racial attitudes and attitudes on race-related policies, as muchas they affect non-racial political attitudes. These results are also consistent with resultspresented in Section 6.1, where we show a positive relationship between the prevalenceof slavery and the prevalence of modern-day hate crimes targeted at blacks. Overall, ourresults show racial hostility extending into the modern period.
4.3 Non-Racially Oriented Outcomes
As an additional placebo test that what we are uncovering corresponds to racial attitudes,as opposed to more conservative attitudes or attitudes about social issues in general, weinvestigate whether slave prevalence has an effect on other political attitudes, such as
15
views on fiscal issues and social policy. Appendix Table A.5 shows that slave prevalencehas a positive effect on fiscal conservatism across specifications and no consistent effect onattitudes concerning the environment, gay marriage, or abortion. Respondents in high-slave counties are more likely to support spending cuts to balance the budget as opposedto tax increases. While there is some evidence for a relationship between proportion slaveand views on gay marriage and abortion in the OLS models, these results are not robustto our IV identification strategy, unlike all of the results for racially oriented attitudes.This suggests that the effect of slavery concentrations on contemporary political attitudesis not one rooted in general conservatism; rather, it appears to be limited to views onrace and other issues that may be determined in some part by racial attitudes, such asgovernment spending (see, e.g., Lee and Roemer, 2006).
4.4 Matching Adjacent Counties
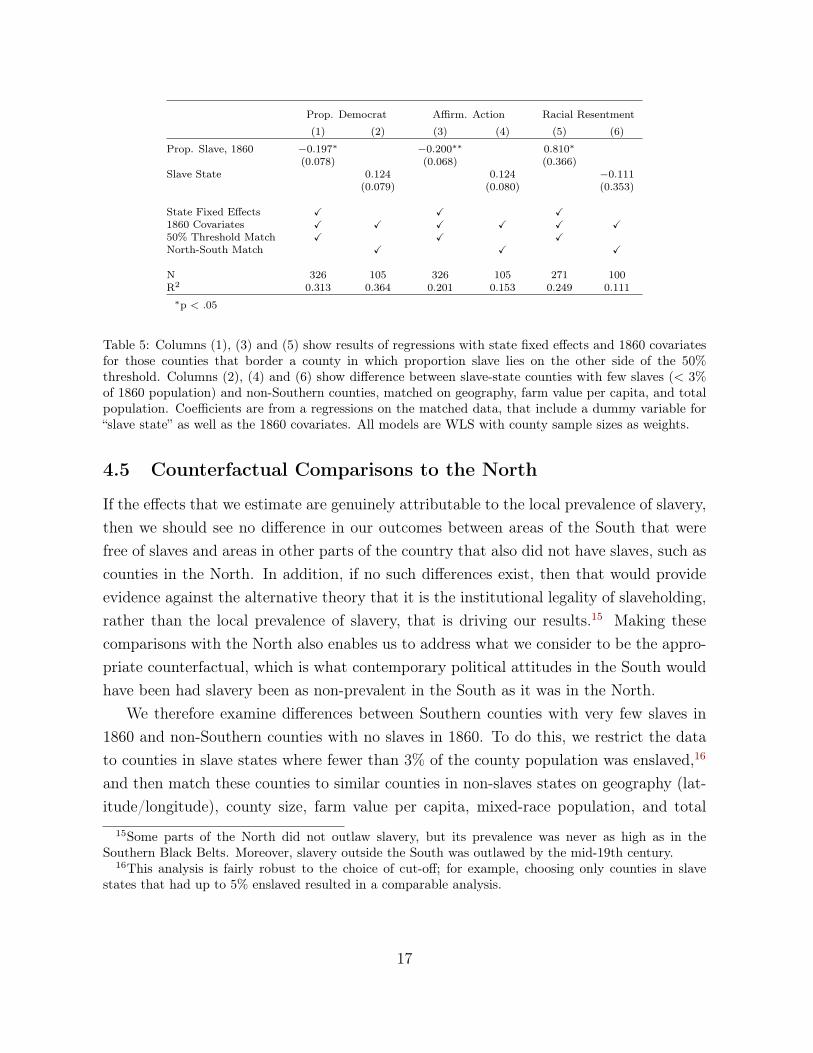
Although our analyses so far control for a number of historical and geographic covariatesit remains possible that our results are driven by differences between slaveholding andnon-slaveholding areas not fully captured by these covariates. For instance, it could bethat the “upland” regions of northern Alabama and Georgia differed systematically fromthe Black Belt (as suggested by Kousser, 2010). To test the robustness of our resultsto these potential confounders, we restrict our sample to the set of neighboring countiesthat are on either side of a cutoff of 50% slave in 1860 (Figure A.1 of Appendix B). Thisenables us to compare the effects of slavery across counties that are geographically andperhaps also politically, economically, and culturally similar (as Banerjee and Iyer, 2005,do with Indian districts). It also drops certain former high slave counties that are inregions where all of the neighbors are also high slave areas—for example, the MississippiDelta (compare Figure A.1 with Figure 1). Columns (1), (3), and (5) of Table 5 show thatthe results for all three of our CCES outcomes are robust to restricting our analysis toonly these neighboring counties, even though this removes more than half of the countiesin our original sample. Thus, even within fairly geographically concentrated areas, thereare strong, statistically significant differences between counties with higher and lower pastconcentrations of slaves.14
14The results are substantively similar when we use different cutoffs below and above 50% (AppendixTable A.6). The conclusions are also the same when, rather than using the 50% cutoff, we take in oursample only those counties that border a county in which proportion slaves differs by more than 20percentage points.
16
Prop. Democrat Affirm. Action Racial Resentment
(1) (2) (3) (4) (5) (6)
Prop. Slave, 1860 −0.197∗ −0.200∗∗ 0.810∗(0.078) (0.068) (0.366)
Slave State 0.124 0.124 −0.111(0.079) (0.080) (0.353)
State Fixed Effects X X X1860 Covariates X X X X X X50% Threshold Match X X XNorth-South Match X X X
N 326 105 326 105 271 100R2 0.313 0.364 0.201 0.153 0.249 0.111∗p < .05
Table 5: Columns (1), (3) and (5) show results of regressions with state fixed effects and 1860 covariatesfor those counties that border a county in which proportion slave lies on the other side of the 50%threshold. Columns (2), (4) and (6) show difference between slave-state counties with few slaves (< 3%of 1860 population) and non-Southern counties, matched on geography, farm value per capita, and totalpopulation. Coefficients are from a regressions on the matched data, that include a dummy variable for“slave state” as well as the 1860 covariates. All models are WLS with county sample sizes as weights.
4.5 Counterfactual Comparisons to the North
If the effects that we estimate are genuinely attributable to the local prevalence of slavery,then we should see no difference in our outcomes between areas of the South that werefree of slaves and areas in other parts of the country that also did not have slaves, such ascounties in the North. In addition, if no such differences exist, then that would provideevidence against the alternative theory that it is the institutional legality of slaveholding,rather than the local prevalence of slavery, that is driving our results.15 Making thesecomparisons with the North also enables us to address what we consider to be the appro-priate counterfactual, which is what contemporary political attitudes in the South wouldhave been had slavery been as non-prevalent in the South as it was in the North.
We therefore examine differences between Southern counties with very few slaves in1860 and non-Southern counties with no slaves in 1860. To do this, we restrict the datato counties in slave states where fewer than 3% of the county population was enslaved,16
and then match these counties to similar counties in non-slaves states on geography (lat-itude/longitude), county size, farm value per capita, mixed-race population, and total
15Some parts of the North did not outlaw slavery, but its prevalence was never as high as in theSouthern Black Belts. Moreover, slavery outside the South was outlawed by the mid-19th century.
16This analysis is fairly robust to the choice of cut-off; for example, choosing only counties in slavestates that had up to 5% enslaved resulted in a comparable analysis.
17
county population.17 Thus, we compare counties from Southern states with very fewslaves to counties where slavery was against the law. We regress each of our three CCESoutcome variables on the 1860 covariates as well as on a dummy variable for the countybeing in a slave state. Columns (2), (4) and (6) of Table 5 show these results and con-firm that there exists no difference between the Southern counties and the non-Southerncounties beyond the effect of local slave prevalence. This provides evidence that the localprevalence of slavery, rather than state laws permitting the ownership of slaves, drivesour results.
5 Alternative Explanations for Slavery’s Effect
We now examine several alternative theories that could explain our findings. We considersix possible explanations: racial threat, urban-rural differences, Civil War destruction, an-tebellum racism, geographic sorting, and contemporary income inequality between blacksand whites, which could lead to statistical discrimination. We examine two other ex-planations – Civil War destruction and rural/urban differences – in the SupplementalInformation. We find limited support for these factors. We therefore present evidence inSection 6 for what we believe is the more likely explanation concerning post-Civil Warpolitical and economic incentives.
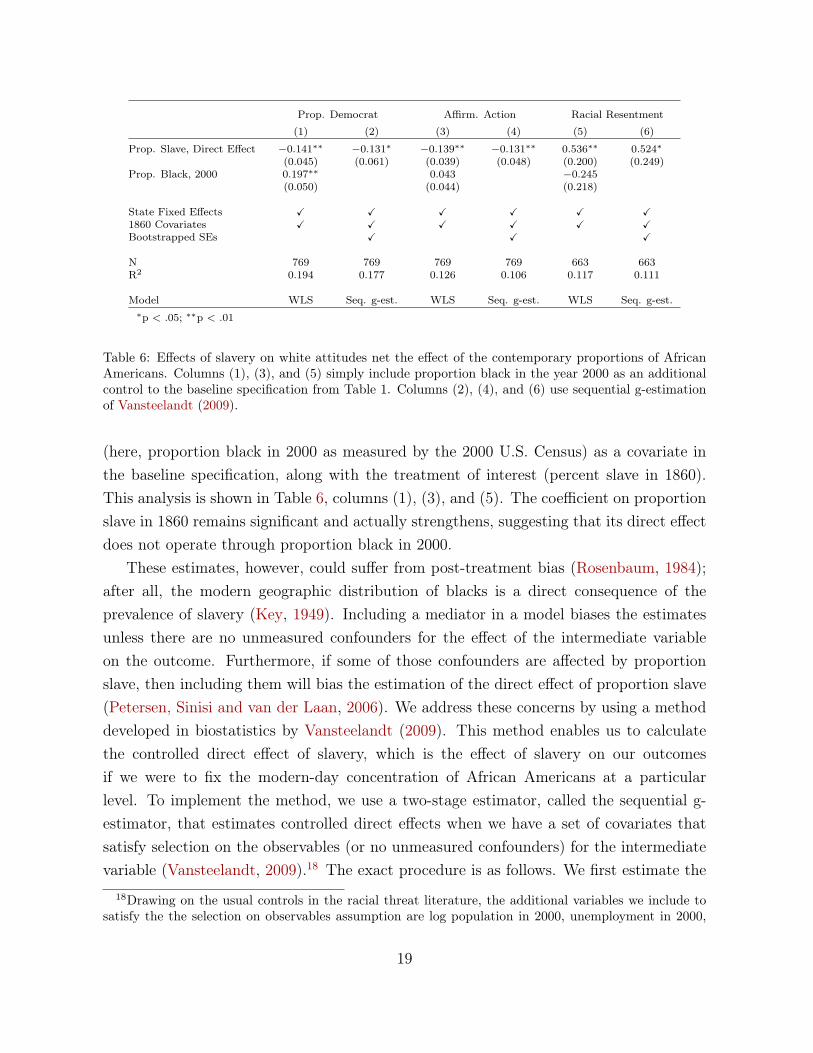
5.1 Racial Threat (Contemporary Black Concentrations)
A seemingly plausible explanation for our results is that slave prevalence affects contem-porary political attitudes through its effect on contemporary black concentrations. Thelocal prevalence of slavery has produced high concentrations of blacks in the modern-dayBlack Belt, which, according to the theory of racial threat, would cause whites’ views tobecome more racially hostile. This is an observation that was made by Key (1949) andthen developed by the expansive literature on racial threat (e.g., Orey et al., 2011; Gilesand Buckner, 1993). At first glance, the racial threat mechanism does provide a possiblecompeting explanation: the correlation of percent slave in 1860 with percent black in 2000is 0.77.
To address this issue, we check how much of our baseline results can be explained bycontemporary black concentrations. We do so in two ways. First, we include the mediator
17We use coarsened exact matching (CEM) on these variables, employing the default cut-points (Iacus,King and Porro, 2012, 2009). To avoid biasing our results, we drop Maryland and Missouri from theNorthern sample since both had non-trivial slavery in 1860.Replicating this analysis with propensityscore matching or genetic matching does not substantively change the results (available upon request).
18
Prop. Democrat Affirm. Action Racial Resentment
(1) (2) (3) (4) (5) (6)
Prop. Slave, Direct Effect −0.141∗∗ −0.131∗ −0.139∗∗ −0.131∗∗ 0.536∗∗ 0.524∗(0.045) (0.061) (0.039) (0.048) (0.200) (0.249)
Prop. Black, 2000 0.197∗∗ 0.043 −0.245(0.050) (0.044) (0.218)
State Fixed Effects X X X X X X1860 Covariates X X X X X XBootstrapped SEs X X X
N 769 769 769 769 663 663R2 0.194 0.177 0.126 0.106 0.117 0.111
Model WLS Seq. g-est. WLS Seq. g-est. WLS Seq. g-est.∗p < .05; ∗∗p < .01
Table 6: Effects of slavery on white attitudes net the effect of the contemporary proportions of AfricanAmericans. Columns (1), (3), and (5) simply include proportion black in the year 2000 as an additionalcontrol to the baseline specification from Table 1. Columns (2), (4), and (6) use sequential g-estimationof Vansteelandt (2009).
(here, proportion black in 2000 as measured by the 2000 U.S. Census) as a covariate inthe baseline specification, along with the treatment of interest (percent slave in 1860).This analysis is shown in Table 6, columns (1), (3), and (5). The coefficient on proportionslave in 1860 remains significant and actually strengthens, suggesting that its direct effectdoes not operate through proportion black in 2000.
These estimates, however, could suffer from post-treatment bias (Rosenbaum, 1984);after all, the modern geographic distribution of blacks is a direct consequence of theprevalence of slavery (Key, 1949). Including a mediator in a model biases the estimatesunless there are no unmeasured confounders for the effect of the intermediate variableon the outcome. Furthermore, if some of those confounders are affected by proportionslave, then including them will bias the estimation of the direct effect of proportion slave(Petersen, Sinisi and van der Laan, 2006). We address these concerns by using a methoddeveloped in biostatistics by Vansteelandt (2009). This method enables us to calculatethe controlled direct effect of slavery, which is the effect of slavery on our outcomesif we were to fix the modern-day concentration of African Americans at a particularlevel. To implement the method, we use a two-stage estimator, called the sequential g-estimator, that estimates controlled direct effects when we have a set of covariates thatsatisfy selection on the observables (or no unmeasured confounders) for the intermediatevariable (Vansteelandt, 2009).18 The exact procedure is as follows. We first estimate the
18Drawing on the usual controls in the racial threat literature, the additional variables we include tosatisfy the the selection on observables assumption are log population in 2000, unemployment in 2000,
19
effect of contemporary black concentration on white views today, controlling for all ofour covariates including the additional covariates in footnote 18. We then transform thedependent variable by subtracting this effect. Finally, we estimate the effect of proportionslave on this transformed variable, which gives us the controlled direct effect of proportionslave in 1860.
Estimates from this analysis are reported in columns (2), (4), and (6) of Table 6.19
Compared to the baseline estimates of Table 1 and the potentially biased estimates incolumns (1), (3), and (5), these results demonstrate that contemporary percent black haslittle influence on slavery’s effect on any of the outcomes. Indeed, the direct effects ofslave proportion are similar to those in Table 1 and are still highly significant. Moreover,once we account for slavery in 1860, contemporary black concentrations appear to havethe opposite effect that racial threat theory would predict for Southern white attitudes.Finally, with the full controls from the first stage of the sequential g-estimator, the effectof proportion black today is no longer significant (Appendix Table A.7). Thus, we see noevidence that slavery’s effects operate via contemporary black concentrations.
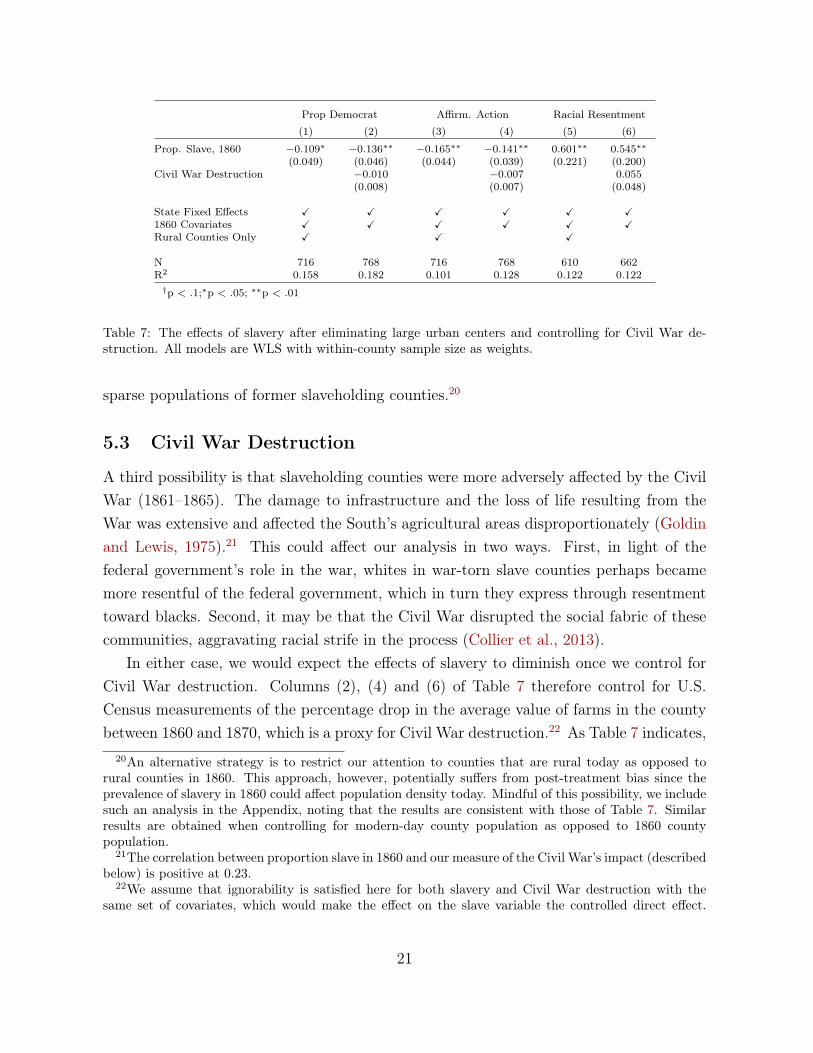
5.2 Rural versus Urban Counties
Another plausible explanation for our findings is that large slaveholding counties tend tobe more rural today than counties that smaller slave proportions, maybe because they hadplantations and other large farms. Our results might therefore reflect the simple fact thatrural counties tend to be more conservative than urban counties (Frank, 2004; Bartels,2006; Ansolabehere, Rodden and Snyder, 2006).
To examine this possibility, we remove from our dataset all counties with 1860 popu-lations greater than 14,000, which is the fourth quartile for all Southern counties in 1860.Thus, we remove one quarter of counties that have been historically the most urban (forexample, Fulton County, GA, and Shelby County, TN—which are today among the mosturban in the South). Removing these counties hardly changes the estimated effects ofslavery, as indicated in columns (1), (3) and (5) of Table 7. In fact, the magnitudes ofthe effects of slavery on each of the three outcome measures actually increase, and theeffects remain significant. Our results are therefore unlikely to be attributable to the
percent of individuals with high school degrees in 1990, and log median income in 2000. These resultsassume no interaction between proportion slave and contemporary proportion black, but weakening thisassumption does not change the findings.
19To account for the added uncertainty of the two-step nature of sequential g-estimation, we reportbootstrapped standard errors.
20
Prop Democrat Affirm. Action Racial Resentment
(1) (2) (3) (4) (5) (6)
Prop. Slave, 1860 −0.109∗ −0.136∗∗ −0.165∗∗ −0.141∗∗ 0.601∗∗ 0.545∗∗(0.049) (0.046) (0.044) (0.039) (0.221) (0.200)
Civil War Destruction −0.010 −0.007 0.055(0.008) (0.007) (0.048)
State Fixed Effects X X X X X X1860 Covariates X X X X X XRural Counties Only X X X
N 716 768 716 768 610 662R2 0.158 0.182 0.101 0.128 0.122 0.122†p < .1;∗p < .05; ∗∗p < .01
Table 7: The effects of slavery after eliminating large urban centers and controlling for Civil War de-struction. All models are WLS with within-county sample size as weights.
sparse populations of former slaveholding counties.20
5.3 Civil War Destruction
A third possibility is that slaveholding counties were more adversely affected by the CivilWar (1861–1865). The damage to infrastructure and the loss of life resulting from theWar was extensive and affected the South’s agricultural areas disproportionately (Goldinand Lewis, 1975).21 This could affect our analysis in two ways. First, in light of thefederal government’s role in the war, whites in war-torn slave counties perhaps becamemore resentful of the federal government, which in turn they express through resentmenttoward blacks. Second, it may be that the Civil War disrupted the social fabric of thesecommunities, aggravating racial strife in the process (Collier et al., 2013).
In either case, we would expect the effects of slavery to diminish once we control forCivil War destruction. Columns (2), (4) and (6) of Table 7 therefore control for U.S.Census measurements of the percentage drop in the average value of farms in the countybetween 1860 and 1870, which is a proxy for Civil War destruction.22 As Table 7 indicates,
20An alternative strategy is to restrict our attention to counties that are rural today as opposed torural counties in 1860. This approach, however, potentially suffers from post-treatment bias since theprevalence of slavery in 1860 could affect population density today. Mindful of this possibility, we includesuch an analysis in the Appendix, noting that the results are consistent with those of Table 7. Similarresults are obtained when controlling for modern-day county population as opposed to 1860 countypopulation.
21The correlation between proportion slave in 1860 and our measure of the Civil War’s impact (describedbelow) is positive at 0.23.
22We assume that ignorability is satisfied here for both slavery and Civil War destruction with thesame set of covariates, which would make the effect on the slave variable the controlled direct effect.
21
slavery’s effects on our three outcome measures are hardly affected by the inclusion of thisvariable. Furthermore, in results not presented here, we find that even when we includean interaction term between proportion slave and Civil War destruction, the interactionis not significant.
5.4 Antebellum Social and Political Attitudes
We argued that the demise of slavery intensified the political differences between for-mer slaveholding and non-slaveholding counties, but it could be that racial hostility wassignificantly greater in former slaveholding counties than in other counties even in theantebellum period. Jordan (1968), for example, argues that the origins of racial attitudesactually predate 1860 and may even go as far back as the start of the African slave tradein the 16th century. It is possible that slavery began to affect whites’ feelings towardsblacks beginning in the antebellum period.23
We consider two possibilities. The first is that racist attitudes motivated some Euro-peans to seek out Africans for the slave trade, and become slaveowners. That is, racismpredated or developed jointly with the origins of race-based slavery. Slave prevalencein the cotton-suitable areas of the American South would therefore be indicative of pre-existing racially hostile attitudes. The second possibility is that the act of having slavescaused whites to become more racist, and that this happened well before 1860. This couldbe due to the set of complementary social practices and cultural norms needed to justifyslavery as an institution. For our purposes, either of these two channels could explain ourfindings if such antebellum attitudes were passed down through successive generations.However, as a first piece of evidence against this alternative hypothesis, we note that ourresults are robust to the inclusion of social and political covariates from 1860 (discussedabove). In results not presented, our effects are also robust to controlling for the presenceof freed blacks in the county, which we consider to be a strong indicator of antebellumracial attitudes. In addition, as we discuss in Section 6, the effects of slavery on anotheroutcome, Presidential vote share, appear only after the conclusion of the Civil War—evidence that racial attitudes became politically salient (and started affecting politicalattitudes and behavior) only in the postbellum period.
We believe that this is a more plausible assumption than that made with respect to contemporary blackpopulation. The reason is because conditioning on 1860s covariates is likely to result in an accurateestimate of which counties suffered more destruction during the Civil War, but would probably not besufficient to separately identify the effect of black concentrations in the 20th century.
23We note an extensive socio-historical literature on this topic (e.g., Foner, 2011; Jordan, 1968; Du Bois,[1935] 1999). We do not engage the nuances of this longstanding scholarly discussion; rather, our purposeis to highlight that any of these antebellum theories could be explaining our results.
22
Prop Democrat Affirm. Action Racial Resentment
(1) (2) (3) (4) (5) (6)
Prop. Slave, 1860 −0.163∗ −0.175∗∗ −0.104† −0.150∗ 0.749∗∗ 0.688∗∗(0.067) (0.052) (0.060) (0.045) (0.267) (0.230)
Prop Slave, 1830 0.041 −0.083 0.032(0.059) (0.053) (0.234)
Prop Slaveholder, 1860 0.991† 0.280 −3.596(0.591) (0.509) (2.586)
State Fixed Effects X X X X X X1860 Covariates X X X X X X
N 456 769 456 769 398 663R2 0.236 0.181 0.159 0.125 0.191 0.118†p < .1; ∗p < .05; ∗∗p < .01
Table 8: Effect of slavery when adjusting for proxies of antebellum attitudes. All models are WLS withwithin-county sample size as weights.
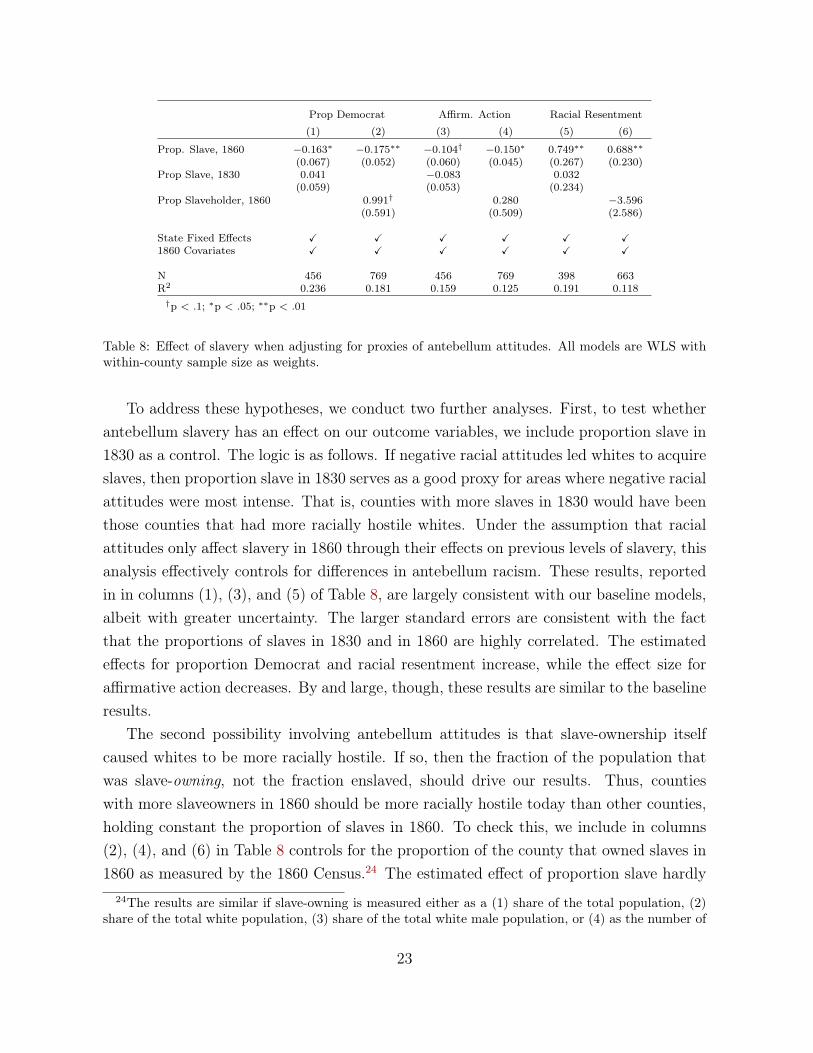
To address these hypotheses, we conduct two further analyses. First, to test whetherantebellum slavery has an effect on our outcome variables, we include proportion slave in1830 as a control. The logic is as follows. If negative racial attitudes led whites to acquireslaves, then proportion slave in 1830 serves as a good proxy for areas where negative racialattitudes were most intense. That is, counties with more slaves in 1830 would have beenthose counties that had more racially hostile whites. Under the assumption that racialattitudes only affect slavery in 1860 through their effects on previous levels of slavery, thisanalysis effectively controls for differences in antebellum racism. These results, reportedin in columns (1), (3), and (5) of Table 8, are largely consistent with our baseline models,albeit with greater uncertainty. The larger standard errors are consistent with the factthat the proportions of slaves in 1830 and in 1860 are highly correlated. The estimatedeffects for proportion Democrat and racial resentment increase, while the effect size foraffirmative action decreases. By and large, though, these results are similar to the baselineresults.
The second possibility involving antebellum attitudes is that slave-ownership itselfcaused whites to be more racially hostile. If so, then the fraction of the population thatwas slave-owning, not the fraction enslaved, should drive our results. Thus, countieswith more slaveowners in 1860 should be more racially hostile today than other counties,holding constant the proportion of slaves in 1860. To check this, we include in columns(2), (4), and (6) in Table 8 controls for the proportion of the county that owned slaves in1860 as measured by the 1860 Census.24 The estimated effect of proportion slave hardly
24The results are similar if slave-owning is measured either as a (1) share of the total population, (2)share of the total white population, (3) share of the total white male population, or (4) as the number of
23
changes. While these tests cannot rule out all possible antebellum explanations, they docast doubt on antebellum factors being the main drivers behind our results.
5.5 Geographic Sorting
The fifth possibility is that population sorting explains our results. For example, raciallyhostile whites from other parts of the South (or elsewhere) may have migrated to formerslave counties during the last 150 years. Analoglously, whites who hold more raciallytolerant beliefs may have continually left former slaveholding areas. We address thissorting hypothesis in several ways.
Historical Migration Analysis. If geographic sorting is an important determinant ofwhy and where people move, our interpretation of the results as reflecting the importanceof the historical events following the Civil War might be overstated. To investigate thispossibility, we look into patterns of migration in a five-year snapshot from 1935-1940,drawing on the public use micro-sample (PUMS) of the 1940 U.S. Census (Ruggles et al.,2010). This year of the census is unique in that it provides the county in which a personresided in 1935 and in 1939. Thus, we can identify migrants and their patterns of migra-tion at the individual level. These data allows us to investigate if migrants into or out offormer slave area were somehow distinct from other migrants. If perpetual sorting playsan important role in our results, we would expect to see differences between high-slavemigrants and migrants from or to other areas. To test for differences among out-migrants,we adopted the following strategy: we ran a regression of various individual characteris-tics on out-migration status, the proportion of slaves in the respondent’s 1935 county ofresidence, and the interaction between the two. We also included the 1860 covariates andstate fixed effects for the 1935 counties. The interaction in this regression measures thedegree to which differences between out-migrants and those who didn’t migrate varies asa function of proportion slave. For in-migration, we take a similar approach but replacethe characteristics of the 1935 county of residence with the characteristics of the 1939county of residence.
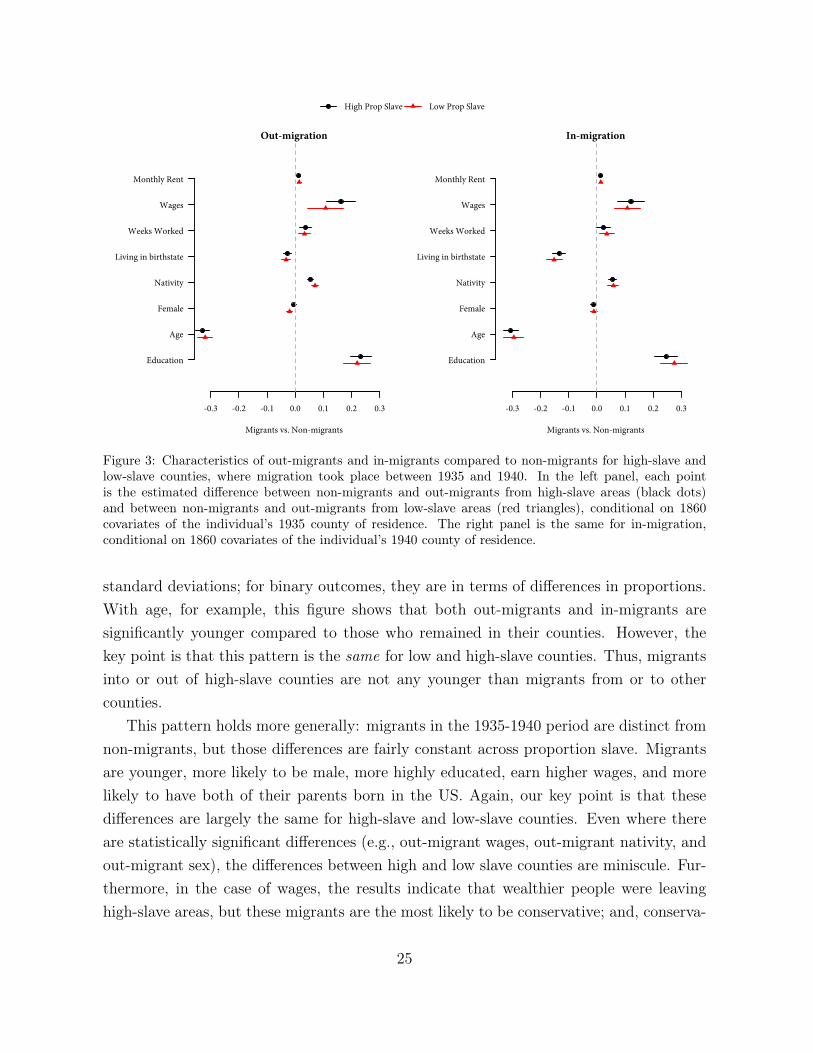
Figure 3 depicts the results from this analysis, and shows the differences betweenmigrants and non-migrants across a number of characteristics.25 The figure depicts howthese effects vary by proportion slave. For continuous outcomes, the effects are in terms of
slave owners per family.25See the IPUMS documentation at https://usa.ipums.org/ for a complete description of these
census measures.
24
High Prop Slave Low Prop Slave
-0.3 -0.2 -0.1 0.0 0.1 0.2 0.3
Out-migration
Migrants vs. Non-migrants
Education
Age
Female
Nativity
Living in birthstate
Weeks Worked
Wages
Monthly Rent
-0.3 -0.2 -0.1 0.0 0.1 0.2 0.3
In-migration
Migrants vs. Non-migrants
Education
Age
Female
Nativity
Living in birthstate
Weeks Worked
Wages
Monthly Rent
Figure 3: Characteristics of out-migrants and in-migrants compared to non-migrants for high-slave andlow-slave counties, where migration took place between 1935 and 1940. In the left panel, each pointis the estimated difference between non-migrants and out-migrants from high-slave areas (black dots)and between non-migrants and out-migrants from low-slave areas (red triangles), conditional on 1860covariates of the individual’s 1935 county of residence. The right panel is the same for in-migration,conditional on 1860 covariates of the individual’s 1940 county of residence.
standard deviations; for binary outcomes, they are in terms of differences in proportions.With age, for example, this figure shows that both out-migrants and in-migrants aresignificantly younger compared to those who remained in their counties. However, thekey point is that this pattern is the same for low and high-slave counties. Thus, migrantsinto or out of high-slave counties are not any younger than migrants from or to othercounties.
This pattern holds more generally: migrants in the 1935-1940 period are distinct fromnon-migrants, but those differences are fairly constant across proportion slave. Migrantsare younger, more likely to be male, more highly educated, earn higher wages, and morelikely to have both of their parents born in the US. Again, our key point is that thesedifferences are largely the same for high-slave and low-slave counties. Even where thereare statistically significant differences (e.g., out-migrant wages, out-migrant nativity, andout-migrant sex), the differences between high and low slave counties are miniscule. Fur-thermore, in the case of wages, the results indicate that wealthier people were leavinghigh-slave areas, but these migrants are the most likely to be conservative; and, conserva-
25
tives leaving high-slave areas actually cuts against our observed patterns. These results,while being tied to a specific five-year period in American history, provide suggestiveevidence that the differences we are seeing are not due to geographic sorting alone.
Contemporary Migration Analysis. We also present some suggestive evidence usingdata on between-county migration from 1995 to 2000 from the 2000 U.S. Census (Bureau,2001). These data help us investigate the extent to which contemporary, as opposedto historical migration, explains our findings (see Dell, 2010, for a similar analysis). Inorder for geographic sorting to explain our results, two conditions must hold. The firstis that there must be migration from low-slave areas to high-slave areas (or vice-versa);otherwise, there is no meaningful sorting of any kind. To test this condition, we usecounty-to-county migration data to calculate dyads of where people move to and from,measuring the absolute difference in the proportion 1860 slave between the departing andreceiving county; this enables us to assess how much migration exists between low-slaveand high-slave areas. Appendix Figure A.2 shows the relationship between these flowsand the difference in proportion slave, and it demonstrates that, as the slavery differentialgrows, the migrations between counties drops significantly. Thus, the vast majority ofcontemporary migration is within low-slave areas or within high-slave areas, not between.
The second condition for sorting to explain our findings is that racially conservativewhites are moving into high-slave areas, racially liberal whites are moving out of high-slave areas, or some combination. Even if there is very little migration between low-and high-slave counties (as shown in Appendix Figure A.2), the distribution of politicalbeliefs among these migrants could be so highly skewed so as to produce our results. (Forexample, perhaps all of the out-migrants from high-slave counties are racially liberal andall of the in-migrants to high-slave counties are racially conservative.) With regard to thefirst possibility, this seems unlikely to be the primary mechanism as it relies on raciallyhostile whites moving to areas with extremely large proportions of African Americans. Forexample, Farley et al. (1994), show that anti-black attitudes are correlated with strongerpreferences for geographic segregation. More plausible is the exodus of racial liberals fromformer slave counties. To check this, again using contemporary data, we examine therelationship between the proportion slave in 1860 and out-migration in 1995-2000 censusrecords. We find that proportion slave actually has a negative effect on contemporary out-migration (Appendix Table A.15). Thus, we have no evidence drawn from contemporarydata for any of the necessary conditions behind a geographic sorting explanation.
26
Prop Democrat Affirm. Action Racial Resentment
logistic logistic OLS
(1) (2) (3) (4) (5) (6)
Prop. Slave, 1860 0.500 −0.708 −0.408 −0.695 −0.161 0.546(0.378) (0.623) (0.450) (0.598) (0.367) (0.650)
State Fixed Effects X X X X X X1860 Covariates X X X X X XCluster-Robust SEs X X X X X X
Sample Blacks 2nd Gen. Blacks 2nd Gen. Blacks 2nd Gen.Immigrants Immigrants Immigrants
N 5,082 1,965 5,077 1,960 1,649 606∗p < .1; ∗∗p < .05
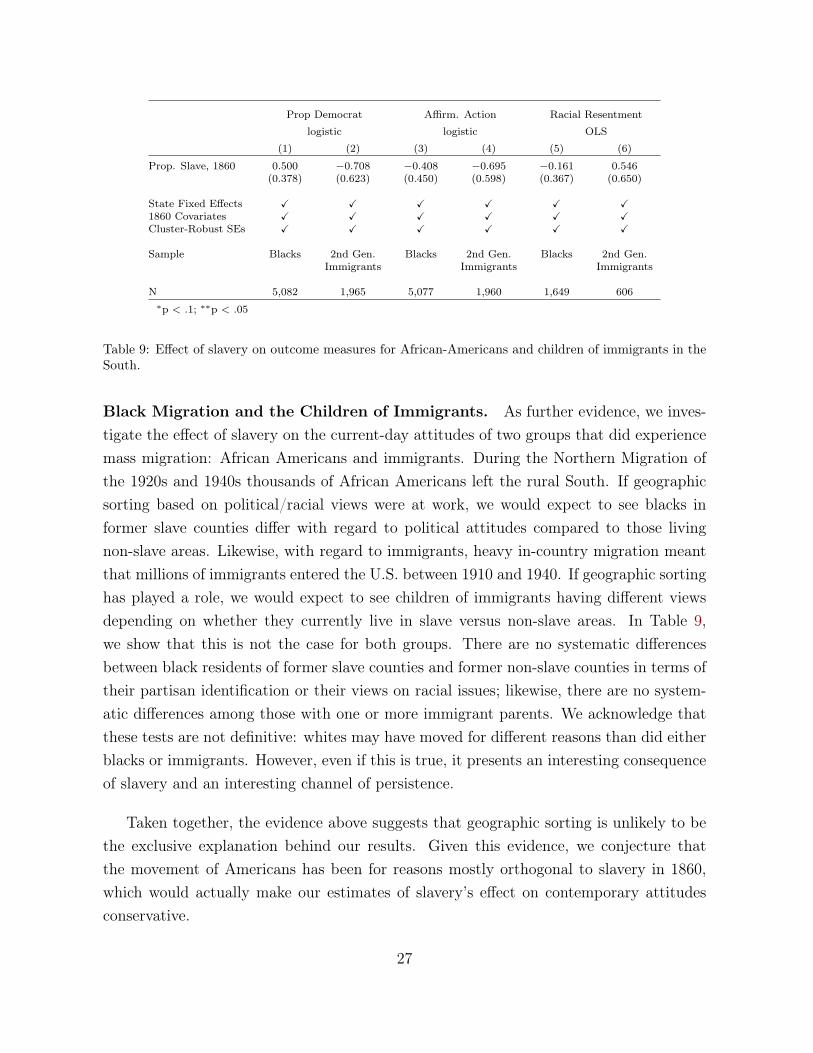
Table 9: Effect of slavery on outcome measures for African-Americans and children of immigrants in theSouth.
Black Migration and the Children of Immigrants. As further evidence, we inves-tigate the effect of slavery on the current-day attitudes of two groups that did experiencemass migration: African Americans and immigrants. During the Northern Migration ofthe 1920s and 1940s thousands of African Americans left the rural South. If geographicsorting based on political/racial views were at work, we would expect to see blacks informer slave counties differ with regard to political attitudes compared to those livingnon-slave areas. Likewise, with regard to immigrants, heavy in-country migration meantthat millions of immigrants entered the U.S. between 1910 and 1940. If geographic sortinghas played a role, we would expect to see children of immigrants having different viewsdepending on whether they currently live in slave versus non-slave areas. In Table 9,we show that this is not the case for both groups. There are no systematic differencesbetween black residents of former slave counties and former non-slave counties in terms oftheir partisan identification or their views on racial issues; likewise, there are no system-atic differences among those with one or more immigrant parents. We acknowledge thatthese tests are not definitive: whites may have moved for different reasons than did eitherblacks or immigrants. However, even if this is true, it presents an interesting consequenceof slavery and an interesting channel of persistence.
Taken together, the evidence above suggests that geographic sorting is unlikely to bethe exclusive explanation behind our results. Given this evidence, we conjecture thatthe movement of Americans has been for reasons mostly orthogonal to slavery in 1860,which would actually make our estimates of slavery’s effect on contemporary attitudesconservative.
27
5.6 Inequality and Statistical Discrimination
The final alternative explanation that we consider is that contemporary (or historical)inequality between black residents and white residents, or other features of the localblack communities, are the main drivers of contemporary differences in white attitudes.For instance O’Connell (2012) finds that slavery in 1860 predicts black-white incomeinequality today, using a OLS approach. Her results suggest that our findings could beexplained by a simple theory of statistical discrimination (Becker, 2010; Arrow, 1998) ifthe lower incomes of African Americans is what shapes attitudes towards them, moregenerally. In addition, if poverty correlates with other traits (such as, for example, higherinstances of crime) then we might expect this type of statistical discrimination to be evenmore pronounced.
We address this story of statistical discrimination with three analyses, all of whichcast doubt on its explanatory power. First, in Appendix Table A.8, we show that theeffect of slavery on black-white income inequality today is not robust to different empiricalspecifications. For example, we show that, while an OLS approach shows that slavery ispositively correlated with inequality, our IV approach shows no such statistically signifi-cant relationship. We do not think this is an issue of statistical power because repeatingthe analysis for black-white inequality in 1940 wages shows that applying the IV strat-egy actually increases the magnitude of the effect of slavery on inequality. Thus, whilethere is evidence that slavery increased historical income inequality, there is much weakerevidence that this effect has persisted until today.
Second, we show that local income inequality is a weak predictor of our main outcomevariables, and if anything, the effects are in the opposite direction as statistical discrim-ination theory would predict. In Appendix Table A.9, we show that inequality has astatistically significant relationship only with proportion Democrat and in this case, therelationship is actually positive. The relationships with support for affirmative action andracial resentment are small and not significant. Furthermore, the table also shows thatincluding contemporary black-white income inequality into our baseline specification doesnot substantially change our estimates of the effects of slave prevalence.
Finally, we check an observable implication of the inequality account. If income in-equality drives these effects, then the marginal effect of slavery on attitudes should varyin the income level of the respondent. For example, higher income respondents might bemore responsive to the inequality mechanism, since the discrepancy between their incomeand that of the local black population is higher. In Appendix Table A.10, we show thatthere is no such interaction between respondent income and proportion slave. Taken to-
28
gether, these three analyses provide evidence that statistical discrimination and inequalityare not the main drivers of our effects.
6 Evidence for Postbellum Oppression and the Persis-tence of Attitudes
If slavery’s effects do not operate through the pathways we have excluded, then whatexplains our results? Our theory is that slave and non-slave areas began to divergepolitically after the Civil War. The prevalence of slavery, coupled with the shock ofits removal, created strong incentives for Southern whites to try to preserve both theirpolitical and economic power by promoting racially targeted violence, anti-black norms,and, to the extent legally possible, racist institutions.26 This intensified racially hostilepolitical attitudes, and these attitudes were passed on by elites to other members ofthe community, and then from parents to children, leading to a historical persistence ofpolitical attitudes.
In this section, we provide evidence for this theory.27 We present four pieces of evidencefor our argument. This includes evidence for (1) post-bellum racial violence, for whichwe present evidence on post-Reconstruction era lynchings, (2) the weakening of economicincentives for racial hostile attitudes that took place as a result of the movement towardagricultural mechanization in the 1930s, (3) the continued effect of slavery on partisanshipover the last 150 years, and (4) indirect evidence for parent-to-child transmission of racialattitudes.
6.1 Postbellum Lynchings, the Status of Black Farmers and Con-temporary Hate Crimes
A key component of our incentives-based explanation is that violence was used not onlyto disenfranchise blacks, but also to suppress their mobility and wages. Given this ex-
26The more general idea behind our theory is that when an entrenched social and economic institutionlike slavery is abruptly and forcibly abolished, previously powerful groups (ex-slave-owning white elite)seek to establish other local and informal institutions that serve a similar purpose to that of the previous,forcibly abolished formal institution (slavery). This idea is also discussed briefly in Acemoglu et al. (2011),who explain that when Napoleon’s armies forcibly removed seigniorial institutions in Western Germany,local elites tried to set up informal institutions that served the same roles as the ones that were forciblyabolished.
27In a companion working paper (Acharya, Blackwell and Sen, 2013) we formalize the intuition behindour theory. A copy of the paper can be found at http://www.mattblackwell.org/files/papers/slaverytheory.pdf.
29
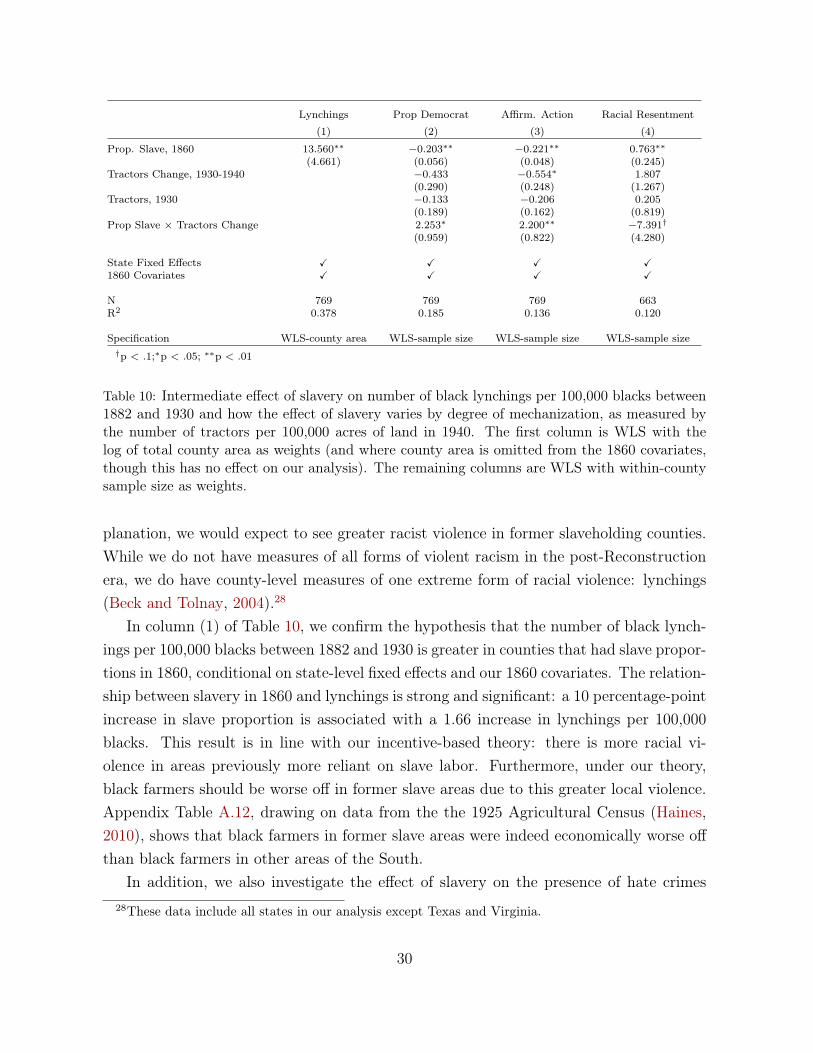
Lynchings Prop Democrat Affirm. Action Racial Resentment
(1) (2) (3) (4)
Prop. Slave, 1860 13.560∗∗ −0.203∗∗ −0.221∗∗ 0.763∗∗(4.661) (0.056) (0.048) (0.245)
Tractors Change, 1930-1940 −0.433 −0.554∗ 1.807(0.290) (0.248) (1.267)
Tractors, 1930 −0.133 −0.206 0.205(0.189) (0.162) (0.819)
Prop Slave × Tractors Change 2.253∗ 2.200∗∗ −7.391†(0.959) (0.822) (4.280)
State Fixed Effects X X X X1860 Covariates X X X X
N 769 769 769 663R2 0.378 0.185 0.136 0.120
Specification WLS-county area WLS-sample size WLS-sample size WLS-sample size†p < .1;∗p < .05; ∗∗p < .01
Table 10: Intermediate effect of slavery on number of black lynchings per 100,000 blacks between1882 and 1930 and how the effect of slavery varies by degree of mechanization, as measured bythe number of tractors per 100,000 acres of land in 1940. The first column is WLS with thelog of total county area as weights (and where county area is omitted from the 1860 covariates,though this has no effect on our analysis). The remaining columns are WLS with within-countysample size as weights.
planation, we would expect to see greater racist violence in former slaveholding counties.While we do not have measures of all forms of violent racism in the post-Reconstructionera, we do have county-level measures of one extreme form of racial violence: lynchings(Beck and Tolnay, 2004).28
In column (1) of Table 10, we confirm the hypothesis that the number of black lynch-ings per 100,000 blacks between 1882 and 1930 is greater in counties that had slave propor-tions in 1860, conditional on state-level fixed effects and our 1860 covariates. The relation-ship between slavery in 1860 and lynchings is strong and significant: a 10 percentage-pointincrease in slave proportion is associated with a 1.66 increase in lynchings per 100,000blacks. This result is in line with our incentive-based theory: there is more racial vi-olence in areas previously more reliant on slave labor. Furthermore, under our theory,black farmers should be worse off in former slave areas due to this greater local violence.Appendix Table A.12, drawing on data from the the 1925 Agricultural Census (Haines,2010), shows that black farmers in former slave areas were indeed economically worse offthan black farmers in other areas of the South.
In addition, we also investigate the effect of slavery on the presence of hate crimes28These data include all states in our analysis except Texas and Virginia.
30
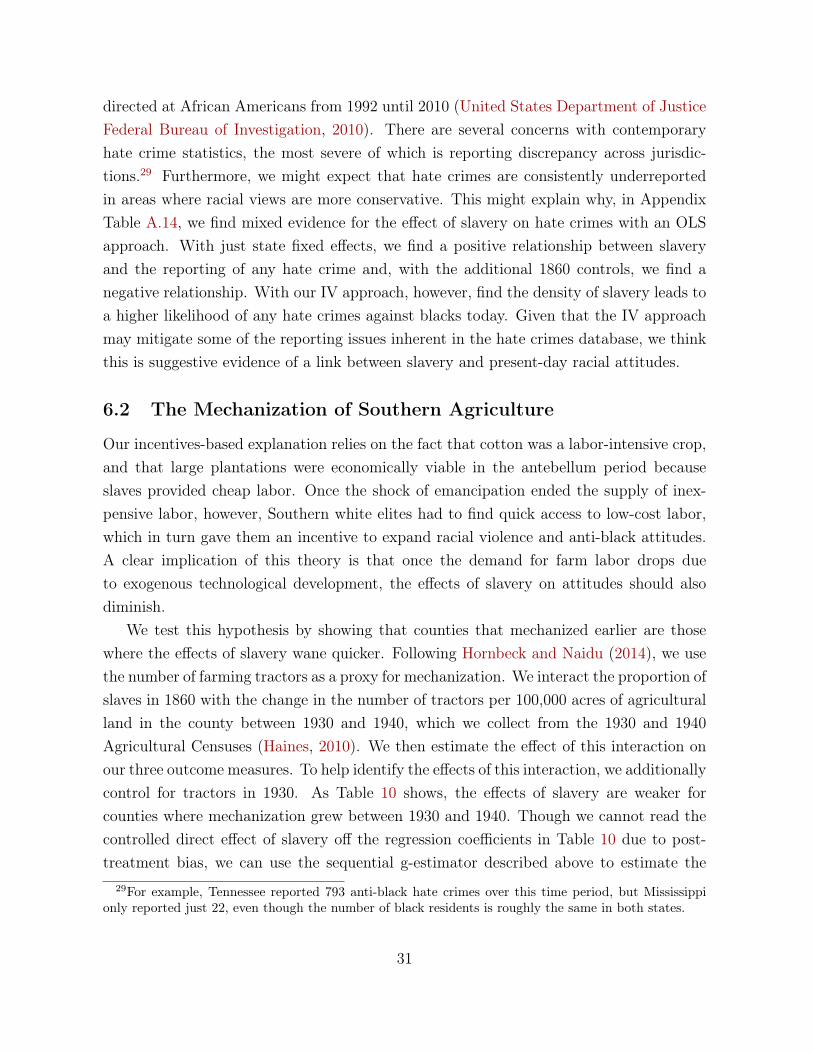
directed at African Americans from 1992 until 2010 (United States Department of JusticeFederal Bureau of Investigation, 2010). There are several concerns with contemporaryhate crime statistics, the most severe of which is reporting discrepancy across jurisdic-tions.29 Furthermore, we might expect that hate crimes are consistently underreportedin areas where racial views are more conservative. This might explain why, in AppendixTable A.14, we find mixed evidence for the effect of slavery on hate crimes with an OLSapproach. With just state fixed effects, we find a positive relationship between slaveryand the reporting of any hate crime and, with the additional 1860 controls, we find anegative relationship. With our IV approach, however, find the density of slavery leads toa higher likelihood of any hate crimes against blacks today. Given that the IV approachmay mitigate some of the reporting issues inherent in the hate crimes database, we thinkthis is suggestive evidence of a link between slavery and present-day racial attitudes.
6.2 The Mechanization of Southern Agriculture
Our incentives-based explanation relies on the fact that cotton was a labor-intensive crop,and that large plantations were economically viable in the antebellum period becauseslaves provided cheap labor. Once the shock of emancipation ended the supply of inex-pensive labor, however, Southern white elites had to find quick access to low-cost labor,which in turn gave them an incentive to expand racial violence and anti-black attitudes.A clear implication of this theory is that once the demand for farm labor drops dueto exogenous technological development, the effects of slavery on attitudes should alsodiminish.
We test this hypothesis by showing that counties that mechanized earlier are thosewhere the effects of slavery wane quicker. Following Hornbeck and Naidu (2014), we usethe number of farming tractors as a proxy for mechanization. We interact the proportion ofslaves in 1860 with the change in the number of tractors per 100,000 acres of agriculturalland in the county between 1930 and 1940, which we collect from the 1930 and 1940Agricultural Censuses (Haines, 2010). We then estimate the effect of this interaction onour three outcome measures. To help identify the effects of this interaction, we additionallycontrol for tractors in 1930. As Table 10 shows, the effects of slavery are weaker forcounties where mechanization grew between 1930 and 1940. Though we cannot read thecontrolled direct effect of slavery off the regression coefficients in Table 10 due to post-treatment bias, we can use the sequential g-estimator described above to estimate the
29For example, Tennessee reported 793 anti-black hate crimes over this time period, but Mississippionly reported just 22, even though the number of black residents is roughly the same in both states.
31
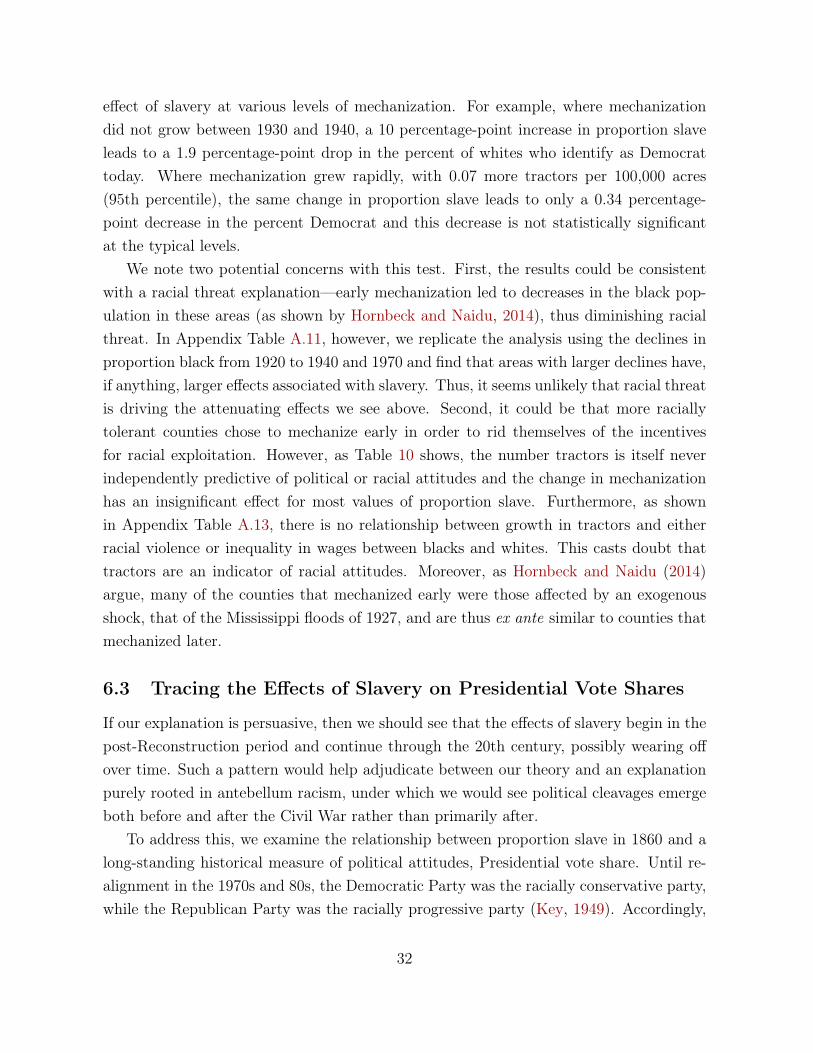
effect of slavery at various levels of mechanization. For example, where mechanizationdid not grow between 1930 and 1940, a 10 percentage-point increase in proportion slaveleads to a 1.9 percentage-point drop in the percent of whites who identify as Democrattoday. Where mechanization grew rapidly, with 0.07 more tractors per 100,000 acres(95th percentile), the same change in proportion slave leads to only a 0.34 percentage-point decrease in the percent Democrat and this decrease is not statistically significantat the typical levels.
We note two potential concerns with this test. First, the results could be consistentwith a racial threat explanation—early mechanization led to decreases in the black pop-ulation in these areas (as shown by Hornbeck and Naidu, 2014), thus diminishing racialthreat. In Appendix Table A.11, however, we replicate the analysis using the declines inproportion black from 1920 to 1940 and 1970 and find that areas with larger declines have,if anything, larger effects associated with slavery. Thus, it seems unlikely that racial threatis driving the attenuating effects we see above. Second, it could be that more raciallytolerant counties chose to mechanize early in order to rid themselves of the incentivesfor racial exploitation. However, as Table 10 shows, the number tractors is itself neverindependently predictive of political or racial attitudes and the change in mechanizationhas an insignificant effect for most values of proportion slave. Furthermore, as shownin Appendix Table A.13, there is no relationship between growth in tractors and eitherracial violence or inequality in wages between blacks and whites. This casts doubt thattractors are an indicator of racial attitudes. Moreover, as Hornbeck and Naidu (2014)argue, many of the counties that mechanized early were those affected by an exogenousshock, that of the Mississippi floods of 1927, and are thus ex ante similar to counties thatmechanized later.
6.3 Tracing the Effects of Slavery on Presidential Vote Shares
If our explanation is persuasive, then we should see that the effects of slavery begin in thepost-Reconstruction period and continue through the 20th century, possibly wearing offover time. Such a pattern would help adjudicate between our theory and an explanationpurely rooted in antebellum racism, under which we would see political cleavages emergeboth before and after the Civil War rather than primarily after.
To address this, we examine the relationship between proportion slave in 1860 and along-standing historical measure of political attitudes, Presidential vote share. Until re-alignment in the 1970s and 80s, the Democratic Party was the racially conservative party,while the Republican Party was the racially progressive party (Key, 1949). Accordingly,
32
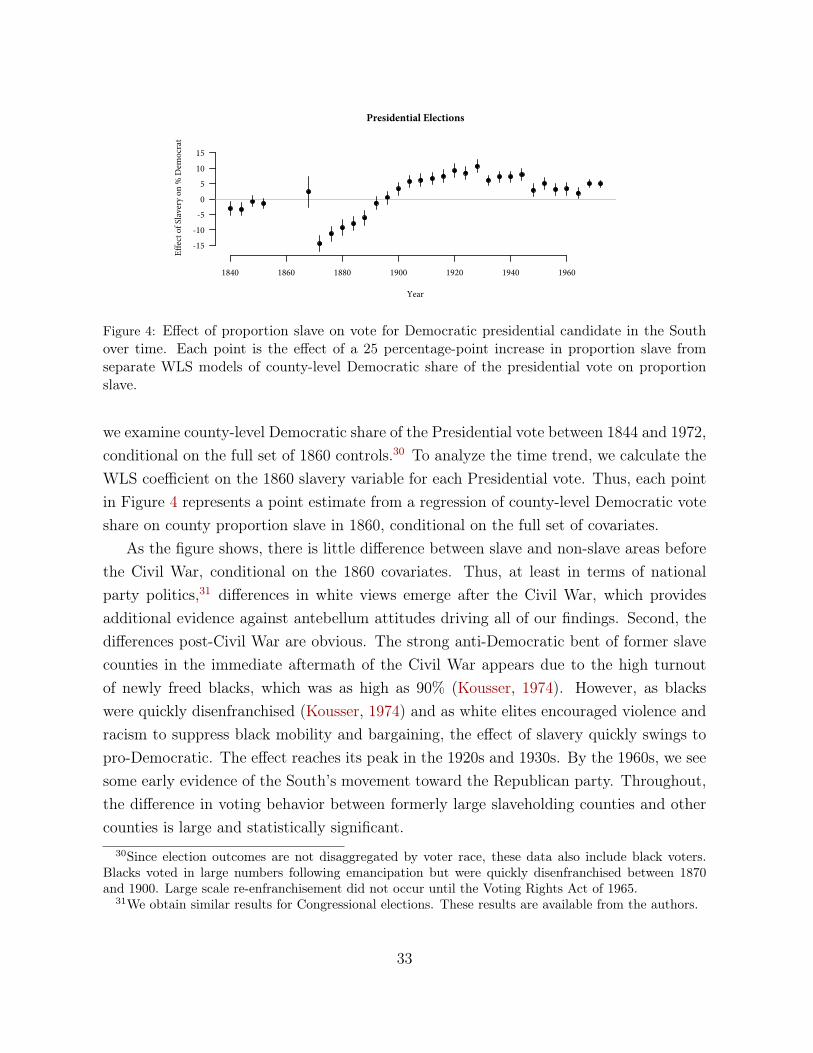
1840 1860 1880 1900 1920 1940 1960
Presidential Elections
Year
Eff
ect
of
Slav
ery
on
% D
emo
crat
-15
-10
-5
0
5
10
15
Figure 4: Effect of proportion slave on vote for Democratic presidential candidate in the Southover time. Each point is the effect of a 25 percentage-point increase in proportion slave fromseparate WLS models of county-level Democratic share of the presidential vote on proportionslave.
we examine county-level Democratic share of the Presidential vote between 1844 and 1972,conditional on the full set of 1860 controls.30 To analyze the time trend, we calculate theWLS coefficient on the 1860 slavery variable for each Presidential vote. Thus, each pointin Figure 4 represents a point estimate from a regression of county-level Democratic voteshare on county proportion slave in 1860, conditional on the full set of covariates.
As the figure shows, there is little difference between slave and non-slave areas beforethe Civil War, conditional on the 1860 covariates. Thus, at least in terms of nationalparty politics,31 differences in white views emerge after the Civil War, which providesadditional evidence against antebellum attitudes driving all of our findings. Second, thedifferences post-Civil War are obvious. The strong anti-Democratic bent of former slavecounties in the immediate aftermath of the Civil War appears due to the high turnoutof newly freed blacks, which was as high as 90% (Kousser, 1974). However, as blackswere quickly disenfranchised (Kousser, 1974) and as white elites encouraged violence andracism to suppress black mobility and bargaining, the effect of slavery quickly swings topro-Democratic. The effect reaches its peak in the 1920s and 1930s. By the 1960s, we seesome early evidence of the South’s movement toward the Republican party. Throughout,the difference in voting behavior between formerly large slaveholding counties and othercounties is large and statistically significant.
30Since election outcomes are not disaggregated by voter race, these data also include black voters.Blacks voted in large numbers following emancipation but were quickly disenfranchised between 1870and 1900. Large scale re-enfranchisement did not occur until the Voting Rights Act of 1965.
31We obtain similar results for Congressional elections. These results are available from the authors.
33
6.4 Inter-generational Transmission of Beliefs
Our last empirical analysis concerns how racial attitudes have been passed down over time.One possibility is that racial attitudes are shaped contemporaneously by local institutions,for example schools and churches, which have themselves persisted. Another possibilityis that racial attitudes have been passed down from parents to children, independentof external institutions such as schools and churches. These mechanisms have differentimplications. If inter-generational socialization (parent-to-child transmission) is in effect,then newcomers to the South should not meaningfully differ in their political attitudesacross former slaveholding and non-slaveholding counties. The reason is because theirancestors did not leave there, and so could not differ meaningfully across these counties.On the other hand, if local institutions like schools and churches shape racial attitudescontinuously through time, then we should expect those moving to former slaveholdingcounties to adopt similar attitudes as families living there for generations, because eventhe newcomers are exposed to the same institutions and environment as the older families.
To adjudicate between these explanations, we return to our results on the effect ofslavery for the children of immigrants. Second-generation immigrants living in the Southare exposed to current local institutions but are unlikely to have had the legacy of slaverypassed down to them through their parents. The lack of an effect for these respondents(Table 9) provides suggestive evidence that the parent-to-child transmission mechanism isan important component of how slavery affects attitudes. Local institutions appear to playa more modest role by comparison. As such, this evidence provides some indirect supportthat political culture, rather than institutions, plays an important role in explaining thepersistent effects of American slavery.
7 Conclusion
In this paper, we have shown that an institution that was formally abolished nearly150 years ago still has effects on contemporary political outcomes. Slavery continues toaffect how Southern whites identify politically, how they feel about affirmative action,and how they perceive African Americans. To explain these results, we offered a theoryin which slavery affected racial attitudes, and these attitudes were passed down throughgenerations. In addition, we ruled out various other explanations that were motivated byprevious theories in the American politics literature.
Our research has substantial implications for the current study of American politicalbehavior. After the pioneering work of Campbell et al. (1980), several scholars produced
34
evidence for the theory that political beliefs are passed down through successive gen-erations, from parents to children via inter-generational socialization. For us, the nextnatural question arising from these findings is the following: If political beliefs are trans-mitted from generation to generation, then what determined the political beliefs of thegreat-great-grandparents? In other words, how and when did these beliefs originate? Thebroadest interpretation of our contribution here is that answers to such questions can befound by investigating the impact of historical institutions like slavery. Thus, we can lookeven beyond white attitudes and explore other effects of these institutions on other aspectsof contemporary society such as the persistent belief in linked fate among African Ameri-cans (Dawson, 1994) and the racial biases of the U.S. criminal justice system (Alexander,2012). We may even look to other historical events, such as the Great Depression orWorld War II, to examine their possible long-term effects on contemporary politics.
This leads us to our final point. Within the study of American political behavior, themodern practice for quantitative researchers is to include only contemporaneous variablesin their analysis. However, our paper reinforces the argument of Pierson (2004) thatinstitutional and historical legacies are crucial for understanding modern politics. Inlight of this, we encourage future research to explore the relationships between historicalinstitutions and contemporary political behavior. As Key (1949) himself observed manyyears ago, social and historical forces have “an impact on political habit whose influencehas not worn away even yet.” This might be the case not just for racial relations in theAmerican South, but also in other areas of American politics and elsewhere in the world.
35

References
Acemoglu, Daron, Camilo García-Jimeno and James A Robinson. 2012. “Finding Eldo-rado: Slavery and long-run development in Colombia.” Journal of Comparative Eco-nomics 40(4):534–564.
Acemoglu, Daron, Davide Cantoni, Simon Johnson and James A Robinson. 2011. “Theconsequences of radical reform: The French Revolution.” American Economic Review101(7):3286–3307.
Acharya, Avidit, Matthew Blackwell and Maya Sen. 2013. “Attitudes Shaped by Violence.”Working Paper.
Alesina, Alberto, Paola Giuliano and Nathan Nunn. 2013. “On the Origins of GenderRoles: Women and the Plough.” Quarterly Journal of Economics 128(2):469–530.
Alexander, Michelle. 2012. The New Jim Crow: Mass Incarceration in the Age of Color-blindness. The New Press.
Alston, Lee J. and Joseph P. Ferrie. 1993. “Paternalism in Agricultural Labor Contracts inthe U.S. South: Implications for the Growth of the Welfare State.” American EconomicReview pp. 852–876.
Ansolabehere, Stephen. 2010. “Cooperative Congressional Election Study, 2010: CommonContent.” Cambridge, MA: Harvard University [producer].URL: http://projects.iq.harvard.edu/cces/
Ansolabehere, Stephen, Jonathan Rodden and James M. Snyder. 2006. “Purple America.”The Journal of Economic Perspectives 20(2):97–118.
Arrow, Kenneth J. 1998. “What Has Economics to Say About Racial Discrimination?”The Journal of Economic Perspectives 12(2):91–100.
Banerjee, Abhijit and Lakshmi Iyer. 2005. “History, Institutions, and Economic Perfor-mance: The Legacy of Colonial Land Tenure Systems in India.” American EconomicReview 95(4):1190–1213.
Barrios, Thomas, Rebecca Diamond, Guido W. Imbens and Michal Kolesar. 2012. “Clus-tering, Spatial Correlations, and Randomization Inference.” Journal of the AmericanStatistical Association 107(498):578–591.
36
Bartels, Larry M. 2006. “What’s the Matter with ‘What’s the Matter with Kansas?’.”Quarterly Journal of Political Science 1(2):201–26.
Baybeck, Brady. 2006. “Sorting Out the Competing Effects of Racial Context.” Journalof Politics 68(2):386–396.
Beck, EM and Stewart E Tolnay. 2004. “Confirmed Inventory of Southern Lynch Victims,1882–1930.” Data file available from authors .
Becker, Gary S. 2010. The Economics of Discrimination. University of Chicago Press.
Birdsall, Stephen S. 1969. “Preliminary Analysis of the 1968 Wallace Vote in the South-east.” Southeastern Geographer 9(2):55–66.
Bisin, Alberto and Thierry Verdier. 2000. “A model of cultural transmission, voting andpolitical ideology.” European Journal of Political Economy 16(1):5–29.
Black, Earl and Merle Black. 1973. “The Wallace Vote in Alabama: A Multiple RegressionAnalysis.” Journal of Politics 35(03):730–736.
Blackmon, Douglas A. 2008. Slavery by Another Name: The Re-Enslavement of BlackAmericans from the Civil War to World War II. Anchor Books.
Blalock, Hubert M. 1967. Toward a Theory of Minority-Group Relations. Wiley Press.
Blumer, Herbert. 1958. “Race Prejudice as a Sense of Group Position.” Pacific SociologicalReview 1(1):3–7.
Boyd, Robert and Peter J Richerson. 1988. Culture and the Evolutionary Process. Uni-versity of Chicago Press.
Bureau, US Census. 2001. “County-to-County Migration Flow Files.”.URL: http://www.census.gov/population/www/cen2000/ctytoctyflow/
Campbell, Angus, Philip E. Converse, Warren E. Miller and Donald E. Stokes. 1980. TheAmerican Voter. University of Chicago Press.
Collier, Paul, V. L. Elliott, Håvard Hegre, Anke Hoeffler, Marta Reynal-Querol andNicholas Sambanis. 2013. “Breaking the Conflict Trap: Civil War and DevelopmentPolicy.” Washington, DC: World Bank.
37
Dawson, Michael C. 1994. Behind the Mule-Race and Class in African-American Politics.Princeton University Press.
DeGroot, Morris H. 1974. “Reaching a consensus.” Journal of the American StatisticalAssociation 69(345):118–121.
Dell, Melissa. 2010. “The Persistent Effects of Peru’s Mining Mita.” Econometrica78(6):1863–1903.
Du Bois, W.E.B. [1935] 1999. Black Reconstruction in America, 1860-1880. Free Press.
Farley, Reynolds, Charlotte Steeh, Maria Krysan, Tara Jackson and Keith Reeves. 1994.“Stereotypes and segregation: Neighborhoods in the Detroit area.” American Journalof Sociology pp. 750–780.
Faust, Drew Gilpin. 1988. The Creation of Confederate Nationalism: Ideology and Identityin the Civil War South. Louisiana State University Press.
Festinger, Leon. 1962. A theory of cognitive dissonance. Vol. 2 Stanford university press.
Foner, Eric. 2011. Reconstruction: America’s Unfinished Revolution, 1863-1877. Harper.
Frank, Thomas. 2004. What’s the Matter with Kansas? How Conservatives Won theHeart of America. Henry Holt and Company.
Giles, Micheal W. 1977. “Percent Black and Racial Hostility: An Old Assumption Reex-amined.” Social Science Quarterly 58(3):412–7.
Giles, Micheal W. and Melanie A. Buckner. 1993. “David Duke and Black Threat: AnOld Hypothesis Revisited.” Journal of Politics 55(3):702–13.
Glaser, James M. 1994. “Back to the Black Belt: Racial Environment and White RacialAttitudes in the South.” Journal of Politics 56(1):21–41.
Goldin, Claudia D. and Frank D. Lewis. 1975. “The Economic Cost of the American CivilWar: Estimates and Implications.” Journal of Economic History 35(2):299–326.
Haines, Michael R. 2010. “Historical, Demographic, Economic, and Social Data: TheUnited States, 1790-2002.” Inter-university Consortium for Political and Social Research(ICPSR) [distributor].
38
Higgs, Robert. 1977. Competition and Coercion: Blacks in the American Economy, 1865-1914. Vol. 163 Cambridge; New York: Cambridge University Press.
Hopkins, Daniel J. 2010. “Politicized places: Explaining Where and When ImmigrantsProvoke Local Opposition.” American Political Science Review 104(1):40–60.
Hornbeck, Richard and Suresh Naidu. 2014. “When the Levee Breaks: Black Migra-tion and Economic Development in the American South.” American Economic Review104(3):963–90.URL: http://www.aeaweb.org/articles.php?doi=10.1257/aer.104.3.963
Iacus, Stefano, Gary King and Giuseppe Porro. 2009. “cem: Software for Coarsened ExactMatching.” Journal of Statistical Software 30(9):1–27.URL: http://www.jstatsoft.org/v30/i09
Iacus, Stefano M., Gary King and Giuseppe Porro. 2012. “Causal Inference WithoutBalance Checking: Coarsened Exact Matching.” Political Analysis 20(1):1–24.
Jennings, M. Kent and Richard G. Niemi. 1968. “The Transmission of Political Valuesfrom Parent to Child.” The American Political Science Review 62(1):169–184.
Jordan, Winthrop D. 1968. White Over Black: American Attitudes Toward the Negro,1550-1812. University of North Carolina Press.
Katznelson, Ira, Kim Geiger and Daniel Kryder. 1993. “Limiting Lliberalism: The South-ern Veto in Congress, 1933-1950.” Political Science Quarterly 108(2):283–306.
Key, V.O. 1949. Southern Politics in State and Nation. Knopf Books.
Kinder, Donald R. and David O. Sears. 1981. “Prejudice and Politics: Symbolic RacismVersus Racial Threats to the Good Life.” Journal of Personality and Social Psychology40(3):414–31.
Kinder, Donald R. and Lynn M. Sanders. 1996. Divided by Color: Racial Politics andDemocratic Ideals. University of Chicago Press.
Kousser, J. Morgan. 2010. “The Immutability of Categories and the Reshaping of SouthernPolitics.” Annual Review of Political Science 13:365–383.
Kousser, Morgan J. 1974. The Shaping of Southern Politics: Suffrage Restriction and theEstablishment of the One-Party South, 1880-1910. Yale University Press.
39
Lee, Woojin and John E Roemer. 2006. “Racism and redistribution in the United States:A solution to the problem of American exceptionalism.” Journal of Public Economics90(6):1027–1052.
Lichtenstein, Alex. 1996. Twice the Work of Free Labor: The Political Economy of ConvictLabor in the New South. Verso Books.
Logan, Rayford W. 1954. The Negro in American Life and Thought. Dial Press.
Mitchener, Kris James and Ian W. McLean. 2003. “The Productivity of U.S. States Since1880.” Journal of Economic Growth 8(1):73–114.
Myrdal, Gunnar. 1944. Black and African-American Studies: American Dilemma, theNegro Problem and Modern Democracy. Vol. 2 Transaction Publishers.
Nunn, Nathan. 2008. Slavery, Inequality, and Economic Development in the Americas. InInstitutions and Economic Performance. Harvard University Press.
Nunn, Nathan. 2009. “The Importance of History for Economic Development.” AnnualReview of Economics 1(1):65–92.
Nunn, Nathan. 2012. “Culture and the Historical Process.” Economic History of Devel-oping Regions 27(sup1):S108–S126.
Nunn, Nathan and Leonard Wantchekon. 2011. “The Slave Trade and the Origins ofMistrust in Africa.” American Economic Review 101(7):3221–3252.
O’Connell, Heather A. 2012. “The Impact of Slavery on Racial Inequality in Poverty inthe Contemporary U.S. South.” Social Forces 90(3):713–734.
Ogburn, William F. and Charles M. Grigg. 1956. “Factors Related to the Virginia Voteon Segregation.” Social Forces 34(4):301–308.
Oliver, J. Eric and Tali Mendelberg. 2000. “Reconsidering the Environmental Determi-nants of White Racial Attitudes.” American Journal of Political Science pp. 574–589.
Orey, Byron D’Andra, L. Overby, Peter K. Hatemi and Baodong Liu. 2011. “WhiteSupport for Racial Referenda in the Deep South.” Politics & Policy 39(4):539–558.
Petersen, Maya L, Sandra E Sinisi and Mark J van der Laan. 2006. “Estimation of DirectCausal Effects.” Epidemiology 17(3):276–284.
40
Pettigrew, Thomas F. 1957. “Demographic Correlates of Border-state Desegregation.”American Sociological Review 22(6):683–689.
Pierson, Paul. 2004. Politics in Time: History, Institutions, and Social Analysis. Prince-ton University Press.
Reed, John Shelton. 1972. “Percent Black and Lynching: A Test of Blalock’s Theory.”Social Forces 50(3):356–360.
Roithmayr, Daria. 2010. “Racial Cartels.” Michigan Journal of Race and Law 16:45.
Rosenbaum, Paul R. 1984. “The Consquences of Adjustment for a Concomitant VariableThat Has Been Affected by the Treatment.” Journal of the Royal Statistical Society.Series A (General) 147(5):656–666.
Ruggles, Steven, J. Trent Alexander, Katie Genadek, Ronald Goeken, Matthew B.Schroeder and Matthew Sobek. 2010. “Integrated Public Use Microdata Series: Version5.0 [Machine-readable database].”.
United States Department of Justice Federal Bureau of Investigation. 2010. “UniformCrime Reporting Program Data: Hate Crime Data, 1992-2010 [Record-Type Files].”.URL: http://doi.org/10.3886/ICPSR33524.v1
Vansteelandt, Sijn. 2009. “Estimating Direct Effects in Cohort and Case–Control Studies.”Epidemiology 20(6):851–860.
Voigtländer, Nico and Hans-Joachim Voth. 2012. “Persecution Perpetuated: The MedievalOrigins of Anti-Semitic Violence in Nazi Germany.” Quarterly Journal of Economics127(3):1339–1392.
Voss, D. Stephen. 1996. “Beyond Racial Threat: Failure of an Old Hypothesis in the NewSouth.” Journal of Politics 58:1156–1170.
Wright Jr, Gerald C. 1977. “Contextual Models of Electoral behavior: The SouthernWallace Vote.” American Political Science Review pp. 497–508.
Zaller, John. 1992. The Nature and Origins of Mass Opinion. Cambridge UniversityPress.
41
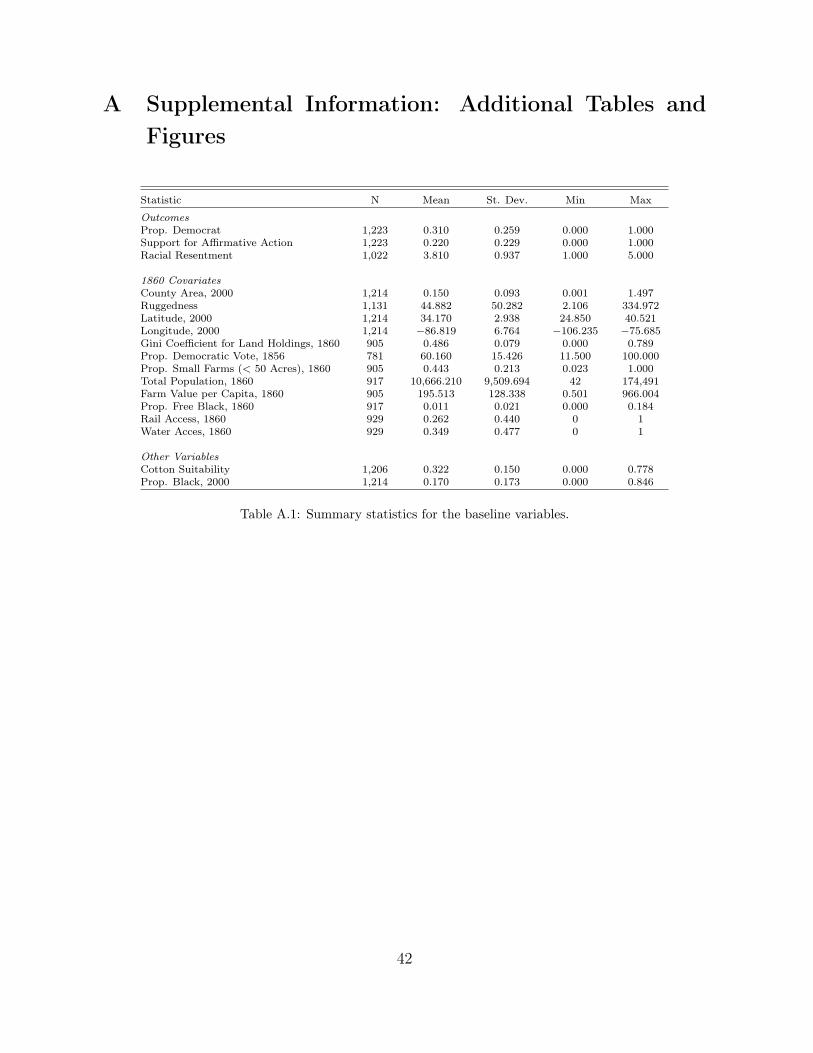
A Supplemental Information: Additional Tables andFigures
Statistic N Mean St. Dev. Min Max
OutcomesProp. Democrat 1,223 0.310 0.259 0.000 1.000Support for Affirmative Action 1,223 0.220 0.229 0.000 1.000Racial Resentment 1,022 3.810 0.937 1.000 5.000
1860 CovariatesCounty Area, 2000 1,214 0.150 0.093 0.001 1.497Ruggedness 1,131 44.882 50.282 2.106 334.972Latitude, 2000 1,214 34.170 2.938 24.850 40.521Longitude, 2000 1,214 −86.819 6.764 −106.235 −75.685Gini Coefficient for Land Holdings, 1860 905 0.486 0.079 0.000 0.789Prop. Democratic Vote, 1856 781 60.160 15.426 11.500 100.000Prop. Small Farms (< 50 Acres), 1860 905 0.443 0.213 0.023 1.000Total Population, 1860 917 10,666.210 9,509.694 42 174,491Farm Value per Capita, 1860 905 195.513 128.338 0.501 966.004Prop. Free Black, 1860 917 0.011 0.021 0.000 0.184Rail Access, 1860 929 0.262 0.440 0 1Water Acces, 1860 929 0.349 0.477 0 1
Other VariablesCotton Suitability 1,206 0.322 0.150 0.000 0.778Prop. Black, 2000 1,214 0.170 0.173 0.000 0.846
Table A.1: Summary statistics for the baseline variables.
42
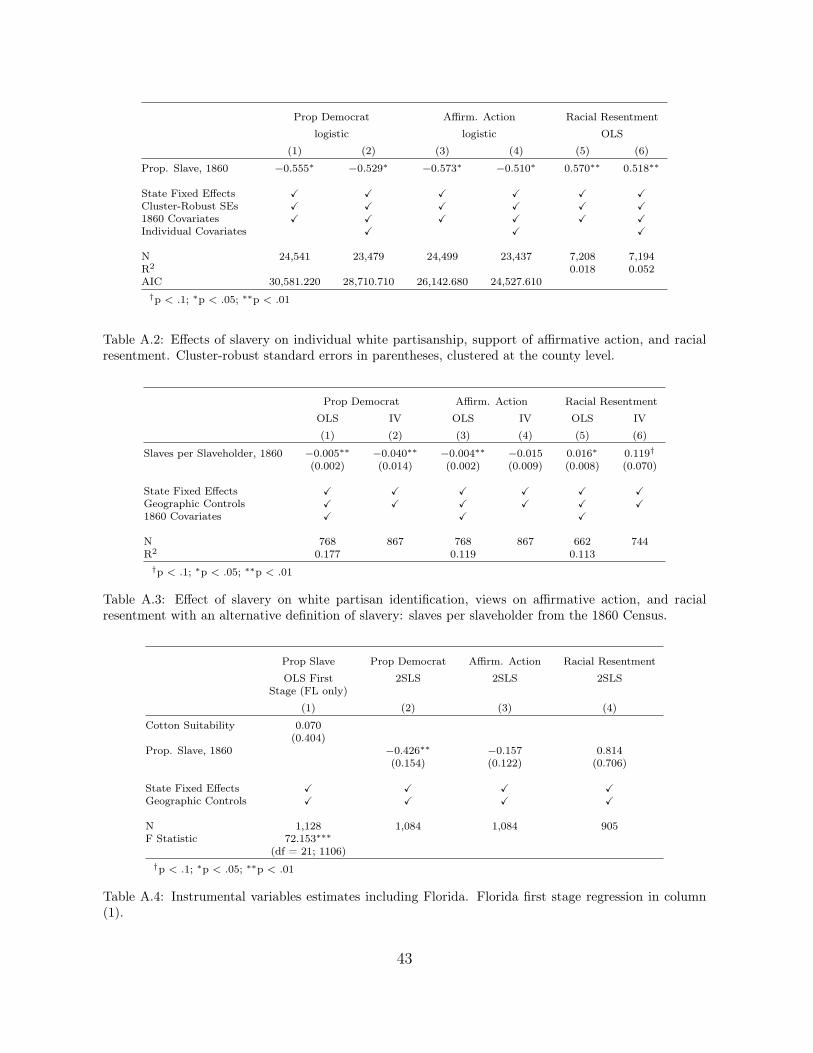
Prop Democrat Affirm. Action Racial Resentment
logistic logistic OLS
(1) (2) (3) (4) (5) (6)
Prop. Slave, 1860 −0.555∗ −0.529∗ −0.573∗ −0.510∗ 0.570∗∗ 0.518∗∗
State Fixed Effects X X X X X XCluster-Robust SEs X X X X X X1860 Covariates X X X X X XIndividual Covariates X X X
N 24,541 23,479 24,499 23,437 7,208 7,194R2 0.018 0.052AIC 30,581.220 28,710.710 26,142.680 24,527.610†p < .1; ∗p < .05; ∗∗p < .01
Table A.2: Effects of slavery on individual white partisanship, support of affirmative action, and racialresentment. Cluster-robust standard errors in parentheses, clustered at the county level.
Prop Democrat Affirm. Action Racial Resentment
OLS IV OLS IV OLS IV
(1) (2) (3) (4) (5) (6)
Slaves per Slaveholder, 1860 −0.005∗∗ −0.040∗∗ −0.004∗∗ −0.015 0.016∗ 0.119†(0.002) (0.014) (0.002) (0.009) (0.008) (0.070)
State Fixed Effects X X X X X XGeographic Controls X X X X X X1860 Covariates X X X
N 768 867 768 867 662 744R2 0.177 0.119 0.113†p < .1; ∗p < .05; ∗∗p < .01
Table A.3: Effect of slavery on white partisan identification, views on affirmative action, and racialresentment with an alternative definition of slavery: slaves per slaveholder from the 1860 Census.
Prop Slave Prop Democrat Affirm. Action Racial Resentment
OLS First 2SLS 2SLS 2SLSStage (FL only)
(1) (2) (3) (4)
Cotton Suitability 0.070(0.404)
Prop. Slave, 1860 −0.426∗∗ −0.157 0.814(0.154) (0.122) (0.706)
State Fixed Effects X X X XGeographic Controls X X X X
N 1,128 1,084 1,084 905F Statistic 72.153∗∗∗
(df = 21; 1106)†p < .1; ∗p < .05; ∗∗p < .01
Table A.4: Instrumental variables estimates including Florida. Florida first stage regression in column(1).
43
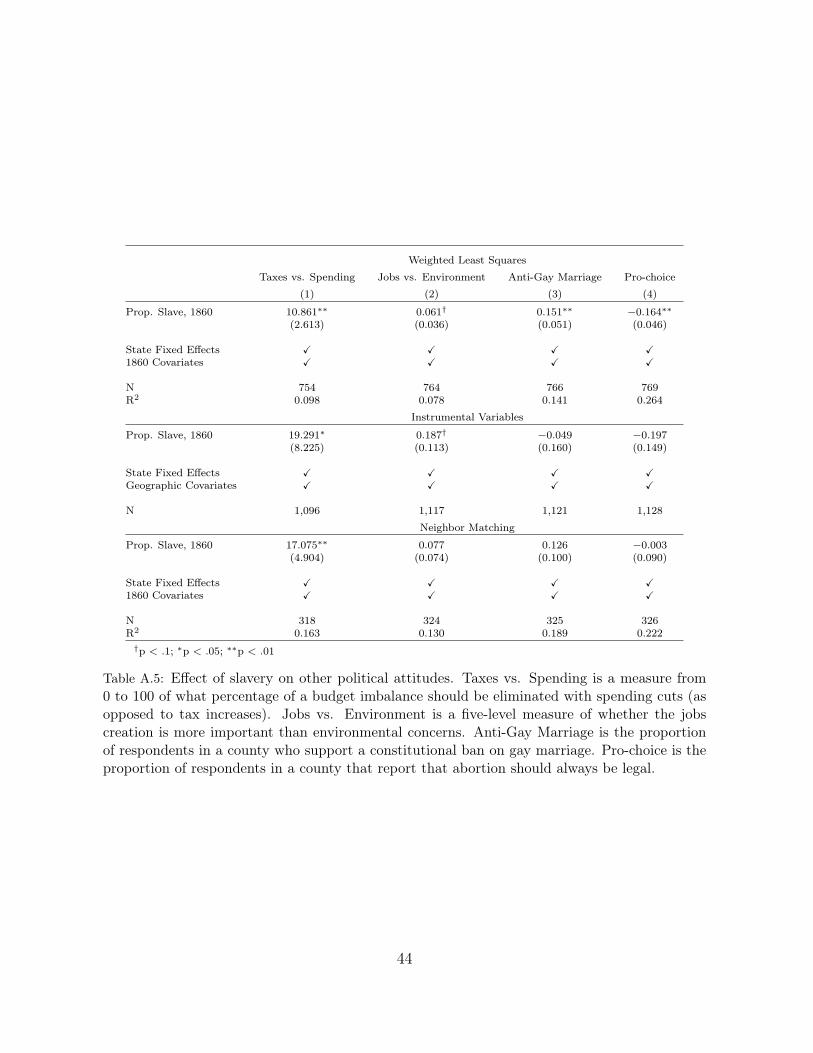
Weighted Least Squares
Taxes vs. Spending Jobs vs. Environment Anti-Gay Marriage Pro-choice
(1) (2) (3) (4)
Prop. Slave, 1860 10.861∗∗ 0.061† 0.151∗∗ −0.164∗∗(2.613) (0.036) (0.051) (0.046)
State Fixed Effects X X X X1860 Covariates X X X X
N 754 764 766 769R2 0.098 0.078 0.141 0.264
Instrumental Variables
Prop. Slave, 1860 19.291∗ 0.187† −0.049 −0.197(8.225) (0.113) (0.160) (0.149)
State Fixed Effects X X X XGeographic Covariates X X X X
N 1,096 1,117 1,121 1,128
Neighbor Matching
Prop. Slave, 1860 17.075∗∗ 0.077 0.126 −0.003(4.904) (0.074) (0.100) (0.090)
State Fixed Effects X X X X1860 Covariates X X X X
N 318 324 325 326R2 0.163 0.130 0.189 0.222†p < .1; ∗p < .05; ∗∗p < .01
Table A.5: Effect of slavery on other political attitudes. Taxes vs. Spending is a measure from0 to 100 of what percentage of a budget imbalance should be eliminated with spending cuts (asopposed to tax increases). Jobs vs. Environment is a five-level measure of whether the jobscreation is more important than environmental concerns. Anti-Gay Marriage is the proportionof respondents in a county who support a constitutional ban on gay marriage. Pro-choice is theproportion of respondents in a county that report that abortion should always be legal.
44
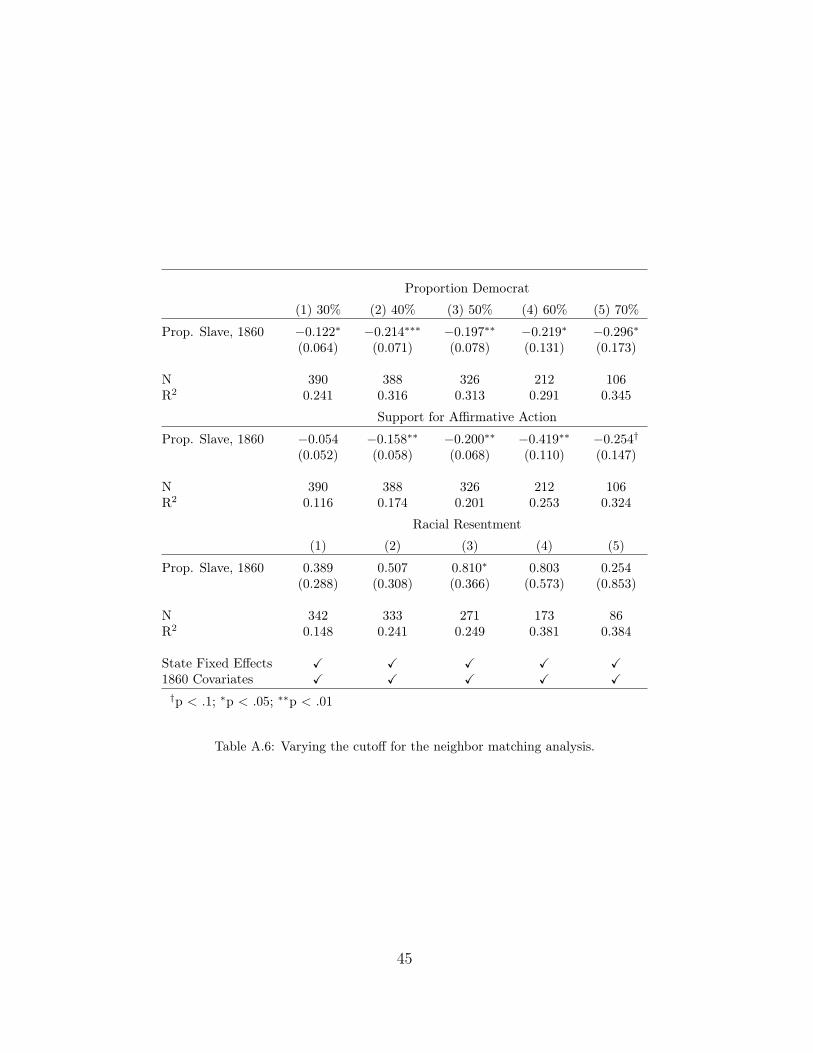
Proportion Democrat
(1) 30% (2) 40% (3) 50% (4) 60% (5) 70%
Prop. Slave, 1860 −0.122∗ −0.214∗∗∗ −0.197∗∗ −0.219∗ −0.296∗(0.064) (0.071) (0.078) (0.131) (0.173)
N 390 388 326 212 106R2 0.241 0.316 0.313 0.291 0.345
Support for Affirmative Action
Prop. Slave, 1860 −0.054 −0.158∗∗ −0.200∗∗ −0.419∗∗ −0.254†(0.052) (0.058) (0.068) (0.110) (0.147)
N 390 388 326 212 106R2 0.116 0.174 0.201 0.253 0.324
Racial Resentment
(1) (2) (3) (4) (5)
Prop. Slave, 1860 0.389 0.507 0.810∗ 0.803 0.254(0.288) (0.308) (0.366) (0.573) (0.853)
N 342 333 271 173 86R2 0.148 0.241 0.249 0.381 0.384
State Fixed Effects X X X X X1860 Covariates X X X X X†p < .1; ∗p < .05; ∗∗p < .01
Table A.6: Varying the cutoff for the neighbor matching analysis.
45
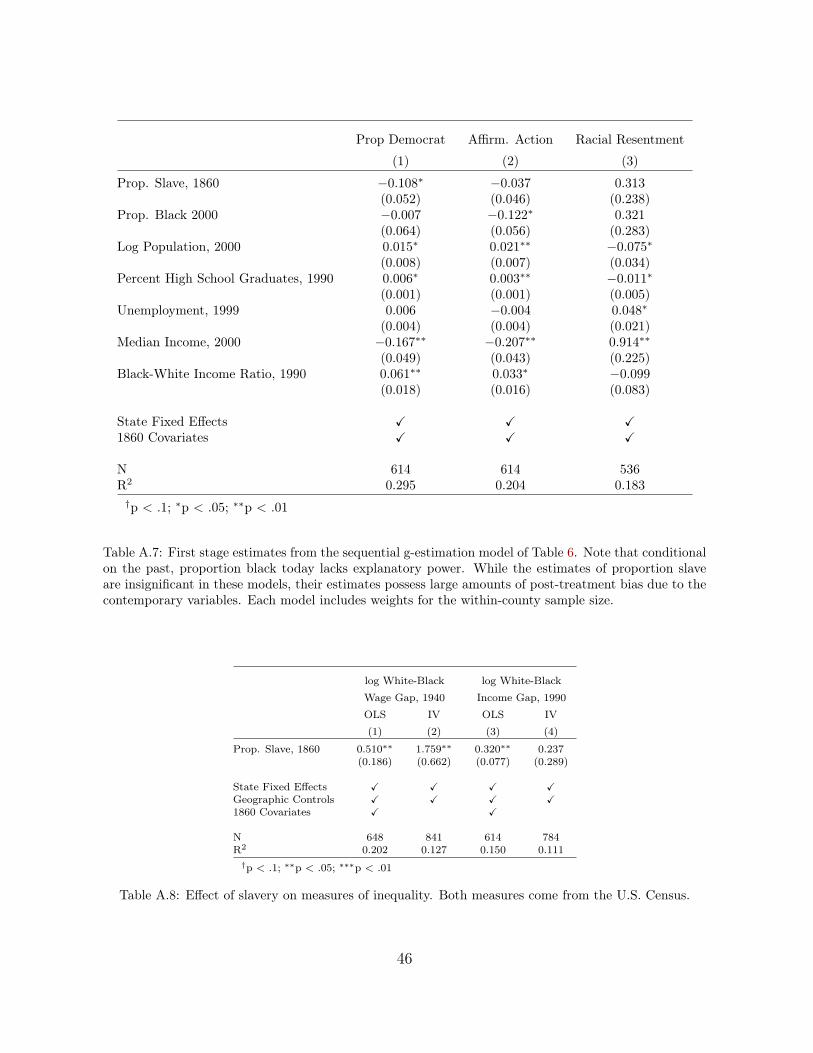
Prop Democrat Affirm. Action Racial Resentment
(1) (2) (3)
Prop. Slave, 1860 −0.108∗ −0.037 0.313(0.052) (0.046) (0.238)
Prop. Black 2000 −0.007 −0.122∗ 0.321(0.064) (0.056) (0.283)
Log Population, 2000 0.015∗ 0.021∗∗ −0.075∗(0.008) (0.007) (0.034)
Percent High School Graduates, 1990 0.006∗ 0.003∗∗ −0.011∗(0.001) (0.001) (0.005)
Unemployment, 1999 0.006 −0.004 0.048∗(0.004) (0.004) (0.021)
Median Income, 2000 −0.167∗∗ −0.207∗∗ 0.914∗∗(0.049) (0.043) (0.225)
Black-White Income Ratio, 1990 0.061∗∗ 0.033∗ −0.099(0.018) (0.016) (0.083)
State Fixed Effects X X X1860 Covariates X X X
N 614 614 536R2 0.295 0.204 0.183†p < .1; ∗p < .05; ∗∗p < .01
Table A.7: First stage estimates from the sequential g-estimation model of Table 6. Note that conditionalon the past, proportion black today lacks explanatory power. While the estimates of proportion slaveare insignificant in these models, their estimates possess large amounts of post-treatment bias due to thecontemporary variables. Each model includes weights for the within-county sample size.
log White-Black log White-Black
Wage Gap, 1940 Income Gap, 1990
OLS IV OLS IV
(1) (2) (3) (4)
Prop. Slave, 1860 0.510∗∗ 1.759∗∗ 0.320∗∗ 0.237(0.186) (0.662) (0.077) (0.289)
State Fixed Effects X X X XGeographic Controls X X X X1860 Covariates X X
N 648 841 614 784R2 0.202 0.127 0.150 0.111†p < .1; ∗∗p < .05; ∗∗∗p < .01
Table A.8: Effect of slavery on measures of inequality. Both measures come from the U.S. Census.
46
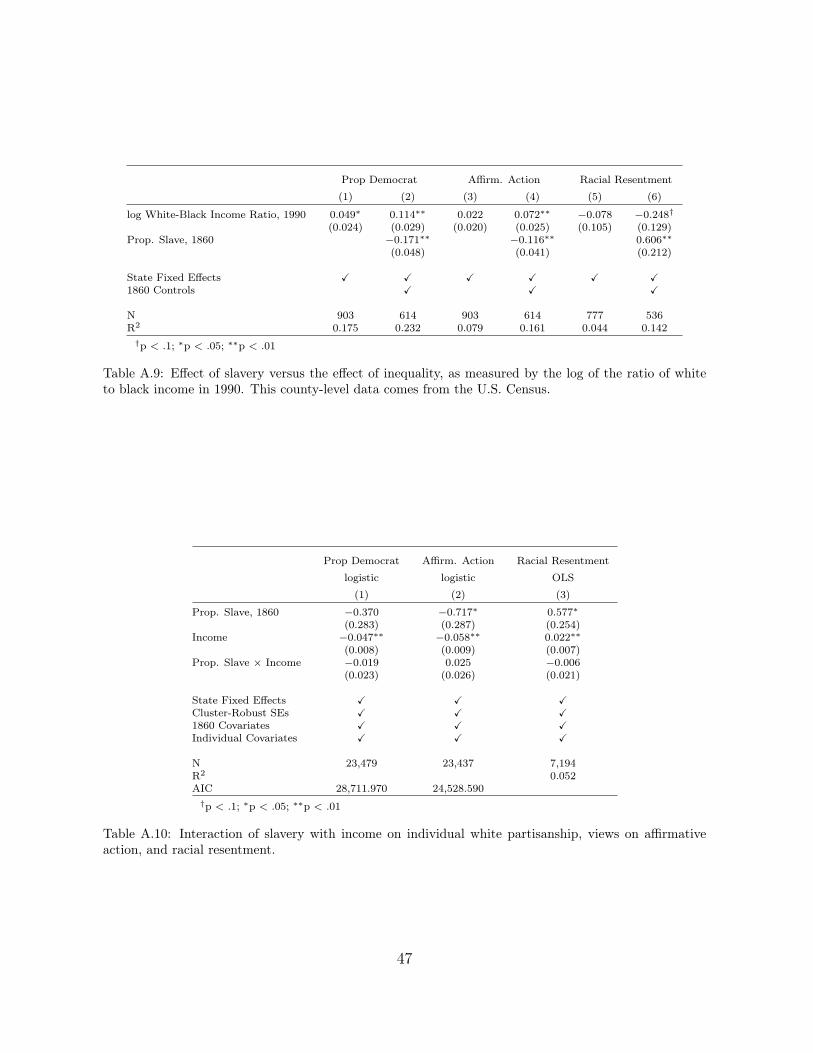
Prop Democrat Affirm. Action Racial Resentment
(1) (2) (3) (4) (5) (6)
log White-Black Income Ratio, 1990 0.049∗ 0.114∗∗ 0.022 0.072∗∗ −0.078 −0.248†(0.024) (0.029) (0.020) (0.025) (0.105) (0.129)
Prop. Slave, 1860 −0.171∗∗ −0.116∗∗ 0.606∗∗(0.048) (0.041) (0.212)
State Fixed Effects X X X X X X1860 Controls X X X
N 903 614 903 614 777 536R2 0.175 0.232 0.079 0.161 0.044 0.142†p < .1; ∗p < .05; ∗∗p < .01
Table A.9: Effect of slavery versus the effect of inequality, as measured by the log of the ratio of whiteto black income in 1990. This county-level data comes from the U.S. Census.
Prop Democrat Affirm. Action Racial Resentment
logistic logistic OLS
(1) (2) (3)
Prop. Slave, 1860 −0.370 −0.717∗ 0.577∗(0.283) (0.287) (0.254)
Income −0.047∗∗ −0.058∗∗ 0.022∗∗(0.008) (0.009) (0.007)
Prop. Slave × Income −0.019 0.025 −0.006(0.023) (0.026) (0.021)
State Fixed Effects X X XCluster-Robust SEs X X X1860 Covariates X X XIndividual Covariates X X X
N 23,479 23,437 7,194R2 0.052AIC 28,711.970 24,528.590†p < .1; ∗p < .05; ∗∗p < .01
Table A.10: Interaction of slavery with income on individual white partisanship, views on affirmativeaction, and racial resentment.
47
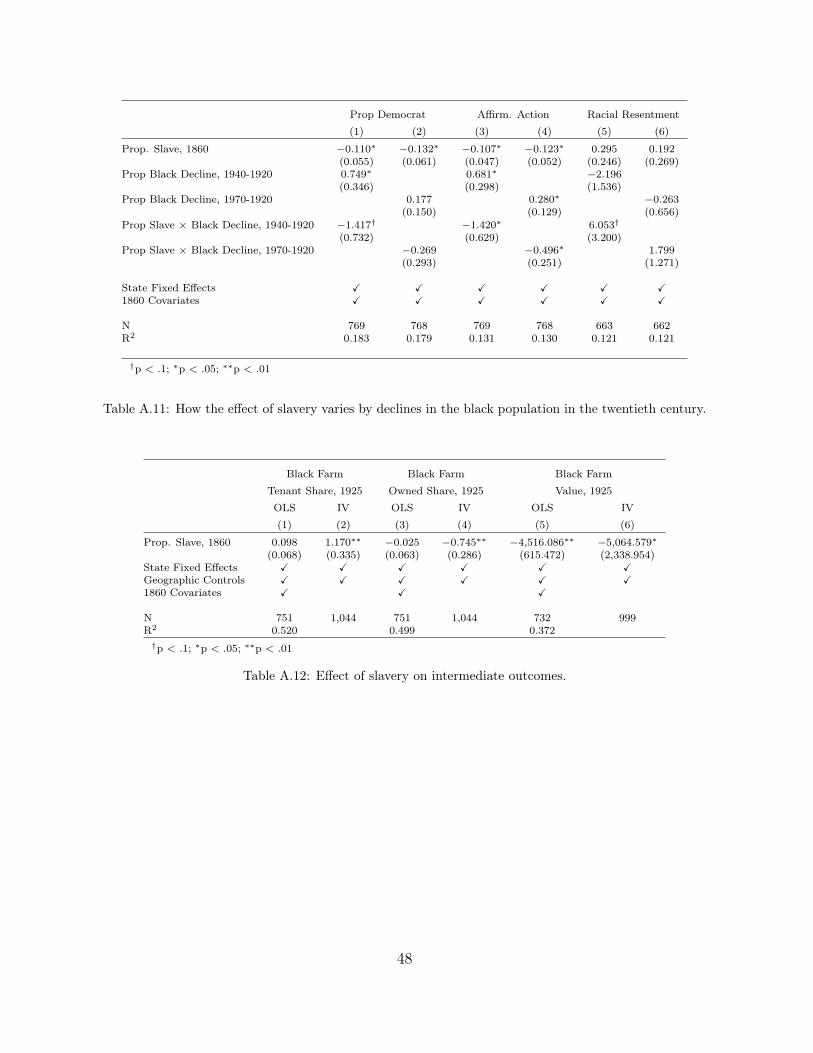
Prop Democrat Affirm. Action Racial Resentment
(1) (2) (3) (4) (5) (6)
Prop. Slave, 1860 −0.110∗ −0.132∗ −0.107∗ −0.123∗ 0.295 0.192(0.055) (0.061) (0.047) (0.052) (0.246) (0.269)
Prop Black Decline, 1940-1920 0.749∗ 0.681∗ −2.196(0.346) (0.298) (1.536)
Prop Black Decline, 1970-1920 0.177 0.280∗ −0.263(0.150) (0.129) (0.656)
Prop Slave × Black Decline, 1940-1920 −1.417† −1.420∗ 6.053†(0.732) (0.629) (3.200)
Prop Slave × Black Decline, 1970-1920 −0.269 −0.496∗ 1.799(0.293) (0.251) (1.271)
State Fixed Effects X X X X X X1860 Covariates X X X X X X
N 769 768 769 768 663 662R2 0.183 0.179 0.131 0.130 0.121 0.121
†p < .1; ∗p < .05; ∗∗p < .01
Table A.11: How the effect of slavery varies by declines in the black population in the twentieth century.
Black Farm Black Farm Black Farm
Tenant Share, 1925 Owned Share, 1925 Value, 1925
OLS IV OLS IV OLS IV
(1) (2) (3) (4) (5) (6)
Prop. Slave, 1860 0.098 1.170∗∗ −0.025 −0.745∗∗ −4,516.086∗∗ −5,064.579∗(0.068) (0.335) (0.063) (0.286) (615.472) (2,338.954)
State Fixed Effects X X X X X XGeographic Controls X X X X X X1860 Covariates X X X
N 751 1,044 751 1,044 732 999R2 0.520 0.499 0.372†p < .1; ∗p < .05; ∗∗p < .01
Table A.12: Effect of slavery on intermediate outcomes.
48
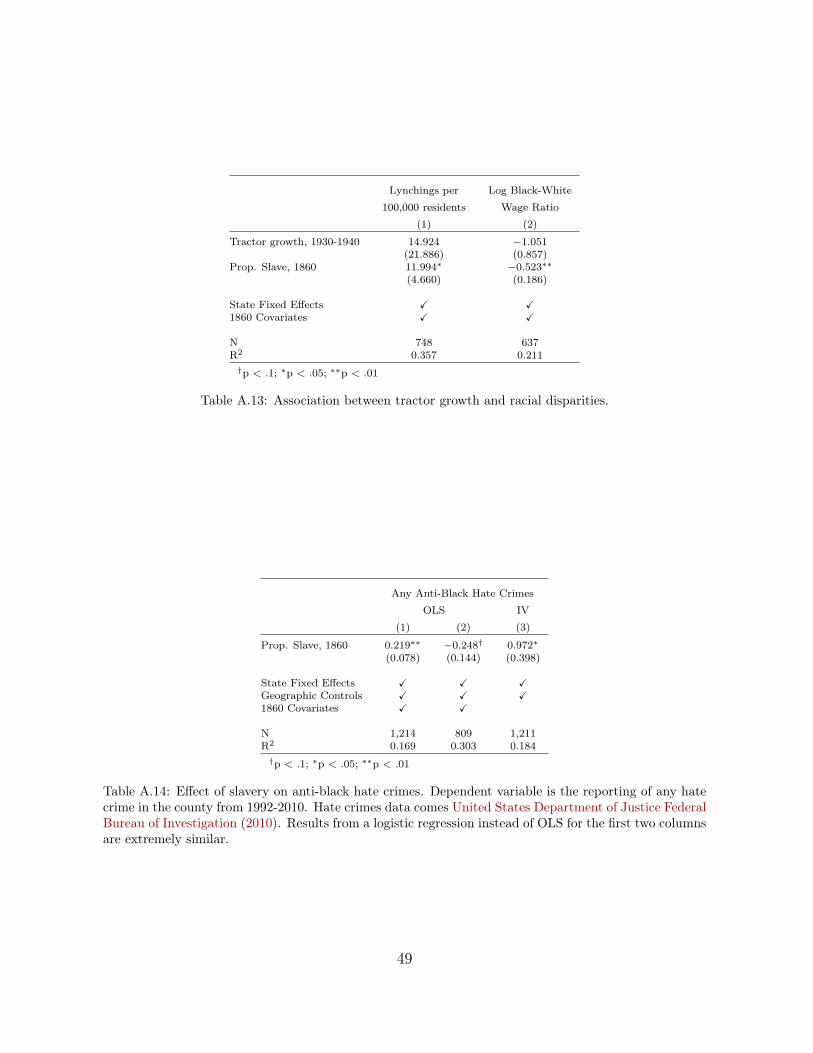
Lynchings per Log Black-White
100,000 residents Wage Ratio
(1) (2)
Tractor growth, 1930-1940 14.924 −1.051(21.886) (0.857)
Prop. Slave, 1860 11.994∗ −0.523∗∗(4.660) (0.186)
State Fixed Effects X X1860 Covariates X X
N 748 637R2 0.357 0.211†p < .1; ∗p < .05; ∗∗p < .01
Table A.13: Association between tractor growth and racial disparities.
Any Anti-Black Hate Crimes
OLS IV
(1) (2) (3)
Prop. Slave, 1860 0.219∗∗ −0.248† 0.972∗(0.078) (0.144) (0.398)
State Fixed Effects X X XGeographic Controls X X X1860 Covariates X X
N 1,214 809 1,211R2 0.169 0.303 0.184†p < .1; ∗p < .05; ∗∗p < .01
Table A.14: Effect of slavery on anti-black hate crimes. Dependent variable is the reporting of any hatecrime in the county from 1992-2010. Hate crimes data comes United States Department of Justice FederalBureau of Investigation (2010). Results from a logistic regression instead of OLS for the first two columnsare extremely similar.
49
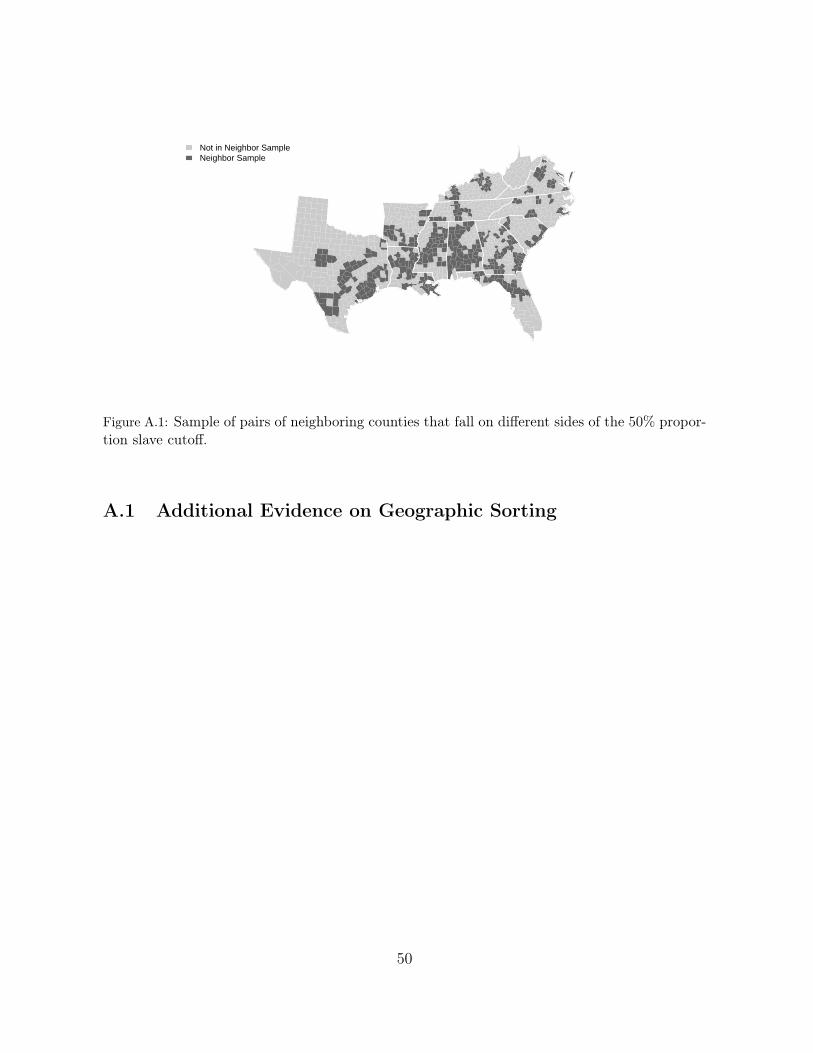
Not in Neighbor SampleNeighbor Sample
Figure A.1: Sample of pairs of neighboring counties that fall on different sides of the 50% propor-tion slave cutoff.
A.1 Additional Evidence on Geographic Sorting
50
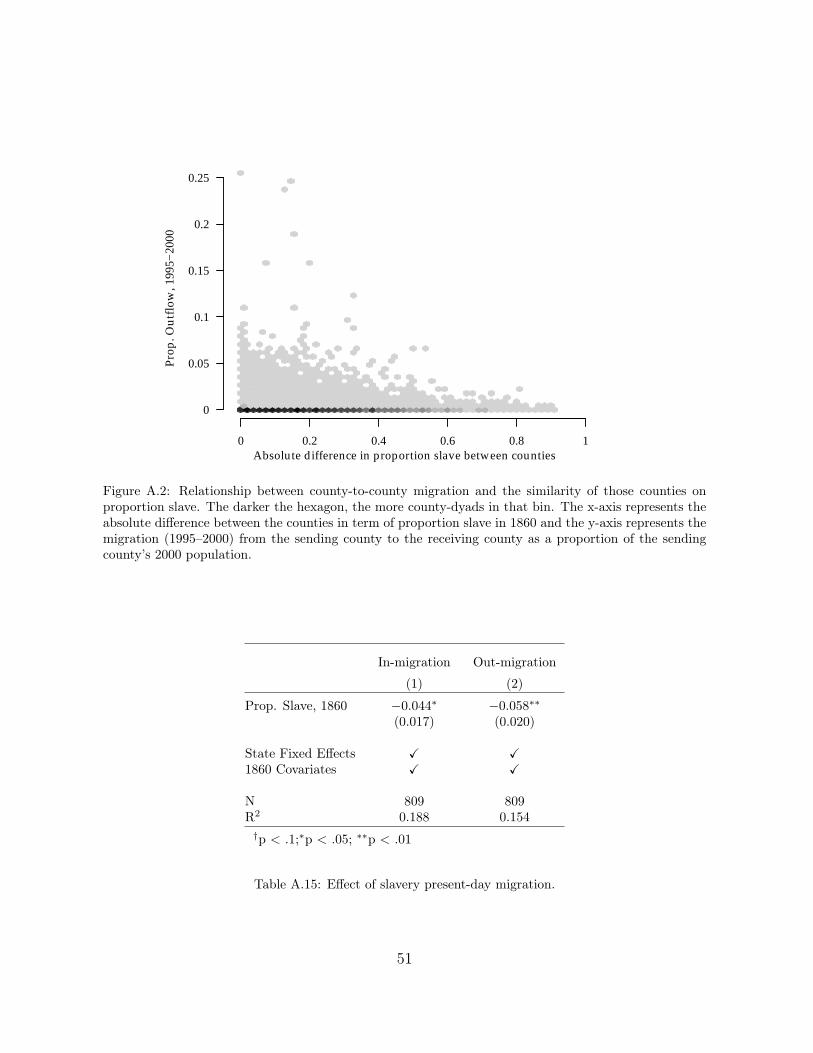
0 0.2 0.4 0.6 0.8 1
0
0.05
0.1
0.15
0.2
0.25
Absolute difference in proportion slave between counties
Prop
. Out
flow
, 199
5−20
00
Figure A.2: Relationship between county-to-county migration and the similarity of those counties onproportion slave. The darker the hexagon, the more county-dyads in that bin. The x-axis represents theabsolute difference between the counties in term of proportion slave in 1860 and the y-axis represents themigration (1995–2000) from the sending county to the receiving county as a proportion of the sendingcounty’s 2000 population.
In-migration Out-migration
(1) (2)
Prop. Slave, 1860 −0.044∗ −0.058∗∗(0.017) (0.020)
State Fixed Effects X X1860 Covariates X X
N 809 809R2 0.188 0.154†p < .1;∗p < .05; ∗∗p < .01
Table A.15: Effect of slavery present-day migration.
51
Related Documents