The Physical Environment of Susquehanna Flats Larry Sanford In collaboration with Cassie Gurbisz, Steve Suttles, Michael Kemp, Cindy Palinkas, Jeff Cornwell, Nick Nidzieko, Debbie Hinkle, Angela Cole, Jia Gao, and Alex Fisher UMCES, Horn Point Laboratory Cambridge, MD [email protected]

Welcome message from author
This document is posted to help you gain knowledge. Please leave a comment to let me know what you think about it! Share it to your friends and learn new things together.
Transcript
The Physical Environment of Susquehanna Flats
Larry Sanford
In collaboration with Cassie Gurbisz, Steve Suttles, Michael Kemp, Cindy Palinkas, Jeff Cornwell, Nick Nidzieko, Debbie Hinkle, Angela Cole, Jia Gao, and
Alex Fisher
UMCES, Horn Point LaboratoryCambridge, [email protected]
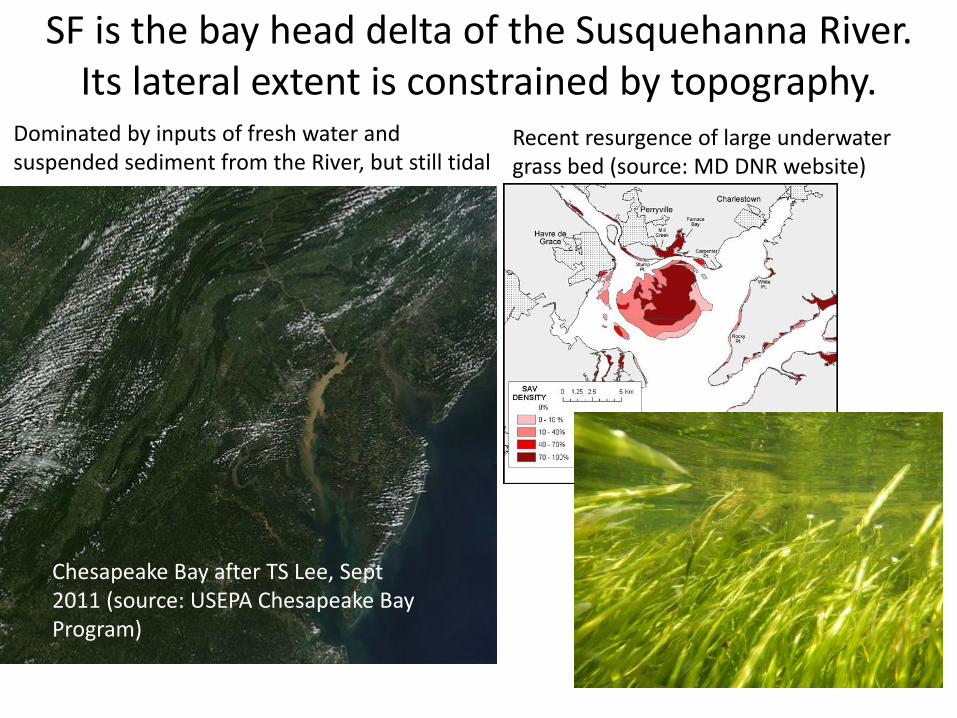
SF is the bay head delta of the Susquehanna River. Its lateral extent is constrained by topography.
Dominated by inputs of fresh water and suspended sediment from the River, but still tidal
Chesapeake Bay after TS Lee, Sept 2011 (source: USEPA Chesapeake Bay Program)
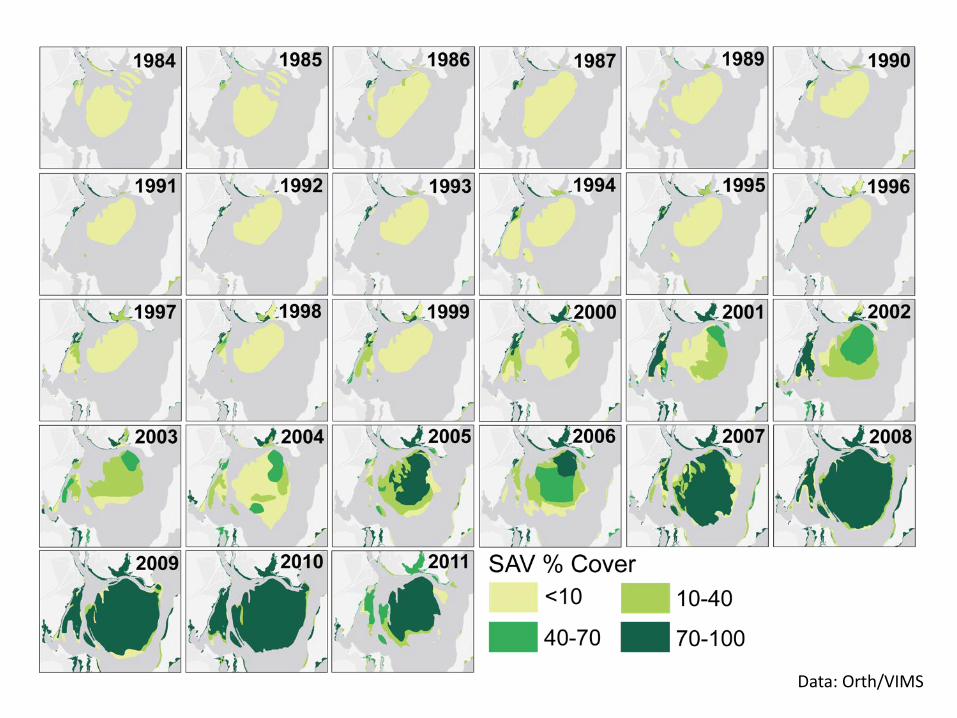
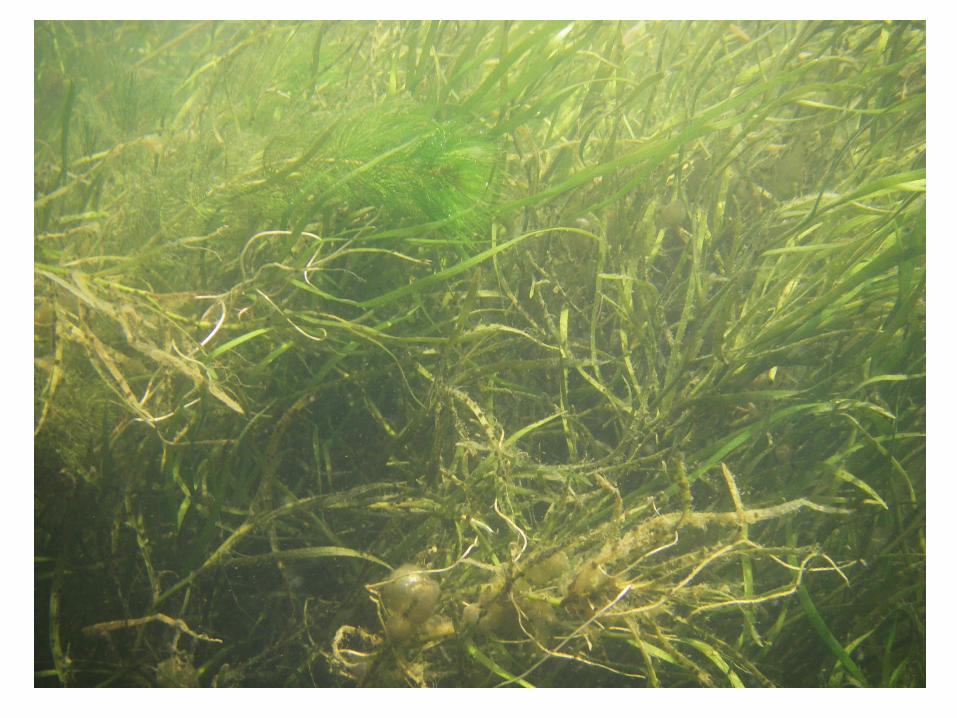
Recent resurgence of large underwater grass bed (source: MD DNR website)
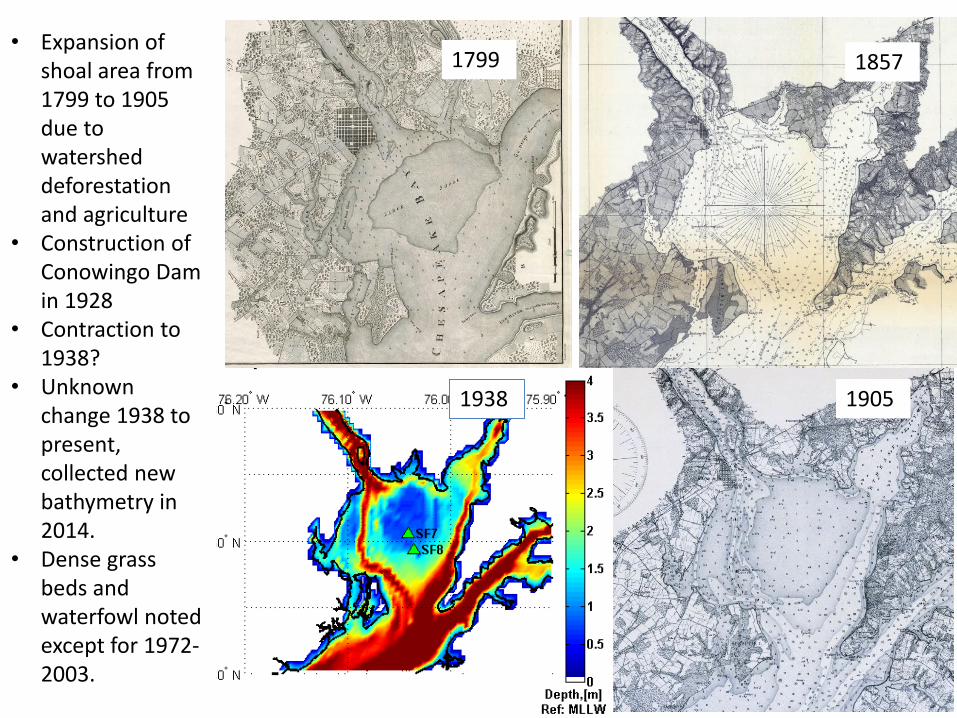
1938
• Expansion of shoal area from 1799 to 1905 due to watershed deforestation and agriculture
• Construction of Conowingo Dam in 1928
• Contraction to 1938?
• Unknown change 1938 to present, collected new bathymetry in 2014.
• Dense grass beds and waterfowl noted except for 1972-2003.
1905
18571799
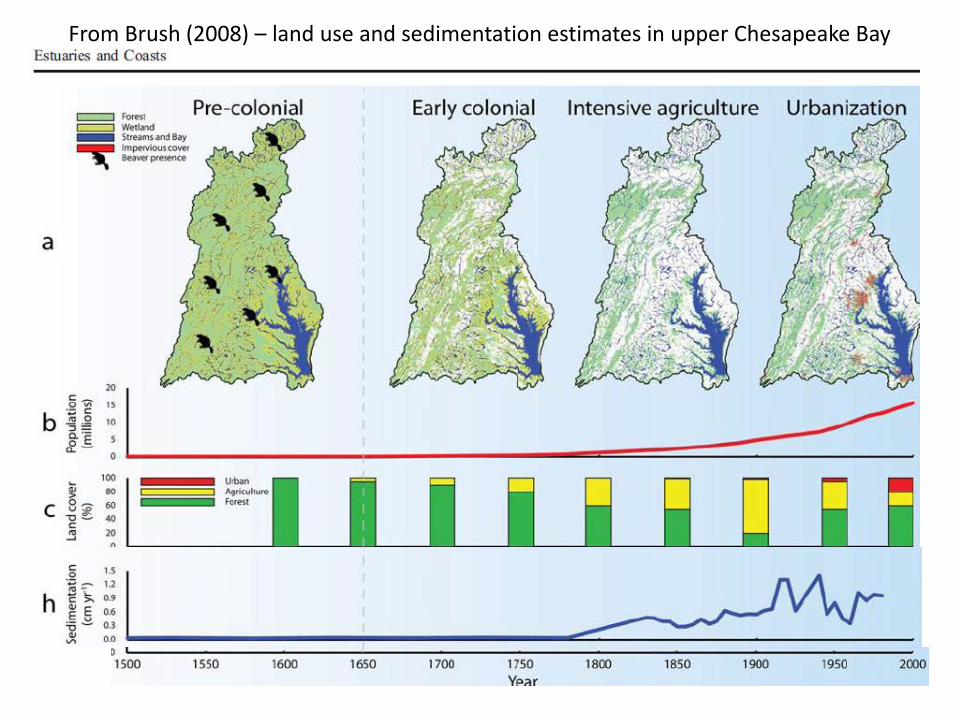
From Brush (2008) – land use and sedimentation estimates in upper Chesapeake Bay
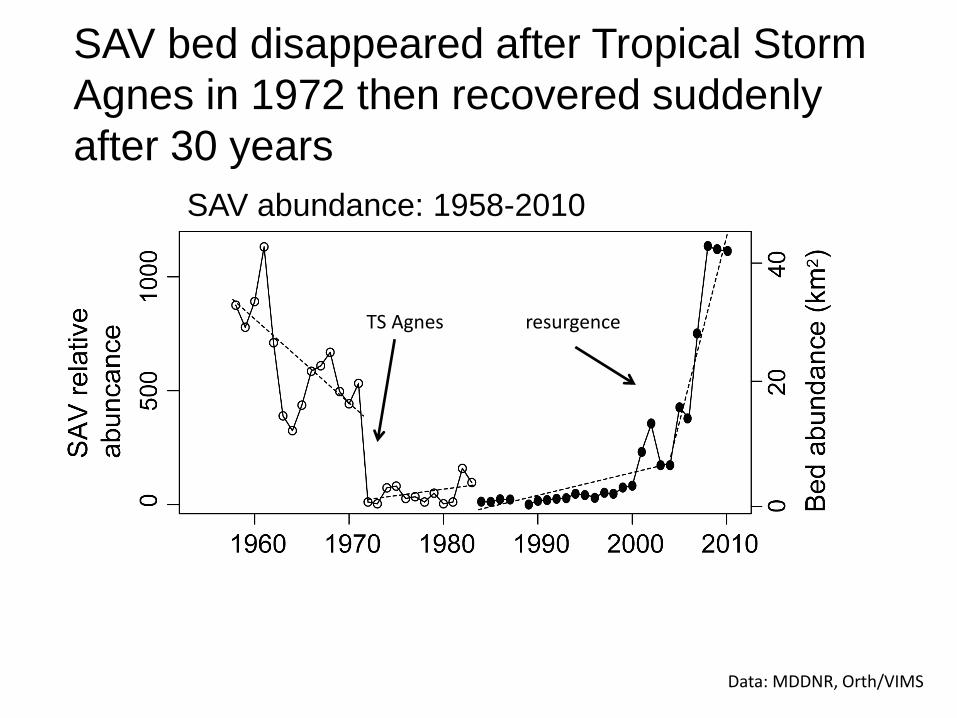
SAV bed disappeared after Tropical Storm
Agnes in 1972 then recovered suddenly
after 30 years
Data: MDDNR, Orth/VIMS
SAV abundance: 1958-2010
TS Agnes resurgence
SAV bed disappeared after Agnes then
recovered suddenly after 30 years
Data: Orth/VIMS
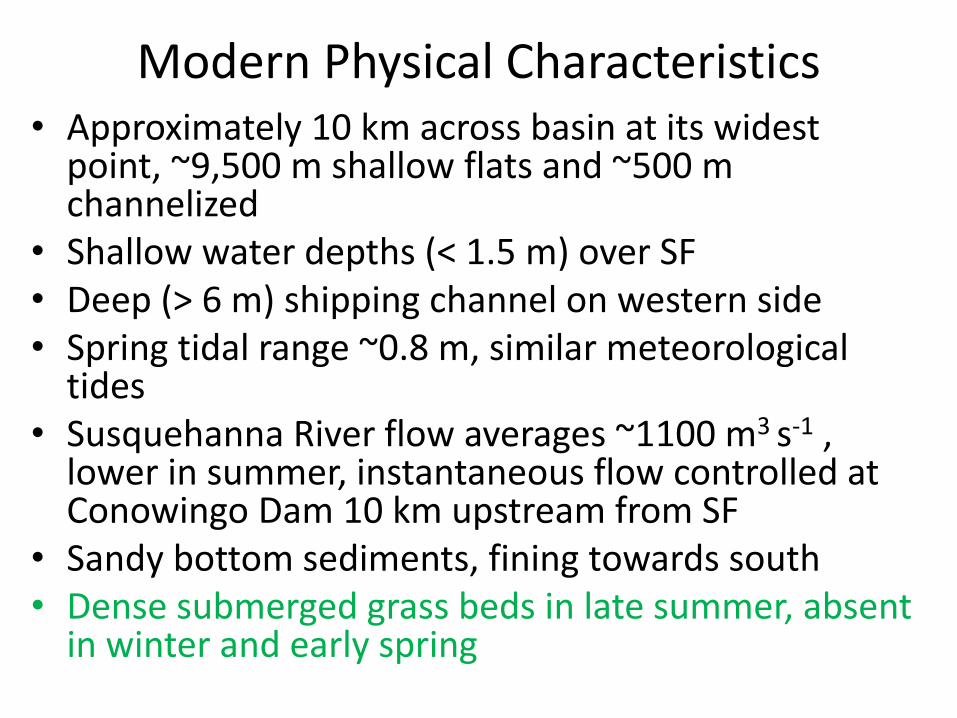
Modern Physical Characteristics• Approximately 10 km across basin at its widest
point, ~9,500 m shallow flats and ~500 m channelized
• Shallow water depths (< 1.5 m) over SF• Deep (> 6 m) shipping channel on western side• Spring tidal range ~0.8 m, similar meteorological
tides• Susquehanna River flow averages ~1100 m3 s-1 ,
lower in summer, instantaneous flow controlled at Conowingo Dam 10 km upstream from SF
• Sandy bottom sediments, fining towards south• Dense submerged grass beds in late summer, absent
in winter and early spring
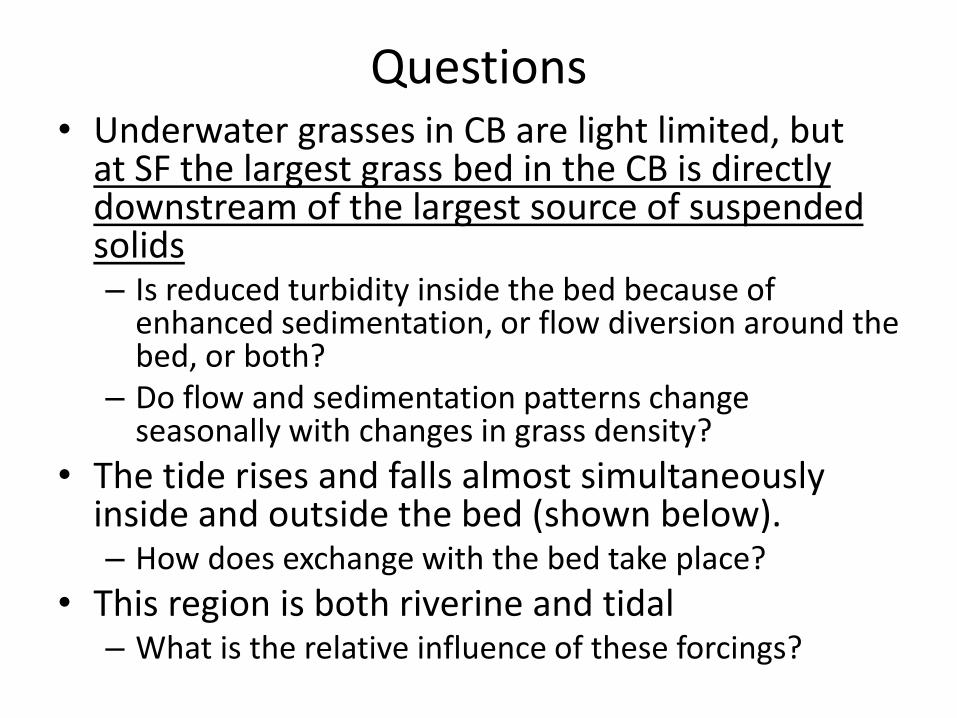
Questions• Underwater grasses in CB are light limited, but
at SF the largest grass bed in the CB is directly downstream of the largest source of suspended solids– Is reduced turbidity inside the bed because of
enhanced sedimentation, or flow diversion around the bed, or both?
– Do flow and sedimentation patterns change seasonally with changes in grass density?
• The tide rises and falls almost simultaneously inside and outside the bed (shown below).– How does exchange with the bed take place?
• This region is both riverine and tidal– What is the relative influence of these forcings?

Now let’s look at some data
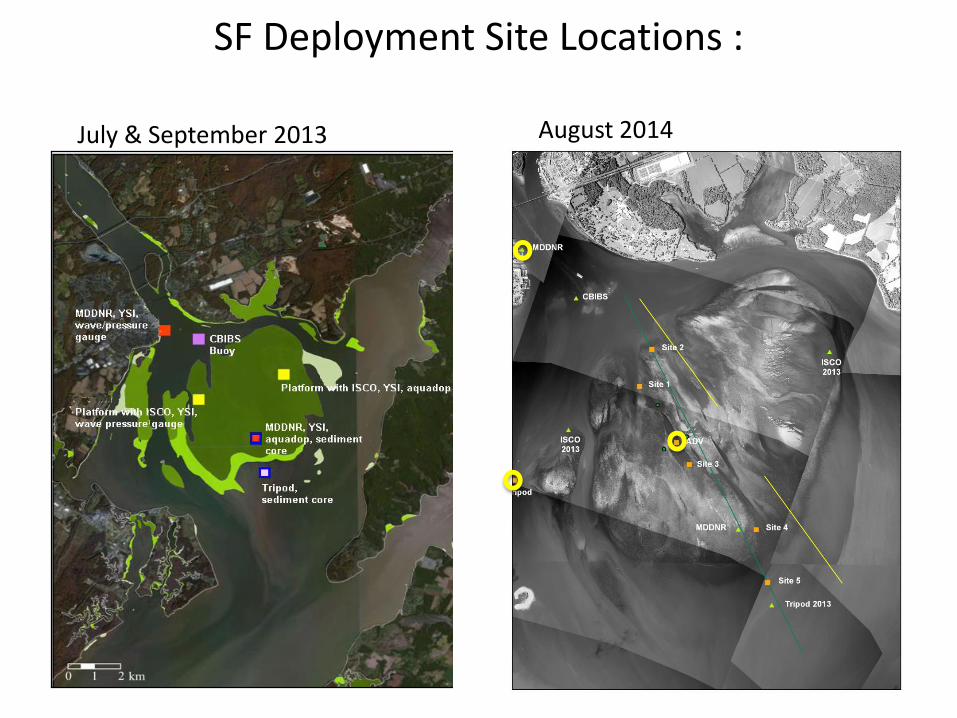
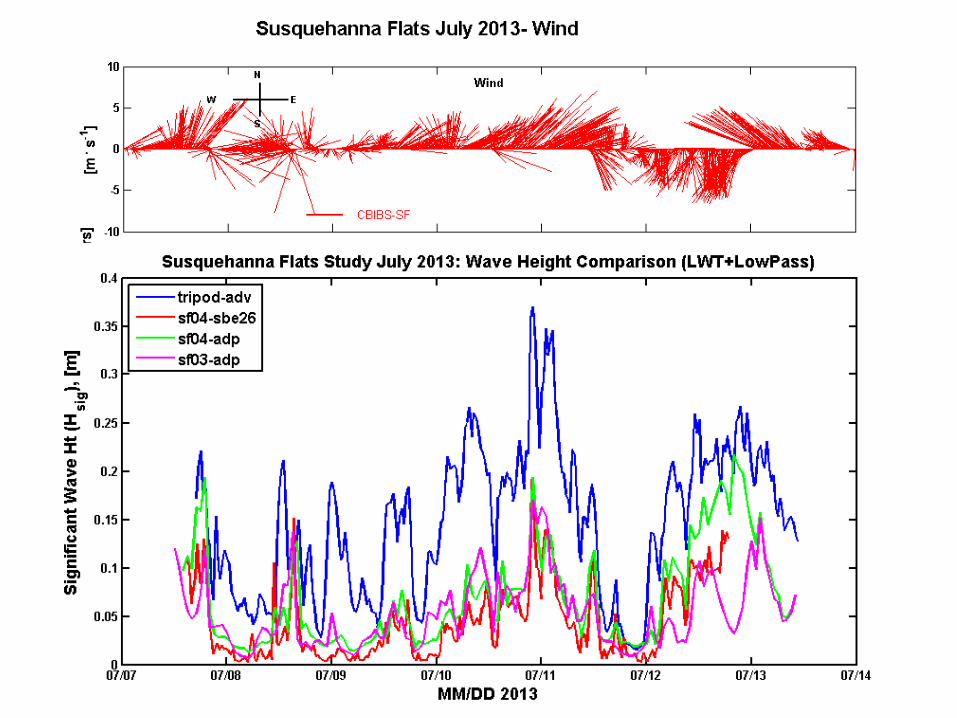
SF Deployment Site Locations :
sf04
sf03
sf07
July & September 2013 August 2014
2013 Observations
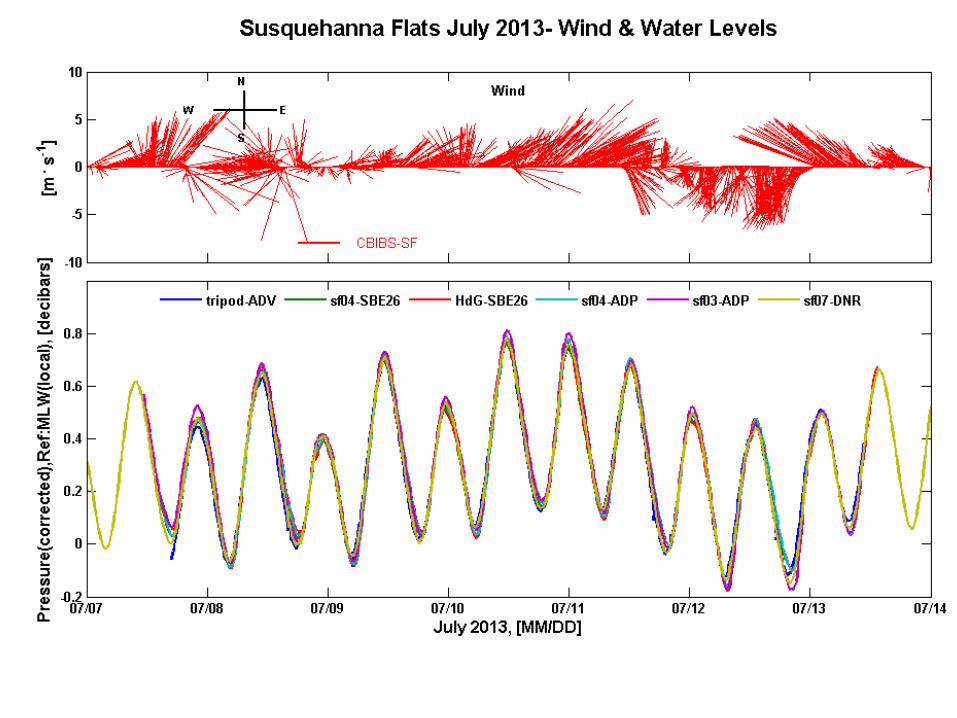
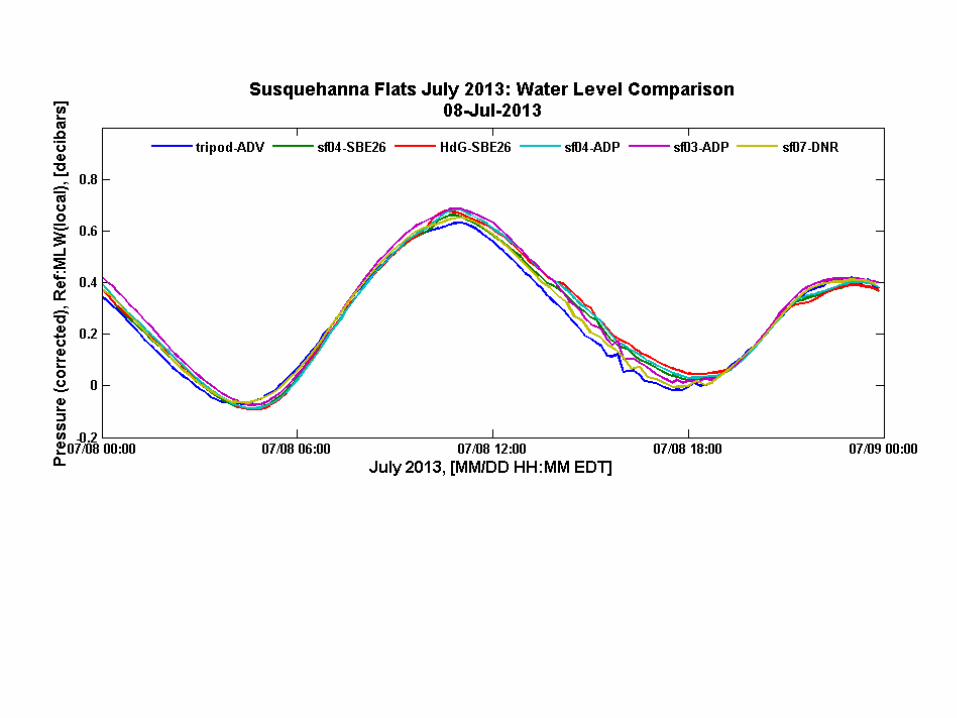
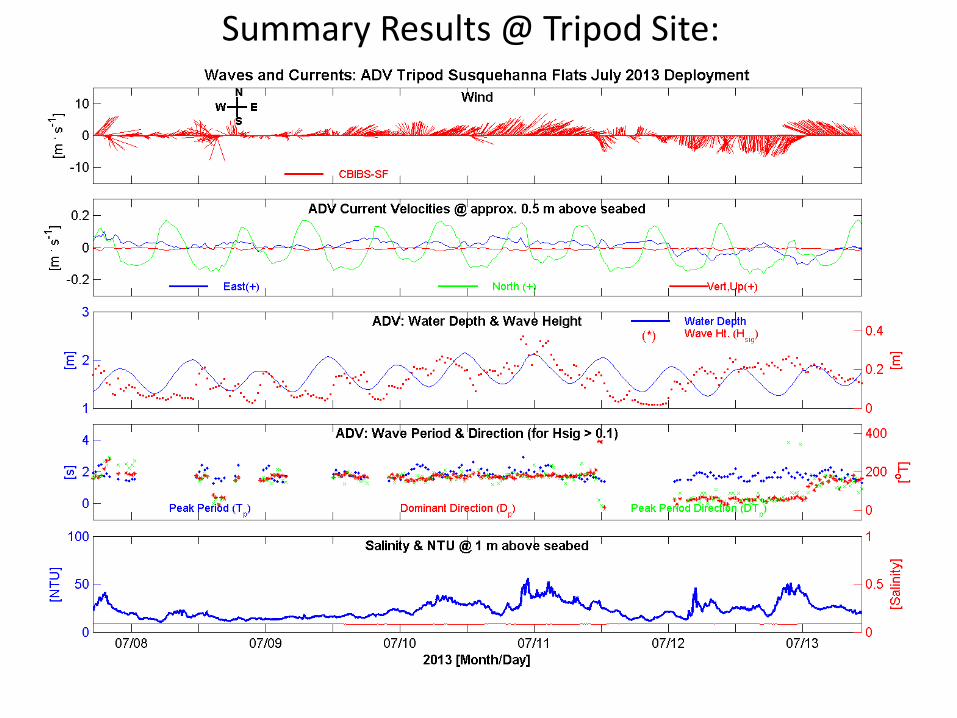
Summary Results @ Tripod Site:
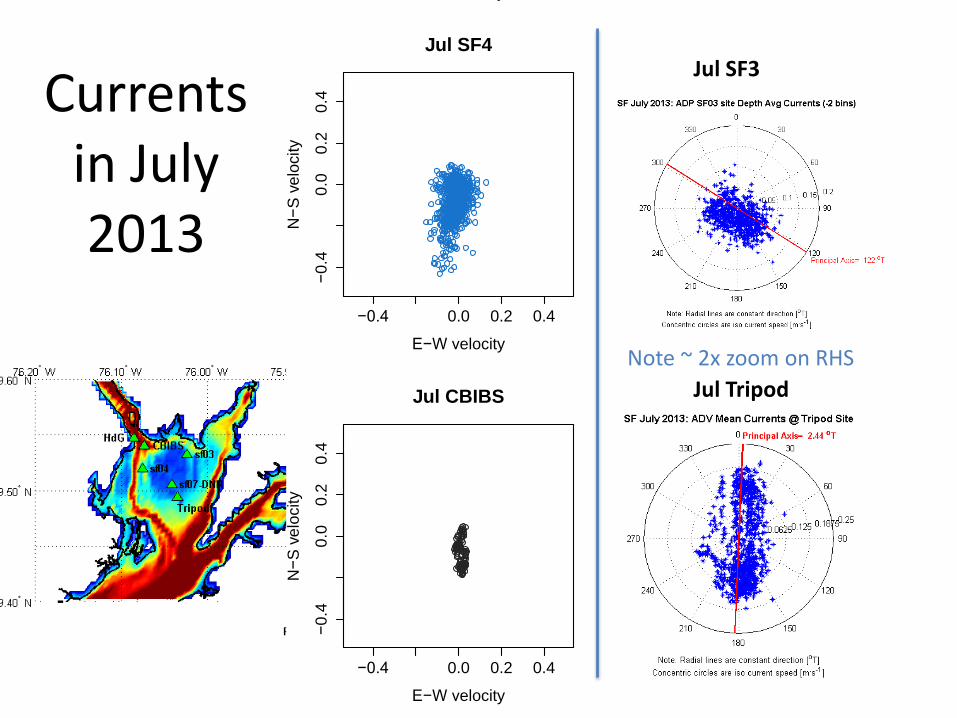
Currents in July 2013
−0.4 0.0 0.2 0.4
−0.4
0.0
0.2
0.4
Jul SF3
E−W velocity
N−
S v
elo
city
−0.4 0.0 0.2 0.4−
0.4
0.0
0.2
0.4
Jul SF4
E−W velocity
N−
S v
elo
city
−0.4 0.0 0.2 0.4
−0.4
0.0
0.2
0.4
Jul CBIBS
E−W velocity
N−
S v
elo
city
Jul SF3
Jul Tripod
Note ~ 2x zoom on RHS
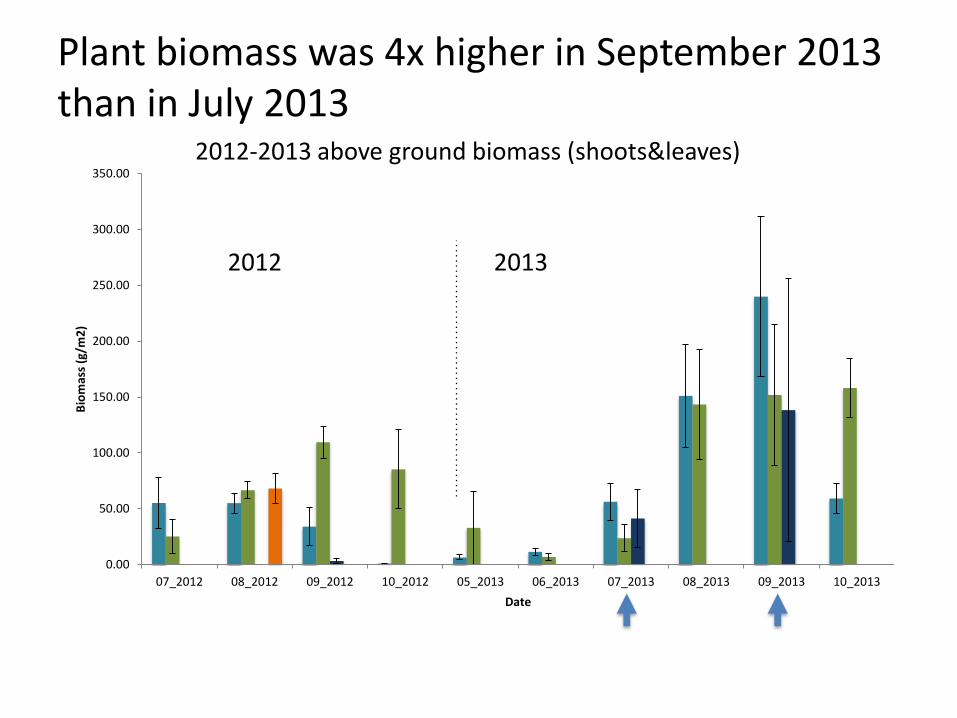
Plant biomass was 4x higher in September 2013 than in July 2013
0.00
50.00
100.00
150.00
200.00
250.00
300.00
350.00
07_2012 08_2012 09_2012 10_2012 05_2013 06_2013 07_2013 08_2013 09_2013 10_2013
Bio
mas
s (g
/m2
)
Date
2012-2013 above ground biomass (shoots&leaves)
2012 2013
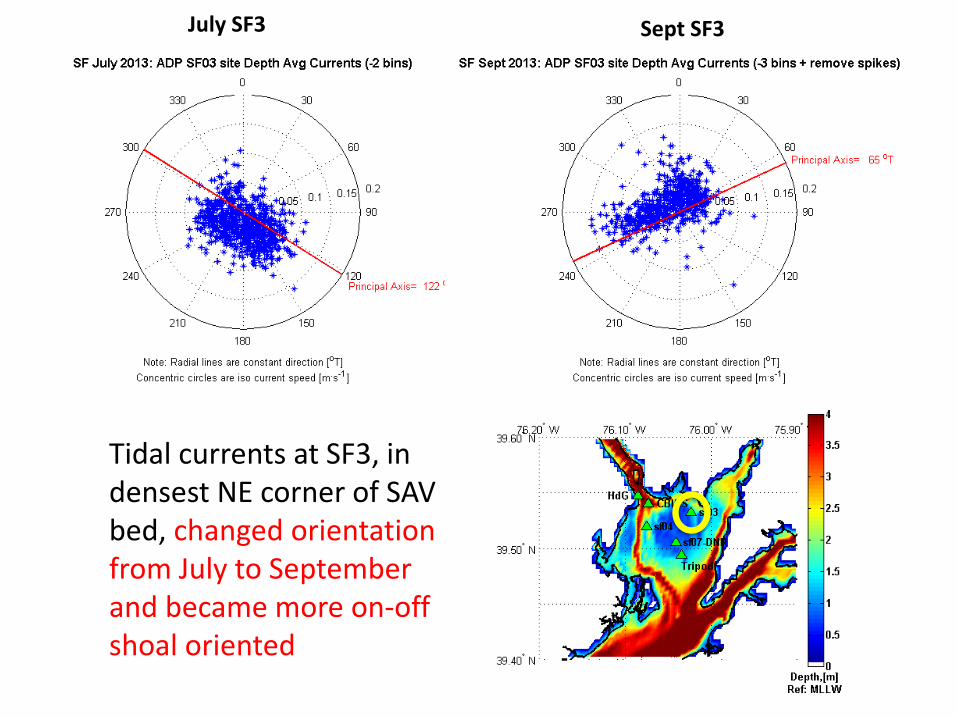
Tidal currents at SF3, in densest NE corner of SAV bed, changed orientation from July to September and became more on-off shoal oriented
July SF3 Sept SF3

2014 Observations
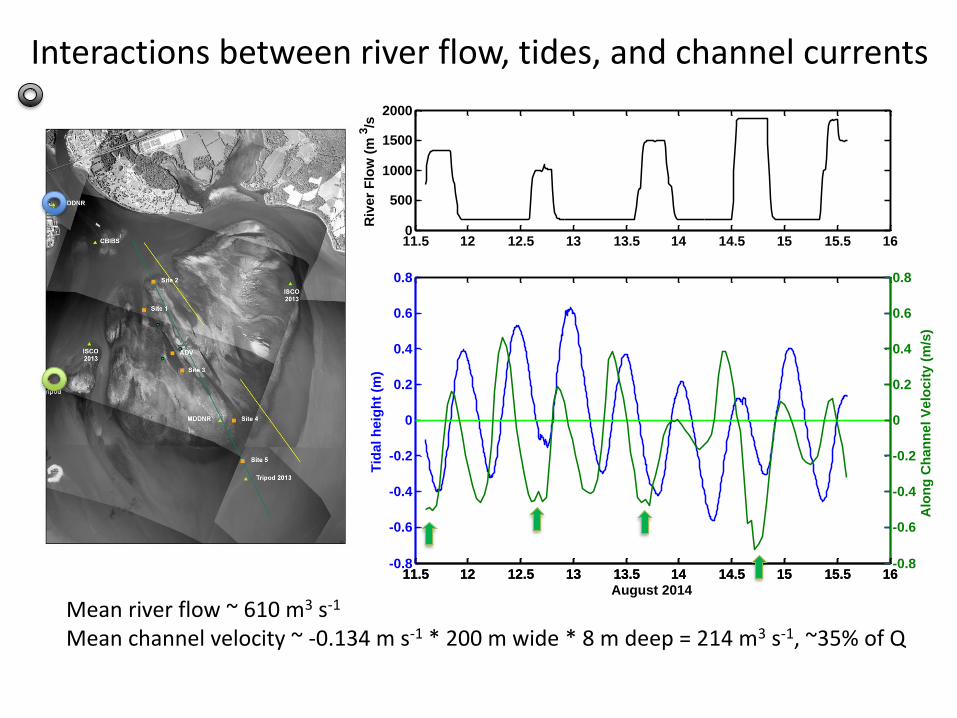
Interactions between river flow, tides, and channel currents
11.5 12 12.5 13 13.5 14 14.5 15 15.5 160
500
1000
1500
2000
Riv
er
Flo
w (
m3/s
11.5 12 12.5 13 13.5 14 14.5 15 15.5 16-0.8
-0.6
-0.4
-0.2
0
0.2
0.4
0.6
0.8
August 2014
Tid
al
he
igh
t (m
)
11.5 12 12.5 13 13.5 14 14.5 15 15.5 16-0.8
-0.6
-0.4
-0.2
0
0.2
0.4
0.6
0.8
Alo
ng
Ch
an
ne
l V
elo
cit
y (
m/s
)
Mean river flow ~ 610 m3 s-1
Mean channel velocity ~ -0.134 m s-1 * 200 m wide * 8 m deep = 214 m3 s-1, ~35% of Q
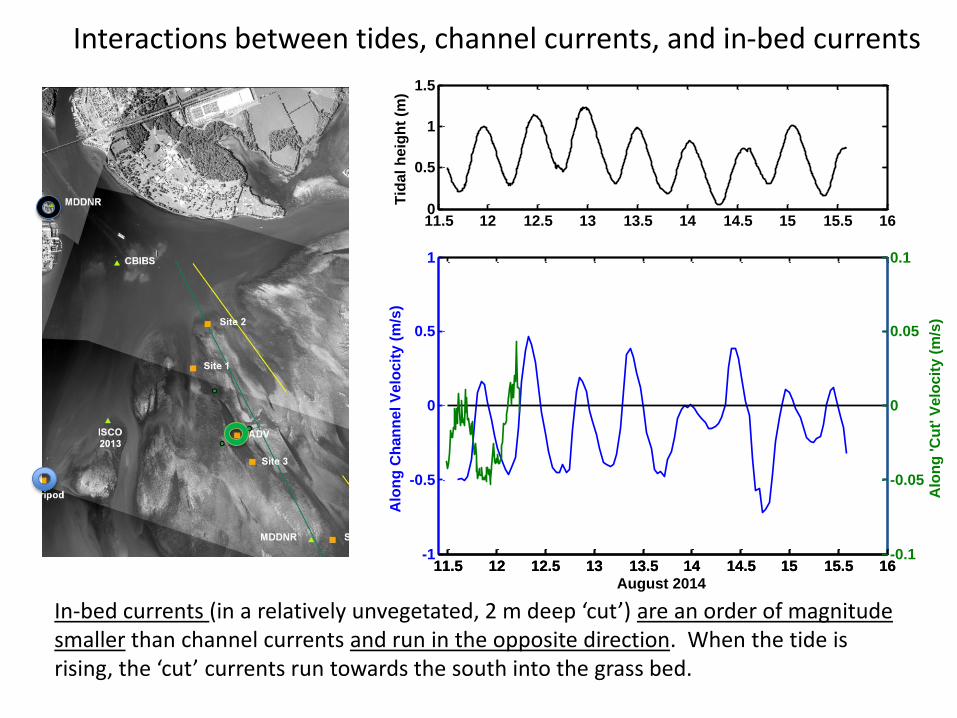
Interactions between tides, channel currents, and in-bed currents
11.5 12 12.5 13 13.5 14 14.5 15 15.5 160
0.5
1
1.5
Tid
al
he
igh
t (m
)
11.5 12 12.5 13 13.5 14 14.5 15 15.5 16-1
-0.5
0
0.5
1
August 2014
Alo
ng
Ch
an
ne
l V
elo
cit
y (
m/s
)
11.5 12 12.5 13 13.5 14 14.5 15 15.5 16-0.1
-0.05
0
0.05
0.1
Alo
ng
'C
ut' V
elo
cit
y (
m/s
)
In-bed currents (in a relatively unvegetated, 2 m deep ‘cut’) are an order of magnitude smaller than channel currents and run in the opposite direction. When the tide is rising, the ‘cut’ currents run towards the south into the grass bed.
Modeling efforts to date
• Simplified models to illustrate general behavior
• 1 model run as part of LSRWA effort (Steve Scott using CDH)
• Complex new grass resistance model under development by USGS Woods Hole (collaborative effort)
• Future grass ecosystem modeling by Cassie Gurbisz, geomorphological modeling by Matt Biddle (both MEES students at UMCES, Horn Point)
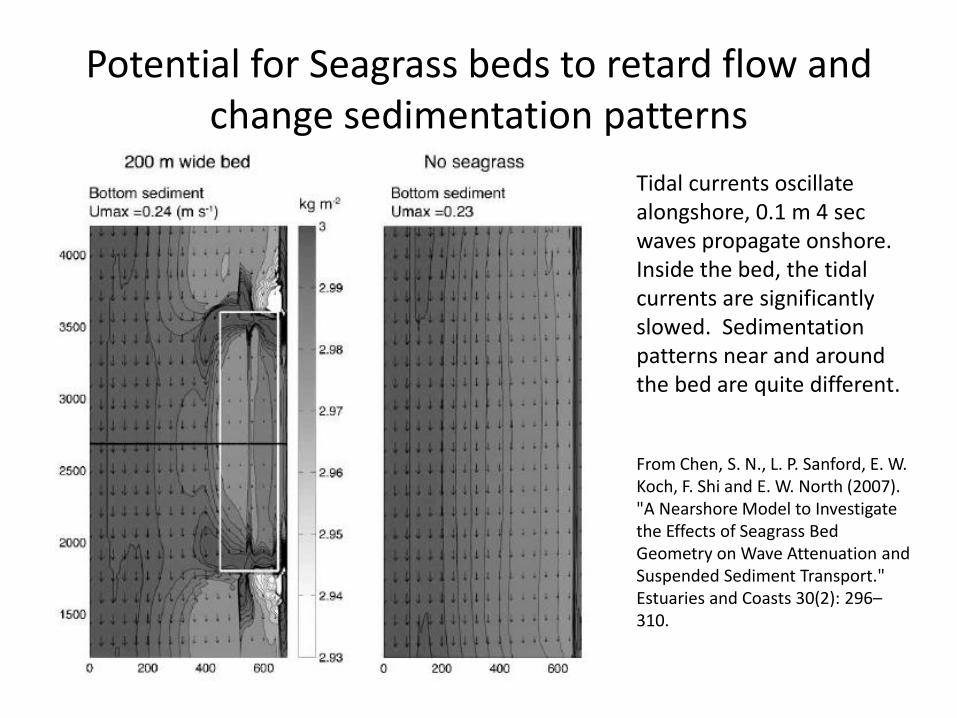
Potential for Seagrass beds to retard flow and change sedimentation patterns
Tidal currents oscillate alongshore, 0.1 m 4 sec waves propagate onshore. Inside the bed, the tidal currents are significantly slowed. Sedimentation patterns near and around the bed are quite different.
From Chen, S. N., L. P. Sanford, E. W. Koch, F. Shi and E. W. North (2007). "A Nearshore Model to Investigate the Effects of Seagrass Bed Geometry on Wave Attenuation and Suspended Sediment Transport." Estuaries and Coasts 30(2): 296–310.
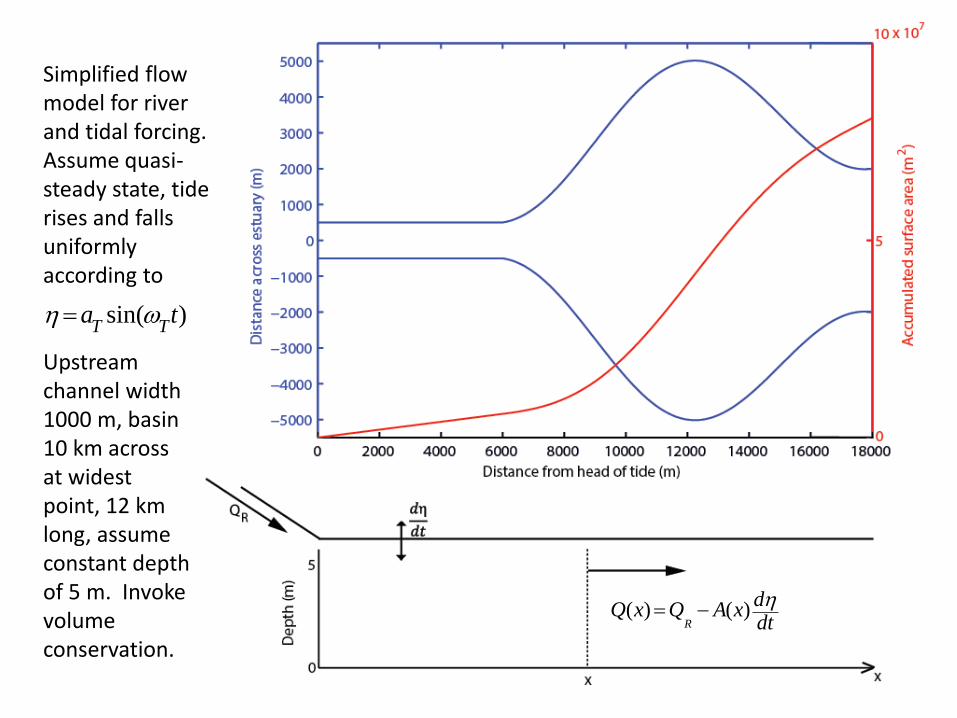
Simplified flow model for river and tidal forcing. Assume quasi-steady state, tide rises and falls uniformly according to
sin( )T T
a t
Upstream channel width 1000 m, basin 10 km across at widest point, 12 km long, assume constant depth of 5 m. Invoke volume conservation.
( ) ( )R
dQ x Q A x
dt
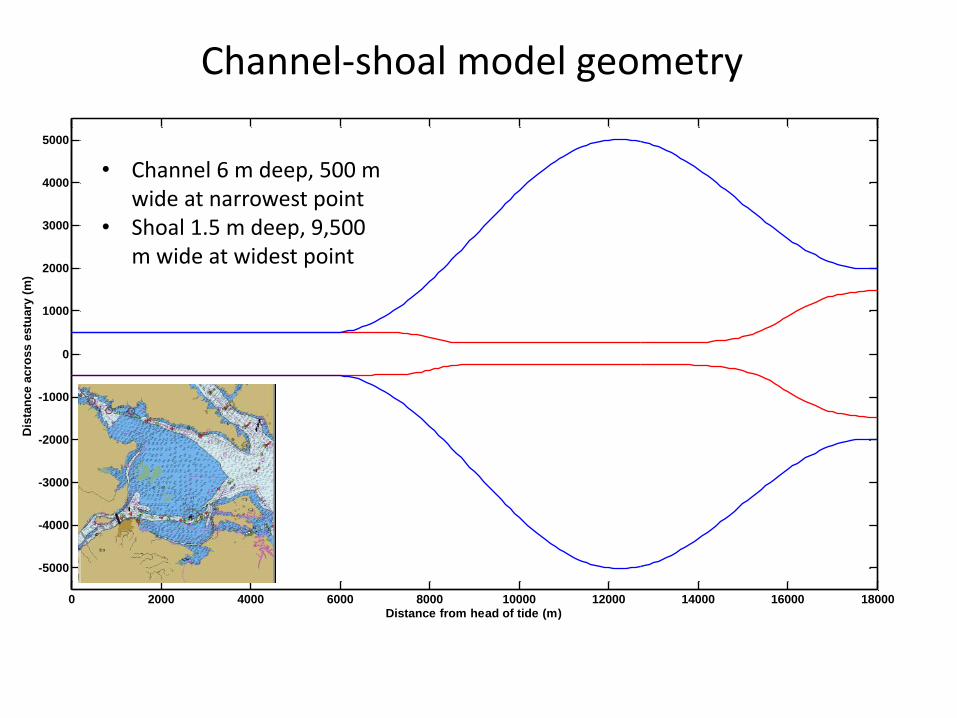
Channel-shoal model geometry
0 2000 4000 6000 8000 10000 12000 14000 16000 18000
-5000
-4000
-3000
-2000
-1000
0
1000
2000
3000
4000
5000
Distance from head of tide (m)
Dis
tan
ce
ac
ros
s e
stu
ary
(m
)
• Channel 6 m deep, 500 m wide at narrowest point
• Shoal 1.5 m deep, 9,500 m wide at widest point
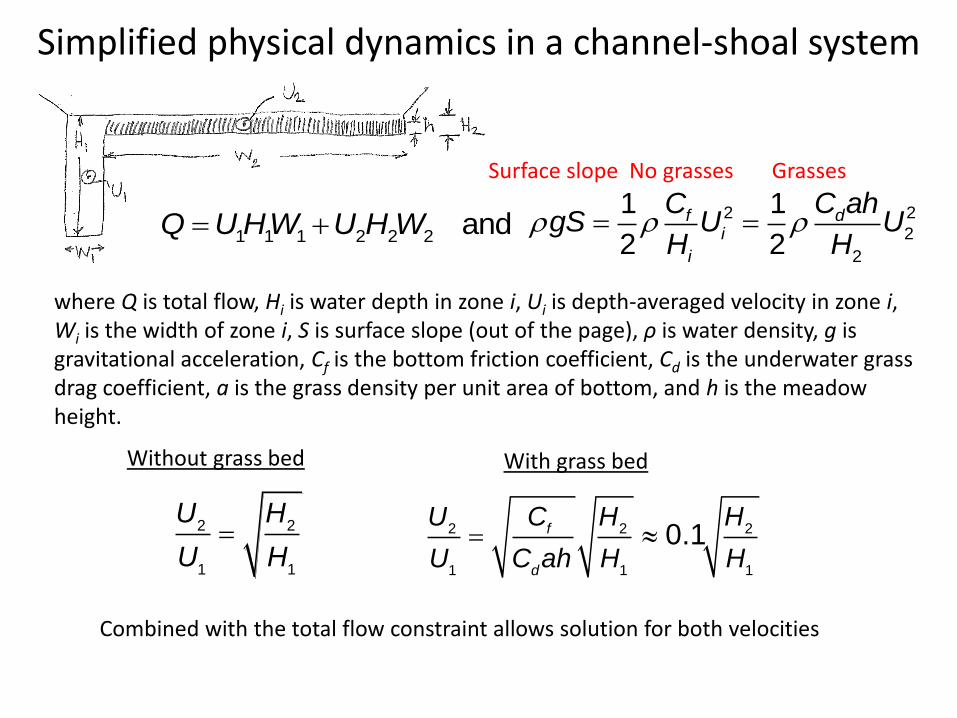
Simplified physical dynamics in a channel-shoal system
2 2
2
2
1 1
2 2df
i
i
C ahCgS U U
H H
where Q is total flow, Hi is water depth in zone i, Ui is depth-averaged velocity in zone i, Wi is the width of zone i, S is surface slope (out of the page), ρ is water density, g is gravitational acceleration, Cf is the bottom friction coefficient, Cd is the underwater grass drag coefficient, a is the grass density per unit area of bottom, and h is the meadow height.
1 1 1 2 2 2 andQ U HW U H W
2 2
1 1
U H
U H
Without grass bed
2 2 2
1 1 1
0.1f
d
U C H H
U C ah H H
With grass bed
Surface slope No grasses Grasses
Combined with the total flow constraint allows solution for both velocities
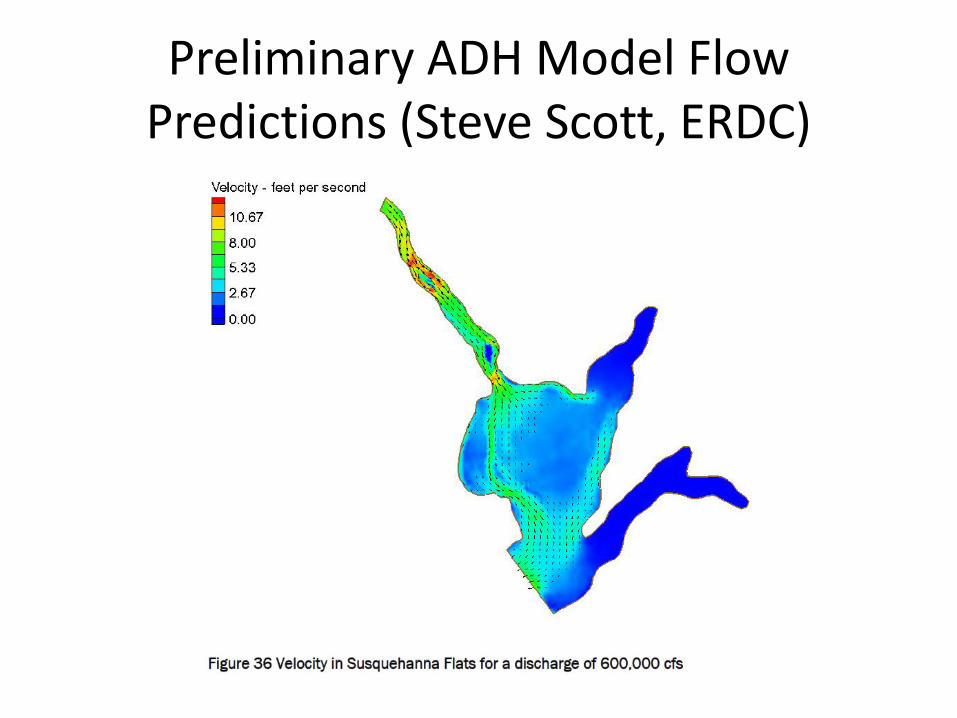
Preliminary ADH Model Flow Predictions (Steve Scott, ERDC)
Extreme River flows result in deposition on the shoals, but scour in
the channel
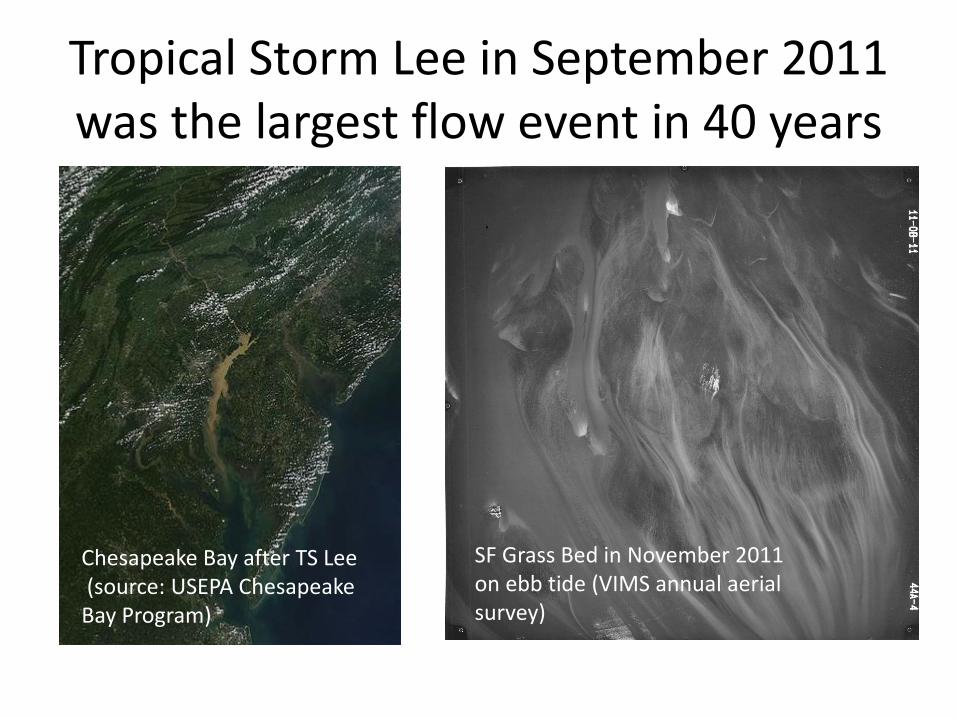
Tropical Storm Lee in September 2011 was the largest flow event in 40 years
Chesapeake Bay after TS Lee(source: USEPA Chesapeake
Bay Program)
SF Grass Bed in November 2011 on ebb tide (VIMS annual aerial survey)
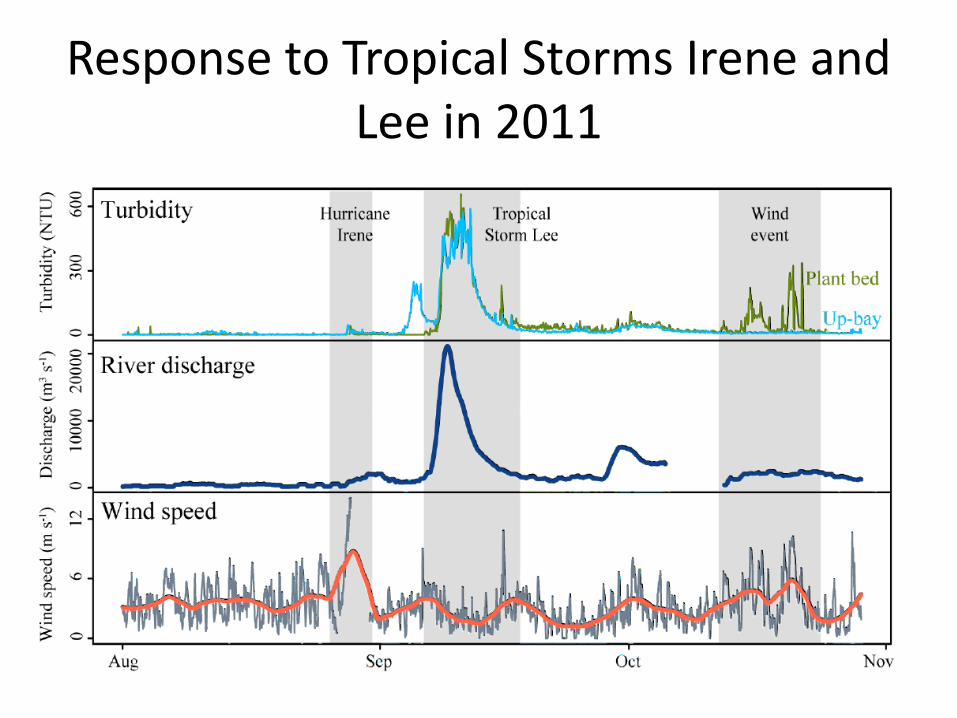
Response to Tropical Storms Irene and Lee in 2011
Conclusions (preliminary)• SF is a persistent feature at the head of CB
– varies in size and depth in response to sediment delivery– geomorphology constrained by surrounding topography– very important to ecology of upper CB
• Resurgent SF SAV bed has a strong influence on flow and sediment delivery– resists flow in proportion to grass density– diverts large proportion of flow around bed through channel(s)
• Shallow water dynamics control flow around and through the grass bed– flows into bed focused into less vegetated, slightly deeper ‘cuts’
• Tidal height differences across SF are small but likely dynamically important, need further investigation
• Episodic sediment delivery, seasonal flow blockage and waves appear to dominate turbidity fluctuations inside bed– dense grass beds result in greatly reduced turbidity, positive
feedbacks
Continuing work
• Additional coordinated hydrodynamic, geological, biogeochemical, and biological studies in 2015
• At least 1 MS thesis and 1 PhD dissertation
• Collaborative modeling with USGS
• Future work on long-term geomorphology?
• Relationship to high flows from Conowingo??
Related Documents