cancers Article The Link between Cytogenetics/Genomics and Imaging Patterns of Relapse and Progression in Patients with Relapsed/Refractory Multiple Myeloma: A Pilot Study Utilizing 18F-FDG PET/CT Xiang Zhou 1 , Alexander Dierks 2,3 , Olivia Kertels 4 , Samuel Samnick 2 , Malte Kircher 2,3 , Andreas K. Buck 2 , Larissa Haertle 1 , Sebastian Knorz 1 , David Böckle 1 , Lukas Scheller 1 , Janin Messerschmidt 1 , Mohammad Barakat 1 , Marietta Truger 5 , Claudia Haferlach 5 , Hermann Einsele 1 , Leo Rasche 1 , K. Martin Kortüm 1 and Constantin Lapa 2,3, * 1 Department of Internal Medicine II, University Hospital of Würzburg, Oberdürrbacher Street 6, D-97080 Würzburg, Germany; [email protected] (X.Z.); [email protected] (L.H.); [email protected] (S.K.); [email protected] (D.B.); [email protected] (L.S.); [email protected] (J.M.); [email protected] (M.B.); [email protected] (H.E.); [email protected] (L.R.); [email protected] (K.M.K.) 2 Department of Nuclear Medicine, University Hospital of Würzburg, D-97080 Würzburg, Germany; [email protected] (A.D.); [email protected] (S.S.); [email protected] (M.K.); [email protected] (A.K.B.) 3 Nuclear Medicine, Medical Faculty, University Hospital of Augsburg, D-86156 Augsburg, Germany 4 Department of Diagnostic and Interventional Radiology, University Hospital of Würzburg, D-97080 Würzburg, Germany; [email protected] 5 Munich Leukemia Laboratory, D-81377Munich, Germany; [email protected] (M.T.); [email protected] (C.H.) * Correspondence: [email protected] Received: 30 July 2020; Accepted: 21 August 2020; Published: 24 August 2020 Abstract: Utilizing 18F-fluorodeoxyglucose (18F-FDG) positron emission tomography (PET)/ computed tomography (CT), we performed this pilot study to evaluate the link between cytogenetic/ genomic markers and imaging patterns in relapsed/refractory (RR) multiple myeloma (MM). We retrospectively analyzed data of 24 patients with RRMM who were treated at our institution between November 2018 and February 2020. At the last relapse/progression, patients had been treated with a median of three (range 1–10) lines of therapy. Six (25%) patients showed FDG avid extramedullary disease without adjacency to bone. We observed significantly higher maximum standardized uptake values (SUV max ) in patients harboring del(17p) compared with those without del(17p) (p = 0.025). Moreover, a high SUV max of >15 indicated significantly shortened progression-free survival (PFS) (p = 0.01) and overall survival (OS) (p = 0.0002). One female patient exhibited biallelic TP53 alteration, i.e., deletion and mutation, in whom an extremely high SUV max of 37.88 was observed. In summary, this pilot study suggested a link between del(17p)/TP53 alteration and high SUV max on 18F-FDG PET/CT in RRMM patients. Further investigations are highly warranted at this point. Keywords: radiogenomics; 18F-FDG PET/CT; multiple myeloma; relapse; progression; pattern 1. Introduction Multiple myeloma (MM) represents the second most common hematological malignancy in adults [1]. In MM, functional imaging methods, such as diffusion-weighted (DW) magnetic resonance imaging (MRI) and 18F-fluorodeoxyglucose (18F-FDG) positron emission tomography (PET)/computed Cancers 2020, 12, 2399; doi:10.3390/cancers12092399 www.mdpi.com/journal/cancers

Welcome message from author
This document is posted to help you gain knowledge. Please leave a comment to let me know what you think about it! Share it to your friends and learn new things together.
Transcript

cancers
Article
The Link between Cytogenetics/Genomics andImaging Patterns of Relapse and Progression inPatients with Relapsed/Refractory Multiple Myeloma:A Pilot Study Utilizing 18F-FDG PET/CT
Xiang Zhou 1, Alexander Dierks 2,3, Olivia Kertels 4, Samuel Samnick 2, Malte Kircher 2,3,Andreas K. Buck 2, Larissa Haertle 1, Sebastian Knorz 1, David Böckle 1, Lukas Scheller 1,Janin Messerschmidt 1, Mohammad Barakat 1, Marietta Truger 5, Claudia Haferlach 5,Hermann Einsele 1, Leo Rasche 1, K. Martin Kortüm 1 and Constantin Lapa 2,3,*
1 Department of Internal Medicine II, University Hospital of Würzburg, Oberdürrbacher Street 6,D-97080 Würzburg, Germany; [email protected] (X.Z.); [email protected] (L.H.); [email protected] (S.K.);[email protected] (D.B.); [email protected] (L.S.); [email protected] (J.M.);[email protected] (M.B.); [email protected] (H.E.); [email protected] (L.R.);[email protected] (K.M.K.)
2 Department of Nuclear Medicine, University Hospital of Würzburg, D-97080 Würzburg, Germany;[email protected] (A.D.); [email protected] (S.S.); [email protected] (M.K.);[email protected] (A.K.B.)
3 Nuclear Medicine, Medical Faculty, University Hospital of Augsburg, D-86156 Augsburg, Germany4 Department of Diagnostic and Interventional Radiology, University Hospital of Würzburg,
D-97080 Würzburg, Germany; [email protected] Munich Leukemia Laboratory, D-81377Munich, Germany; [email protected] (M.T.);
[email protected] (C.H.)* Correspondence: [email protected]
Received: 30 July 2020; Accepted: 21 August 2020; Published: 24 August 2020�����������������
Abstract: Utilizing 18F-fluorodeoxyglucose (18F-FDG) positron emission tomography (PET)/computed tomography (CT), we performed this pilot study to evaluate the link between cytogenetic/
genomic markers and imaging patterns in relapsed/refractory (RR) multiple myeloma (MM).We retrospectively analyzed data of 24 patients with RRMM who were treated at our institutionbetween November 2018 and February 2020. At the last relapse/progression, patients had beentreated with a median of three (range 1–10) lines of therapy. Six (25%) patients showed FDG avidextramedullary disease without adjacency to bone. We observed significantly higher maximumstandardized uptake values (SUVmax) in patients harboring del(17p) compared with those withoutdel(17p) (p = 0.025). Moreover, a high SUVmax of >15 indicated significantly shortened progression-freesurvival (PFS) (p = 0.01) and overall survival (OS) (p = 0.0002). One female patient exhibited biallelicTP53 alteration, i.e., deletion and mutation, in whom an extremely high SUVmax of 37.88 was observed.In summary, this pilot study suggested a link between del(17p)/TP53 alteration and high SUVmax on18F-FDG PET/CT in RRMM patients. Further investigations are highly warranted at this point.
Keywords: radiogenomics; 18F-FDG PET/CT; multiple myeloma; relapse; progression; pattern
1. Introduction
Multiple myeloma (MM) represents the second most common hematological malignancy inadults [1]. In MM, functional imaging methods, such as diffusion-weighted (DW) magnetic resonanceimaging (MRI) and 18F-fluorodeoxyglucose (18F-FDG) positron emission tomography (PET)/computed
Cancers 2020, 12, 2399; doi:10.3390/cancers12092399 www.mdpi.com/journal/cancers

Cancers 2020, 12, 2399 2 of 13
tomography (CT), can display diffuse growth patterns, focal lesions, and extramedullary disease(EMD) of patients (Figure 1). In the current consensus recommendation by the International MyelomaWorking Group (IMWG), 18F-FDG PET/CT is considered a valuable tool for the visualization of diseaseactivity in both newly diagnosed (ND) and relapsed/refractory (RR) MM patients [2]. 18F-FDG PET/CThas also been used for the prediction of survival outcome in MM patients treated with allogeneic stemcell transplant [3].
Figure 1. 18F-FDG PET/CT in two patients with multiple myeloma. 18F-FDG PET/CT demonstrates FDG avid(A) medullary lesions (pelvis, spine, both humeri and both femurs) and (B) extramedullary manifestations(mediastinal lymph nodes) in patients with multiple myeloma. 18F-FDG, 18F-fluorodeoxyglucose; PET,positron emission tomography; CT, computed tomography.
To date, there are also a few studies evaluating the association between cytogenetic abnormalitiesand imaging patterns in newly diagnosed MM (NDMM). Recently, adverse cytogenetics, such asdel(17p), gain(1q21), and t(4;14), have been reported to be enriched in NDMM patients with diffuseinfiltration pattern in DWMRI C [4]. Moreover, del(17p), gain(1q21), and gene expression profiling(GEP)-based high-risk disease are more frequent in NDMM patients with at least three large focallesions >5 cm2 [5]. Furthermore, McDonald et al. reported that total lesion glycolysis (TLG) >620 gand metabolic tumor volume (MTV) >210 cm3 indicated a significantly inferior progression-freesurvival (PFS) and overall survival (OS) of myeloma patients [6]. However, it has been less extensivelyinvestigated if imaging patterns of relapse and progression correlate with cytogenetic/genomic markersin RRMM. Therefore, we performed this pilot study in RRMM utilizing 18F-FDG PET/CT.
The aim of the current study was to evaluate the potential link between imaging patterns ofrelapse or progression and cytogenetic/genomic characteristics in RRMM and to generate hypothesesfor further investigations.
2. Methods
2.1. Patient Population
This was a single-center retrospective cohort study. We identified 24 patients who were treatedfor RRMM between November 2018 and February 2020. RRMM was defined as per current IMWGcriteria [7]. At the last relapse/progression, we simultaneously performed a bone marrow biopsy plusan 18F-FDG-PET/CT prior to therapy initiation in all patients. Patients with active second tumorwere excluded from the analysis. Patients’ characteristics, including time point of diagnosis, MMsubtype, prior lines of therapy, and drug resistance status, were collected for the analysis of imaging
Cancers 2020, 12, 2399 3 of 13
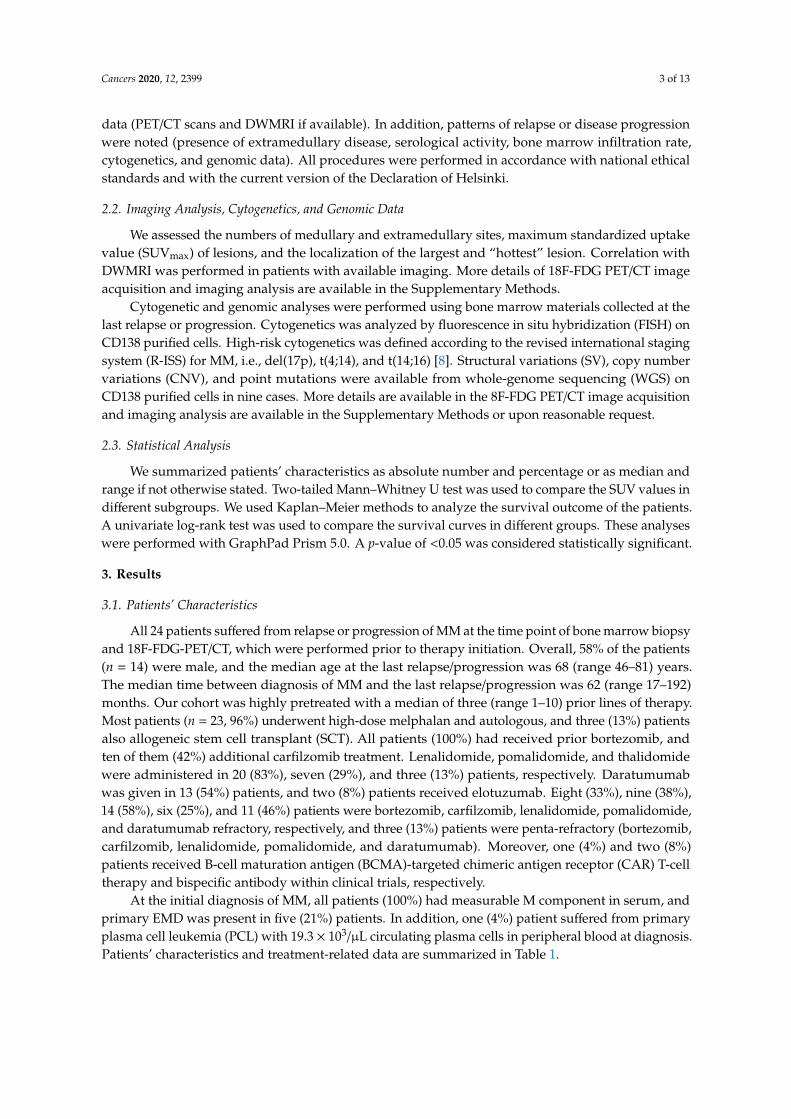
data (PET/CT scans and DWMRI if available). In addition, patterns of relapse or disease progressionwere noted (presence of extramedullary disease, serological activity, bone marrow infiltration rate,cytogenetics, and genomic data). All procedures were performed in accordance with national ethicalstandards and with the current version of the Declaration of Helsinki.
2.2. Imaging Analysis, Cytogenetics, and Genomic Data
We assessed the numbers of medullary and extramedullary sites, maximum standardized uptakevalue (SUVmax) of lesions, and the localization of the largest and “hottest” lesion. Correlation withDWMRI was performed in patients with available imaging. More details of 18F-FDG PET/CT imageacquisition and imaging analysis are available in the Supplementary Methods.
Cytogenetic and genomic analyses were performed using bone marrow materials collected at thelast relapse or progression. Cytogenetics was analyzed by fluorescence in situ hybridization (FISH) onCD138 purified cells. High-risk cytogenetics was defined according to the revised international stagingsystem (R-ISS) for MM, i.e., del(17p), t(4;14), and t(14;16) [8]. Structural variations (SV), copy numbervariations (CNV), and point mutations were available from whole-genome sequencing (WGS) onCD138 purified cells in nine cases. More details are available in the 8F-FDG PET/CT image acquisitionand imaging analysis are available in the Supplementary Methods or upon reasonable request.
2.3. Statistical Analysis
We summarized patients’ characteristics as absolute number and percentage or as median andrange if not otherwise stated. Two-tailed Mann–Whitney U test was used to compare the SUV values indifferent subgroups. We used Kaplan–Meier methods to analyze the survival outcome of the patients.A univariate log-rank test was used to compare the survival curves in different groups. These analyseswere performed with GraphPad Prism 5.0. A p-value of <0.05 was considered statistically significant.
3. Results
3.1. Patients’ Characteristics
All 24 patients suffered from relapse or progression of MM at the time point of bone marrow biopsyand 18F-FDG-PET/CT, which were performed prior to therapy initiation. Overall, 58% of the patients(n = 14) were male, and the median age at the last relapse/progression was 68 (range 46–81) years.The median time between diagnosis of MM and the last relapse/progression was 62 (range 17–192)months. Our cohort was highly pretreated with a median of three (range 1–10) prior lines of therapy.Most patients (n = 23, 96%) underwent high-dose melphalan and autologous, and three (13%) patientsalso allogeneic stem cell transplant (SCT). All patients (100%) had received prior bortezomib, andten of them (42%) additional carfilzomib treatment. Lenalidomide, pomalidomide, and thalidomidewere administered in 20 (83%), seven (29%), and three (13%) patients, respectively. Daratumumabwas given in 13 (54%) patients, and two (8%) patients received elotuzumab. Eight (33%), nine (38%),14 (58%), six (25%), and 11 (46%) patients were bortezomib, carfilzomib, lenalidomide, pomalidomide,and daratumumab refractory, respectively, and three (13%) patients were penta-refractory (bortezomib,carfilzomib, lenalidomide, pomalidomide, and daratumumab). Moreover, one (4%) and two (8%)patients received B-cell maturation antigen (BCMA)-targeted chimeric antigen receptor (CAR) T-celltherapy and bispecific antibody within clinical trials, respectively.
At the initial diagnosis of MM, all patients (100%) had measurable M component in serum, andprimary EMD was present in five (21%) patients. In addition, one (4%) patient suffered from primaryplasma cell leukemia (PCL) with 19.3 × 10³/µL circulating plasma cells in peripheral blood at diagnosis.Patients’ characteristics and treatment-related data are summarized in Table 1.

Cancers 2020, 12, 2399 4 of 13
Table 1. Patients’ characteristics.
Parameter Number
Patients, n 24
Gender, n (%)Male 14 (58)
Female 10 (42)
Age at the last relapse/progression, median (range), years 68 (46–81)
Subtype, n (%)IgG 16 (67)IgA 7 (29)LC 1 (4)
ISS Stage, n (%)I 9 (37)II 5 (21)III 5 (21)
NA 5 (21)
Cytogenetics, n (%)High-risk 8 (33)
Standard-risk 15 (63)NA 1 (4)
t(4;14)Yes 5 (21)No 18 (75)NA 1 (4)
t(14;16)Yes 1 (4)No 19 (79)NA 4 (17)
del(17p)Yes 4 (17)No 19 (79)NA 1 (4)
gain(1q21)Yes 10 (42)No 13 (54)NA 1 (4)
EMD at diagnosis, n (%)Yes 5 (21)No 19 (79)
Prior lines of therapy, n (%)2–1 month 9 (38)4–3 month 7 (29)≥5 8 (33)
Prior treatments, n (%)PIs
Bortezomib 24 (100)Carfilzomib 10 (42)
IMiDsLenalidomide 20 (83)Pomalidomide 7 (29)Thalidomide 3 (13)
Cancers 2020, 12, 2399 5 of 13
Table 1. Cont.
Parameter Number
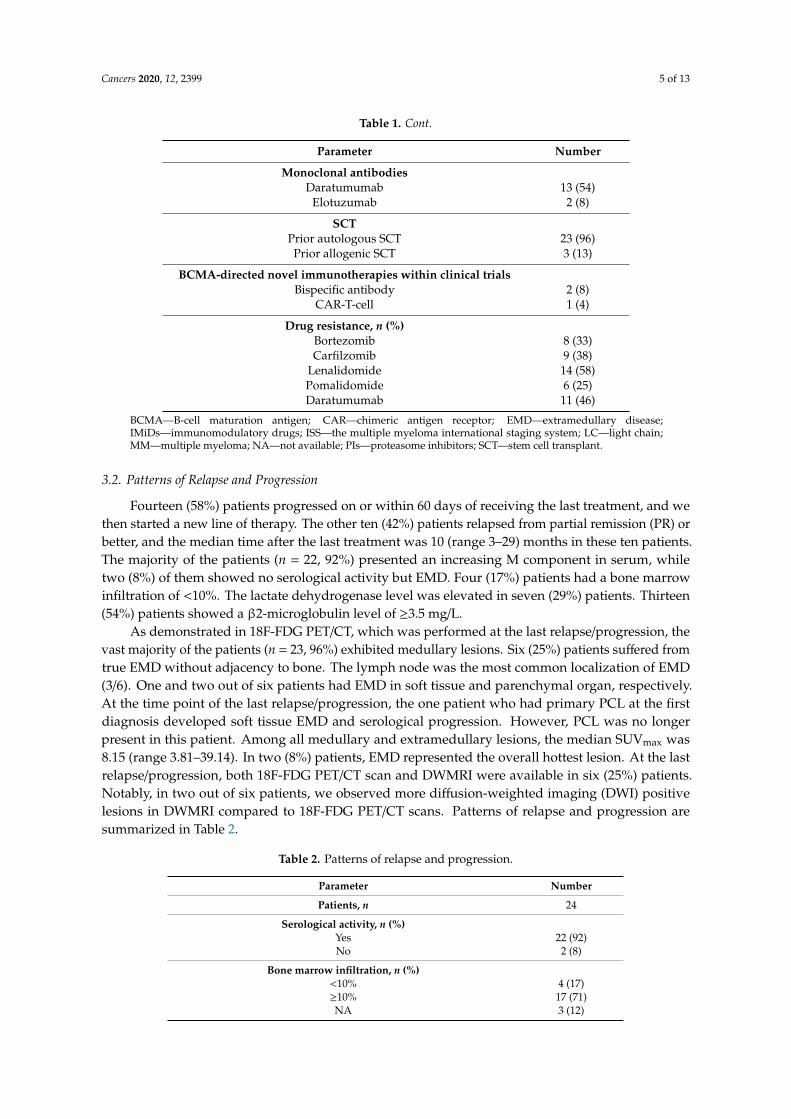
Monoclonal antibodiesDaratumumab 13 (54)
Elotuzumab 2 (8)
SCTPrior autologous SCT 23 (96)Prior allogenic SCT 3 (13)
BCMA-directed novel immunotherapies within clinical trialsBispecific antibody 2 (8)
CAR-T-cell 1 (4)
Drug resistance, n (%)Bortezomib 8 (33)Carfilzomib 9 (38)
Lenalidomide 14 (58)Pomalidomide 6 (25)Daratumumab 11 (46)
BCMA—B-cell maturation antigen; CAR—chimeric antigen receptor; EMD—extramedullary disease;IMiDs—immunomodulatory drugs; ISS—the multiple myeloma international staging system; LC—light chain;MM—multiple myeloma; NA—not available; PIs—proteasome inhibitors; SCT—stem cell transplant.
3.2. Patterns of Relapse and Progression
Fourteen (58%) patients progressed on or within 60 days of receiving the last treatment, and wethen started a new line of therapy. The other ten (42%) patients relapsed from partial remission (PR) orbetter, and the median time after the last treatment was 10 (range 3–29) months in these ten patients.The majority of the patients (n = 22, 92%) presented an increasing M component in serum, whiletwo (8%) of them showed no serological activity but EMD. Four (17%) patients had a bone marrowinfiltration of <10%. The lactate dehydrogenase level was elevated in seven (29%) patients. Thirteen(54%) patients showed a β2-microglobulin level of ≥3.5 mg/L.
As demonstrated in 18F-FDG PET/CT, which was performed at the last relapse/progression, thevast majority of the patients (n = 23, 96%) exhibited medullary lesions. Six (25%) patients suffered fromtrue EMD without adjacency to bone. The lymph node was the most common localization of EMD(3/6). One and two out of six patients had EMD in soft tissue and parenchymal organ, respectively.At the time point of the last relapse/progression, the one patient who had primary PCL at the firstdiagnosis developed soft tissue EMD and serological progression. However, PCL was no longerpresent in this patient. Among all medullary and extramedullary lesions, the median SUVmax was8.15 (range 3.81–39.14). In two (8%) patients, EMD represented the overall hottest lesion. At the lastrelapse/progression, both 18F-FDG PET/CT scan and DWMRI were available in six (25%) patients.Notably, in two out of six patients, we observed more diffusion-weighted imaging (DWI) positivelesions in DWMRI compared to 18F-FDG PET/CT scans. Patterns of relapse and progression aresummarized in Table 2.
Table 2. Patterns of relapse and progression.
Parameter Number
Patients, n 24
Serological activity, n (%)Yes 22 (92)No 2 (8)
Bone marrow infiltration, n (%)<10% 4 (17)≥10% 17 (71)NA 3 (12)

Cancers 2020, 12, 2399 6 of 13
Table 2. Cont.
Parameter Number
Laboratory parameters, n (%)eGFR, mL/min (CKD-EPI), median (range) 70 (34–98)
≥50 mL/min 18 (75)<50 mL/min 6 (25)
Calcium, mmol/L, median (range) 2.5 (2.0–2.3)≥2.5 mmol/L 0 (0)<2.5 mmol/L 24 (100)
LDH, U/L, median (range) 197 (107–711)≥250 U/L 7 (29)<250 U/L 17 (71)
Hemoglobin, g/dL, median (range) 11.0 (7.7–14.3)≥10 g/dL 16 (67)<10 g/dL 8 (33)
β2-microglobulin, mg/L, median (range) 3.6 (1.7–9.7)≥3.5 mg/L 13 (54)<3.5 mg/L 11 (46)
Number of medullary lesions, n (%)0 1 (4)
3–1 month 6 (25)7–4 month 2 (8)
>7 15 (63)
Number of EMD, n (%)0 18 (75)
3–1 month 4 (17)7–4 month 1 (4)
>7 1 (4)
Localization of EMD, n (%)Lymph node 3 (12)
Parenchymal organ 2 (8)Soft tissue 1 (4)
SUVmax, median (range) 8.15 (3.81–39.14)
Localization of the hottest lesion, n (%)Medullary 22 (92)
Extramedullary 2 (8)
Comparison between DWMRI and 18F-FDG-PET/CT (n = 6), n (%)Number of DWI positive lesions > FDG avid lesions 2 (33)Number of DWI positive lesions < FDG avid lesions 1 (17)Number of DWI positive lesions = FDG avid lesions 3 (50)
18F-FDG-PET/CT—18F-fluorodeoxyglucose positron emission tomography/computed tomography; CKD-EPI—Chronic Kidney Disease Epidemiology Collaboration; eGFR—estimated glomerular filtration rate; DWI—diffusion-weighted imaging; DWMRI—diffusion-weighted magnetic resonance imaging; EMD—extramedullarydisease; LDH—lactate dehydrogenase; NA—not available; SUVmax—maximum standardized uptake value.
3.3. Cytogenetics and Imaging Patterns of Relapse and Progression
We analyzed the link between cytogenetics and imaging patterns of relapse and progression, whichwere demonstrated in 18F-FDG PET/CT scans. Cytogenetics obtained at the last relapse/progressionwas available in 23 patients. High-risk cytogenetics, as determined by FISH, was present in eight(33%) patients, with four (17%), five (21%), one (4%) patients harboring del(17p), t(4;14), and t(14;16),respectively. Ten (42%) patients exhibited gain(1q21). Fifteen (63%) patients had standard-riskcytogenetics. EMD prevalence in patients with high-risk cytogenetics was slightly higher than thatwith standard-risk cytogenetics (2/8, 25% versus 3/15, 20%). In the patient with primary PCL andsoft tissue EMD progression, we did not find any unfavorable cytogenetic alterations, such as t(4;14),del(17p), or gain(1q21), and the patient exhibited t(11;14). Among the three penta-refractory patients,two of them had hyperdiploid myeloma, and one patient displayed t(11;14) and gain(1q21).

Cancers 2020, 12, 2399 7 of 13
We observed a significantly higher SUVmax in patients harboring del(17p) when compared withthose without del(17p) (median SUVmax: 27.03 versus 6.04, p = 0.025, Figure 2A). Moreover, patientswith high-risk cytogenetics showed a significantly higher SUVmax in comparison with those withstandard-risk cytogenetics (median SUVmax: 12.80 versus 5.54, p = 0.026, Figure 2B). Furthermore, weobserved no difference in SUVmax between patients with and without gain(1q21) (p = 0.200, figure notshown). Importantly, a high SUVmax of >15 indicated a significantly inferior PFS (p = 0.01, Figure 3A)and OS (p = 0.0002, Figure 3B) in our patients with RRMM.
Figure 2. Link between cytogenetics and maximum standardized uptake value (SUVmax): (A) Patientswith del(17p) (n = 4) showed a significantly higher SUVmax compared with those without del(17p)(n = 19) (p = 0.025). (B) High-risk cytogenetics, i.e., t(4;14), t(14;16), and del(17p) (n = 8) indicated asignificantly higher SUVmax when compared with standard-risk cytogenetics (n = 15) (p = 0.026).

Cancers 2020, 12, 2399 8 of 13
Figure 3. Maximum standardized uptake value (SUVmax) and survival: (A) Progression free survival(PFS) of patients with SUVmax >15 (n = 4) was significantly shorter than that in patients with SUVmax
≤15 (n = 19) (p = 0.01). (B) Patients with SUVmax >15 (n = 4) had a significantly inferior overall survival(OS) compared to those with SUVmax ≤15 (n = 19) (p = 0.0002).
3.4. WGS and Imaging Patterns of Relapse and Progression
To further elucidate the relationship between genomic alterations and imaging patterns, we alsoreviewed the data of WGS at the last relapse/progression, which were available in nine out of 24patients. In these nine patients, WGS data could confirm structural changes within the genome,including translocations, amplifications, and deletions, which had been detected by FISH analysisat the last relapse/progression. Overall, t(14;16) and gain(1q21) were present in one (11%) and five(56%) patients, respectively. One (11%) patient exhibited del(17p). With regard to gene mutation status,KRAS represented the most frequently mutated gene in our cohort (n = 4, 44%), followed by NRAS(n = 2, 22%) mutation. WGS data and the patients’ characteristics are presented in Table 3.
Notably, there was one female patient with biallelic TP53 alteration (patient No. 5 in Table 3).In this patient, a del(17p) was found by FISH analysis. The WGS data revealed a TP53 mutation

Cancers 2020, 12, 2399 9 of 13
ENST00000269305.4:c.375 + 1G > T with a variant allele frequency (vaf) of 84% in one allele and aloss of the remaining allele through deletion chr17_p13.3_1::18986000_p11.2 (Figure 4A). At the lastrelapse/progression, this patient suffered from serological disease progression with EMD in lymphnodes. She received an allogeneic SCT as salvage therapy, and, two months later, this patient developeda new true EMD lesion in lymph node with excessive FDG uptake (Figure 4B). Interestingly, in 18F-FDGPET/CT scans, this patient also showed the highest SUVmax, which was much higher than the othereight patients (Table 3). This finding was consistent with our results demonstrated by FISH analysisthat del(17p) indicated a significantly higher SUVmax at relapse/progression in 18F-FDG PET/CT scansin RRMM patients compared with those without del(17p).
Figure 4. Whole-genome sequencing (WGS) and 18F-FDG PET/CT in the patient with biallelic TP53alteration (No. 5 in Table 3): (A) Circos plot demonstrated data of WGS, including copy numbervariations (CNV), structural variations (SV), and single nucleotide variations (SNV), at the last relapse.Gains and losses of >1 Mb are shown in blue and red, respectively. Interchromosomal reciprocaltranslocations with variant allele frequency (vaf) >0.1 are displayed by red lines inside the circle.Gene mutations (TP53) and variants (ATR, KRAS, TRAF3, and MUC16) are marked in red and grey,respectively. (B) True extramedullary disease (axillary lymph node) with excessive FDG uptake,as shown on 18F-FDG PET/CT scans. Biallelic TP53 alteration might lead to aggressive tumor growth,e.g., development of extramedullary disease (EMD) and excessive FDG uptake.

Cancers 2020, 12, 2399 10 of 13
Table 3. Whole-genome sequencing and imaging patterns in 18F-FDG PET/CT scans.
Patient Gender Age atDiagnosis Subtype
Lines ofPrior
Therapy
MutatedGenes
High-RiskStructural
AlterationsSUVmax EMD
Size of theLargest
EMD, cm
Localizationof the
LargestEMD
1 M 54 IgA Kappa 5 KRAS None 5.4 No / /
2 F 75 IgG Kappa 3 KRAS,CUL4B None 12.78 Yes 2.6 Lymph node
3 M 48 IgG Kappa 3 BRAF None 4.44 No / /4 M 78 IgG Kappa 1 None None 8.58 No / /
5 F 60 IgG Kappa 7 TP53 del(17p),gain(1q21) 37.88 Yes 3.1 Lymph node
6 M 66 IgA Kappa 2
KRAS,MUC16,NRAS,RRBP1,
FAM46C
gain(1q21) 11.36 No / /
7 F 64 IgA Kappa 8 KRAS gain(1q21) 6.04 No / /
8 F 74 IgA Lambda 2 None t(14;16),gain(1q21) 7.73 No / /
9 M 72 Kappa LC 1 NRAS gain(1q21) 13.31 No / /
18F-FDG-PET/CT—18F-fluorodeoxyglucose positron emission tomography/computed tomography; EMD—extramedullary disease; F—female; LC—light chain; M—male; SUVmax—maximum standardized uptake value.
4. Discussion
We performed this pilot study utilizing 18F-FDG PET/CT to explore the potential link betweencytogenetic/genomic characteristics and imaging patterns of relapse and progression in MM. To thebest of our knowledge, this is the first study analyzing this link in patients with RRMM.
Overall, in our cohort, a high SUVmax of >15 on 18F-FDG PET/CT scans indicated significantlyinferior PFS and OS in patients with relapsed or progressive MM. In 18F-FDG PET/CT, generally,SUVmax is a semi-quantitative parameter correlated with glucose uptake and metabolic or proliferativeactivity of the tumor [9]. So far, published data on the prognostic role of SUVmax in RRMM are still verylimited [2]. Recently, in another study of Jamet et al., SUVmax of >15.9 was identified as an independentnegative prognostic factor for PFS [10] in patients with relapsed MM. In addition, Lapa et al. foundthat SUVmax of >18.57 was predictive for a shorter time to progression (TTP) in patients with MMrelapse after autologous SCT [11]. In our study, we took a comparable cut-off value of SUVmax (>15),as already reported, and our results were in line with these previous studies. These findings underlinethe prognostic value of SUVmax on 18F-FDG PET/CT scans for RRMM patients.
As yet, little is known about the link between cytogenetics and semi-quantitative parametersin 18F-FDG PET/CT scans, such as SUVmax in RRMM patients. In our cohort, RRMM patients withhigh-risk cytogenetics, including del(17p), showed a significantly higher SUVmax in 18F-FDG PET/CTscans compared with those with standard-risk cytogenetics. More importantly, among the four patientswith SUVmax of >15, three of them (3/4) showed del(17p) and, consequently, also high-risk cytogenetics.As reported by IMWG in the R-ISS in 2015, primary genetic events t(4;14), t(14;16) and secondarygenetic abnormality del(17p) are known as negative prognostic factors in MM, and R-ISS is one ofthe most widely used prognostic models worldwide [8,12]. Additionally, in a study of Zamagni et al.,(1) high-risk cytogenetics, i.e., del(17p) and t(4;14), and (2) the presence of lesions with SUV > 4.2 wereidentified as negative prognostic factors for PFS in NDMM [13]. At this point, our study demonstratedthe prognostic values of high-risk cytogenetics and high SUVmax in RRMM and elucidated the linkbetween both prognostic factors, suggesting that imaging parameters, such as SUVmax, might be apotential surrogate marker of cytogenetics in RRMM. Similar to previous studies, EMD was alsoenriched in patients with high-risk cytogenetics in our cohort [14,15]. However, these findings shouldbe interpreted with caution due to the small patient population in our analysis. Altogether, the currentstudy demonstrated that both SUVmax and cytogenetics, probably due to the potential link betweenboth factors, were predictive for the survival outcome of RRMM patients.
In our cohort, WGS data revealed a patient with biallelic TP53 alteration, in whom an extremelyhigh SUVmax of 37.88 was presented by 18F-FDG PET/CT scans. TP53 is a well-known tumor suppressor

Cancers 2020, 12, 2399 11 of 13
gene, and its dysfunction is associated with various malignant diseases in humans [16]. In this patient,we detected a TP53 mutation ENST00000269305.4:c.375 + 1G > T, which had been reported in ovariancancer and breast cancer in the International Agency for Research on Cancer (IARC) TP53 MutationDatabase [17]. Currently, the role of this SNV is not fully understood. Mutations in this region couldaffect a splice site in intron 4 of TP53 and might result in a frameshift and probably the loss of TP53function [18]. Thus, this SNV has been classified as a pathogenic variant in the Catalogue of SomaticMutations in Cancers (COSMIC) database (Legacy Identifier: COSM69405). In addition, we observed aloss of the remaining TP53 allele due to a large deletion chr17_p13.3_1::18986000_p11.2. Taken together,this patient presented a so-called double-hit TP53 alteration, i.e., mutation plus deletion, which mightresult in a severe deficiency of TP53 function. Interestingly, we observed the highest FDG uptake in anEMD lesion (SUVmax 37.88), indicating an extremely high metabolic and proliferative activity of EMD.Biallelic TP53 alteration might correlate with aggressive behaviors of MM, e.g., development of EMDand excessive FDG uptake. This finding should be further evaluated in larger studies.
The current pilot study had several limitations: (1) In our study, we selected 18F-FDG PET/CTscans as a candidate parameter to elucidate the link between cytogenetics/genomics and imagingpatterns in RRMM. While 18F-FDG clearly is the standard of reference tracer in nuclear imaging ofMM, scan results might be influenced by different factors, such as expression levels of hexokinase-2and glucose transporter, as well as hyperglycemia, and false-positive results due to infection, chronicinflammation, metallic implants, surgery, and fracture healing can occur [2,19–22]. In this context,the hexokinase-2 expression is increased in the HY and PR molecular subgroup [19]. In principle,additional semi-quantitative parameters, such as MTV and TLG, or PET/CT using other tracers, suchas 11C-methionine [23,24] and 68Ga-Pentixafor [25,26], can also be used. A combination of differentimaging methods might help to reduce the opportunities for bias. (2) Additional gene analysis of EMDlesions, if available, should also be performed to further evaluate the link between imaging patternsand special cytogenetic/genomic features of EMD [27]. (3) Our patients had received heterogeneouspretreatment, which might impact the clonal evolution and, consequently, also the genetic/genomicprofile of MM cells. (4) As our pilot study was a retrospective study based on a limited number ofpatients, we did not perform multivariate survival analysis, and our findings should be interpretedwith caution. Nevertheless, our findings have given insight into the biological background of imagingpatterns in RRMM and have provided a rationale for further investigations.
5. Conclusions
In conclusion, this pilot study suggested a link between del(17p)/TP53 alteration and FDG-uptakeon FDG PET/CT scans in RRMM patients. Further larger studies are highly warranted at this point.
Supplementary Materials: The following are available online at http://www.mdpi.com/2072-6694/12/9/2399/s1,Supplementary Methods.
Author Contributions: Conceptualization, X.Z, K.M.K., L.R. and C.L.; Data curation, A.D., M.K., S.S., A.K.B.,D.B. and C.L.; Formal analysis, X.Z., O.K., M.K., L.S. and J.M.; Investigation, X.Z., A.D., M.T., C.H. and C.L.;Methodology, A.D., M.T., C.H., S.K., L.S. and K.M.K.; Project administration, X.Z., M.K., H.E. and M.B.; Resources,L.H., O.K. and J.M.; Supervision, A.K.B., K.M.K., L.R., H.E. and C.L.; Validation, D.B.; Visualization, M.K. and S.K.;Writing–original draft, X.Z., A.D. and O.K.; Writing–review & editing, A.K.B., S.K., D.B., L.S., M.B., L.R., H.E. andC.L. All authors have read and agreed to the published version of the manuscript.
Funding: This publication was supported by the Open Access Publication Fund of the University of Wuerzburg.
Conflicts of Interest: All authors declare that they have no conflict of interest relevant to the submitted manuscript.
References
1. Robak, P.; Drozdz, I.; Szemraj, J.; Robak, T. Drug resistance in multiple myeloma. Cancer Treat. Rev. 2018, 70,199–208. [CrossRef] [PubMed]

Cancers 2020, 12, 2399 12 of 13
2. Cavo, M.; Terpos, E.; Nanni, C.; Moreau, P.; Lentzsch, S.; Zweegman, S.; Hillengass, J.; Engelhardt, M.;Usmani, S.Z.; Vesole, D.H.; et al. Role of (18)F-FDG PET/CT in the diagnosis and management of multiplemyeloma and other plasma cell disorders: A consensus statement by the International Myeloma WorkingGroup. Lancet Oncol. 2017, 18, e206–e217. [CrossRef]
3. Stolzenburg, A.; Luckerath, K.; Samnick, S.; Speer, M.; Kneer, K.; Schmid, J.S.; Grigoleit, G.U.; Hofmann, S.;Beer, A.J.; Bunjes, D.; et al. Prognostic value of [(18)F]FDG-PET/CT in multiple myeloma patients beforeand after allogeneic hematopoietic cell transplantation. Eur. J. Nucl. Med. Mol. Imaging 2018, 45, 1694–1704.[CrossRef] [PubMed]
4. Mai, E.K.; Hielscher, T.; Kloth, J.K.; Merz, M.; Shah, S.; Hillengass, M.; Wagner, B.; Hose, D.; Raab, M.S.;Jauch, A.; et al. Association between magnetic resonance imaging patterns and baseline disease featuresin multiple myeloma: Analyzing surrogates of tumour mass and biology. Eur. Radiol. 2016, 26, 3939–3948.[CrossRef]
5. Rasche, L.; Angtuaco, E.J.; Alpe, T.L.; Gershner, G.H.; McDonald, J.E.; Samant, R.S.; Kumar, M.; VanHemert, R.; Epstein, J.; Deshpande, S.; et al. The presence of large focal lesions is a strong independentprognostic factor in multiple myeloma. Blood 2018, 132, 59–66. [CrossRef]
6. McDonald, J.E.; Kessler, M.M.; Gardner, M.W.; Buros, A.F.; Ntambi, J.A.; Waheed, S.; van Rhee, F.; Zangari, M.;Heuck, C.J.; Petty, N.; et al. Assessment of Total Lesion Glycolysis by (18)F FDG PET/CT SignificantlyImproves Prognostic Value of GEP and ISS in Myeloma. Clin. Cancer Res. 2017, 23, 1981–1987. [CrossRef]
7. Rajkumar, S.V.; Harousseau, J.L.; Durie, B.; Anderson, K.C.; Dimopoulos, M.; Kyle, R.; Blade, J.; Richardson, P.;Orlowski, R.; Siegel, D.; et al. Consensus recommendations for the uniform reporting of clinical trials: Reportof the International Myeloma Workshop Consensus Panel 1. Blood 2011, 117, 4691–4695. [CrossRef]
8. Palumbo, A.; Avet-Loiseau, H.; Oliva, S.; Lokhorst, H.M.; Goldschmidt, H.; Rosinol, L.; Richardson, P.;Caltagirone, S.; Lahuerta, J.J.; Facon, T.; et al. Revised International Staging System for Multiple Myeloma:A Report From International Myeloma Working Group. J. Clin. Oncol. 2015, 33, 2863–2869. [CrossRef]
9. Kinahan, P.E.; Fletcher, J.W. Positron emission tomography-computed tomography standardized uptakevalues in clinical practice and assessing response to therapy. Semin. Ultrasound CT MR 2010, 31, 496–505.[CrossRef]
10. Jamet, B.; Bailly, C.; Carlier, T.; Planche, L.; Touzeau, C.; Kraeber-Bodere, F.; Moreau, P.; Bodet-Milin, C.Added prognostic value of FDG-PET/CT in relapsing multiple myeloma patients. Leuk. Lymphoma 2019, 60,222–225. [CrossRef]
11. Lapa, C.; Luckerath, K.; Malzahn, U.; Samnick, S.; Einsele, H.; Buck, A.K.; Herrmann, K.; Knop, S.18 FDG-PET/CT for prognostic stratification of patients with multiple myeloma relapse after stem celltransplantation. Oncotarget 2014, 5, 7381–7391. [CrossRef] [PubMed]
12. Abe, Y.; Sunami, K.; Yamashita, T.; Ueda, M.; Takamatsu, H.; Narita, K.; Kobayashi, H.; Kitadate, A.;Takeuchi, M.; Matsue, K. Improved survival outcomes and relative youthfulness of multiple myelomapatients with t(4;14) receiving novel agents are associated with poorer performance of the revised internationalstaging system in a real aging society. Oncotarget 2019, 10, 595–605. [CrossRef] [PubMed]
13. Zamagni, E.; Patriarca, F.; Nanni, C.; Zannetti, B.; Englaro, E.; Pezzi, A.; Tacchetti, P.; Buttignol, S.; Perrone, G.;Brioli, A.; et al. Prognostic relevance of 18-F FDG PET/CT in newly diagnosed multiple myeloma patientstreated with up-front autologous transplantation. Blood 2011, 118, 5989–5995. [CrossRef] [PubMed]
14. Besse, L.; Sedlarikova, L.; Greslikova, H.; Kupska, R.; Almasi, M.; Penka, M.; Jelinek, T.; Pour, L.; Adam, Z.;Kuglik, P.; et al. Cytogenetics in multiple myeloma patients progressing into extramedullary disease. Eur. J.Haematol. 2016, 97, 93–100. [CrossRef] [PubMed]
15. Rasche, L.; Bernard, C.; Topp, M.S.; Kapp, M.; Duell, J.; Wesemeier, C.; Haralambieva, E.; Maeder, U.;Einsele, H.; Knop, S. Features of extramedullary myeloma relapse: High proliferation, minimal marrowinvolvement, adverse cytogenetics: A retrospective single-center study of 24 cases. Ann. Hematol. 2012, 91,1031–1037. [CrossRef]
16. Levine, A.J.; Momand, J.; Finlay, C.A. The p53 tumour suppressor gene. Nature 1991, 351, 453–456. [CrossRef]17. Bouaoun, L.; Sonkin, D.; Ardin, M.; Hollstein, M.; Byrnes, G.; Zavadil, J.; Olivier, M. TP53 Variations in
Human Cancers: New Lessons from the IARC TP53 Database and Genomics Data. Hum. Mutat. 2016, 37,865–876. [CrossRef]
18. Baralle, D.; Baralle, M. Splicing in action: Assessing disease causing sequence changes. J. Med. Genet. 2005,42, 737–748. [CrossRef]

Cancers 2020, 12, 2399 13 of 13
19. Rasche, L.; Angtuaco, E.; McDonald, J.E.; Buros, A.; Stein, C.; Pawlyn, C.; Thanendrarajan, S.; Schinke, C.;Samant, R.; Yaccoby, S.; et al. Low expression of hexokinase-2 is associated with false-negative FDG-positronemission tomography in multiple myeloma. Blood 2017, 130, 30–34. [CrossRef]
20. Kitamura, S.; Yanagi, T.; Inamura-Takashima, Y.; Imafuku, K.; Hata, H.; Uehara, J.; Ishida, Y.; Otsuka, A.;Hirata, K.; Shimizu, H. Retrospective study on the correlation between 18-fluorodeoxyglucose uptake inpositron emission tomography-computer tomography and tumour volume, cytological activity as assessedwith Ki-67 and GLUT-1 staining in 10 cases of Merkel cell carcinoma. J. Eur. Acad. Dermatol. Venereol. 2018,32, e285–e287. [CrossRef]
21. Martin, O.; Aissa, J.; Boos, J.; Wingendorf, K.; Latz, D.; Buchbender, C.; Gaspers, S.; Antke, C.; Sedlmair, M.;Antoch, G.; et al. Impact of different metal artifact reduction techniques on attenuation correction in 18F-FDGPET/CT examinations. Br. J. Radiol. 2020, 93, 20190069. [CrossRef] [PubMed]
22. Rabkin, Z.; Israel, O.; Keidar, Z. Do hyperglycemia and diabetes affect the incidence of false-negative 18F-FDGPET/CT studies in patients evaluated for infection or inflammation and cancer? A Comparative analysis.J. Nucl. Med. 2010, 51, 1015–1020. [CrossRef] [PubMed]
23. Lapa, C.; Garcia-Velloso, M.J.; Luckerath, K.; Samnick, S.; Schreder, M.; Otero, P.R.; Schmid, J.S.; Herrmann, K.;Knop, S.; Buck, A.K.; et al. (11)C-Methionine-PET in Multiple Myeloma: A Combined Study from TwoDifferent Institutions. Theranostics 2017, 7, 2956–2964. [CrossRef] [PubMed]
24. Lapa, C.; Knop, S.; Schreder, M.; Rudelius, M.; Knott, M.; Jorg, G.; Samnick, S.; Herrmann, K.; Buck, A.K.;Einsele, H.; et al. 11C-Methionine-PET in Multiple Myeloma: Correlation with Clinical Parameters and BoneMarrow Involvement. Theranostics 2016, 6, 254–261. [CrossRef] [PubMed]
25. Lapa, C.; Schreder, M.; Schirbel, A.; Samnick, S.; Kortum, K.M.; Herrmann, K.; Kropf, S.; Einsele, H.;Buck, A.K.; Wester, H.J.; et al. [(68)Ga]Pentixafor-PET/CT for imaging of chemokine receptor CXCR4expression in multiple myeloma—Comparison to [(18)F]FDG and laboratory values. Theranostics 2017, 7,205–212. [CrossRef]
26. Pan, Q.; Cao, X.; Luo, Y.; Li, J.; Feng, J.; Li, F. Chemokine receptor-4 targeted PET/CT with (68)Ga-Pentixaforin assessment of newly diagnosed multiple myeloma: Comparison to (18)F-FDG PET/CT. Eur. J. Nucl. Med.Mol. Imaging 2020, 47, 537–546. [CrossRef]
27. Rasche, L.; Chavan, S.S.; Stephens, O.W.; Patel, P.H.; Tytarenko, R.; Ashby, C.; Bauer, M.; Stein, C.;Deshpande, S.; Wardell, C.; et al. Spatial genomic heterogeneity in multiple myeloma revealed by multi-regionsequencing. Nat. Commun. 2017, 8, 268. [CrossRef]
© 2020 by the authors. Licensee MDPI, Basel, Switzerland. This article is an open accessarticle distributed under the terms and conditions of the Creative Commons Attribution(CC BY) license (http://creativecommons.org/licenses/by/4.0/).
Related Documents