THE IMPACT OF ASEAN FREE TRADE AGREEMENT ON ASEAN MEMBERS’ EXPORT A Research Paper presented by: Ammi Ardiyanti (Indonesia) in partial fulfilment of the requirements for obtaining the degree of MASTER OF ARTS IN DEVELOPMENT STUDIES Major: Economics of Development (ECD) Members of the Examining Committee: Prof. Peter van Bergeijk Prof. Mansoob Murshed The Hague, The Netherlands August 2015

Welcome message from author
This document is posted to help you gain knowledge. Please leave a comment to let me know what you think about it! Share it to your friends and learn new things together.
Transcript
THE IMPACT OF ASEAN FREE TRADE AGREEMENT ON ASEAN MEMBERS’ EXPORT
A Research Paper presented by:
Ammi Ardiyanti
(Indonesia)
in partial fulfilment of the requirements for obtaining the degree of
MASTER OF ARTS IN DEVELOPMENT STUDIES
Major:
Economics of Development
(ECD)
Members of the Examining Committee:
Prof. Peter van Bergeijk
Prof. Mansoob Murshed
The Hague, The Netherlands August 2015
ii
iii
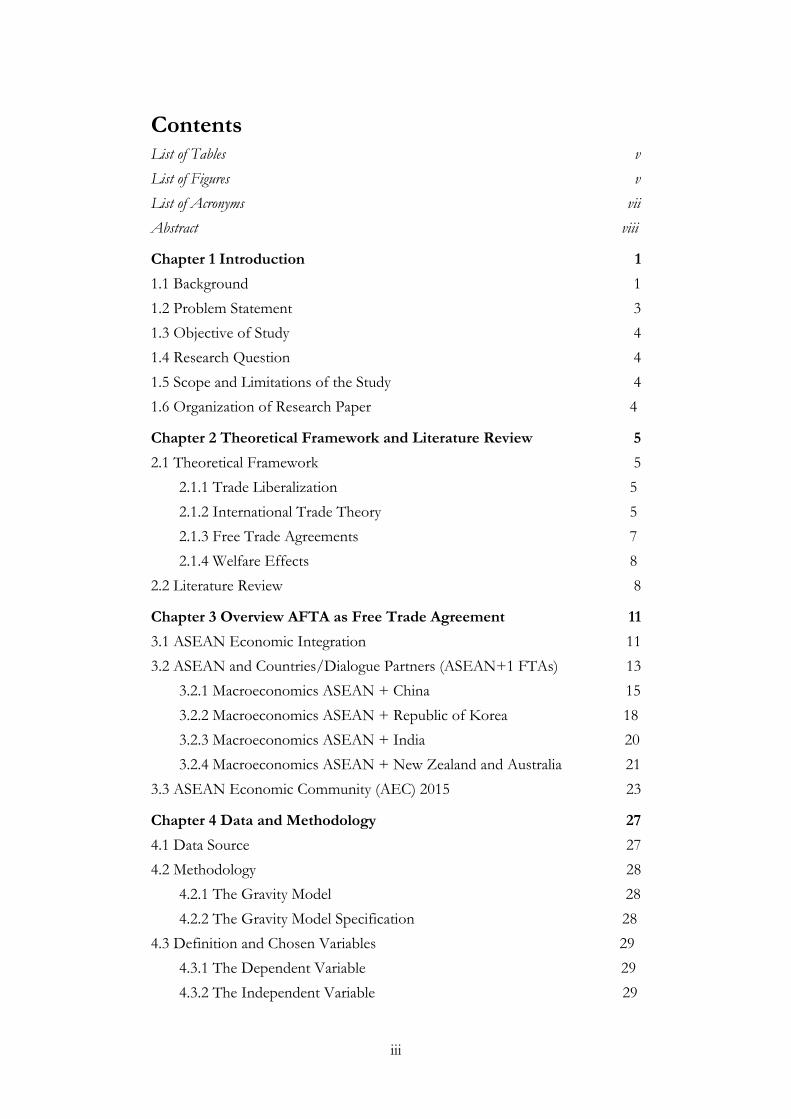
Contents List of Tables v
List of Figures v
List of Acronyms vii
Abstract viii
Chapter 1 Introduction 1
1.1 Background 1
1.2 Problem Statement 3
1.3 Objective of Study 4
1.4 Research Question 4
1.5 Scope and Limitations of the Study 4
1.6 Organization of Research Paper 4
Chapter 2 Theoretical Framework and Literature Review 5
2.1 Theoretical Framework 5
2.1.1 Trade Liberalization 5
2.1.2 International Trade Theory 5
2.1.3 Free Trade Agreements 7
2.1.4 Welfare Effects 8
2.2 Literature Review 8
Chapter 3 Overview AFTA as Free Trade Agreement 11
3.1 ASEAN Economic Integration 11
3.2 ASEAN and Countries/Dialogue Partners (ASEAN+1 FTAs) 13
3.2.1 Macroeconomics ASEAN + China 15
3.2.2 Macroeconomics ASEAN + Republic of Korea 18
3.2.3 Macroeconomics ASEAN + India 20
3.2.4 Macroeconomics ASEAN + New Zealand and Australia 21
3.3 ASEAN Economic Community (AEC) 2015 23
Chapter 4 Data and Methodology 27
4.1 Data Source 27
4.2 Methodology 28
4.2.1 The Gravity Model 28
4.2.2 The Gravity Model Specification 28
4.3 Definition and Chosen Variables 29
4.3.1 The Dependent Variable 29
4.3.2 The Independent Variable 29

iv
4.4 The Issue of Zero Trade Flow 30
Chapter 5 Result and Analysis 32
5.1 Empirical Results 32
5.1.1 Basic Gravity Model 32
5.1.2 Re-estimated Basic Gravity Model 37
Chapter 6 Conclusions 42
References 44
v
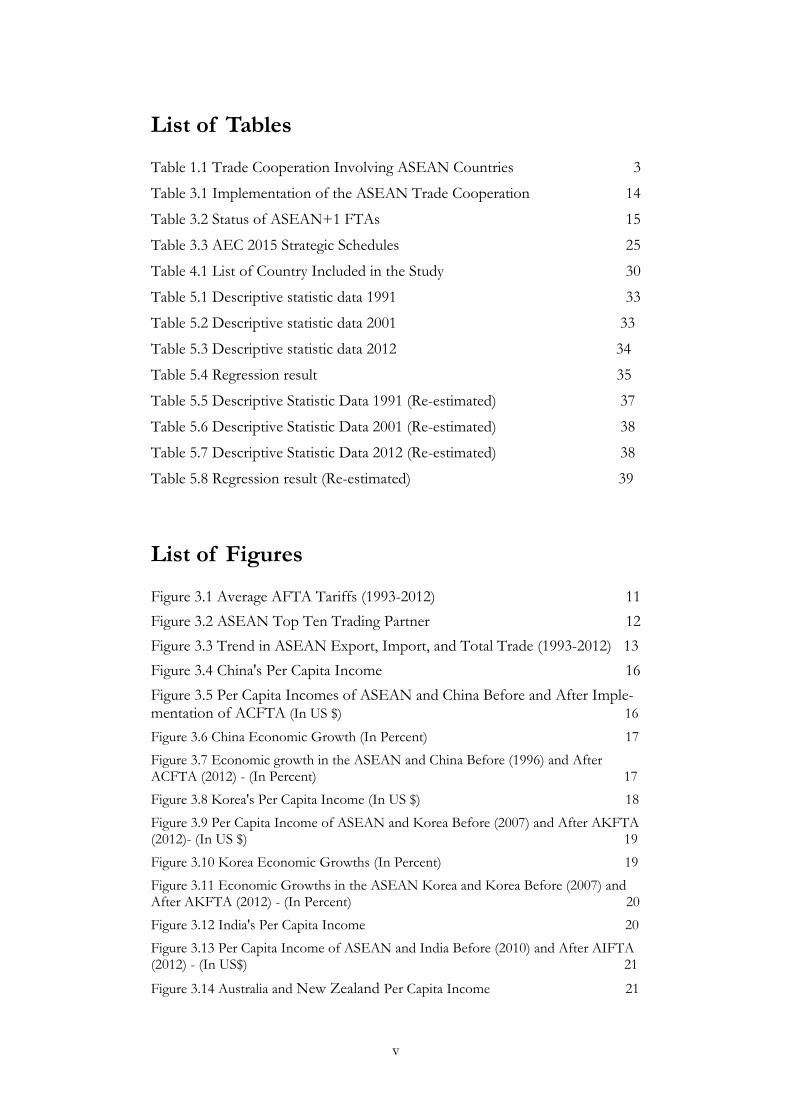
List of Tables
Table 1.1 Trade Cooperation Involving ASEAN Countries 3
Table 3.1 Implementation of the ASEAN Trade Cooperation 14
Table 3.2 Status of ASEAN+1 FTAs 15
Table 3.3 AEC 2015 Strategic Schedules 25
Table 4.1 List of Country Included in the Study 30
Table 5.1 Descriptive statistic data 1991 33
Table 5.2 Descriptive statistic data 2001 33
Table 5.3 Descriptive statistic data 2012 34
Table 5.4 Regression result 35
Table 5.5 Descriptive Statistic Data 1991 (Re-estimated) 37
Table 5.6 Descriptive Statistic Data 2001 (Re-estimated) 38
Table 5.7 Descriptive Statistic Data 2012 (Re-estimated) 38
Table 5.8 Regression result (Re-estimated) 39
List of Figures
Figure 3.1 Average AFTA Tariffs (1993-2012) 11
Figure 3.2 ASEAN Top Ten Trading Partner 12
Figure 3.3 Trend in ASEAN Export, Import, and Total Trade (1993-2012) 13
Figure 3.4 China's Per Capita Income 16
Figure 3.5 Per Capita Incomes of ASEAN and China Before and After Imple-mentation of ACFTA (In US $) 16
Figure 3.6 China Economic Growth (In Percent) 17
Figure 3.7 Economic growth in the ASEAN and China Before (1996) and After ACFTA (2012) - (In Percent) 17
Figure 3.8 Korea's Per Capita Income (In US $) 18
Figure 3.9 Per Capita Income of ASEAN and Korea Before (2007) and After AKFTA (2012)- (In US $) 19
Figure 3.10 Korea Economic Growths (In Percent) 19
Figure 3.11 Economic Growths in the ASEAN Korea and Korea Before (2007) and After AKFTA (2012) - (In Percent) 20
Figure 3.12 India's Per Capita Income 20
Figure 3.13 Per Capita Income of ASEAN and India Before (2010) and After AIFTA (2012) - (In US$) 21
Figure 3.14 Australia and New Zealand Per Capita Income 21
vi
Figure 3.15 Per Capita Income of ASEAN, New Zealand and Australia (In 2012) 22
Figure 3.16 Economic Growths of New Zealand and Australia (In percent) 22
Figure 3.17 Economic Growths of ASEAN, New Zealand and Australia 23
vii
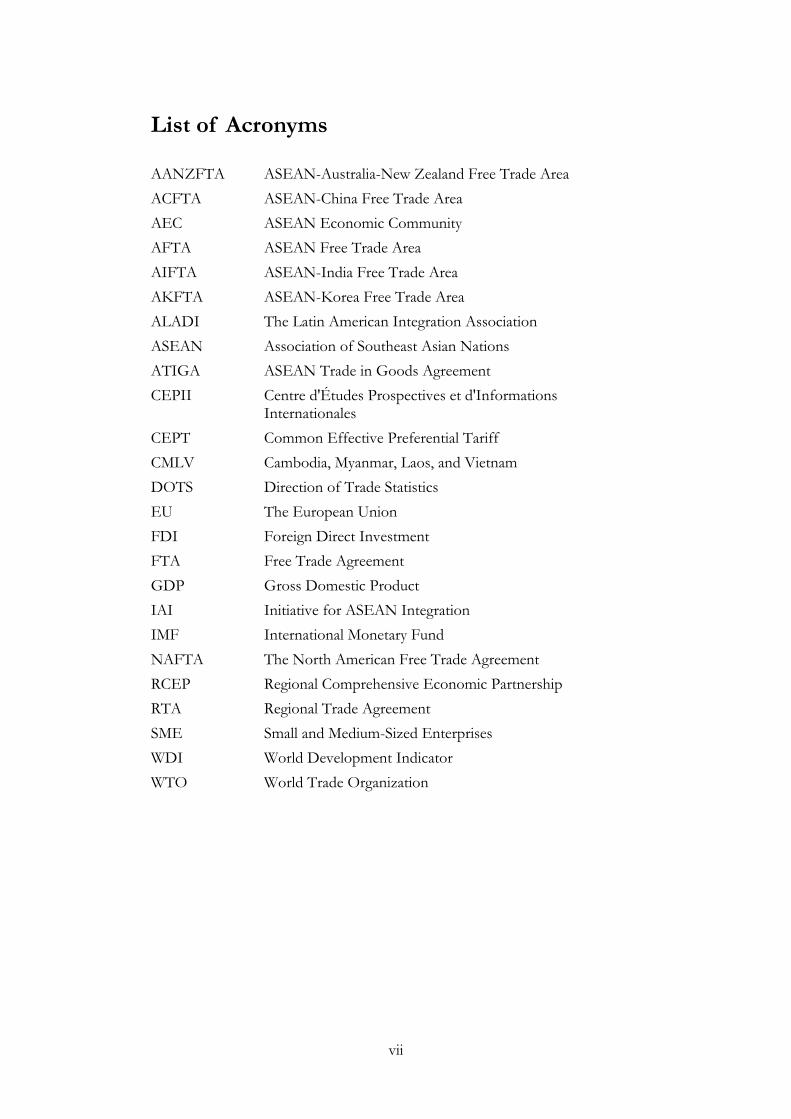
List of Acronyms
AANZFTA ASEAN-Australia-New Zealand Free Trade Area
ACFTA ASEAN-China Free Trade Area
AEC ASEAN Economic Community
AFTA ASEAN Free Trade Area
AIFTA ASEAN-India Free Trade Area
AKFTA ASEAN-Korea Free Trade Area
ALADI The Latin American Integration Association
ASEAN Association of Southeast Asian Nations
ATIGA ASEAN Trade in Goods Agreement
CEPII Centre d'Études Prospectives et d'Informations Internationales
CEPT Common Effective Preferential Tariff
CMLV Cambodia, Myanmar, Laos, and Vietnam
DOTS Direction of Trade Statistics
EU The European Union
FDI Foreign Direct Investment
FTA Free Trade Agreement
GDP Gross Domestic Product
IAI Initiative for ASEAN Integration
IMF International Monetary Fund
NAFTA The North American Free Trade Agreement
RCEP Regional Comprehensive Economic Partnership
RTA Regional Trade Agreement
SME Small and Medium-Sized Enterprises
WDI World Development Indicator
WTO World Trade Organization
viii
Abstract
Regional trade agreements have covered more than half of international trade throughout the world since in the beginning 1990’s. The ASEAN Free Trade Area (AFTA) was established to improve regional economic competitiveness. Encouraging export has been one of the main priorities within the opening-up to international trade as the driving force for economic growth. In the after-math of the global financial crisis, it is important for the member countries to enhance international trade relations through free trade agreements to improve regional production systems. Free trade agreements enhance the trade of goods efficiently sourced between member countries and lead to trade creation that improves welfare. In order to analyze the impact of AFTA on member coun-tries’ export performance, this paper develops a basic gravity model to perform cross sectional data analysis involving sixty countries, both members and non-members of AFTA, for the periods of 1991, 2001, and 2012. The main finding of this study is that after AFTA came into force, there was a positive effect on the member countries’ export performance.
Relevance to Development Studies
Free trade agreements (FTAs) are a source of major debate and discussion in the field of development. The establishment of free trade agreements has had some impact on the competitiveness of member countries’ products, with positive impacts on economic growth. Through free trade, regions and companies are able to focus on the goods or services that they are best able to provide. Among the key characteristic of FTAs is that they are intended to reduce the trade barriers between two or more countries. These barriers are supposedly in place for the protection of local markets and industries, yet often end up doing more harm to economies than good. Along with strengthening economies, FTAs are also designed to benefit consumers, with the idea being that increased competition results in a greater diversity and abundance of products available to consumers at lower prices. Under free trade, risk-taking is awarded through both increased sales and increased market shares. When larger countries engage in free trade, their economies grow as a result. This growth overflows into smaller countries that have less economic stability or are stuck in poverty but are open to trade. The findings of this study highlight the impacts of FTAs on ASEAN members’ export performance. These findings can be considered by policy makers in the formulation of trade policies that can minimize the disadvantages of FTAs while maximizing their benefits.
Keywords
Free Trade Agreement, Gravity Model, Export Flows, ASEAN
1
Chapter 1 Introduction
1.1 Background
Over the past few years, free trade has become a new trend in Asia. Coun-tries in Asia are expanding economic integration through bilateral and plurilat-eral free trade agreements (FTAs). As the foundation of the theory of Compar-ative Advantage, all countries can’t meet their own needs because resources available in each country are not often enough to meet demands. Then the trade is considered as one way to meet the needs of the countries. Every coun-try has specific resources, even excessively so it can’t meet domestic demand. For that reason trading with other countries becomes a solution.
The major factors that determine the current expansion of FTA in Asia can be distinguished as follows: (i) The slow pace of the World Trade Organi-zation (WTO)’s Doha negotiations makes FTAs a viable alternative; (ii) FTAs can support Asia’s market-driven economic integration through additional lib-eralization of trade and foreign direct investment policy; (iii) European and North American economic regionalism motivated policy makers in Asian countries to enhance international competitiveness; (iv) Asian financial crisis in 1997-1998 proved that regional initiatives are required to maintain growth and stability by overcome common challenges (Kawai et al, 2010).
In the beginning of 1990s a new regional trade agreement has become the major arrangement of trade liberalization. Most economists generally agree that multilateral liberalization is simultaneously beneficial for the member countries. Preferential liberalization is contentious because of its discriminatory nature. Members of regional trade agreements agree to reduce trade barriers but their import tariff from non-member countries remains unconstrained. This ar-rangement can lead member countries to change inefficiently produced im-ports from member countries for import formerly sourced efficiently from outsiders. Regional trade agreement can induce trade diversion and lead to negative effects for non-member countries through lost markets and will also create detrimental effects for the member countries through reduced tariff rev-enue. Nevertheless, regional trade agreements tend to improve trade of goods efficiently sourced between member countries and lead to trade creation that improves welfare. Trade creation and trade diversion induce preferential liber-alization that can both reduce welfare and enhance welfare. The impact of the two forces can be different for various trade agreements (Pardo et al. 2009).
Association of Southeast Asian Nations (ASEAN) was established on 8 August 1967 in Bangkok, Thailand, and was marked by the signing of the ASEAN Declaration (or Bangkok Declaration) by its founder members, name-ly Indonesia, Malaysia, the Philippines, Singapore and Thailand. Brunei Darus-salam joined on January 7, 1984; Vietnam on July 28, 1995; Laos and Myanmar on 23 July 1997, and Cambodia on December 16, 1998. Current ASEAN membership comprises ten (10) countries. Economic integration in ASEAN has both political and economic purposes. Geopolitical factors in the ASEAN region that supports regional cooperation in political and security environment in Southeast Asia in the 1960s and 1970s also inspired the leaders of ASEAN
2
countries at that time to work together in bringing about peace and security in Southeast Asia. Some territorial dispute among the countries in Southeast Asia also helped the unification of economic markets in the ASEAN region.
The evolution of ASEAN can be traced from the signing of a regional economic cooperation agreement creating Free Trade Agreements (FTAs) in 1992, to the creation an ASEAN Economic Community (AEC) blueprint by 2015. The ASEAN Free Trade Area (AFTA) was agreed by ASEAN member countries to establish a regional trade area aimed at improving regional eco-nomic competitiveness of ASEAN and making the region a world production base in 15 years. This agreement accelerated in 2003 and following members’ adoption of the Common Effective Preferential Tariff (CEPT) in 2002. With AEC, ASEAN is expected to be integrated (as a single market) and making it a dynamic and competitive production base.
Economic diversity among countries in the ASEAN region was initially an obstacle to the creation of regional economic integration. ASEAN members show the diversity of the area, population size, level of economic development, per capita income, and openness to international trade and foreign investment. This diversity raises a different perception of the benefits of economic integra-tion in the region. Less advanced economies (especially Lao PDR) are seen to be at a disadvantaged position within the proposed regional economic integra-tion, particularly within free markets and an open economy. On the one hand, there is the view that free and open markets in the region will be more profita-ble for advanced economies like Singapore.
ASEAN proved its regional stability during the 2008 crisis affecting among the major powers in Asia and is showing its resilience amidst the cur-rent global crisis. Even though regional integration requires trade and invest-ment liberalization, FTAs likely have attracted countries involved. AFTA has been ratified since 2003 between its members. Every single member of AFTA also has attempted to negotiate with ASEAN non-member countries to ar-range further bilateral trade agreements. Nowadays those bilateral trade agree-ments are likely to evolve into agreement between ASEAN member and other trading countries (Ariyasajjakorn et al. 2009).
ASEAN expansion into ASEAN + 1 and ASEAN + 3 indicates that shal-low integration have changed into deep integration and develop into regional-ism. For Asian countries, regionalism is a continuation of regionalization where formal trade agreements have formed part of the reform process and are used to reinforce the goal of economic development strategy of export-oriented member states (ADB 2008). Expansion of ASEAN cooperation is still in the process of negotiation such as the ASEAN-European Union FTA, the Com-prehensive Economic Partnership for East Asia, East Asia Free Trade Area (ASEAN + 3) and the Regional Comprehensive Economic Partnership.
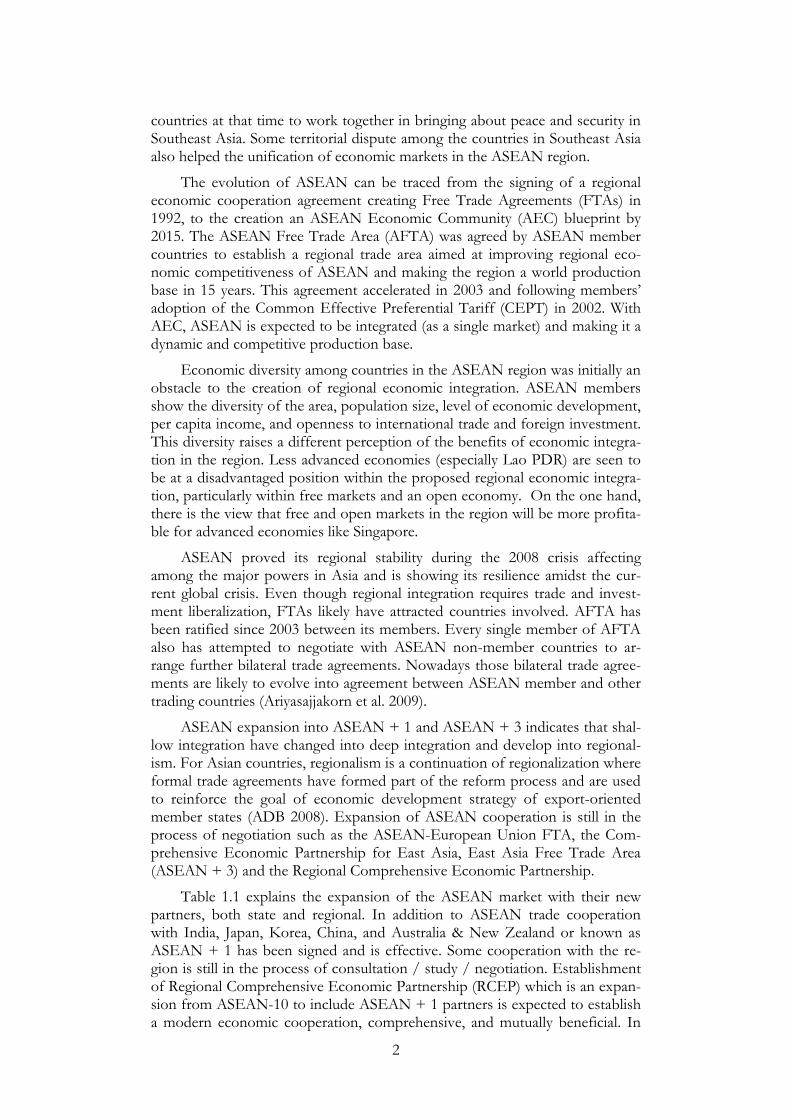
Table 1.1 explains the expansion of the ASEAN market with their new partners, both state and regional. In addition to ASEAN trade cooperation with India, Japan, Korea, China, and Australia & New Zealand or known as ASEAN + 1 has been signed and is effective. Some cooperation with the re-gion is still in the process of consultation / study / negotiation. Establishment of Regional Comprehensive Economic Partnership (RCEP) which is an expan-sion from ASEAN-10 to include ASEAN + 1 partners is expected to establish a modern economic cooperation, comprehensive, and mutually beneficial. In
3
the ASEAN Free Trade Area (AFTA), four new ASEAN member countries, namely Cambodia, Myanmar, Laos, and Vietnam (CMLV) have integrated their tariffs on imported goods through ASEAN Integration System of Preferences (AISP).
Table 1.1 Trade Cooperation Involving ASEAN Countries
Agreements for Economic Cooperation and/Trade
Status
Effective
In the process of negotiation / consultation / study
ASEAN Free Trade Area (AFTA) √
ASEAN-Australia and New Zealand FTA √
ASEAN-EU FTA √
ASEAN-India Comprehensive Economic Cooperation Agreement
√
ASEAN-Japan Compehensive Economic Partnership
√
ASEAN-Korea Comprehensive Economic Cooperation Agreement
√
ASEAN-People’s Republic of China Comprehensive Economic Cooperation Agreement
√
Comprehensive Economic Partnership for East Asia (CEPEA)
√
East Asia Free Trade Area (ASEAN+3) √
Regional Comprehensive Economic Partnership (ASEAN+6)
√
Source : ADB Asia Regional Integration Center – FTA Database , 2013
In light of successes of trade liberalization under AFTA, this paper aims to investigate the impact of AFTA on the economic performance among the AFTA member countries. Particularly, I am interested in whether AFTA has promoted export among the AFTA member countries, as was predicted before the implementation of AFTA. I conduct regression analyses by applying a gravity model.
1.2 Problem Statement
Free trade has been one of the most debated topics in economics in the last decades. A question arises whether free trade agreements and trade liberalization are indeed beneficial for the world. On the one hand, this would be beneficial for member countries since they will improve their export competitiveness and the mechanism of export and import will be more efficient due to reductions in very high tariffs and removals of trade barriers. On the other hand, countries may lose economic and standard value. Local production sectors maybe highly affected negatively, which means that all established small industries will be at risk. This situation would threaten domestic manufacture products because it should be able to compete with cheaper and better quality of imported products. The implementation of the FTA means removing tariff barriers that have been useful for the protection of domestic industry.
4
This study involves 10 countries of ASEAN and countries/dialogue partners (ASEAN+1FTAs). The purpose of this paper is to conduct an economic evaluation study of this FTA in both its pre-negotiation phase and after its implementation. Post implementation can illustrate how AFTA affects the trade flow by estimating what would have happened to trade flows if there had been no FTA. Thus, counterfactual scenario should be created to compare with actual flows. In this way, this study can estimate how much of the changes in export performance can be attributed to ASEAN.
1.3 Objectives of the Study
This paper aims to investigate the impact of AFTA on export among its member countries. Particularly, whether AFTA has promoted export between its member countries, as was expected before the establishment of the free trade agreement.
1.4 Research Question
This paper will explore the following question:
Does AFTA affect a member country’s export?
1.5 Scope and Limitations of the Study
The notable achievement of FTA has influenced export performance both for member and non-member of the FTAs. Trade creation and trade di-version are the effects of the establishment of FTA. This paper only analyzes the export performance of sixty countries. Additionally, I will limit my analysis to three years namely: 1991, 2001 and 2012. A further limitation of this paper is that it does not explicitly deal with the welfare effects of the FTAs, for in-stance, impacts of FTAs on factors such as employment, income, etc. This is beyond the scope of this paper, but my hope here is that this paper can lay the groundwork for further study in these areas.
1.6 Organization of Research Paper
The research paper constitutes six chapters, beginning with introduction, background of the study, problem statement, research objective, research questions and limitation of the study in the first chapter. The second chapter gives an explanation of theoretical framework on concepts and theories of trade and presents a literature review with regards to free trade agreements. The third chapter provides an overview of AFTA as Free Trade Agreement. Description of data and methodology are presented in chapter four. Chapter five consists of results and discussions of an econometric analysis presented to investigate the effects of AFTA on export performance. Chapter six gives a conclusion of the main findings including policy recommendations.
5
Chapter 2 Theoretical Framework and Literature Review
This chapter explores and provides discussion on general theory about free trade agreements. It begins with a discussion on trade liberalization, followed by an overview of international trade theories. An explanation of free trade agreement is provided. Finally, previous studies that have been conducted by some researchers are also discussed here.
2.1 Theoretical Framework
2.1.1 Trade Liberalization
Trade liberalization refers to a series of actions to become open to trade internationally, including an orderly reduction and elimination of tariff barriers and other barriers among trading countries. These measures may entail that countries entering into FTA reduce or eliminate trade barriers for example tariffs, quotas, export subsidies and taxes (Bezuneh et al. 2001).
The general impacts of trade liberalization vary, and not always pro-poor. Trade reforms are believed to improve the incomes of unskilled labour that produce unskilled-intensive commodities in countries with a comparative advantage. Even though trade policy has decreased poverty, there are still is-sues of distribution of income. The most important issue for developing and industrialized countries is about supporting labourers that 'move out of con-tracting (import-competing) sectors into expanding (exporting) sectors' (Zagha et al. 2005).
According to Romer (1994), the main aim of trade restriction is to de-crease the stock of intermediate goods in the market. This issue leads to an in-fra-marginal impact on productivity. Romer points out that neglecting this ef-fect may result in a problem with approximate calculation of the production penalty of protection. This effect will appear as a positive relationship among trade liberalisation and productivity, and can alsobe considered as the positive relationship between trade openness and productivity.
2.1.2 International Trade Theory
The basic idea of Adam Smith’s theory of international trade is on the division of labour. The advance of division of labour leads to more output as a result of production from the same number of labour. In addition, Smith pointed out that international trade is profitable for nations. If trade with other countries is set up, the expansion of division of labour likely to gain because international market is larger compared to domestic market. Nations will bene-fit from the additional annual produce of land and labour. This condition leads to the increase of the real wealth of the nation and population (Schumacher 2012).
Smith emphasizes that division of labour works for both domestic and international trade. Every country can specialize in the export of products that have an absolute advantage and import products from other countries that gained absolute loss. Through absolute advantage, each country can gain
6
worldwide production and benefit from specialization. This is advantageousif free trade between the two countries has mutually different absolute advantage and has interaction of export and import. This condition can increase the prosperity of the country (Schumacher 2012).
David Ricardo and John Stuart Mill proposed a theory of comparative advantage of free trade. This theory posits that labour cost is the only variable factor and specialization benefits from trade. It is impossible for people to ful-fil all of their needs. People discover that it is beneficial to take part in activities that are profitable or have a comparative advantage as factor endowment. This condition leads to the phenomenon of specialization. Countries should special-ize in production activities that could yield the biggest advantage from trade. (Todaro 2009).
The theory of international trade takes relative cost and price differ-ences as the basic concepts. Comparative advantage theory affirms that a coun-try should specialize to produce products at a lower relative cost to enter mar-kets within competitive conditions. The phenomenon of differentiation in comparative advantage highlights the benefit of international trade although between unequal trading partner countries (Todaro 2009).
Eli Heckehrs and Bertil Ohlin introduced neoclassical theory. They emphasized differences for factor supply especially for land, labour and capital on international specialization. The classical theory of trade by Heckscher-Ohlin points out trade based on the comparative advantage of countries with very different characteristics. The basis of comparative advantage is factor en-dowment that can define trade patterns affected by economic growth (Todaro 2009).
A country can be considered as abundant in a resource if it has a large reserve of goods for that resource. A country will likely produce more com-modities for which they have a large quantity of resource. This condition is the basic notion of Heckscher-Ohlin’s theory. The adjustment of relative price of commodities has a powerful effect on the relative earnings of resources, as trade can impact relative price, international trade may have an impact on in-come distribution. 'The owners of a country’s abundant factors gain from trade, but the owners of scarce factors lose. However, there are still gains from trade, in the limited sense that the winners could compensate the losers, and everyone would be better off' (Krugman et al. 2012).
International trade enables the establishment of an integrated market that is bigger than one single market of a country. Hence, it is possible to give consumers a diversity of products with lower prices. The term for this kind of trade is intra-industry trade. In the last fifty years, the relative amount of worldwide intra-industry trade has steadily become larger. The amount of in-tra-industry trade depends on an industrial categorization system that classifies commodities into dissimilar industries. Nowadays intra-industry trade has an important role for the trade of manufactured commodities between advanced industrial countries, which are related to the most of world trade (Krugman et al. 2012).
Krugman (1979) proposed a new trade theory and argues that trade al-so takes place among countries that have very similar characteristics, technolo-gy, and factor endowments. He introduced a model of non-comparative ad-
7
vantage trade, trade is generated by economies of scale instead of dissimilarity of factor endowments or technology.
2.1.3 Free Trade Agreements
Economic integration takes place if a group of countries in the same region unite together to arrange an economic union or regional trading bloc by setting a common tariff on goods from non-member countries and, at the same time, freeing internal trade between member country. In terms of integra-tion, countries apply a custom union if they impose common external tariffs while freeing internal trade between member countries. While members to the agreement enjoy free internal trade among one another, tarriffs could be applied on non-member countries. Finally, countries have established a com-mon market if ithas all the characteristics of customs union (common external tariffs and free internal trade) and have freer movement of labour and capital between member countries (Todaro 2009).
A Free Trade Agreement (FTA) is the form of trade agreement among countries, in which members agree to eliminate tariff and non-tariff barriers for several commodities traded among themselves. The goal of FTA is to improve the trade value among member countries (Kepaptsoglou, 2010).
Each member in a free trade agreement keeps up and applies its tariff regime with reference to non-member countries. This fact leads to three con-cerns. First, FTA should be based on rules of origin. Without rules of origin there will be transhipment, this condition happens when non-member coun-tries export products to member countries that have the lowest tariff and then re-exports the product to other member countries. Free trade agreement has become an unofficial customs union that imposes the lowest tariff line among the members’ tariffs. Rules of origin are necessary for FTA. There will be a cost to implement the rules. Second, the price of products will be different in each FTA member country because FTA member countries may apply differ-ent lines of external tariffs while at the same time they must be at the same line tariff in a customs union. Third, even though FTA members keep up their au-tonomy with the tariff regime toward non-member countries, the autonomy can be used by special interest groups at the national level. These groups may lobby to their government at the regional level to accept their special interest (Plummer et al. 2010).
Before the establishment of Viner’s model (static effects of an FTA), it was a common belief that free trade agreements will lead to improvement of the welfare because it included some degree of trade liberalization. Viner’s model broke the myth by showing that free trade agreement may have negative effect on welfare. His model shows that free trade agreement would be harm-ful for the welfare or not, based on the net effect of trade creation and trade diversion (Plummer et al. 2010).
Trade creation can take place when external trade barrier and internal free trade can encourage trade relationships between member countries and shift from the high cost production member states to the low cost production member states. By contrast, trade diversion occurs when external tariff barrier leads to 'the production and consumption from lower-cost non-member sources of supply to higher-cost member producers'. Trade creation is considered desirable because it im-proves resource allocation. In contrast, trade diversion is considered undesira-
8
ble because both member and non-member countries may be worse off as a result of diversion of production from highly efficient non-member countries to the less efficient member countries (Todaro 2009: 619).
The reduction in tariff and non-tariff barriers as consequences of FTA still gives an opportunity for the member countries to benefit from the increase of intra-bloc competition. The increased competition from trade partner leads to a negative impact onless productive firms and gives positive impact to pro-ductive firms. It also gives firms an opportunity to invest in productive pro-cesses and technology. The competitive forces may encourage structural effi-ciency and resource allocation because each member country specializes in in the production of different commodities. These effects also can raise FTA members’ long-run growth prospects (Plummer et al. 2010).
2.1.4 Welfare Effects
Even though countries may benefit from trade in most cases, it is still possible that international trade may result in a disadvantage to specific groups within country. In the other words, international trade will have tremendous impact on the distribution of income. The side effects of trade in terms of the distribution of income have been a consideration of international trade theo-rists who raise concerns about how international trade can negatively influence the owner of specific industries that face import, therefore can’t find another possibility of employment in other industries. Trade may change the distribu-tion of income among extensive groups, for example labors and the capital owner (Krugman et al. 2012).
Trade has important effects for distribution of income between trading countries, hence in the implementation, the advantages of trade are frequently distributed very unevenly. There are two motives why international trade has powerful effect for the distribution of income. First, for the short-run conse-quence of trade, resources can’t move right away or without expense from one industry to another industry. Second, for the long-run consequence of trade, the transformation of commodities that are produced in a country will usually decrease the demand for a few factors of production, at the same time increas-ing the demand for other factors of production. For these motives, interna-tional trade is clearly beneficial. On one hand, trade may give some advantages for the country as a whole but on another, trade may give the disadvantage for the important groups for the short run and the long run (Krugman et al. 2012).
2.2 Literature Review
Several studies have been conducted on the impact of free trade agreements on trade flows. Some of findings are discussed below.
Kien (2009) investigated the determinants of export flows of the member countries in the AFTA through the gravity model by using the Hausman-Taylor (HT) estimation for a country panel data of thirty-nine countries from 1988 until 2002. He found that export flows increased proportionately with GDP, and the implementation of AFTA resulted in significant trade creation among the member of AFTA.
Endoh (1999) studied the actual effects of three regional economic integration: the European Economic Community (EEC), the Latin American Free Trade Association (LAFTA) and the Council of Mutual Economic
9
Assistance (CMEA) with the new version of the gravity model for the year 1960-1994. The study shows that FTA dummy variables bring about trade creation effect and that trade diversion effect with statistically significant coefficients. The trade creation and trade diversion effect of each FTA tended to be weak in the 1990s. It was also discovered that each FTA had a unique international trade character.
MacPhee et al. (2014) examined the impacts of twelve major Regional Trade Agreements (RTAs) on intra and extra-regional trade flows in member developing countries. The study found that RTAs succeed in improving intra-bloc trade creation. Some RTAs such as the Southern Asian Preferential Trade Arrangement, Gulf Cooperation Council, Pan-Arab Free Trade Area, and West African Economic and Monetary Union, were discovered to have had negative intra-bloc effects. The reason for the negative intra-bloc effects for these RTA is the unsuccessful elimination of tariffs barriers and non-tariff barriers.
Bergstrand [1985, 1989] gave the basic theoretical foundation for the gravity model. The traditional gravity model includes three variable: '(1) Economic factors affecting trade flows in the exporting country (2) Economic factors affecting trade flows in the importing country (3) Natural or artificial factors enhancing or restricting trade flows between trading partners' (Karemera et al. 1999:349).
In the last forty years, the gravity model has been widely used in international trade research. The gravity model has proved its empirical robustness and explanatory power. Since its introduction by Tinbergen in early 1960s, gravity models has been employed in many studies to analyze and assess trade policy implications, specifically to analyze the impacts of Free Trade Agreements on international trade (Kepaptsoglou 2010).
The gravity model is one of the most important methods to analyze international trade relations, particularly in analyzing bilateral trade flows. This model is based on Newton's theory that the gravity between two objects is positively related to their masses and negatively by the distance between them. The basic gravity formula points out that the trade flow among two countries is positively proportional to their economic masses and can be reflected by the countries' GDPs, and adversely by the distance between them. On the one hand, the more two countries produce, the greater the GDPs, the greater the trade flow between them. On the other hand, the farther the distance between two countries, the lower the trade flow between them. One important fact is that transport cost is still take a larger part in transaction cost. The transportation cost will increase the price and the consumer from the importing country should pay for it. Transport cost is one of the obstacle to the bilateral trade flow (Molders et al. 2011).
Gross Domestic Product (GDP) represents the economic size of two countries and with reference to production capacity and size of market. Countries with a larger production capacity tend to get economic of scale and improve their comparative advantage. They also have bigger domestic market which has the ability to import more goods. For that reason, it can be implied that the greater the product of the two countries’ GDPs, the greater bilateral trade volume between them (Sohn 2005).
Transportation costs have become substantial part of international trade. The farther distance and poorer infrastructure gain transport costs. Upgrading the infrastructure will leadto decreasing transport cost and as a result the volume of trade will increase. Economies of scale represented by trade volume is relevant to explain the variety of transport costs. Economic
10
policies which can reduce transportation cost is effective to increase competitiveness. The other way to increase the competitivemess is to invest in port infrastructures as well as other transport infrastructures (Zarzoso et al. 2005).
A country’s demand and supply are the measurement of economic and market size. The higher number of population in exporter countries may increase the bilateral trade flow. Population has high propensity to enhance bilateral trade flows and the level of specialization by gaining product specialization (Làszlò 1997).
Karemera et al. (1999) showed that ASEAN can improve trade among ASEAN members and non-ASEAN members, and also promote trade creation and trade diversion effects. Their study proves that trade agreements are advantageous for member and non-member countries of the trade agreement.
According to Itakura (2013) although there is differentiation in the degree of positive impacts to welfare, all of the FTAs signed by ASEAN member countries tend to improve welfare above the baseline standard. Among the FTA policy scenarios, the ASEAN+6 (China, Japan, Korea, India, Australia, New Zealand) FTA give the biggest positive impact on real Gross Domestic Product (GDP) for most of the ASEAN member countries. Liberalization reforms through ASEAN FTAs attract and impress investors into the ASEAN region both from domestic and foreign investment, as well as increasing the scale, volume and efficiency of international trade.
Okabe et al. (2014) used the gravity model and found that there are positive and significant trade creation effects from the tariff elimination by applying AFTA on intra-ASEAN trade. Trade creation effects for the old member of ASEAN countries relatively big compared to those for the new member countries. In addition, AFTA has been successful in improving the trade value in intra-AFTA. Further benefits can be achieved by improving the use of AFTA and by reducing nontariff measures.
11
Chapter 3 Overview of AFTA as Free Trade Agreement
3.1 ASEAN Economic Integration
The evolution of ASEAN is a regional economic cooperation agree-ment with the creation of Free Trade Agreement (FTA) in 1992 and ASEAN Economic Community (AEC) blueprint by 2015. ASEAN Free Trade Area (AFTA) was agreed by ASEAN member countries to establish a regional trade area aimed at improving regional economic competitiveness of ASEAN and also ASEAN as a world production base in 15 years. This agreement is acceler-ated into 2003 and eventually agreed to start in 2002 through the Common Ef-fective Preferential Tariff (CEPT). With AEC, ASEAN is expected to be inte-grated (as a single market) and ASEAN as a more dynamic and competitive production base (ASEAN Secretariat, 2015).
ASEAN economic integration models stickle to the main destination as regional institutions that cooperate in peace, security, and prosperity for the people of ASEAN so that the various schemes ASEAN economic cooperation taking into account the development progress of its member countries. The addition ASEAN membership from ASEAN-5 into ASEAN-6 and ASEAN-10 in 2012 is to encourage the Initiative for ASEAN Integration (IAI). IAI aims to reduce the development gap and improve the competitiveness of the region as a framework for regional cooperation among ASEAN members (de-veloped country and less developed country) (ASEAN Secretariat, 2015).
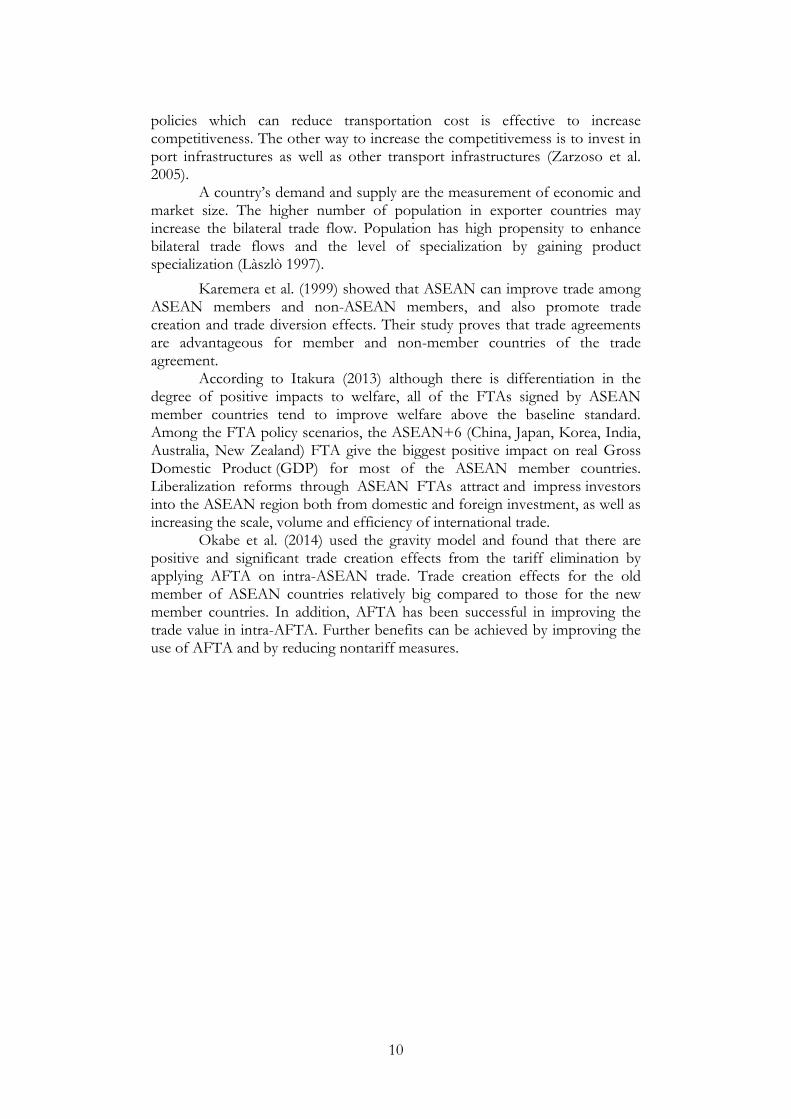
Removal of trade barriers and enhancement of trade facilitation are among the most important and earliest economic integration initiatives that ASEAN has been pursuing. The removal of trade barriers has been centred on the removal of intra-ASEAN tariffs through commitments on Common Effec-tive Preferential Tariff (CEPT) under the ASEAN Free Trade Area (AFTA). With the ASEAN Trade in Goods Agreement (ATIGA) that came into effect in May 2010, a more comprehensive approach has also been taken to further facilitate trade beyond the removal of formal trade restrictions (i.e. tariffs) through more simplified, harmonised and streamlined customs documents, and rules and procedures, as well as removal of other technical barriers to trade. Goods are expected to move more easily across borders due to reduction in transaction time, costs and technical barriers to trade, benefiting both export-ers, importers, producers and consumers, enhancing intra-ASEAN trade and contributing to the broader regional integration agenda (ASEAN Secretariat, 2015).
Figure 3.1 Average AFTA Tariffs (1993-2012) - (In Percent)
Source: Author, Computed based data from ASEAN Secretariat
12
Important improvement has been made in the advancement of ASEAN’s regional economic integration. The removal of formal restrictions in different areas, along with other facilitating domestic and external factors, has contributed to growing trade and investment in the region. Tariffs on intra-ASEAN have been removed significantly. ASEAN-6, namely Brunei Darus-salam, Indonesia, Malaysia, Philippines, Singapore and Thailand, has applied zero tariff rates for intra-ASEAN trade in more than 99% of tariff lines since 2010 (ASEAN Secretariat, 2015).
Progress has also been made in the newer ASEAN Member States, i.e. Cambodia, Lao PDR, Myanmar, and Viet Nam (CLMV) where zero tariff rates have been applied to 72.6% of tariff lines in 2012, a significant increase from only 45.9% in 2010. ASEAN-6 has eliminated tariffs on 7,881 additional tariff lines so that there are some 54,467 tariff lines to zero import duty (zero duty) or 99.65% of the tariff lines traded under the Common Effective Preferential Tariff (CEPT-AFTA). Of the 7,881 additional tariff lines, there are goods in the sector for the ASEAN-4, a number of 34,691 tariff lines, or 98.96% of to-tal tariff lines has been at an average rate of 0-5% rate after the rate of 2,003 additional tariff lines lowered to 0-5% (ASEAN Secretariat, 2015).
Successful implementation of various ASEAN initiatives such as the ATIGA and ACIA - as reported in the AEC Scorecard – has enhanced trade facilitation, competitiveness and investment. Thus, ASEAN is increasingly fo-cused on efforts to further increase trade among member countries of ASEAN (ASEAN Member States). In this context, and in order to facilitate the flow of goods as well as to promote the production network in the ASEAN region, ASEAN Member States adopted the Trade Facilitation Work Program in 2008 and the Trade Facilitation indicators in 2009 (ASEAN Secretariat, 2015).
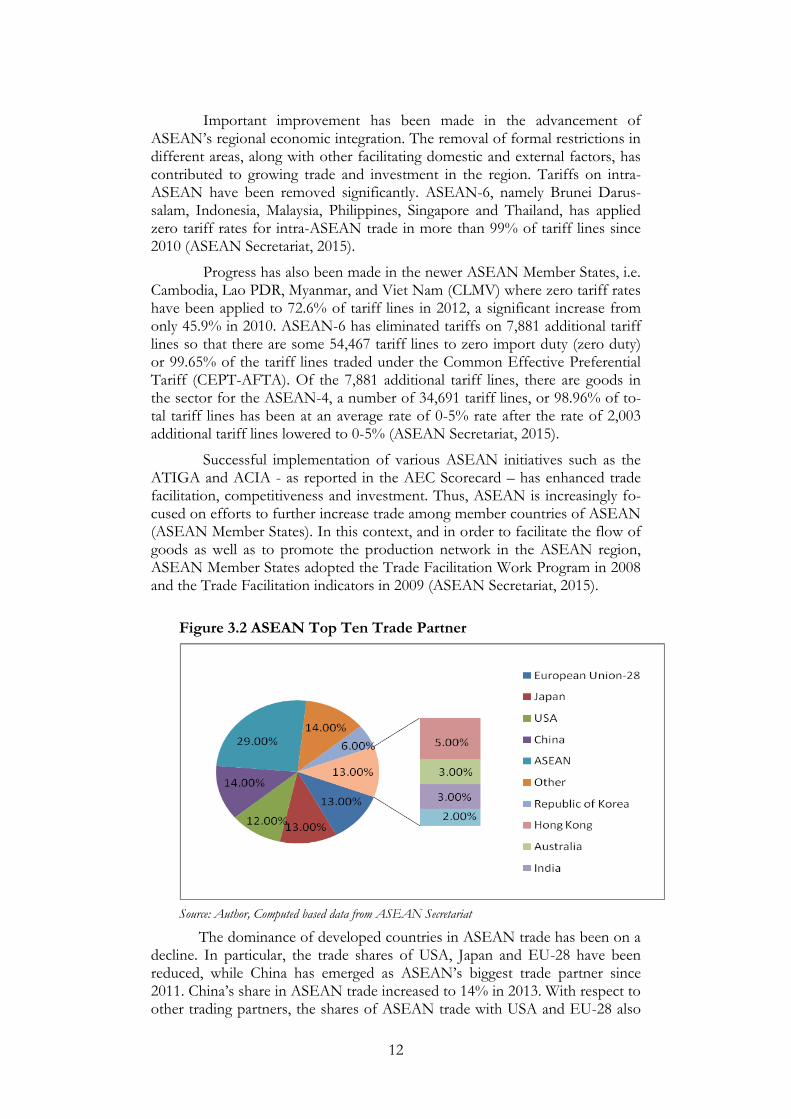
Figure 3.2 ASEAN Top Ten Trade Partner
Source: Author, Computed based data from ASEAN Secretariat
The dominance of developed countries in ASEAN trade has been on a decline. In particular, the trade shares of USA, Japan and EU-28 have been reduced, while China has emerged as ASEAN’s biggest trade partner since 2011. China’s share in ASEAN trade increased to 14% in 2013. With respect to other trading partners, the shares of ASEAN trade with USA and EU-28 also
13
declined significantly. Data indicated significant increase in the position of China in ASEAN trade, while the share in ASEAN trade with Japan declined.
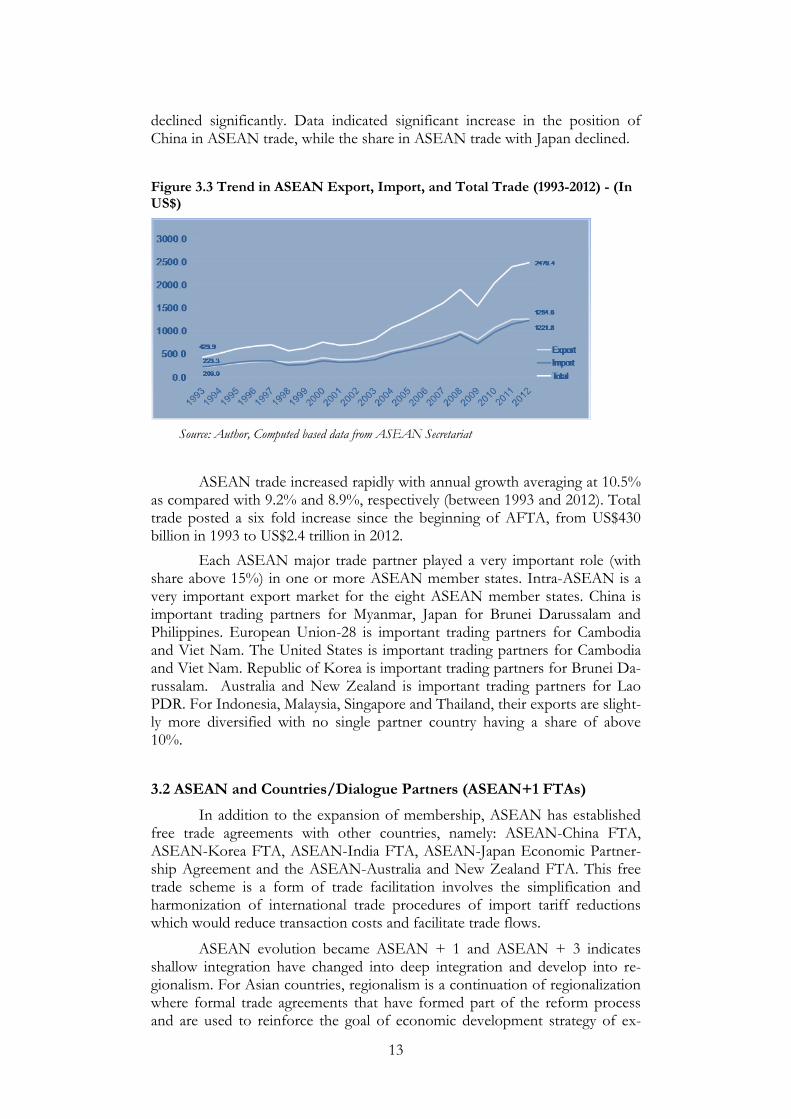
Figure 3.3 Trend in ASEAN Export, Import, and Total Trade (1993-2012) - (In US$)
Source: Author, Computed based data from ASEAN Secretariat
ASEAN trade increased rapidly with annual growth averaging at 10.5% as compared with 9.2% and 8.9%, respectively (between 1993 and 2012). Total trade posted a six fold increase since the beginning of AFTA, from US$430 billion in 1993 to US$2.4 trillion in 2012.
Each ASEAN major trade partner played a very important role (with share above 15%) in one or more ASEAN member states. Intra-ASEAN is a very important export market for the eight ASEAN member states. China is important trading partners for Myanmar, Japan for Brunei Darussalam and Philippines. European Union-28 is important trading partners for Cambodia and Viet Nam. The United States is important trading partners for Cambodia and Viet Nam. Republic of Korea is important trading partners for Brunei Da-russalam. Australia and New Zealand is important trading partners for Lao PDR. For Indonesia, Malaysia, Singapore and Thailand, their exports are slight-ly more diversified with no single partner country having a share of above 10%.
3.2 ASEAN and Countries/Dialogue Partners (ASEAN+1 FTAs)
In addition to the expansion of membership, ASEAN has established free trade agreements with other countries, namely: ASEAN-China FTA, ASEAN-Korea FTA, ASEAN-India FTA, ASEAN-Japan Economic Partner-ship Agreement and the ASEAN-Australia and New Zealand FTA. This free trade scheme is a form of trade facilitation involves the simplification and harmonization of international trade procedures of import tariff reductions which would reduce transaction costs and facilitate trade flows.
ASEAN evolution became ASEAN + 1 and ASEAN + 3 indicates shallow integration have changed into deep integration and develop into re-gionalism. For Asian countries, regionalism is a continuation of regionalization where formal trade agreements that have formed part of the reform process and are used to reinforce the goal of economic development strategy of ex-
14
port-oriented member states (ADB, 2008). Some expansion of ASEAN coop-eration is still in the process of negotiating such as the ASEAN-European Un-ion FTA, the Comprehensive Economic Partnership for East Asia (CEPEA), East Asia Free Trade Area (ASEAN + 3) and the Regional Comprehensive Economic Partnership (RCEP). RCEP which still in the negotiation process is expected to make ASEAN a deal that modern, high-quality, comprehensive and mutual benefit between ASEAN and its partners.
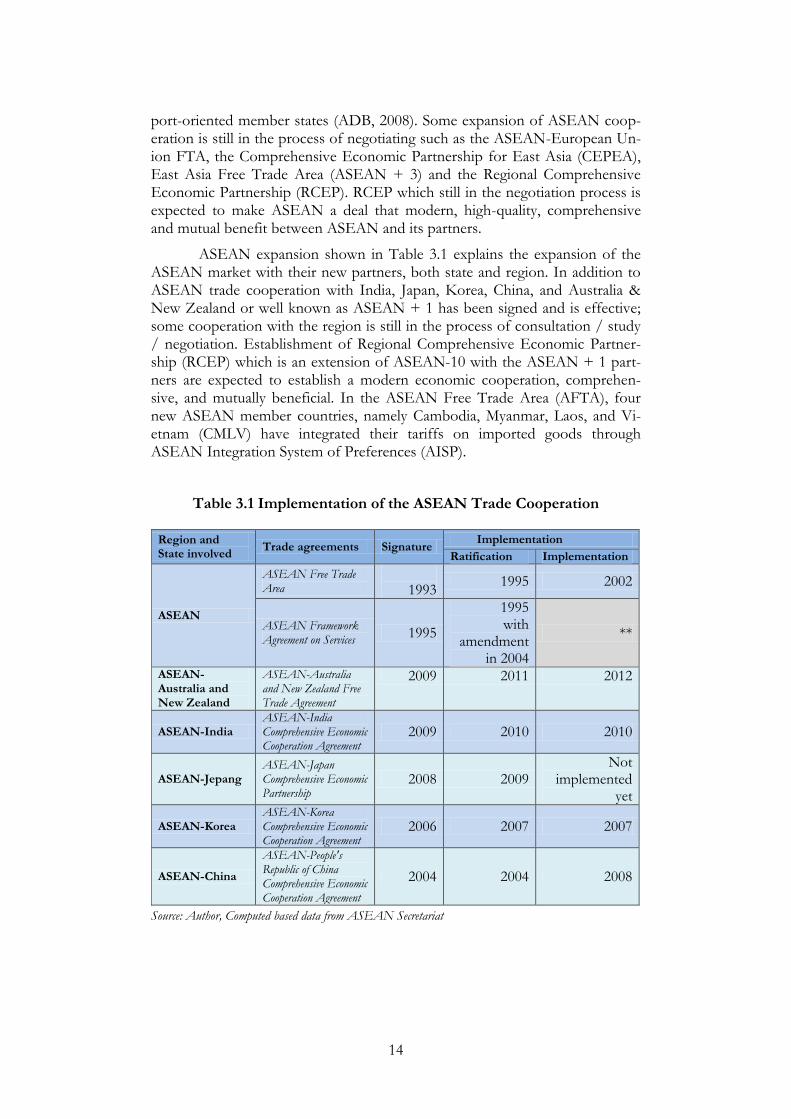
ASEAN expansion shown in Table 3.1 explains the expansion of the ASEAN market with their new partners, both state and region. In addition to ASEAN trade cooperation with India, Japan, Korea, China, and Australia & New Zealand or well known as ASEAN + 1 has been signed and is effective; some cooperation with the region is still in the process of consultation / study / negotiation. Establishment of Regional Comprehensive Economic Partner-ship (RCEP) which is an extension of ASEAN-10 with the ASEAN + 1 part-ners are expected to establish a modern economic cooperation, comprehen-sive, and mutually beneficial. In the ASEAN Free Trade Area (AFTA), four new ASEAN member countries, namely Cambodia, Myanmar, Laos, and Vi-etnam (CMLV) have integrated their tariffs on imported goods through ASEAN Integration System of Preferences (AISP).
Table 3.1 Implementation of the ASEAN Trade Cooperation
Region and State involved
Trade agreements Signature Implementation
Ratification Implementation
ASEAN
ASEAN Free Trade Area
1993
1995 2002
ASEAN Framework Agreement on Services
1995
1995 with
amendment in 2004
**
ASEAN-Australia and New Zealand
ASEAN-Australia and New Zealand Free Trade Agreement
2009 2011 2012
ASEAN-India ASEAN-India Comprehensive Economic Cooperation Agreement
2009 2010 2010
ASEAN-Jepang ASEAN-Japan Comprehensive Economic Partnership
2008 2009 Not
implemented yet
ASEAN-Korea ASEAN-Korea Comprehensive Economic Cooperation Agreement
2006 2007 2007
ASEAN-China
ASEAN-People's Republic of China Comprehensive Economic Cooperation Agreement
2004 2004 2008
Source: Author, Computed based data from ASEAN Secretariat
15
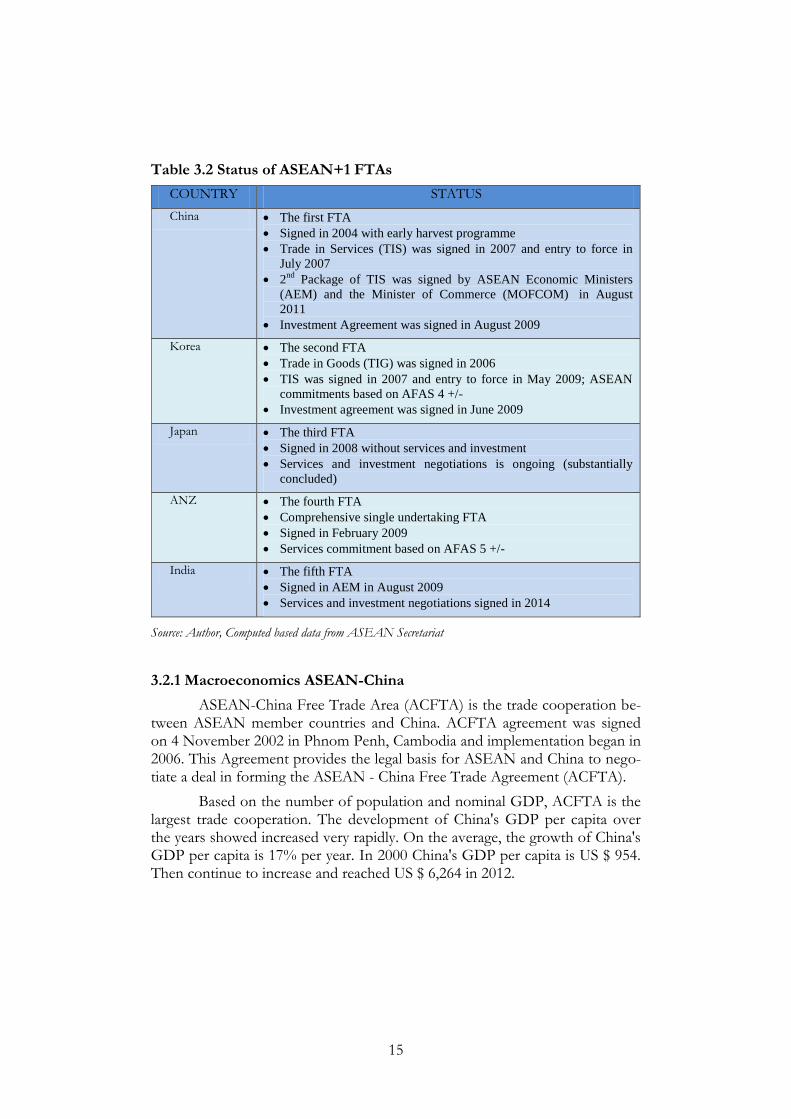
Table 3.2 Status of ASEAN+1 FTAs
COUNTRY STATUS
China The first FTA
Signed in 2004 with early harvest programme
Trade in Services (TIS) was signed in 2007 and entry to force in
July 2007
2nd
Package of TIS was signed by ASEAN Economic Ministers
(AEM) and the Minister of Commerce (MOFCOM) in August
2011
Investment Agreement was signed in August 2009
Korea The second FTA
Trade in Goods (TIG) was signed in 2006
TIS was signed in 2007 and entry to force in May 2009; ASEAN
commitments based on AFAS 4 +/-
Investment agreement was signed in June 2009
Japan The third FTA
Signed in 2008 without services and investment
Services and investment negotiations is ongoing (substantially
concluded)
ANZ The fourth FTA
Comprehensive single undertaking FTA
Signed in February 2009
Services commitment based on AFAS 5 +/-
India The fifth FTA
Signed in AEM in August 2009
Services and investment negotiations signed in 2014
Source: Author, Computed based data from ASEAN Secretariat
3.2.1 Macroeconomics ASEAN-China
ASEAN-China Free Trade Area (ACFTA) is the trade cooperation be-tween ASEAN member countries and China. ACFTA agreement was signed on 4 November 2002 in Phnom Penh, Cambodia and implementation began in 2006. This Agreement provides the legal basis for ASEAN and China to nego-tiate a deal in forming the ASEAN - China Free Trade Agreement (ACFTA).
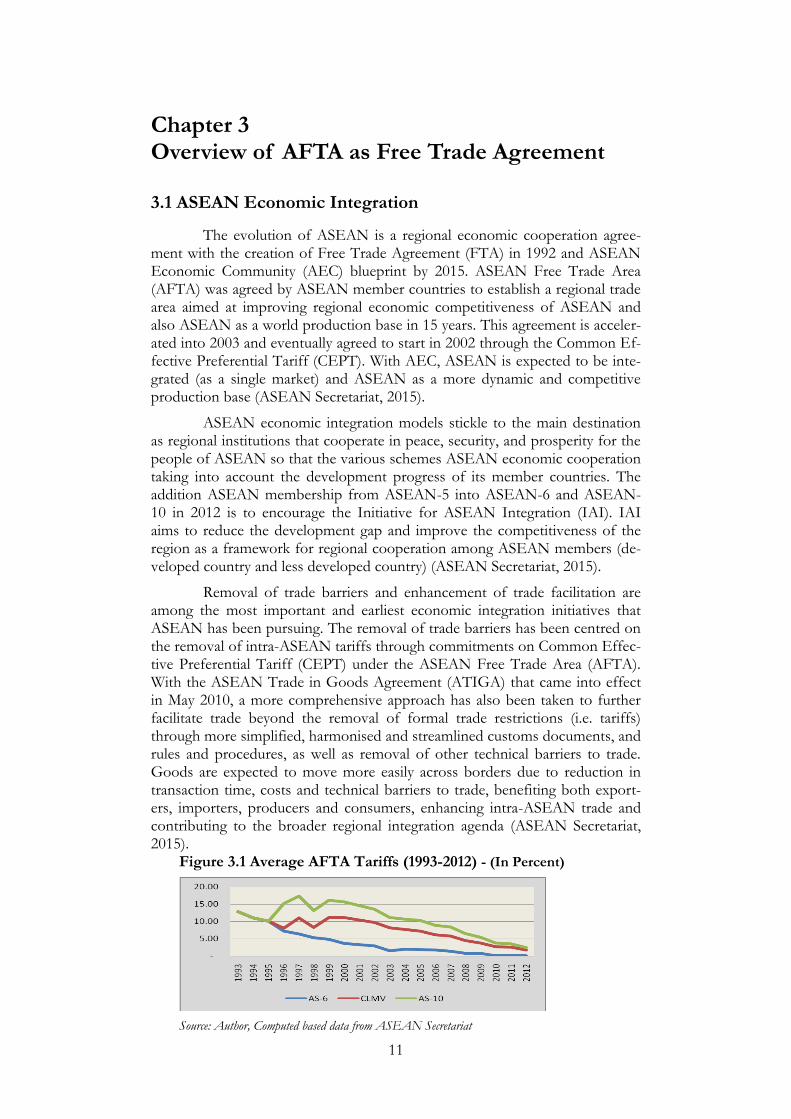
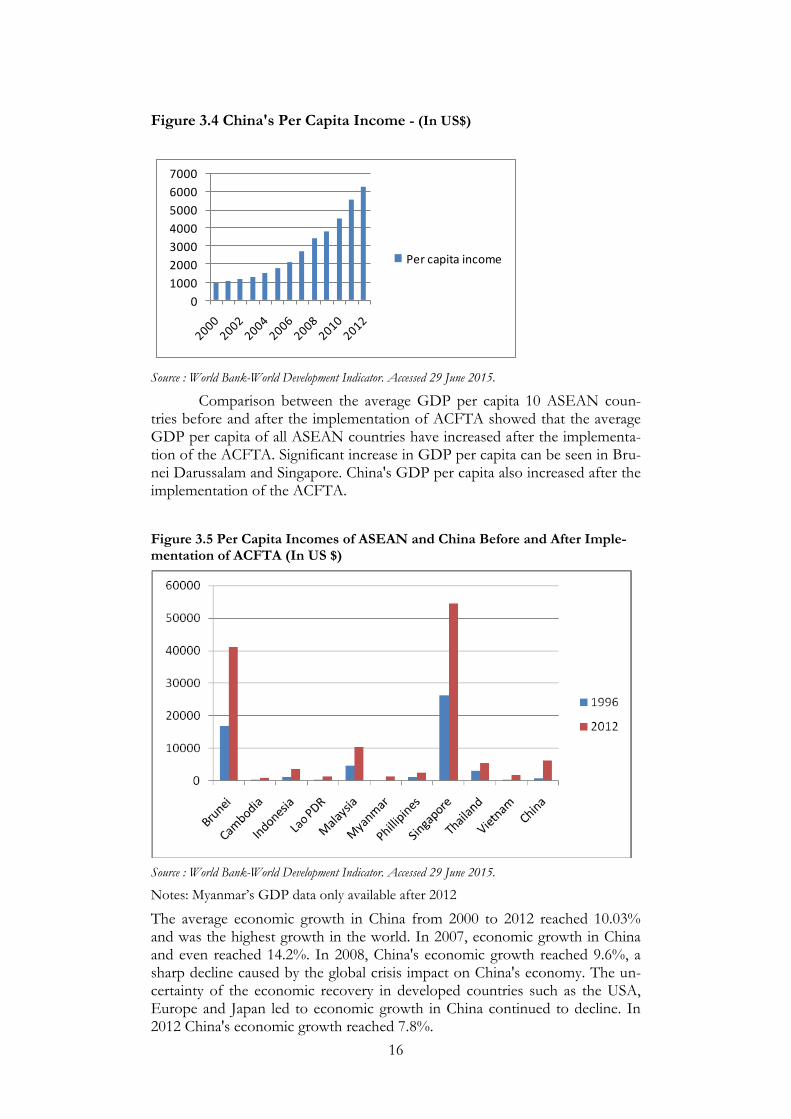
Based on the number of population and nominal GDP, ACFTA is the largest trade cooperation. The development of China's GDP per capita over the years showed increased very rapidly. On the average, the growth of China's GDP per capita is 17% per year. In 2000 China's GDP per capita is US $ 954. Then continue to increase and reached US $ 6,264 in 2012.
16
Figure 3.4 China's Per Capita Income - (In US$)
0
1000
2000
3000
4000
5000
6000
7000
Per capita income
Source : World Bank-World Development Indicator. Accessed 29 June 2015.
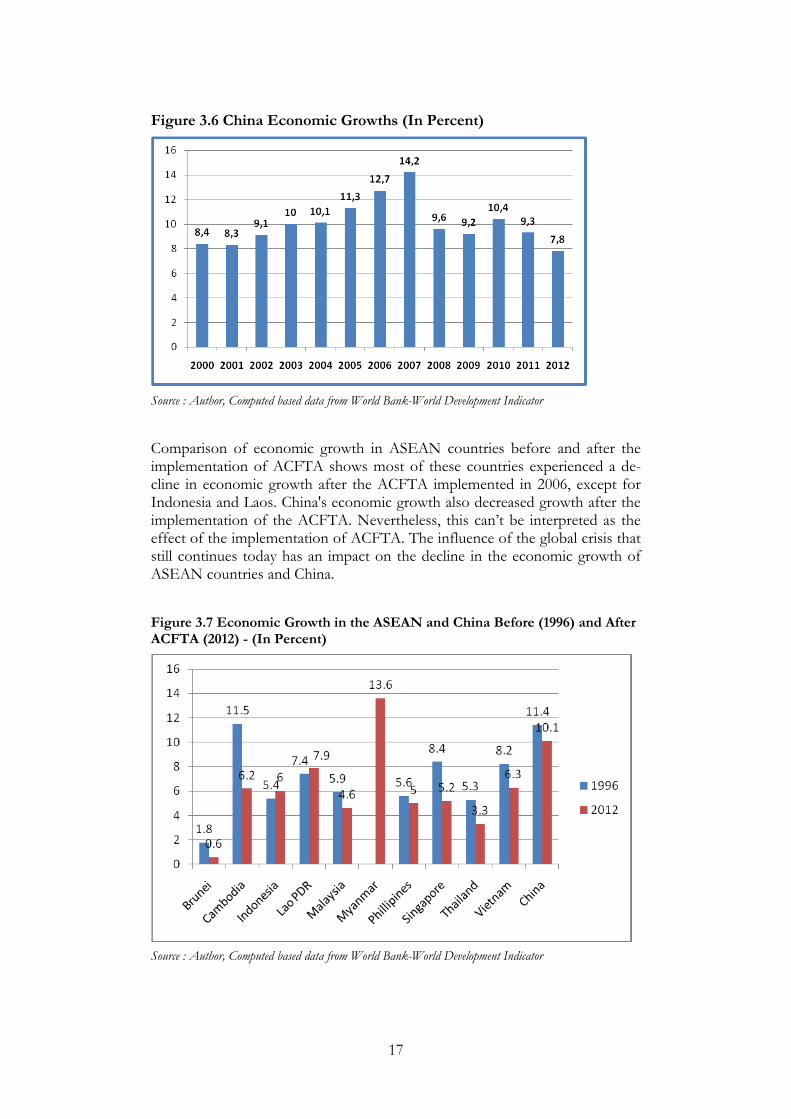
Comparison between the average GDP per capita 10 ASEAN coun-tries before and after the implementation of ACFTA showed that the average GDP per capita of all ASEAN countries have increased after the implementa-tion of the ACFTA. Significant increase in GDP per capita can be seen in Bru-nei Darussalam and Singapore. China's GDP per capita also increased after the implementation of the ACFTA.
Figure 3.5 Per Capita Incomes of ASEAN and China Before and After Imple-mentation of ACFTA (In US $)
Source : World Bank-World Development Indicator. Accessed 29 June 2015.
Notes: Myanmar’s GDP data only available after 2012
The average economic growth in China from 2000 to 2012 reached 10.03% and was the highest growth in the world. In 2007, economic growth in China and even reached 14.2%. In 2008, China's economic growth reached 9.6%, a sharp decline caused by the global crisis impact on China's economy. The un-certainty of the economic recovery in developed countries such as the USA, Europe and Japan led to economic growth in China continued to decline. In 2012 China's economic growth reached 7.8%.
17
Figure 3.6 China Economic Growths (In Percent)
Source : Author, Computed based data from World Bank-World Development Indicator
Comparison of economic growth in ASEAN countries before and after the implementation of ACFTA shows most of these countries experienced a de-cline in economic growth after the ACFTA implemented in 2006, except for Indonesia and Laos. China's economic growth also decreased growth after the implementation of the ACFTA. Nevertheless, this can’t be interpreted as the effect of the implementation of ACFTA. The influence of the global crisis that still continues today has an impact on the decline in the economic growth of ASEAN countries and China.
Figure 3.7 Economic Growth in the ASEAN and China Before (1996) and After ACFTA (2012) - (In Percent)
Source : Author, Computed based data from World Bank-World Development Indicator
18
3.2.2 Macroeconomics ASEAN - Republic of Korea
In 2005, ASEAN and Korea signed the Framework Agreement on Comprehensive Economic Cooperation (Framework Agreement), and in sub-sequent years signed three other agreements (i.e. in the field of Trade in Goods, Trade in Services and Investment) as a legal basis to be able to imple-ment the ASEAN - Korea Free Trade Agreement (AKFTA).
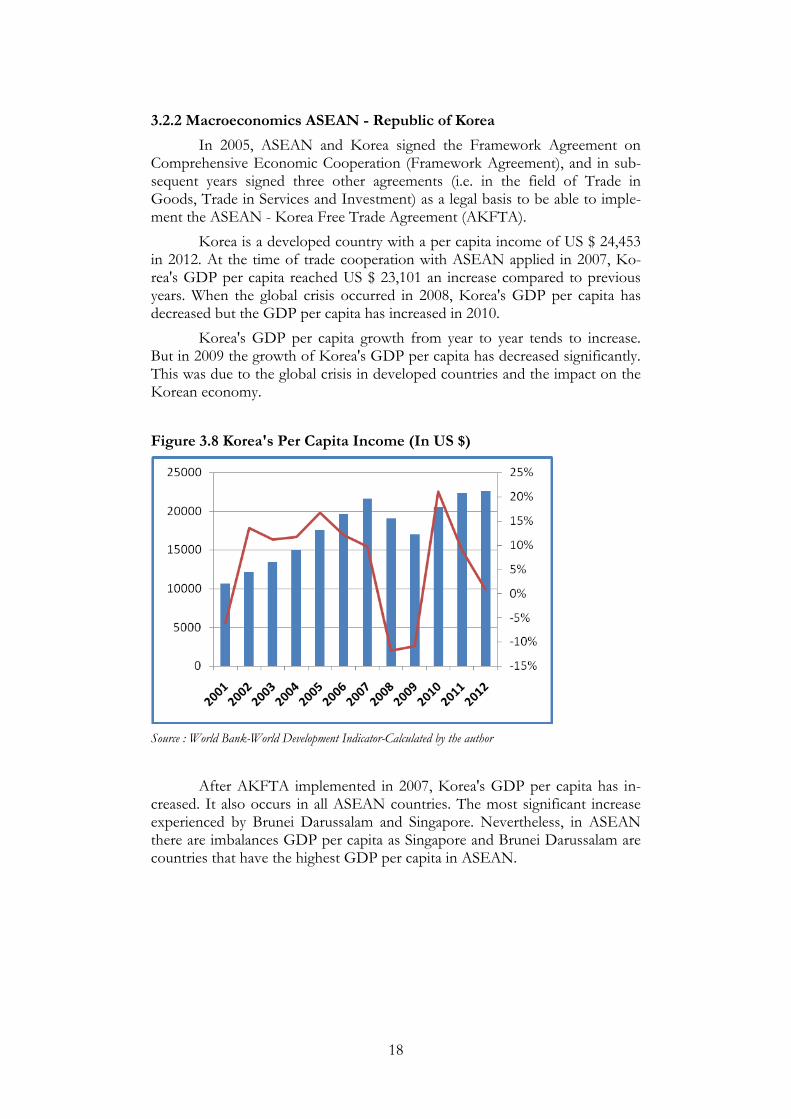
Korea is a developed country with a per capita income of US $ 24,453 in 2012. At the time of trade cooperation with ASEAN applied in 2007, Ko-rea's GDP per capita reached US $ 23,101 an increase compared to previous years. When the global crisis occurred in 2008, Korea's GDP per capita has decreased but the GDP per capita has increased in 2010.
Korea's GDP per capita growth from year to year tends to increase. But in 2009 the growth of Korea's GDP per capita has decreased significantly. This was due to the global crisis in developed countries and the impact on the Korean economy.
Figure 3.8 Korea's Per Capita Income (In US $)
Source : World Bank-World Development Indicator-Calculated by the author
After AKFTA implemented in 2007, Korea's GDP per capita has in-creased. It also occurs in all ASEAN countries. The most significant increase experienced by Brunei Darussalam and Singapore. Nevertheless, in ASEAN there are imbalances GDP per capita as Singapore and Brunei Darussalam are countries that have the highest GDP per capita in ASEAN.
19
Figure 3.9 Per Capita Income of ASEAN and Korea Before AKFTA(2007) and After AKFTA (2012)- (In US $)
Source : World Bank-World Development Indicator. Accessed 29 June 2015.
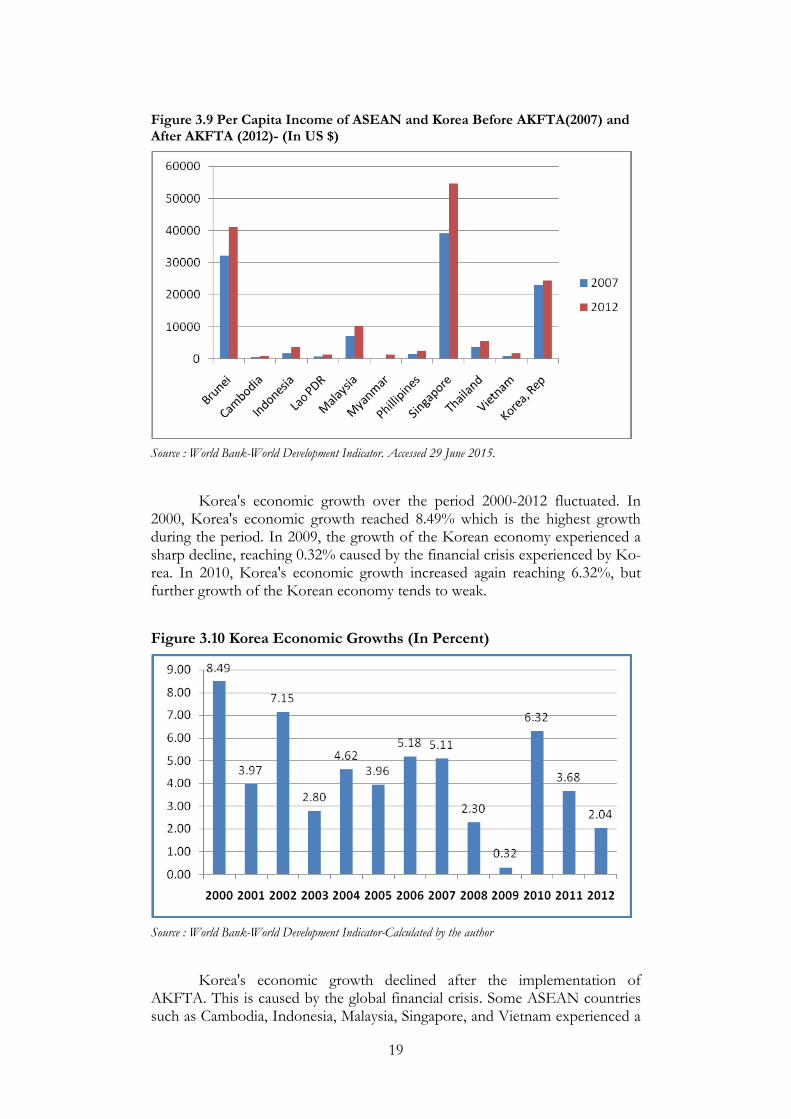
Korea's economic growth over the period 2000-2012 fluctuated. In 2000, Korea's economic growth reached 8.49% which is the highest growth during the period. In 2009, the growth of the Korean economy experienced a sharp decline, reaching 0.32% caused by the financial crisis experienced by Ko-rea. In 2010, Korea's economic growth increased again reaching 6.32%, but further growth of the Korean economy tends to weak.
Figure 3.10 Korea Economic Growths (In Percent)
Source : World Bank-World Development Indicator-Calculated by the author
Korea's economic growth declined after the implementation of AKFTA. This is caused by the global financial crisis. Some ASEAN countries such as Cambodia, Indonesia, Malaysia, Singapore, and Vietnam experienced a
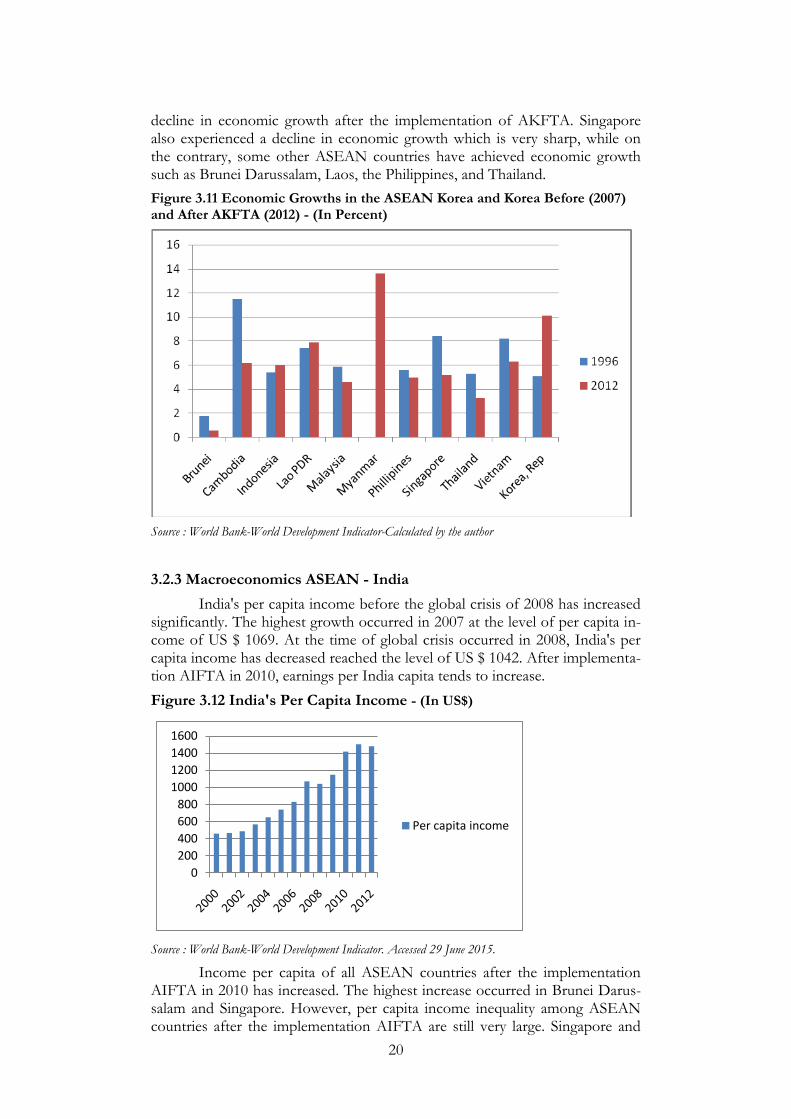
20
decline in economic growth after the implementation of AKFTA. Singapore also experienced a decline in economic growth which is very sharp, while on the contrary, some other ASEAN countries have achieved economic growth such as Brunei Darussalam, Laos, the Philippines, and Thailand.
Figure 3.11 Economic Growths in the ASEAN Korea and Korea Before (2007) and After AKFTA (2012) - (In Percent)
Source : World Bank-World Development Indicator-Calculated by the author
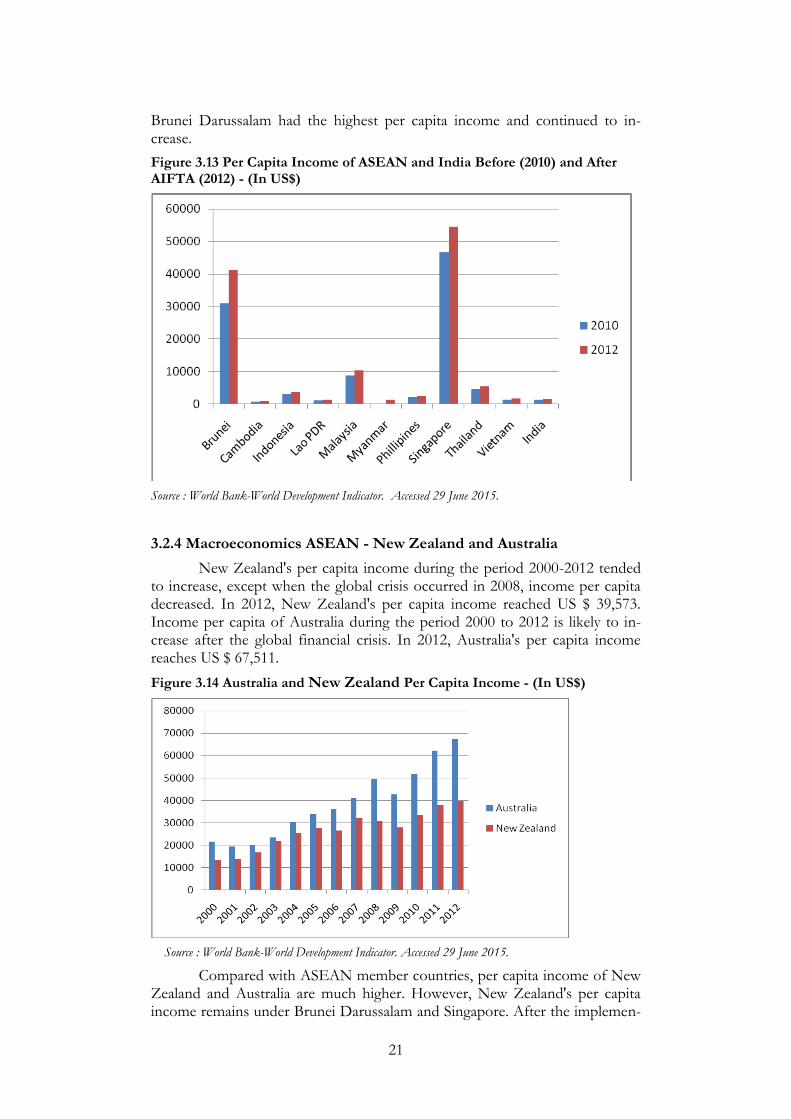
3.2.3 Macroeconomics ASEAN - India
India's per capita income before the global crisis of 2008 has increased significantly. The highest growth occurred in 2007 at the level of per capita in-come of US $ 1069. At the time of global crisis occurred in 2008, India's per capita income has decreased reached the level of US $ 1042. After implementa-tion AIFTA in 2010, earnings per India capita tends to increase.
Figure 3.12 India's Per Capita Income - (In US$)
0
200
400
600
800
1000
1200
1400
1600
Per capita income
Source : World Bank-World Development Indicator. Accessed 29 June 2015.
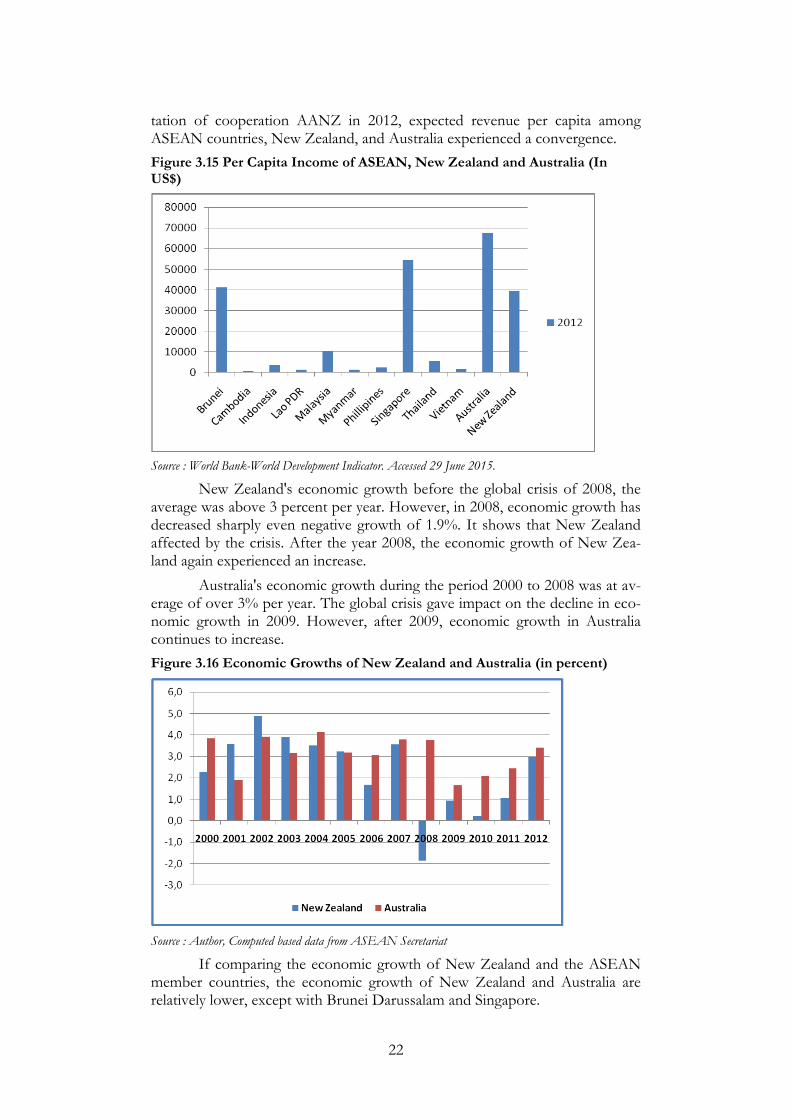
Income per capita of all ASEAN countries after the implementation AIFTA in 2010 has increased. The highest increase occurred in Brunei Darus-salam and Singapore. However, per capita income inequality among ASEAN countries after the implementation AIFTA are still very large. Singapore and
21
Brunei Darussalam had the highest per capita income and continued to in-crease.
Figure 3.13 Per Capita Income of ASEAN and India Before (2010) and After AIFTA (2012) - (In US$)
Source : World Bank-World Development Indicator. Accessed 29 June 2015.
3.2.4 Macroeconomics ASEAN - New Zealand and Australia
New Zealand's per capita income during the period 2000-2012 tended to increase, except when the global crisis occurred in 2008, income per capita decreased. In 2012, New Zealand's per capita income reached US $ 39,573. Income per capita of Australia during the period 2000 to 2012 is likely to in-crease after the global financial crisis. In 2012, Australia's per capita income reaches US $ 67,511.
Figure 3.14 Australia and New Zealand Per Capita Income - (In US$)
Source : World Bank-World Development Indicator. Accessed 29 June 2015.
Compared with ASEAN member countries, per capita income of New Zealand and Australia are much higher. However, New Zealand's per capita income remains under Brunei Darussalam and Singapore. After the implemen-
22
tation of cooperation AANZ in 2012, expected revenue per capita among ASEAN countries, New Zealand, and Australia experienced a convergence.
Figure 3.15 Per Capita Income of ASEAN, New Zealand and Australia (In US$)
Source : World Bank-World Development Indicator. Accessed 29 June 2015.
New Zealand's economic growth before the global crisis of 2008, the average was above 3 percent per year. However, in 2008, economic growth has decreased sharply even negative growth of 1.9%. It shows that New Zealand affected by the crisis. After the year 2008, the economic growth of New Zea-land again experienced an increase.
Australia's economic growth during the period 2000 to 2008 was at av-erage of over 3% per year. The global crisis gave impact on the decline in eco-nomic growth in 2009. However, after 2009, economic growth in Australia continues to increase.
Figure 3.16 Economic Growths of New Zealand and Australia (in percent)
Source : Author, Computed based data from ASEAN Secretariat
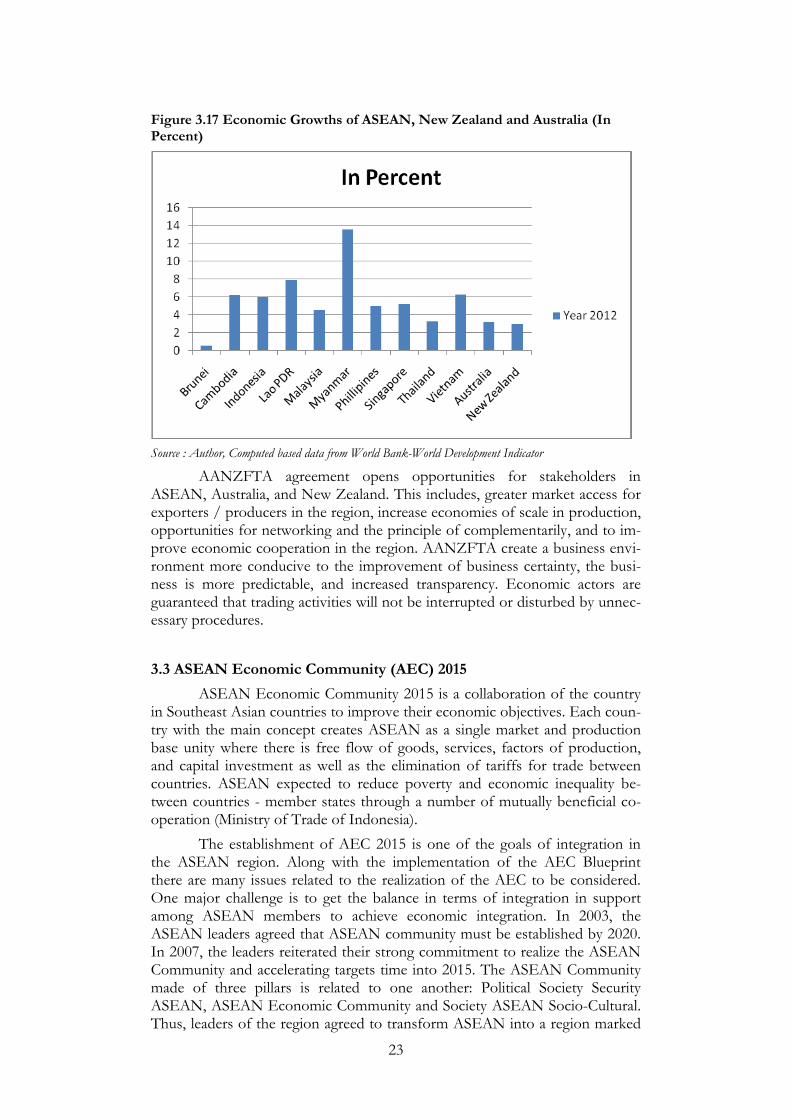
If comparing the economic growth of New Zealand and the ASEAN member countries, the economic growth of New Zealand and Australia are relatively lower, except with Brunei Darussalam and Singapore.
23
Figure 3.17 Economic Growths of ASEAN, New Zealand and Australia (In Percent)
Source : Author, Computed based data from World Bank-World Development Indicator
AANZFTA agreement opens opportunities for stakeholders in ASEAN, Australia, and New Zealand. This includes, greater market access for exporters / producers in the region, increase economies of scale in production, opportunities for networking and the principle of complementarily, and to im-prove economic cooperation in the region. AANZFTA create a business envi-ronment more conducive to the improvement of business certainty, the busi-ness is more predictable, and increased transparency. Economic actors are guaranteed that trading activities will not be interrupted or disturbed by unnec-essary procedures.
3.3 ASEAN Economic Community (AEC) 2015
ASEAN Economic Community 2015 is a collaboration of the country in Southeast Asian countries to improve their economic objectives. Each coun-try with the main concept creates ASEAN as a single market and production base unity where there is free flow of goods, services, factors of production, and capital investment as well as the elimination of tariffs for trade between countries. ASEAN expected to reduce poverty and economic inequality be-tween countries - member states through a number of mutually beneficial co-operation (Ministry of Trade of Indonesia).
The establishment of AEC 2015 is one of the goals of integration in the ASEAN region. Along with the implementation of the AEC Blueprint there are many issues related to the realization of the AEC to be considered. One major challenge is to get the balance in terms of integration in support among ASEAN members to achieve economic integration. In 2003, the ASEAN leaders agreed that ASEAN community must be established by 2020. In 2007, the leaders reiterated their strong commitment to realize the ASEAN Community and accelerating targets time into 2015. The ASEAN Community made of three pillars is related to one another: Political Society Security ASEAN, ASEAN Economic Community and Society ASEAN Socio-Cultural. Thus, leaders of the region agreed to transform ASEAN into a region marked
24
by the free movement of goods, services, investment, labor skilled, and freer flow of capital. Furthermore, the ASEAN Economic Community Blueprint was drawn up and ratified in 2007. The AEC Blueprint works as a coherent master plan that directs the establishment of AEC. Blueprint identifies charac-teristics and elements of the AEC with clear targets and timelines for the im-plementation of various measures and agreed flexibility to accommodate the interests of all member countries of ASEAN (ASEAN Secretariat, 2015).
Establishment of the ASEAN Economic Community (AEC) has been accelerated from 2020 to 2015 after the AEC Blueprint in 2007. Blueprint is a master plan of the establishment of AEC, by using AEC then ASEAN has be-come a region with free movement of goods, services, investment, skilled la-bour, and capital.
Characters in the region taking into account the importance of the ex-ternal AEC trade for ASEAN and policies that are outward looking. The char-acter is ASEAN as a single market and production base, ASEAN as a region of high economic competitiveness, ASEAN as a regional economic development that is aligned with, and ASEAN as a region fully integrated with the global economy (ASEAN Secretariat, 2015).
First, ASEAN as a single market and production base is expected to make ASEAN become more dynamic and competitive with the mechanisms and measures to strengthen the implementation of the existing economy, ac-celerating the integration of priority sectors, facilitating the movement of busi-ness, skilled and talented workforce, and strengthen institutional mechanisms of ASEAN.
Elements for the establishment of ASEAN as a market and production base consists of five main elements, namely the free movement of goods, free movement of services, free movement of investment, free movement of edu-cated labour, and freer movement of capital. AEC will facilitate the develop-ment of production networks in the region and increase the capacity of ASEAN as a centre of global production and supply chain as part of the world with a reduction in transaction costs and tax simplification, harmonization and standardization of trade. Industrial sectors that will be included in the scope of ASEAN as a single market and production base is covered in ASEAN Priority Integration Sector (ASEAN PIS) is agro-based products, agro-based products, air travel (air transport), automotive, e-ASEAN, electronics, fisheries, healthcare, rubber-based products, textiles and apparel, tourism, wood-based products and logistics (including food, agriculture and forestry in it).
Second, ASEAN as an economic region is stable, prosperous and high-ly competitive. This condition is reflected in the six main elements of competi-tion policy, consumer protection, intellectual property rights, infrastructure, taxation, and e-commerce. Its implementation is the commitment of ASEAN member countries to expand the competition policy and national law (CPL). CPL is expected to ensure that the region's economic performance in the long run because of the culture of fair business competition.
Third, ASEAN as a regional economic development parallel to develop small and medium-sized enterprises (SMEs) and the initiative for ASEAN inte-gration (Initiative for ASEAN Integration). The ASEAN initiative bridge SMEs and accelerate economic integration in Cambodia, Lao PDR, Myanmar
25
and Vietnam so that all ASEAN members forward on the same level. With the pattern of this initiative, ASEAN members will be able to improve the compet-itiveness of ASEAN as a regional and at the same time benefit from this eco-nomic integration.
Fourth, ASEAN integration with the global economy shows that ASEAN cooperates with a strong connection to the global network, market interconnected and globalized industry.
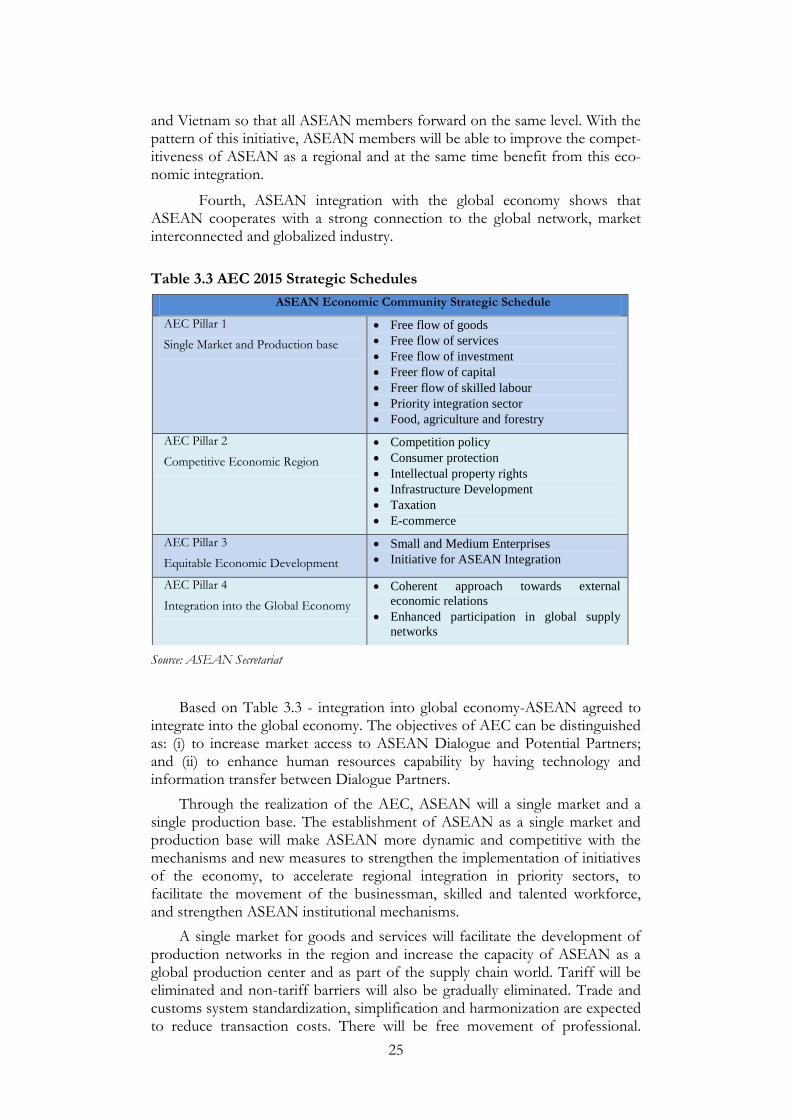
Table 3.3 AEC 2015 Strategic Schedules
ASEAN Economic Community Strategic Schedule
AEC Pillar 1
Single Market and Production base
Free flow of goods
Free flow of services
Free flow of investment
Freer flow of capital
Freer flow of skilled labour
Priority integration sector
Food, agriculture and forestry
AEC Pillar 2
Competitive Economic Region
Competition policy
Consumer protection
Intellectual property rights
Infrastructure Development
Taxation
E-commerce
AEC Pillar 3
Equitable Economic Development
Small and Medium Enterprises
Initiative for ASEAN Integration
AEC Pillar 4
Integration into the Global Economy
Coherent approach towards external
economic relations
Enhanced participation in global supply
networks
Source: ASEAN Secretariat
Based on Table 3.3 - integration into global economy-ASEAN agreed to integrate into the global economy. The objectives of AEC can be distinguished as: (i) to increase market access to ASEAN Dialogue and Potential Partners; and (ii) to enhance human resources capability by having technology and information transfer between Dialogue Partners.
Through the realization of the AEC, ASEAN will a single market and a single production base. The establishment of ASEAN as a single market and production base will make ASEAN more dynamic and competitive with the mechanisms and new measures to strengthen the implementation of initiatives of the economy, to accelerate regional integration in priority sectors, to facilitate the movement of the businessman, skilled and talented workforce, and strengthen ASEAN institutional mechanisms.
A single market for goods and services will facilitate the development of production networks in the region and increase the capacity of ASEAN as a global production center and as part of the supply chain world. Tariff will be eliminated and non-tariff barriers will also be gradually eliminated. Trade and customs system standardization, simplification and harmonization are expected to reduce transaction costs. There will be free movement of professional.
26
ASEAN investors will be free to invest in various sectors, and the service sec-tor will be opened. An embodiment of economic region that is stable, prosper-ous and high competitiveness is the goal of ASEAN economic integration. ASEAN member countries have committed to introducing policies and com-petition law nationally to ensure a level of equality and create a culture of fair competition to improve regional economic performance in the long term.
Under Equitable Economic Development characteristics there are two main elements: (i) Development of Small and Medium Enterprise (SME) and (ii) Initiative for ASEAN Integration. Both of these initiatives are directed to bridge the development gap both at the level of SMEs as well as to strengthen the economic integration of Cambodia, Laos, Myanmar and Viet Nam (CLMV) so that all members can move forward simultaneously and increase the power ASEAN's competitiveness as a region that benefit from the integra-tion process to all members.
ASEAN moves in an environment that is increasingly connected in a global network highly related to one another, with interdependent markets and industries worldwide. So that businesses can compete globally, to make ASEAN a more dynamic as "Mainstream" world supplier, and to ensure that domestic market remains attractive for foreign investment, then ASEAN must be more to reach beyond the boundaries of AEC. Two approaches taken by ASEAN in participating in the process of integration with the world economy are: (i) coherent approach towards external economic relations through the Free Trade Agreement (Free Trade Area / FTA) and closer economic partner-ship (Closer Economic Partnership / CEP), and (ii) a stronger participation in global supply networks.
27
Chapter 4 Data and Methodology
The main focus of this chapter is to discuss data and methodology that are used in this study. Since the main objective of this research is to examine the relationship between free trade agreements which has been implemented between member countries, it is necessary to explain proper data and methodology that can give the framework to conduct the research. Furthermore, this study may give a better analysis of free trade agreement and export performance. Moreover, the part of methodology and data explains model specification, variables justification, and estimation method.
4.1 Data Source
The data for this study was collected from secondary sources. Data of export is obtained from Direction of Trade Statistics (DOTS) database of the International Monetary Fund (IMF). While data on GDP and population are collected online from World Development Indicators (WDI) database of the World Bank. Meanwhile, distance is measured by the geographical coordinates of between major cities of each economy from Centre d'Études Prospectives et d'Informations Internationales (CEPII) database.
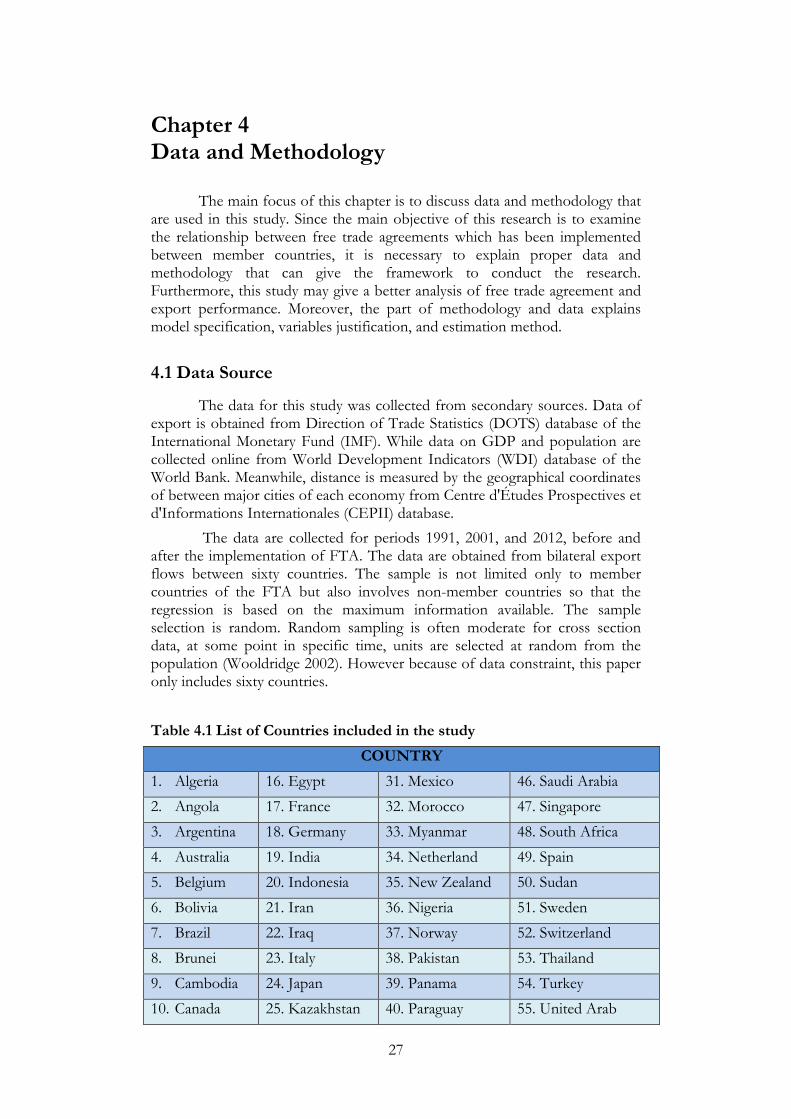
The data are collected for periods 1991, 2001, and 2012, before and after the implementation of FTA. The data are obtained from bilateral export flows between sixty countries. The sample is not limited only to member countries of the FTA but also involves non-member countries so that the regression is based on the maximum information available. The sample selection is random. Random sampling is often moderate for cross section data, at some point in specific time, units are selected at random from the population (Wooldridge 2002). However because of data constraint, this paper only includes sixty countries.
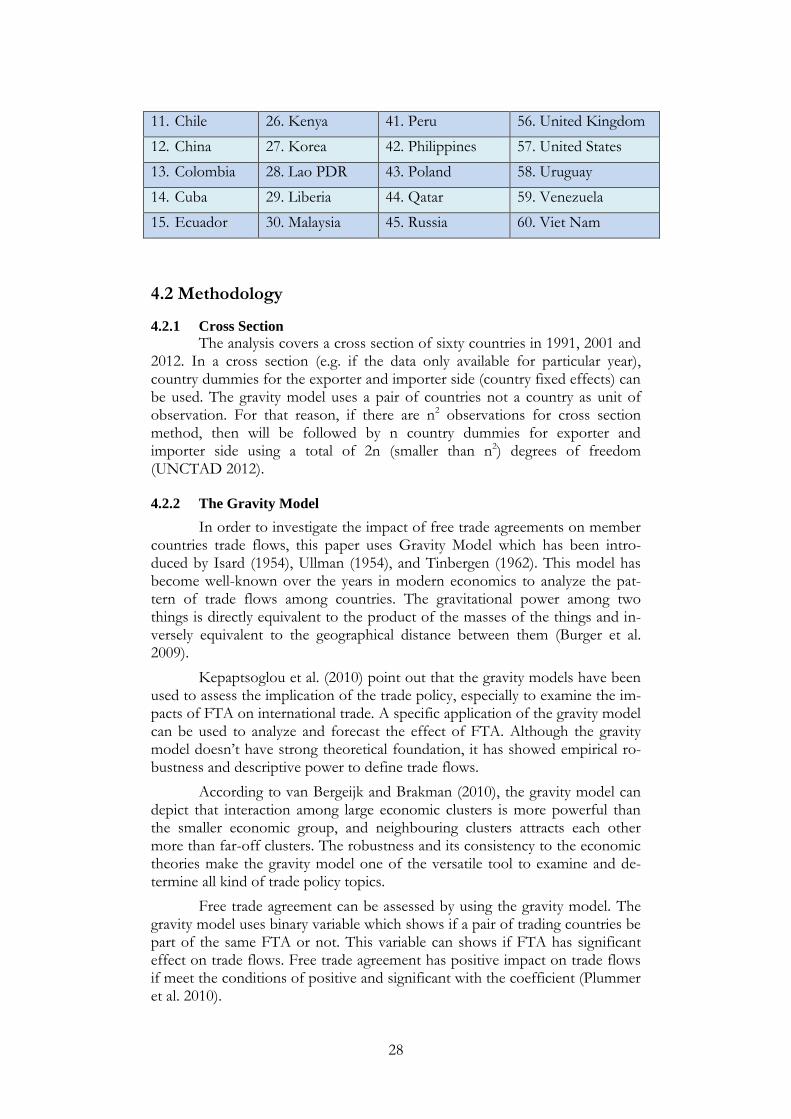
Table 4.1 List of Countries included in the study
COUNTRY
1. Algeria 16. Egypt 31. Mexico 46. Saudi Arabia
2. Angola 17. France 32. Morocco 47. Singapore
3. Argentina 18. Germany 33. Myanmar 48. South Africa
4. Australia 19. India 34. Netherland 49. Spain
5. Belgium 20. Indonesia 35. New Zealand 50. Sudan
6. Bolivia 21. Iran 36. Nigeria 51. Sweden
7. Brazil 22. Iraq 37. Norway 52. Switzerland
8. Brunei 23. Italy 38. Pakistan 53. Thailand
9. Cambodia 24. Japan 39. Panama 54. Turkey
10. Canada 25. Kazakhstan 40. Paraguay 55. United Arab
28
11. Chile 26. Kenya 41. Peru 56. United Kingdom
12. China 27. Korea 42. Philippines 57. United States
13. Colombia 28. Lao PDR 43. Poland 58. Uruguay
14. Cuba 29. Liberia 44. Qatar 59. Venezuela
15. Ecuador 30. Malaysia 45. Russia 60. Viet Nam
4.2 Methodology
4.2.1 Cross Section
The analysis covers a cross section of sixty countries in 1991, 2001 and 2012. In a cross section (e.g. if the data only available for particular year), country dummies for the exporter and importer side (country fixed effects) can be used. The gravity model uses a pair of countries not a country as unit of observation. For that reason, if there are n2 observations for cross section method, then will be followed by n country dummies for exporter and importer side using a total of 2n (smaller than n2) degrees of freedom (UNCTAD 2012).
4.2.2 The Gravity Model
In order to investigate the impact of free trade agreements on member countries trade flows, this paper uses Gravity Model which has been intro-duced by Isard (1954), Ullman (1954), and Tinbergen (1962). This model has become well-known over the years in modern economics to analyze the pat-tern of trade flows among countries. The gravitational power among two things is directly equivalent to the product of the masses of the things and in-versely equivalent to the geographical distance between them (Burger et al. 2009).
Kepaptsoglou et al. (2010) point out that the gravity models have been used to assess the implication of the trade policy, especially to examine the im-pacts of FTA on international trade. A specific application of the gravity model can be used to analyze and forecast the effect of FTA. Although the gravity model doesn’t have strong theoretical foundation, it has showed empirical ro-bustness and descriptive power to define trade flows.
According to van Bergeijk and Brakman (2010), the gravity model can depict that interaction among large economic clusters is more powerful than the smaller economic group, and neighbouring clusters attracts each other more than far-off clusters. The robustness and its consistency to the economic theories make the gravity model one of the versatile tool to examine and de-termine all kind of trade policy topics.
Free trade agreement can be assessed by using the gravity model. The gravity model uses binary variable which shows if a pair of trading countries be part of the same FTA or not. This variable can shows if FTA has significant effect on trade flows. Free trade agreement has positive impact on trade flows if meet the conditions of positive and significant with the coefficient (Plummer et al. 2010).
29
4.2.3 The Gravity Model Specification
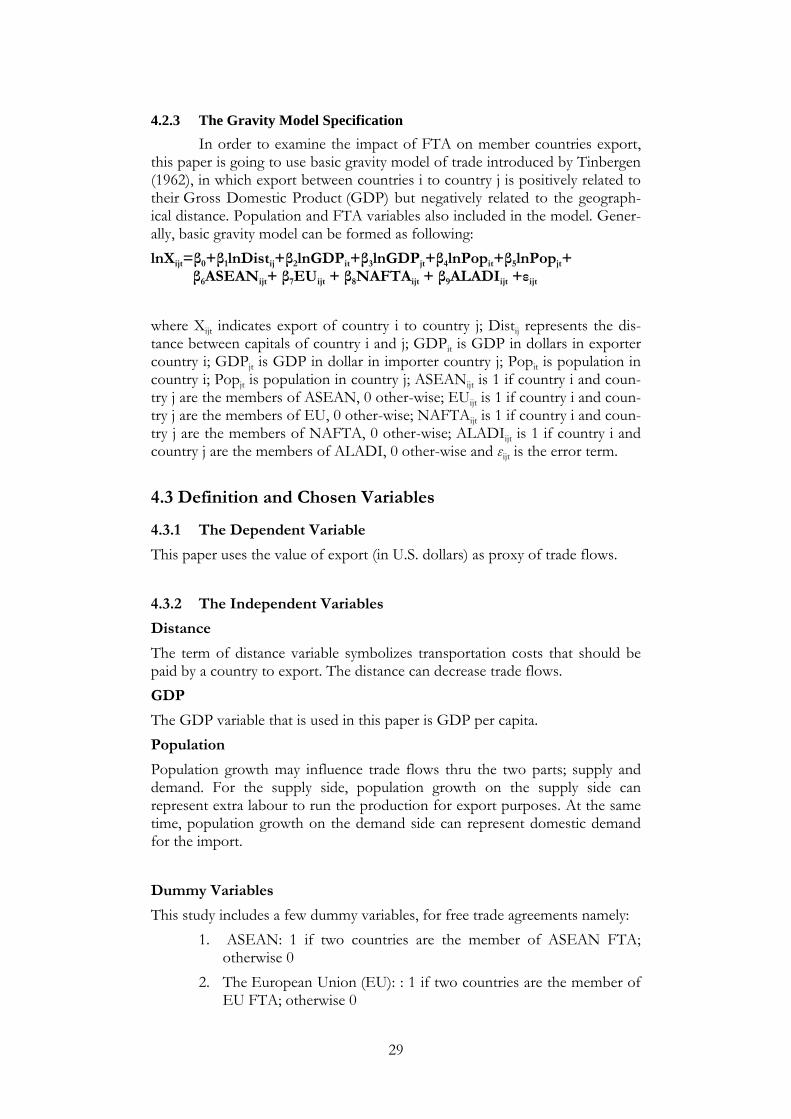
In order to examine the impact of FTA on member countries export, this paper is going to use basic gravity model of trade introduced by Tinbergen (1962), in which export between countries i to country j is positively related to their Gross Domestic Product (GDP) but negatively related to the geograph-ical distance. Population and FTA variables also included in the model. Gener-ally, basic gravity model can be formed as following:
lnXijt=β0+β1lnDistij+β2lnGDPit+β3lnGDPjt+β4lnPopit+β5lnPopjt+ β6ASEANijt+ β7EUijt + β8NAFTAijt + β9ALADIijt +εijt
where Xijt indicates export of country i to country j; Distij represents the dis-tance between capitals of country i and j; GDPit is GDP in dollars in exporter country i; GDPjt is GDP in dollar in importer country j; Popit is population in country i; Popjt is population in country j; ASEANijt is 1 if country i and coun-try j are the members of ASEAN, 0 other-wise; EUijt is 1 if country i and coun-try j are the members of EU, 0 other-wise; NAFTAijt is 1 if country i and coun-try j are the members of NAFTA, 0 other-wise; ALADIijt is 1 if country i and country j are the members of ALADI, 0 other-wise and εijt is the error term.
4.3 Definition and Chosen Variables
4.3.1 The Dependent Variable
This paper uses the value of export (in U.S. dollars) as proxy of trade flows.
4.3.2 The Independent Variables
Distance
The term of distance variable symbolizes transportation costs that should be paid by a country to export. The distance can decrease trade flows.
GDP
The GDP variable that is used in this paper is GDP per capita.
Population
Population growth may influence trade flows thru the two parts; supply and demand. For the supply side, population growth on the supply side can represent extra labour to run the production for export purposes. At the same time, population growth on the demand side can represent domestic demand for the import.
Dummy Variables
This study includes a few dummy variables, for free trade agreements namely:
1. ASEAN: 1 if two countries are the member of ASEAN FTA; otherwise 0
2. The European Union (EU): : 1 if two countries are the member of EU FTA; otherwise 0
30
3. The North American Free Trade Agreement (NAFTA): 1 if two countries are the member of NAFTA; otherwise 0
4. The Latin American Integration Association (ALADI) : 1 if two countries are the member of ALADI FTA; otherwise 0
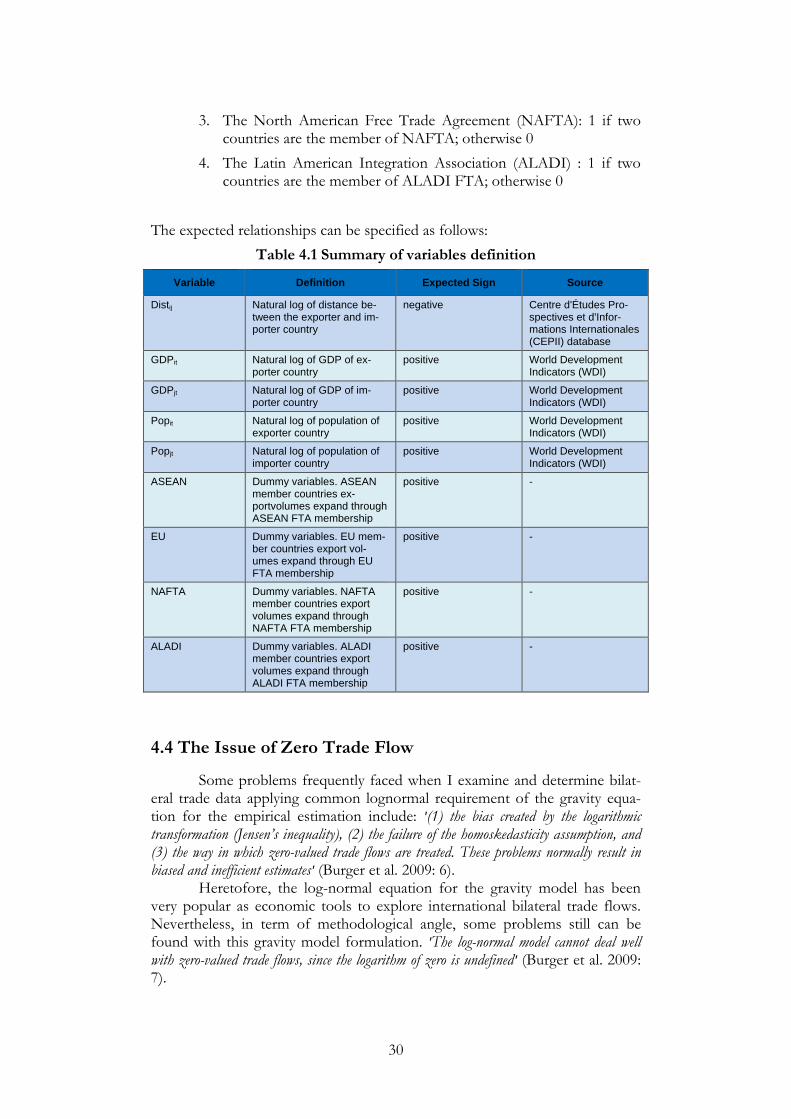
The expected relationships can be specified as follows:
Table 4.1 Summary of variables definition
Variable Definition Expected Sign Source
Distij Natural log of distance be-tween the exporter and im-porter country
negative Centre d'Études Pro-spectives et d'Infor-mations Internationales (CEPII) database
GDPit Natural log of GDP of ex-porter country
positive World Development Indicators (WDI)
GDPjt Natural log of GDP of im-porter country
positive World Development Indicators (WDI)
Popit Natural log of population of exporter country
positive World Development Indicators (WDI)
Popjt Natural log of population of importer country
positive World Development Indicators (WDI)
ASEAN Dummy variables. ASEAN member countries ex-portvolumes expand through ASEAN FTA membership
positive -
EU Dummy variables. EU mem-ber countries export vol-umes expand through EU FTA membership
positive -
NAFTA Dummy variables. NAFTA member countries export volumes expand through NAFTA FTA membership
positive -
ALADI Dummy variables. ALADI member countries export volumes expand through ALADI FTA membership
positive -
4.4 The Issue of Zero Trade Flow
Some problems frequently faced when I examine and determine bilat-eral trade data applying common lognormal requirement of the gravity equa-tion for the empirical estimation include: '(1) the bias created by the logarithmic transformation (Jensen’s inequality), (2) the failure of the homoskedasticity assumption, and (3) the way in which zero-valued trade flows are treated. These problems normally result in biased and inefficient estimates' (Burger et al. 2009: 6).
Heretofore, the log-normal equation for the gravity model has been very popular as economic tools to explore international bilateral trade flows. Nevertheless, in term of methodological angle, some problems still can be found with this gravity model formulation. 'The log-normal model cannot deal well with zero-valued trade flows, since the logarithm of zero is undefined' (Burger et al. 2009: 7).
31
Frankel (1997) further points out the most understandable reason for
the existence of zero-valued trade flows are the deficiency of trade among small and distant countries. This problem can be clarified by large variables and fixed cost.
Furthermore, Rauch (1999) argues that the small number of GDP per capita and the absence of cultural and historical connection as the attainable reason for the lack of trade among countries. Haveman and Hummels (2004) also write their concern about the dominant weakness for the gravity model that it indicates trade for all goods between all countries.
According to Burger et al (2009) the possible explanation for the pres-ence of zero-valued trade flows between countries turns into greater if the trade volume in a particular good instead of overall trade volume, among two countries is considered. Every country doesn’t produce all commodities. Every country also doesn’t have an effective demand for all commodities.
The simple way to overcome this problem is by deleting all zero valued flows. But by deleting all zero value observation, significant information on small number of trade is left out of the model (Eichengreen & Irwin, 1998). This problem may cause biased results, specifically if zero-valued trade flows are non-randomly spread.
Another way to address this problem in the analysis of trade flow is to add small positive number (usually 0.5 or 1) for all trade flows for the specific purpose that the logarithm is describe very well (Linders & de Groot, 2006). Based on this, this study applies this way to overcome the problem with zero trade flow.
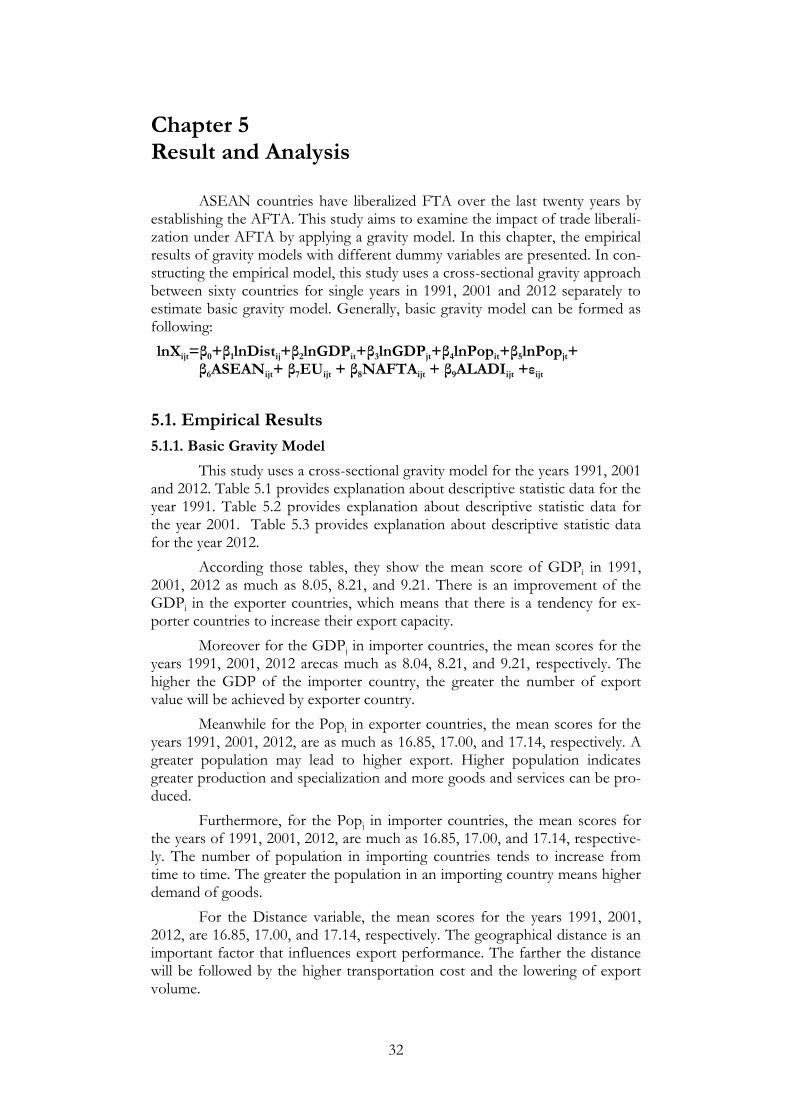
32
Chapter 5 Result and Analysis
ASEAN countries have liberalized FTA over the last twenty years by establishing the AFTA. This study aims to examine the impact of trade liberali-zation under AFTA by applying a gravity model. In this chapter, the empirical results of gravity models with different dummy variables are presented. In con-structing the empirical model, this study uses a cross-sectional gravity approach between sixty countries for single years in 1991, 2001 and 2012 separately to estimate basic gravity model. Generally, basic gravity model can be formed as following:
lnXijt=β0+β1lnDistij+β2lnGDPit+β3lnGDPjt+β4lnPopit+β5lnPopjt+ β6ASEANijt+ β7EUijt + β8NAFTAijt + β9ALADIijt +εijt
5.1. Empirical Results
5.1.1. Basic Gravity Model
This study uses a cross-sectional gravity model for the years 1991, 2001 and 2012. Table 5.1 provides explanation about descriptive statistic data for the year 1991. Table 5.2 provides explanation about descriptive statistic data for the year 2001. Table 5.3 provides explanation about descriptive statistic data for the year 2012.
According those tables, they show the mean score of GDPi in 1991, 2001, 2012 as much as 8.05, 8.21, and 9.21. There is an improvement of the GDPi in the exporter countries, which means that there is a tendency for ex-porter countries to increase their export capacity.
Moreover for the GDPj in importer countries, the mean scores for the years 1991, 2001, 2012 arecas much as 8.04, 8.21, and 9.21, respectively. The higher the GDP of the importer country, the greater the number of export value will be achieved by exporter country.
Meanwhile for the Popi in exporter countries, the mean scores for the years 1991, 2001, 2012, are as much as 16.85, 17.00, and 17.14, respectively. A greater population may lead to higher export. Higher population indicates greater production and specialization and more goods and services can be pro-duced.
Furthermore, for the Popj in importer countries, the mean scores for the years of 1991, 2001, 2012, are much as 16.85, 17.00, and 17.14, respective-ly. The number of population in importing countries tends to increase from time to time. The greater the population in an importing country means higher demand of goods.
For the Distance variable, the mean scores for the years 1991, 2001, 2012, are 16.85, 17.00, and 17.14, respectively. The geographical distance is an important factor that influences export performance. The farther the distance will be followed by the higher transportation cost and the lowering of export volume.
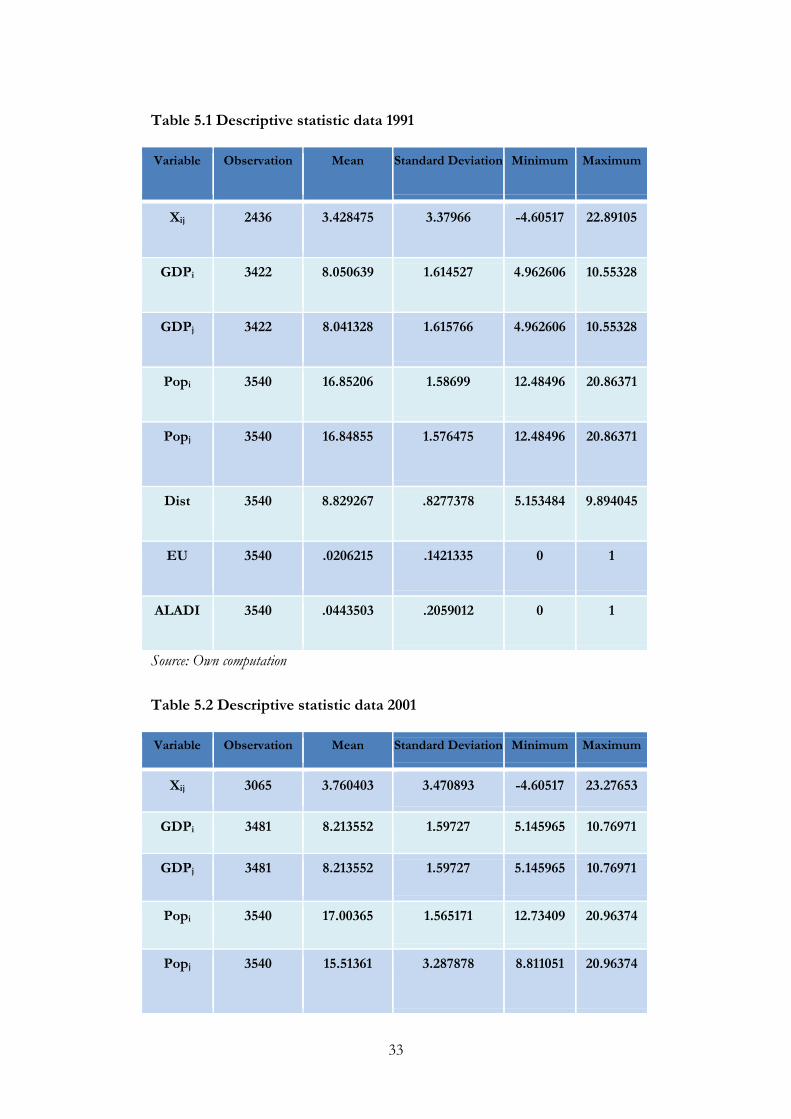
33
Table 5.1 Descriptive statistic data 1991
Variable Observation Mean Standard Deviation Minimum Maximum
Xij 2436 3.428475 3.37966 -4.60517 22.89105
GDPi 3422 8.050639 1.614527 4.962606 10.55328
GDPj 3422 8.041328 1.615766 4.962606 10.55328
Popi 3540 16.85206 1.58699 12.48496 20.86371
Popj 3540 16.84855 1.576475 12.48496 20.86371
Dist 3540 8.829267 .8277378 5.153484 9.894045
EU 3540 .0206215 .1421335 0 1
ALADI 3540 .0443503 .2059012 0 1
Source: Own computation
Table 5.2 Descriptive statistic data 2001
Variable Observation Mean Standard Deviation Minimum Maximum
Xij 3065 3.760403 3.470893 -4.60517 23.27653
GDPi 3481 8.213552 1.59727 5.145965 10.76971
GDPj 3481 8.213552 1.59727 5.145965 10.76971
Popi 3540 17.00365 1.565171 12.73409 20.96374
Popj 3540 15.51361 3.287878 8.811051 20.96374
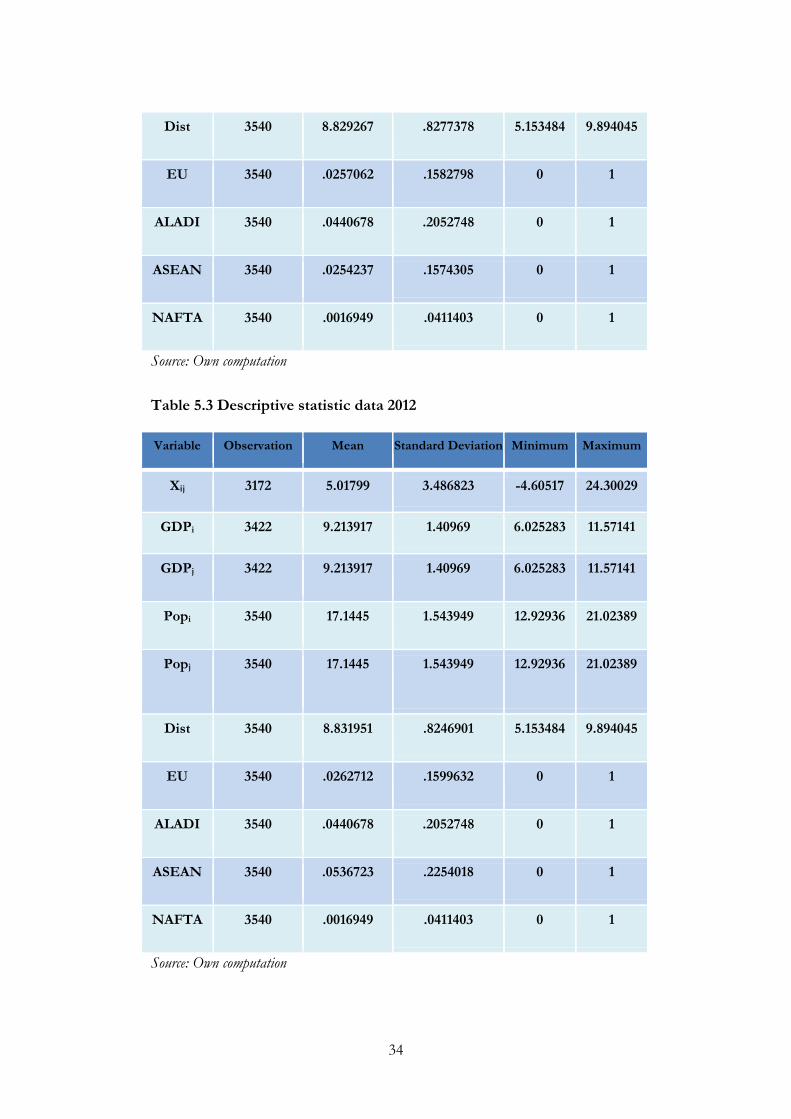
34
Dist 3540 8.829267 .8277378 5.153484 9.894045
EU 3540 .0257062 .1582798 0 1
ALADI 3540 .0440678 .2052748 0 1
ASEAN 3540 .0254237 .1574305 0 1
NAFTA 3540 .0016949 .0411403 0 1
Source: Own computation
Table 5.3 Descriptive statistic data 2012
Variable Observation Mean Standard Deviation Minimum Maximum
Xij 3172 5.01799 3.486823 -4.60517 24.30029
GDPi 3422 9.213917 1.40969 6.025283 11.57141
GDPj 3422 9.213917 1.40969 6.025283 11.57141
Popi 3540 17.1445 1.543949 12.92936 21.02389
Popj 3540 17.1445 1.543949 12.92936 21.02389
Dist 3540 8.831951 .8246901 5.153484 9.894045
EU 3540 .0262712 .1599632 0 1
ALADI 3540 .0440678 .2052748 0 1
ASEAN 3540 .0536723 .2254018 0 1
NAFTA 3540 .0016949 .0411403 0 1
Source: Own computation
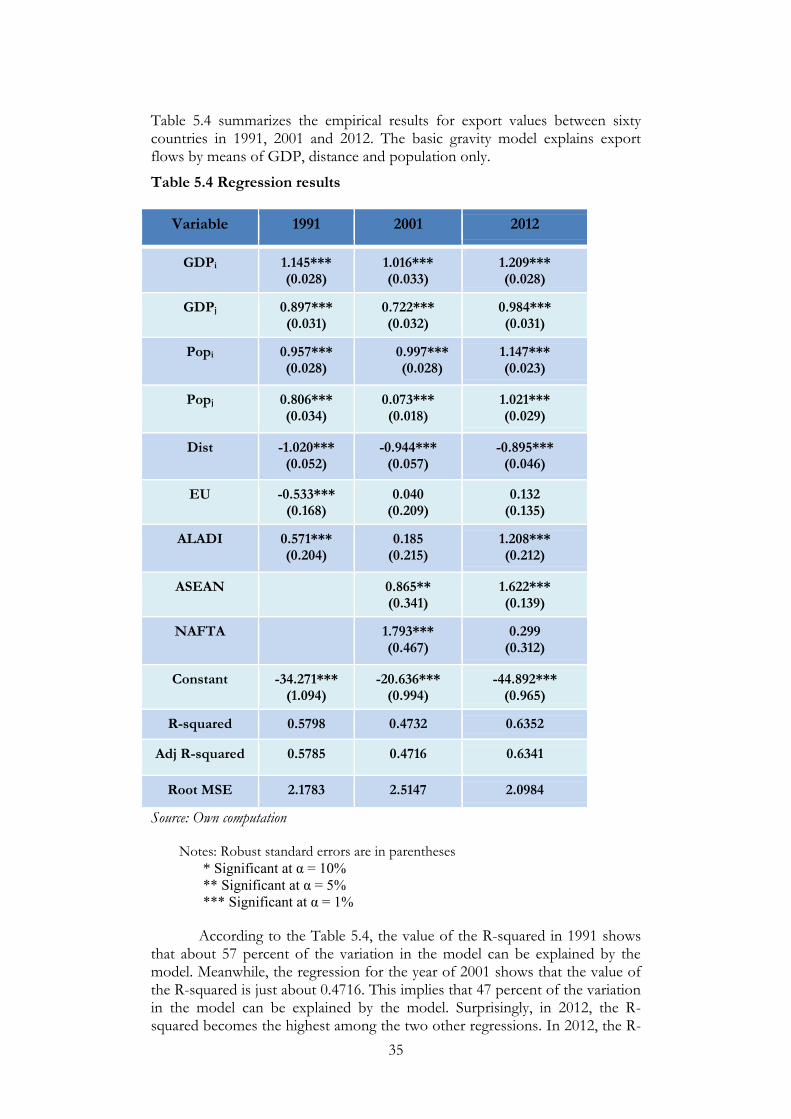
35
Table 5.4 summarizes the empirical results for export values between sixty countries in 1991, 2001 and 2012. The basic gravity model explains export flows by means of GDP, distance and population only.
Table 5.4 Regression results
Variable 1991 2001 2012
GDPi 1.145*** (0.028)
1.016*** (0.033)
1.209*** (0.028)
GDPj 0.897*** (0.031)
0.722*** (0.032)
0.984*** (0.031)
Popi 0.957*** (0.028)
0.997*** (0.028)
1.147*** (0.023)
Popj 0.806*** (0.034)
0.073*** (0.018)
1.021*** (0.029)
Dist -1.020*** (0.052)
-0.944*** (0.057)
-0.895*** (0.046)
EU -0.533*** (0.168)
0.040 (0.209)
0.132 (0.135)
ALADI 0.571*** (0.204)
0.185 (0.215)
1.208*** (0.212)
ASEAN 0.865** (0.341)
1.622*** (0.139)
NAFTA 1.793*** (0.467)
0.299 (0.312)
Constant -34.271*** (1.094)
-20.636*** (0.994)
-44.892*** (0.965)
R-squared 0.5798 0.4732 0.6352
Adj R-squared 0.5785 0.4716 0.6341
Root MSE 2.1783 2.5147 2.0984
Source: Own computation Notes: Robust standard errors are in parentheses
* Significant at α = 10%
** Significant at α = 5%
*** Significant at α = 1%
According to the Table 5.4, the value of the R-squared in 1991 shows that about 57 percent of the variation in the model can be explained by the model. Meanwhile, the regression for the year of 2001 shows that the value of the R-squared is just about 0.4716. This implies that 47 percent of the variation in the model can be explained by the model. Surprisingly, in 2012, the R-squared becomes the highest among the two other regressions. In 2012, the R-
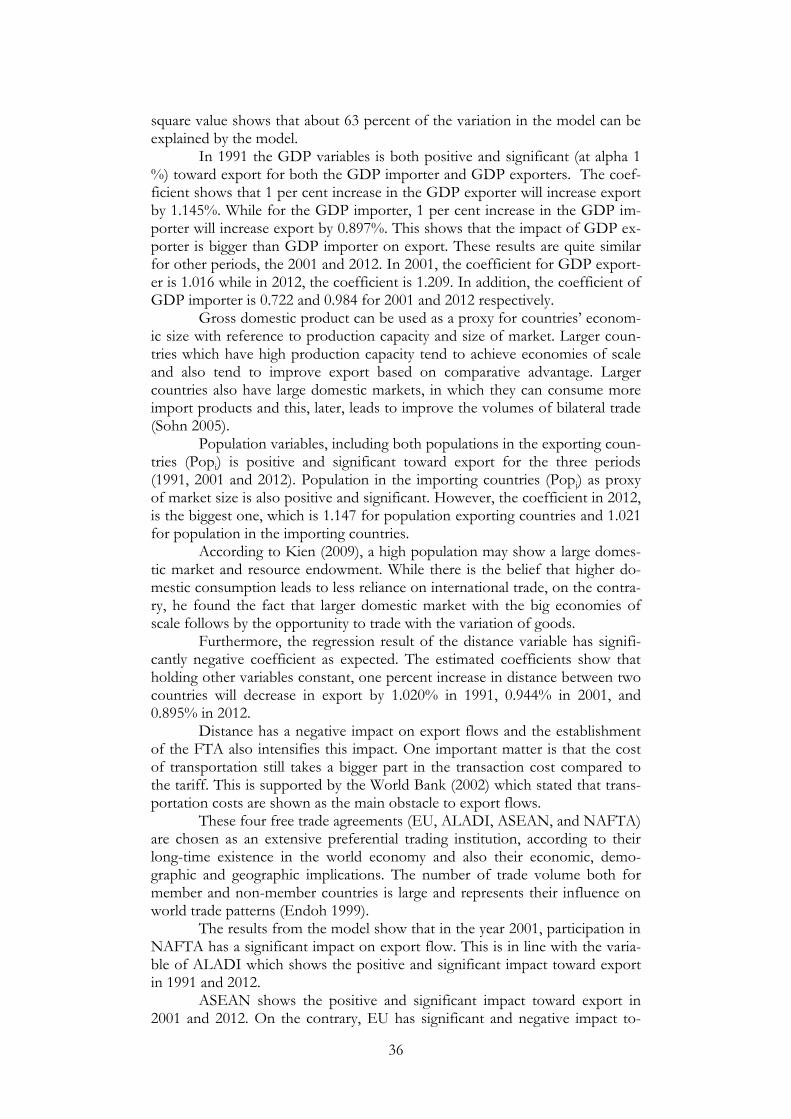
36
square value shows that about 63 percent of the variation in the model can be explained by the model.
In 1991 the GDP variables is both positive and significant (at alpha 1 %) toward export for both the GDP importer and GDP exporters. The coef-ficient shows that 1 per cent increase in the GDP exporter will increase export by 1.145%. While for the GDP importer, 1 per cent increase in the GDP im-porter will increase export by 0.897%. This shows that the impact of GDP ex-porter is bigger than GDP importer on export. These results are quite similar for other periods, the 2001 and 2012. In 2001, the coefficient for GDP export-er is 1.016 while in 2012, the coefficient is 1.209. In addition, the coefficient of GDP importer is 0.722 and 0.984 for 2001 and 2012 respectively.
Gross domestic product can be used as a proxy for countries’ econom-ic size with reference to production capacity and size of market. Larger coun-tries which have high production capacity tend to achieve economies of scale and also tend to improve export based on comparative advantage. Larger countries also have large domestic markets, in which they can consume more import products and this, later, leads to improve the volumes of bilateral trade (Sohn 2005).
Population variables, including both populations in the exporting coun-tries (Popi) is positive and significant toward export for the three periods (1991, 2001 and 2012). Population in the importing countries (Popj) as proxy of market size is also positive and significant. However, the coefficient in 2012, is the biggest one, which is 1.147 for population exporting countries and 1.021 for population in the importing countries.
According to Kien (2009), a high population may show a large domes-tic market and resource endowment. While there is the belief that higher do-mestic consumption leads to less reliance on international trade, on the contra-ry, he found the fact that larger domestic market with the big economies of scale follows by the opportunity to trade with the variation of goods.
Furthermore, the regression result of the distance variable has signifi-cantly negative coefficient as expected. The estimated coefficients show that holding other variables constant, one percent increase in distance between two countries will decrease in export by 1.020% in 1991, 0.944% in 2001, and 0.895% in 2012.
Distance has a negative impact on export flows and the establishment of the FTA also intensifies this impact. One important matter is that the cost of transportation still takes a bigger part in the transaction cost compared to the tariff. This is supported by the World Bank (2002) which stated that trans-portation costs are shown as the main obstacle to export flows.
These four free trade agreements (EU, ALADI, ASEAN, and NAFTA) are chosen as an extensive preferential trading institution, according to their long-time existence in the world economy and also their economic, demo-graphic and geographic implications. The number of trade volume both for member and non-member countries is large and represents their influence on world trade patterns (Endoh 1999).
The results from the model show that in the year 2001, participation in NAFTA has a significant impact on export flow. This is in line with the varia-ble of ALADI which shows the positive and significant impact toward export in 1991 and 2012.
ASEAN shows the positive and significant impact toward export in 2001 and 2012. On the contrary, EU has significant and negative impact to-
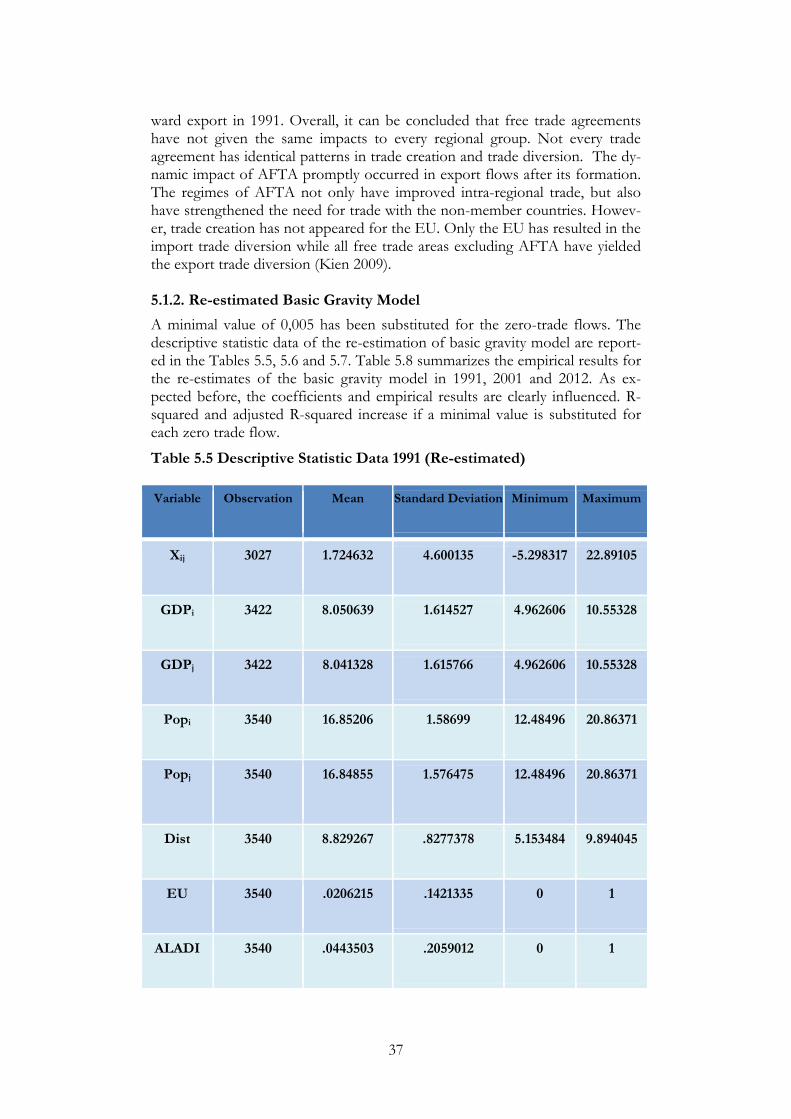
37
ward export in 1991. Overall, it can be concluded that free trade agreements have not given the same impacts to every regional group. Not every trade agreement has identical patterns in trade creation and trade diversion. The dy-namic impact of AFTA promptly occurred in export flows after its formation. The regimes of AFTA not only have improved intra-regional trade, but also have strengthened the need for trade with the non-member countries. Howev-er, trade creation has not appeared for the EU. Only the EU has resulted in the import trade diversion while all free trade areas excluding AFTA have yielded the export trade diversion (Kien 2009).
5.1.2. Re-estimated Basic Gravity Model
A minimal value of 0,005 has been substituted for the zero-trade flows. The descriptive statistic data of the re-estimation of basic gravity model are report-ed in the Tables 5.5, 5.6 and 5.7. Table 5.8 summarizes the empirical results for the re-estimates of the basic gravity model in 1991, 2001 and 2012. As ex-pected before, the coefficients and empirical results are clearly influenced. R-squared and adjusted R-squared increase if a minimal value is substituted for each zero trade flow.
Table 5.5 Descriptive Statistic Data 1991 (Re-estimated)
Variable Observation Mean Standard Deviation Minimum Maximum
Xij 3027 1.724632 4.600135 -5.298317 22.89105
GDPi 3422 8.050639 1.614527 4.962606 10.55328
GDPj 3422 8.041328 1.615766 4.962606 10.55328
Popi 3540 16.85206 1.58699 12.48496 20.86371
Popj 3540 16.84855 1.576475 12.48496 20.86371
Dist 3540 8.829267 .8277378 5.153484 9.894045
EU 3540 .0206215 .1421335 0 1
ALADI 3540 .0443503 .2059012 0 1
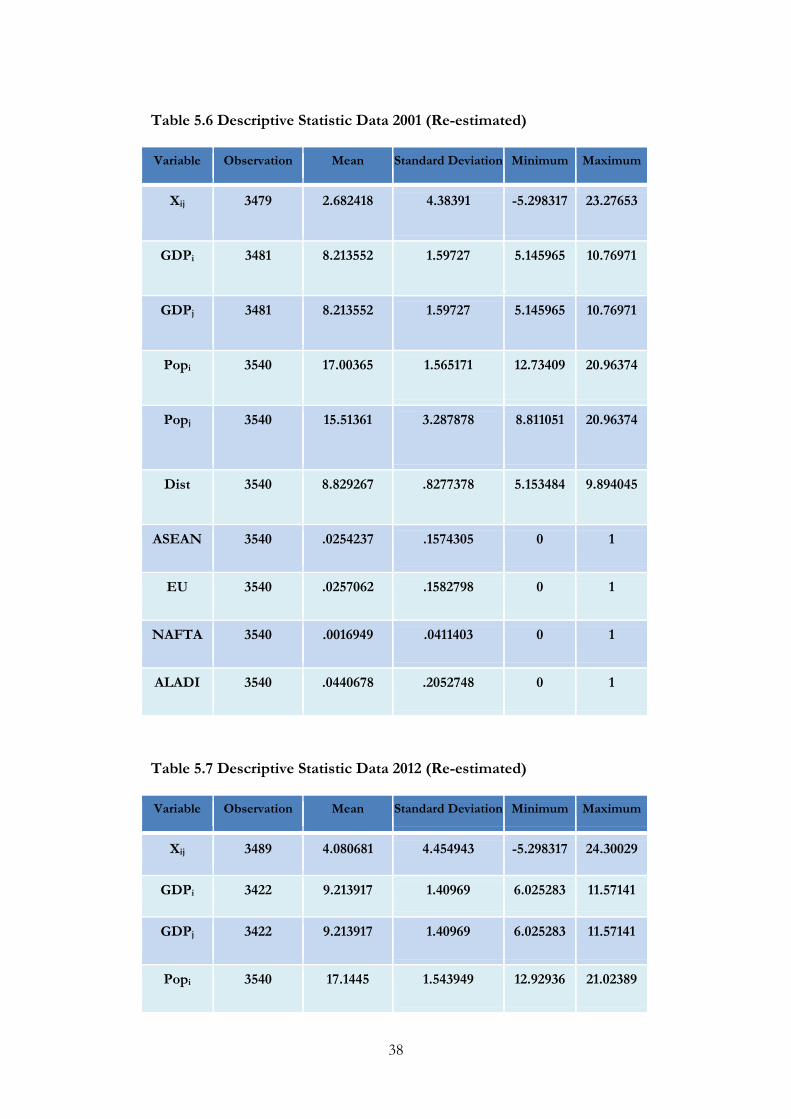
38
Table 5.6 Descriptive Statistic Data 2001 (Re-estimated)
Variable Observation Mean Standard Deviation Minimum Maximum
Xij 3479 2.682418 4.38391 -5.298317 23.27653
GDPi 3481 8.213552 1.59727 5.145965 10.76971
GDPj 3481 8.213552 1.59727 5.145965 10.76971
Popi 3540 17.00365 1.565171 12.73409 20.96374
Popj 3540 15.51361 3.287878 8.811051 20.96374
Dist 3540 8.829267 .8277378 5.153484 9.894045
ASEAN 3540 .0254237 .1574305 0 1
EU 3540 .0257062 .1582798 0 1
NAFTA 3540 .0016949 .0411403 0 1
ALADI 3540 .0440678 .2052748 0 1
Table 5.7 Descriptive Statistic Data 2012 (Re-estimated)
Variable Observation Mean Standard Deviation Minimum Maximum
Xij 3489 4.080681 4.454943 -5.298317 24.30029
GDPi 3422 9.213917 1.40969 6.025283 11.57141
GDPj 3422 9.213917 1.40969 6.025283 11.57141
Popi 3540 17.1445 1.543949 12.92936 21.02389
39
Popj 3540 17.1445 1.543949 12.92936 21.02389
Dist 3540 8.831951 .8246901 5.153484 9.894045
ASEAN 3540 .0536723 .2254018 0 1
EU 3540 .0262712 .1599632 0 1
NAFTA 3540 .0016949 .0411403 0 1
ALADI 3540 .0440678 .2052748 0 1
Source: Own computation
Table 5.8 Regression result (Re-estimated)
Variable 1991 2001 2012
GDPi 1.450*** (0.029)
1.331*** (0.035)
1.497*** (0.033)
GDPj 1.136*** (0.034)
0.829*** (0.036)
1.172*** (0.036)
Popi 1.273*** (0.030)
1.202*** (0.031)
1.324*** (0.028)
Popj 0.967*** (0.036)
0.124*** (0.021)
1.197*** (0.033)
Dist -1.369*** (0.064)
-1.116*** (0.070)
-1.096*** (0.056)
EU -1.560*** (0.217)
-0.383 (0.234)
-0.330** (0.160)
ALADI 1.147*** (0.226)
0.790*** (0.226)
1.759*** (0.220)
ASEAN 1.110*** (0.405)
2.123*** (0.142)
NAFTA 1.348*** (0.462)
-0.392 (0.399)
Constant -44.519*** (1.130)
-27.589*** (1.119)
-54.107*** (1.084)
R-squared 0.6320 0.5047 0.6443
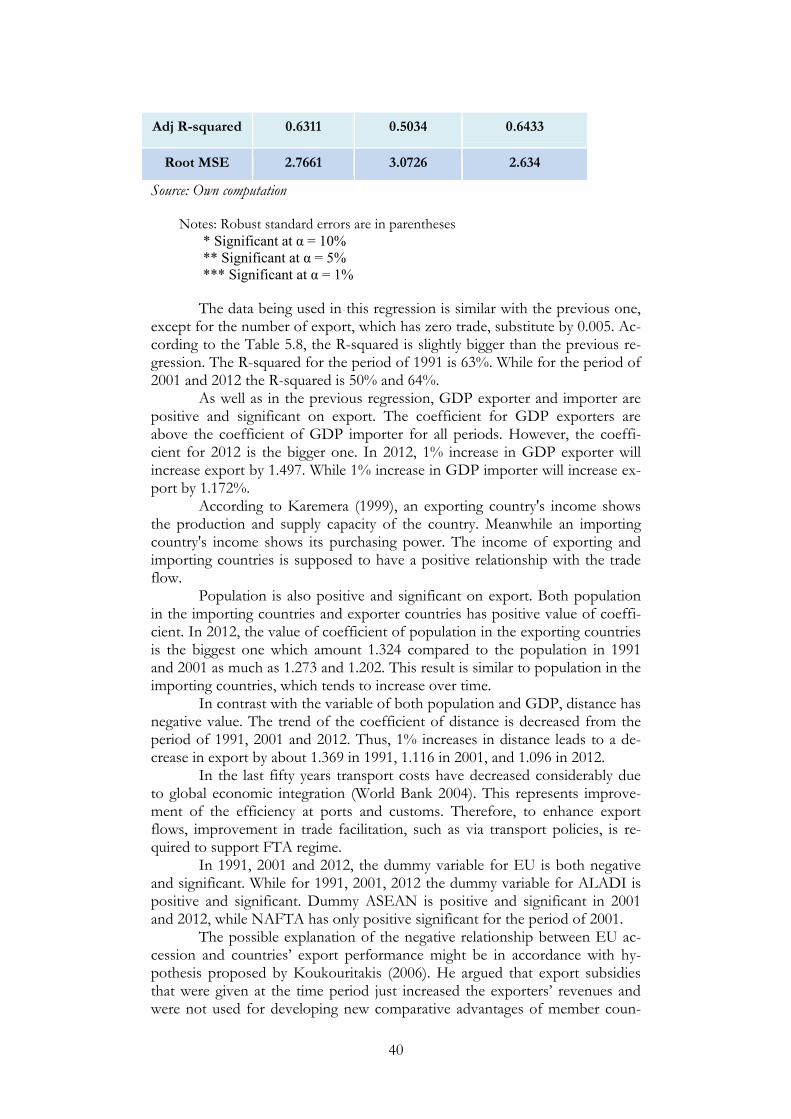
40
Adj R-squared 0.6311 0.5034 0.6433
Root MSE 2.7661 3.0726 2.634
Source: Own computation Notes: Robust standard errors are in parentheses
* Significant at α = 10%
** Significant at α = 5%
*** Significant at α = 1%
The data being used in this regression is similar with the previous one, except for the number of export, which has zero trade, substitute by 0.005. Ac-cording to the Table 5.8, the R-squared is slightly bigger than the previous re-gression. The R-squared for the period of 1991 is 63%. While for the period of 2001 and 2012 the R-squared is 50% and 64%.
As well as in the previous regression, GDP exporter and importer are positive and significant on export. The coefficient for GDP exporters are above the coefficient of GDP importer for all periods. However, the coeffi-cient for 2012 is the bigger one. In 2012, 1% increase in GDP exporter will increase export by 1.497. While 1% increase in GDP importer will increase ex-port by 1.172%.
According to Karemera (1999), an exporting country's income shows the production and supply capacity of the country. Meanwhile an importing country's income shows its purchasing power. The income of exporting and importing countries is supposed to have a positive relationship with the trade flow.
Population is also positive and significant on export. Both population in the importing countries and exporter countries has positive value of coeffi-cient. In 2012, the value of coefficient of population in the exporting countries is the biggest one which amount 1.324 compared to the population in 1991 and 2001 as much as 1.273 and 1.202. This result is similar to population in the importing countries, which tends to increase over time. In contrast with the variable of both population and GDP, distance has negative value. The trend of the coefficient of distance is decreased from the period of 1991, 2001 and 2012. Thus, 1% increases in distance leads to a de-crease in export by about 1.369 in 1991, 1.116 in 2001, and 1.096 in 2012. In the last fifty years transport costs have decreased considerably due to global economic integration (World Bank 2004). This represents improve-ment of the efficiency at ports and customs. Therefore, to enhance export flows, improvement in trade facilitation, such as via transport policies, is re-quired to support FTA regime.
In 1991, 2001 and 2012, the dummy variable for EU is both negative and significant. While for 1991, 2001, 2012 the dummy variable for ALADI is positive and significant. Dummy ASEAN is positive and significant in 2001 and 2012, while NAFTA has only positive significant for the period of 2001.
The possible explanation of the negative relationship between EU ac-cession and countries’ export performance might be in accordance with hy-pothesis proposed by Koukouritakis (2006). He argued that export subsidies that were given at the time period just increased the exporters’ revenues and were not used for developing new comparative advantages of member coun-

41
tries’ products. The export subsidies should be used for specializations of new products. Hence it can gain market competence in international trade.
42
Chapter 6 Conclusion
This paper has examined the impact of AFTA on ASEAN members’ ex-port performance. In order to analyze the impact, this paper has developed a basic gravity model to perform cross sectional data analysis involving sixty countries, both members and non-members of AFTA, for the periods of 1991,
2001, and 2012.
The estimation results of the gravity model show that the GDP of export-er countries has a positive influence on export. The GDP of importer coun-tries is also positively significant for export.
Population in exporter countries and importer countries has a large and positive effect on export. Hence, the size in the form of income and popula-tion does matter in ASEAN members’ export flows.
The distance variable that is related to transport costs confirms the theory of the gravity model. It indicates that transportation costs have become an im-portant barrier to ASEAN members’ export abilities.
The main finding of this study is that after AFTA came into force there was a positive effect on the member countries’ export performance. Among the key policy implications that can be drawn from this study are: 1. ASEAN and Countries/Dialogue Partners should reach the target of per
capita income convergence so the inequality of the per capita income among members of ASEAN and ASEAN + 1 country can be reduced. In addition, the other important issue is the convergence of economic indica-tors such as inflation, economic growth, and economic openness among members of ASEAN and ASEAN + 1.
2. Some of the things that concern the government are how ASEAN and ASEAN + 1 country must consider the principle of fairness and mutual benefit. Therefore, domestic policies should be directed at supply side poli-cies such as the provision of adequate infrastructure, improving the compet-itive climate of business/industry, and lowering both logistics costs and the cost of doing business. All of these proposed policies are in order to in-crease the productivity of national industry, as the driving force of econom-ic growth.
3. In the group of ASEAN member countries that have consistently had supe-rior products in AFTA, it is necessary to know the source of this compara-tive advantage, comparative advantage which is not derived from the ability of specific products to compete with similar products or simply depending on market demand tends to fluctuate.
4. In the group of ASEAN member countries that do not have superior prod-ucts in AFTA, it is necessary to recognize the factors causing this compara-tive disadvantage. The development of this industry can still be done to meet the domestic needs and, with improvement, have the possibility of the development of new export markets.
5. To optimize the positive impacts of trade, ASEAN member countries should continue efforts to increase the national exports to several countries
43
among the Countries/Dialogue Partners. In addition, it is also necessary to have efforts to substitute imports, particularly imports of final demand, namely consumer goods and capital goods in the form of final consumption goods with products derived from domestic production.
6. Export of products from the industrial sector should be targeted to be in-creased in the future. That is because the value of the multiplier is greater on the national economy in comparison with exports from other sectors. For the same reason, the import of goods used as auxiliary raw materials and capital goods for further production processes in the domestic industrial sector also needs to be prioritized in comparison to imports for consumer goods and other sectors.
This has been a preliminary study, giving recommendation for future research. The framework has been used here included examination of ‘export perfor-mance’ of the member countries of the FTA. It would be interesting to similar-ly assess welfare effects for the member countries. Lastly, this study is limited in its explanatory variables. Therefore, for further development of this re-search, it would be necessary to take into consideration more explanatory vari-ables that have been shown to be significant in other previous studies, such as border and exchange rate.
44
References
Andersson, J.E. (1979) 'A Theoretical Foundation for the Gravity Equation'
American Economic Review, 69(1): 106-116.
ASEAN Secretariat, 'Prospects, Opportunities and Challenges of ASEAN Eco-
nomic Community Towards 2015'. Accessed 29 July 2015. http://www.asean.org/archive/staffpaperdsgnathan2.pdf
ASEAN Secretariat, 'ASEAN Community in Figures Special Edition 2014'. Ac-
cessed 29 July 2015. file:///C:/Users/EI8HT/Downloads/ASEAN%20Community%20in%20Figures%2020141.pdf
ASEAN Secretariat, 'ASEAN Economic Community (AEC) Chartbook 2014' Ac-cessed 30 July 2015. http://www.asean.org/resources/item/asean-economic-
community-aec-chartbook-2014?category_id=382
ASEAN Secretariat, 'ASEAN Statistical Yearbook 2014'. Accessed 1 August
2015. http://www.asean.org/resources/item/asean-statistical-yearbook2014?category_id=382
ASEAN Secretariat, 'ASEAN Community Statistical System 2014' Accessed 15
June 2015.
http://www.asean.org/images/2015/february/asean_publications_2014/12.%2
0December%202014%20-%20ACSS%20ASEAN%20Community%20Statistical%20System%202014.pdf
ASEAN Secretariat, ' ASEAN Economic Community (AEC) Blueprint (8th Re-print)' Accessed 15 June 2015. http://www.asean.org/images/2015/february/asean_publications_2014/11.%2
0November%202014%20-%20ASEAN%20Economic%20Community%20Blueprint%20(8th%20Reprint).pdf
ASEAN Secretariat, 'ASEAN Communication Master Plan' Accessed 15 June 2015. http://www.asean.org/images/pdf/2014_upload/ACMP_Print_pdf_final.pdf
Baldwin R. E. (1992) 'Measurable Dynamic Gains from Trade', Journal of Politi-cal Economy 100(1): 162-174.
Behrens, K. and F. Robert-Nicoud (2009) 'Krugman’s Papers in Regional Sci-ence: the 100 dollar bill on the sidewalk is gone and the 2008 Nobel Prize well-
deserved', Papers in regional Science 88(2): 467-489.
Bergeijk, P.A.G.v. & Brakman, S. (2010) 'The gravity model in international trade: advances and applications' / ed. by Peter A.G. van Bergeijk and Steven
Brakman, Cambridge University Press, Cambridge [etc.].
Bergstrand, J.H. (1985) 'The Gravity Equation in International Trade -Some Mi-
croeconomic Foundations and Empirical Evidence', Reviewof Economics and Statistics 67: 474-481.
Bezuneh, M. & Yiheyis, Z. (2014) 'Has trade liberalization improved food avail-abity in developing countries?: an empirical analysis', Journal of economic de-velopment, vol. 39, no. 1, pp. 63-78.
Corden, W. M. (1972) 'Economies os Scale and Customs Union Theory', Journal of Political Economy 80: 465-75.
Davis, D.R. and D.E. Weinstein (2002) 'An Account of Global Factor Trade', American Economic Review 91: 1423-53.
Deardorff, A (2001) 'Local Comparative Advantage; Trade costs and the Pattern of Trade' Processed, University of Michigan.
Deadorff, A. V. (1995) 'Determinants of Bilateral Trade: Does Gravity Work in a A Neoclassical World? ' NBER Working Paper, No 5377, Cambridge Mass.: Na-tional Bureau of Economic Research.
45
Eichengreen, B. & Irwin, D.A. (1962) 'The role of history in bilateral trade flows', National bureau of economic research, Cambridge, Mass.
Endoh, M. (1999) 'Trade creation and trade diversion in the EEC, the LAFTA and
the CMEA: 1960-1994', Applied Economics, vol. 31, no. 2, pp. 207.
Feenstra, R. C., J. R. Markusen and A. K. Rose (1998) 'Understanding the Home
Market Effect and the Gravity Equation: The Role of Differentiating Goods', NBER Working Paper No. 6804.
Frankel, J. A. (1997) 'Regional Trading Blocs in The World Economic System' Washington, DC: Institute for International Economics.
Haveman, J. & Hummels, D. (2004) 'Alternative hypotheses and the volume of trade: the gravity equation and the extent of specialization', Canadian Journal of Economics, vol. 37, no. 1, pp. 199-218.
Henderson, J.V., Shalizi, Z, and Venables, AJ (2001) 'Geography and Develop-ment', Journal of Economic Geography 1: 81-106.
Itakura, K. (2014) 'Impact of Liberalization and Improved Connectivity and Fa-cilitation in ASEAN', Journal of Asian Economics, vol. 35, pp. 2-11.
Kalirajan, K. (2007) 'Regional Cooperation and Bilateral Trade Flows: an Empir-ical Measurement of Resistance', Int Trade J 21(2): 85-107.
Karemera, D. (1999) "A Gravity Model Analysis of the Benefits of Economic In-tegration in the Pacific Rim", Journal of Economic Integration, vol. 14, no. 3,
pp. 347-367.
Kepaptsoglou, K, M.G. Karlaftis and D. Tsamboulas (2010) 'The Gravity Model Specification for Modeling International Trade Flows and Free Trade Agreement Effects: A 10-Year Review of Empirical Studies', The Open Econom-ics Journal
3: 1-13.
Kien, N.T. (2009) 'Gravity Model by Panel Data Approach: An Empirical Applica-
tion with Implications for the ASEAN Free Trade Area', ASEAN Economic Bulle-tin, vol. 26, no. 3, pp. 266-277.
Kotabe M. and K. Helsen (2010) 'Global Marketing Management', Fifth Edition, John Wiley and Sons Inc.
Koukouritakis, M. (2006) 'EU Accession Effects on Export Performance: The
Case of Greece', South-Eastern Europe Journal of Economics, vol. 4, no. 2, pp. 147-166.
Krugman, P.R. and Obstfeld M. (2003) 'International Economics', Sixth Edition, World Student Series.
Krugman P. (1991) 'Increasing Returns and Economic Geography', Journal of Political Economy 3: 483-499.
Krugman, P.R. (1979) 'Increasing Returns, Monopolistic Competition, and In-
ternal Trade', Journal of International Economics 9: 469-479.
Linders, G.1. & Groot, H.L.F.d.1. (2006) 'Estimation of the gravity equation in the presence of zero flows' Tinbergen Institute, Amsterdam [etc.].
Martinez-Zarzoso I. and C. Suarez-Burguet (2005) 'Transport costs and trade:
empirical evidence for latin american imports from the European union', J Int Trade Econ Dev 14(3): 353-71.
Matyas Làszlò (1997) 'Proper Econometric Specification of the Gravity Model'. World Economy 20(3): 363-368.
Naqvi, K.H. (1999) 'Impact of Trade Liberalisation on Production, Income Dis-tribution and on Balance of Trade in Pakistan: A Counterfactual Analysis Using a Computable General Equilibrium Model', Institute os Social Studies.
Okabe, M. & Urata, S. (2014) 'The impact of AFTA on intra-AFTA trade', Journal of Asian Economics, vol. 35, pp. 12.
Paas, T. (2000) 'Gravity Approach for Modeling Trade Flows Between Estonia and The Main Trading Partners', Tartu University Press.
46
Plummer M. G., D. Cheong and S. Hamanaka (2010) 'Methodology for Impact Assessment of Free Trade Agreements', Asian Development Bank.
Rauch, J.E. (1999) 'Networks versus markets in international trade', Journal of
International Economics, vol. 48, no. 1, pp. 7-35.
Romer, P.M. (1994) 'New goods, old theory, and the welfare costs of trade re-
strictions', Journal of Development Economics, vol. 43, no. 1, pp. 5-38.
Schott, P.K. (2004) 'Across-Product versus Within-Product Specialization in In-
ternational Trade', The Quarterly Journal of Economics, vol. 119, no. 2, pp. 647-678.
Schumacher, R. (2012) 'Adam Smith’s Theory of Absolute Advantage and the Use of Doxography in the History of Economic', Erasmus Journal for Philosophy and Economics 5(2): 54-80.
Silva, J.M.C.S. & Tenreyro, S. (2006) 'The Log of Gravity', The review of eco-nomics and statistics, vol. 88, no. 4, pp. 641-658.
Sohn C-H. (2005) 'Does the gravity model explain South Korea‟s trade flows?', Japanese Econ Rev 56(4): 417-30.
Tang, D. (2005) 'Effects of the Regional Trading Arrangements on Trade: Evi-dence from the NAFTA, ANZCER and ASEAN Countries, 1989-2000', J Int Trade Econ Dev 14(2): 241-65.
Tinbergen, J. (1962) 'Shaping the World Economy—Suggestions for an Inter-
national Economic Policy', New York: Twentieth Century Fund.
Todaro, M.P. & Smith, S.C. (2009) 'Economic development: Michael P. Todaro, Stephen C. Smith, 10th [upd.] ' edn, Addison-Wesley, Harlow [etc.].
Urata, S. And M. Okabe (2007) 'The Impacts of Free Trade Agreements on Trade Flows: An Application ot the Gravity Model Approach', RIETI Discus-sion Paper Series 07-E-052.
Van Oort, F., Burger, M. & Linders, G. (2009) 'On the Specification of the Gravi-ty Model of Trade: Zeros, Excess Zeros and Zero-inflated Estimation', Spatial
Economic Analysis, vol. 4, no. 2, pp. 167-190.
World Bank. World Development Report 2002: Building Institutions for Markets. 2002.
World Bank. World Economic Outlook 2004. Chapter UI on Trade and Financial Integration, 2004.
Winters, L.A. (2004) 'Trade liberalisation and economic performance: an over-view', The Economic Journal, vol. 114, no. 493, pp. F4-F21.
Wooldridge, J.M. (2002) 'Econometric analysis of cross section and panel data: Jeffrey M. Wooldridge', MIT Press, Cambridge, MA [etc.].
Zagha, R., Nankani, G.T. (1949) & World Bank (2005) 'Economic growth in the
1990s: learning from a decade of reform' World Bank, Washington, D.C.
Related Documents