The International Journal of Indian Psychology: Volume: 01 | Issue: 04 | ISSN 2348-5396 © 2014 www.ijip.in July-September 2014 16 | P a g e The factors of personality traits among students of arts, commerce and science of students Mr. Ankit P. Patel* INTRODUCTION Today many interesting researches are being conducted in the field of psychology. This Research on home environment, anxiety, mental health, emotional maturity etc finds the place in many leading journals of psychology. Topic of personality traits has drawn attention of many researchers in psychology. Research in personality traits has received a great deal of attention in the last few decades. Comparative study on personality traits of different social groups is worth exploring. Therefore a researcher has selected an interesting topic of comparing the personality traits of Arts, Commerce and Science students. It is also worthwhile to compare the personality traits of males and females. Different inventories of evaluating personality are available. From the available test of personality, the researcher has selected 16 PF of cattle to collect relevant data. Personality is defined as characteristics and distinctive ways of behaving according to C.T. Morgan. The individual behaves in the environment according to his personality traits. The oldest approach to the problem of identifying characteristic and distinctive ways of behaving is to establish a limited number of traits that can be measured with standardised personality tests. 16 PF is one such standard personality inventory. A scientific way of selecting and measuring a limited number of traits is the technique of factor analysis. Different researchers have identified several factors of personality and constructed standard personality inventories. One such popular personality test is 16 PF of cattle. The trait name represents the 16 personality factor obtained by factor analysis of large number of rating of different groups. In the present research, researcher has used standardised Gujarati version of original 16 PF of cattle. *M.A, Clinical Psychology, Sardar Patel University, Vallabh Vidhyanagar, Gujarat

Welcome message from author
This document is posted to help you gain knowledge. Please leave a comment to let me know what you think about it! Share it to your friends and learn new things together.
Transcript
The International Journal of Indian Psychology: Volume: 01 | Issue: 04 | ISSN 2348-5396
© 2014 www.ijip.in July-September 2014 16 | P a g e
The factors of personality traits among students of arts, commerce
and science of students
Mr. Ankit P. Patel*
INTRODUCTION
Today many interesting researches are being conducted in the field of psychology. This Research
on home environment, anxiety, mental health, emotional maturity etc finds the place in many
leading journals of psychology. Topic of personality traits has drawn attention of many
researchers in psychology. Research in personality traits has received a great deal of attention in
the last few decades. Comparative study on personality traits of different social groups is worth
exploring. Therefore a researcher has selected an interesting topic of comparing the personality
traits of Arts, Commerce and Science students. It is also worthwhile to compare the personality
traits of males and females. Different inventories of evaluating personality are available. From
the available test of personality, the researcher has selected 16 PF of cattle to collect relevant
data. Personality is defined as characteristics and distinctive ways of behaving according to C.T.
Morgan. The individual behaves in the environment according to his personality traits. The
oldest approach to the problem of identifying characteristic and distinctive ways of behaving is
to establish a limited number of traits that can be measured with standardised personality tests.
16 PF is one such standard personality inventory.
A scientific way of selecting and measuring a limited number of traits is the technique of factor
analysis. Different researchers have identified several factors of personality and constructed
standard personality inventories. One such popular personality test is 16 PF of cattle. The trait
name represents the 16 personality factor obtained by factor analysis of large number of rating of
different groups. In the present research, researcher has used standardised Gujarati version of
original 16 PF of cattle.
*M.A, Clinical Psychology, Sardar Patel University, Vallabh Vidhyanagar, Gujarat
The International Journal of Indian Psychology: Volume: 01 | Issue: 04 | ISSN 2348-5396
© 2014 www.ijip.in July-September 2014 17 | P a g e
REVIEW OF LITERATURE
A. “ A comparative study of factors of personality traits among players of individual and team
games of universities of Gujarat ” The above research was conducted by Dr. Harish M.
Desai, Head of Physical Education, Gujarat University, Ahmadabad, under the guidance of
Dr. P.B. Tambar, Director, Department of Physical Education. M. S. University of Baroda.
The sample consisted of total 420 players, 210 males and 210 females. Researcher
administered 16 PF to those persons. The scoring was done according to manual. The
statistical analysis consisted mean, SD and T. Significant difference in personality traits was
found in males and females. As well as players of individual events and team events.
B. Personality and culture revisited: Linking traits and dimensions of culture.
The above study was conducted in Tilburg, Netherland, by Greet Hofstede, Robert R Mcnac.
It was concerned with trait and preliterate societies. In these research taxonomies of
personality traits and cultural values was discussed. The five- factor model of personality is
universally valued taxonomy of traits. In analysis of recently reported data, mean personality
score of 33 countries were significantly correlated with culture dimension score.
Environmental and temperamental explanations were discussed for this.
C. University students personality traits and entrepreneurial intention:
Using entrepreneurship and entrepreneurial attitudes as mediating variable, the study was
conducted by Su-Changchen, Professors and Ling-Lingsing, lecturer in National Penghu
university of Science & Technology, Taiwan.
This study aims to probe into relationship between personality traits & entrepreneurial
attitude. A total of 550 questionnaires were distributed to seven universities in Taiwan. After
eliminating the questionnaires with incomplete answers & invalid ones, there were 392
variety samples with a valid return rate of 71.27%. The result indicated that openness to
experience; extraversion and conscientiousness influence entrepreneur attitude
entrepreneurship & entrepreneurial attitude reveal partial mediating effects between
openness to experience, extraversion and conscientiousness in personality traits &
entrepreneur intention.
The International Journal of Indian Psychology: Volume: 01 | Issue: 04 | ISSN 2348-5396
© 2014 www.ijip.in July-September 2014 18 | P a g e
OBJECTIVES:
The present research was carried out with the following objectives.
I. To find out the difference in personality traits of Arts, Commerce and Science students.
II. To find out the difference in personality traits between males and females students.
SAMPLE:
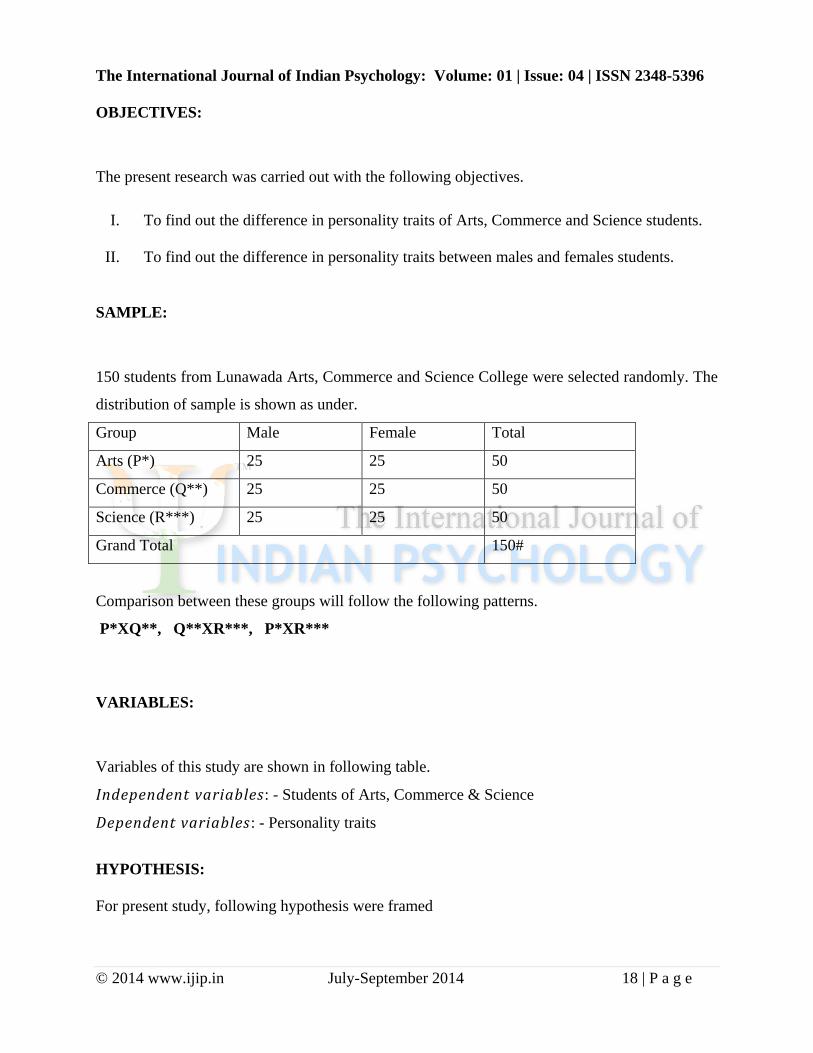
150 students from Lunawada Arts, Commerce and Science College were selected randomly. The
distribution of sample is shown as under.
Group Male Female Total
Arts (P*) 25 25 50
Commerce (Q**) 25 25 50
Science (R***) 25 25 50
Grand Total 150#
Comparison between these groups will follow the following patterns.
P*XQ**, Q**XR***, P*XR***
VARIABLES:
Variables of this study are shown in following table.
Independent variables: - Students of Arts, Commerce & Science
Dependent variables: - Personality traits
HYPOTHESIS:
For present study, following hypothesis were framed
The International Journal of Indian Psychology: Volume: 01 | Issue: 04 | ISSN 2348-5396
© 2014 www.ijip.in July-September 2014 19 | P a g e
1) There will be no significant difference in factors of personality traits among Arts and
Commerce students.
2) There will be no significant difference in factors of personality traits among Commerce
and Science students.
3) There will be no significant difference in factors of personality traits among Arts and
Science students.
4) There will be no significant difference in factors of personality traits among male and
female students.
TOOLS FOR THE DATA COLLECTION:
Standardized Gujarati version of original 16 PF prepared by Dr. J.H Shah and Dr. R.S Patel of
educational faculty of Gujarat University, was used as a tool of data collection. The reliability
and validity of the said test has been worked out by researcher of the present test.
Discussion:- Present research has been under taken to compare the factors of personality traits
among Arts & Commerce students, commerce & science students, Arts & science students. For
the purpose of this study 50 arts, 50 commerce and 50 science students were selected as sample.
Each group consisted of 25 male students and 25 female students. Out of total sample of 150
students, 75 were males and 75 were females. It was hypotheses that there is no significant
difference in the personality traits among arts and commerce, commerce and science, arts &
science students, male & female students.
Standardised Gujarati version of 16 PF test prepared by Dr. J. H. Shah and Dr. R. S. Patel
was used for collecting data. Two cardboards & stencil scoring keys were used. Key-1 covered
factors (Traits) A, C, F, H, L, N, Q1 & Q3. Key-2 covered other factors (traits) B, E, G, I, M, O,
Q2 & Q4. The scores were summed up and row scores were covered into “sten” with the help of
norms of Form A and form B.
For the statistical analysis of the collected data mean & S.D. were worked out initially
and then to find out significant difference between the groups “t” ratio was worked out. The level
of significance for‟s‟ ratio was 0.05. The discussion of four tables is as under:
Discussion on table no 1
Difference on personality tarts of factors A to Q4 among Arts and Commerce students.
The International Journal of Indian Psychology: Volume: 01 | Issue: 04 | ISSN 2348-5396
© 2014 www.ijip.in July-September 2014 20 | P a g e
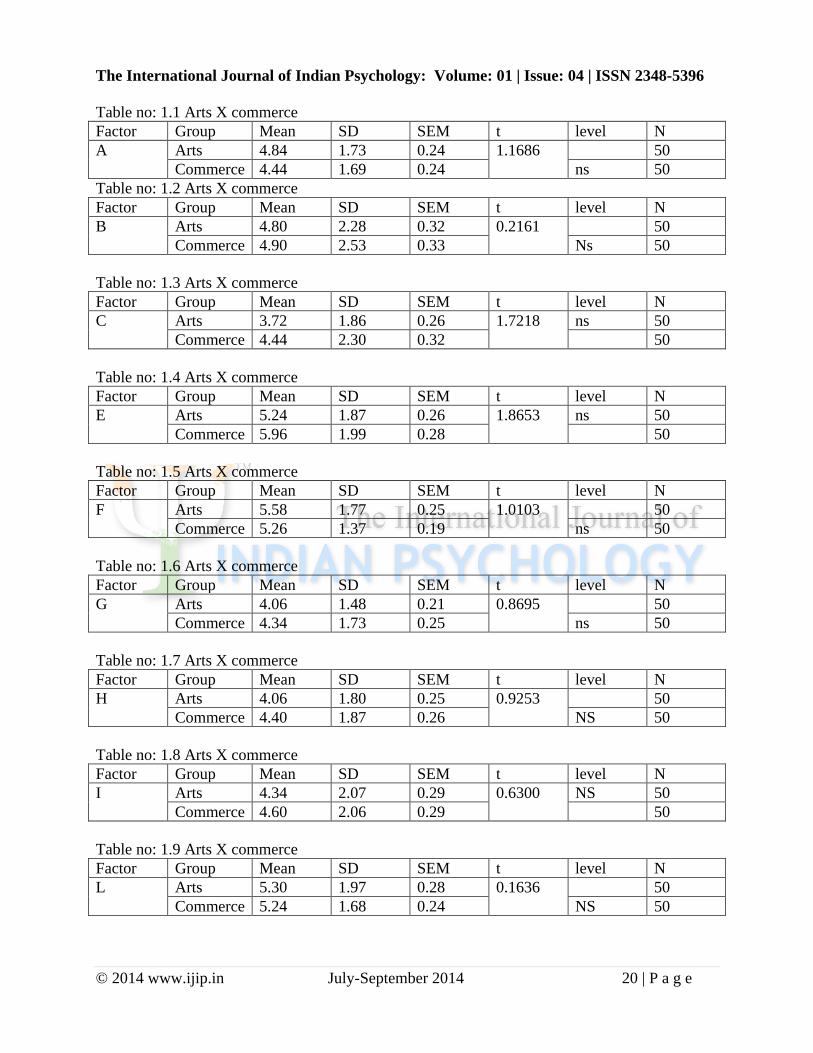
Table no: 1.1 Arts X commerce
Factor Group Mean SD SEM t level N
A Arts 4.84 1.73 0.24 1.1686 50
Commerce 4.44 1.69 0.24 ns 50
Table no: 1.2 Arts X commerce
Factor Group Mean SD SEM t level N
B Arts 4.80 2.28 0.32 0.2161 50
Commerce 4.90 2.53 0.33 Ns 50
Table no: 1.3 Arts X commerce
Factor Group Mean SD SEM t level N
C Arts 3.72 1.86 0.26 1.7218 ns 50
Commerce 4.44 2.30 0.32 50
Table no: 1.4 Arts X commerce
Factor Group Mean SD SEM t level N
E Arts 5.24 1.87 0.26 1.8653 ns 50
Commerce 5.96 1.99 0.28 50
Table no: 1.5 Arts X commerce
Factor Group Mean SD SEM t level N
F Arts 5.58 1.77 0.25 1.0103 50
Commerce 5.26 1.37 0.19 ns 50
Table no: 1.6 Arts X commerce
Factor Group Mean SD SEM t level N
G Arts 4.06 1.48 0.21 0.8695 50
Commerce 4.34 1.73 0.25 ns 50
Table no: 1.7 Arts X commerce
Factor Group Mean SD SEM t level N
H Arts 4.06 1.80 0.25 0.9253 50
Commerce 4.40 1.87 0.26 NS 50
Table no: 1.8 Arts X commerce
Factor Group Mean SD SEM t level N
I Arts 4.34 2.07 0.29 0.6300 NS 50
Commerce 4.60 2.06 0.29 50
Table no: 1.9 Arts X commerce
Factor Group Mean SD SEM t level N
L Arts 5.30 1.97 0.28 0.1636 50
Commerce 5.24 1.68 0.24 NS 50
The International Journal of Indian Psychology: Volume: 01 | Issue: 04 | ISSN 2348-5396
© 2014 www.ijip.in July-September 2014 21 | P a g e
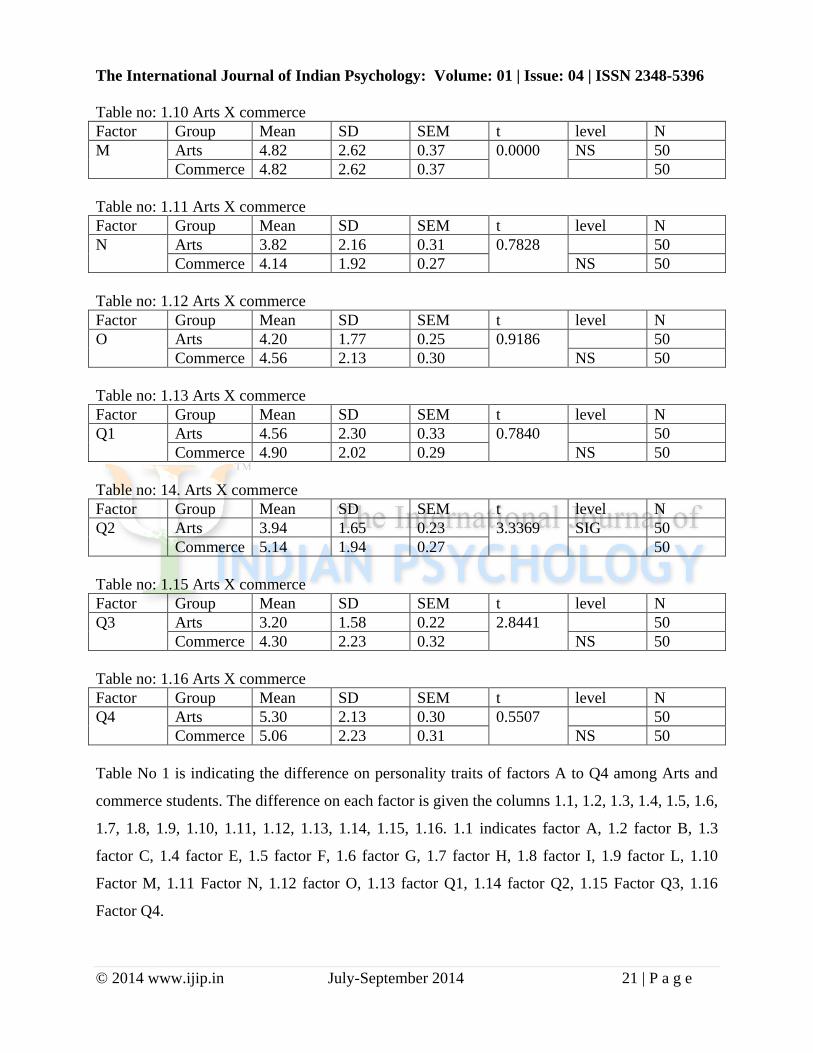
Table no: 1.10 Arts X commerce
Factor Group Mean SD SEM t level N
M Arts 4.82 2.62 0.37 0.0000 NS 50
Commerce 4.82 2.62 0.37 50
Table no: 1.11 Arts X commerce
Factor Group Mean SD SEM t level N
N Arts 3.82 2.16 0.31 0.7828 50
Commerce 4.14 1.92 0.27 NS 50
Table no: 1.12 Arts X commerce
Factor Group Mean SD SEM t level N
O Arts 4.20 1.77 0.25 0.9186 50
Commerce 4.56 2.13 0.30 NS 50
Table no: 1.13 Arts X commerce
Factor Group Mean SD SEM t level N
Q1 Arts 4.56 2.30 0.33 0.7840 50
Commerce 4.90 2.02 0.29 NS 50
Table no: 14. Arts X commerce
Factor Group Mean SD SEM t level N
Q2 Arts 3.94 1.65 0.23 3.3369 SIG 50
Commerce 5.14 1.94 0.27 50
Table no: 1.15 Arts X commerce
Factor Group Mean SD SEM t level N
Q3 Arts 3.20 1.58 0.22 2.8441 50
Commerce 4.30 2.23 0.32 NS 50
Table no: 1.16 Arts X commerce
Factor Group Mean SD SEM t level N
Q4 Arts 5.30 2.13 0.30 0.5507 50
Commerce 5.06 2.23 0.31 NS 50
Table No 1 is indicating the difference on personality traits of factors A to Q4 among Arts and
commerce students. The difference on each factor is given the columns 1.1, 1.2, 1.3, 1.4, 1.5, 1.6,
1.7, 1.8, 1.9, 1.10, 1.11, 1.12, 1.13, 1.14, 1.15, 1.16. 1.1 indicates factor A, 1.2 factor B, 1.3
factor C, 1.4 factor E, 1.5 factor F, 1.6 factor G, 1.7 factor H, 1.8 factor I, 1.9 factor L, 1.10
Factor M, 1.11 Factor N, 1.12 factor O, 1.13 factor Q1, 1.14 factor Q2, 1.15 Factor Q3, 1.16
Factor Q4.
The International Journal of Indian Psychology: Volume: 01 | Issue: 04 | ISSN 2348-5396
© 2014 www.ijip.in July-September 2014 22 | P a g e
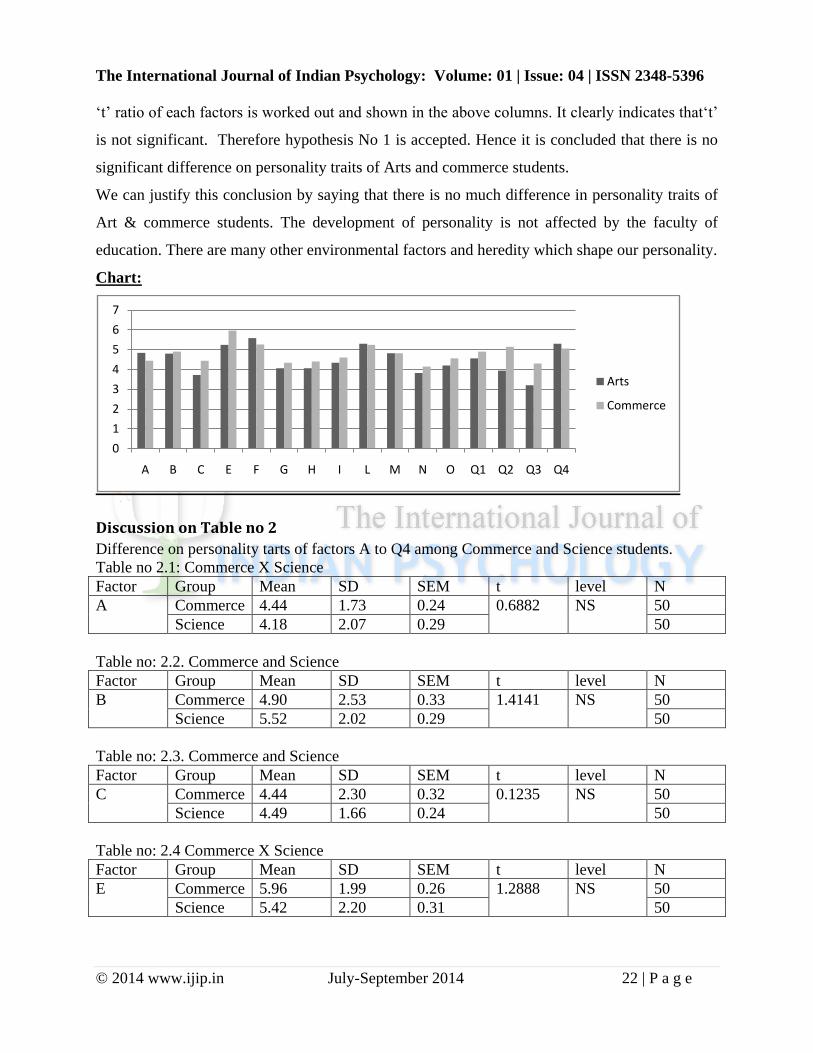
„t‟ ratio of each factors is worked out and shown in the above columns. It clearly indicates that„t‟
is not significant. Therefore hypothesis No 1 is accepted. Hence it is concluded that there is no
significant difference on personality traits of Arts and commerce students.
We can justify this conclusion by saying that there is no much difference in personality traits of
Art & commerce students. The development of personality is not affected by the faculty of
education. There are many other environmental factors and heredity which shape our personality.
Chart:
Discussion on Table no 2
Difference on personality tarts of factors A to Q4 among Commerce and Science students.
Table no 2.1: Commerce X Science
Factor Group Mean SD SEM t level N
A Commerce 4.44 1.73 0.24 0.6882 NS 50
Science 4.18 2.07 0.29 50
Table no: 2.2. Commerce and Science
Factor Group Mean SD SEM t level N
B Commerce 4.90 2.53 0.33 1.4141 NS 50
Science 5.52 2.02 0.29 50
Table no: 2.3. Commerce and Science
Factor Group Mean SD SEM t level N
C Commerce 4.44 2.30 0.32 0.1235 NS 50
Science 4.49 1.66 0.24 50
Table no: 2.4 Commerce X Science
Factor Group Mean SD SEM t level N
E Commerce 5.96 1.99 0.26 1.2888 NS 50
Science 5.42 2.20 0.31 50
0
1
2
3
4
5
6
7
A B C E F G H I L M N O Q1 Q2 Q3 Q4
Arts
Commerce
The International Journal of Indian Psychology: Volume: 01 | Issue: 04 | ISSN 2348-5396
© 2014 www.ijip.in July-September 2014 23 | P a g e
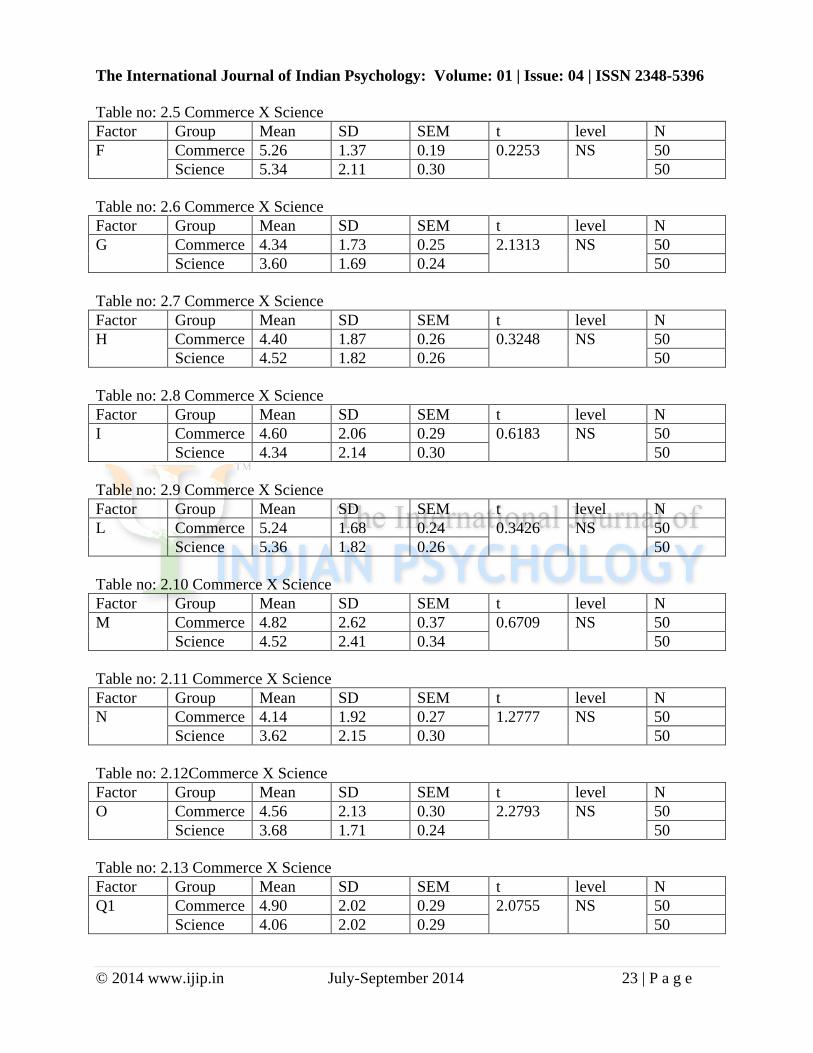
Table no: 2.5 Commerce X Science
Factor Group Mean SD SEM t level N
F Commerce 5.26 1.37 0.19 0.2253 NS 50
Science 5.34 2.11 0.30 50
Table no: 2.6 Commerce X Science
Factor Group Mean SD SEM t level N
G Commerce 4.34 1.73 0.25 2.1313 NS 50
Science 3.60 1.69 0.24 50
Table no: 2.7 Commerce X Science
Factor Group Mean SD SEM t level N
H Commerce 4.40 1.87 0.26 0.3248 NS 50
Science 4.52 1.82 0.26 50
Table no: 2.8 Commerce X Science
Factor Group Mean SD SEM t level N
I Commerce 4.60 2.06 0.29 0.6183 NS 50
Science 4.34 2.14 0.30 50
Table no: 2.9 Commerce X Science
Factor Group Mean SD SEM t level N
L Commerce 5.24 1.68 0.24 0.3426 NS 50
Science 5.36 1.82 0.26 50
Table no: 2.10 Commerce X Science
Factor Group Mean SD SEM t level N
M Commerce 4.82 2.62 0.37 0.6709 NS 50
Science 4.52 2.41 0.34 50
Table no: 2.11 Commerce X Science
Factor Group Mean SD SEM t level N
N Commerce 4.14 1.92 0.27 1.2777 NS 50
Science 3.62 2.15 0.30 50
Table no: 2.12Commerce X Science
Factor Group Mean SD SEM t level N
O Commerce 4.56 2.13 0.30 2.2793 NS 50
Science 3.68 1.71 0.24 50
Table no: 2.13 Commerce X Science
Factor Group Mean SD SEM t level N
Q1 Commerce 4.90 2.02 0.29 2.0755 NS 50
Science 4.06 2.02 0.29 50
The International Journal of Indian Psychology: Volume: 01 | Issue: 04 | ISSN 2348-5396
© 2014 www.ijip.in July-September 2014 24 | P a g e
Table no: 2.14 Commerce X Science
Factor Group Mean SD SEM t level N
Q2 Commerce 5.14 1.94 0.27 3.1691 NS 50
Science 3.88 2.04 0.29 50
Table no: 2.15 Commerce X Science
Factor Group Mean SD SEM t level N
Q3 Commerce 4.30 2.23 0.32 3.7756 NS 50
Science 2.78 1.76 0.25 50
Table no: 2.16 Commerce X Science
Factor Group Mean SD SEM t level N
Q4 Commerce 5.06 2.23 0.13 0.4365 NS 50
Science 5.26 2.35 0.33 50
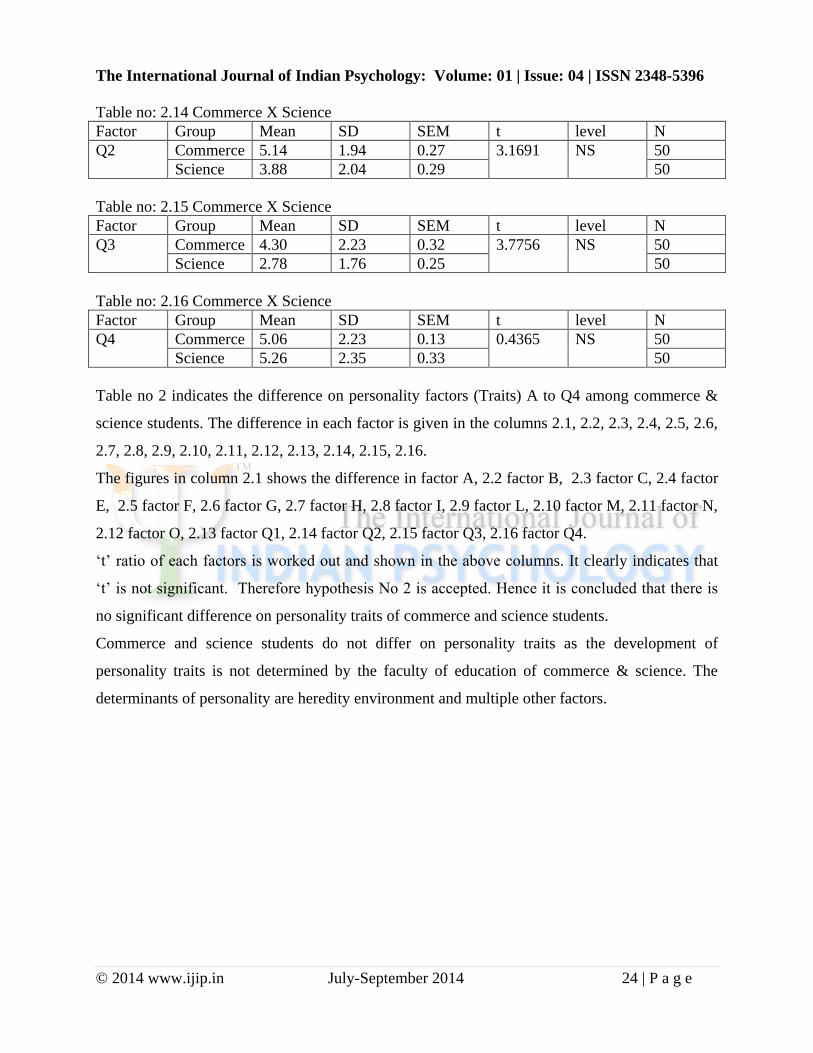
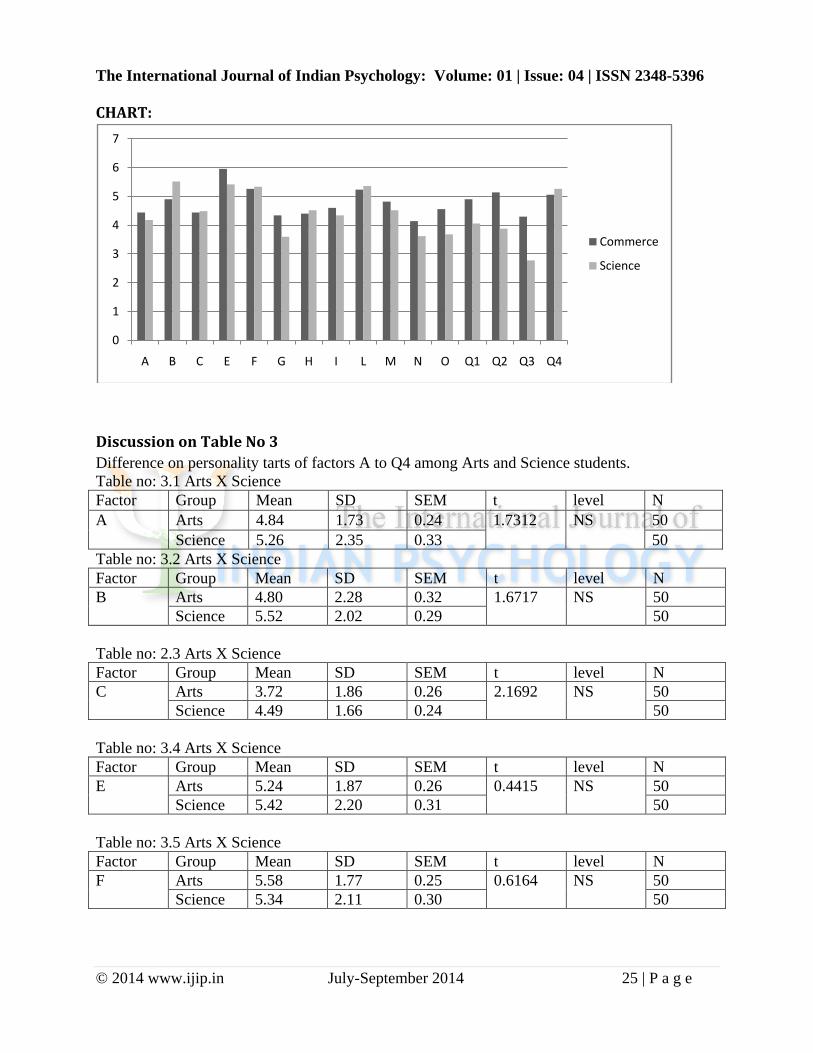
Table no 2 indicates the difference on personality factors (Traits) A to Q4 among commerce &
science students. The difference in each factor is given in the columns 2.1, 2.2, 2.3, 2.4, 2.5, 2.6,
2.7, 2.8, 2.9, 2.10, 2.11, 2.12, 2.13, 2.14, 2.15, 2.16.
The figures in column 2.1 shows the difference in factor A, 2.2 factor B, 2.3 factor C, 2.4 factor
E, 2.5 factor F, 2.6 factor G, 2.7 factor H, 2.8 factor I, 2.9 factor L, 2.10 factor M, 2.11 factor N,
2.12 factor O, 2.13 factor Q1, 2.14 factor Q2, 2.15 factor Q3, 2.16 factor Q4.
„t‟ ratio of each factors is worked out and shown in the above columns. It clearly indicates that
„t‟ is not significant. Therefore hypothesis No 2 is accepted. Hence it is concluded that there is
no significant difference on personality traits of commerce and science students.
Commerce and science students do not differ on personality traits as the development of
personality traits is not determined by the faculty of education of commerce & science. The
determinants of personality are heredity environment and multiple other factors.
The International Journal of Indian Psychology: Volume: 01 | Issue: 04 | ISSN 2348-5396
© 2014 www.ijip.in July-September 2014 25 | P a g e
CHART:
Discussion on Table No 3
Difference on personality tarts of factors A to Q4 among Arts and Science students.
Table no: 3.1 Arts X Science
Factor Group Mean SD SEM t level N
A Arts 4.84 1.73 0.24 1.7312 NS 50
Science 5.26 2.35 0.33 50
Table no: 3.2 Arts X Science
Factor Group Mean SD SEM t level N
B Arts 4.80 2.28 0.32 1.6717 NS 50
Science 5.52 2.02 0.29 50
Table no: 2.3 Arts X Science
Factor Group Mean SD SEM t level N
C Arts 3.72 1.86 0.26 2.1692 NS 50
Science 4.49 1.66 0.24 50
Table no: 3.4 Arts X Science
Factor Group Mean SD SEM t level N
E Arts 5.24 1.87 0.26 0.4415 NS 50
Science 5.42 2.20 0.31 50
Table no: 3.5 Arts X Science
Factor Group Mean SD SEM t level N
F Arts 5.58 1.77 0.25 0.6164 NS 50
Science 5.34 2.11 0.30 50
0
1
2
3
4
5
6
7
A B C E F G H I L M N O Q1 Q2 Q3 Q4
Commerce
Science
The International Journal of Indian Psychology: Volume: 01 | Issue: 04 | ISSN 2348-5396
© 2014 www.ijip.in July-September 2014 26 | P a g e
Table no: 3.6 Arts X Science
Factor Group Mean SD SEM t level N
G Arts 4.06 1.48 0.21 1.4493 NS 50
Science 3.60 1.69 0.24 50
Table no: 3.7 Arts X Science
Factor Group Mean SD SEM t level N
H Arts 4.06 1.80 0.25 1.2702 NS 50
Science 4.52 1.82 0.26 50
Table no: 3.8 Arts X Science
Factor Group Mean SD SEM t level N
I Arts 4.34 2.07 0.29 0.0000 NS 50
Science 4.34 2.14 0.30 50
Table no: 3.9 Arts X Science
Factor Group Mean SD SEM t level N
L Arts 5.30 1.97 0.28 0.1583 NS 50
Science 5.36 1.82 0.26 50
Table no: 3.10 Arts X Science
Factor Group Mean SD SEM t level N
M Arts 4.82 2.62 0.37 0.5964 NS 50
Science 4.52 2.41 0.34 50
Table no: 3.11 Arts X Science
Factor Group Mean SD SEM t level N
N Arts 3.82 2.16 0.31 0.4640 NS 50
Science 3.62 2.15 0.30 50
Table no: 3.12 Arts X Science
Factor Group Mean SD SEM t level N
O Arts 4.20 1.77 0.25 1.4938 NS 50
Science 3.68 1.71 0.24 50
Table no: 3.13 Arts X Science
Factor Group Mean SD SEM t level N
Q1 Arts 4.56 2.30 0.33 1.1525 NS 50
Science 4.06 2.02 0.29 50
Table no: 3.14 Arts X Science
Factor Group Mean SD SEM t level N
Q2 Arts 3.94 1.65 0.23 0.1620 NS 50
Science 3.88 2.04 0.29 50
The International Journal of Indian Psychology: Volume: 01 | Issue: 04 | ISSN 2348-5396
© 2014 www.ijip.in July-September 2014 27 | P a g e
Table no: 3.15 Arts X Science
Factor Group Mean SD SEM t level N
Q3 Arts 3.20 1.58 0.22 1.2546 NS 50
Science 2.78 1.76 0.25 50
Table no: 3.16 Arts X Science
Factor Group Mean SD SEM t level N
Q4 Arts 5.30 2.13 0.30 0.0891 NS 50
Science 5.26 2.35 0.33 50
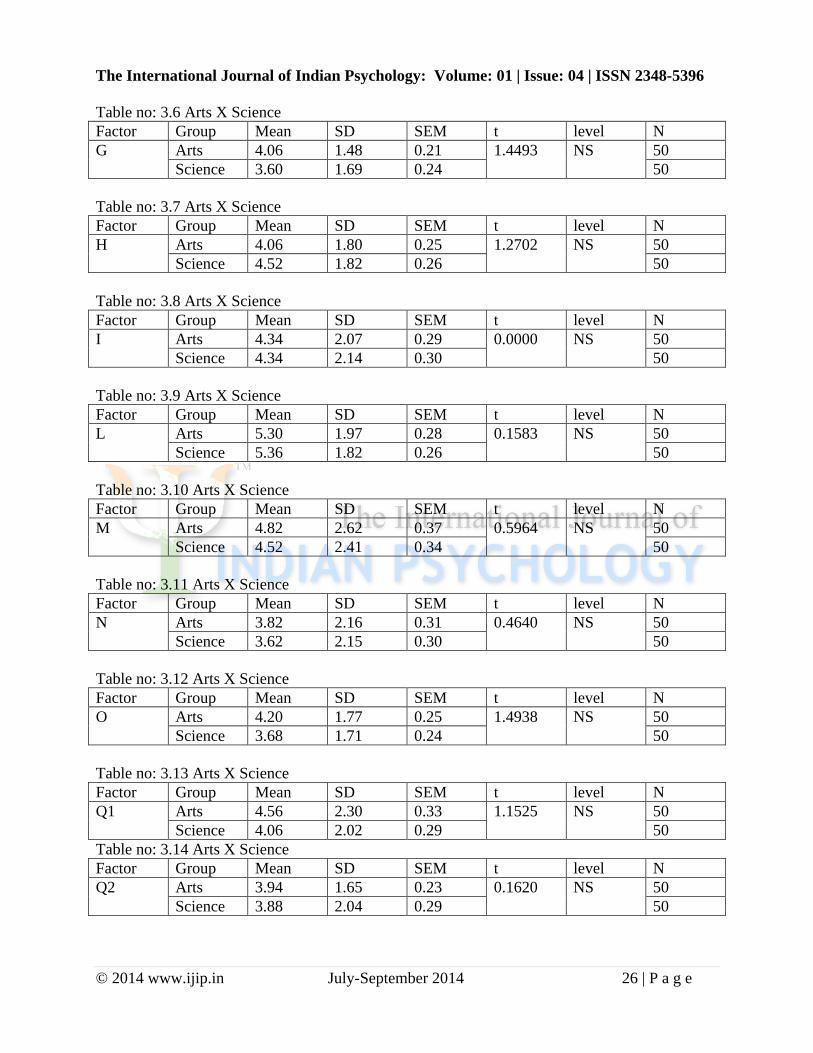
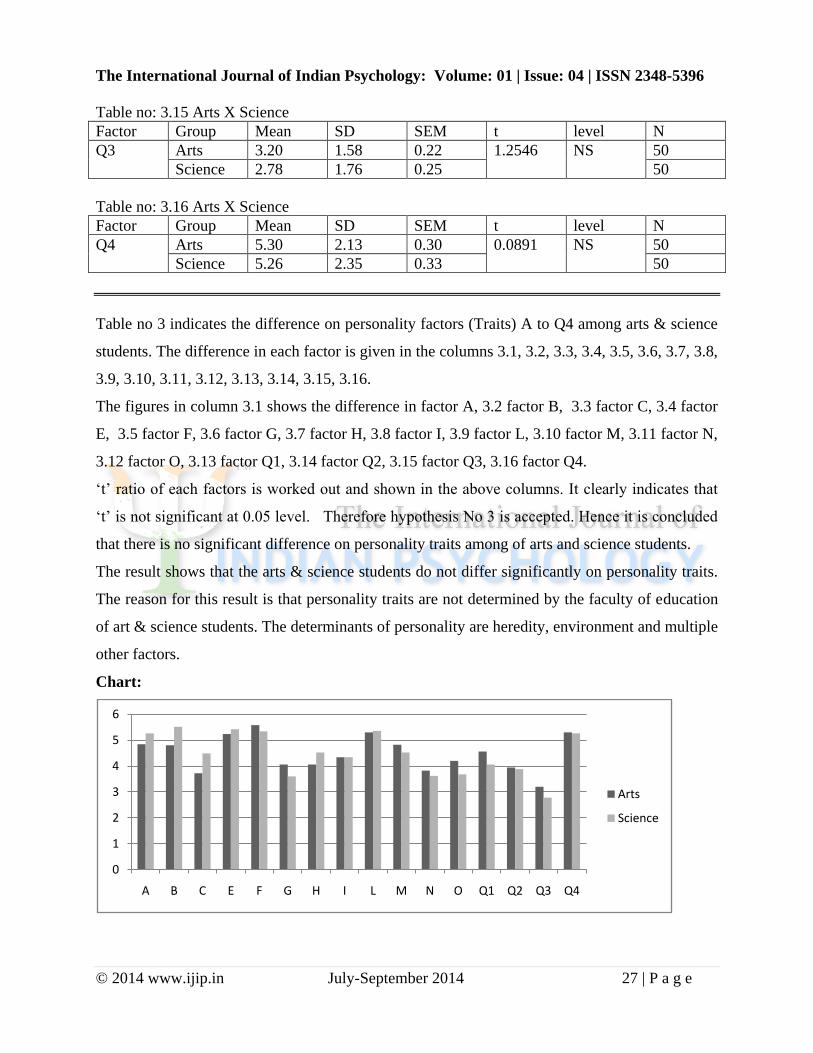
Table no 3 indicates the difference on personality factors (Traits) A to Q4 among arts & science
students. The difference in each factor is given in the columns 3.1, 3.2, 3.3, 3.4, 3.5, 3.6, 3.7, 3.8,
3.9, 3.10, 3.11, 3.12, 3.13, 3.14, 3.15, 3.16.
The figures in column 3.1 shows the difference in factor A, 3.2 factor B, 3.3 factor C, 3.4 factor
E, 3.5 factor F, 3.6 factor G, 3.7 factor H, 3.8 factor I, 3.9 factor L, 3.10 factor M, 3.11 factor N,
3.12 factor O, 3.13 factor Q1, 3.14 factor Q2, 3.15 factor Q3, 3.16 factor Q4.
„t‟ ratio of each factors is worked out and shown in the above columns. It clearly indicates that
„t‟ is not significant at 0.05 level. Therefore hypothesis No 3 is accepted. Hence it is concluded
that there is no significant difference on personality traits among of arts and science students.
The result shows that the arts & science students do not differ significantly on personality traits.
The reason for this result is that personality traits are not determined by the faculty of education
of art & science students. The determinants of personality are heredity, environment and multiple
other factors.
Chart:
0
1
2
3
4
5
6
A B C E F G H I L M N O Q1 Q2 Q3 Q4
Arts
Science
The International Journal of Indian Psychology: Volume: 01 | Issue: 04 | ISSN 2348-5396
© 2014 www.ijip.in July-September 2014 28 | P a g e
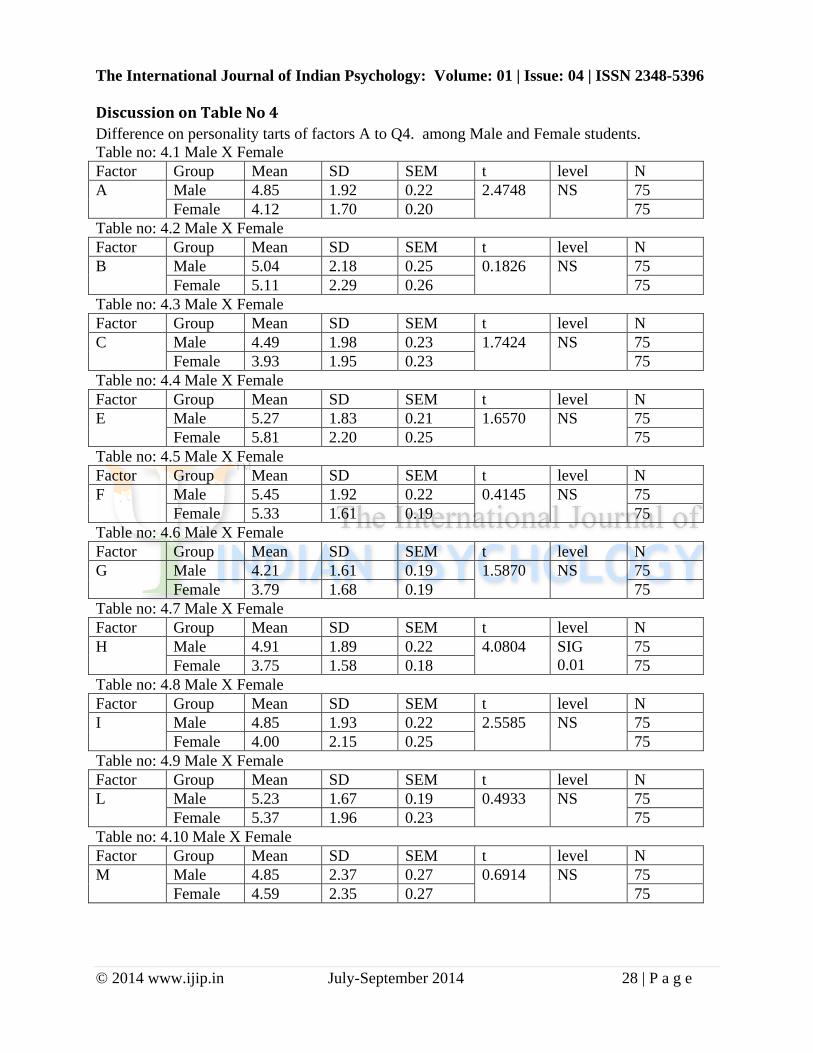
Discussion on Table No 4
Difference on personality tarts of factors A to Q4. among Male and Female students.
Table no: 4.1 Male X Female
Factor Group Mean SD SEM t level N
A Male 4.85 1.92 0.22 2.4748 NS 75
Female 4.12 1.70 0.20 75
Table no: 4.2 Male X Female
Factor Group Mean SD SEM t level N
B Male 5.04 2.18 0.25 0.1826 NS 75
Female 5.11 2.29 0.26 75
Table no: 4.3 Male X Female
Factor Group Mean SD SEM t level N
C Male 4.49 1.98 0.23 1.7424 NS 75
Female 3.93 1.95 0.23 75
Table no: 4.4 Male X Female
Factor Group Mean SD SEM t level N
E Male 5.27 1.83 0.21 1.6570 NS 75
Female 5.81 2.20 0.25 75
Table no: 4.5 Male X Female
Factor Group Mean SD SEM t level N
F Male 5.45 1.92 0.22 0.4145 NS 75
Female 5.33 1.61 0.19 75
Table no: 4.6 Male X Female
Factor Group Mean SD SEM t level N
G Male 4.21 1.61 0.19 1.5870 NS 75
Female 3.79 1.68 0.19 75
Table no: 4.7 Male X Female
Factor Group Mean SD SEM t level N
H Male 4.91 1.89 0.22 4.0804 SIG
0.01
75
Female 3.75 1.58 0.18 75
Table no: 4.8 Male X Female
Factor Group Mean SD SEM t level N
I Male 4.85 1.93 0.22 2.5585 NS 75
Female 4.00 2.15 0.25 75
Table no: 4.9 Male X Female
Factor Group Mean SD SEM t level N
L Male 5.23 1.67 0.19 0.4933 NS 75
Female 5.37 1.96 0.23 75
Table no: 4.10 Male X Female
Factor Group Mean SD SEM t level N
M Male 4.85 2.37 0.27 0.6914 NS 75
Female 4.59 2.35 0.27 75
The International Journal of Indian Psychology: Volume: 01 | Issue: 04 | ISSN 2348-5396
© 2014 www.ijip.in July-September 2014 29 | P a g e
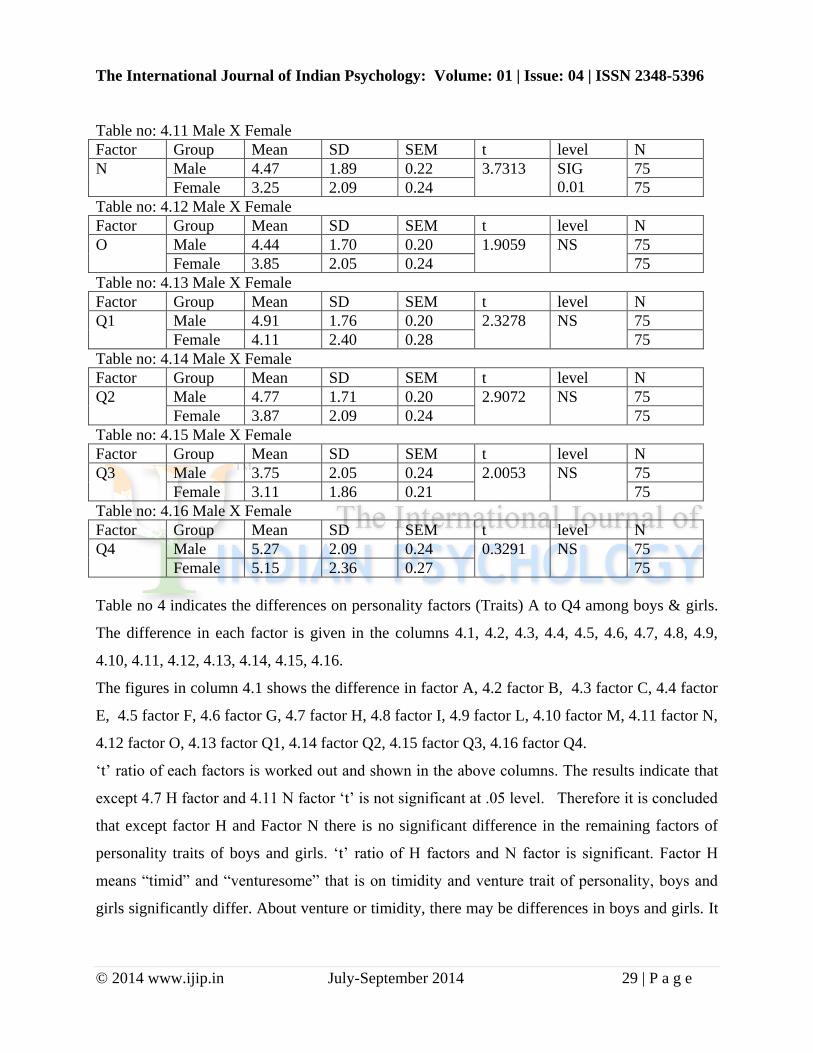
Table no: 4.11 Male X Female
Factor Group Mean SD SEM t level N
N Male 4.47 1.89 0.22 3.7313 SIG
0.01
75
Female 3.25 2.09 0.24 75
Table no: 4.12 Male X Female
Factor Group Mean SD SEM t level N
O Male 4.44 1.70 0.20 1.9059 NS 75
Female 3.85 2.05 0.24 75
Table no: 4.13 Male X Female
Factor Group Mean SD SEM t level N
Q1 Male 4.91 1.76 0.20 2.3278 NS 75
Female 4.11 2.40 0.28 75
Table no: 4.14 Male X Female
Factor Group Mean SD SEM t level N
Q2 Male 4.77 1.71 0.20 2.9072 NS 75
Female 3.87 2.09 0.24 75
Table no: 4.15 Male X Female
Factor Group Mean SD SEM t level N
Q3 Male 3.75 2.05 0.24 2.0053 NS 75
Female 3.11 1.86 0.21 75
Table no: 4.16 Male X Female
Factor Group Mean SD SEM t level N
Q4 Male 5.27 2.09 0.24 0.3291 NS 75
Female 5.15 2.36 0.27 75
Table no 4 indicates the differences on personality factors (Traits) A to Q4 among boys & girls.
The difference in each factor is given in the columns 4.1, 4.2, 4.3, 4.4, 4.5, 4.6, 4.7, 4.8, 4.9,
4.10, 4.11, 4.12, 4.13, 4.14, 4.15, 4.16.
The figures in column 4.1 shows the difference in factor A, 4.2 factor B, 4.3 factor C, 4.4 factor
E, 4.5 factor F, 4.6 factor G, 4.7 factor H, 4.8 factor I, 4.9 factor L, 4.10 factor M, 4.11 factor N,
4.12 factor O, 4.13 factor Q1, 4.14 factor Q2, 4.15 factor Q3, 4.16 factor Q4.
„t‟ ratio of each factors is worked out and shown in the above columns. The results indicate that
except 4.7 H factor and 4.11 N factor „t‟ is not significant at .05 level. Therefore it is concluded
that except factor H and Factor N there is no significant difference in the remaining factors of
personality traits of boys and girls. „t‟ ratio of H factors and N factor is significant. Factor H
means “timid” and “venturesome” that is on timidity and venture trait of personality, boys and
girls significantly differ. About venture or timidity, there may be differences in boys and girls. It
The International Journal of Indian Psychology: Volume: 01 | Issue: 04 | ISSN 2348-5396
© 2014 www.ijip.in July-September 2014 30 | P a g e
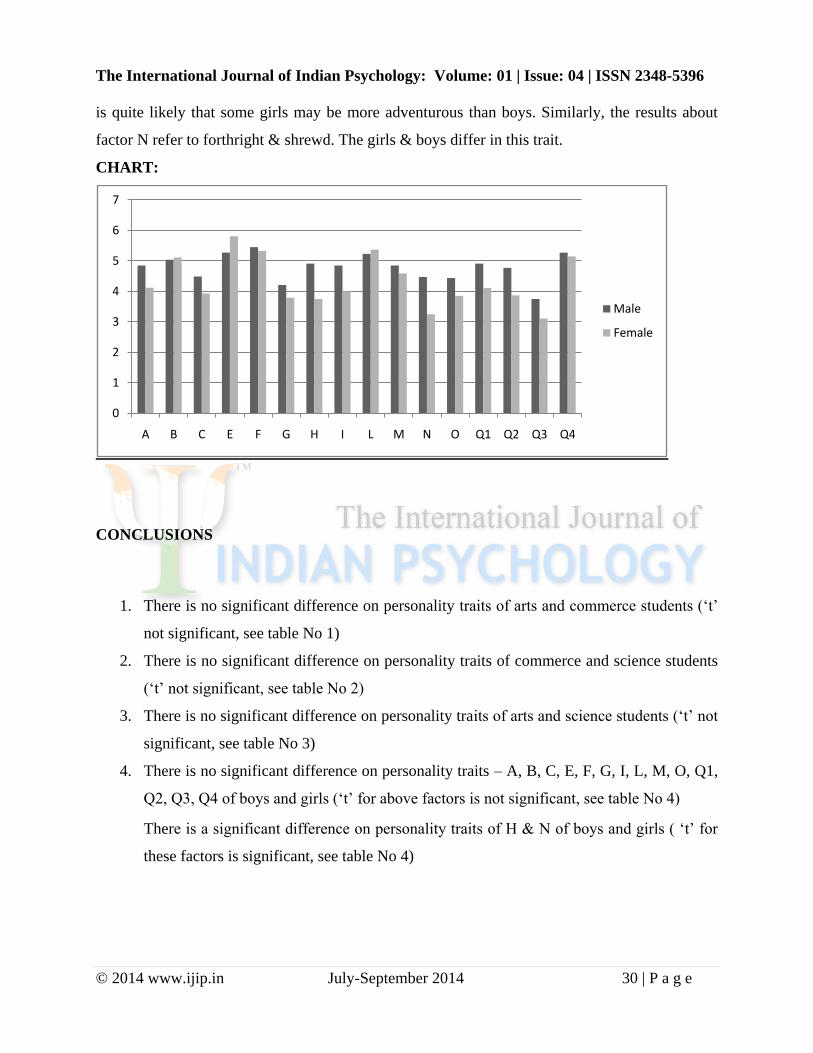
is quite likely that some girls may be more adventurous than boys. Similarly, the results about
factor N refer to forthright & shrewd. The girls & boys differ in this trait.
CHART:
CONCLUSIONS
1. There is no significant difference on personality traits of arts and commerce students („t‟
not significant, see table No 1)
2. There is no significant difference on personality traits of commerce and science students
(„t‟ not significant, see table No 2)
3. There is no significant difference on personality traits of arts and science students („t‟ not
significant, see table No 3)
4. There is no significant difference on personality traits – A, B, C, E, F, G, I, L, M, O, Q1,
Q2, Q3, Q4 of boys and girls („t‟ for above factors is not significant, see table No 4)
There is a significant difference on personality traits of H & N of boys and girls ( „t‟ for
these factors is significant, see table No 4)
0
1
2
3
4
5
6
7
A B C E F G H I L M N O Q1 Q2 Q3 Q4
Male
Female
The International Journal of Indian Psychology: Volume: 01 | Issue: 04 | ISSN 2348-5396
© 2014 www.ijip.in July-September 2014 31 | P a g e
SUGGESTIONS
1. A research project may be undertaken to compare personality traits of graduates and post
graduate students.
2. A similar study can be done with the student of engineering and medical students.
3. A similar study can be performed on international basis.
4. Personality traits can be measured by many other personality inventories
REFERENCES
1. A comparative study of personality traits among players of individual and team games of
universities of Gujarat (Using 16 PF) –Dr. H.M. Desai, Head of Physical education,
Gujarat University
2. A guide to the clinical use of 16 PF –Champaign
3. An introduction to the five factor model and its applications –Journals of personality 60
(2) page 175 -215
4. Brief introduction to Psychology – C.T. Morgan
5. Dimensions of personality –Eyesenk
6. Introduction to Psychology –Hilgard and Atikinson
7. Large scale cross validation of personality structure defined by 16 PF –Psychological
reports 59 (2) 683 – 693
8. Personality and culture revisited and Dimensions of culture –Geert Hofstely and others
9. Psychological testing –Anastasi
10. The 16 personality factor questionnaire ( 16 PF) –Cattle and Mead
11. The big five personality traits, learning styles and academic achievement–Ko marragu &
others
12. University students personality traits and entrepreneurial intentions –Su-chang chen &
others
The International Journal of Indian Psychology: Volume: 01 | Issue: 04 | ISSN 2348-5396
© 2014 www.ijip.in July-September 2014 32 | P a g e
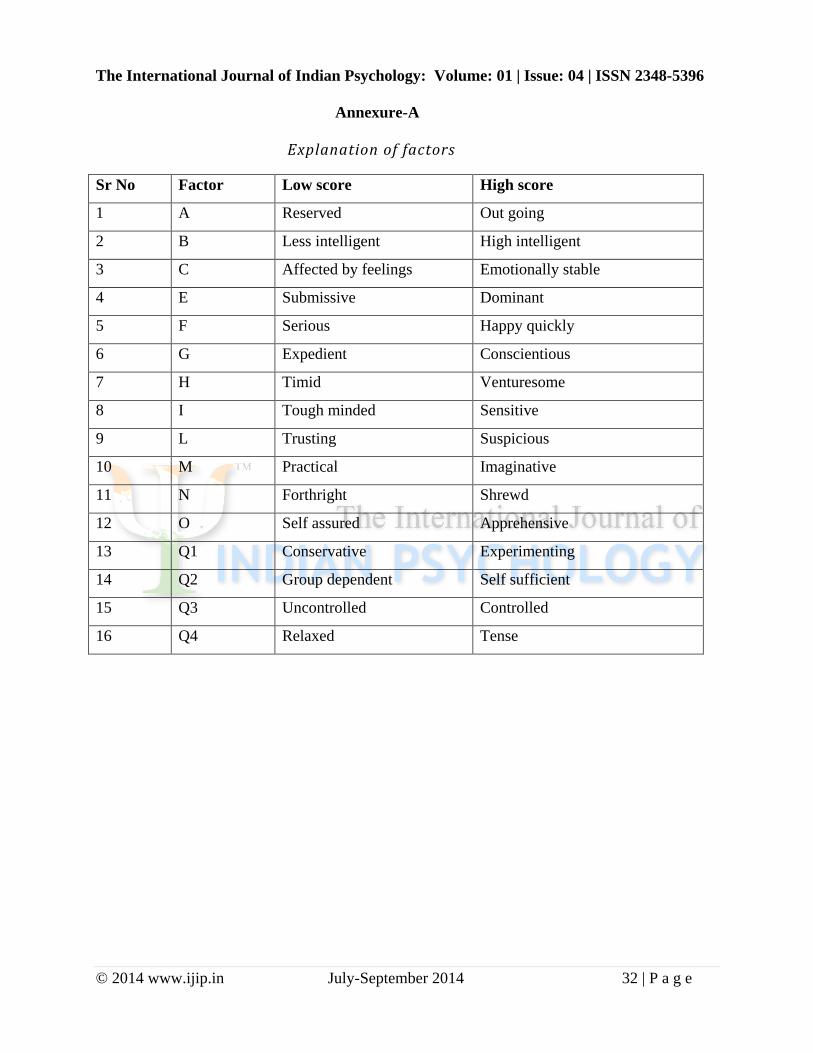
Annexure-A
Explanation of factors
Sr No Factor Low score High score
1 A Reserved Out going
2 B Less intelligent High intelligent
3 C Affected by feelings Emotionally stable
4 E Submissive Dominant
5 F Serious Happy quickly
6 G Expedient Conscientious
7 H Timid Venturesome
8 I Tough minded Sensitive
9 L Trusting Suspicious
10 M Practical Imaginative
11 N Forthright Shrewd
12 O Self assured Apprehensive
13 Q1 Conservative Experimenting
14 Q2 Group dependent Self sufficient
15 Q3 Uncontrolled Controlled
16 Q4 Relaxed Tense
Related Documents