The Effects of Rodents on Ground Dwelling Arthropods in the Waitakere Ranges A thesis submitted to the Auckland University of Technology in fulfilment of the Degree Master of Philosophy Peter A. King January 2007

Welcome message from author
This document is posted to help you gain knowledge. Please leave a comment to let me know what you think about it! Share it to your friends and learn new things together.
Transcript
The Effects of Rodents on Ground Dwelling Arthropods
in the Waitakere Ranges
A thesis submitted to the Auckland University of Technology
in fulfilment of the Degree
Master of Philosophy
Peter A. King
January 2007
2
TABLE OF CONTENTS
ATTESTATION …………………………….…………….…….………………….…....8
ACKNOWLEDGEMENTS………………………………………………………….……9
ABSTRACT ……………………...……………………….……….………….……....…11
1 INTRODUCTION.............................................................................................................. 13 1.1 GONDWANALAND ORIGINS OF NEW ZEALAND’S ARTHROPODS.............. 14 1.2 IMPACTS OF HUMAN COLONISATION............................................................... 17 1.3 ARTHROPODS IN THE DIETS OF INTRODUCED PREDATORS....................... 19 1.4 IMPACT OF INTRODUCED PREDATORS ON NATIVE VERTEBRATES ......... 22 1.5 EFFECTS OF PREDATORS ON NATIVE ARTHROPODS.................................... 24 1.5.1 Research on Offshore Islands .......................................................................24 1.5.2 Research on the Mainland ............................................................................29 1.6 IMPACT OF HABITAT STRUCTURE ON ARTHROPOD POPULATIONS......... 32 1.7 ARTHROPODS AS INDICATORS OF ENVIRONMENTAL CHANGE................ 33 1.8 SUMMARY ................................................................................................................ 35 1.9 AIMS OF THIS RESEARCH ..................................................................................... 36 2 METHODS ......................................................................................................................... 38 2.1 INTRODUCTION....................................................................................................... 38 2.2 SITE DESCRIPTIONS................................................................................................ 39 2.2.1 Treatment Sites............................................................................................42 2.2.2 Control Sites ...............................................................................................45 2.3 ASSESSMENT OF SITE CHARACTERISTICS....................................................... 48 2.3.1 Vegetation Parameters .................................................................................48 2.3.2 Physical Parameters .....................................................................................48 2.3.3 Ground Cover..............................................................................................49 2.4 WEATHER MEASUREMENTS................................................................................ 50 2.4.1 Temperature ................................................................................................50 2.4.2 Rainfall .......................................................................................................50 2.5 POSSUM AND RODENT CONTROL AT THE TREATMENT SITES (LTFERP). 50 2.6 RODENT MONITORING .......................................................................................... 51 2.6.1 Previous Research........................................................................................51 2.6.2 This Study...................................................................................................55 2.7 POSSUM CONTROL IN THE WAITAKERE RANGES.......................................... 55 2.8 POSSUM MONITORING .......................................................................................... 56 2.8.1 Previous Research........................................................................................56 2.8.2 This Study...................................................................................................56 2.9 ARTHROPOD MONITORING .................................................................................. 57 2.9.1 Pitfall Traps ................................................................................................61 2.9.2 Sampling Regime ........................................................................................64 2.10 STATISTICAL ANALYSIS OF DATA..................................................................... 66 2.10.1 Ground Cover..............................................................................................66 2.10.2 Rat Tracking ...............................................................................................66

3
2.10.3 Pitfall Trap Samples.....................................................................................67 3 RESULTS............................................................................................................................ 68 3.1 KANUKA FOREST.................................................................................................... 68 3.1.1 Study Site Physical Characteristics ...............................................................68 3.1.2 Vegetation Assessment ................................................................................68 3.1.3 Rodent Monitoring ......................................................................................70 3.1.4 Ground Weta...............................................................................................73 3.1.5 Cave Weta...................................................................................................78 3.1.6 Carabid Beetles ...........................................................................................82 3.1.7 Prowling Spiders .........................................................................................87 3.1.8 Kanuka Forest Results Summary ..................................................................91 3.2 PODOCARP-BROADLEAF FOREST....................................................................... 95 3.2.1 Study Site Physical Characteristics ...............................................................95 3.2.2 Vegetation Monitoring .................................................................................95 3.2.3 Rodent Monitoring ......................................................................................97 3.2.4 Ground Weta...............................................................................................99 3.2.5 Cave Weta...................................................................................................99 3.2.6 Carabid Beetles .........................................................................................101 3.2.7 Prowling Spiders .......................................................................................103 3.2.8 Podocarp-Broadleaf Results Summary ........................................................105 3.3 TARAIRE FOREST.................................................................................................. 107 3.3.1 Study Site Physical Characteristics .............................................................107 3.3.2 Vegetation Assessment ..............................................................................107 3.3.3 Rodent Monitoring ....................................................................................109 3.3.4 Ground Weta.............................................................................................112 3.3.5 Cave Weta.................................................................................................112 3.3.6 Carabid Beetles .........................................................................................114 3.3.7 Prowling Spiders .......................................................................................117 3.3.8 Taraire Results Summary ...........................................................................119 3.4 OVERVIEW OF ARTHROPOD ABUNDANCE AT TREATMENT SITES ......... 121 3.5 POSSUM MONITORING ........................................................................................ 122 3.5.1 At the LTFERP .........................................................................................122 3.5.2 At the Control Sites ...................................................................................123 3.5.3 Possum Footprints on Rodent Tracking Cards used in 2005–06 at the Control Sites ...123 3.6 WEATHER MONITORING..................................................................................... 124 3.6.1 Rainfall Data .............................................................................................124 3.6.2 Temperature Data ......................................................................................124 4 DISCUSSION ................................................................................................................... 126 4.1 INTRODUCTION..................................................................................................... 126 4.2 RODENT MONITORING ........................................................................................ 127 4.3 IMPACT OF RODENTS ON ARTHROPODS ........................................................ 130 4.3.1 On Ground Weta .......................................................................................130 4.3.2 On Cave Weta ...........................................................................................132 4.3.3 On Carabid Beetles ....................................................................................133 4.3.4 On Prowling Spiders ..................................................................................135
4
4.4 ARTHROPODS IN TARAIRE FOREST ................................................................. 136 4.4.1 The Impact of Rodents on Arthropods.........................................................136 4.4.2 The Influence of Site Aspect on Arthropods ................................................137 4.4.3 The Influence of Habitat Diversity on Arthropods........................................137 4.4.4 The Influence of Soil Depth on Arthropods .................................................138 4.5 THE EFFECTS OF OTHER PREDATORS ON ARTHROPODS........................... 139 4.5.1 Possums....................................................................................................139 4.5.2 Stoats, Hedgehogs, Weasels, Ferrets and Cats..............................................140 4.5.3 Morepork ..................................................................................................144 4.5.4 Introduced Wasps ......................................................................................145 4.6 RODENTS SIZE CLASS SELECTION OF ARTHROPOD PREY......................... 146 4.7 ARTHROPODS AS INDICATORS OF RODENT CONTROL .............................. 150 5 CONCLUSIONS .............................................................................................................. 155 5.1 SUMMARY OF FINDINGS..................................................................................... 155 5.2 LIMITATIONS OF THIS STUDY ........................................................................... 156 5.3 APPLICATIONS OF THIS STUDY ........................................................................ 157 5.3.1 Recommendations for Further Research ......................................................157 5.3.2 Practical Applications of this Research........................................................158
REFERENCES……………………………………………………………………………..…160
APPENDIX………………………………………………………………………………...…..177

5
LIST OF FIGURES
Figure 2-1 Location of Waitakere Ranges in the North Island of New Zealand. ......................... 39 Figure 2-2 Location of the LTFERP at Karekare.......................................................................... 40 Figure 2-3 Study sites in the Waitakere Ranges. .......................................................................... 41 Figure 2-4 Diagram of pitfall trap in situ. ..................................................................................... 63 Figure 3-1 Rat tracking indices in kanuka during 2005–06 by site (+/- SE). ............................... 71 Figure 3-2 Mice tracking indices in kanuka during 2005–06 by site (+/- SE).............................. 73 Figure 3-3 Mean abundance of ground weta in kanuka during 2004–2005 (+/- SE).................... 75 Figure 3-4 Mean abundance of ground weta in kanuka during 2005–2006 (+/- SE).................... 75 Figure 3-5 Mean cave weta abundance in kanuka during 2004–05 by site (+/- SE). ................... 79 Figure 3-6 Mean cave weta abundance in kanuka during 2005–06 by site (+/- SE). .................. 80 Figure 3-7 Mean carabid abundance in kanuka during 2004–05 (+/- SE). ................................... 84 Figure 3-8 Mean carabid abundance in kanuka during 2005–2006 (+/- SE). .............................. 84 Figure 3-9 Mean prowling spider abundance in kanuka during 2004–2005 (+/-SE).................... 88 Figure 3-10 Mean prowling spider abundance in kanuka during 2005–2006 (+/- SE)................. 89 Figure 3-11 Mean rat tracking indices in podocarp-broadleaf during 2005–06 by site (+/- SE). . 98 Figure 3-12 Mean cave weta abundance in podocarp-broadleaf during 2005–06 (+/- SE). ....... 100 Figure 3-13 Mean carabid abundance in podocarp-broadleaf during 2005–2006 (+/- SE). ....... 102 Figure 3-14 Mean prowling spider abundance in podocarp-broadleaf during 2005–06 (+/-SE).104 Figure 3-15 Mean rat tracking indices in taraire during 2005–2006 (+/- SE)............................. 111 Figure 3-16 Mean cave weta abundance in taraire during 2005–2006 (+/- SE). ........................ 113 Figure 3-17 Mean carabid abundance in taraire during 2005–2006 (+/- SE). ............................ 115 Figure 3-18 Mean prowling spider abundance in taraire during 2005–2006 (+/- SE). ............... 118 Figure 3-19 Mean minimum monthly temperatures (°C) at La Trobe Tack (+/- SE). ................ 125
6
LISTOF TABLES Table 2-1 Arthropod by size classes. ............................................................................................ 66 Table 3-1 Comparison of site characteristics in kanuka. .............................................................. 68 Table 3-2 Proportions of ground cover in kanuka by site. ............................................................ 69 Table 3-3 Numbers of plant species in the different height tiers by site....................................... 69 Table 3-4 Rat tracking indices at kanuka treatment site from 2002–2006.................................... 70 Table 3-5 Rat tracking indices in kanuka during 2005–06 by site................................................ 71 Table 3-6 Mice tracking indices at the kanuka treatment site by year. ......................................... 72 Table 3-7 Mice tracking indices in kanuka during 2005–2006 by site. ........................................ 72 Table 3-8 Ground weta mean size class proportions in kanuka during 2004–05 by site. ............. 76 Table 3-9 Ground weta mean size class proportions in kanuka during 2005–06 by site. ............. 77 Table 3-10 Ground weta size class proportions in kanuka control site 1 by sampling season. .... 77 Table 3-11 Ground weta size class proportions in the kanuka treatment site by sampling season.
.............................................................................................................................................. 78 Table 3-12 Cave weta size class proportions in kanuka by site. ................................................... 81 Table 3-13 Cave weta size class proportions in kanuka treatment by sampling season. .............. 81 Table 3-14 Cave weta size class proportions in kanuka control site 1 by sampling season. ........ 81 Table 3-15 Cave weta size class proportions in kanuka by site. ................................................... 82 Table 3-16 Carabid beetle size class proportions in kanuka treatment by sampling season......... 85 Table 3-17 Carabid beetle size class proportions in kanuka control 1 by sampling season.......... 86 Table 3-18 Carabid beetle size class proportions in kanuka during 2004–05 by site. .................. 86 Table 3-19 Carabid size class proportions in kanuka during 2005–06 by site.............................. 87 Table 3-20 Prowling spider size class proportions in kanuka during 2004–05 by site. ................ 89 Table 3-21 Prowling spider size class proportions in kanuka treatment site by sampling season.90 Table 3-22 Prowling spider size class proportions in kanuka control site 1 by sampling season. 90 Table 3-23 Prowling spider size class proportions in kanuka during 2005–06 by site. ................ 91 Table 3-24 Comparison of site characteristics at podocarp-broadleaf. ......................................... 95 Table 3-25 Proportion of ground cover in podocarp-broadleaf by site......................................... 96 Table 3-26 Number of plant species in different height tiers in podocarp-broadleaf by site........ 96 Table 3-27 Rat tracking indices in podocarp-broadleaf during 2005–06...................................... 97 Table 3-28 Mice tracking indices in podocarp-broadleaf during 2005–06................................... 99 Table 3-29 Cave weta size class proportions in podocarp-broadleaf during 2005-06 by site..... 101 Table 3-30 Carabid beetle size class proportions in podocarp-broadleaf during 2005–06 by site.
............................................................................................................................................ 103 Table 3-31 Prowling spider size class proportions in podocarp-broadleaf during 2005–06 by site.
............................................................................................................................................ 104 Table 3-32 Comparison of site characteristics in taraire............................................................. 107 Table 3-33 Proportion of ground cover categories in taraire by site........................................... 108 Table 3-34 Number of plant species in different height tiers in taraire by site........................... 109 Table 3-35 Rat tracking indices in taraire by year. ..................................................................... 110 Table 3-36 Rat tracking indices in taraire during 2005–06 by site. ............................................ 110 Table 3-37 Mice tracking indices of in taraire during 2005–06 by site. ..................................... 112 Table 3-38 Cave weta size class proportions in taraire 2005–06 by site. ................................... 114 Table 3-39 Carabid beetle size class proportions in taraire during 2005–06 by site................... 116 Table 3-40 Prowling spider size class proportions in taraire during 2005–06 by site. ............... 119 Table 3-41 Tracking cards with possum footprints (%) at taraire control site 2 during 2005–06.
............................................................................................................................................ 123 Table 3-42 Monthly rainfall data (mm) at La Trobe Track by year. (The
historical average was calculated from data collected monthly since 1995)...................... 124

7
LIST OF PLATES
Plate 2-1 Understorey of podocarp-broadleaf forest in the Company Stream valley, LTFERP, with dense kiekie growth and supplejack vines........................................................... 43
Plate 2-2 Understorey plants in mature kanuka forest. ................................................................. 44 Plate 2-3 Mature taraire forest in the LTFERP, showing the thick layer of leaf litter. ................. 45 Plate 2-4 Black trakka ™ tracking tunnel containing card for rodent monitoring........................ 52 Plate 2-5 Monitoring cards showing footprints of rat (top), mice (middle) and possum (bottom).
Scale life size............................................................................................................... 54 Plate 2-6 Ground weta, Hemiandrus sp. 22 mm body length. ...................................................... 58 Plate 2-7 Auckland cave weta, Gymnoplectron acanthocera, 25 mm average body length......... 59 Plate 2-8 Carabid beetle, Mecodema spiniferum, 30 mm body length. ........................................ 60 Plate 2-9 Prowling spider, Uliodon sp. 25 mm body length. ........................................................ 61

8
ATTESTATION OF AUTHORSHIP
“I hereby declare that this submission is my own work and that, to the best of my
knowledge and belief, it contains no material previously published or written by another
person nor material which to a substantial extent has been accepted for the award of any
other degree or diploma of a university or other institution of higher learning, except
where due acknowledgement is made in the acknowledgements.”
Peter A. King

9
ACKNOWLEDGEMENTS First I would like to thank my supervisor Dr. Steve Cook, AUT, who steered me through
this project, offering me advice and guidance throughout. Also thanks must go to Dave
Bryant, AUT, for the help with field work, especially the identification of plants, and the
encouragement to begin this thesis. Next thanks must go to Stuart Young, AUT Statistics
Advisory Service, for advice and help in the analysis of results.
I am grateful to Dr. Graham Ussher, heritage scientist at the Auckland Regional Council,
for providing maps for this thesis and supplying technical advice throughout this project,
and who also took the time to discuss the results section of this thesis. Also I would like
to thank Dr. Chris Green, entomologist at the Auckland Conservancy of the Department
of Conservation, for the time that he took to discuss my results with me and also for the
helpful information about the biology of the arthropods used in this study. Thanks also
to Dr. Peter Maddison, for the help he gave in identifying some of the arthropods
collected in the pitfall traps used in this research, and for constructive comments about
the results collected for this thesis.
I am grateful to the following people at the Auckland Regional Council: Jack Craw,
Biosecurity Manager, for supplying the brodifacoum bait used to control rats and
possums, Dave Galloway, Biosecurity Northern, for supplying the possum monitoring
data for the Waitakere Ranges and Greg Hoskins, Biosecurity officer, for helping with
wasp identification.

10
I am indebted to Warren Agnew for supplying tracking cards at no cost. Thanks also to
my neighbour, Peter Moore, for solving computer problems.
Final thanks must go to my family: my daughters Helen, who typed up my references,
and Laura, who helped with the statistical analysis of data. The largest thank you must go
to my wife, Jean, who patiently dealt with things that went wrong, did the formatting of
the thesis document and spent many hours proofreading what I had written. And to my
constant companion, my Springer spaniel, Lily, who has walked the many kilometres of
rugged, muddy tracks to watch me fill bait stations, set up and empty pitfall traps and
never questioned the rationale, my grateful thanks.
11
ABSTRACT
The abundance and size classes of ground weta, cave weta, carabid beetles and prowling
spiders were monitored in the La Trobe Forest Ecosystem Restoration Project, Karekare,
West Auckland, where rodent populations had been reduced. These were compared with
those in control sites, where the rodent populations had not been manipulated. The
arthropods were sampled using pitfall traps set in young podocarp-broadleaf, mature
kanuka and mature taraire forested sites, and each treatment site was matched with two
control sites. Data was collected monthly from all nine sites from December to May,
2005–06. In kanuka forest, data collected during December to May, 2004–05 has also
been used.
Rodent populations and possum populations were monitored during the course of the
study. Tracking tunnel indices indicated that rat numbers were lower in the treatment
sites than the control sites during 2005–06, and that rats were low in abundance at the
treatment sites, apart from the occasional spike in numbers, in the three years prior to the
start of this research. Mice tracking indices were relatively high at some specific sites,
mainly in spring and autumn. Evidence indicated that possum abundance was low in both
the treatment and the control sites.
Ground weta were more abundant at the kanuka treatment site than the control sites in
2005–06, but were rarely found in the podocarp-broadleaf and taraire forest types.
Carabid beetles were trapped in greater numbers in podocarp-broadleaf and kanuka forest

12
treatment sites in 2005–06, than in their respective control sites, and an increase in
carabid beetle abundance was recorded between the 2004–05 and 2005–06 sampling
seasons at the kanuka treatment site. Prowling spiders were more abundant at the
podocarp-broadleaf treatment than at the control sites. Cave weta abundance at the
podocarp-broadleaf and kanuka treatment sites was similar to their respective control
sites. The arthropod abundance data from the taraire forest sites was confounded by
many differences between the treatment and the control sites, which may have masked
any effects caused by the suppression of rodent numbers at the treatment site.
Ground weta and cave weta in the larger size classes appeared to be selectively preyed
upon by predators, however, it was unclear whether rodents were entirely responsible
because stoats and cats are also known to target larger arthropod prey, and their presence
was not monitored.
Ground weta in kanuka forest, carabid beetles in kanuka and podocarp-broadleaf forest
and prowling spiders in podocarp-broadleaf forest are identified as potential indicators
for monitoring the effects of rodent control in the Waitakere Ranges.
This study was limited by a lack of knowledge of life histories and basic ecology of the
arthropods. Further research at these sites is required to establish the long term
population patterns of the arthropods.
13
1 INTRODUCTION Arthropods are regarded as the most diverse component of terrestrial ecosystems,
occupying a wide variety of niches (Kremen, Colwill, Erwin, Murphy, Noss &
Sanjayan, 1993). Two out of three of all organisms are arthropods, and they are found
in most habitats in the biosphere (Campbell & Reece 2002). It has been suggested
that New Zealand has approximately 80,000 species of invertebrates, compared to
350 terrestrial bird species, and 2,000 endemic vascular plant species (McGuinness,
2001). Some endemic invertebrates are endangered. Twenty percent of New
Zealand’s flora is considered to be threatened, and if the same percentage of endemic
invertebrates is threatened, then there could be 16,000 threatened invertebrate species.
Phylum Arthropoda consists of the insects (class Insecta), the crustaceans (class
Crustacea), the millipedes (class Diplopoda), the centipedes (class Chilopoda), and
the spiders (class Arachnida), (Campbell & Reece, 2002). Arthropods in general also
provide the most biomass and numbers in any ecosystem (Wilson, 1985), and have
many vital roles. They are involved in nutrient cycling, pollination, seed dispersal,
decomposition, predator-prey relationships and soil formation (Cone, Gordon,
Frampton, Keesing, Miskell & McFarlane, 2001; Wilson, 1985). Wilson (1987)
describes arthropods as “the little things that run the world”. If arthropods are being
negatively impacted by introduced mammals, then many ecological processes may be
disrupted.
14
1.1 GONDWANALAND ORIGINS OF NEW ZEALAND’S ARTHROPODS
New Zealand split from the supercontinent Gondwanaland about 80 million years ago
(Young, 2004), and because of this long period of isolation, New Zealand’s biota has
a high degree of endemism. Ninety percent of New Zealand’s arthropods are endemic
and 100% of reptiles and amphibians (ibid.). Mammals evolved around the world
after New Zealand split from Gondwanaland, and in some regions large herbivorous
mammals and their predators became common (King, 2005). In New Zealand, large
flightless birds and their avian predators, e.g. eagles and hawks, occupied comparable
niches, whilst the niches held overseas by rodents and lagomorphs, i.e. rabbits and
hares, were filled in New Zealand by large flightless insects (ibid.).
Mammals such as mustelids, cats and rodents were introduced into New Zealand
without their predators. The absence of the top predators of these introduced
mammals has lead to what is described as ‘mesopredator’ release (Terborgh, 2000).
This causes a large increase in the numbers of small carnivores (cats, mustelids and
rodents), which are the major predators of birds, other vertebrates, and some
invertebrates (Crooks & Soule, 1999). ‘Mesopredator’ release has lead to a rapid
decrease in prey diversity and abundance on islands. For example, lizards introduced
onto a small island caused a large reduction in spider diversity and abundance
(Schoener & Spiller, 1996).
Introduced mammals may have had some significant effects on food webs in the
forests that they colonized. Innes & Barker (1999) developed models to explore some
possible outcomes of pest control at the community level. Their model demonstrated

15
that if possums and rodents were nearly eradicated from podocarp-hardwood forest
the number of trophic interactions declined by one third, because possums and
rodents are omnivorous. More food was available for up to 70% of the other links in
the food web (Innes & Barker, 1999). However, their model also predicted that
predators that formerly ate possums and rodents would now need to eat more other
prey. Prey-switching by mustelids, from rodents to birds and arthropods has already
been verified (Murphy & Robbins et al., 1999; Rickard, 1996).
The presence of mesopredators such as rodents and mustelids in forest communities
may have other non-trophic effects. For example, the decline of the parasitic New
Zealand mistletoe (Peraxilla spp.) may be due to the shortage of pollinating birds
such as the tui (Prosthemadera novaeseelandiae) and the bellbird (Anthornis
melanura), which may be predated by mustelids, rodents, possums and cats (Ladley,
Kelly, Robertson, 1997).
Trends in New Zealand terrestrial arthropods towards gigantism, ground dwelling,
extended lifecycles, low rates of reproduction, along with the high rates of endemism,
are factors that made many of New Zealand species vulnerable to predation by
introduced mammals (Daugherty, Gibbs & Hitchmough, 1993; Diamond, 1990).
Many New Zealand endemic insects communicate using pheromones, which makes
them easy to locate by predators with a good sense of smell (McGuiness, 2001).
Large-bodied arthropods, such as the wetapunga (Deinacrida sp.), would find it hard
to locate secure refuges and would be attractive prey, because of their high energy
content and the low energy investment needed to catch them (Gibbs, 1998). These
features, plus a nomadic lifestyle have probably contributed to the loss of D. rugosa

16
and D. heteracantha from all but rat free habitats (Gibbs, 1998). In contrast, tree weta
(Hemideina spp.), have behavioural adaptations that allowed them to survive in the
presence of small mammal predators such as rodents and mustelids. For example they
live in tree galleries with small external diameters, secure from mammal predators,
during the day, and furthermore exhibit some predator avoidance behaviours (Gibbs,
1998). Cave weta, also demonstrate avoidance behaviour in the presence of
mammalian predators, which may enhance their survival chances (Powlesland,
Stringer, Hedderley, 2005)
Some carabid beetles, for example Mecodema oconnori, Megadromus turgidiceps
and Plocamostethus planiusculus carry a small number of eggs (Hutchison, 2007).
This low egg load may be an indication of low fecundity, which would make
arthropods with these features vulnerable to predation by mammals.
In this chapter the impacts of human colonisation on New Zealand’s unique biota will
be discussed, but the main focus will be to assess how destructive introduced
predators have been on the abundance and faunal diversity of native arthropod
populations in native forests, both on the mainland of New Zealand and offshore
islands. The strong evidence that introduced mammals have had a negative impact on
New Zealand’s native vertebrate populations will be discussed in contrast to the
paucity of evidence that introduced mammals have had a similar effect on native
arthropod populations. The use of native arthropods as indicators of habitat change
will also be discussed.

17
1.2 IMPACTS OF HUMAN COLONISATION Human colonisation of New Zealand over the past 1000 years has resulted in the
exploitation of forests, habitat loss and fragmentation, and together with the
introduction of alien species, especially mammals, has devastated the country’s
biodiversity (Department of Conservation, 2000; Ministry for the Environment,
1997).
Approximately 85% of New Zealand was forested when the Maori arrived about 1000
years ago and as much as one third of this was destroyed before European settlers
arrived in the 19th century (Atkinson & Cameron, 1993; King, 2005; Ministry for the
Environment, 1997). Many bird species were hunted to extinction, including all moa
species which were unique to New Zealand, and 18 species of water fowl and rail. In
fact, 25% of endemic land bird species become extinct, in this period of Maori
occupation of New Zealand (Ministry for the Environment, 1997). The first of the
invasive mammals, the kiore (Rattus exulans), that are thought to have devastated
native biota, was introduced by Maori. Indigenous predators of arthropods such as the
tomtit (Petroica macrocephala) and tuatara (Sphenodon punctatus) hunt by sight and
touch, (Field, 2001; McGuiness, 2001) and the main defense mechanism of their prey
was to remain still. This behaviour was of little use as a defense against introduced
mammals, such as the kiore, which rely on scent to locate their prey, are nocturnal
and are very persistent hunters (King, 2005).
The next colonists, the Europeans, increased the speed of environmental
modification. In less than 200 years since their arrival, native forest has been reduced

18
to just 23% of the land it originally occupied (Atkinson & Cameron, 1993) and 54
mammal species have been introduced (King, 2005). Fifty two percent of native
forest has been converted to grassland, compared to the world average of 37%
(Ministry for the Environment, 1997). By the time the Europeans arrived, large native
herbivores such as the moa had already become extinct, and in their place complete
communities of invasive organisms were introduced, including animals, plant crops
and their parasites and diseases (King, 2005). The loss of forest habitat and the
introduction of alien organisms have put native ecosystems under serious pressure in
a short period of time.
Over geological time New Zealand’s present biota has withstood large environmental
changes such as climate change, mountain building, glaciation, and volcanism
(McGuinness, 2001). However, native faunal and floral communities have been
unable to cope with the rapid rate of change that has occurred since the Maori and
European colonisation of New Zealand. Forty percent of terrestrial native bird species
have been lost, and 40% of the remaining bird species are classified as threatened
(Department of Conservation, 2000). In addition, many endemic reptile, arthropod
and plant species are threatened (Department of Conservation, 2000). Despite the
ever increasing land area allocated to reserves, Clout (2001) argues, that having more
than 30% of New Zealand’s land area in reserves will not protect threatened plants
and animals, because the main threats are invasive species such as rodents, possums
and mustelids. This is perhaps evidenced by the fact that extinctions have continued.
For example, the bush wren (Xenicus longipes), a bird with poor reproductive
capacity and a limited ability for dispersal, disappeared from the isolated Great South
Cape Islands (south of Stewart Island) soon after they were invaded by rats in 1962

19
(Towns & Broome, 2003). The North Island piopio (Turnagra capensis) also became
extinct after the ship rat (Rattus rattus) was introduced in 1860 (Dowding & Murphy,
1994).
1.3 ARTHROPODS IN THE DIETS OF INTRODUCED PREDATORS
It is well established that arthropods constitute a significant proportion of ship rat
diets. Most New Zealand studies have found that, of the arthropods, ship rats mainly
consume weta, beetles and spiders, though their diet was dependent on the season,
with arthropods largely eaten in spring and summer, whilst plant material was eaten
in winter (Best, 1969; Clout, 1980; Craddock, 1997; Innes, 2005; Miller & Miller,
1995). In addition, in his study in taraire forest, Craddock (1997) found that rats
consumed a variety of sizes of arthropods, but especially those greater than 12 mm in
length. He also suggested that rats may select some prey in quantities
disproportionate to their abundance in their environment, for instance weta.
A number of workers have investigated the diet of the house mouse (Mus musculus)
in New Zealand forests. The consensus is that mice are omnivores and those
arthropods such as butterflies, moths, beetles, weta and spiders form an important part
of their diet (Baden, 1986; Fitzgerald, 2001; Jones & Toft, 2006; Ruscoe & Murphy,
2005). Ruscoe and Murphy (2005) reported that in a long term study in the
Orongorongo Valley, arthropods were found to be important in the diet of mice
during spring and summer. Mice also exhibit some size selection of their prey. For
example, Craddock (1997) found that mice commonly ate arthropods in the 3–12 mm

20
length range although a wider range was available. He also found that mice consumed
a disproportionate number of caterpillars, spiders and cockroaches, compared to their
abundance.
Whilst ship rats and mice are known to consume large quantities of arthropods, other
introduced mammals also include arthropods in their diet. Cowan (2005) describes
the brush-tailed possum (Trichosorus vulpecula) as an opportunistic herbivore, eating
most plant parts, but when the opportunity presents itself, consuming other items
including arthropods. Cowan and Moeed (1987) reported that possums ate arthropods
mainly during the summer and autumn in the Orongorongo Valley, but that
arthropods only formed a small proportion of their diet.
Mustelids (stoats, weasels and ferrets) are small active carnivores that were
introduced to New Zealand to control introduced rabbits. Stoats are mammals with a
high metabolic rate, and it is more energy efficient to hunt larger prey such as rodents
to satisfy their energy needs (King, 2005). King and Murphy (2005) report that stoats
(Mustela erminea) eat mainly large prey, such as birds, mice, rabbits, hares, rats and
possums, but some insects do appear in their diet, mainly large-bodied weta species.
However, stoats do target arthropods at the times of the year when rodents are scarce
(Purdey & King, 2004; Rickard, 1996). Rickard (1996) found that arthropods formed
a large proportion of the diet of stoats, but this was at a time of the year when rat
abundance was low in the podocarp forest where his study was located.
Two other mustelids occur in New Zealand forests, but their effect on arthropod
numbers, whilst unknown, is likely to be small. Weasels (Mustela nivalis) occur in

21
New Zealand forests in very small numbers (King, 2005), and stomach content
analysis of weasels from Pureora, Mapara and Kaharoa Forests did reveal an insect
component in their diet (ibid.). Ferrets (Mustela furo), are mainly found in
pastureland and forest margins, and studies indicate that arthropods (mainly weta,
beetles and spiders) only form a minor component of their diet (Clapperton & Byron,
2005).
Two other introduced mammalian predators are present in New Zealand forests, one
is the feral cat (Felis catus). However arthropods form only a small proportion of
their diet (Gillies & Fitzgerald, 2005). The other is the European hedgehog
(Erinaceus europaeus), a nocturnal insectivore, that feeds on beetles, weta and
millipedes (Berry, 1999; Jones, Moss & Sanders, 2005). While research into their
dietary preferences suggests that hedgehogs could be significant predators of
arthropods in New Zealand forests, the few studies investigating their population
densities in forest habitats found them in very low numbers (Hendra, 1999; Jones &
Toft, 2006).
Another introduced group of animals must be added to the list of arthropod predators
and its impact may yet prove to be as significant as that of introduced mammals.
Social wasps of the genus Vespula, represented in New Zealand by two species, have
been shown to have an effect on arthropod populations. In ecosystems where there is
an abundant carbohydrate source, e.g. in beech forests (Beggs, 2001), wasp numbers
can sometimes reach epidemic proportions. Toft and Rees (1998) showed that the
predation rate by wasps on orb web spiders (Eriophora pustulosa) was so high that
the probability of an individual surviving a season was nil. Moreover, they contend

22
that the arthropod taxa most vulnerable to wasp predation may have already been
eliminated from beech forest ecosystems in the 40 years since wasps have been
present.
1.4 IMPACT OF INTRODUCED PREDATORS ON NATIVE VERTEBRATES
There has been a lot of focus on the impact of introduced mammals on native
vertebrate populations. Holdaway (1989) described a vast avifaunal diversity prior to
human settlement in New Zealand, and contends that some small flightless birds that
lived and nested on the ground would have been particularly vulnerable to predation
by kiore. He describes a “rat blitzkrieg advancing across the landscape turning
everything edible into rat protein” (ibid.).
Birds, in particular, have benefited in ecosystems where invasive pests such as
possums, ship rats and stoats have been maintained at low levels. James and Clout
(1996) demonstrated that when poison baits were used at Wenderholm (North
Auckland) to suppress ship rats to low levels, kereru (Hemiphaga novaezealandia)
breeding success dramatically improved. In the 1991–92 breeding season, when baits
were used, young pigeons were fledged at 5 of the 11 nests observed. In the preceding
summers no pigeons fledged from the 27 nests observed. Similar results were
obtained by Innes, Nugent, Prime and Spurr (2004) at Motatau (North Auckland),
where tracking indices of ship rats and possums were maintained below 4%. Innes,
Nugent et al. (2004) also used video cameras to capture direct evidence of nest
predation by ship rats and possums. In a separate study, kokako populations
23
(Callaeus cinerea wilsoni) responded in a similar manner to suppression of possum
and ship rat numbers to very low levels. Innes, Brown, Jansen, Shorten and Williams
(1996) reported that at Rotoehu (Bay of Plenty), in the absence of predator control,
83% of nesting attempts failed, whereas on Hauturu (Little Barrier Island) where
possums and ship rats are absent, juvenile survival was high. Video evidence again
implicated ship rats and possums as nest predators at Rotoehu.
Recent research has demonstrated that the native Hochstetter’s frog (Leiopelma
hochstetteri) has also benefited from intensive predator control. Relative densities of
frogs in the Hunua Kokako Management Area (KMA), where introduced mammal
predators are maintained at low levels, are from 4 to10 times higher than an adjacent
unmanaged area (Mussett, 2005; G. Ussher pers. comm.). Moreover, in the KMA, the
frog population age structure indicated that recruitment of young frogs was
successful, in contrast to the non-management area (Mussett, 2005).
Increases in the abundance of lizards have been reported after kiore elimination from
some sites. Towns (1994) reported thirty fold increases in the numbers of five species
of resident lizards five years after kiore were removed from Korapuki (Mercury
Islands). The numbers of the rare Whitaker’s skink (Cyclodena whitakeri) transferred
onto Korapuki Island, after kiore eradication, had also increased after five years.
Towns contends that these increases demonstrate that predation, rather than habitat
deficiencies was responsible for the previously depleted lizard populations on the
island.
Similarly, Gorman (1996), after surveying the lizard populations on Kapiti Island,
concluded that the lizard fauna was depauperate for an island the size of Kapiti and

24
proposed that rats were responsible. Towns (2002) concluded that seven species of
gecko and ten species of skink have probably increased in abundance due to the
eradication of rats from islands.
1.5 EFFECTS OF PREDATORS ON NATIVE ARTHROPODS
Consistent evidence that arthropods have benefited from the control of introduced
mammals in New Zealand has been difficult to obtain.
1.5.1 Research on Offshore Islands
Towns and Broome (2003) suggested that the evidence that kiore affect populations
of arthropods on islands is circumstantial, and is based mainly on comparing islands
with and without kiore, and by examining the fossil record. These lines of evidence
indicate that kiore were responsible for the extinction of large flightless arthropods,
such as the darkling beetle (Mimopeus elongatus), from Korapuki Island (ibid.).
Investigations into the response of arthropods to the removal of kiore from islands
indicate that ground weta (Hemiandrus sp.), and other flightless arthropods, have
been suppressed by the predators presence (Green, 2000). However, rat removal may
also effect forest regeneration, for example when kiore are present on an island, they
may compete with kereru (Hemiphaga novaeseelandiae) for large fruit. The reduction
in the amount of available fruit may result in fewer pigeon visits to the trees, and
consequently less seed spread. On islands from which kiore have been removed forest
structure is reportedly changing, e.g. in terms of seedling abundance, depth of leaf

25
litter and soil moisture, and these changes, as well as the removal of kiore predation
pressure, may also affect the arthropod communities (Towns & Broome, 2003).
The successful release of the large flightless Mahoenui weta (Deinacrida mahoenui)
onto Breaksea Island, the tree weta (Hemideina) onto Korapuki Island and the
Mercury Island tusked weta (Motuweta isolata) onto other islands in the Mercury
group after kiore eradication, have been used as evidence of the impact of kiore on
arthropods (Towns and Broome, 2003). However, it is impossible to isolate the
effects of kiore predation from the habitat changes that would also occur when kiore
were eliminated from the ecosystem.
The lack of a control site, with no predator control, is a feature of most island
eradication operations and this makes the results less robust. However, Towns (2002)
argues that unmodified nearby islands can be used as controls, though care must be
taken when interpreting data, because community succession pathways may be
different due to different environmental conditions on adjacent islands.
Ecosystem regeneration on islands after rodent removal is slow and the benefits may
take many years to become apparent, so short term studies may fail to detect any
benefits. For example, the presence of the large native flax weevil (Anagotus
fairburni) was only recorded five years after Norway rats were removed from Hawea
Island (Fiordland) (Towns and Broome, 2003).
Another study investigating the effects of rat removal from Kapiti Island
(Wellington), on arthropod populations, highlighted some of the problems associated
26
with such research. Sinclair, McCartney, Godfrey, Pledger, Wakelin and Sherley
(2005) reported that three years after rat removal, there had been a significant
decrease in catch frequency and diversity of arthropods, especially carabid beetles
and amphipods. This study was confounded by weather differences between the years
(fluctuations between El Niño, bringing wet and windy conditions, and La Niña,
bringing drier conditions), which may have affected the recovery of arthropod
populations. A similar pattern of decline in arthropod numbers was reported, which
coincided with similar weather fluctuations on Tiritiri Matangi Island (Hauraki Gulf,
Auckland), and apparently the amphipods have yet to recover to their original levels
(Green, 2002). On Kapiti Island (Wellington), another confounding factor that may
have affected the abundance of arthropods was an increase in the conspicuousness of
insectivorous ground-feeding birds, such as the saddleback (Philesturnus
carunculatus), robin (Petroica australis), blackbird (Turdus merula), weka
(Gallirallus australis) and little spotted kiwi (Apteryx owenii). It has been suggested
that the rats may suppress other predators and food competitors, thereby contributing
to the higher numbers and diversity of the arthropods (Sinclair,McCartney et al.,
2005), leading the authors to provocatively ask the question “Is a rat free Kapiti
Island actually beneficial to arthropods?” However, the pitfall traps used in this
investigation were active for only three months of each year, and this may have been
too short a sampling period to detect population trends, which can vary temporally
(Chris Green pers. comm.).
Atkinson and Towns (2001) reported a seven year pitfall capture study on Tiritiri
Matangi before and after kiore (Rattus exulans) removal. Ground weta (Hemiandrus
sp.) and large prowling spiders (Miturga sp.) appear to have benefited from the kiore

27
eradication. A similar increase in abundance of ground weta and darkling beetles
(Mimopeus opaculus) was reported after kiore removal from Lady Alice Island
(Hauraki Gulf) (Atkinson & Towns, 2001). In both cases the increases were greater
than would have been expected because of changes in environmental conditions.
Capture rates of other species in the same studies varied widely and correlated well
with weather changes over the same period.
In contrast, the invasion of Big South Cape Islands (south of Stewart Island) by ship
rats in 1962 provided evidence of the possible effects of rodents on native arthropods.
Ship rats colonising these islands coincided with the extinction of the large weevil
Hadramphus stilbocarpae (Towns & Broome, 2003).
Ruscoe (2001) reported an increase in the numbers of eight different species of
arthropods after mice were eradicated from Allport Island (Fiordland). It is difficult to
attribute these increases entirely to the eradication of mice, because concurrently, five
species of arthropods at an adjacent mainland site, where mice were present, also
increased in number, so other environmental changes were suggested as contributing
to these observed changes (Ruscoe, 2001).
Van Aarde, Ferreira and Wassenaar (2004) investigated the impact of mice on
arthropod communities on sub Antarctic Marion Island. They also found that even
though the abundance of some arthropod prey species changed significantly, these
changes could not be isolated from the effects of environmental change over time.
They found that small variations in rainfall and temperature could obscure any effects
on the arthropod populations due to predation by mice. They also commented that

28
before the effects of mice on arthropod populations can be isolated, we need more
knowledge of arthropod life histories.
There is circumstantial evidence that the wetapunga (Deinacrida heteracantha) on
Hauturu (Little Barrier Island) had been affected by the presence of kiore. Gibbs and
McIntyre (1997) surveyed the population of wetapunga around the Ranger’s house on
Hauturu, and concluded that the population in this area was at an all-time low. Kiore
were still present on Hauturu when this survey was done, but no evidence was
gathered of direct predation of wetapunga by kiore. Gibbs and McIntyre (1997)
commented that the habitat around the Ranger’s house on Hauturu had not
deteriorated and that the most likely cause of the decline in the wetapunga population
was predation. Cats were eliminated from the island in 1980 (Veitch, 1983), which
would have removed some predation pressure, and rat poisoning around the Ranger’s
house was no longer being carried out. In 1984 saddlebacks were introduced onto
Hauturu (Meads and Notman, 1993). These insectivorous birds feed on the ground,
and whilst no direct evidence of them feeding on wetapunga had been gathered, a
group of saddlebacks were observed around a ponga, with a known population of
young wetapunga that subsequently could not be located (Gibbs & McIntyre, 1997).
So the evidence that kiore predation had caused the decline of this wetapunga
population is circumstantial and cannot be attributed to any one predator. In the two
years since kiore have been eradicated from Hauturu, whilst there has only been a
small increase in wetapunga numbers in the areas surveyed, there has been an
increase in juvenile wetapunga detected and this indicates that recruitment is
occurring, because young are surviving (Chris Green pers. comm.). Adult wetapunga

29
have large spines on their back legs which they can use for defense, a feature lacking
in juveniles, which could make them more vulnerable to predation (ibid.).
Moeed and Meads (1987) commented that large arthropods, for example weta and
ground beetles, are in low numbers on rat infested islands (such as Long and Motuara
Islands, Fiordland), where kiore were present. They also made the point that the
abundance of arthropods on smaller islands is low because there is less habitat
diversity to support large populations. However, it is difficult to attribute these losses
solely to kiore predation. Gibbs (1999) makes the point that forest habitat
modification, with the loss of logs and deep forest litter, could be contributing factors.
1.5.2 Research on the Mainland Studies of the impact of introduced mammal predators on arthropod populations on
the mainland have yielded similarly variable results. Spurr and Berben (2004)
assessed the recovery of arthropods after a pest control operation using 1080 in the
Tararua Forest Park. They monitored the arthropods, in artificial tree-mounted
refuges, for 12 months before and 4 months after the application of 1080 and found
that there was no significant effect on arthropod numbers. However, given the flax
weevil example mentioned previously, a four month time lag after the application of
toxin may not be long enough for benefits to arthropods to appear. These results were
in contrast to those of Powlesland, Stringer and Hedderley (2005), who in a similar
study showed that tree weta may have benefited from pest control. Unlike the
previous study, monitoring continued for 12 months after poison application,
adequate time for the tree weta to respond to the reduced numbers of possums

30
(Trichosorus vulpecula) and rodents. No such benefit was found for spiders,
harvestmen, cockroaches and cave weta. They did observe a time lag of five months
before the tree weta numbers increased, but this may have been caused by a
temporary increase in mouse numbers.
Craddock (1997), in a study in taraire forest at Wenderholm (North Auckland), found
that arthropod groups eaten by rodents, such as beetles, wetas and caterpillars,
benefited from pest control. However, other arthropod groups that were not targeted
by rodents, such as millipedes, springtails and flies, were in significantly higher
numbers in the control area than the treatment area, and habitat variation may have
been responsible for this difference.
As on off-shore islands, it may be necessary to monitor arthropods for several years
on the mainland before the benefits of pest control become apparent. At the Boundary
Stream Mainland Island (Hawkes Bay), arthropod monitoring has been carried out
since 1995 (Ward-Smith, Abbott, Macdonald, Nakagawa, Stephenson & Sullivan,
2004). Whilst the general trend over that time has been for a greater overall
abundance of arthropods (ibid.), the numbers of some arthropod groups have
oscillated. For instance, weta numbers significantly increased and then significantly
decreased between 2000–01 and 2003–04.
Hutcheson (1999), in a study at the Mapara Wildlife Reserve (Te Kuiti) that
investigated the changes in beetle communities over time, found that the greatest
changes occurred after eight years of pest control. Species richness, abundance and
diversity were higher in the reserve, where grazing mammals were fenced out and

31
mammalian predators suppressed, than in the control area where grazing mammals
were present and mammalian predators were not suppressed. This study also
demonstrates the importance of habitat characteristics and resource availability in
driving insect biodiversity. A lack of grazers in the reserve resulted in a large increase
of mid-level woody vegetation, compared to the control area where grazers were not
restricted. In the control area this tier of vegetation decreased over time, resulting in
less woody debris for detritivore beetles to utilise (ibid.). In the reserve there were
fewer mammal carcasses available after eight years of pest control, and the reduction
in the amount of this resource also resulted in lower numbers of carrion eating beetles
(ibid.).
Sim (2005) investigated the effects of pest control on arthropod populations at the
Rotoiti Nature Recovery Project (Nelson) using one treatment site and five control
sites. He was unable to detect any differences between the treatment site and the
control sites in abundance, species richness and size of individuals. However, the
rodent tracking indices revealed that the rodent population at the treatment site had
not been significantly suppressed. He recommended that if arthropod populations are
to be targeted for recovery, rodent numbers would need to be significantly reduced.
Watts (2004) investigated the effects of mammalian pest removal on ground beetles at
the Karori Wildlife Sanctuary (Wellington). No differences were detected in species
richness and abundance. However, there was some indication of benefit to beetles
because there were significantly more beetles in the >30 mm length at the treatment
site. There are several factors that could be responsible for the lack of response of
beetles in this investigation. Mice numbers were not suppressed and mice are known

32
predators of beetles (Baden, 1986; Jones et al., 2006; Ruscoe et al., 2005; Fitzgerald,
2001). Also brown teal (Anas aucklandica), weka, saddleback, North Island robin and
kiwi have been introduced, and they are all ground-feeding, insectivorous birds.
Predation pressure from mice and insectivorous birds may have replaced that from the
pests removed from the site. Hunt, Sherley and Wakelin (1998) claimed that the
apparent high mice numbers may be responsible for their inability to detect any
benefits to large-bodied arthropods in their study.
Hutcheson (2001) observed that pest control at the Papaitonga Reserve (Horowhenua)
had no effect on carabids and other arthropod taxa, and noted that carabids were not a
major food item of rodents.
1.6 IMPACT OF HABITAT STRUCTURE ON ARTHROPOD POPULATIONS
Habitat structure is regarded as one of the most important factors influencing the
composition and distribution of arthropod groups in forests. Lassau, Hochuli, Cassis
and Reid (2005) constructed a scale of habitat complexity based on the percentage
cover of the various plant tiers, ground characteristics and soil moisture, and found
that habitat complexity was a good predictor of the species richness and abundance of
pitfall-trapped beetles. It has been argued that areas with greater habitat diversity,
because of the presence of varying amounts of leaf litter, debris, logs and rocks,
provide more micro-habitats for arthropod populations (Crisp, Dickinson & Gibbs,
1998; Ings & Hartley, 1999; Lassau, Hochuli et al., 2005; Taylor & Doran, 2001). In
addition, Moeed and Meads (1985) found that more botanically diverse sites

33
supported a greater abundance of forest arthropods. However, determining the
reasons for habitat preferences in New Zealand forests is difficult because of a lack of
detailed knowledge of the life histories and general ecology of arthropods (Crisp,
Dickinson et al. 1998).
1.7 ARTHROPODS AS INDICATORS OF ENVIRONMENTAL CHANGE
It has been suggested that arthropods could be used as indicators of environmental
change, and may provide an early warning system of environmental degradation,
because they have rapid breeding rates, short generation times, and are more sensitive
to environmental change than plants or vertebrates (Hilty & Merenlender, 2000;
Hutcheson, 1994; Kremen,Colwell et al., 1993). Furthermore, arthropods respond to
environmental change more rapidly than do vertebrates (Kremen, Colwell et al.,
1993). In addition, many invertebrate groups are closely linked to a particular region,
ecosystem, and specific anthropogenic disturbance (Hutchison, Walsh, & Given,
1999).
New Zealand has high rates of endemism in most invertebrate groups (Hutchison,
Walsh, et al., 1999). Mollusc assemblages in the East Cape region have shown close
affinity to specific indigenous vegetation assemblages (Hutcheson, Walsh, et al.
1999).
However, insects, because they carry out many functions in terrestrial ecosystems,
have many characteristics that make them good candidates for use as environmental

34
indicators. For example, they are important pollinators, are involved in the
decomposition of plant material, as well as being scavengers, parasites and predators,
and a major food source for many vertebrates (Hutcheson, Walsh, et al., 1999).
Because of their varied ecological roles in forest ecosystems, insects cause the
retention of organic material, and control mineral cycling (Hutcheson, Walsh et al.,
1999).
There is another characteristic of insects that makes them suitable as environmental
indicators, especially for assessing the progress of restoration projects. They often
have large population sizes, which allows for the collection of statistically robust
information without depleting their populations (Longcore, 2003). However, Kremen,
Colwell et al., 1993, contend that not all arthropod taxa would be effective as
environmental indicators, and the ones selected should have high species diversity,
and high endemism, and be sensitive to environmental change.
Very little work has been done on determining taxa that may be suitable for use as
indicators of forest ecosystem quality. Harris and Burns (2000) investigated the beetle
assemblages of kahikatea forest fragments in the Waikato, and their potential as
indicators of these fragment’s ability to resist invasion by adventive species. It was
suggested that such assemblages could be used as indicators of habitat quality in the
forest fragments, and if a large proportion of adventive species were found, this
would indicate that the fragment had lost its resistance to invasion (Harris & Burns,
2000).
35
To monitor the effects of poisoning programmes that target invasive mammals, tree
weta (Hemideina) has been proposed as a suitable genus, as they are abundant and
large. Spurr & Berben (2004) and Powlesland,Stringer et al. (2005) used tree weta to
monitor the impact of 1080 poisoning on non-target arthropod species.
There is research currently underway by the Department of Conservation that aims to
identify suitable arthropod species or groups to use as indicators to monitor the
effects of mammal control in mainland islands (Potter, Stringer, Wakelin, Barrett &
Hedderley, 2006). This is a five year study looking at three different sites in
podocarp-broadleaf forest.
1.8 SUMMARY New Zealand’s Gondwanaland origins have resulted in a diverse, distinctive yet
vulnerable biota. The introduction of invasive species, and habitat loss and
fragmentation, has devastated ecosystems resulting in the extinction of many native
species. The benefits to vertebrates, such as birds, amphibians and reptiles, of
suppressing introduced mammal populations has been, in the main, clearly
established. However, the benefits associated with reducing the numbers of
introduced mammal predator populations to arthropods have been more difficult to
ascertain. Whilst the importance of arthropods, both in sheer numbers and their
contribution to ecological processes, is widely recognised, very little is known about
their biodiversity, taxonomy, and basic biology and ecology.

36
Arthropod populations seem to be particularly sensitive to changes in environmental
variables, both biotic and abiotic. Many studies that aim to determine if pest reduction
or elimination benefits arthropod populations have been limited by sampling periods
of inadequate length and confounded by variations in environmental conditions.
Currently there is interest in using arthropods as indicators of environmental change;
however, selecting appropriate arthropod taxa for this purpose is limited by the lack
of basic knowledge of their life histories, taxonomy and ecology.
1.9 AIMS OF THIS RESEARCH This research will investigate the effects of rodent control on ground weta
(Stenopelmatideae), cave weta (Anastostomatidae), carabid beetles (Carabidae) and
prowling spiders (Zoropsidae) in mature kanuka forest, young podocarp-broadleaf
forest and mature taraire forest. The selected arthropods will be monitored within
treatment sites, in the La Trobe Forest Ecosystem Restoration Project (LTFERP) in
the Waitakere Ranges, west of Auckland, where intensive rodent control has been
carried out since 2002. These arthropods will also be monitored at control sites in the
same forest types, outside of the LTFERP, where rodent populations have not been
manipulated. The abundance of rodents and possums will be compared at the
treatment and control sites. Vegetation and ground-cover features at all sites will also
be assessed.

37
The hypotheses tested in this research are:
1 That ground weta, cave weta, carabid beetles and prowling spiders will be
found in greater abundances in rodent treated (treatment) areas than in
non-rodent treated (control) areas within mature kanuka forest, young
podocarp-broadleaf forest and mature taraire forest.
2 That rodents are selecting particular size classes of the arthropods being
monitored in this research.
3 That ground weta, cave weta, carabid beetles and prowling spiders would
be suitable indicators of the effects of intensive rodent control at the La
Trobe Forest Restoration Project.

38
2 METHODS
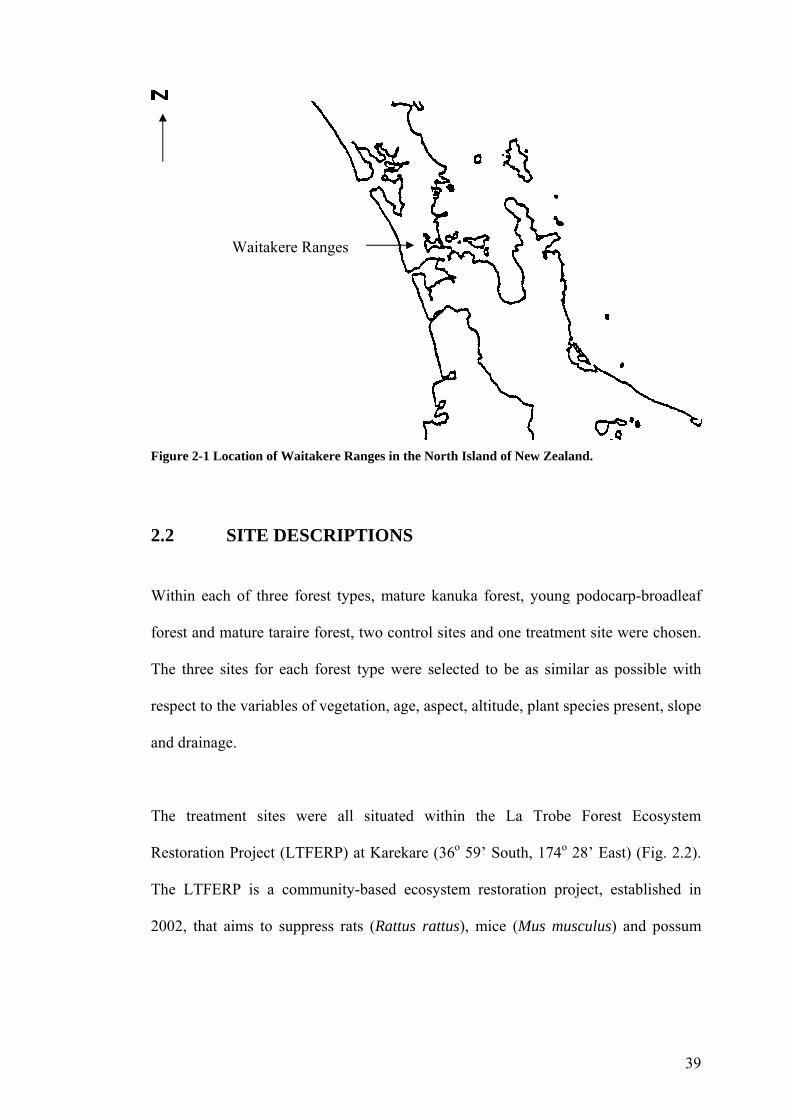
2.1 INTRODUCTION The Waitakere Ranges are situated 25 km to the west of Auckland city and run
roughly north to south (Fig. 2.1). Their topography is rugged, with the highest point
being 474 m a.s.l. Sixty percent of the ranges are within the Waitakere Ranges
Regional Park, and the area surrounding the park is in private ownership (Harvey and
Harvey, 2006). The nature of the original forest is not documented, but may have
been kauri, northern rata and rimu forest (Esler, 2006). Most of the original forest had
been milled and burnt by the 1930’s (Cranwell-Smith, 2006). Forest regeneration has
been influenced by its past history of timber milling and farming (Esler, 2006). Esler
(2006) recognises the following forest zones: unmilled and lightly milled forest, cut-
over forest with tall trees, cut-over forest without tall trees, and tea tree scrublands.
All of the study sites in this research were located between Piha and the Pararaha
Valley, on the western side of the Waitakere Ranges.
39
Figure 2-1 Location of Waitakere Ranges in the North Island of New Zealand.
2.2 SITE DESCRIPTIONS
Within each of three forest types, mature kanuka forest, young podocarp-broadleaf
forest and mature taraire forest, two control sites and one treatment site were chosen.
The three sites for each forest type were selected to be as similar as possible with
respect to the variables of vegetation, age, aspect, altitude, plant species present, slope
and drainage.
The treatment sites were all situated within the La Trobe Forest Ecosystem
Restoration Project (LTFERP) at Karekare (36o 59’ South, 174o 28’ East) (Fig. 2.2).
The LTFERP is a community-based ecosystem restoration project, established in
2002, that aims to suppress rats (Rattus rattus), mice (Mus musculus) and possum
Waitakere Ranges
40
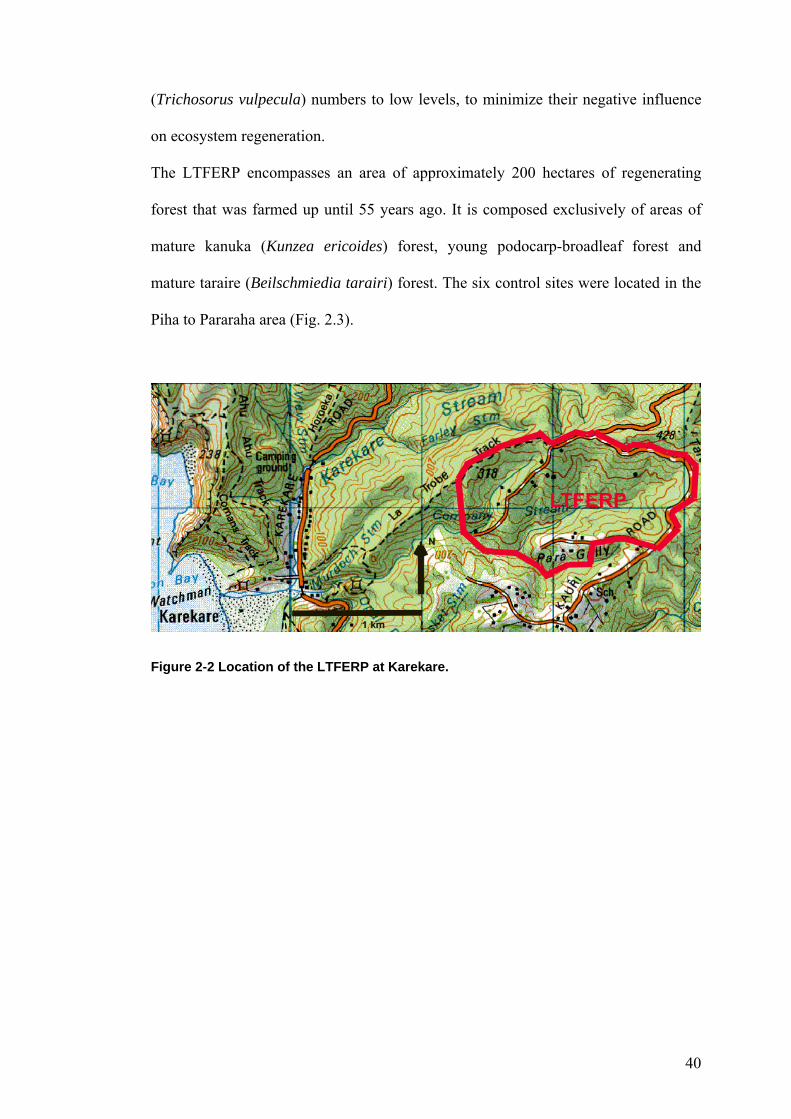
(Trichosorus vulpecula) numbers to low levels, to minimize their negative influence
on ecosystem regeneration.
The LTFERP encompasses an area of approximately 200 hectares of regenerating
forest that was farmed up until 55 years ago. It is composed exclusively of areas of
mature kanuka (Kunzea ericoides) forest, young podocarp-broadleaf forest and
mature taraire (Beilschmiedia tarairi) forest. The six control sites were located in the
Piha to Pararaha area (Fig. 2.3).
Figure 2-2 Location of the LTFERP at Karekare.

41
Figure 2-3 Study sites in the Waitakere Ranges.
1 Podocarp control site 1 7 Taraire control site 1 2 Podocarp control site 2 8 Taraire control site 2 3 Podocarp treatment site (LTFERP) 9 Taraire treatment site (LTFERP) 4 Kanuka control site 1 5 Kanuka control site 2 6 Kanuka treatment site (LTFERP)
42
2.2.1 Treatment Sites
Podocarp-broadleaf forest This site was located along the south-west side of the Lone Kauri Road,
approximately 2 km from the Piha Road intersection (Fig. 2.3). The site consisted of
secondary-growth forest with a canopy of rewarewa (Knightia excelsa), whitey wood
(Melycytus ramiflorus), pigeonwood (Hedycarya arborea), black ponga (Cyathea
medullaris), mapou (Myrsine australis), lacebark (Hoheria populnea), rimu
(Dacrydium cupressinum), miro (Prumnopitys ferruginea) and nikau palm
(Rhopalostylis sapida). The understorey plants consisted mainly of mapou, rewarewa,
lacebark, silver fern (Cyathea dealbata), kiekie (Freycinetia banksii), pigeonwood,
lancewood (Pseudopanax crassifolius), toropapa (Alseuosmia macrophylla), and
various Coprosma species. There were also large numbers of lianes: supplejack vines
(Ripogonum scandens), kiekie, various rata species (Metrosideros spp), and
mangemange (Lygodium articulatum). Some trees also supported epiphytes such as
kauri grass (Astelia trinervia), and hanging spleenwort (Asplenium flaccidum). This
site had a south-westerly aspect, and was situated on medium to steep sloped hills,
with well drained soil, at an elevation of 250–300 m a.s.l. (Plate 2.1).

43
Plate 2-1 Understorey of podocarp-broadleaf forest in the Company Stream valley, LTFERP, with dense kiekie growth and supplejack vines.
Kanuka Forest This site was situated between La Trobe Track and La Trobe Road (Fig. 2.3). It
consisted of secondary-growth forest, with a canopy dominated by mature kanuka
(Kunzea ericoides). The understorey consisted mainly of rewarewa, lancewood,
pigeonwood, silver fern, various Coprosma species, hangehange (Geniostoma
rupestre), and crown fern (Blechnum discolor). There were very few lianes and
epiphytes present. This site had a south-easterly aspect, and was situated on steep
hills, with well drained soil, at an elevation of 250–300 m a. s. l. (Plate 2.2)

44
Plate 2-2 Understorey plants in mature kanuka forest.
Taraire Forest This site was located in the Company Stream valley between the stream and the La
Trobe Road (Fig. 2.3). It was comprised of mature taraire (Beilschmiedia tarairi),
with a canopy dominated by taraire, black ponga, tawa (Beilschmiedia tawa), and
nikau. The understorey consisted mainly of hangehange, kohekohe (Dysoxylum
spectabile), juvenile nikau palm, kiekie, various Coprosma species and silver fern.
There were a large number of supplejack vines, and also kiekie growing as a liane, as
well as many epiphytes, the most common of which were ferns such as hanging
spleenwort. The forest floor was covered in a thick layer of leaf litter. This site had a
south-easterly aspect, and was sited on medium to steep slopes with well-drained soil,
at an elevation of 180–200 m a.s.l. (Plate 2.3).

45
Plate 2-3 Mature taraire forest in the LTFERP, showing the thick layer of leaf litter.
2.2.2 Control Sites Podocarp Control Site 1 Situated beside the Arthur Mead Track, off the Piha Road, and towards the Lone
Kauri Road (Fig. 2.3), this site was comprised of secondary-growth forest with a
canopy of rimu (Dacrydium cupressinum) black ponga, heketara (Olearia rani),
lancewood, kohuhu (Pittosporum tenuifolium) and rewarewa. The understorey
consisted mainly of kiekie, toropapa, hangehange, heketara, hohere and cutty grass
(Gahnia setifolia). There were large numbers of lianes such as supplejack,
mangemange, rata species and kauri grass, and ferns growing as epiphytes. This site
had a south-easterly aspect, and was sited on medium to steep slopes, with well
drained soils, at an elevation of 250–300 m a. s. l.

46
Podocarp Control Site 2 This site was situated approximately 400 m along the Home Track, which is located
off the Piha Road (Fig. 2.3). It consisted of secondary-growth forest with a canopy of
tawa, houpara (Pseudopanax lessoni), pigeonwood, black ponga, rewarewa, heketara
and kahikatea (Dacrycarpus dacrydioides). The understorey consisted mainly of
nikau palm, black ponga, hangehange, pigeonwood, mapou, various Coprosma
species, whitey wood, miro (Prumnopitys ferruginea) and houpara. There were large
numbers of lianes such as supplejack, rata and mangemange, and various epiphytic
ferns. This site had both a southerly and a northerly aspect, and was located on both
steep and gentle slopes, with well-drained soils, at an elevation of 250–300 m a. s. l.
Kanuka Control Site 1 This site was located approximately 2 km down La Trobe Track, between the track
and the Company Stream (Fig. 2.3). It was comprised of secondary-growth forest
with a canopy dominated by mature kanuka. The understorey consisted mainly of
silver fern, black fern, hangehange, pigeonwood, rewarewa, various Coprosma
species, toropapa, whitey wood and heketara. There were only a few lianes and
epiphytes. This site had a south-easterly aspect, and was located on steep slopes, with
well-drained soils, at an elevation of 180–200 m a. s. l.).
Kanuka Control Site 2 This site was located approximately 800 m down the Winstone Track, off the Piha
Road, between the track and the Ussher Stream (Fig. 2.3). It was comprised of
secondary-growth forest with a canopy dominated by mature kanuka. The
understorey consisted mainly of silver fern, various Coprosma species, kohuhu,

47
pigeonwood, hangehange, kauri (Agathis australis), toropapa, rewarewa, miro, and
cutty grass. There were only a few lianes and epiphytes. This site had an east to north-
westerly aspect and was located on gentle to medium slopes, with medium-drained
soils, at an elevation of 180–200 m a. s. l.
Taraire Control Site 1
This site was located in the Farley Stream valley, which is a tributary of the Karekare
Stream (Fig. 2.3). It was comprised of mature taraire, with a canopy dominated by
taraire, nikau and karaka (Corynocarpus laevigatus). The understorey consisted
mainly of silver fern, nikau palm, hangehange, pigeonwood, whitey wood, various
Coprosma species, taraire, kohekohe, and tawa. The trees supported large numbers of
lianes such as rata species and supplejack, as well as the epiphytes spleen wort, and
hounds tongue. The forest floor was covered in a thick layer of leaf litter. This site
had a northerly aspect, and was located on steep slopes, with well drained soils, at an
elevation of 200–240 m a.s.l.
Taraire Control Site 2
This site was located up the side of Baldy in the Pararaha Stream valley (Fig. 2.3). It
was comprised of mature taraire, with a canopy dominated by taraire, small numbers
of kowhai (Sophora microphylla), and puriri (Vitex lucens). The understorey plants
consisted mainly of nikau palm, silver fern, hangehange, pigeonwood, whitey wood,
and waiu-atua (Rhabdothamnus solandri), with very few lianes and epiphytes. The
forest floor was covered in a thick layer of leaf litter. This site had a south-easterly
aspect, and was located on very steep slopes, with well drained soils, at an elevation
of 200–240 m a.s.l.

48
2.3 ASSESSMENT OF SITE CHARACTERISTICS
2.3.1 Vegetation Parameters The assessment of selected vegetation parameters is based on the RECCE method,
and all of the parameters recorded were visually assessed to allow for rapid data
collection (Allan, 1993).
The different plant species in the prescribed height-tier classes were recorded using
line transects, running along the pitfall trap lines, at each site. Plants in height-tiers
one to five were recorded; plants in height-tier six were recorded using the point
intercept method (see section 2.3.3). The presence of any epiphytes and lianes were
noted in each height-tier. In addition to the height-tier information, the mean height of
the canopy was estimated at each site, and the canopy percentage cover, estimated to
the nearest 10% of the proportion of sky blocked out by vegetation at a height of 1.35
m, was also estimated at each site.
2.3.2 Physical Parameters
At each pitfall trap site the aspect was measured with a compass, the slope estimated,
and the soil depth measured with a gum digger’s spike. Drainage was estimated
following Allan (1993) as:
• Good - where there is fast runoff and little accumulation of water
• Medium - where runoff is slow and water accumulates for a few days after
rain
• Poor - where water stands for long periods

49
2.3.3 Ground Cover
Ground cover was assessed using the Point Intercept method (Handford, 2000). At
each pitfall trap site a measuring tape was extended for 10 m, horizontal to the slope,
and the ground cover category was recorded under each 1 m mark of the tape i.e. a
point. A total of 220 points were recorded at each site. The following ground cover
categories were recorded:
• Vegetation – any vegetation less than 15 cm in height other than mosses or
ferns
• Live tree roots
• Mosses
• Ferns – any ferns less than 15 cm in height
• Leaf litter – including dead sticks < 3 cm in diameter
• Wood – dead wood, branches and logs, ≥ 3 cm in diameter
• Bare soil
• Exposed rock
50
2.4 WEATHER MEASUREMENTS Temperature and rainfall measurements were recorded at a home-based weather
station located in the LTFERP.
2.4.1 Temperature
Daily maximum and minimum temperatures have been recorded since March 2004.
The recordings were taken in the shade, 1.56 m above the ground. The monthly
minimum temperatures have been used for comparisons between 2004–05 and 2005–
06, because the arthropods being captured in the pitfall traps are nocturnal and the
night-time temperatures are more relevant to their activity pattern.
2.4.2 Rainfall
Rainfall data has been collected using a standard calibrated rain gauge, and monthly
totals calculated and recorded, since December 1999.
2.5 POSSUM AND RODENT CONTROL AT THE TREATMENT SITES (LTFERP)
In 2002 a network of poison bait stations was established over the entire LTFERP
area, using lines with the bait stations at 50 m intervals, and the lines 100 m apart.
Initially, brodifacoum, a second generation anti-coagulant, was used to control
rodents (Rattus rattus and Mus musculus) and possums (Trichosorus vulpecula).
However, because of concerns about the persistence and toxicity of brodifacoum to
51
non-target species (Booth, Eason & Spurr, 2001; Booth, Fisher, Heppelthwaite &
Eason, 2003), other pest control methods have also been trialed at the LTFERP. In
July 2003, diphacinone, a first generation anti-coagulant, was used in the podocarp-
broadleaf forest. However, this trial did not adequately suppress rat numbers and
consequently the use of brodifacoum was resumed and is still currently in use.
Rat snap-traps were used to control rodents in the kanuka forest in 2003. Lines of
paired traps baited with peanut butter, oats, and fish sauce were placed in Black
Trakka ™ tracking tunnels using the 50 m by 100 m grid. This trial ended in July
2004, because mice numbers increased during autumn, so brodifacoum use was
resumed.
2.6 RODENT MONITORING
2.6.1 Previous Research At the LTFERP tracking tunnels were used to provide an index of rodent abundance,
because they are reported to be able to detect the presence of rodents at low
abundance (Gillies & Williams, 2003).
Seven rodent monitoring lines, each at least 200 m from any other line (ibid.), were
established in 2002, encompassing all three forest types in the project. Black Trakka
™ plastic tracking tunnels (Plate 2.4) were permanently located at 50 m intervals
along each line, and the number of tunnels along each line varied between 8 and 16.
A total of 74 tunnels were installed.

52
Plate 2-4 Black trakka ™ tracking tunnel containing card for rodent monitoring.
Rodent monitoring surveys were carried out over one night, with fine weather
conditions. Pre-inked footprint tracking cards were baited with a tablespoon of
crunchy peanut butter and placed inside the tunnels. The next day the cards were
retrieved and any rodent foot print tracks identified and recorded as rat or mouse
(Plate 2.5). Possum (Plate 2.5) and hedgehog prints were also recorded. In 2002 and
2003 rodent monitoring was carried out at approximately two monthly intervals, and
in 2005 at three monthly intervals, however, in 2004 rodent monitoring was only
done at six monthly intervals, because of time constraints.
For each monitoring event the percentage of cards with rat or mouse footprints was
calculated, and this total was recorded as the tracking index. A tracking index of

53
above 5% was used as the threshold limit. If the index was higher than 5%, the bait
stations were rebaited.

54
Plate 2-5 Monitoring cards showing footprints of rat (top), mice (middle) and possum (bottom). Scale life size.

55
2.6.2 This Study An existing rodent monitoring line was used to estimate the rodent population in the
kanuka treatment site for this study. New rodent monitoring lines were installed in
November 2005, in the podocarp-broadleaf treatment and taraire treatment sites. In
addition, rodent monitoring lines were also established in each of the kanuka,
podocarp-broadleaf and taraire control sites. Each line consisted of 10 tracking
tunnels, which were spaced at 50 m intervals and left in place for three weeks before
use, to allow any resident rodents to become acclimatised to their presence (Gillies &
Williams, 2003). A total of 90 tracking tunnels were installed (30 in the treatment
sites and 60 in the control sites). The rodent populations were sampled in November–
December 2005, March–April 2006 and October 2006, using the same methodology
as previously described.
2.7 POSSUM CONTROL IN THE WAITAKERE RANGES Possum control was carried out throughout the Waitakere Ranges, in 1998, including
the LTFERP and control areas, in an operation called Project Forest Save, run by the
Auckland Regional Authority. Brodifacoum placed in bait stations was used to reduce
possum numbers.

56
2.8 POSSUM MONITORING
2.8.1 Previous Research
Five lines of 10 leg-hold traps, with the traps at 20 m intervals in each line, were
installed giving 50 traps in total. Each leg-hold trap was attached to a tree, and a
mixture of plain white flour and icing sugar was spread up the tree beyond the trap as
a lure. The traps were left out for two nights of fine weather, and checked each day,
giving a total of 100 trap nights. The number of possums captured per trap night was
calculated. This was done only once, in September 2002, and thereafter the presence
of possum footprints on the tracking cards in tunnels was used to monitor possums
(Plate 2.5).
2.8.2 This Study Treatment Sites Possum footprints found on the rodent tracking cards used in 2005–06 were recorded,
and the number of cards with possum prints used to indicate the presence of possums
in the treatment site.
Control Sites The relative abundance of possums was determined by the Auckland Regional
Council in the Piha and Whatipu areas, between February and March 2006. Twenty
lines of leg-hold traps were installed in each area, with 10 traps per line. In each line
the traps were spaced at 20 m intervals and left out for three nights, giving a total of
1200 trap nights. The Karekare area was monitored during October 2006, using
similar methodology, except 10 lines of leg-hold traps were installed, giving a total of

57
300 trap nights. The number of possums captured per 100 trap nights was calculated
from the data obtained. In addition to the possum monitoring done by the Auckland
Regional Authority, any possum footprints found on the tracking cards, used for
rodent monitoring, were also recorded.
2.9 ARTHROPOD MONITORING In this research, ground weta (Plate 2.6), cave weta (Plate 2.7), carabid beetles (Plate
2.8), and prowling spiders (Plate 2.9), have been monitored, to determine whether
they were being affected by the presence of rodents. These arthropods have been
selected because they are largely nocturnal, live on the ground, are flightless and
large bodied and have extended life histories and therefore low rates of reproduction.
According to Gibbs (1998), these are features that make them vulnerable to rodent
predation, because rodents are predominantly nocturnal and spend much of their time
hunting on the ground (Green, 2000).

58
Plate 2-6 Ground weta, Hemiandrus sp. 22 mm body length.

59
Plate 2-7 Auckland cave weta, Gymnoplectron acanthocera, 25 mm average body length.

60
Plate 2-8 Carabid beetle, Mecodema spiniferum, 30 mm body length.

61
Plate 2-9 Prowling spider, Uliodon sp. 25 mm body length.
2.9.1 Pitfall Traps Pitfall traps were used to monitor the selected arthropods in this research, because
they have been used extensively to sample ground-dwelling arthropods in New
Zealand forests (Chapman, Alexander & Ussher, 2004; Craddock, 1997; Hutcheson,
2001; Moeed and Meads, 1986; Sim, 2005; Ward-Smith, Sullivan et al., 2004; Watts,
2004). They are effective at capturing larger organisms (New, 1998). Pitfall traps
collect only a fraction of the available fauna and cannot be used for measuring
population density; instead they provide an index of arthropod activity (Southwood &
Henderson, 2000).

62
A large range of factors affect the catch, including such things as: temperature,
weather conditions, food supply, amount of vegetation impeding the movement of
ground-dwelling arthropods, and the sex and age of the individual. They must also be
left unset for a few weeks to avoid the “digging in effect”, because the ground is
disturbed when they are first installed and some organisms are attracted to the
disturbed ground whilst others are repelled by it (New, 1998). Despite these
limitations, pitfall traps do have many advantages. For instance, they are inexpensive
and easily constructed, can be transported in large numbers through dense forest, and
can be left unattended for long periods of time, and therefore can provide a
continuous record of arthropod fauna for comparison between sites (Watts, 1999).
The pitfall traps used in this study consisted of 160 mm lengths of 80 mm diameter
cylindrical plastic down-pipe (Green, 2000), dug into the ground with a small post-
hole borer, so that the rim was level with the ground (Fig. 2.4). Surplus soil was
discarded several metres away from the traps, which were then left unset for several
weeks before being activated, to avoid the “digging in effect”. During the course of
the trapping season, any cracks that appeared between the trap and the surrounding
ground were repaired, and the rims of the traps were maintained level with the
ground. A tight-fitting plastic cup was pushed to the bottom of the down-pipe, leaving
a distance of at least 60–70 mm between the top of the cup and ground level. This
distance reduces the chance of any arthropods climbing out of the trap and escaping
(Green, 2000). Six small drainage holes were burnt into each cup with a hot nail,
about 30 mm from the top, to prevent loss of arthropods during heavy rainfall. To
locate the trap site, the position of each was marked by attaching flagging tape to a
near-by tree. When operating the trap line, the same route was taken to each trap site

63
to minimize damage to the ground cover and disturbance to any other material that
may be used by arthropods to shelter during the day (Green, 2000).
Each trap was covered with a plastic, 2 litre ice-cream container lid that was
positioned 2 cm above the surface of the ground on wire supports. The purpose of the
cover was to reduce the amount of rain and solid objects falling into the trap.
Figure 2-4 Diagram of pitfall trap in situ.
The preservative used was a mixture of 30% monoethylene glycol (vehicle antifreeze)
solution, 70% unfiltered tank water, plus a tablespoon of table salt to supersaturate
the solution (Green, 2000). A few drops of detergent were added to reduce the surface
tension of the liquid, so that captured arthropods would sink quickly. Approximately
80 ml of this solution was poured into each cup. During trap clearances, the
preservative and captured arthropods were poured into plastic screw top containers,
soil level
plastic cup
preservative solution
down-pipe
lid
wire pin

64
labeled with the trap number, location and date, and the plastic cup refilled with new
preservative solution.
2.9.2 Sampling Regime
This Study Pre-existing pitfall trap lines were used in kanuka forest in the LTFERP (the
treatment site) (Fig. 2.3), and in control site 1 (Fig. 2.3).
New pitfall trap-lines were located at the treatment sites in young podocarp-broadleaf
and mature taraire, within the LTFERP (Fig. 2.3) In addition, two control sites in
each of podocarp-broadleaf and taraire forest, and one additional control site in
kanuka forest were established (Fig. 2.3). All of the control sites were located at least
400 m outside of the treatment site, in order to avoid rodent control at the treatment
sites affecting the control sites (Chapman, Alexander & Ussher, 2004). This provided
a total of one treatment and two control sites for each forest type. According to
Underwood (1992), several control sites are required because natural populations
fluctuate, both temporally and spatially, but while it is usually not feasible to have
more than one treatment site, it is possible to have multiple control sites. In this study
two control sites per forest type were used given the time frame available
At each site, two lines of pitfall traps were installed a minimum of 50 m apart. Each
line consisted of 10 traps, located at intervals of at least 10 m. A 10 m interval
between traps is sufficient to ensure that they are independent of each other (Green,
2000). Each pitfall trap line was located a minimum of 50 m away from different
65
forest types that may have different characteristics and could influence arthropod
numbers and species present (ibid.). Pitfall traps were placed 20 m away from streams
to prevent flooding during heavy rainfall, and away from ridge tops to avoid the
drying effect of higher winds. Traps were located at least 10 m away from public
walking tracks so they would not be disturbed by foot traffic. To minimise variable
drying effects, each trap was placed at a site with a minimum of 80% canopy cover.
Traps were installed in October 2005 and samples collected approximately every 30
days, from December 2005 until May 2006. This gave a total of six months of
sampling for each trap. A total of 1080 samples were collected during 2005–06.
The contents of each sample were grouped into ground weta, cave weta, carabid
beetles and prowling spiders, and the numbers of each of these were recorded and
voucher specimens kept. Other arthropods in the samples were stored in 70% ethanol
for future study. Capture rates of each arthropod group, as the number per trap night,
were used to provide the indices of abundance at each site. The targeted arthropods
were sorted into different size class groups (Table 2.1), and the number of individuals
in each size class was recorded.
Previous Research The pitfall trap lines in the kanuka treatment site, within the LTFERP, and control
site 1 were established in November 2004. The same methodology, as described
below, was used, except there was only one control site, and the pit fall traps were
cleared at approximately 28 day intervals (from December 2004 to May 2005). A
total of 240 samples were collected. This data was also used in this study.
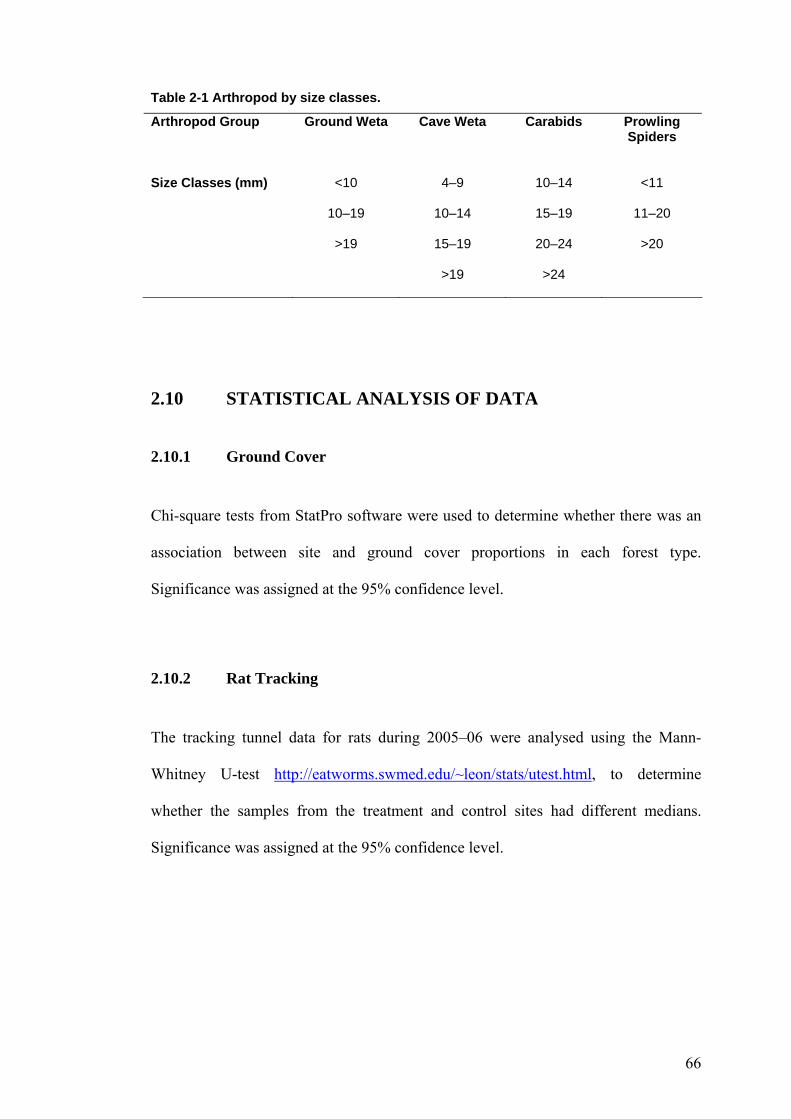
66
Table 2-1 Arthropod by size classes.
Arthropod Group Ground Weta Cave Weta Carabids Prowling Spiders
Size Classes (mm) <10
10–19
>19
4–9
10–14
15–19
>19
10–14
15–19
20–24
>24
<11
11–20
>20
2.10 STATISTICAL ANALYSIS OF DATA
2.10.1 Ground Cover Chi-square tests from StatPro software were used to determine whether there was an
association between site and ground cover proportions in each forest type.
Significance was assigned at the 95% confidence level.
2.10.2 Rat Tracking The tracking tunnel data for rats during 2005–06 were analysed using the Mann-
Whitney U-test http://eatworms.swmed.edu/~leon/stats/utest.html, to determine
whether the samples from the treatment and control sites had different medians.
Significance was assigned at the 95% confidence level.
67
2.10.3 Pitfall Trap Samples Each data set was tested for normality using the Lilliefors Test from StatPro software,
and homogeneity of variance using the F max test (Fowler, Cohen & Jarvis, 1999).
Data sets that were not normally distributed or had non-homogenous variances were
logarithmically transformed using StatPro software. If data transformation was not
possible (because of the presence of too many zero results), non-parametric statistical
tests were used. For two-sample comparisons, the Mann-Whitney U test
http://eatworms.swmed.edu/~leon/stats/utest.html was used, and the Kruskal-Wallis
test (using SPSS software), for three-sample comparisons. One-way Analysis of
Variance (ANOVA) was used to analyse data that was normally distributed with
homogenous variances. The statistical significance of differences in the size class
frequencies of each arthropod group, at each site or between different years, was
tested using Chi-square contingency tables, from StatPro software. All tests were
two-tailed and significance was assigned at the 95% confidence level.

68
3 RESULTS
3.1 KANUKA FOREST
3.1.1 Study Site Physical Characteristics Both the treatment site and control site 1 have similar site characteristics, in contrast to
control site 2, which has a more northerly aspect, is less steep, has poorer drainage, and a
taller canopy. In addition, soil depths were similar at all three sites (Table 3.1).
Table 3-1 Comparison of site characteristics in kanuka.
Characteristic Aspect Slope Drainage Canopy height
Mean soil depth
Treatment site SW–SE 20°–40° Good 15 m >1.1 m
Control site 1 SE 25°–30° Good 15 m >1.1 m
Control site 2 E–NW 5°–10° Medium 20 m >1.1 m
3.1.2 Vegetation Assessment Ground Cover The ground cover categories of vegetation, moss, fern, and rock were not used because
they occurred in frequencies too low for statistical comparisons to be made. There was a
statistically significant relationship between ground cover categories and place (Chi-
square = 16.9, P = 0.01).
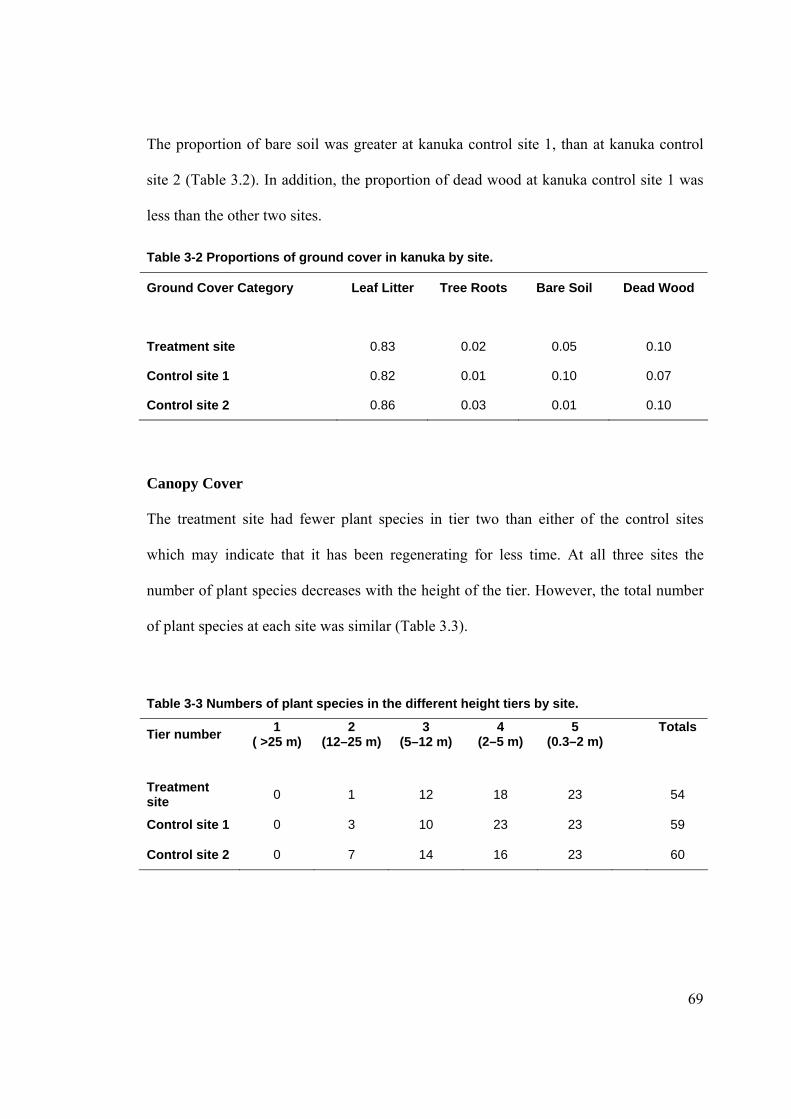
69
The proportion of bare soil was greater at kanuka control site 1, than at kanuka control
site 2 (Table 3.2). In addition, the proportion of dead wood at kanuka control site 1 was
less than the other two sites.
Table 3-2 Proportions of ground cover in kanuka by site.
Ground Cover Category Leaf Litter Tree Roots Bare Soil Dead Wood
Treatment site 0.83 0.02 0.05 0.10
Control site 1 0.82 0.01 0.10 0.07
Control site 2 0.86 0.03 0.01 0.10
Canopy Cover The treatment site had fewer plant species in tier two than either of the control sites
which may indicate that it has been regenerating for less time. At all three sites the
number of plant species decreases with the height of the tier. However, the total number
of plant species at each site was similar (Table 3.3).
Table 3-3 Numbers of plant species in the different height tiers by site.
Tier number 1 ( >25 m)
2 (12–25 m)
3 (5–12 m)
4 (2–5 m)
5 (0.3–2 m)
Totals
Treatment site 0 1 12 18 23 54
Control site 1 0 3 10 23 23 59
Control site 2 0 7 14 16 23 60

70
3.1.3 Rodent Monitoring
Rats The annual rat tracking index in kanuka has only twice been below the target figure of
5% since 2002 (2003 and 2004), nevertheless, all the tracking indices were well below
those of control sites 1 and 2 for 2005–06 (Tables 3.4 and 3.5). During the time period
2002–06, rats were detected at the kanuka treatment site in autumn (March, April, and
May), and in spring (September and November) only (Table 3.4).
The rat tracking index, for the kanuka treatment site, during the 2005–06 pitfall trapping
season was 20%. This was higher than the historical indices, which varied between 0%
and 10.6% (Table 3.4 and Fig. 3.1). The tracking index for rats at the treatment site
during 2005–06 was not statistically significantly different from that of control site 1
(Mann-Whitney U = 507.7, P = 0.176). In contrast, the tracking index for rats at the
treatment site was statistically significantly lower than that of control site 2 (Mann-
Whitney U = 765, P <0.001).
Table 3-4 Rat tracking indices at kanuka treatment site from 2002–2006.
* No monitoring done
Year Jan Mar Apr May Jun Jul Sep Oct Nov Mean SE
2002 * * * 0 * * 25 * 0 8.3 4.0
2003 0 19 * 6 * 0 * 0 * 5 2.0
2004 0 * * * * * * 0 * 0 0.0
2005 0 * 30 * 0 * * * 30 10.6 3.0
2006 * 30 * * * * * 0 * 15 8

71
Table 3-5 Rat tracking indices in kanuka during 2005–06 by site.
Month Nov Mar Oct Mean SE
Treatment site (6) 30 30 0 20 7.4
Control site 1 (4) 20 78 30 42.6 9.3
Control site 2 (5) 80 100 100 93.3 4.6
Rat tracking index in kanuka during 2005-06
0%
10%
20%
30%
40%
50%
60%
70%
80%
90%
100%
Mea
n tr
acki
ng i
ndex
TreatmentControl 1Control 2
Figure 3-1 Rat tracking indices in kanuka during 2005–06 by site (+/- SE).
Mice The target 5% mice tracking index, at the kanuka treatment site between 2002 and 2006,
was achieved in 2002, 2004, and 2005, and similarly to rats, mice were detected at the
kanuka treatment site in spring and autumn (Table 3.6). However, rodent monitoring in
the whole kanuka forest in the LTFERP between 2003 and 2005 produced high mice
tracking indices in March 2003, October 2003 and April 2005 (39.4%, 33.3% and 36.4%

72
respectively). During the 2005–06 pitfall trapping season, mice were more abundant at
control site 1 than either control site 2 or the treatment site (Table 3.7). However,
because of the large amount of variation in the results the standard errors are large
(Tables 3.6, 3.7 and Fig.3.2).
Table 3-6 Mice tracking indices at the kanuka treatment site by year.
* No monitoring done
Month Jan Mar Apr May Jun Jul Sep Oct Nov Mean S.E.
2002 * * * 0 * * 0 12.5 * 4.2 2.9
2003 0 31 * 0 * 0 * 25 * 11.3 3.6
2004 0 * * * * * * 0 * 0 0.0
2005 0 * 12.5 * * 0 * * 0 3.4 2.4
2006 * * 20 * * * * 0 * 10 6.8
Table 3-7 Mice tracking indices in kanuka during 2005–2006 by site.
Month Nov Apr Oct Mean SE
Treatment site 0 20 0 6.6 5.0
Control site 1 0 30 20 16.7 6.9
Control site 2 0 10 0 3.3 3.3

73
0%
5%
10%
15%
20%
25%
Mea
n m
ice
trac
king
inde
x
TreatmentControl 1Control 2
Figure 3-2 Mice tracking indices in kanuka during 2005–06 by site (+/- SE).
3.1.4 Ground Weta
Seasonal Abundance The monthly abundance patterns of ground weta within kanuka forest were very similar
for the sampling seasons in 2004–05 and 2005–06, with peaks in January, followed by a
general decline until May when sampling was concluded (Figs. 3.3 and 3.4). However, in
April 2006 at the treatment site (Fig.3.4), there was a second, smaller peak in numbers.
Both control site 1 and control site 2 had similar monthly means during the 2005–06
sampling season (Fig 3.4). The monthly means for both 2004–05 and 2005–06 had large
standard errors and this indicates a large amount of variation in the number of ground

74
weta trapped in each pitfall trap. The increase in abundance from December to January
was much greater in 2005–06 than in 2004–05 (Fig. 3.4).
Ground weta were more abundant in 2005–06 than 2004–05 at the treatment site (0.056
per trap night compared to 0.031 respectively); however, this difference was not
statistically significant (U = 250.5, P = 0.17). Conversely, ground weta were more
abundant in 2004–05 than 2005–06 at control site 1 (0.016 per trap night compared to
0.014 respectively), but this difference was not statistically significant (U = 455, P =
0.39). Ground weta were more abundant at the treatment site in 2004–05 than at control
site 1 over the same time period (0.03 per trap night compared with 0.016 respectively);
however, this difference was not statistically significant either (U = 262.5, P = 0.09). In
contrast, ground weta abundance in 2005–06 at the treatment site was greater than those
of control site 1 and control site 2 (0.06, 0.01, and 0.01 per trap night respectively), and
these differences were statistically significant (Kruskal-Wallis, P = 0.008). Conversely,
the means of the control sites one and two were very similar.
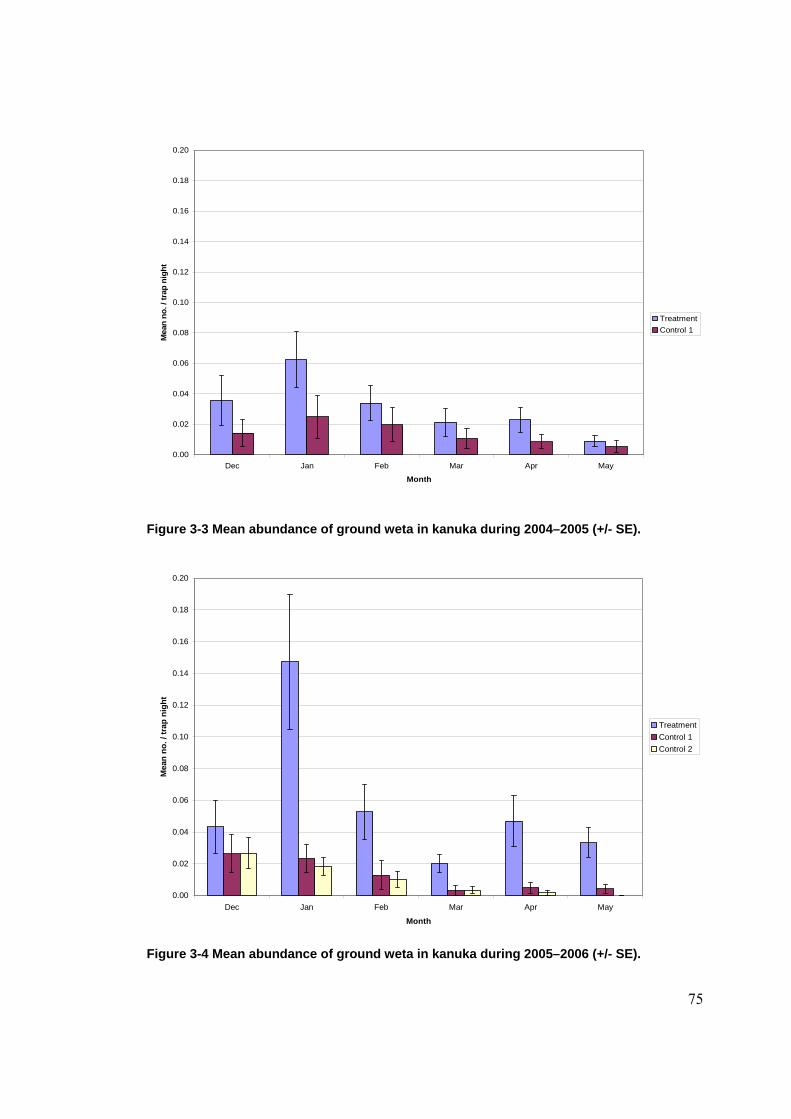
75
0.00
0.02
0.04
0.06
0.08
0.10
0.12
0.14
0.16
0.18
0.20
Dec Jan Feb Mar Apr May
Month
Mea
n no
. / tr
ap n
ight
TreatmentControl 1
Figure 3-3 Mean abundance of ground weta in kanuka during 2004–2005 (+/- SE).
0.00
0.02
0.04
0.06
0.08
0.10
0.12
0.14
0.16
0.18
0.20
Dec Jan Feb Mar Apr May
Month
Mea
n no
. / tr
ap n
ight
TreatmentControl 1Control 2
Figure 3-4 Mean abundance of ground weta in kanuka during 2005–2006 (+/- SE).

76
Trapped Ground Weta Size Classes In the 2004–05 sampling season, the proportions of the different size classes were similar
to those of the 2005–06 sampling season. There was a statistically significant relationship
between the size classes <10 mm and >19 mm of ground weta, and site (Chi-square =
9.8, P = 0.007). In particular, there was a large proportion of ground weta in the <10 mm
size class at control site 1 and a small proportion of ground weta in the >19 mm size
class (Table 3.8). However, there was a small proportion of ground weta in the <10 mm
size class at the treatment site, whereas, there was a large proportion of ground weta in
the >19 mm size class.
Table 3-8 Ground weta mean size class proportions in kanuka during 2004–05 by site.
Size class (mm) <10 10–19 >19
Treatment site 0.42 0.32 0.26
Control site 1 0.68 0.23 0.09
In the 2005–06 sampling season there was a large proportion of ground weta in the <10
mm size class in both control sites 1 and 2, but a small proportion at the treatment site. In
contrast, at the treatment site there was a large proportion of ground weta in the >19 mm
size class, whereas at control sites 1 and 2, there was a small proportion of ground weta
in this size class (Table 3.9). There was a statistically significant relationship between the
ground weta size classes < 10 mm, >19 mm and site (Chi-square = 12.53, P = 0.014).

77
Table 3-9 Ground weta mean size class proportions in kanuka during 2005–06 by site.
Size class (mm) <10 10–19 >19
Treatment site 0.24 0.40 0.36
Control site 1 0.44 0.35 0.21
Control site 2 0.46 0.34 0.20
In kanuka control site 1, between 2004–05 and 2005–06, there was no significant
relationship between ground weta size classes and sampling season (Chi-square = 5.686,
P = 0.058) (Table 3.10).
Table 3-10 Ground weta size class proportions in kanuka control site 1 by sampling season.
Size class (mm) <10 10–19 >19
2004–05 0.68 0.23 0.09
2005–06 0.44 0.35 0.21
There was a statistically significant relationship between size classes and sampling
season at the kanuka treatment site (Chi-square = 10.49, P = 0.005). In particular, there
was a large proportion of ground weta in the <10 mm size class in 2004–05, and a small
proportion in 2005–06. There was a small proportion of ground weta in the >19 mm size
class in 2004–05 and a larger one in 2005–06 (Table 3.11).
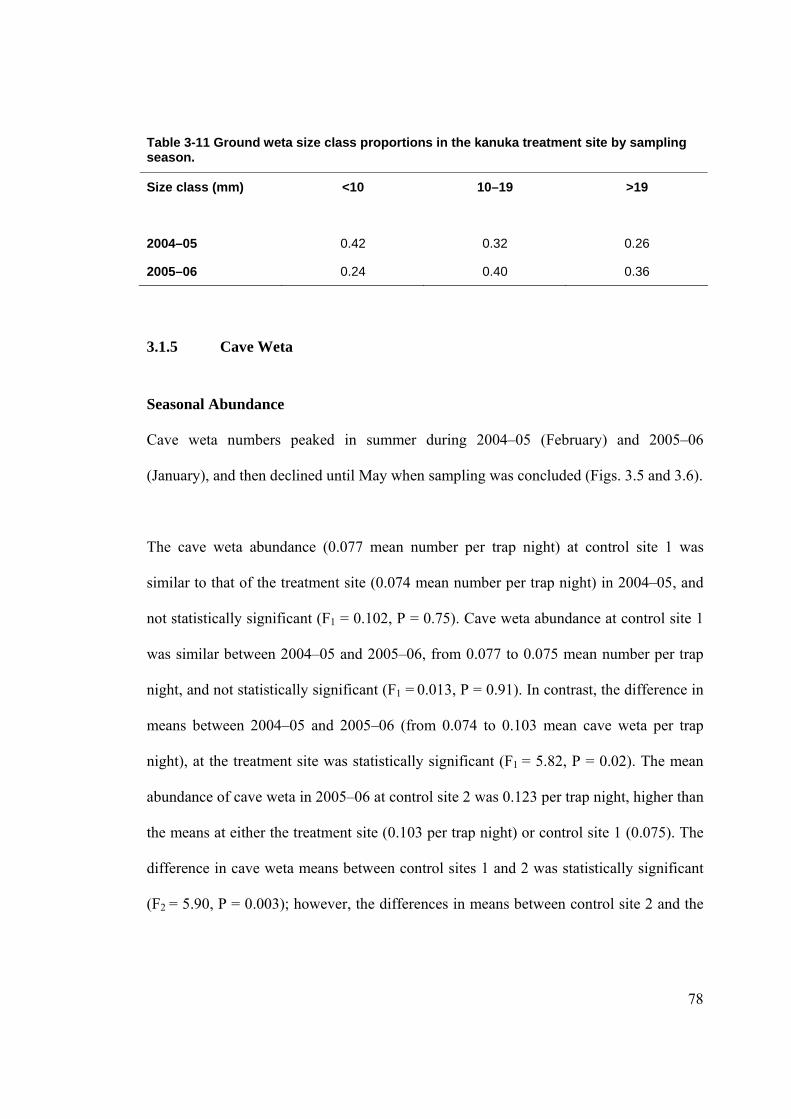
78
Table 3-11 Ground weta size class proportions in the kanuka treatment site by sampling season.
Size class (mm) <10 10–19 >19
2004–05 0.42 0.32 0.26
2005–06 0.24 0.40 0.36
3.1.5 Cave Weta
Seasonal Abundance Cave weta numbers peaked in summer during 2004–05 (February) and 2005–06
(January), and then declined until May when sampling was concluded (Figs. 3.5 and 3.6).
The cave weta abundance (0.077 mean number per trap night) at control site 1 was
similar to that of the treatment site (0.074 mean number per trap night) in 2004–05, and
not statistically significant (F1 = 0.102, P = 0.75). Cave weta abundance at control site 1
was similar between 2004–05 and 2005–06, from 0.077 to 0.075 mean number per trap
night, and not statistically significant (F1 = 0.013, P = 0.91). In contrast, the difference in
means between 2004–05 and 2005–06 (from 0.074 to 0.103 mean cave weta per trap
night), at the treatment site was statistically significant (F1 = 5.82, P = 0.02). The mean
abundance of cave weta in 2005–06 at control site 2 was 0.123 per trap night, higher than
the means at either the treatment site (0.103 per trap night) or control site 1 (0.075). The
difference in cave weta means between control sites 1 and 2 was statistically significant
(F2 = 5.90, P = 0.003); however, the differences in means between control site 2 and the

79
treatment site, and between the treatment site and control site 1 were not statistically
significant (Tukey test).
0.00
0.05
0.10
0.15
0.20
0.25
0.30
Dec Jan Feb Mar Apr May
Month
Mea
n no
. / tr
ap n
ight
TreatmentControl 1
Figure 3-5 Mean cave weta abundance in kanuka during 2004–05 by site (+/- SE).

80
0.00
0.05
0.10
0.15
0.20
0.25
0.30
Dec Jan Feb Mar Apr May
Month
Mea
n no
. / tr
ap n
ight
TreatmentControl 1Control 2
Figure 3-6 Mean cave weta abundance in kanuka during 2005–06 by site (+/- SE).
Trapped Cave Weta Size Classes The frequencies of size classes 15–19 mm, and >20 mm were combined because there
were insufficient captures in the >20 mm size class for statistical comparisons (these size
class frequencies were also combined for the podocarp-broadleaf, and taraire results).
Treatment site and control site 1 2004–05
There was no significant relationship between cave weta size classes and site (Chi-square
= 0.53, P = 0.77) (Table 3.12).

81
Table 3-12 Cave weta size class proportions in kanuka by site.
Size class (mm) <10 10–14 >14
Treatment site 0.72 0.24 0.04
Control site 1 0.71 0.24 0.05
Treatment site 2004–05 and 2005–06
There was no significant relationship between cave weta size classes and sampling
season (Chi-square = 1.40, P = 0.24) (Table 3.13)
Table 3-13 Cave weta size class proportions in kanuka treatment by sampling season.
Size class (mm) <10 10–14 >14
2004–05 0.72 0.24 0.04
2005–06 0.68 0.26 0.06
Control site 1 2004–05 and 2005–06
There was no significant relationship between cave weta size classes and sampling
season (Chi-square = 1.89, P = 0.39) (Table 3.14).
Table 3-14 Cave weta size class proportions in kanuka control site 1 by sampling season.
Size class (mm) <10 10–14 >14
2004–05 0.71 0.24 0.05
2005–06 0.76 0.20 0.04

82
Treatment site, control sites 1 and 2, 2005–06
There was a statistically significant relationship between cave weta size classes and site
(Chi-square =12.85, P = 0.01). For example, there was a small proportion of cave weta
in the <10 mm size class at the treatment site, whereas, there was a large proportion of
cave weta in the 10–14 mm size class. Furthermore, there were small proportions of cave
weta in the 10–14 mm size class at control site 2, and the >14 mm size class at the
control site 1 (Table 3.15).
Table 3-15 Cave weta size class proportions in kanuka by site.
Size class (mm) <10 10–14 >14
Treatment site 0.68 0.26 0.06
Control site 1 0.76 0.20 0.04
Control site 2 0.78 0.17 0.05
3.1.6 Carabid Beetles
Seasonal Abundance In 2004–05 there were two peaks of seasonal abundance at the treatment site, a large one
in January and a small one in May, but only one at control site 1 (Fig. 3.7). In 2005–06
there were two peaks of seasonal abundance at the treatment site; however, in contrast to
2004–05, the smaller peak was in January and the larger one in May. Similarly, at control
sites 1 and 2 there were also two peaks of abundance in 2005–06, although the difference
between the peaks was very small.
83
At the treatment site the overall mean number of carabid beetles per trap night increased
from 0.070 to 0.138 between 2004–05 and 2005–06, and this increase was statistically
significant, (F1 = 11.92, P = 0.001). Over the same time period at control site 1, whilst
there was an increase in means from 2004–05 to 2005–06 (0.053 to 0.062), this increase
was not statistically significant (F1 = 0.353, P = 0.558).
The overall mean number of carabids per trap night at the treatment site for 2004–05 was
greater than that of control site 1 (0.07 and 0.06 respectively); however, this difference
was not statistically significant (F1 = 2.15, P = 0.14). The overall mean number of
carabids per trap night at the treatment site (0.138) for 2005–06 was significantly greater
than those of control site1 (0.059) and control site 2 (0.050), over the same time period
(F2 = 29.75, P <0.001), whereas, the difference in means between control sites 1 and 2
was not statistically significant (Tukey test). Furthermore, the monthly means for control
sites 1 and 2 were very similar (Fig.3.8).

84
0.00
0.05
0.10
0.15
0.20
0.25
0.30
0.35
Dec Jan Feb Mar Apr May
Month
Mea
n no
/ tra
p ni
ght
TreatmentControl 1
Figure 3-7 Mean carabid abundance in kanuka during 2004–05 (+/- SE).
0.00
0.05
0.10
0.15
0.20
0.25
0.30
0.35
Dec Jan Feb Mar Apr May
Month
Mea
n no
. / tr
ap n
ight
Treatment Control 1Control 2
Figure 3-8 Mean carabid abundance in kanuka during 2005–2006 (+/- SE).

85
Trapped Carabid Beetle Size Classes Kanuka treatment site 2004–06 There was a statistically significant relationship between size classes and sampling
season (Chi-square = 64.40, P <0.001). In 2004–05, there was a large proportion of
carabid beetles in the 10–14 mm size class, and a small proportion in the 15–19 mm size
class, whereas, in 2005–06 the opposite applied. Also, in 2004–05 there was a large
proportion of carabids in the >24 mm size class, but in 2005–06 the proportion of
carabids in this size class was less. The number of carabid beetles captured in the 2004–
05 trapping season in the 20–24 mm size class was too low for statistical comparisons to
be made (Table 3.16).
Table 3-16 Carabid beetle size class proportions in kanuka treatment by sampling season.
Size class (mm) 10–14 15–19 20–24 >24
2004–05 0.34 0.36 0.00 0.30
2005–06 0.13 0.64 0.02 0.21
Kanuka control site 1 in 2004–06 There was a statistically significant relationship between size classes and sampling
season (Chi-square = 12.29, P = 0.006). In particular, the proportion of carabids in the
15–19 mm size class increased over the two sampling seasons. In contrast, the frequency
of the >24 mm size class declined. The number of carabid beetles trapped in the 20–24
mm size class, in 2004–05, was too low for meaningful comparisons to be made (Table
3.17).
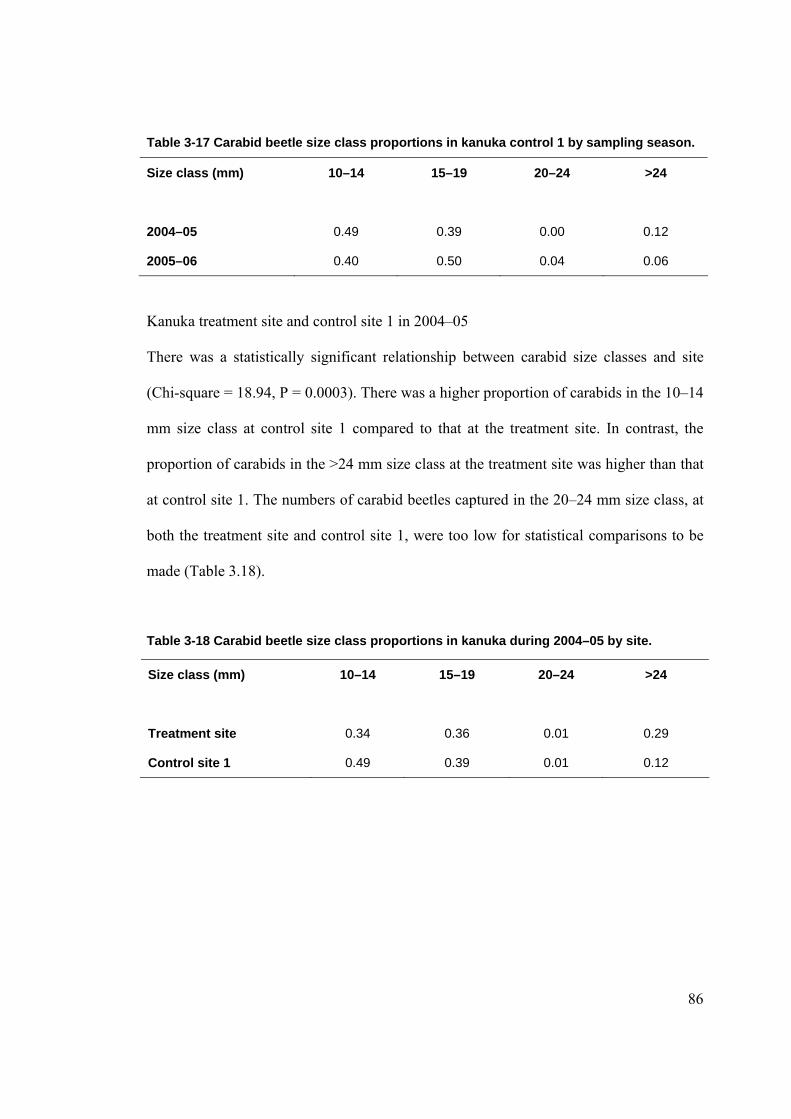
86
Table 3-17 Carabid beetle size class proportions in kanuka control 1 by sampling season.
Size class (mm) 10–14 15–19 20–24 >24
2004–05 0.49 0.39 0.00 0.12
2005–06 0.40 0.50 0.04 0.06
Kanuka treatment site and control site 1 in 2004–05
There was a statistically significant relationship between carabid size classes and site
(Chi-square = 18.94, P = 0.0003). There was a higher proportion of carabids in the 10–14
mm size class at control site 1 compared to that at the treatment site. In contrast, the
proportion of carabids in the >24 mm size class at the treatment site was higher than that
at control site 1. The numbers of carabid beetles captured in the 20–24 mm size class, at
both the treatment site and control site 1, were too low for statistical comparisons to be
made (Table 3.18).
Table 3-18 Carabid beetle size class proportions in kanuka during 2004–05 by site.
Size class (mm) 10–14 15–19 20–24 >24
Treatment site 0.34 0.36 0.01 0.29
Control site 1 0.49 0.39 0.01 0.12

87
Kanuka treatment site, control site 1 and control site 2 in 2005–06
There was a significant relationship between carabid size classes and site (Chi-square =
124.49, P < 0.0001). The proportion of carabids in the 10–14 mm size class was smaller
at the treatment site than that at control site 1. In the 15–19 mm size class, the proportion
of carabids was higher at the treatment site compared to that at control site 2. There were
a much lower proportion of carabids (in the > 24mm size class) at control site 1 than at
the treatment site or control site 2 (Table 3.19).
Table 3-19 Carabid size class proportions in kanuka during 2005–06 by site.
Size class (mm) 10–14 15–19 20–24 >24
Treatment site 0.13 0.64 0.02 0.21
Control site 1 0.40 0.50 0.04 0.06
Control site 2 0.20 0.37 0.04 0.39
3.1.7 Prowling Spiders
Seasonal Abundance There was a similar pattern of monthly abundance for prowling spiders in 2004–05 and
2005–06, with peak abundance either in February (control site 1 and 2) or March
(treatment site), followed by a decline until sampling was concluded in May (Figs. 3.9
and 3.10). However, in contrast to 2005–06, in 2004–05 there was another, smaller peak
in numbers of prowling spiders, at the treatment site (in May), and at control site 1 (in
April).

88
At the treatment site prowling spider abundance increased from 2004–05 (0.052 per trap
night) to 2005–06 (0.060 per trap night); however, this mean difference was not
statistically significant (F1 =1.26, P = 0.26). Likewise prowling spider abundance
increased from 2004–05 (0.048 per trap night) to 2005–06 (0.065 per trap night) at
control site 1, and furthermore this mean difference was statistically significant (F1 =
4.71, P = 0.04). In 2005–06 the mean number per trap night at the treatment site (0.060)
was less than either control site 1 (0.065) or control site 2 (0.074), but these mean
differences were not statistically significant (F2 = 1.22, P = 0.30).
0.00
0.02
0.04
0.06
0.08
0.10
0.12
0.14
0.16
0.18
0.20
Dec Jan Feb Mar Apr May
Month
Mea
n no
. / tr
ap n
ight
TreatmentControl 1
Figure 3-9 Mean prowling spider abundance in kanuka during 2004–2005 (+/-SE).

89
0.00
0.02
0.04
0.06
0.08
0.10
0.12
0.14
0.16
0.18
0.20
Dec Jan Feb Mar Apr May
Month
Mea
n no
. / tr
ap n
ight
TreatmentControl 1Control 2
Figure 3-10 Mean prowling spider abundance in kanuka during 2005–2006 (+/- SE).
Trapped Prowling Spider Size Classes
Treatment site and control site 1 2004–05
The majority of prowling spiders captured were in the <11 mm size class with few
captures in the >20 mm class (Table 3.20). There was no significant relationship between
prowling spider size classes and site (Chi-square = 1.10, P = 0.58).
Table 3-20 Prowling spider size class proportions in kanuka during 2004–05 by site.
Size class (mm) <11 11–20 >20
Treatment site 0.75 0.21 0.04
Control site 1 0.73 0.25 0.02
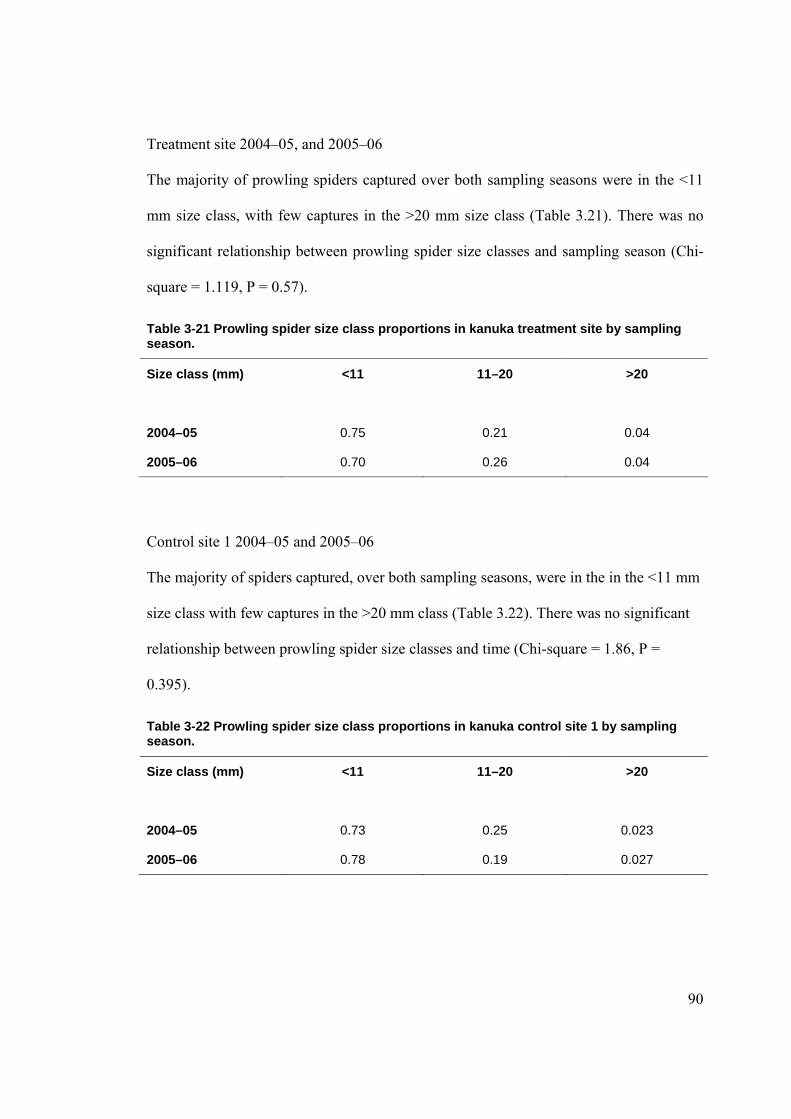
90
Treatment site 2004–05, and 2005–06 The majority of prowling spiders captured over both sampling seasons were in the <11
mm size class, with few captures in the >20 mm size class (Table 3.21). There was no
significant relationship between prowling spider size classes and sampling season (Chi-
square = 1.119, P = 0.57).
Table 3-21 Prowling spider size class proportions in kanuka treatment site by sampling season.
Size class (mm) <11 11–20 >20
2004–05 0.75 0.21 0.04
2005–06 0.70 0.26 0.04
Control site 1 2004–05 and 2005–06
The majority of spiders captured, over both sampling seasons, were in the in the <11 mm
size class with few captures in the >20 mm class (Table 3.22). There was no significant
relationship between prowling spider size classes and time (Chi-square = 1.86, P =
0.395).
Table 3-22 Prowling spider size class proportions in kanuka control site 1 by sampling season.
Size class (mm) <11 11–20 >20
2004–05 0.73 0.25 0.023
2005–06 0.78 0.19 0.027

91
Treatment site, Control sites 1 and 2 The majority of prowling spiders captured at all three sites were in the <11 mm size
class, with few captures in the >20 mm size class (Table 3.23). There was no significant
relationship between prowling spider size classes and site (Chi-square = 8.62, P = 0.07).
Table 3-23 Prowling spider size class proportions in kanuka during 2005–06 by site.
Size class (mm) <11 11–20 >20
Treatment site 0.70 0.26 0.04
Control site 1 0.78 0.19 0.03
Control site 2 0.76 0.23 0.01
3.1.8 Kanuka Forest Results Summary Physical Site Characteristics • The treatment site and control site 1 had similar physical site characteristics, in
contrast to control site 2, which had some different physical characteristics.
Vegetation
• The total number of plant species at each site was similar.
Groundcover
• At control site 1, there was a greater proportion of bare ground and a smaller
proportion of woody material than at either the treatment site or control site 2.

92
Rodents
• Rodents were more abundant at the control sites than at the treatment site during
2005–06 (although not significantly lower at control site 1), and furthermore, the
average annual rodent tracking indices for 2002–06 were much lower than those
of the control sites for 2005–06.
Ground Weta
• Ground weta numbers peaked in January in both sampling seasons.
• Ground weta were more abundant at the treatment site in 2005–06 than at either
of the control sites (P = 0.008)
• Ground weta abundances did not increase significantly at the treatment and the
control 1 sites over the two years that they were sampled (P = 0.17 and P = 0.39
respectively). The difference in abundance at the treatment and control 1 site in
2004–05 was not significant (P = 0.09).
• There was a higher proportion of small ground weta at the control sites and a
higher proportion of large ground weta at the treatment site in 2004–06 (P =
0.007).
Cave Weta
• Cave weta abundance peaked in January–February and then declined over both
sampling seasons.
• The difference of cave weta abundance at the control 1site from 2004–06 was not
significant (P = 0.91).

93
• There was a significant increase in cave weta abundance from 2004–05 to 2005–
06 at the treatment site (P = 0.02).
• There was no significant difference in the cave weta abundances when the
treatment site was compared with the control 1 and control 2 sites during 2005–
06.
• The cave weta abundance at the control 2 site in 2005–06 was significantly
greater than that of the control 1 site (P = 0.003).
• In 2005–06, there was a greater proportion of large cave weta at the treatment site
than either of the control sites, and conversely, a lower proportion of small cave
weta than at either of the control sites (P = 0.01).
Carabid Beetles
• There were two peaks in carabid beetle abundance in both sampling seasons they
were sampled.
• There was a significant increase in carabid beetle abundance at the treatment site
from 2004–05 to 2005–06 (P = 0.001). In 2005–06, there was a greater
abundance of carabid beetle at the treatment site, compared to either control site 1
or 2, (P = < 0.001).
• The difference in the means of carabid beetles at the treatment and control 1 sites
during 2004–5 was not significant (P = 0.14).
• The difference in means of the carabid beetles at the control 1 site from 2004–05
to 2006–06 was not significant (P = 0.558).
94
• There were significant relationships between carabid beetle size class, site and
sampling season.
Prowling Spiders
• Prowling spider numbers peaked in February–March and then declined in both
sampling seasons.
• There were no significant differences in the abundances of prowling spiders in the
treatment area over the time period 2004–06 (P = 0.26).
• The increase in abundance of prowling spiders at the control 1 site over the 2004–
5 and the 2005–6 sampling periods was significant ( P = 0.04).
• The differences in the abundances, of prowling spiders, at the treatment, control 1
and the control 2 sites, during the 2005–06 sampling period, were not significant (
P = 0.30).
• There were no significant relationships between prowling spider size classes, site
and sampling season.

95
3.2 PODOCARP-BROADLEAF FOREST
3.2.1 Study Site Physical Characteristics
The physical site characteristics of aspect, drainage, and mean soil depth were similar at
all sites, whereas, the canopy height at control site 2 was greater than that of either the
treatment site or control site 1, and control site 1 had some steeper pitfall trap sites (Table
3.24).
Table 3-24 Comparison of site characteristics at podocarp-broadleaf.
Characteristics Aspect Slope Drainage Canopy height
Mean Soil depth
Treatment site SW–NW 5°–30° Good 8 –12 m >1.1 m
Control site 1 SW–NW 5°–45° Good 5 –12 m >1.1 m
Control site 2 SW–NW 5°–30° Good 10 –20 m >1.1 m
3.2.2 Vegetation Monitoring
Ground cover
The ground cover categories of vegetation, moss, fern, and rock were not used because
they occurred in frequencies that were too low for statistical comparisons to be made.
There was no significant relationship between ground cover category and site (Chi-
square = 5.52, P = 0.48) (Table 3.25).

96
Table 3-25 Proportion of ground cover in podocarp-broadleaf by site.
Ground Cover Category Leaf litter Tree roots Bare soil Dead wood
Treatment site 0.82 0.06 0.01 0.11
Control site 1 0.81 0.03 0.03 0.13
Control site 2 0.84 0.05 0.01 0.10
Canopy cover
The treatment site and control site 1 contained similar numbers of plant species, in
contrast to control site 2, which contained far fewer plant species, especially in tiers 3
and 5 (Table 3.26).
Table 3-26 Number of plant species in different height tiers in podocarp-broadleaf by site.
Tier number 1 ( >25 m)
2 (12–25 m)
3 (5–12 m)
4 (2–5 m)
5 (0.3–2 m) Totals
Treatment site 0 5 22 22 25 74
Control site 1 0 4 18 29 22 73
Control site 2 0 7 12 25 15 59

97
3.2.3 Rodent Monitoring
Rats Before pitfalls were established
Rodent monitoring has been carried out five times in the LTFERP, between December
2003 and May 2005 in line 10, which contains 10 tracking tunnels and runs through
podocarp-broadleaf forest. The mean tracking index during this time period was 6% (+/-
SE = 3.4).
After pitfalls were active
There were high tracking indices of rats at both control sites, for each monitoring event,
in contrast to the treatment site, where rat tracking indices remained low during each
monitoring event (Table 3.27 and Fig 3.11). The abundance of rats at the treatment site
was statistically significantly lower than those of control site 1 (Mann-Whitney U = 840,
P <0.001), and 2 (Mann-Whitney U = 914.5, P <0.001) during 2005–06.
Table 3-27 Rat tracking indices in podocarp-broadleaf during 2005–06.
Month Nov Mar Oct Mean S E
Treatment site 0 10 0 3.33 3.33
Control site 1 70 90 100 86.7 6.31
Control site 2 100 100 100 100 0

98
0%
10%
20%
30%
40%
50%
60%
70%
80%
90%
100%M
ean
rat t
rack
ing
inde
x
TreatmentControl 1Control 2
Figure 3-11 Mean rat tracking indices in podocarp-broadleaf during 2005–06 by site (+/- SE).
Mice
Before pitfall traps were established
There were no mice footprints, on any of the tracking cards used for the five rodent
monitoring events in line 10, between December 2003 and May 2005.
After pitfalls were active
The mice tracking indices were much lower at the treatment site and control site 1,
compared to that of control site 2, and furthermore the mouse tracking index at the
treatment site was less than the target value of 5% (Table 3.28).

99
Table 3-28 Mice tracking indices in podocarp-broadleaf during 2005–06.
Month Nov Mar Oct Mean SE
Treatment site 0 10 0 3.33 3.33
Control site 1 0 10 0 3.33 3.33
Control site 2 0 20 30 13.3 6.3
3.2.4 Ground Weta
Ground weta were trapped in very low numbers in podocarp-broadleaf throughout the
December–May pitfall trapping season; for example, a total of eight ground weta were
trapped at the treatment site, zero at control site 1, and two at control site 2.
3.2.5 Cave Weta
Seasonal Abundance
The pattern of monthly abundance was very similar at all three sites, with peak
abundance in January, followed by a decline in numbers until sampling concluded in
May, 2006 (Fig. 3.12). The overall mean number per trap night, for cave weta at the
treatment site, was higher than those of control site 1 and control site 2 (0.093 compared
to 0.076 and 0.071 respectively). Furthermore, the monthly means for control sites 1 and
2 were very similar (Fig. 3.12). However, the differences between the means at the
treatment, control 1 and control 2 sites were not statistically significant (F2 = 1.91, P =
0.16).

100
0.00
0.05
0.10
0.15
0.20
0.25
Dec Jan Feb Mar Apr May
Month
Mea
n no
. / tr
ap n
ight
TreatmentControl 1Control 2
Figure 3-12 Mean cave weta abundance in podocarp-broadleaf during 2005–06 (+/- SE).
Trapped Cave Weta Size Classes
The original 15–19 mm and the 20–24 mm size classes were combined to form a >14
mm size class, because there were insufficient captures in the 20–24 mm size class for
statistical comparisons.
There was a statistically significant relationship between cave weta size classes and site
(Chi-square = 9.98, P = 0.04). In particular, there was a greater proportion of cave weta
in the >14 mm size class, at the treatment site, than at each of the two control sites (Table
3.29).

101
Table 3-29 Cave weta size class proportions in podocarp-broadleaf during 2005-06 by site.
Size class (mm) 4–9 10–14 >14
Treatment site 0.59 0.29 0.12
Control site 1 0.65 0.29 0.06
Control site 2 0.62 0.32 0.06
3.2.6 Carabid Beetles
Seasonal Abundance The treatment site had a small peak in numbers in January and a larger one in May;
similarly, control site 1 also had a peak in numbers in May (Fig. 3.13). In contrast, at
control site 2 the peak abundances were much earlier, in January and February (Fig.
3.13). The means of January, April and May at the treatment site, and those of April and
May at control site 1, had large standard errors, because in these months there was large
variation in trap captures. For example, in May at the treatment site, trap B4 captured 21
carabid beetles, whereas trap B9 captured zero. The overall mean number per trap night
(0.145) was greater at the treatment site than that of either control site 1 (0.104) or
control site 2 (0.100). The treatment site mean was significantly greater than those of
either control site 1 or control site 2 (F2 = 4.3, P = 0.01). In contrast, the difference
between the means of control site 1 and control site 2 was not statistically significant
(Tukey test).

102
0.00
0.05
0.10
0.15
0.20
0.25
0.30
0.35
Dec Jan Feb Mar Apr May
Month
Mea
n no
. / tr
ap n
ight
TreatmentControl 1Control 2
Figure 3-13 Mean carabid abundance in podocarp-broadleaf during 2005–2006 (+/- SE).
Trapped Carabid Beetle Size Classes
There was a statistically significant relationship between carabid beetle size classes and
site (Chi-square = 106.44, P <0.0001). In particular, there was a larger proportion of
carabid beetles in the >24 mm size class at the treatment and control 1 sites, compared
with the control 2 site. Also there was a small proportion of carabids in the 15–19 mm
size class at control site 2, whereas, there was a large proportion of this size class at the
treatment site and control site 1 (Table 3.30).

103
Table 3-30 Carabid beetle size class proportions in podocarp-broadleaf during 2005–06 by site.
Size class (mm) 10–14 15–19 20–24 >24
Treatment site 0.16 0.56 0.12 0.16
Control site 1 0.14 0.58 0.11 0.17
Control site 2 0.17 0.34 0.07 0.42
3.2.7 Prowling Spiders
Seasonal Abundance
The patterns of abundance for prowling spiders were very similar at all sites, with
increasing monthly means until January (control site 2) or February (treatment site and
control site 1), and then generally declining monthly thereafter, until sampling concluded
in May 2006 (Fig 3.14). In most months, except for February when the monthly mean
was much greater at the control site 1, the means for control sites 1 and 2 were very
similar (Fig. 3.14). In all months, the mean numbers per trap night were greater at the
treatment site than either of the control sites (Fig. 3.14). The overall mean number of
prowling spiders per trap night at the treatment site was greater than either of those for
the control sites: 0.104, compared with 0.065 and 0.074 for control sites 1 and 2
respectively. The treatment site mean was significantly greater than that for either of the
control sites (F2 = 8.17, P = 0.0003). In contrast, the difference between the means of
control sites 1 and 2 was not statistically significant (Tukey test).

104
0.00
0.05
0.10
0.15
0.20
0.25
0.30
Dec Jan Feb Mar Apr May
Month
Mea
n no
. / tr
ap n
ight
TreatmentControl 1Control 2
Figure 3-14 Mean prowling spider abundance in podocarp-broadleaf during 2005–06 (+/-SE).
Trapped Prowling Spider Class Sizes
There was no significant relationship between prowling spider size classes and sites
during the 2005–06 sampling season (Chi-square = 7.17, P = 0.127) (Table 3.31).
Table 3-31 Prowling spider size class proportions in podocarp-broadleaf during 2005–06 by site.
Size class (mm) <11 11–20 >20
Treatment site 0.77 0.20 0.03
Control site 1 0.84 0.15 0.01
Control site 2 0.82 0.16 0.02

105
3.2.8 Podocarp-Broadleaf Results Summary
Physical Site Characteristics
• All three sites had similar aspect, drainage and mean soil depth characteristics.
However, control site 1 had some steeper pitfall trap sites, and control site 2 some
areas with a higher canopy.
Vegetation
• There was no significant relationship between site and ground cover category.
• The treatment and control site1 contained a similar number of plant species in
contrast to control site 2, which contained fewer plant species.
Rodents
• The abundance of rats was much less at the treatment site than either of the
control sites.
• The abundance of mice was greater at control site 2 than that of either the
treatment site or control site 1.
Ground Weta
• Ground weta occurred in very low abundance in all the podocarp-broadleaf sites.

106
Cave Weta
• The abundance of ground weta was similar at the treatment site and the control
sites (P = 0.16).
• The frequency of larger cave weta was greater at the treatment site than either of
the control sites (P = 0.04)
Carabid Beetles
• Carabid beetles were more abundant at the treatment site than either of the control
sites (P = 0.01).
• There was a significant relationship between carabid beetle size class and site (P
= 0.0001). Control site two had the biggest proportion of the largest carabid
beetle size class.
Prowling Spiders
• There was a greater abundance of prowling spiders at the treatment site than
either of the control sites (P = 0.0003).
• There was no significant relationship between prowling spider size class and site
(P = 0.127).

107
3.3 TARAIRE FOREST
3.3.1 Study Site Physical Characteristics
The treatment site and control site 1 had similar physical characteristics of slope, canopy
height and mean soil depth; however, the treatment and control 2 sites had a southerly
aspect, whereas the control site 1 had a northerly aspect (Table 3.32). All three sites had
similar drainage, whereas, control site 2 had less soil depth and was steeper than the
other two sites (Table 3.32).
Table 3-32 Comparison of site characteristics in taraire.
Characteristic Aspect Slope Drainage Canopy height
Mean soil depth
Treatment site SE 5°–30° Good 10–20 m >1.1 m
Control site 1 NW 5°–30° Good 10–20 m >1.1 m
Control site 2 SE 30°–40° Good 15–20 m 0.42 m
3.3.2 Vegetation Assessment
Ground Cover The ground cover categories of vegetation, moss, fern, and rock were not used because
they occurred in proportions that were too low for statistical comparisons to be made.
There was a statistically significant relationship between ground cover category
proportions and site (Chi-square = 24.39, P = 0.0004). In particular, the proportion of

108
bare soil at control site 2 was greater than the other two sites, whereas the proportion of
bare soil at the treatment site was lower than the other two sites. Furthermore, the
proportion of dead wood at control site 2 was smaller than the other two sites, whereas
the proportion of dead wood at the treatment site was higher than the two control sites
(Table 3.33).
Table 3-33 Proportion of ground cover categories in taraire by site.
Ground Cover Category Leaf litter Tree roots Bare soil Dead wood
Treatment site 0.84 0.03 0.01 0.12
Control site 1 0.86 0.03 0.03 0.08
Control site 2 0.88 0.01 0.07 0.04
Canopy Cover Control site 1 contained a much greater variety of plant species than either the treatment
site or control site 2; furthermore, the variety of plant species present at the treatment site
was greater than that of control site 2 (Table 3.34). When comparing the treatment site
and control site 1, tiers three and four at control site 1 contained four and ten more
species respectively, whereas, tiers two and five contained approximately the same
number of species (Table 3.34). Control site 2 had fewer species in all tiers than either
the treatment site or control site 1.

109
Table 3-34 Number of plant species in different height tiers in taraire by site.
Tier number 1 ( >25 m)
2 (12–25 m)
3 (5–12 m)
4 (2–5 m)
5 (0.3–2 m) Totals
Treatment site 0 6 9 14 19 48
Control site 1 0 5 13 24 19 61
Control site 2 0 1 9 7 8 25
3.3.3 Rodent Monitoring
Rats 2002–05 Monitoring With the exception of 2004, when only one rodent monitoring was carried out, the annual
rat tracking indices in taraire forest at the LTFERP, for the time period 2002–05, were
higher than that of 2005–06 at the treatment site (Tables 3.35 and 3.36). However, high
tracking indices in September 2002, July 2003, May 2005 and July 2005 inflated the
annual indices for these sampling seasons (Table 3.35), and all the other months when rat
monitoring occurred had 0% to 10% tracking indices.
2005-06 Monitoring The rat tracking index for the treatment site was much lower than that of either control
site 1 or 2, during the 2005–06 pitfall trapping season; in addition, the rat tracking index
for control site 2 was much greater than that for control site 1 over the same time period
(Fig. 3.15). The abundance of rats at the treatment site was significantly lower than those
of control site 1 (Mann-Whitney U = 600, P = 0.026), and control site 2 (Mann-Whitney

110
U = 736.6, P <0.00l). There was a similar pattern of tracking indices over the times that
rat monitoring was carried out at control sites 1 and 2, with higher rat tracking indices
during March 2006 and October 2006, than in November 2005 (Table 3.36). In contrast,
the rat tracking indices at the treatment site were low, and varied less during the three
monitoring events (Table 3.36).
Table 3-35 Rat tracking indices in taraire by year.
Month Jan Mar May Jul Aug Sep Oct Nov Dec Mean SE
2002 * * * 10 0 50 * 0 * 15 5.7
2003 10 10 0 80 * * 10 * 0 18 5
2004 * * * * * * * 0 * 0 0
2005 0 * 40 20 * * * * * 20 7.4
Table 3-36 Rat tracking indices in taraire during 2005–06 by site.
Month Nov Mar Oct Mean SE
Treatment site 20 10 10 13.3 6.30
Control site 1 20 60 50 43.3 9.20
Control site 2 40 100 100 80 7.66

111
0%
10%
20%
30%
40%
50%
60%
70%
80%
90%
100%M
ean
trac
king
inde
x
TreatmentControl 1Control 2
Figure 3-15 Mean rat tracking indices in taraire during 2005–2006 (+/- SE).
Mice 2002–05 Monitoring Between 2002 and 2005 there were no mice footprints on the tracking cards used to
monitor rodent tracking lines in taraire forest in the LTFERP.
2005–06 Monitoring
Mice were not detected at the treatment site or control site 1 during any of the rodent
monitoring done during 2005–06 (Table 3.37). However, a relatively high tracking index
of 40% occurred in the March 2006 rodent monitoring at control site 1, in contrast to

112
those done in November 2005 and October 2006 when no mice were detected (Table
3.37).
Table 3-37 Mice tracking indices of in taraire during 2005–06 by site.
Month Nov Mar Oct Mean S E
Treatment site 0 0 0 0 0
Control site 1 0 40 0 13.3 0.06
Control site 2 0 0 0 0 0
3.3.4 Ground Weta
Ground weta occurred in very low abundance at the taraire sites during the 2005–06
sampling season. For example, no ground weta were trapped at the treatment site and
control site 1, and only four at control site 2.
3.3.5 Cave Weta
Seasonal Abundance
In all three sites, there was a similar pattern in the mean number per trap night over time,
with higher numbers over the summer months (December–February), followed by a
general decline in numbers during autumn (March–May) (Fig. 3.16). However, the
monthly totals for the treatment site and control site 1 were greater than those of control
site 2, and the monthly totals for control site 1, except for May, were greater than those
for the treatment site. The overall mean number per trap night for the treatment site,

113
control site 1 and control site 2 were: 0.048, 0.094 and 0.020 respectively, and there were
significantly more cave weta trapped at control site 1, than either of control site 2 or the
treatment site, and significantly more trapped at the treatment site than control site 2
(Kruskal-Wallis test, P <0.0001).
0.00
0.05
0.10
0.15
0.20
0.25
Dec Jan Feb Mar Apr May
Month
Mea
n no
. / tr
ap n
ight
TreatmentControl 1Control 2
Figure 3-16 Mean cave weta abundance in taraire during 2005–2006 (+/- SE).
Trapped Cave Weta Size Classes
The original 15–19 mm and the 20–24 mm size classes were combined to form a >14
mm size class, because there were insufficient captures in the 20–24 mm size class for
statistical comparisons. There was no significant relationship between cave weta size
class and site (Chi-square = 3.88, P = 0.42) (Table 3.38).

114
Table 3-38 Cave weta size class proportions in taraire 2005–06 by site.
Size class (mm) 4–9 10–14 >14
Treatment site 0.60 0.30 0.10
Control site 1 0.59 0.32 0.07
Control site 2 0.51 0.40 0.09
3.3.6 Carabid Beetles Seasonal Abundance The trends in mean number of carabid beetles per trap night are very similar at the
treatment site and control site 1, with numbers of carabid beetles remaining relatively
low until March and then increasing suddenly, with a peak in numbers in May (Fig 3.17).
In contrast, at control site 2, numbers of carabid beetles peaked in December, and then
generally declined until sampling concluded in May 2006. The overall mean number of
carabids per trap night, for the treatment site (0.132), was greater than that of either
control site 1 (0.122) or control site 2 (0.083), however, these differences were not
statistically significant (Kruskal-Wallis test, P = 0.105).
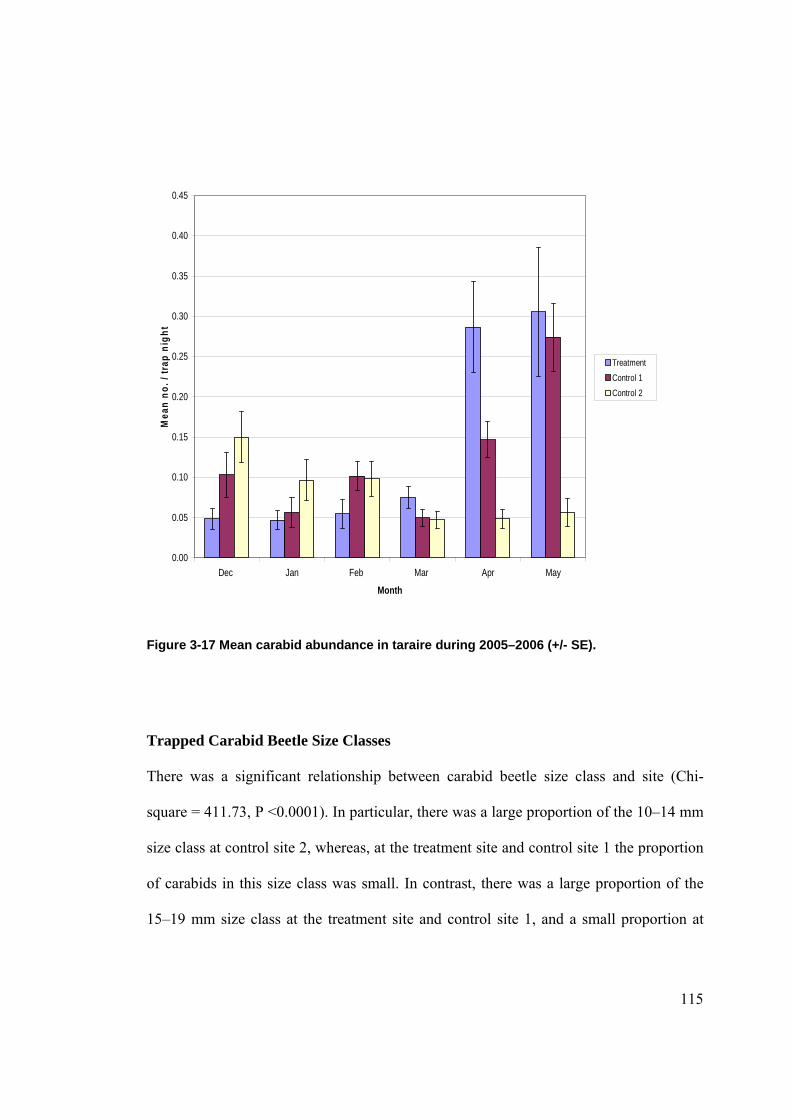
115
0.00
0.05
0.10
0.15
0.20
0.25
0.30
0.35
0.40
0.45
Dec Jan Feb Mar Apr May
Month
Mea
n no
. / tr
ap n
ight
TreatmentControl 1Control 2
Figure 3-17 Mean carabid abundance in taraire during 2005–2006 (+/- SE).
Trapped Carabid Beetle Size Classes There was a significant relationship between carabid beetle size class and site (Chi-
square = 411.73, P <0.0001). In particular, there was a large proportion of the 10–14 mm
size class at control site 2, whereas, at the treatment site and control site 1 the proportion
of carabids in this size class was small. In contrast, there was a large proportion of the
15–19 mm size class at the treatment site and control site 1, and a small proportion at

116
control site 2. At the treatment site, the proportion of the >24 mm size class was larger
than that at control sites 2. At control site 1, the proportion of the >24 mm size class was
greater than those of the treatment site and control site 2. At control site 2, only one
carabid beetle in this size class was trapped over the entire sampling season (Table 3.39).
Table 3-39 Carabid beetle size class proportions in taraire during 2005–06 by site.
Size class (mm) 10–14 15–19 20–24 25–34
Treatment site 0.12 0.75 0.08 0.05
Control site 1 0.24 0.53 0.03 0.20
Control site 2 0.71 0.26 0.02 0.003

117
3.3.7 Prowling Spiders
Seasonal abundance The monthly abundance pattern was similar at all three sites, with peaks in February, at
the treatment site and control site 2, and January at control site 1, followed by a decline
in numbers until May, when sampling concluded (Fig. 3.18). The overall mean number
of prowling spiders per trap night was greater at control site 1 than those at control site 2
and the treatment site (0.083, 0.057, and 0.043 respectively). Furthermore, the
differences in means between control site 1 and control site 2, and between control site 1
and the treatment site were significant (F2 = 15.05, P <0.0001). In contrast, the difference
between the means of the treatment site and control site 2 was not statistically significant
(Tukey test).

118
0.00
0.02
0.04
0.06
0.08
0.10
0.12
0.14
0.16
Dec Jan Feb Mar Apr May
Month
Mea
n no
. / tr
ap n
ight
TreatmentControl 1Control 2
Figure 3-18 Mean prowling spider abundance in taraire during 2005–2006 (+/- SE).
Trapped Prowling Spider Size Classes
The original 11–20 mm and the >20 mm size classes were combined to form a 10+ size
class, because there were insufficient captures in the >20 mm size class for statistical
comparisons to be made.
There was a significant relationship between prowling spider size class proportions and
site (Chi-square = 11.68, P = 0.003). The proportion of the <10 mm size class at control
site 2 was smaller than the other two sites, whereas the proportion of the 10+ mm size
class was larger than those of the other two sites. In addition, the proportion of the 10+
mm size class at control site 1 was less than the other two sites (Table 3.40).

119
Table 3-40 Prowling spider size class proportions in taraire during 2005–06 by site.
Size class (mm) <10 10+
Treatment site 0.75 0.25
Control site 1 0.80 0.20
Control site 2 0.65 0.35
3.3.8 Taraire Results Summary Physical Site Characteristics
• The treatment site and control site 1 had similar physical site characteristics with
the exception of soil depth and slope, whereas, control site 1 differed from the
treatment site in aspect only.
Vegetation Assessment
• There was a relationship between ground cover categories and site (P = 0.0004).
• Control site 1 contained a greater variety of plant species than either the treatment
site or control site 2. In addition, the variety of plant species was greater at the
treatment site than at control site 2.

120
Ground Weta
• Ground weta occurred in very low abundance in all three sites.
Cave Weta
• The abundance of cave weta was greater at control site 1 than at either the
treatment site or control site 2 (P = <000.1), moreover, the abundance of cave
weta at the treatment site was greater than at control site 2.
• There was no significant relationship between cave weta size class and site.
Carabid Beetles
• The difference in abundance of carabid beetles at the treatment site and control
sites 1 and 2 was not significant (P = 0.105).
• There was a significant relationship between carabid beetle size classes and site.
In particular there was a larger proportion of carabid beetles in the >24 mm size
class at the control site 1 (P = >0.0001).
Prowling Spiders
• The abundance of prowling spiders at control site 1 was greater than at either
control site 2 or the treatment site, and in addition, the abundance of prowling
spiders at the treatment site was greater than at control site 2 (P = <0.0001).
• There was a significant relationship between prowling spider size class and site.
In particular the proportion of larger prowling spiders was greater at control site 2
(P = 0.003).

121
Rodents
• The abundance of rats was significantly less at the treatment site than at control
sites 1 and 2 (P = 0.026 and 0.001 respectively).
• Mice were only detected at control site 1.
3.4 OVERVIEW OF ARTHROPOD ABUNDANCE AT TREATMENT SITES
Ground Weta
Ground weta appeared infrequently in pitfall traps in podocarp-broadleaf and taraire,
with a total capture of eight at the podocarp treatment site and zero at the taraire
treatment site, during the six months that the pitfall traps were active. In contrast, ground
weta were trapped frequently at kanuka sites, with a total capture of 191 at the kanuka
treatment site, during the same time period. It was noted that there was kanuka forest
directly adjoining one of the pitfall trap lines in taraire.
Carabid Beetles
Carabid beetle abundance was very similar at all three treatment, (F2 = 0.19, P = 0.83).
122
Cave Weta Kanuka and podocarp-broadleaf had similar abundance of cave weta, and the difference
of means was not significant (Tukey test). In contrast, the mean number of cave weta per
trap night in taraire was much less than in kanuka and podocarp-broadleaf, (F2 = 13.93, P
<0.001).
Prowling Spiders
The abundance of prowling spiders in podocarp-broadleaf was much greater than those
of kanuka and taraire, (F2 = 15.02, P <0.001). However, the abundance of prowling
spiders in kanuka and taraire was very similar (Tukey test).
3.5 POSSUM MONITORING
3.5.1 At the LTFERP The September 2002 possum monitoring event resulted in a zero possum count and
therefore a trap catch of 0%. Since 2002 no further possum monitoring has been done
using NPCA 2000 protocols. However, any possum footprints present on the tracking
cards were recorded during rodent monitoring events, and between late 2002 and October
2006 a total of four tracking cards had possum foot prints on them (one in October 2004,
and three in 2005 in January, February and November).
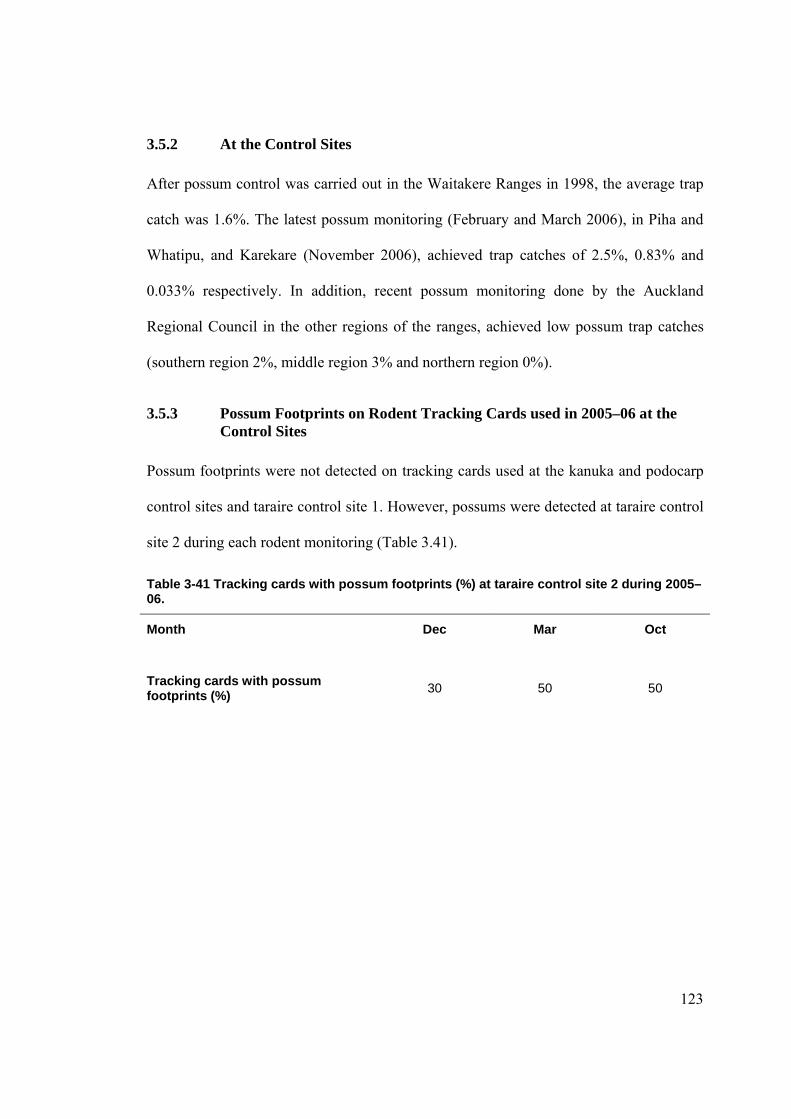
123
3.5.2 At the Control Sites After possum control was carried out in the Waitakere Ranges in 1998, the average trap
catch was 1.6%. The latest possum monitoring (February and March 2006), in Piha and
Whatipu, and Karekare (November 2006), achieved trap catches of 2.5%, 0.83% and
0.033% respectively. In addition, recent possum monitoring done by the Auckland
Regional Council in the other regions of the ranges, achieved low possum trap catches
(southern region 2%, middle region 3% and northern region 0%).
3.5.3 Possum Footprints on Rodent Tracking Cards used in 2005–06 at the Control Sites
Possum footprints were not detected on tracking cards used at the kanuka and podocarp
control sites and taraire control site 1. However, possums were detected at taraire control
site 2 during each rodent monitoring (Table 3.41).
Table 3-41 Tracking cards with possum footprints (%) at taraire control site 2 during 2005–06.
Month Dec Mar Oct
Tracking cards with possum footprints (%) 30 50 50

124
3.6 WEATHER MONITORING
3.6.1 Rainfall Data The months where the rainfall deviated greatly from average were: January 2005 (lower),
February 2006 (lower), April 2005 (lower) and April 2006 (higher) (Table 3.42)
Table 3-42 Monthly rainfall data (mm) at La Trobe Track by year. (The historical average was calculated from data collected monthly since 1995)
Month Dec Jan Feb Mar Apr May
Rainfall (mm)
Historical Average 131 106 112 106 135 164
2004–05 172 37 106 82 59 194
2005–06 110 143 21 86 246 170
3.6.2 Temperature Data The greatest difference between the mean monthly minimums is between December
2004 and December 2005, with the mean minimum temperature for 2005 being 3.8 °C
greater (Fig. 3.19). The other monthly differences varied between 0.5 °C and 1.2 °C, and
from February to May were mainly higher in 2004–05 than 2005–06 (Fig. 3.19).

125
0
2
4
6
8
10
12
14
16
18
Dec Jan Feb Mar Apr May
Month
Mea
n m
in. t
emp.
(°C
)
2004-052005-06
Figure 3-19 Mean minimum monthly temperatures (°C) at La Trobe Tack (+/- SE).
126
4 DISCUSSION
4.1 INTRODUCTION
In this chapter the rodent tracking indices, from 2002 to 2006 in the LTFERP and in
2005–06 in the LTFERP and control areas are discussed. The reason for including
historical rodent tracking data is that it may take several years for the benefits of
rodent control to be detected.
The impact of rodents on ground weta, cave weta, carabid beetles and prowling
spiders, in kanuka and podocarp-broadleaf forest types is variable, and each arthropod
group is treated separately in this discussion. The taraire forest results were
confounded by some differences in environmental features at the treatment and
control sites, and therefore the results for this forest type will be dealt with separately.
There were some other predators of arthropods that were not monitored in this study.
However they may have had an impact and their potential to influence arthropod
abundance and size class distribution in this study will be assessed. The ability of
rodents to influence the size class distribution of the arthropod populations,
monitored in this research, is also considered. Finally, the potential of these
arthropods to be used as indicators of the effect of rodent control at the LTFERP will
be discussed.
127
4.2 RODENT MONITORING
At the LTFERP, where the treatment sites for this research are located, rodent control
procedures have been in place since 2002, and rodent tracking indices have been used
to provide information about the size of the rodent populations. The relationship
between rat tracking index and density has been quantified in several studies e.g.
Brown, Moller, Innes and Alterio 1996 and Blackwell, Potter, Murray and McLennan
2002, found strong correlations between rat tracking indices and density. In contrast,
Ruscoe (2001) could find no relationship between mouse density and tracking tunnel
indices. However, Blackwell, Potter et al. (2002) suggested that tracking tunnels
should only be used to compare the relative abundance of rats within similar habitat
types.
In kanuka forest at the LTFERP, between 2002 and 2005, the mean rat tracking index
was 8%, 6% in podocarp-broadleaf and 13% in taraire. These rat tracking rates
indicate low rat densities, especially in the kanuka and podocarp-broadleaf areas.
Rodent monitoring at control sites, in the absence of pest control, was not carried out
concurrently with that in the LTFERP from 2002–05, consequently, it is assumed that
the rodent density was lower in the treatment than the surrounding areas. In support
of this assumption, in a study at Mapara (Hutchinson, 1999), bait stations containing
brodifacoum, spaced at 50 m intervals, as at the LTFERP, achieved a tracking index
reduction of 91% (Innes, Warburton, Williams, Speed and Bradfield, 1995),
moreover, rat tracking rates were significantly lower at sites where brodifacoum was
used than sites where this toxin was not used. Similarly, the rat tracking indices at
podocarp-broadleaf and taraire forest treatment sites, at the LTFERP during 2005–06,

128
were significantly lower than their control sites. This clearly indicates that rat
densities at these treatment sites were lower than their control sites. However, in the
2005-06 sampling season the tracking indices at the kanuka treatment site indicated a
significantly lower rat density than control site 2, but not control site 1. It is possible
that the kanuka control site 1 (and also the taraire control site 1) may be close enough
to the treatment area to be influenced by the pest control operations carried out at the
LTFERP. Unfortunately no research has yet been published that investigates how far
beyond pest control operations the suppression of rodent numbers extends.
Nevertheless, when the average rat tracking index in kanuka for 2005–06 (20%), is
compared to the historical average for this area (8%), it can be seen that the result for
2005–06 was unusual. The LTFERP encompasses a relatively small area (200
hectares), and therefore has a large boundary length to area ratio, making it
susceptible to incursions of rodents from the surrounding forest areas, where no
rodent control has been carried out.
Unexpectedly, mice were rarely detected at the podocarp-broadleaf and taraire
treatment sites between 2002 and 2006. It is usual that when rat numbers have been
significantly reduced, mouse abundance increases markedly (Innes, Warburton,
Williams, Speed & Bradfield, 1995; Murphy, Robbins, Young & Dowding, 1999).
This was the case in the Tawharanui Open Sanctuary, where a 70% mouse tracking
index was reported when the rat tracking index was 0% (Ussher, 2006). The reasons
for these observed increases in mouse abundance are not fully understood, although it
has been suggested that they could be caused by an increase in mouse food supply,
because of less competition from rats or release from predation pressure by rats
(Miller and Miller, 1995). Alternatively, it has been suggested by Brown et al.,
129
(1996), that mice were deterred from entering tracking tunnels by rat scent marks left
in them. They found that mice significantly increased their use of tracking tunnels as
rats were removed by trapping, even though mice were being trapped at the same
time.
The absence of mouse prints on the tracking tunnel cards, during rodent monitoring in
taraire at the LTFERP, between 2002 and 2005, may be explained by periodic high
rat tracking indices (50% in September 2002, 80% in July 2003 and 40% in May
2005) in this area. High rat numbers at these times may have deterred mice from
entering the tunnels (Brown, Moller et al., 1996).
Mice were present in kanuka forest in the LTFERP during 2002–06, in spring and
autumn (except for autumn 2006), and tracking indices of between 20% and 39%
were recorded. According to Blackwell, Potter et al., (2002), the preferred habitat of
mice is areas with dense undergrowth, which is common in podocarp-broadleaf forest
at the LTFERP due to the presence of large numbers of kiekie plants (pers. obs.).
Since the ground cover in kanuka is much more sparse than that in the podocarp-
broadleaf (pers. obs.), the higher mice tracking indices in kanuka were surprising.
At kanuka control site 1, mouse tracking indices of 30% in April 2006 and 20% in
October 2006 were recorded, whereas, at control site 2, mice were only detected
once, in April 2006, with a low tracking index of 10%. The rat tracking index at
kanuka control site 2 was significantly higher than that of kanuka control site 1, and
consequently a higher rat density at kanuka control site 2 may be causing a
suppression of mice numbers and / or tracking index, as previously described.
130
Furthermore, this same effect was observed at the taraire control sites with high rat
tracking indices recorded at taraire control site 2, with no evidence of the presence of
mice, whilst much lower rat abundance was recorded at taraire control site 1, and a
40% mouse tracking index, in March 2006.
4.3 IMPACT OF RODENTS ON ARTHROPODS
4.3.1 On Ground Weta
Ground weta, which were mainly confined to kanuka forest, appear to have benefited
from rodent control. There were more captures of ground weta at the kanuka
treatment site than the two control sites in 2005–06 (P = 0.008). However there was
no significant difference between the ground weta abundances at the kanuka
treatment site and the kanuka control 1 site during the 2004-05 sampling period.
Predator control at the LTFERP was initiated in 2002 and consequently insufficient
time may have elapsed for a significant difference in abundance of ground weta at the
kanuka treatment site to have accrued.
There are no published studies that link the distribution of the ground weta
Hemiandrus sp. to kanuka forest. However, Booker (2001) captured large numbers of
ground weta in pitfall traps in forest dominated by kanuka at the Matuku Reserve,
Auckland, where rodent numbers had been suppressed using brodifacoum. In this
same study, only a few ground weta were found in pitfall traps in the nearby Cascade
Kauri Reserve, an area with few mature kanuka, although at the time no rodent
control was being carried out. Since that study was conducted, the Cascade Kauri
Park has been included in the Ark in the Park Mainland Island, and despite the fact

131
that rodent numbers have been maintained at low levels, ground weta are only
infrequently captured in pitfall traps (Peter Maddison, pers. comm.). There is no
published data that directly implicates rodents as predators of Hemiandrus sp.
However if Hemiandrus sp. is restricted to kanuka forest, as found in this research
and by Booker (2001), it is unlikely that it would be found in rodent stomach content
analyses, unless the rodents had been captured in or nearby kanuka forest.
Nevertheless, considering that tree weta and cave weta, which are large-bodied
arthropods, are eaten by rodents (Best, 1969; Clout, 1980; Miller & Miller, 1995), it
is probable that such a potential food source, as large as a ground weta, would also be
eaten by rodents. There is some indirect evidence that ground weta (Hemiandrus sp.)
may be eaten by rodents. After kiore were removed from Tiritiri Matangi Island,
capture rates of the ground weta Hemiandrus sp. increased significantly (Atkinson
and Towns, 2001).
Previous research (McColl, 1975; Moeed and Meads, 1985) reported that the ground
weta H. pallitarsis was captured in pitfall traps in greater numbers at higher
temperatures. McColl (1975) found that there was a positive correlation between the
numbers of pitfall-trapped ground weta, in beech forest at Kaitoke, and daily
temperatures of 15–20 °C. The abundance of ground weta increased dramatically in
the kanuka treatment site from December 2005 to January 2006, before declining
markedly in February 2006. December 2005 was the third warmest December on
record (Gregory, 2006), and the minimum mean temperature during December 2005
was 3.8 °C higher than during December 2004 at La Trobe Track. However, ground
weta abundance at the kanuka control sites did not increase and then decrease, in a
similar manner, over the same time span. Consequently, it is unlikely that the high

132
temperatures of December 2005 were a major influence on the January 2006 ground
weta abundance at the kanuka treatment site.
The rat tracking indices at kanuka control site 1 were much lower than those of
kanuka control site 2 during 2005–06. Despite these differences, the monthly ground
weta abundance at kanuka control sites 1 and 2 were very similar. However, there
may have been enough mice present at kanuka control site 1, during the autumn and
spring of 2006, to increase predation pressure sufficiently to cause ground weta
numbers to be suppressed.
4.3.2 On Cave Weta
Cave weta abundance at the kanuka treatment site was similar to the control sites
during both sampling periods. However, there was a significant increase in cave weta
abundance at the kanuka treatment site from 2004–05 to 2005–06, which may have
been caused by habitat changes or weather differences that occurred over the two
years of sampling. Further research will be needed, to establish whether cave weta
abundance continues to increase at the kanuka treatment site over time.
Cave weta abundance at the podocarp-broadleaf forest treatment site, in 2005–06,
was similar to those of the control sites.
However, cave weta have a pronounced escape response in areas where mammalian
predation occurs (Bremner, Barratt, Butcher and Patterson, 1989). Because of this
escape response, the level of predation by rodents may have been insufficient to affect
the cave weta population size. Most of the cave weta pitfall trap captures were in the

133
4–9 mm size range, with very few captures in the largest size class. The Auckland
cave weta, Gymnoplectrum acanthocera, is a large bodied weta, and while common
under houses and out-buildings in the LTFERP (pers. obs.), was rarely captured in
pitfall traps. G. acanthocera has very long legs, in fact some individuals have been
measured at 355 mm from the tip of the antennae to the end of the back legs (Crowe,
2002), and consequently may readily avoid pitfall traps. If this weta is being targeted
by rodents, a different methodology, other than pitfall trapping, may need to be
employed to detect changes in abundance that might be caused by rodent predation.
4.3.3 On Carabid Beetles
Carabid beetles have benefited from pest control in kanuka and in podocarp-broadleaf
forest at the LTFERP but not in taraire forest. Statistically significant differences
were recorded when the abundance of carabids at the kanuka and podocarp-broadleaf
treatment were compared with those of their respective control sites. In addition, there
was a statistically significant increase in the abundance of carabid beetles at the
kanuka treatment site between 2004–05 and 2005–06, whereas, at kanuka control site
1 there was no difference in abundance between these two years. However, there
seems to be only limited evidence that carabid beetles are eaten by rodents. Craddock
(1997), when investigating the stomach contents of rodents living in taraire forest,
found few carabid remains. Similarly, Ussher (1999) found that carabid beetles
formed only 0.13% of kiore diet on the Chicken Islands group.
Gibbs (1997) argued that carabid beetles are distasteful to rodents. Some carabid
beetles emit a compound with a repulsive smell and unpalatable taste from their
pygidial glands (Larochelle & Lariviere, 2001; Lovei & Sunderland, 1996), which

134
may be an effective defense against rodent predation. The larvae of carabid beetles
are unlikely to be eaten by rodents, because they are fossorial i.e. burrow
underground, and are rarely seen at the surface (Larochelle & Lariviere, 2001).
The greater abundance of carabid beetles in these areas may be because of habitat
changes, caused by the reduction of rodent numbers at the kanuka and podocarp-
broadleaf treatment sites.
An indirect consequence of rodent control is that an increase in bird abundance has
been reported after introduced mammal numbers in forests have been reduced (James
& Clout, 1995; Saunders, 2000). At the LTFERP the abundance of tui (Posthemadera
novaeseelandiae) and grey warbler (Gerygone igata) increased significantly between
2002 and 2004 (King unpublished data). Seventy percent of New Zealand’s forest
birds eat fruit and disperse seeds (Clout & Hay, 1989). It is possible that a greater
number of birds, at the kanuka and podocarp-broadleaf treatment sites, compared to
their respective control sites, led to an increase in seedling recruitment at these sites.
An outcome of greater seedling numbers, at the kanuka and podocarp-broadleaf
treatment sites, may be the provision of more leaf litter. Greater quantities of leaf
litter may lead to the retention of more soil moisture.
Watts and Gibbs (2002) found that the abundance of beetles was significantly higher
at sites on Somes Island (Wellington) that had greater habitat and vegetational
heterogeneity, and stated that beetles are sensitive to microclimatic conditions such as
temperature and humidity. The amount of leaf litter may be an important influence on
arthropods in forest habitats, especially for predators such as carabid beetles. This is

135
because leaf litter, as well as maintaining moisture, also provides refuges for prey
species (Uetz, 1979). Lovei and Sunderland (1996) suggested that carabid larvae,
because they have weak chitinisation, are vulnerable to desiccation and consequently,
the larval stage of the carabid life cycle may be the most responsive to micro-climate
differences.
4.3.4 On Prowling Spiders
Prowling spiders appeared to have benefited from rodent control in podocarp-
broadleaf, but not in kanuka forest, despite the fact that rat abundance in both
treatment sites was lower than their respective control sites. Spiders have been
reported as a major item of rat diet (Best, 1969; Craddock, 1997). However, spiders
are also a major food item of mice (Craddock, 1997; Jones & Toft, 2006; Ruscoe &
Murphy, 2005), and when mice were eradicated from Allports Island, spider numbers
increased (Fitzgerald, 2001). Mouse tracking indices for the podocarp-broadleaf
forest in the LTFERP from 2002–06 were low, in contrast to the kanuka forest area,
where periodically high mouse tracking indices have occurred from 2003 to 2006,
especially in March–April. Considering that mice are major predators of spiders, it is
possible that prowling spider abundance at the kanuka treatment site has been
suppressed, because of mouse predation. However, this interpretation should be
viewed with caution, as there was a statistically significant increase in abundance of
prowling spiders at kanuka control site 1 between 2004–05 and 2005–06. Although
mice were present at kanuka control site 1 in 2005–06, no rodent monitoring was
carried out in this area in the previous year, and consequently, it is unknown whether

136
the mouse abundance was higher in 2004–05 than 2005–06. Future monitoring of
mice abundance, at kanuka control site 1, would be needed to determine whether
prowling spider and mouse abundance are related.
4.4 ARTHROPODS IN TARAIRE FOREST Although the two taraire control sites had some different features when compared to
the treatment site, they were the only areas of taraire forest available. Other sites that
were more closely matched to the treatment site, either contained bait stations or were
too close to bait stations in a neighbouring restoration project. It was felt that the
results should be included in this study as some of the comparisons with the other
forest types used may be of value.
4.4.1 The Impact of Rodents on Arthropods In contrast to the podocarp-broadleaf and kanuka forest sites, there appear to be no
benefits to the cave weta, carabid beetle and prowling spider populations caused by
rodent control in taraire, even though rat tracking indices were lower at the treatment
site compared with the control sites. Moreover, the abundance of cave weta and
prowling spiders was greater at control site 1 than those of the treatment and control 2
sites. The abundance of cave weta at the treatment site was greater than that of control
site 2, and this was the only abundance comparison that favoured the treatment site.

137
However, there were several confounding variables that may have masked the effect
of rodent control on arthropod abundance.
4.4.2 The Influence of Site Aspect on Arthropods
The taraire treatment site and control site 2 both had a southerly aspect, whereas,
taraire control site 1 had a northerly aspect. It is likely that control site 1, because of
its northerly aspect, would have higher average temperatures than the treatment and
control site 2. Arthropod activity has been found to be positively correlated to
temperature (McColl, 1975; Moeed & Meads 1985, 1986). Higher ground
temperatures at control site 1 may have resulted in increased activity of cave weta and
prowling spiders, compared to that at the treatment and control site 2. A consequence
of increased activity of cave weta and prowling spiders at control site 1 may have
been greater pitfall trap captures, compared to those of the other two sites.
4.4.3 The Influence of Habitat Diversity on Arthropods
Control site 1 had a greater diversity of plant species than either the treatment site or
control site 2. Moreover, the density of plants at control site 2 was noticeably less
than that of the treatment and control 1 sites. In addition, control site 2 had less dead
wood in its ground cover, and a greater proportion of bare ground than the other two
sites. Habitat diversity strongly influences the abundance of arthropods at forest sites.
Watts and Gibbs (2002) found that the abundance of beetles on Matiu/Somes Island,
(Wellington), was greater in sites that had greater vegetation heterogeneity.
Furthermore, Lassau, Hochuli et al., (2005) showed that habitat diversity was strongly
related to the abundance of pitfall-trapped beetles in Sydney sandstone forest
138
(Australia). Crisp, Dickinson & Gibbs, (1998), in an investigation into the
relationship between native arthropod diversity and native plant diversity in a lower
North Island forest, found that sites with the greatest number of plant species
contained the most beetle species. The greater number of plant species at control site
1 may support a greater diversity of arthropod species, which may provide more food
for predators such as prowling spiders.
4.4.4 The Influence of Soil Depth on Arthropods
The average soil depth was much less at control site 2 than at the treatment and
control 1 sites, and as a result of this soil depth difference, the soil moisture level was
likely to be lower at control site 2, especially in periods of low rainfall. The rainfall
for February 2006 (21 mm) was much lower than the 112 mm average for this month.
There was some indication that a shortage of water was having an effect on the taraire
trees at taraire control site 2, because the ripe taraire fruit that had fallen from the
trees in February–March, were very small compared to those seen during April–May.
Carabid beetles at the taraire control site 2 may also have been affected by the low
rainfall in February 2006, because their abundance declined considerably between
February and March 2006, whereas, over the same time period, carabid abundance at
the other two taraire sites increased. Carabid beetles are hygrophilous (Larochelle &
Lariviere, 2001), and are therefore likely to be sensitive to extreme shortages of water
in their environment. The >24 mm size class was largely absent from taraire control
site 2, but was present at the other taraire sites, and it is possible that periodic drought
conditions were a limiting factor, preventing carabids of this size class from
occupying this area. Carabid distribution can also be influenced by temperature and
139
humidity extremes (Lovei & Sunderland, 1996), and both of these could occur in
summer when there has been low rainfall, especially at control site 2.
4.5 THE EFFECTS OF OTHER PREDATORS ON ARTHROPODS
4.5.1 Possums
Possums include some arthropods in their diet. For example, Cowan and Moeed
(1987) found arthropod remains, including weta and beetles, in 48% of the possum
pellets that they analysed. However, arthropods contributed less than 5% of the total
biomass eaten. Similarly, Cochrane, Norton, Miller and Allen, (2003) found that
arthropods contributed only 7.6% of the dietary intake of the possums that they
sampled from north Westland mixed beech forest.
It is assumed that possum numbers, at both the treatment and control sites used for
this research are too low to have any impact on the abundance of arthropods. In the
LTFERP, a zero residual trapping catch was achieved in 2002. Possum monitoring,
using NPCA (2000) protocols, has not been done since 2002, but other data gathered
suggested that possum numbers still remained low in the LTFERP between 2002 and
2006. For example, during this time period, few possum footprints were detected on
the rodent tracking cards. The close spacing of the bait stations, at 50 m intervals
(when possums are targeted, bait stations are typically placed at 150 m intervals), as
well as the fact that the bait stations were replenished at least twice annually, means
that it was unlikely that many possums would survive in the LTFERP.

140
Possum monitoring at the control sites during 2005–06, using NZPA protocols,
indicated that possum abundance was very low. However, possum footprints were
present on the tracking cards each time rodents were monitored at taraire control site
2, which suggested that a possum population had become established. Unfortunately
the presence of possum footprints on rodent tracking cards gives no information
about the size of the possum population in this area. It is possible that a small number
of possums were able to find the tracking tunnels by locating the peanut butter scent.
Many of the taraire berries found on the ground during February and March 2006 had
their seeds removed (pers. obs.). It is unclear whether the taraire seeds were removed
by possums or by rats, because both were present in this area at this time. However, at
taraire control site 1, when ripe taraire berries were on the ground (October 2006), no
seed removal from fruit was observed. Tracking tunnel data collected at this time
indicated the presence of rats, but not possums. Although possums were present at
taraire control site 2, and may have been eating large numbers of taraire seeds, it
cannot be assumed that this indicated the possum population in this area was large,
because over a period of time a small number of possums could have been
responsible for eating a large number of taraire seeds. Even though the presence of
possums at taraire control site 2 was a confounding variable, there is not enough
evidence to determine whether possums had a significant impact on arthropod
abundance at this site.
4.5.2 Stoats, Hedgehogs, Weasels, Ferrets and Cats
While stoats, hedgehogs, weasels, ferrets and cats are not targeted for control at the
LTFERP, and their relative abundance has not been directly monitored, they are

141
known to include arthropods in their diet. Consequently, the likely impacts of these
small introduced mammals on forest arthropod populations need to be assessed.
Stoats Although stoats mainly eat large prey such as rodents, lagomorphs and possums
(King & Murphy, 2005), arthropods are included in their diet. Large bodied insects,
such as the ground weta Hemiandrus sp., and the cave weta Gymnoplectrum sp.
(ibid.), as well as carabid beetles (Purdey & King, 2004) have been found in the
stomach contents of stoats in New Zealand forests.
When rodent numbers in the forest are low, stoats have the ability to switch to other
prey, for example, Murphy, Keedwell, Brown & Westbrooke (2004) found that birds
were eaten more frequently when rat numbers were low. Similarly, Purdy & King,
(2004), in research in Fiordland, found that when mice were scarce the largest
component of stoat diet was birds, although they ate large carabid beetles such as
Mecadema spp. and Megadromus spp. Furthermore, Rickard (1996) found arthropods
in 81.8% of stoat stomachs, when rats were in low numbers, in lowland podocarp
forest in South Westland.
Because rodent numbers were lower at the treatment sites used in this research, it is
probable that any stoats present would respond by targeting other prey, especially
birds and to lesser extent arthropods. It is also possible that stoat numbers were lower
at the treatment sites than the control sites, because when brodifacoum is used to
suppress rodent numbers, stoats are killed when they eat the poisoned rodents (Alterio
& Moller, 2000; Gillies & Pierce, 1999; Murphy, Clapperton, Bradfield & Speed,

142
1998). However, in all of these studies the secondary kill effect only lasted for a few
months, and Gillies and Pierce (1999) found at Trounson Kauri Park (Northland), that
with the ongoing use of brodifacoum, none of the stoats that they monitored died,
although they did contain brodifacoum residues It is possible, therefore, that stoat
numbers at the treatment sites used for this research were unaffected by the continual
use of brodifacoum. However because the preferred food of stoats is rodents, and
their territories large (King & Murphy, 2005), it is unlikely that they would spend
much time in an area of low rodent numbers, when there are large numbers of rodents
nearby. Unfortunately, though, there has been no New Zealand research carried out
that attempted to quantify the effect of stoat predation on arthropod abundance.
Hedgehogs While hedgehogs are insectivorous, and do target carabid beetles, weta and spiders
(Berry, 1999), their footprints have only once been present on rodent tracking cards
used in the LTFERP (October 2005 at the kanuka treatment site). Furthermore, during
2003–04, when rat traps were used to control rodents, only two hedgehogs were
trapped. Trap catch rates of hedgehog at Trounson Kauri Park, and Pureora Forest
Park were up to 1.3 hedgehogs/100 CTN (corrected trap nights), and between 0.10
and 1.51 hedgehogs/100 CTN respectively (Jones and Toft, 2006), all low values. It is
unlikely therefore, that the hedgehog is having a major impact on arthropod
abundance in the LTFERP.

143
Weasels While weasels mainly eat mice and birds, insects such as weta are included in their
food intake (King, 2005). However, data gathered on weasel abundance suggests that
weasels are scarce in New Zealand forests. For example, at the Pureora Forest Park in
1983–87 only 16 weasels were captured in 24,272 Fenn trap nights, and similarly on
the Puketukutuku Peninsula (in Lake Waikaremoana), only 11 weasels were captured
in 66,000 trap nights in 1994–96 (ibid). If the abundances of weasels at the treatment
and control sites used for this research, are similar to those described above, then it is
unlikely that they are having a significant impact on the abundance of arthropods.
Ferrets The primary prey of ferrets is rabbit, but they do eat weta, spider and beetles
(Clapperton & Byron, 2005). However, ferrets are most common in pastoral habitats
(ibid.), and scat and stomach samples from ferrets captured in forest at Mapara and
Pureora did not contain any arthropod remains (ibid.). Consequently, it is unlikely
that ferrets, if present, are having a significant impact on arthropod abundance at the
treatment and control sites used in this research.
Feral Cats Feral cats living in forests mainly eat rats or rabbits (Gillies & Fitzgerald, 2005).
Although arthropods are frequently eaten by cats, it is thought that the numbers
consumed are too small to contribute much to their diet (ibid).
Individually stoats, hedgehogs, weasels, ferrets and cats may have had little impact on
arthropod populations in the study sites of this research; however, their collective

144
impact may have had some influence on arthropod abundance, although there is no
evidence to support or dispute this.
4.5.3 Morepork
Morepork are nocturnal native owls that are mainly insectivorous, eating ground
weta, cave weta, tree weta, beetles, including carabids, and spiders (Haw, 1998; Haw,
Clout & Powlesland, 2001) and typically targeting prey in the 2–5 cm size range
(Haw, 1998). The benefits of intensive pest control to birds have already been
discussed (see section 1.4). It might be expected that morepork abundance would
increase in forests with low numbers of introduced mammalian predators, and
consequently may affect the populations of their arthropod prey, although there is no
evidence for this. However, morepork do include mice in their diet, although in small
numbers (Haw, Clout et al., 2001), and are therefore also vulnerable to secondary
poisoning in rodent control areas. Dead morepork have been found after pest control
operations that have used brodifacoum, and tissue analysis of these dead morepork
found traces of brodifacoum (Eason, Murphy, Wright & Spurr, 2001; McClelland,
2002; Murphy, Clapperton et al., 1998). Nevertheless, there are anecdotal reports
from residents of La Trobe Track of more frequent morepork sightings and calling at
night, since brodifacoum has been used to suppress rodent numbers. Although no
formal morepork monitoring has been done in the LTFERP, their predation cannot be
disregarded as having an affect on the arthropod populations, especially considering
that morepork eat larger arthropods including the taxa being monitored in this
research.

145
4.5.4 Introduced Wasps
Social wasps (Vespula spp.) are common in the Waitakere Ranges during summer
and autumn (pers. obs.), and research in other forests, primarily beech (Nothofagus),
suggests that they may have a profound effect on some native arthropod populations.
In honeydew beech forests, the arthropod prey of wasps is commonly spiders,
caterpillars, ants, flies and bees (Beggs, 2001). Research by Toft and Rees (1998)
predicted that the probability of a spider surviving to the end of the wasp season was
very low in sites where wasp numbers were not reduced by poisoning.
Vespulid wasps may also influence arthropod populations in ways other than by
direct predation. For example, Barr, Moller, Christmas, Lyver & Beggs, (1995) found
that experimentally placed mealworms (Tenebrio molitor) survived longer at sites, in
beech forest, where wasps had been poisoned. It is possible therefore, that those
arthropod predators, such as carabid beetles, could be competing for some of the
same prey items as vespulid wasps, but their specific diet is unknown. There is
evidence that vespulid wasps have the potential to alter the structure of some
arthropod communities. Beggs and Rees (1999) found that experimentally placed
lepidopteran caterpillars, in beech forest, had a high probability of survival in spring,
when wasp density was low, but a low probability of survival at the peak of the wasp
season in summer and autumn. They predicted that the heavy predation of
Lepidoptera caterpillars by wasps that occurred mainly in summer and autumn, could
lead to the loss of some species from the ecosystem, whereas Lepidoptera prey
species that occurred predominantly in spring, would be common.

146
There are few studies of the food intake of social wasps in non-beech honeydew
habitats; however, Harris and Oliver (1993) found that the arthropod prey items of
two species of wasps (V. vulgaris and V. germanica) at two sites in Hamilton were
broadly similar to those of wasps in South Island beech forests. Furthermore, of the
two species V. germanica spent more time foraging amongst forest litter and carried
heavier loads back to their nests (Harris & Oliver, 1993). Most of the vespulid wasps
in the Waitakere ranges are V. germanica (G. Hoskins pers. comm.), and
consequently may be having an impact on forest floor arthropods. However, there is
no published research that has established the densities of vespulid wasp nests in the
Waitakere Ranges, nor have there been any studies that have manipulated wasp
density and monitored the response of prey populations. Until these studies are done,
the affects of vespulid wasps on arthropod populations in the Waitakere Ranges are
speculation.
4.6 RODENTS SIZE CLASS SELECTION OF ARTHROPOD PREY
During the research for this thesis, rats were in lower abundance at the treatment sites
compared to the control sites. However, mice tracking indices at the kanuka
treatment, kanuka control 1 and the taraire control 1 sites, especially in autumn,
indicated their presence in reasonably high numbers, consequently, the impact of rats
in these areas cannot be separated from those of mice. Because neither mustelid nor
cat monitoring was done during this research, and considering that stoats and cats
target larger arthropods as prey, these predators cannot be discounted from having an

147
impact on the size frequencies of the ground weta, cave weta, carabid beetles and
prowling spiders monitored in this research.
There is some evidence from previous research that rodents selectively target certain
size classes of arthropods as prey. Craddock (1997), in research in coastal broadleaf
forest north of Auckland, found that mice targeted arthropods in the 3–12 mm size
range, whereas, rats targeted a broader size range of arthropods.
Other research attempting to determine whether predators target certain size classes
of arthropods, has not isolated the impact of rodents from other mammalian predators
such as possums, mustelids and cats.
Chapman, Alexander et al. (2004), in a study in broadleaf forests spread across the
Auckland region, found that there were a higher proportion of larger individuals of
the arthropods in most of the localities where pest control was carried out. Similarly,
Watts (2004) found that the numbers of ground beetles, in the >30 mm size class, had
increased in the Karori Wildlife Sanctuary after mammalian pest eradication. On the
other hand, Sim (2005), in a study in the Rotoiti Nature Recovery Project Nelson,
found that there was no measurable size differences in the beetles caught when he
compared sites with and without pest control. In fact, most of the beetles caught were
in the <10 mm size class, and Sim suggested that the larger beetles may have been
eradicated from these sites. However, rodent populations may not have been
suppressed to a low enough level at the treatment site in Sim’s research, and
consequently may have been influencing the arthropod populations.

148
In the research for this thesis there was some evidence that there had been size
selection of the ground weta (Hemiandrus sp.) in the kanuka forest, to which it was
largely restricted. There was a greater proportion of the largest ground weta size class
at the treatment site, compared to that at the control sites. In contrast, there was a
larger proportion of the smallest ground weta size class at the control sites, compared
to the treatment site. These differences in the relative proportions of ground weta size
classes, when the treatment and control sites are compared, occurred over both years
of sampling (from 2004–06). Greater predation pressure on adult ground weta, by
rodents at the control sites, could explain why there was a smaller proportion of large
ground weta at the control sites, compared to the treatment site.
The proportion of prowling spiders, in the >10 mm size category, was larger at taraire
control site 2 than the other taraire sites. This site had high rat tracking indices,
indicating the presence of a large rat population. However, it is unlikely that rats were
selecting small spiders as prey. It is possible that there were some environmental
features at the taraire control 2 site that favoured large prowling spiders. There was
no other apparent association between prowling spider size classes, location or year.
However, the abundance of the largest prowling spiders trapped in all areas was very
low, and it is possible that most of the spiders in this size class were able to avoid the
pitfall traps, and if this was the case, another sampling methodology would be needed
to determine whether these larger spiders were being eaten by rodents. The
abundance of large prowling spiders on Tiritiri Matangi Island increased by 400% in
the six years after rodents were eradicated (Chris. Green, pers. comm.), and unlike the
pitfall traps used to monitor arthropods in the LTFERP, which had a diameter of 80
mm, most of the pitfall traps used on Tiritiri Matangi Island had a diameter of 110
mm (Chris. Green, pers. comm.).

149
Cave weta in the 10–14 mm size class at the kanuka treatment site, and those in the
>14 mm size class at the podocarp-broadleaf treatment site, were trapped in greater
proportions compared to their respective control sites, indicating some selection of
these larger cave weta by rodents. A similar pattern was reported by Chapman,
Alexander et al. (2004), who found a significantly higher abundance of cave weta in
the 10–19 mm size class at the treatment sites, where the numbers of a variety of
mammalian predators were being controlled, compared to the control sites. However,
because of the presence of a suite of introduced mammalian predators at the control
sites, Chapman, Alexander et al. could not attribute this result to rodents alone.
As with the prowling spiders, very few of the largest cave weta (in the >20 mm size
class) were captured at the sites in the LTFERP, and their associated control sites, and
this may be because large cave weta, such as Gymnoplectrum acanthocera, can avoid
pitfall traps and consequently are under-represented in the sampling.
Because carabid beetles may be avoided as prey by rodents (see section 4.3.3), any
variation in the proportions of the different size classes captured is probably caused
by environmental differences between the different sites. The largest carabid beetle
size class (>24 mm) did not consistently occur in higher proportions at the treatment
sites, compared to the control sites of the different forest types used in this research.
For example, this size class was found in larger proportions at the podocarp-broadleaf
control 2 and taraire control 1 sites, than their respective treatment sites.
Carabid beetle distribution has been shown to be affected by many environmental
factors, including soil and litter moisture (Luff, Eyre & Rushton, 1992) and

150
vegetation structural diversity (Webb & Hopkins, 1984; McCracken, 1994). There
was a large proportion of the 15–19 mm size class, in this study, at the treatment site
of each forest type, and carabid beetles in this size class may be responding to
variation in soil and vegetation parameters, induced by low rodent numbers.
In this research, most of the arthropods were classified only to the family level.
However, it is probable that several species were present in each of the Carabidae
(carabid beetles), Zoropsidae (prowling spider), and Anastostomatidae (cave weta)
families caught in the pitfall traps (Chris. Green pers.comm. & Peter Maddison, pers.
comm.). Therefore, any effects at the species level caused by the suppression of
rodent numbers would not have been detected at the taxonomic resolution used in this
research.
4.7 ARTHROPODS AS INDICATORS OF RODENT CONTROL
Arthropods have been proposed as indicators of ecosystem change, because they
respond rapidly to environmental change (Hutcheson, Walsh & Given, 1999). In New
Zealand, arthropods have been used to characterise the different stages of restoring
indigenous forests. Both Watts and Gibb (2000), and Reay and Norton (1999), found
that there was a strong correlation between arthropod and plant community
composition and the age of the study site. Similarly, Jansen (1997) used arthropod
community structure to assess the success of a tropical rainforest restoration in
Queensland. Furthermore, ants have been used as indicators of mine site

151
rehabilitation (Majer, 1983), and to monitor biodiversity in Australian range-land
ecosystems (Anderson, Fisher, Hoffmann, Read & Richards, 2004).
However, little research has been done to determine whether arthropods can be used
to indicate the effects of mammal control in New Zealand forests. In fact, there have
only been a small number of studies that have found evidence that suggest arthropods
have benefited from the control of introduced mammals. The data in one New
Zealand study was confounded by El Niño weather patterns and the presence of
ground dwelling insectivorous birds (Sinclair, McCartney, Godfrey, Pledger, Wakelin
& Sherley, 2005), and in another by the presence of large numbers of rodents in the
treatment site (Sim, 2005). On the other hand, Craddock (1997, 2003) documented
some benefits of intensive mammal control to arthropods in taraire-broadleaf forest at
Wenderholm, north of Auckland, and in kauri forest at Trounson, Northland.
In this study, only the index of abundance is being considered for indicator use. None
of the potential indicator groups were consistently in greater abundance at all of the
treatment sites compared to the control sites. However, there were indications that
some arthropod groups were responding to the control of pest species at particular
sites, for example, although the ground weta Hemiandrus sp. seemed to have
benefited from pest control, they effectively only occurred in kanuka forest. Hence,
perhaps ground weta have the potential to be used as indicators of the effects of
rodent control in the kanuka forest at the LTFERP. However, because of their patchy
distribution, the sampling design will need to be addressed to minimize the standard
error, for example increasing the number of pitfall traps or increasing the trap size.

152
Carabid beetles have also been regarded as being suitable for use as ecological
indicators because they are taxonomically varied, abundant across the landscape, and
are sensitive to anthropogenic environmental modification (Niemela, Kotze,
Ashworth, Brandmayr, Desender, New, Penev, Samways & Spence, 2000). In
addition, carabid beetles tend to migrate in response to change rather than adapting
physiologically, which also makes them suitable for use as indicators of
environmental change (Butterfield 1996). Furthermore, pitfall trapping is able to
detect the population variation of carabid beetles within different habitats (Eyre &
Luff, 1990).
Carabid beetle assemblages have been used in Great Britain as indicators of habitat
quality in exposed riverine sediments (Eyre & Luff, 2002), and to classify different
grassland habitats (Luff, 1996). Carabid beetles in the LTFERP, although probably
not eaten by rodents, responded positively to pest control in both the kanuka and
podocarp-broadleaf forest in the 2005-06 sampling season and have the potential to
be used as indicators of the effects of rodent control in both these forest types. In
addition, the kanuka and podocarp-broadleaf forest sites represent different stages of
forest succession (Dugdale & Hutcheson, 1997), and may support different carabid
beetle species assemblages that may facilitate discrimination between these two forest
types (Watts & Gibb, 2002).
The use of spiders as potential biological indicators has also been proposed because
they are abundant in many forests, possess a great variety of lifestyles, and are easily
sampled (New, 1999). Bonte, Baert and Maelfait (2002) were able to identify spider
species as being useful as indicators in discriminating between different coastal dune
153
habitats in Belgium. In New Zealand, there has been some research that aims to
determine if spiders could be useful as indicators in forest restoration programmes.
For example, Reay and Norton (1999) found that the age of forest restoration
plantings was strongly correlated to the spider species composition at each site.
However, Chapman, Alexander et al. (2004) found that prowling spider abundance
did not indicate the benefits of pest control, in Auckland broadleaf forest. The limited
data collected during these studies is inconclusive. In the LTFERP, the abundance of
prowling spiders indicated a lower abundance of rats at the podocarp-broadleaf
treatment site than either of the control sites. In the other two forest types, statistically
significant differences in abundance favoured some of the control sites, although
confounding variables may have contributed to the greater prowling spider abundance
at taraire control site 1 compared with the treatment and control 2 sites. Even though
the number of large prowling spiders captured during this research was small, more
were trapped at the kanuka and podocarp-broadleaf treatment sites than their
respective control sites. Over time, the abundance of large prowling spiders may
continue to increase at the kanuka and podocarp-broadleaf treatment sites. On the
other hand, as has been previously mentioned, the diameter of the pitfall traps used in
this research may have been too small to capture large numbers of prowling spiders.
It is well established that arthropods are sensitive to changes in weather and to
microhabitat differences (Hutcheson, 1999; Van Aarde, Ferreira et al., 2004; Sinclair,
McCartney et al., 2005). It will be necessary, therefore, to monitor the abundance of
the arthropods suggested as potential indicators at the LTFERP, over many years, to
ascertain whether their positive response to low rodent numbers persists if weather
and other environmental conditions change.

154
Any discussion of the reasons for habitat preferences of the arthropods that could
potentially be used as indicators is hampered by the lack of detailed knowledge of
their life histories and general ecology (Crisp, Dickinson et al., 1998).

155
5 CONCLUSIONS
5.1 SUMMARY OF FINDINGS Few studies have demonstrated the benefits to forest arthropods, of maintaining low
pest numbers. However, this research has produced results that suggest that some
arthropods are responding positively to the maintenance of low numbers of rodents,
particularly ground weta in kanuka forest, carabid beetles in kanuka and podocarp-
broadleaf forests, prowling spiders in podocarp-broadleaf forest and to some extent
cave weta in kanuka forest. Furthermore, there is evidence that ground weta in
kanuka forest, and cave weta in kanuka and podocarp-broadleaf forests, may be
selected by predators on the basis of size, because there was a significant relationship
between size class and their respective treatment sites. In addition, there was a
significant relationship between carabid beetles in the 15–19 mm size class and their
treatment sites, but because it is unlikely that carabids are selected as prey by rodents,
it is possible that they are responding to habitat changes that suit them. This response
suggests that carabids represented by this size range may have the potential to be used
as environmental indicators, to monitor the effects of rodent control. However, there
was no evidence to suggest that the largest carabid beetle size class (>24 mm) was
benefiting from rodent control in the LTFERP. In fact, at some control sites this size
class was trapped in larger proportions than at the associated treatment sites. No other
arthropod species or group in this research responded to rodent control consistently in
all three forest types. However, ground weta, which for some undetermined reason
were largely restricted to kanuka forest, responded strongly to rodent control and may

156
be suitable for monitoring the effects of rodent control in kanuka forest in the
LTFERP. Prowling spiders appeared to be sensitive to the presence of both rats and
mice, because they were abundant at the podocarp-broadleaf treatment site, which
had low rat and mice tracking indices, whereas, at the kanuka treatment site their
lowered abundance seemed to coincide with the periodic presence of mice.
5.2 LIMITATIONS OF THIS STUDY Some of the data, particularly those collected from the taraire forest sites, were
compromised by confounding variables such as differences in aspect, soil depth, plant
species variety and density. These differences may have masked any variation in the
arthropod abundance with or without rodent control. New control sites in taraire
forest, with suitable sampling and experimental designs, would need to be established
to mitigate the confounding effects of environmental differences between the sites.
The effect of rodent control on the arthropod populations used in this study could
have been masked by the taxonomic resolution used. Larger cave weta, for example,
were found in greater proportions in some forest types. However, this size class may
have contained several species, not all of which may have been affected by rodents.
Furthermore, cave weta abundance was not greater at any treatment site than its
corresponding control site, so any individual species that may have benefited from
rodent control would not have been apparent using such a broad taxonomic grouping.
The sampling methodology used was unable to detect whether the largest arthropods
collected, i.e. the cave weta (e.g. Gymnoplectrum acantocera) and the prowling

157
spider (Uliodon sp.), were being eaten by rodents. Including some pitfall traps with a
larger diameter in pitfall trap-lines may have addressed this problem.
The effects of other predators were unable to be separated from those of rodents in
this research. Stoats and feral cats, for example, eat larger arthropods and
consequently their predation on these animals may have depressed the proportions of
larger weta, spiders and carabid beetles that were trapped. In addition, morepork may
have been more abundant in the treatment areas of this research, than the control
areas, and because they target larger arthropods may also have had an impact on the
abundance of larger arthropods. However nothing is known about morepork territory
or home range sizes, and consequently it is possible that some morepork hunted in
both the LTFERP and nearby control sites.
5.3 APPLICATIONS OF THIS STUDY
5.3.1 Recommendations for Further Research
There has been very little research investigating the effect of introduced wasps
(Vespula spp.) on other animal populations in non-beech forest ecosystems. Research
to determine the density of wasp nests and numbers of wasps per nest in the LTFERP
needs to be carried out, and furthermore, the effects of wasp predation on arthropods
need to be established. Vespulid wasps, at the time of the year that they reach peak
abundance, may compete with native insectivorous birds for prey and the effects of
such competition merits investigation.

158
Research carried out over many years, similar to that done in this thesis, is needed to
gain comprehensive knowledge of the seasonal patterns of ground and cave weta,
carabid beetles and prowling spiders, in the LTFERP. This would allow seasonal
effects to be separated from the effects of mammal predation on these arthropods,
while maintaining rodent control and monitoring. Also, further research is needed to
investigate arthropod life histories, basic biology and population dynamics. Studies
need to be initiated with experimental designs that allow the specific effects of
rodents on arthropods to be separated from those of other arthropod predators such as
mustelids and cats. The differences between the effects of rats and those of mice on
arthropod abundance could be investigated by setting up exclusion/inclusion
experiments. The effect of environmental conditions on arthropod abundance in the
forest types used in this study also need to be investigated, because arthropods are
very sensitive to small variations in microclimate. In addition, the ideal pitfall trap
size to capture larger arthropods, such as the largest cave weta and prowling spiders,
needs to be established.
5.3.2 Practical Applications of this Research The recognised standard for successful rodent control is often a 5% tracking index,
and this may be necessary for protecting endangered bird species with low population
sizes. However, this research has demonstrated that some arthropod populations can
benefit when rodent tracking indexes are higher than 5%. Considering the effort
required achieving a 5% rodent tracking index, and the amount of toxin that may be
used, higher rodent tracking indices could be set as more appropriate targets in
ecosystem restoration projects that are not designed to protect endangered species.

159
This research has demonstrated the importance of kanuka forest as a habitat for the
ground weta Hemiandrus sp. In addition, it has shown that the abundance of carabid
beetles and cave weta were similar in both the kanuka and podocarp-broadleaf forest
treatment sites used in this research. Previous research has also established the
importance of mature kanuka forests as repositories of high arthropod diversity and
abundance (Dugdale & Hutcheson, 1997). Mature kanuka forest should therefore
have a much higher conservation priority.

160
REFERENCES Allen, R. B. (1993). RECCE An inventory method for describing New Zealand
Vegetation: A field manual. Christchurch, Manaaki Whenua - Landcare
Research.
Alterio, N. & Moller, H. (2000). Secondary poisoning of stoats (Mustela erminea) in
a South Island podocarp forest, New Zealand: implications for
conservation. Wildlife Research 27(5), 501-508.
Andersen, A. N., Fisher, A., Hoffman, B., Read, J.L. & Richards, R. (2004). Use of
terrestrial invertebrates for biodiversity monitoring in Australian
rangelands, with particular reference to ants. Austral Ecology 29(1), 8.
Atkinson, I. A. E. (2001). Introduced mammals and models for restoration.
Biological Conservation 99, 81-96.
Atkinson, I. A. E. & Cameron, E. K. (1993). Human influence on the terrestrial biota
and biotic communities of New Zealand. Trends in Ecology and
Evolution 8 (12), 447-451.
Atkinson, I. A. E. & Towns, D. R. (2001). Advances in New Zealand Mammalogy
1990-2000: Pacific rat. Journal of The Royal Society of New Zealand
31(1), 99-109.
Baden, D. (1986). Diet of the house mouse (Mus musculus) in two pine and a kauri
forest. New Zealand Journal of Ecology 9, 137-141.
Barr, K., Moller, H., Christmas, E., Lyver, P. & Beggs, J. (1995). Impacts of
introduced common wasps (Vespula vulgaris) on experimentally placed
mealworms in a New Zealand beech forest. Oecologia 105(2), 266-270.

161
Beggs, J. (2001). The ecological consequences of social wasps (Vespula spp.)
invading an ecosystem that has an abundant carbohydrate resource.
Biological Conservation 99(1), 99.
Beggs, J. R. & Rees, J. S. (1999). Restructuring of Lepidoptera communities by
introduced Vespula wasps in a New Zealand beech forest. Oecologia 119,
565-571.
Berry, C. J. J. (1999). European hedgehogs (Erinaceus europeaus L.) and their
significance to the ecological restoration of Boundary Stream Mainland
Island, Hawkes Bay. Unpublished M.Sc. thesis. Wellington, Victoria
University.
Best, L. W. (1969). Food of the roof-rat (Rattus rattus L.) in two forest areas of New
Zealand. New Zealand Journal of Science 12, 258-267.
Blackwell, G. L., Potter, M. A. & McLennan, J. A. (2002). Rodent density indices
from tracking tunnels, snap-traps, and Fenn traps: do they tell the same
story? New Zealand Journal of Ecology 26(1), 43-51.
Bonte, D., Baert, L. & Maelfait, J. (2002). Spider assemblage structure and stability
in a heterogeneous coastal dune system (Belgium). Journal of
Arachnology 30(2), 331-341.
Booker, B. (2001). Waitakere Ranges Ground Invertebrate Research. Unpublished
Report for a Royal Society of New Zealand, Teacher Fellowship.
Auckland.
Booth, L. H., Fisher, P., Heppelthwaite, V., & Eason, C. T. (2003). Toxicity and
residue of brodifacoum in snails and earthworms. DOC Science Internal
Series 143. Wellington, New Zealand Department for Conservation.

162
Booth, L. H., Eason, C. T. & Spurr, E.B. (2001). Literature review of the acute
toxicity and persistance of brodifacoum to invertebrates. Science for
Conservation 177, 1-9.
Bremner, A. G., Barratt, B. I. P., Butcher, C.F. & Patterson, G.B. (1989). The effects
of mammalian predation on invertebrate behaviour in South West
Fiordland. New Zealand Entomologist 12, 72-75.
Brown, K. P., Moller, H., Innes, J. & Alterio, N. (1996). Calibration of tunnel
tracking rates to estimate relative abundance of ship rats (Rattus rattus)
and mice (Mus musculus) in a New Zealand forest. New Zealand Journal
of Ecology 20(2), 271-275.
Butterfield, J. (1996). Carabid life-cycle strategies and climate change: a study on an
altitude transect. Ecological entomology 21(1), 9-16.
Chapman, S., Alexander, J. & Ussher, G. (2004). Sampling of terrestrial
invertebrates to evaluate the effectiveness of pest control. Auckland,
Auckland Regional Council.
Clapperton, B. K. & Byron, A. E. (2005). Feral Ferret. In C. M. King (Ed.), The
Handbook of New Zealand Mammals (pp. 294-308). Melbourne, Oxford
University Press.
Clout, M. N. (1980). Ship rats (Rattus rattus L.) in a Pinus radiata plantation. New
Zealand Journal of Ecology 3, 141-145.
Clout, M. N. (2001). Where protection is not enough: active conservation in New
Zealand. Trends in ecology and evolution 16(8), 415-416.
Clout, M. N. & Hay, J. R. (1989). The importance of birds as browsers, pollinators
and seed dispersers in New Zealand forests. New Zealand Journal of
Ecology 12, 27-33.

163
Cochrane, C. H., Norton, D. A., Miller, C. J. & Allen, R. B. (2003). Brushtail possum
(Trichosurus vulpecula) diet in a north Westland mixed-beech
(Nothofagus) forest. New Zealand Journal of Ecology 27(1), 61-65.
Cone, A., Gordon, R., Frampton, C., Keesing, V., Miskell, B. & McFarlane, R.
(2001). Invertebrate colonisation of restoration plantings in
Christchurch. Discussion paper: restoring the health and wealth of
ecosystems, Christchurch.
Courchamp, F., Langlais, M. & Sugihara, G. (1999). Cats protecting birds: modeling
the mesopredator release effect. Journal of Animal Ecology 68 (2), 282-
292.
Cowan, P. E. (2005). Brushtail possum. In C. M. King (Ed.), The Handbook of New
Zealand Mammals (pp. 56-80). Melbourne, Oxford University Press.
Cowan, P. E. & Moeed, A. (1987). Invertebrates in the diet of brushtail possums
(Trichosurus vulpecula) in lowland podocarp/broadleaf forest,
Orongorongo Valley, Wellington, New Zealand. New Zealand Journal of
Zoology 14(2), 163-177.
Craddock, P. (1997). Effect of rodent control on invertebrate communities in coastal
forest near Auckland. Unpublished M.Sc. thesis. School of Biological
Sciences. Auckland, University of Auckland. 132 pp.
Craddock, P. (2003). Aspects of the ecology of forest invertebrates and the use of
brodifacoum. Unpublished Ph.D. thesis. School of Biological Sciences.
Auckland, University of Auckland. 235 pp.
Cranwell-Smith, L. (2006). Rain forest of the Waitakeres. In B. Harvey & T. Harvey
(Eds.), Waitakere Ranges (pp. 49-66). Waitakere City, Waitakere Ranges
Protection Society Inc.

164
Crisp, P. N., Dickinson, K. J. M. & Gibbs, G. W. (1998). Does native invertebrate
diversity reflect native plant diversity? A case study from New Zealand
and implications for conservation. Biological Conservation 83(2), 209-
220.
Crowe, A. (2002). Which New Zealand Insect, Auckland: Penguin Books. 127 pp.
Daugherty, C. H., Gibbs, G. W. & Hitchmough, R. A. (1993). Mega-island or micro-
continent? New Zealand and its fauna. Trends in Ecology & Evolution
8(12), 437-442.
Department of Conservation (2000). The New Zealand biodiversity strategy, our
chance to change the tide. Wellington, Ministry for the Environment.
Diamond, J. M. (1990). New Zealand as an archipelago: an international perspective
In D. R. Towns (Ed.), Ecological restoration of New Zealand Islands (3-
8). Wellington, New Zealand Department of Conservation.
Dowding, J. E. & Murphy, E. C. (1994). Ecology of ship rats (Rattus rattus) in a
kauri (Agathis australis) forest in Northland, New Zealand. New Zealand
Journal of Ecology 18, 19-27.
Dugdale, J. & Hutcheson, J. (1997). Invertebrate values of kanuka (Kunzea ericoides)
stands, Gisborne Region. Science for Conservation. Wellington New
Zealand Department for Conservation.
Eason, C. T., Murphy, E. C., Wright, G. R. & Spurr, E.B. (2001). Assessment of risks
of brodifacoum to non-target birds and mammals in New Zealand
Ecotoxicology 11(1), 35-48.
Esler, A. (2006). Forest Zones. In Harvey, B. & Harvey, T. (Eds.). Waitakere Ranges
(pp 67-73). Waitakere City, Waitakere Ranges Protection Society Inc.
165
Eyre, M. D. & Luff, M. L. (1990). The ground beetle (Coleoptera: Carabidae)
assemblages of British grasslands. Entomologist's Gazette 41, 197-20.
Eyre, M. D. & Luff, M. L. (2002). The use of ground beetles (Coleoptera: Carabidae)
in conservation assessments of exposed riverine sediment habitats in
Scotland and northern England. Journal of Insect Conservation 6, 22-38.
Field, L. H. (2001). The biology of Wetas, King Crickets and their Allies.
Wallingford, England: CABI Publishing.
Fitzgerald, B. M. (2001). Introduced mammals in a New Zealand forest: long-term
research in the Orongorongo Valley. Biological Conservation 99(1), 97.
Fowler, J., Cohen, L. & Jarvis, P. (1998). Practical Statistics for Field Biology.
Chichester, West Sussex: John Wiley and Sons.
Gibbs, G. W. (1998). Why are some weta (Orthoptera: Stenopelmatidae) vulnerable
yet others are common? Journal of Insect Conservation 2,161-166.
Gibbs, G. W. (1999). Insects at risk. Forest and Bird 294, 32-35.
Gibbs, G. W. & McIntyre, M. (1997). Abundance and future options for wetapunga
on Little Barrier Island. Science for Conservation 48. Wellington, New
Zealand Department of Conservation.
Gillies, C. & Pierce, R. J. (1999). Secondary poisoning of mammalian predators
during possum and rodent control operations at Trounson Kauri Park,
Northland, New Zealand New Zealand Journal of Ecology 23, 183-192.
Gillies, C. & Williams, D. (2003). Using tracking tunnels to monitor rodents and
other small mammals. Unpublished report, Science and Research Unit,
Wellington, New Zealand Department of Conservation.
Green, C. (2000). Pitfall trapping for long-term monitoring of invertebrates.
Ecological Management 8, 73-93.
166
Green, C. (2002). Recovery of invertebrate populations on Tiritiri Matangi Island,
New Zealand following eradication of Pacific rats (Rattus exulans). In C.
R. Veitch, and M. N. Clout (Eds.), Turning the tide: the eradication of
invasive species. Gland, Switzerland and Cambridge, United Kingdom,
Invasive species specialist group, 407 pp.
Gregory, A. (2006). Warmest December for 71 years. New Zealand Herald,
Auckland.
Handford, P. (2000). Native Forest Monitoring: A guide for forest owners and
managers. Wellington, New Zealand: Forme Consulting Group. 183 pp.
Harris, R. J. & Burns, B. R. (2000). Beetle assemblages of Kahikatea forest fragments
in a pasture-dominated landscape. New Zealand Journal of Ecology 24(1),
57-67.
Harris, R. J. & Oliver, E. H. (1993). Prey Diets and Population Densities of the
Wasps Vespula vulgaris and V. germanica in Scrubland Pasture. New
Zealand Journal of Ecology 17(1), 5-12.
Harvey, B. & Harvey, T. (2006). Prologue. In Harvey, B. & Harvey, T. (Eds.)
Waitakere Ranges (p.13). Waitakere City, New Zealand: Waitakere
Ranges Protection Society Inc.
Haw, J. M. (1998). Diet of Morepork (Ninox novaeseelandiae). Unpublished M.Sc.
thesis, School of Biological Sciences, Auckland, University of Auckland.
Haw, J. M., Clout, M. N. & Powlesland, R.G. (2001). Diet of moreporks (Ninox
novaeseelandiae) in Pureora Forest determined from prey remains in
regurgitated pellets. New Zealand Journal of Ecology 25(1), 61-67.

167
Hendra, R. (1999). Seasonal abundance patterns and dietary preferences of hedgehogs
at Trounson Kauri Park. Conservation Advisory Science notes, 267, 1-12.
Hilty, J. & Merenlender, A. (2000). Faunal indicator taxa selection for monitoring
ecosystem health. Biological Conservation 92, 185-197.
Hoare, J. M. & Hare, K. M. (2006). The impact of brodifacoum on non-target
wildlife: gaps in knowledge. New Zealand Journal of Ecology 30(2): 157-
167.
Holdaway, R. N. (1989). New Zealand's Pre-human Avifauna and its vulnerability.
New Zealand Journal of Ecology 12 (supplement), 11-25.
Hunt, M., Sherley, G. & Wakelin, M. (1998). Results of a pilot study to detect
benefits to large-bodied invertebrates from sustained regular poisoning of
rodents and possums at Kariori, Ohakune. Science for Conservation.
Wellington, Department of Conservation.
Hutcheson, J. (1994). Biodiversity: saving species or habitats. The Weta 17(12-16).
Hutcheson, J. (1999). Characteristics of Mapara insect communities as depicted by
Malaise trapped beetles: changes with time and animal control. Science
for Conservation. Wellington, Department of Conservation, 16-19.
Hutcheson, J., Walsh, P. & Given, D. (1999). Potential value of indicator species for
conservation and management of New Zealand terrestrial communities.
Science for Conservation. Wellington, Department for Conservation, 5-
62.
Hutcheson, M. (2001). Habitat use, seasonality and ecology of carabid beetles
(Coleoptera: Carabidae) in native forest remnants, North Island, New
Zealand. Unpublished M.Sc. thesis, Palmerston North, Massey
University.

168
Hutcheson, M. (2007). Seasonality and life histories of two endemic New Zealand
carabid beetles (Coleoptera: Carabidae): Mecodema occonori Broun and
Megadromus capito (White). New Zealand Journal of Zoology 34, 79-89
Ings, T. C. & Hartley, S. E. (1999). The effect of habitat structure on carabid
communities during the regeneration of a native Scottish forest. Forest
Ecology and Management 119(1), 123-136.
Innes, J., Warburton, B., Williams, D., Speed, H. & Bradfield, P. (1995). Large-Scale
Poisoning of Ship Rats (Rattus rattus) in Indigenous Forests of the North
Island, New Zealand New Zealand Journal of Ecology 19(1), 5-17.
Innes, J., Brown, K., Jansen, P., Shorten, R. & Williams, D. (1996). Kokako
population studies Rotoehu Forest and on Little Barrier Island. Science
for Conservation 30.
Innes, J. & Barker, G. (1999). Ecological consequences of toxin use for mammalian
pest control in New Zealand – an overview. New Zealand Journal of
Ecology 23(2), 111-127
Innes, J., Nugent, G., Prime, K. & Spurr, E.B. (2004). Responses of kukupa
(Hemiphaga novaeseelandiae) and other birds to mammal pest control at
Motatau. New Zealand Journal of Ecology 28(1), 73-82.
Innes, J. (2005). Ship Rat. In King, C. M. (Ed.), The Handbook of New Zealand
Mammals (pp.187-203). Melbourne, Oxford University Press.
James, R. E. & Clout, M. N. (1996). Nesting success of New Zealand pigeons
(Hemiphaga novaeseelandiae) in response to a rat (Rattus rattus)
poisoning programme at Wenderholm Regional Park. NZ Journal of
Ecology 20(1), 45-51.
169
Jansen, A. (1997). Terrestrial Invertebrates community structure as an indicator of the
success of a tropical rainforest restoration project. Restoration Ecology,
The Journal of the Society for Ecological Restoration International 5(2),
115-124.
Jones, C., Moss, K. & Sanders, M. (2005). Diet of hedgehogs (Erinaceus europaeus)
in the upper Waitaki Basin, New Zealand: Implications for conservation.
New Zealand Journal of Ecology 29(1), 29-35.
Jones, C. & Toft, R. (2006). Impact of mice and hedgehogs on native forest
invertebrates: a pilot study. DOC Research and Development Series 245
5-32. Wellington Department for Conservation.
King, C. M. (2005). Editor's Introduction. In. King ,C. M (Ed.), The Handbook of
New Zealand Mammals (pp.1-27). Melbourne, Oxford University Press.
King, C. M. (2005). Weasel. In King, C. M. (Ed.), The Handbook of New Zealand
Mammals Melbourne, Oxford University Press: 287-294.
King, C. M. & Murphy, E. C. (2005). Stoat. In King, C. M. (Ed.), The Handbook of
New Zealand Mammals (pp. 260-287). Melbourne, Oxford University
Press.
Kremen, C., Colwell, R. K., Erwin, T. L., Murphy, D. D., Noss, R. F. & Sanjayan,
M.A. (1993). Terrestrial Arthropod Assemblages: Their use in
conservation planning. Conservation Biology 7(4), 796-808.
Ladley, J. J., Kelly, D. & Robertson, A.W. (1997). Explosive flowering, nectar
production, breeding systems, and pollinators of New Zealand mistletoes
(Loranthaceae). New Zealand Journal of Botany 35, 345-360
Larochelle, A. & Lariviere, M. C. (2001). Fauna of New Zealand. Lincoln,
Canterbury, New Zealand: Manaakia Whenua Press. 285 pp.

170
Lassau, S. A., Hochuli, D. F., Cassis, G. & Reid, C. A. M. (2005). Effects of habitat
complexity on forest beetle diversity: do functional groups respond
consistently? Diversity and Distributions 11, 73-82.
Lovei, G. L. & Sunderland, K. D. (1996). Ecology and behavior of ground beetles
(Coleoptera: Carabidae). Annual Review of Entomology 41, 231-56.
Longcore, T. (2003). Terrestrial arthropods as indicators of ecological restoration
success in coastal sage scrub (California, U.S.A.). Restoration Ecology 11
(4), 379-409.
Luff, M. L., Eyre, M. D. & Rushton, S. P. (1992). Classification and prediction of
grassland habitats using ground beetles (Coleoptera: Carabidae). Journal
of Environmental Management 35(4), 315.
Luff, M. (1996). Use of Carabids as environmental indicators in grasslands and
cereals Annual Zoological Fennici 33, 185-195.
Major, J. D. (1983). Ants: Bio-indicators of minesite rehabilitation, land-use, and land
conservation. Environmental Management 7(4), 375-383.
McClelland, P. J., Ed. (2002). Eradication of Pacific rats (Rattus exulans) from
Whenua Hou Nature Reserve (Codfish Island), Putauhinu and Rarotoka
Islands, New Zealand. Turning the tide: the eradication of invasive
species. Gland, Invasive Species Specialist Group.
McColl, H. P. (1975). The invertebrate fauna of the litter surface of a Nothofagus
trucata forest floor, and the effect of microclimate on activity. New
Zealand Journal of Zoology 2(1), 15-34.
McCracken, D. I. (1994). A fuzzy classification of moorland ground beetle
(Coleoptera: Carabidae) and plant communities. Pedobiologia 38(1), 12-
27.

171
McGuinness, C. A. (2001). The Conservation Requirements for New Zealand's
Nationally Threatened Invertebrates. Department of Conservation.
Threatened Species Occasional Publication 20.
Meads, M. & Notman, P. (1993). Giant weta (Deinacrida heteracantha) survey of
Little Barrier Island 1992. Landcare research contract report
LC9293/105.
Miller, C. J. & Miller, T. K. (1995). Population Dynamics and Diet of Rodents on
Rangitoto Island, New Zealand, Including the Effect of a 1080 Poison
Operation. New Zealand Journal of Ecology 19(1), 19-27.
Ministry for the Environment (1997). The State of New Zealand's Environment.
Wellington, Ministry for the Environment.
Moeed, A. & Meads, M. J. (1983). Invertebrate Fauna of Four Tree Species in
OrongorongoValley, New Zealand, as Revealed by Trunk Traps. New
Zealand Journal of Ecology 6, 39-53.
Moeed, A. & Meads, M. J. (1985). Seasonality of pitfall trapped invertebrates in three
types of native forest, Orongorongo Valley, New Zealand. New Zealand
Journal of Zoology 12(1), 17-53.
Moeed, A. & Meads, M. J. (1986). Seasonality of litter-inhabiting invertebrates in
two native-forest communities Orongorongo Valley, New Zealand. New
Zealand Journal of Zoology 13(1), 46-64.
Moeed, A. & Meads, M. J. (1987). Invertebrate survey of offshore islands in relation
to potential food sources for the little spotted kiwi, Apteryx owenii (Aves:
Apterygidae). New Zealand Entomologist 10, 50-64.

172
Murphy, E. C. (1998). Effects of rat poisoning operations on abundance and diet of
mustelids in New Zealand podocarp forests. New Zealand Journal of
Zoology 25, 315-32.
Murphy, E. C., Clapperton, B. K., Bradfield, P. M. & Speed, H. J. (1998).
Brodifacoum residues in target and non-target animals following large-
scale poison operations in New Zealand podocarp-hardwood forests. New
Zealand Journal of Zoology 25, 307-314.
Murphy, E. C., Robbins, L., Young, J. B. & Dowding, J. E. (1999). Secondary
poisoning of stoats after an aerial 1080 poison operation in Pureora
Forest, New Zealand. New Zealand Journal of Ecology 23(2), 175-182.
Murphy, E. C., Keedwell, R. J., Brown, K.P. & Westbrooke, I. (2004). Diet of
mammalian predators in braided river beds in the central South Island,
New Zealand. Wildlife Research 31(6), 631-638.
Mussett, S. L. (2005). The effects of pest control on Hochstetter's Frog (Leiopelma
hochstetteri) Unpublished M.Sc. thesis. Auckland, University of
Auckland.
New, T. R. (1998). Invertebrate Surveys for Conservation, Melbourne, Australia:
Oxford University Press. 252 pp.
New, T. R. (1999). Untangling the Web: Spiders and the challenges of Invertebrate
Conservation. Journal of Insect Conservation 3(4), 251-256.
Niemela, J., Kotzei, J., Ashworth, A., Brandmayr, P., Desender, K., New, T., Penev,
L., Samways, M. & Spence, J. (2000). The search for common
anthropogenic impacts on biodiversity: a global network. Journal of
Insect Conservation 4, 3-9.

173
NPCA (2000). National Trap Catch Monitoring Protocol. National Possum Co-
ordination Agencies.
Potter, M., Stringer, I., Wakelin, M., Barrett, P. & Hedderley, D. (2006). Effects of
pest control on forest invertebrates in Tongariro National Park -
preliminary results. DOC Research and Development Series 230, 1-17.
Wellington, Department for Conservation.
Powlesland, R. G., Stringer, I. A. N. & Hedderley, D. I (2005). Effects of an aerial
1080 possum poison operation using carrot baits on invertebrates in
artificial refuges at Whirinaki Forest Park, 1999-2002. New Zealand
Journal of Ecology 29(2), 193-205.
Purdey, D. C. & King, C. M. (2004). Age Structure, dispersion and diet of a
population of stoats (Mustela erminea) in southern Fiordland during the
decline phase of the beechmast cycle. New Zealand Journal of Zoology
31, 205-225.
Reay, S. D. & Norton, D. A. (1999). Assessing the success of restoration plantings in
a temperate New Zealand Forest. Restoration Ecology, The Journal of the
Society for Ecological Restoration International 7(3), 298.
Rickard, C. G. (1996). Introduced small mammals and invertebrate conservation in a
lowland podocarp forest, South Westland, New Zealand. Unpublished
M.Sc. thesis. Christchurch, University of Canterbury.
Ruscoe, W. A. (2001). Advances in New Zealand mammalogy 1990-2000: House
Mouse. Journal of The Royal Society of New Zealand 31(1), 127-134.
Ruscoe, W. A. & Murphy, E. C. (2005). House Mouse. In C. M. King (Ed.), The
Handbook of New Zealand (pp.204-221).Melbourne, Oxford University
Press.

174
Saunders, A. (2000). A review of Department of Conservation mainland restoration
projects and recommendations for further action. Wellington, Department
of Conservation. 219 pp.
Schoener, T.W. & Spiller, D.A. (1996). Devastation of prey diversity by
experimentally introduced predators in the field. Nature 381, 691-694.
Sherley, G. (1996). Biodiversity research for conservation in New Zealand: lessons
from Australia. Science and Research internal report. No. 154.
Wellington, New Zealand Department for Conservation.
Sim, M. (2005). Invertebrate community response to sustained pest control in
Nothofagus beech forest. Unpublished M.Sc. thesis. Auckland, University
of Auckland.
Sinclair, L., McCartney, J., Godfrey, J., Pledger, S., Wakelin, M. & Sherley G.
(2005). How did invertebrates respond to eradication of rats from Kapiti
Island, New Zealand? New Zealand Journal of Zoology 32, 293-315.
Southwood, T. R. E. & Henderson, P. (2000). Ecological Methods (3rd ed.). London:
Blackwell Science. 592pp.
Spurr, E. B. & Berben, P. H. (2004). Assessment of non-target impact of 1080-
poisoning for vertebrate pest control on weta (Orthoptera:
Anostostomatidae and Rhaphidophoridae) and other invertebrates in
artificial refuges. New Zealand Journal of Ecology 28(1), 63-72.
Taylor, R. J. & Doran, N. (2001). Use of terrestrial invertebrates as indicators of the
ecological sustainability of forest management under the Montreal
Process. Journal of Insect Conservation 5(4), 221-231.
Terborgh, J., 2000. A matter of stewardship. Journal of Conservation Biology 14,
1358-1361.

175
Toft, R. J. & Rees ,J. S. (1998). Reducing predation of orb-web spiders by controlling
common wasps (Vespula vulgaris) in New Zealand beech forest.
Ecological Entomology 23(1), 90-96.
Towns, D. R. (1994). The role of ecological restoration in the conservation of
Whitaker's skink (Cyclodina whitakeri), a rare New Zealand lizard
(Lacertilia: Scincidae). New Zealand Journal of Zoology 21, 457-471.
Towns, D. R. (2002). Korapuki Island as a case study for restoration of insular
ecosystems in New Zealand. Journal of Biogeography 29(5-6), 593-615.
Towns, D. R. & Broome, K. G. (2003). From small Maria to massive Campbell: forty
years of rat eradication from New Zealand islands. New Zealand Journal
of Zoology 30, 377-398.
Uetz, G. W. (1979). The influence of variation in litter habitats on spider
communities. Oecologia 40(1), 29-42.
Underwood, A. J. (1992). Beyond BACI: the detection of environmental impacts on
populations in the real, but variable, world. Journal of Experimental
Marine Biology Ecology 161, 145-178.
Ussher, G. T. (1995). Feeding ecology and dietary interactions of tuatara and kiore
on the Chicken Islands. Unpublished M.Sc. thesis. Auckland, University
of Auckland.
Ussher, G. (2006). Monitoring brief 008. Unpublished report. Auckland, Auckland
Regional Council.
Van Aarde, R. J., Ferreira, S. M. & Wassenaar, T. D. (2004). Do feral house mice
have an impact on invertebrate communities on sub-Antarctic Marion
Island? Austral Ecology 29(2), 215.
Veitch, C. R. (1983). A cat problem removed. Wildlife Research 12, 47-49.

176
Ward-Smith, T., Sullivan, W. Nakagawa, K., Abbott, P., Macdonald, P. &
Stephenson, B. (2004). Invertebrate monitoring Boundary Stream
Mainland Island Project 2003-04 Annual Report. Wellington, Department
of Conservation 55-63.
Watts, C. H. (1999). Beetles (Coleoptera) as indicators of ecological restoration: a
study of revegetated habitats on Matiu/Somes Island, Wellington, New
Zealand. Unpublished M.Sc. thesis.Wellington, Victoria University.
Watts, C. H. & Gibbs, G. W. (2002). Revegetation and its effect on the ground-
dwelling beetle fauna of Matiu/Somes Island, New Zealand. Restoration
Ecology, The Journal of the Society for Ecological Restoration
International 10(1), 96-106.
Watts, C. H. (2004). Ground-dwelling beetles in Karori Wildlife sanctuary before and
after mammal pest eradication Hamilton Landcare Research Contract
Report LC 0304. 126 pp.
Webb, N. R. & Hopkins, P. J. (1984). Invertebrate diversity on fragmented Calluna
heathland. Journal of Applied Ecology 21(3), 921-933.
Wilson, E. D. (1985). The biological diversity crisis. Bioscience 35(11), 700-706.
Wilson, E. O. (1987). The Little Things that run the World (The Importance and
Conservation of Invertebrates). Conservation Biology 1(4), 344-346.
Young, D. (2004). Our Selves. A history of conservation in New Zealand. Otago,
New Zealand:University of Otago Press. 298 pp.

177
APPENDIX 1
Plant Species List
Kanuka Treatment Agathis australis Alseuosmia macrophylla Blechnum filiforme Collospermum hastatum Coprosma arborea Coprosma lucida Coprosma robusta Cordyline australis Cyathea dealbata Cyathea medullaris Lygodium articulatum Dacrydium cupressinum Dicksonia squarrosa Freycinetia banksii Gahnia setifolia Geniostoma ruprestre Hebe stricta Hedycarya arborea Hoheria populnea Knightia excelsa Kunzea ericoides Lastreopsis glabella Leucopogon fascilulatus Lygodium articulatum Melicytus ramiflorus Metrosideros fulgens Myrsine australis Olearia rani Phyllocladus trichomanoides Pittosporum eugenioides Pittosporum tenuifolium Podocarpus totara Prumopitys ferruginea Pseudopanax crassifolius Pseudopanax lessonii Rhopalostylis sapida Rubus cissoides Schefflera digitata
Kanuka Control 1 Agathis australis Asplenium fulcatum Beilschmiedia tarairi Blechnum filiforme Coprosma arborea Coprosma lucida Coprosma robusta Cyathea dealbata Cyathea medullaris Dacrycarpus dacrydioides Freycinetia banksii Gahnia setifolia Geniosotoma rupestre Hebe stricta Hedycarya arborea Knightia excelsa Kunzea ericoides Lygodium articulatum Melicytus ramiflorus Metrosideros fulgens Olearia rani Phormium tenax Phyllocladus trichomanoides Pittosporum tenuifolium Pneumatopteris pennigera Pseudopanax crassifolius Pseudopanax lessonii Rhopalostylis sapida Rubus cissoides Schefflera digitata Tmesipteris lanceolata Toronia toru
Kanuka Control 2 Blechnum filiforme Brachyglottis repandra Coprosma arborea Coprosma lucida Coprosma robusta Cyathea dealbata Cyathea medullaris Freycinetia banksii Geniostoma rupestre Hedycarya arborea Hoheria populnea Knightia excelsa Kunzea ericoides Melicytus ramiflorus Olearia rani Phymatosorus pustulatus Pseudopanax crassifolius Pseudopanax lessonii Rhopalostylis sapida Schefflera digitata

178
Podocarp Treatment Agathis australis Alseuosmia macrophylla Asplenium flaccidum Beilschmiedia tawa Brachyglottis repandra Collospermum hastatum Coprosma lucida Coprosma robusta Cyathea dealbata Cyathea medullaris Dacrycarpus dacrydioides Dacrydium cupressinum Elaeocarpus dentatus Freycinetia banksii Gahnia setifolia Geniostoma rupestre Hedycarya arborea Hoheria populnea Knightia excelsa Lygodium articulatum Melicytus ramiflorus Metrosideros fulgens Mida salicifolia Myrsine australis Nestegis cunninghamii Olearia rani Phymatosorus pustulatus Pittosporum tenuifolium Prumnopitys ferruginea Pseudopanax crassifolius Pseudowintera colorata Rhopalostylis sapida Ripogonum scandens Rubus cissoides
Podocarp Control 1 Agathis australis Asplenium flaccidum Beilschmiedia tawa Brachyglottis repandra Collospermum hastatum Coprosma arborea Coprosma lucida Coprosma robusta Corokia buddleioides Cyathea dealbata Cyathea medullaris Dysoxylum spectabile Elaeocarpus dentatus Freycinetia banksii Geniostoma rupestre Hedycarya arborea Hoheria populnea Knightia excelsa Leucopogon fasciculatus Lygodium articulatum Melicytus ramiflorus Metrosideros fulgens Myrsine australis Nestegis cunninghamii Olearia rani Phyllocladus trichomanoides Pittosporum tenuifolium Pseudopanax crassifolius Pseudopanax lessonii Rhopalostylis sapida Ripogonum scandens Rubus cissoides
Podocarp Control 2 Alseuosmia macrophylla Asplenium flaccidum Beilschmiedia tawa Blechnum frazeri Clematis paniculata Collospermum hastatum Coprosma grandifolia Coprosma robusta Cyathea dealbata Cyathea medullaris Dacrycarpus dacrydioides Dicksonia squarrosa Dysoxylum spectabile Freycinetia banksii Geniostoma rupestre Griselinia lucida Hedycarya arborea Knightia excelsa Lygodium articulatum Melicytus ramiflorus Metrosideros fulgens Myrsine australis Nestegis cunninghamii Olearia rani Phymatosorus pustulatus Prumnopitys ferruginea Pseudopanax lessonii Quintinia serrata Ripogonum scandens Rhophalostylis sapida Rubus cissoides Schefflera digitata

179
Taraire Treatment Alseuosmia macrophylla Asplenium flaccidum Astelia trinerva Beilschmiedia tarairi Beilschmiedia tawa Blechnum filiforme Coprosma grandifolia Corynocarpus laevigatus Cyathea dealbata Cyathea medullaris Dicksonia squarrosa Dysoxylum spectabile Freycinetia banksii Geniostoma rupestre Hedycarya arborea Hoheria populnea Knightia excelsa Lastreopsis glabella Lygodium articulatum Melicytus ramiflorus Pellaea rotundifolia Pittosporum tenuifolium Rhipogonum scandens Schefflera digitata
Taraire Control 1 Asplenium flaccidum Asplenium lucidum Astelia trinervia Beilschmiedia tarairi Beilschmiedia tawa Blechnum filiforme Brachyglottis repandra Coprosma arborea Coprosma grandifolia Coprosma lucida Coprosma robusta Corynocarpus laevigatus Collospermum hastatum Cyathea dealbata Dysoxylum spectabile Freycinetia banksii Geniostoma rupestre Griselinia lucida Hebe stricta Hedycarya arborea Hoheria populnea Knightia excelsa Lastreopsis hispida Leucopogon fasciculatus Melicytus ramiflorus Mertosideros fulgens Metrosideros perforata Myrsine australis Phyllocladus trichomanoides Phymatosorus pustulatus Pneumatopteris pennigera Pseudopanax crassifolius Pseudopanax lessonii Rhopalostylis sapida Schefflera digitata Uncinia uncinata
Taraire Control 2 Agathis australis Astelia trinervia Beilschmiedia tarairi Brachyglottis repandra Cordyline australis Cyathea dealbata Geniostoma rupestre Griselinia lucida Hedycarya arborea Knightia excelsa Melicytus ramiflorus Metrosideros fulgens Rhabdothamnus solandri Rhopalostylis sapida Sophora microphylla
Related Documents