The deck is fair. The deck is not fair. Say, “the deck isn’t fair.” Oops. (false positive) Right! Say, “the deck is fair” Right! Oops. (false negative) One of these will be true… but you don’t know which one.

Welcome message from author
This document is posted to help you gain knowledge. Please leave a comment to let me know what you think about it! Share it to your friends and learn new things together.
Transcript
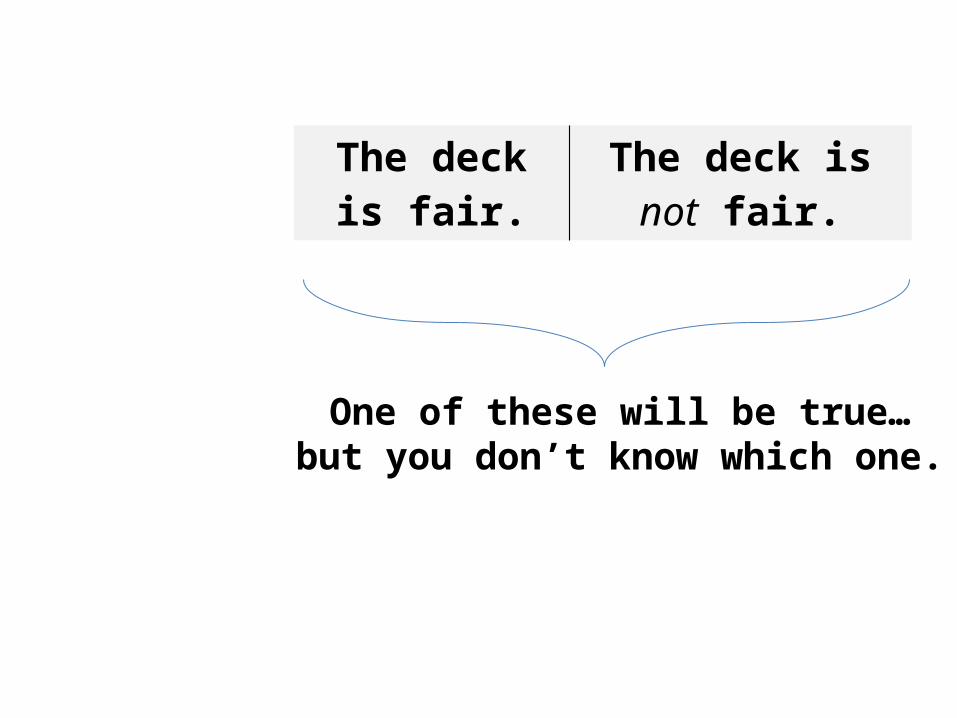
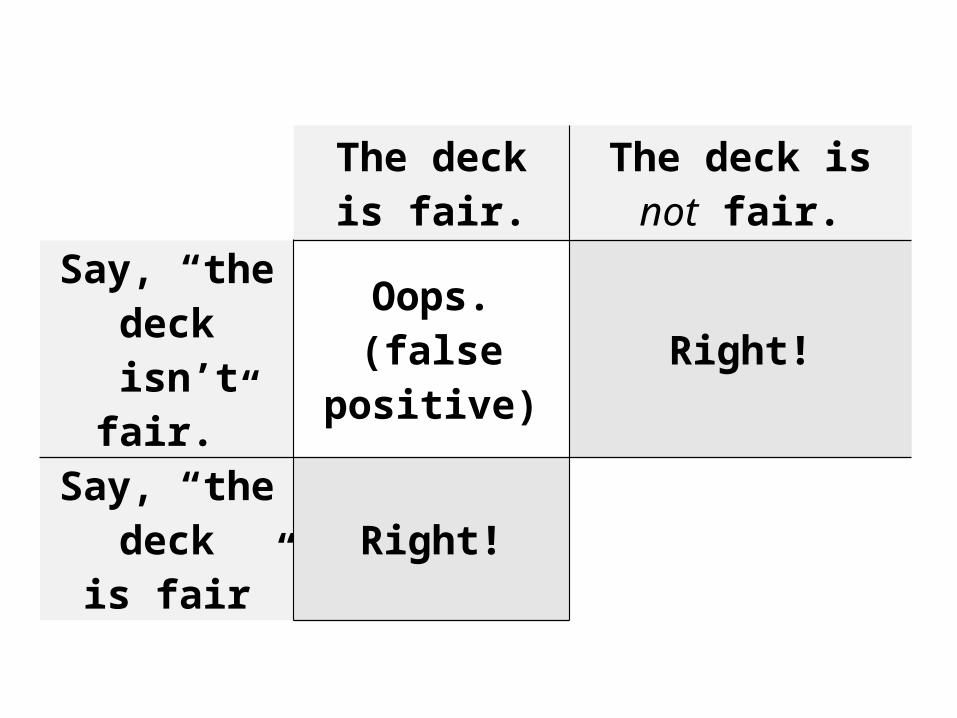
The deck is fair. The deck is not fair.
Say, “the deck isn’t fair.”
Oops.(false positive) Right!
Say, “the deck is fair”
Right! Oops.(false negative)
One of these will be true…but you don’t know which one.
The deck is fair. The deck is not fair.
Say, “the deck isn’t fair.”
Oops.(false positive) Right!
Say, “the deck is fair” Right! Oops.
(false negative)
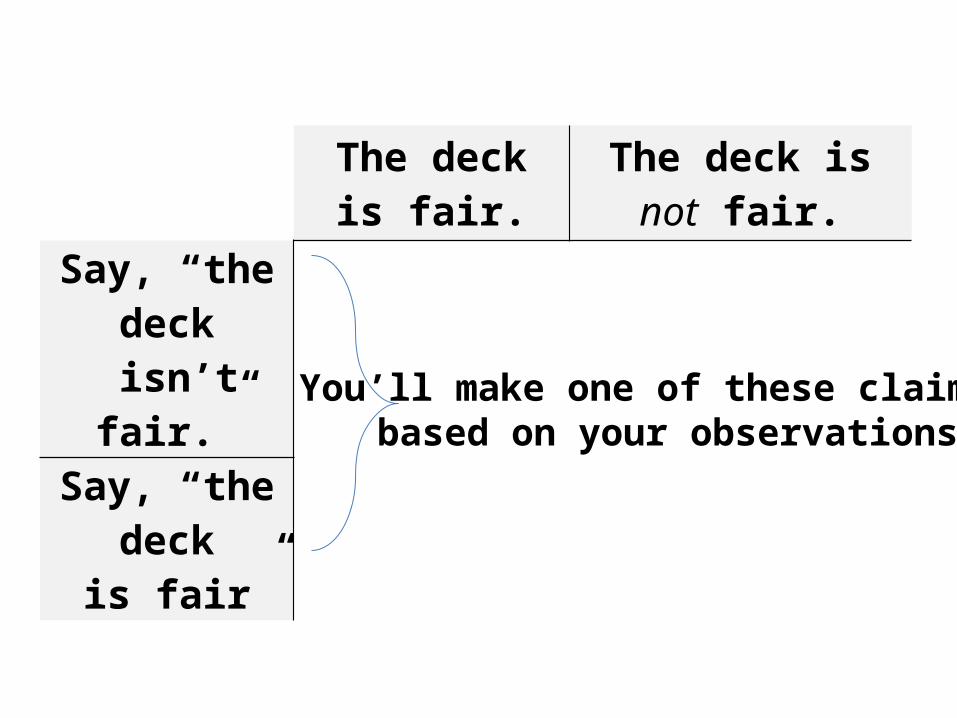
You’ll make one of these claims, based on your observations
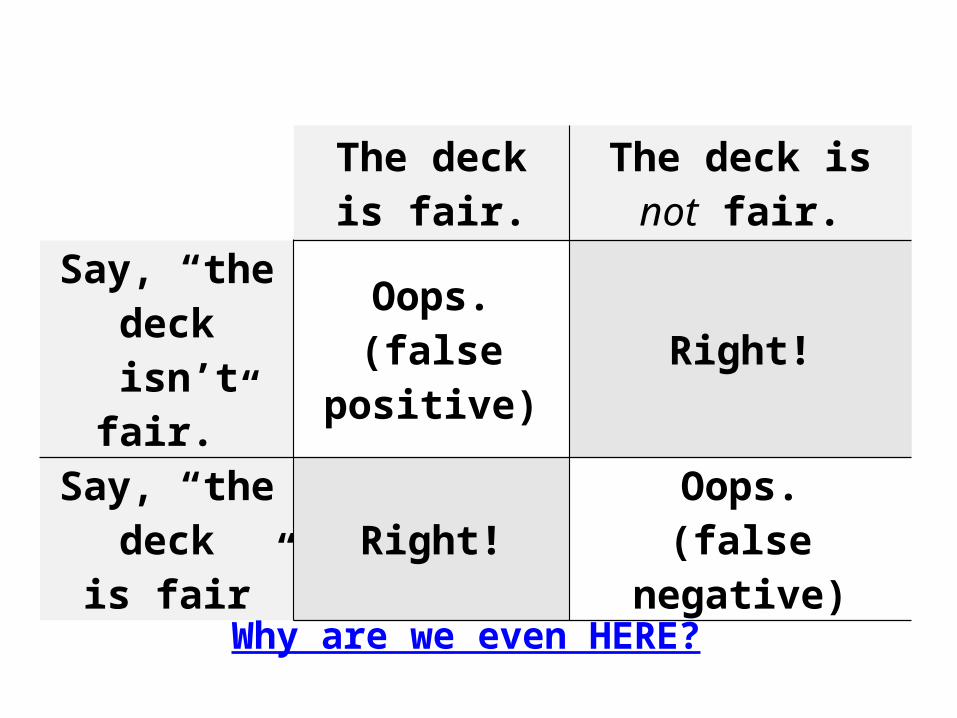
The deck is fair. The deck is not fair.
Say, “the deck isn’t fair.”
Oops.(false positive) Right!
Say, “the deck is fair” Right! Oops.
(false negative)
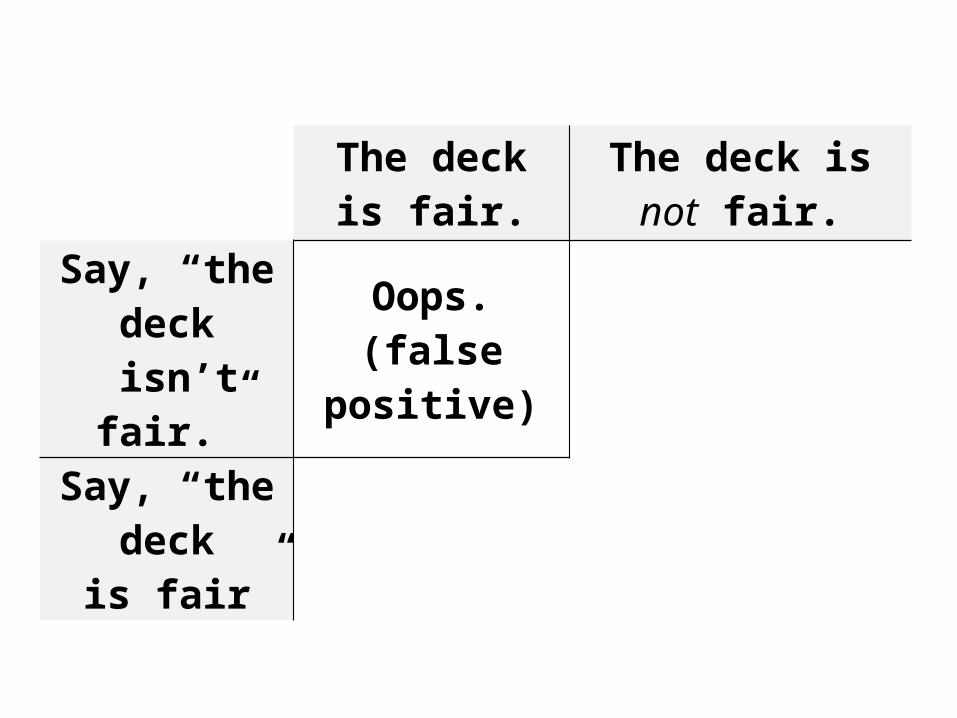
The deck is fair. The deck is not fair.
Say, “the deck isn’t fair.”
Oops.(false positive) Right!
Say, “the deck is fair” Right! Oops.
(false negative)
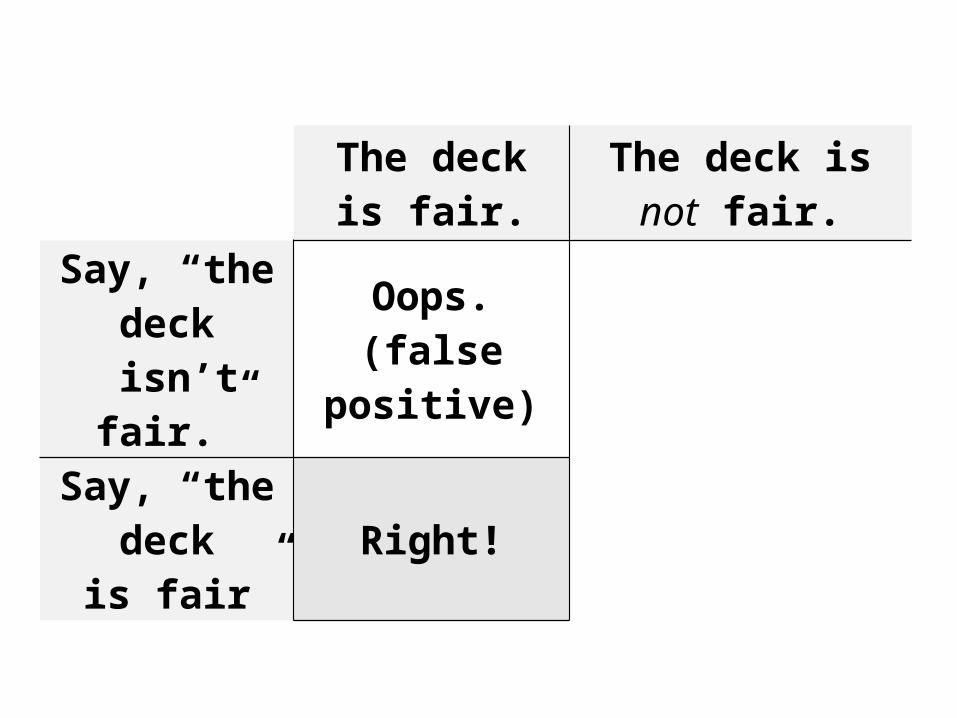
The deck is fair. The deck is not fair.
Say, “the deck isn’t fair.”
Oops.(false positive) Right!
Say, “the deck is fair” Right! Oops.
(false negative)
The deck is fair. The deck is not fair.
Say, “the deck isn’t fair.”
Oops.(false positive) Right!
Say, “the deck is fair” Right! Oops.
(false negative)
Why are we even HERE?
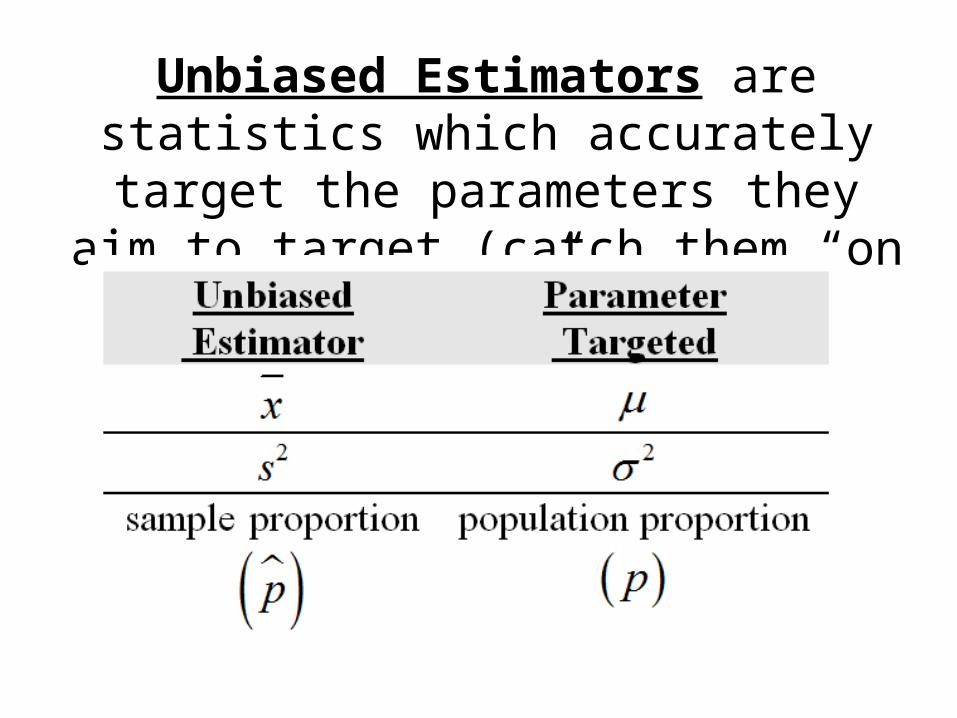
Unbiased Estimators are statistics which accurately target the parameters they aim
to target (catch them “on average”).
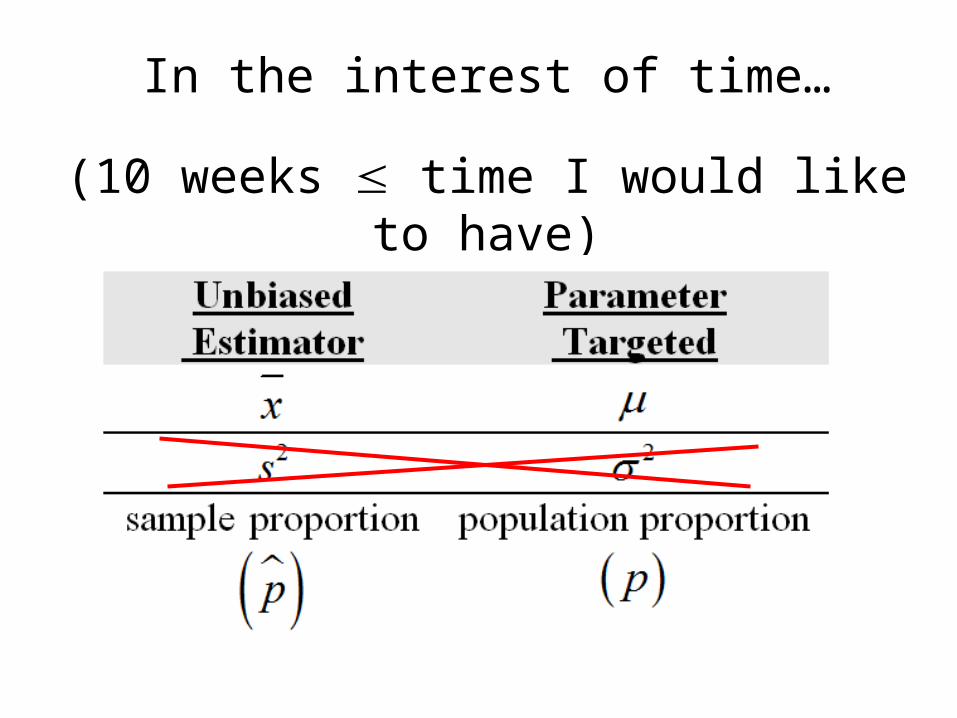
In the interest of time…
(10 weeks time I would like to have)
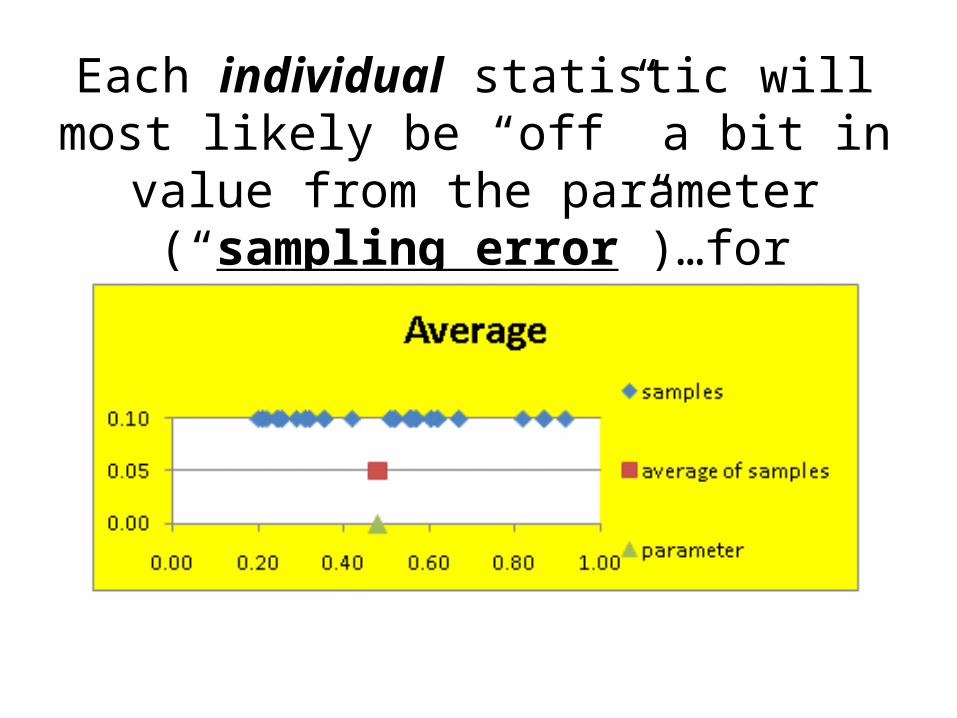
Each individual statistic will most likely be “off” a bit in value from the parameter
(“sampling error”)…for example…
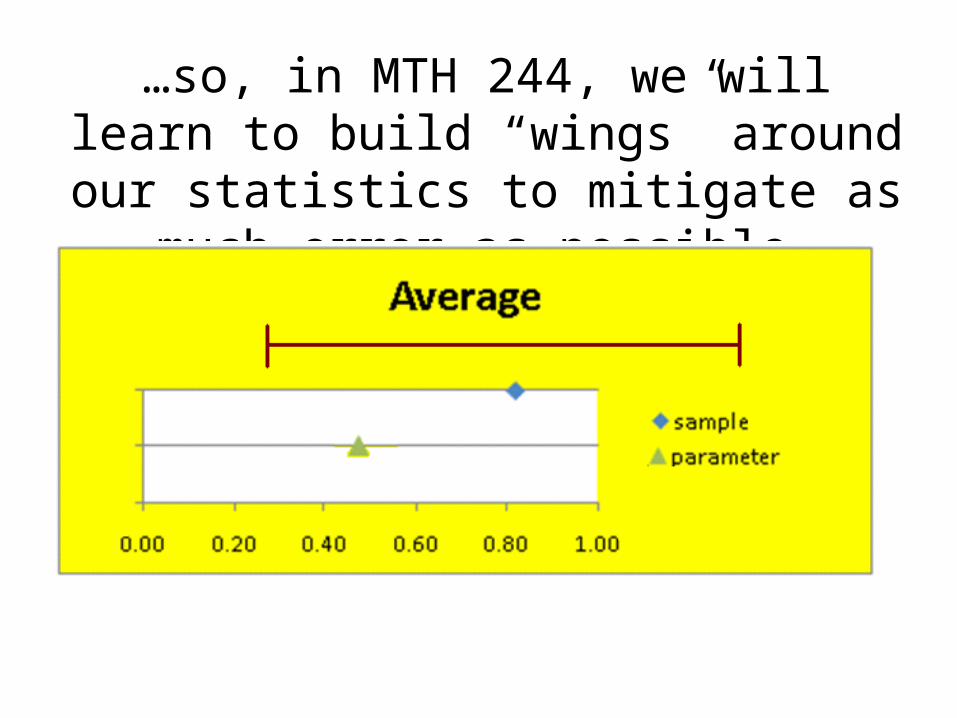
…so, in MTH 244, we will learn to build “wings” around our statistics to mitigate as
much error as possible…
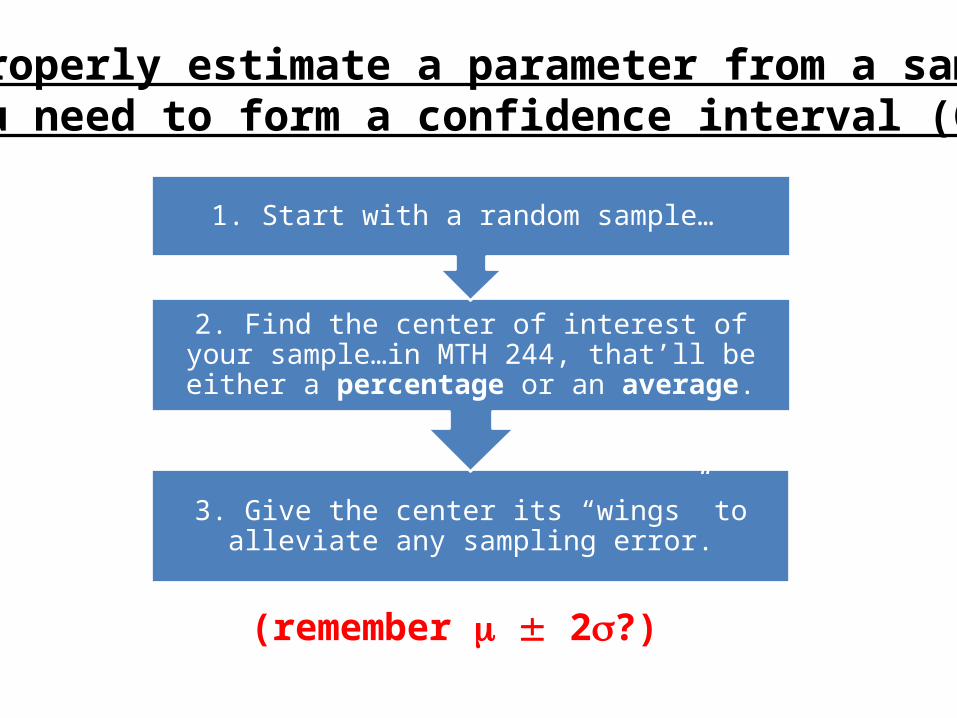
To properly estimate a parameter from a sample, you need to form a confidence interval (CI)…
3. Give the center its “wings” to alleviate any sampling error.
2. Find the center of interest of your sample…in MTH 244, that’ll be either a percentage or an average.
1. Start with a random sample…
(remember 2?)

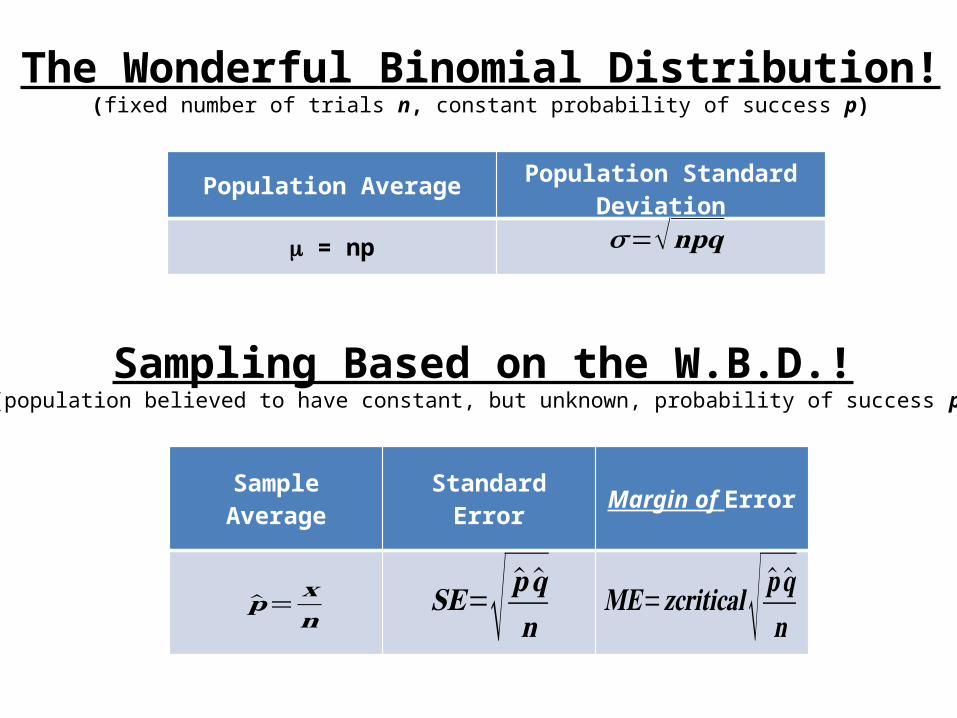
The Wonderful Binomial Distribution!(fixed number of trials n, constant probability of success p)
Population Average Population Standard Deviation
= np 𝛔=√𝐧𝐩𝐪
Sampling Based on the W.B.D.!(population believed to have constant, but unknown, probability of success p)
Sample Average Standard Error Margin of Error
𝐒𝐄=√ �̂� �̂�𝐧�̂�=𝐱𝐧 𝐌𝐄=𝐳𝐜𝐫𝐢𝐭𝐢𝐜𝐚𝐥 √ �̂� �̂�𝐧
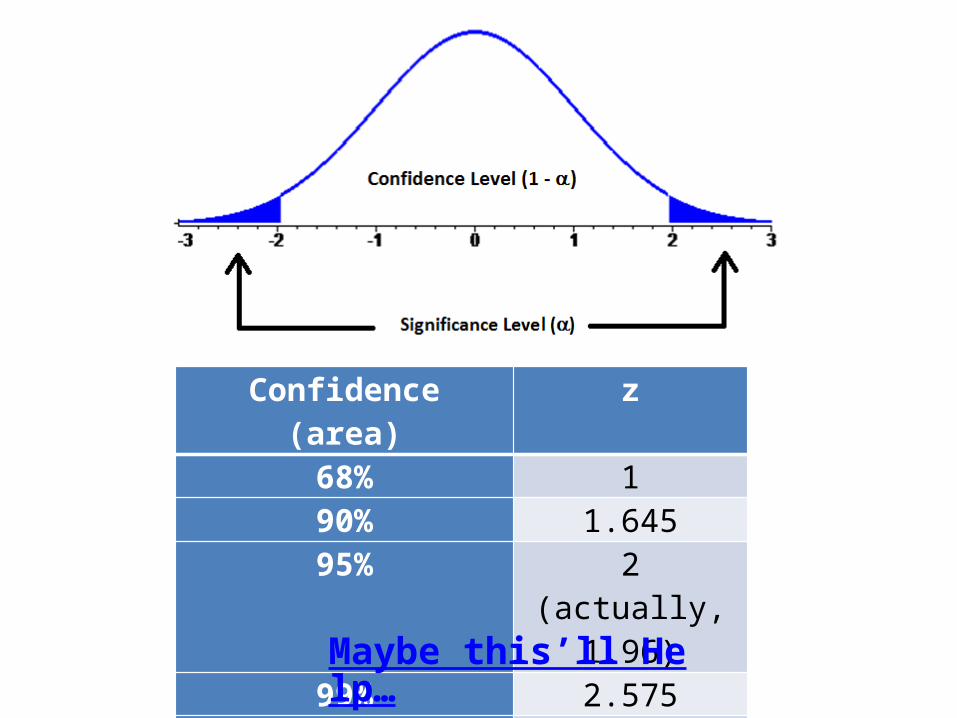
Confidence (area) z68% 190% 1.64595% 2 (actually, 1.96)99% 2.575
99.7% 3
Maybe this’ll Help…
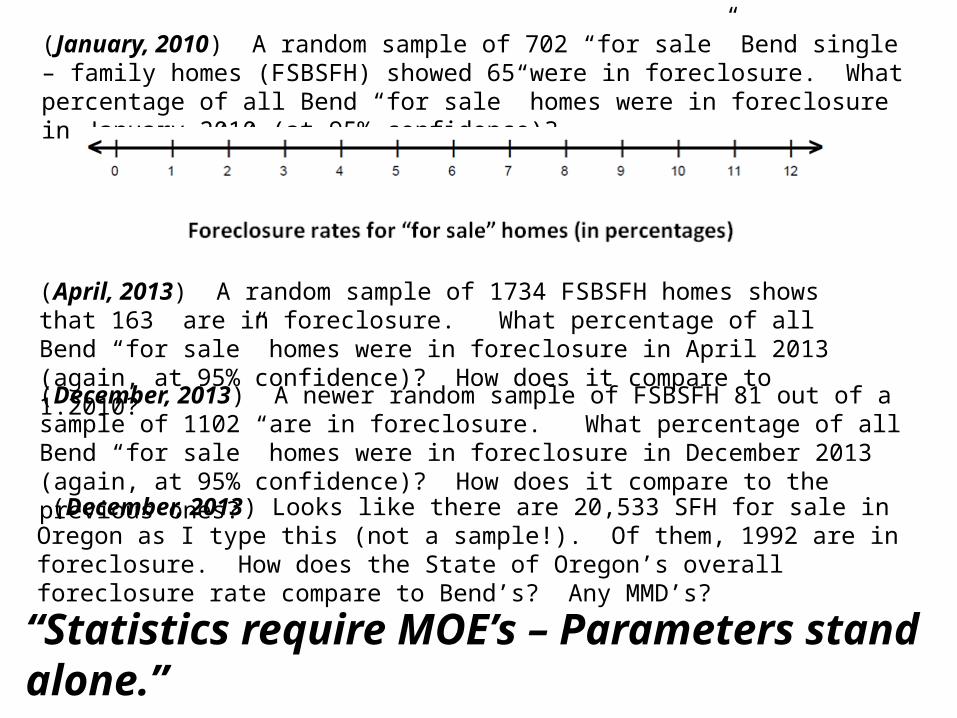
(January, 2010) A random sample of 702 “for sale” Bend single – family homes (FSBSFH) showed 65 were in foreclosure. What percentage of all Bend “for sale” homes were in foreclosure in January 2010 (at 95% confidence)?
(April, 2013) A random sample of 1734 FSBSFH homes shows that 163 are in foreclosure. What percentage of all Bend “for sale” homes were in foreclosure in April 2013 (again, at 95% confidence)? How does it compare to 1.2010?
(December, 2013) A newer random sample of FSBSFH 81 out of a sample of 1102 are in foreclosure. What percentage of all Bend “for sale” homes were in foreclosure in December 2013 (again, at 95% confidence)? How does it compare to the previous ones?
(December, 2013) Looks like there are 20,533 SFH for sale in Oregon as I type this (not a sample!). Of them, 1992 are in foreclosure. How does the State of Oregon’s overall foreclosure rate compare to Bend’s? Any MMD’s?
“Statistics require MOE’s – Parameters stand alone.”

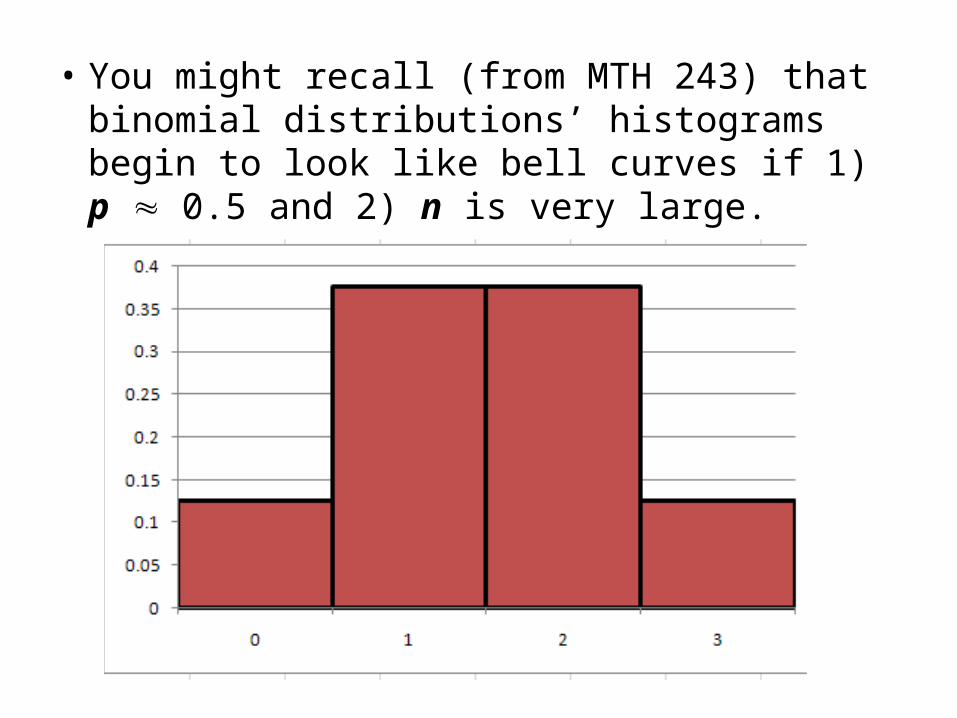
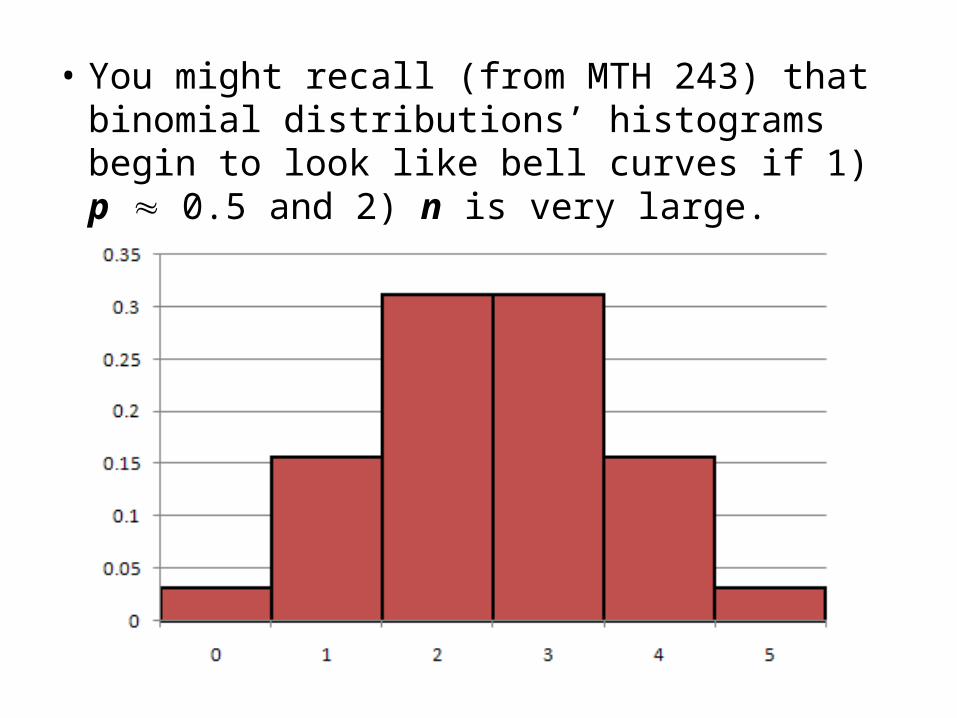
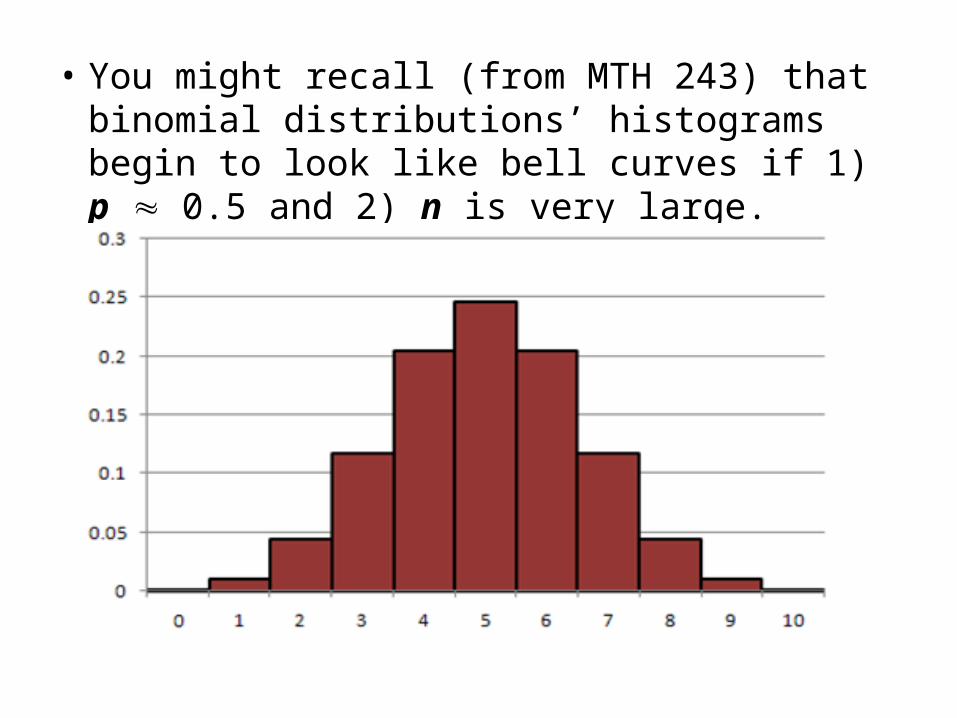
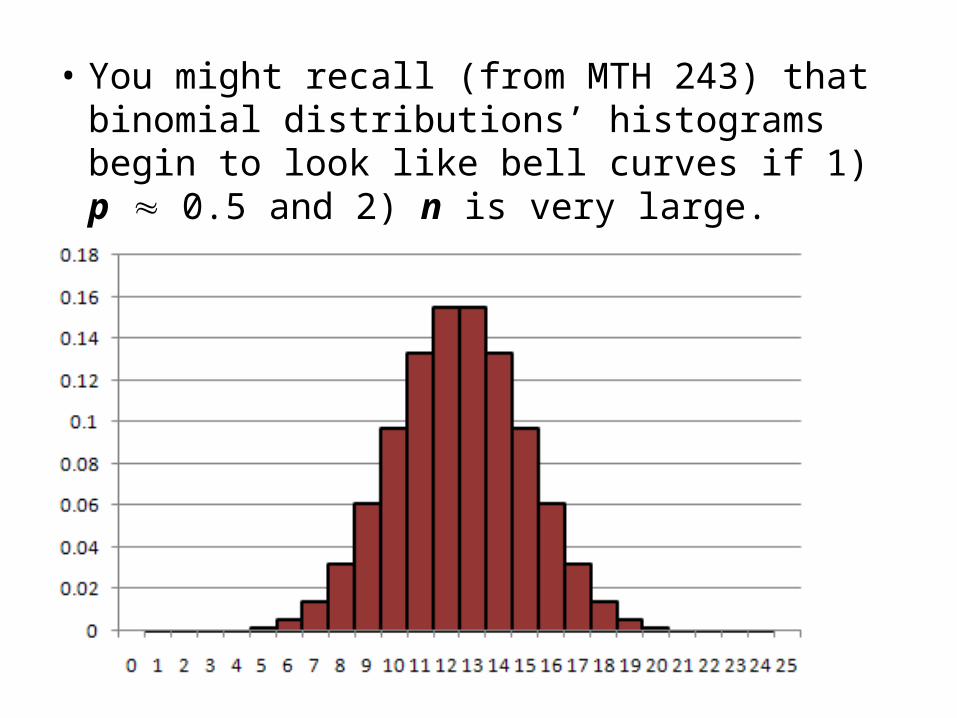
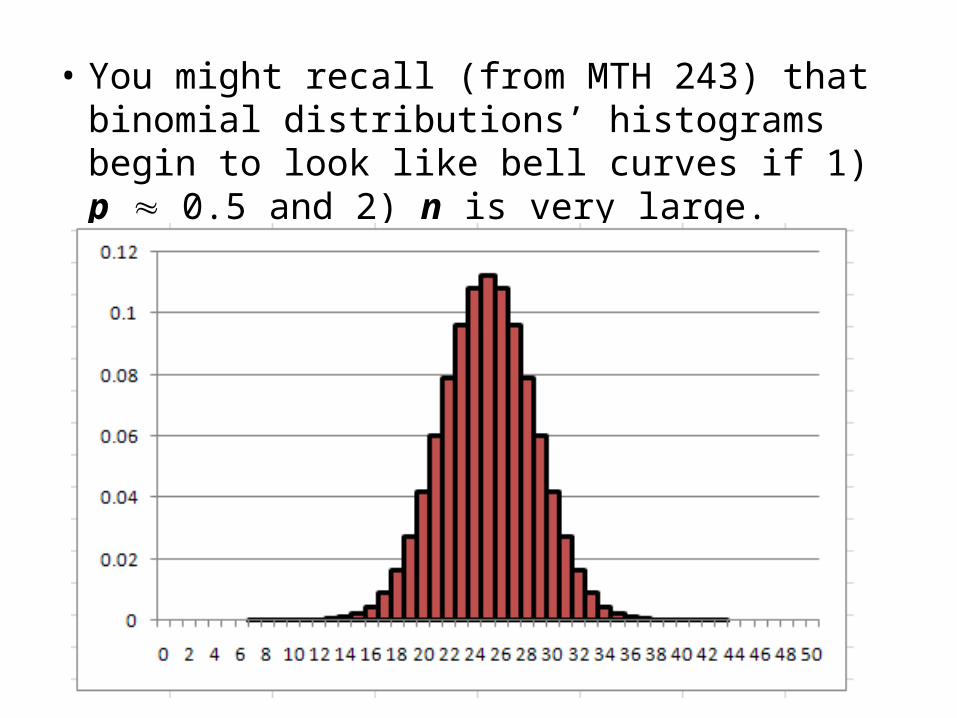
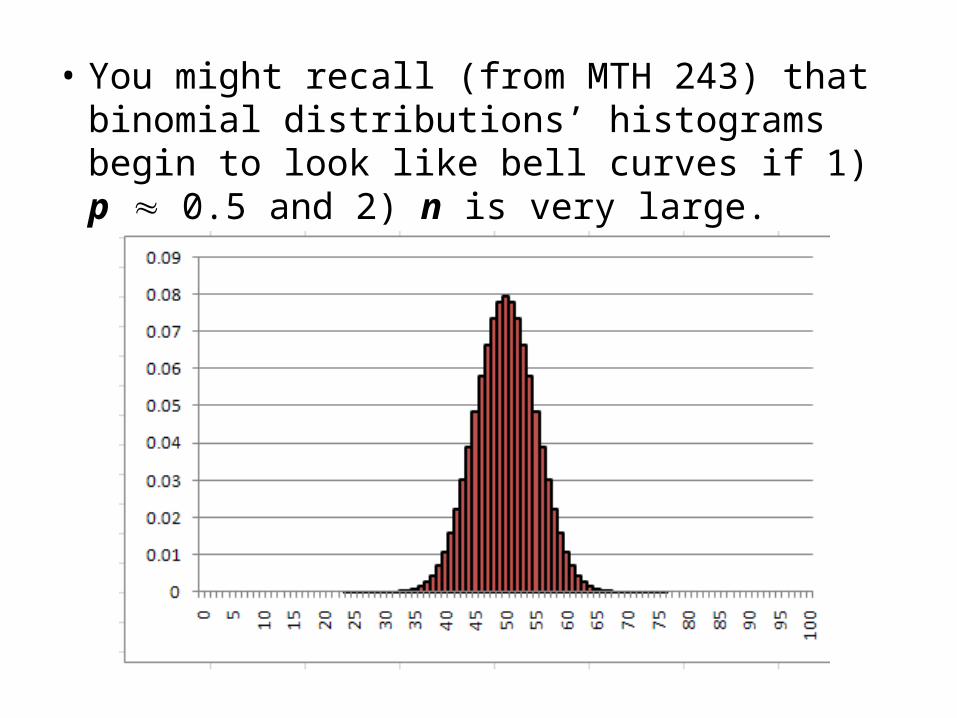
• You might recall (from MTH 243) that binomial distributions’ histograms begin to look like bell curves if 1) p 0.5 and 2) n is very large.
• You might recall (from MTH 243) that binomial distributions’ histograms begin to look like bell curves if 1) p 0.5 and 2) n is very large.
• You might recall (from MTH 243) that binomial distributions’ histograms begin to look like bell curves if 1) p 0.5 and 2) n is very large.
• You might recall (from MTH 243) that binomial distributions’ histograms begin to look like bell curves if 1) p 0.5 and 2) n is very large.
• You might recall (from MTH 243) that binomial distributions’ histograms begin to look like bell curves if 1) p 0.5 and 2) n is very large.
• You might recall (from MTH 243) that binomial distributions’ histograms begin to look like bell curves if 1) p 0.5 and 2) n is very large.
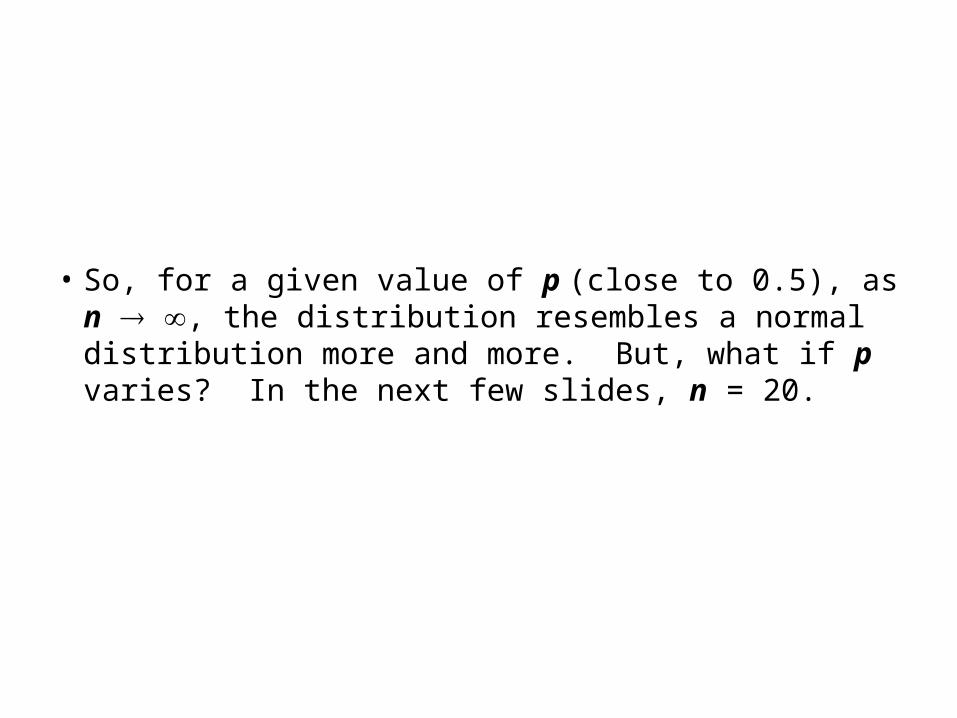
• So, for a given value of p (close to 0.5), as n , the distribution resembles a normal distribution more and more. But, what if p varies? In the next few slides, n = 20.
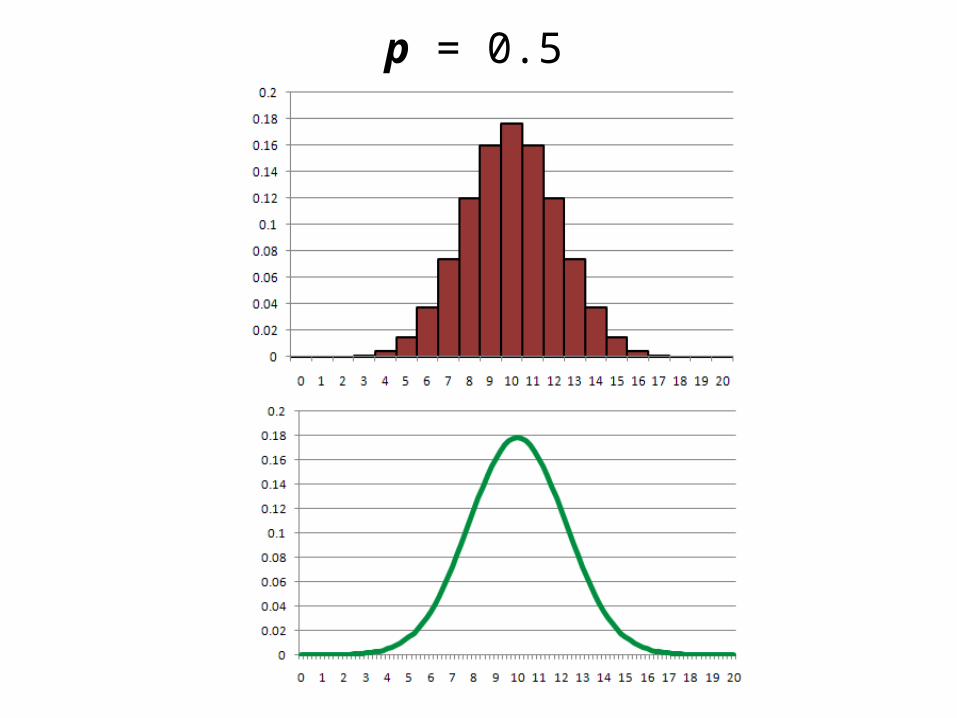
p = 0.5
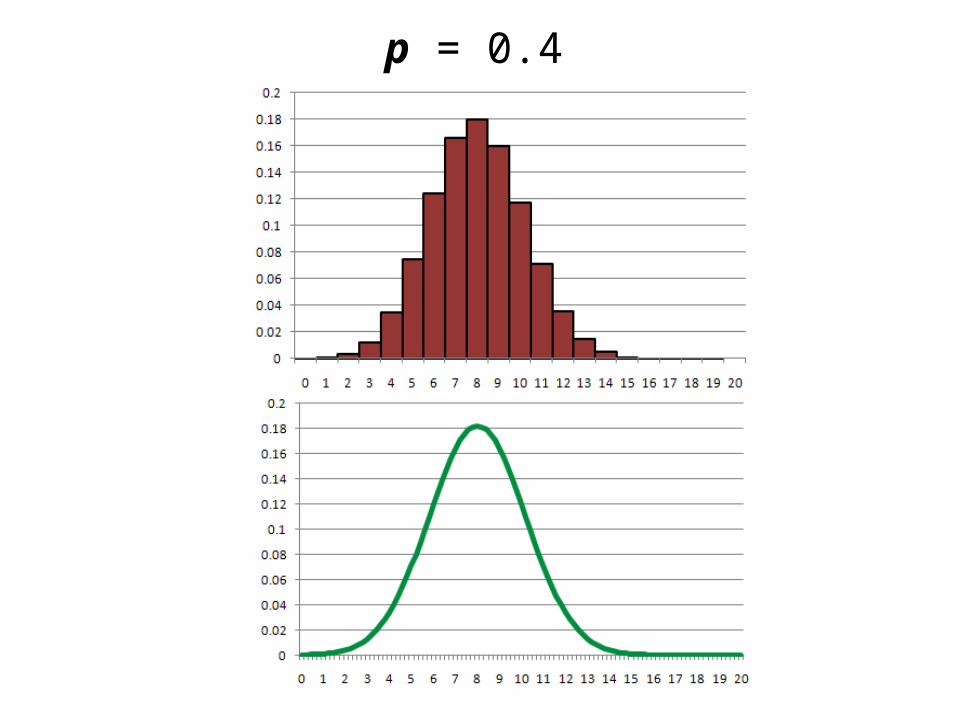
p = 0.4
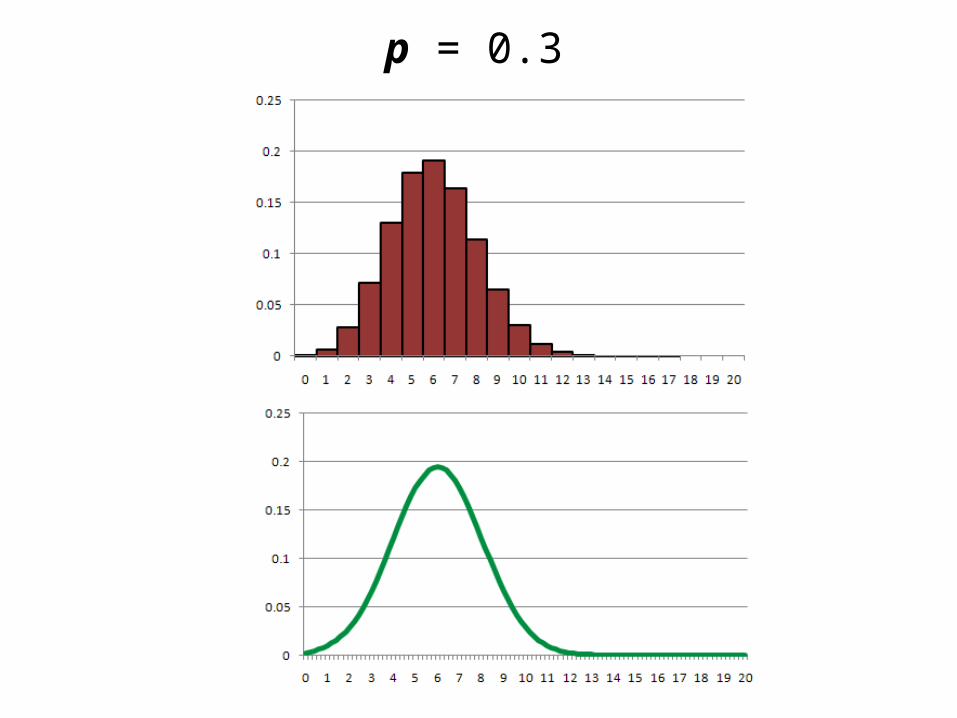
p = 0.3
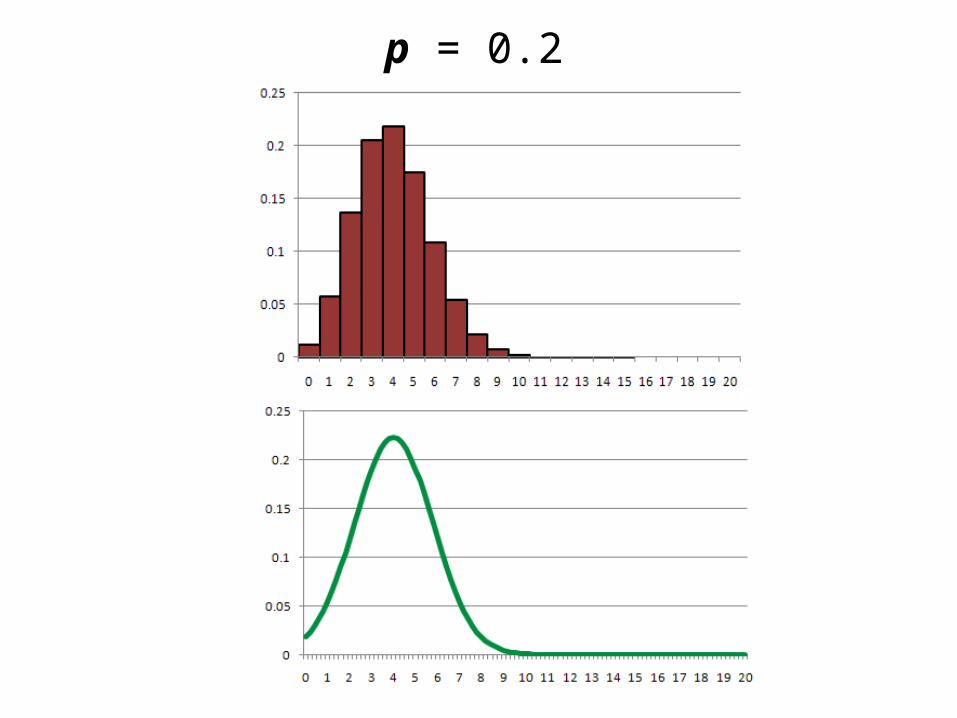
p = 0.2
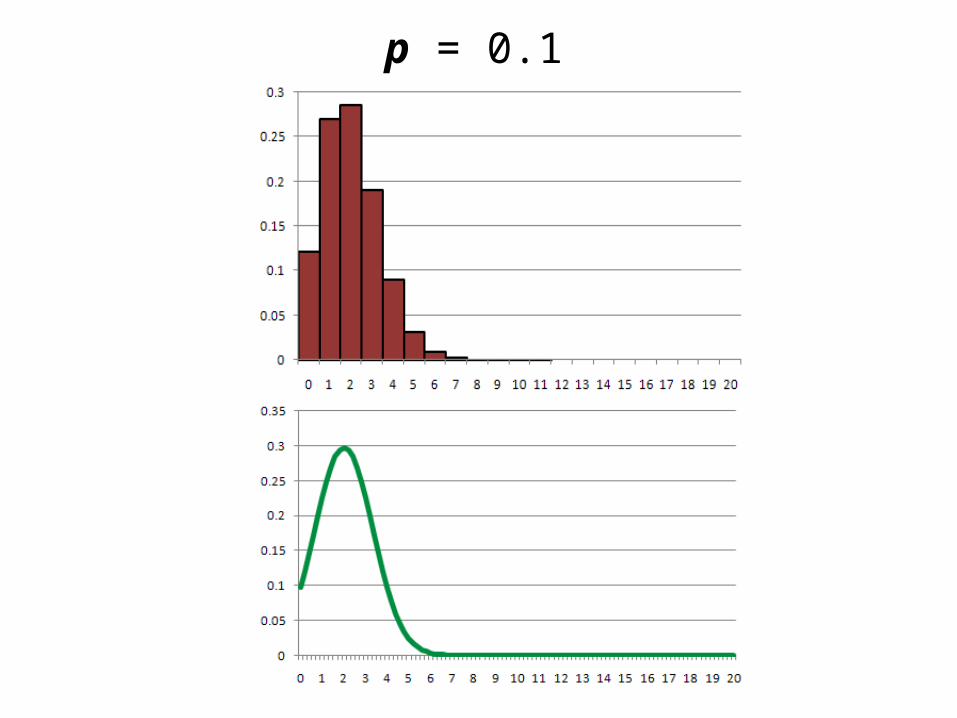
p = 0.1
• So, as p begins to vary significantly from 0.5, the distributions skew more and more. But…watch what happens when n , even when p = 0.1 (highly skewed)...
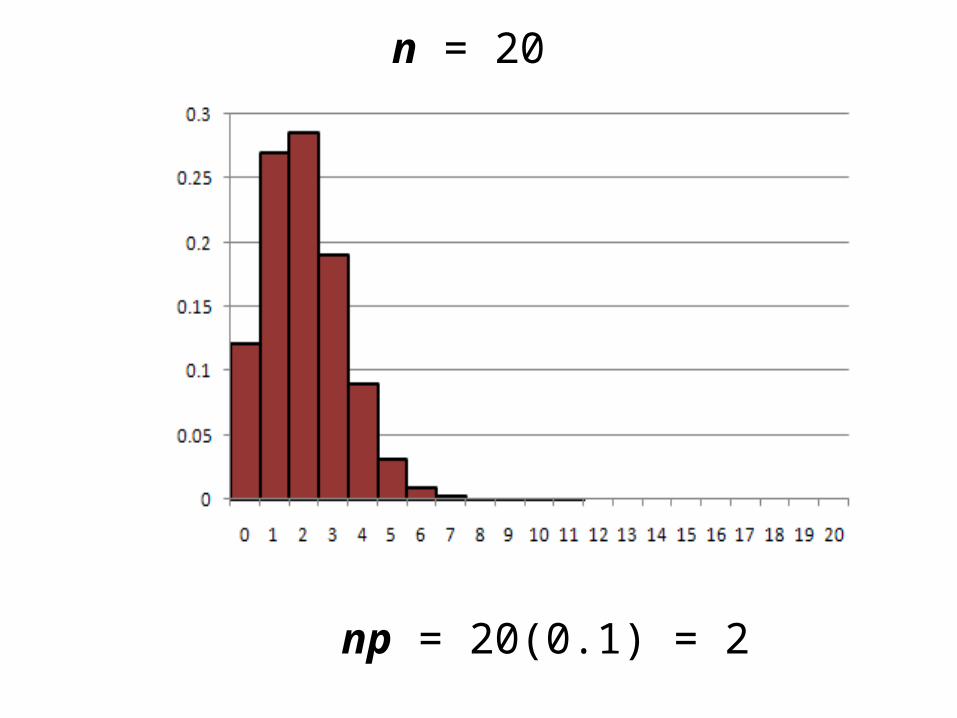
n = 20
np = 20(0.1) = 2
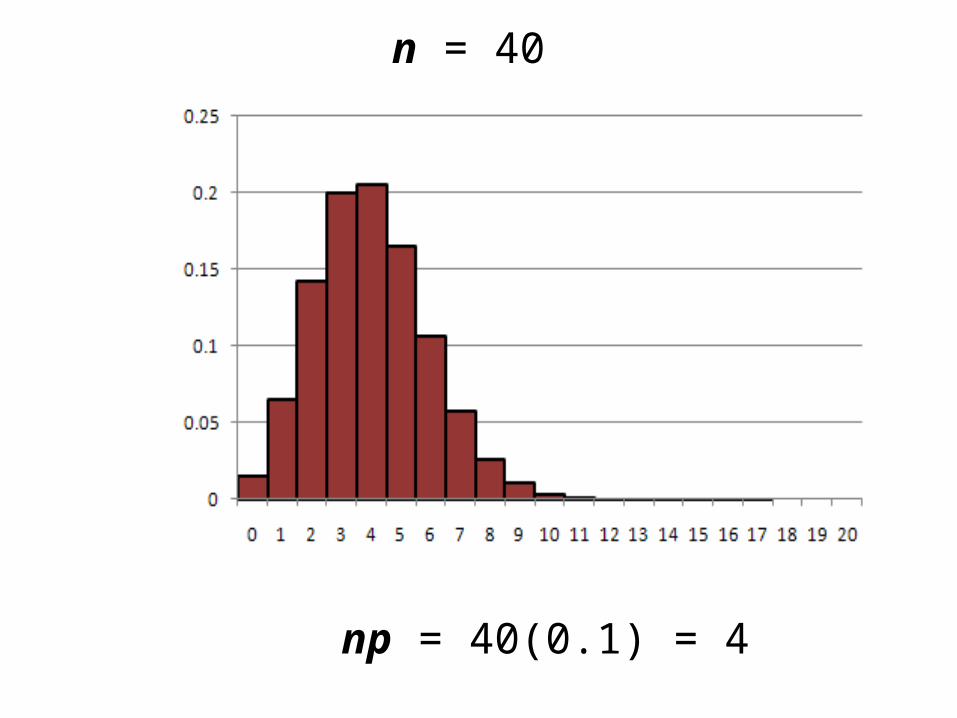
n = 40
np = 40(0.1) = 4
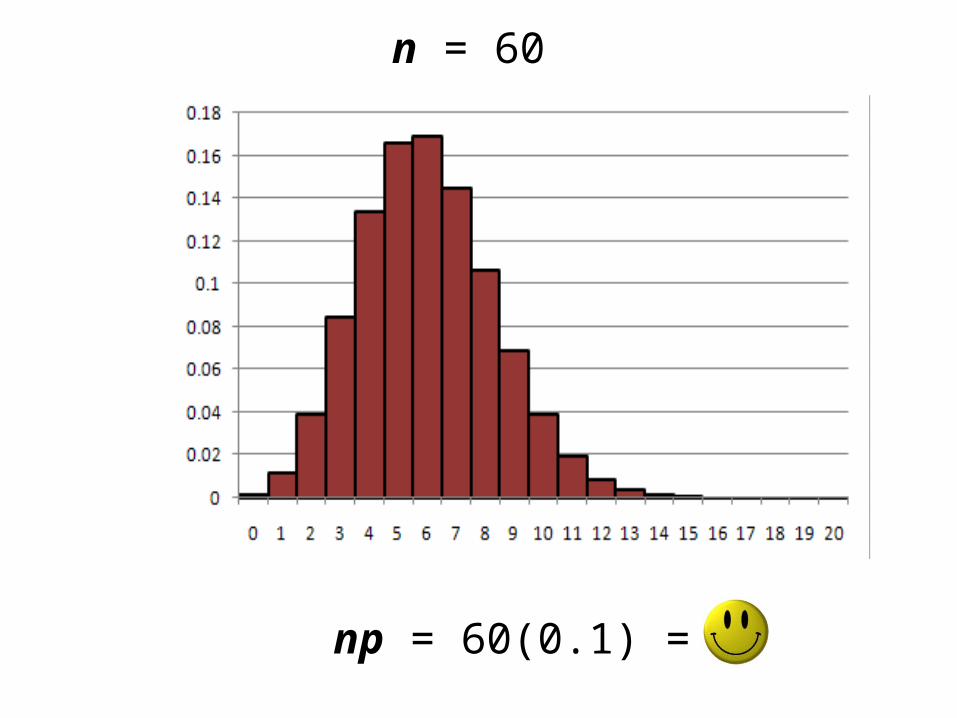
n = 60
np = 60(0.1) = 6
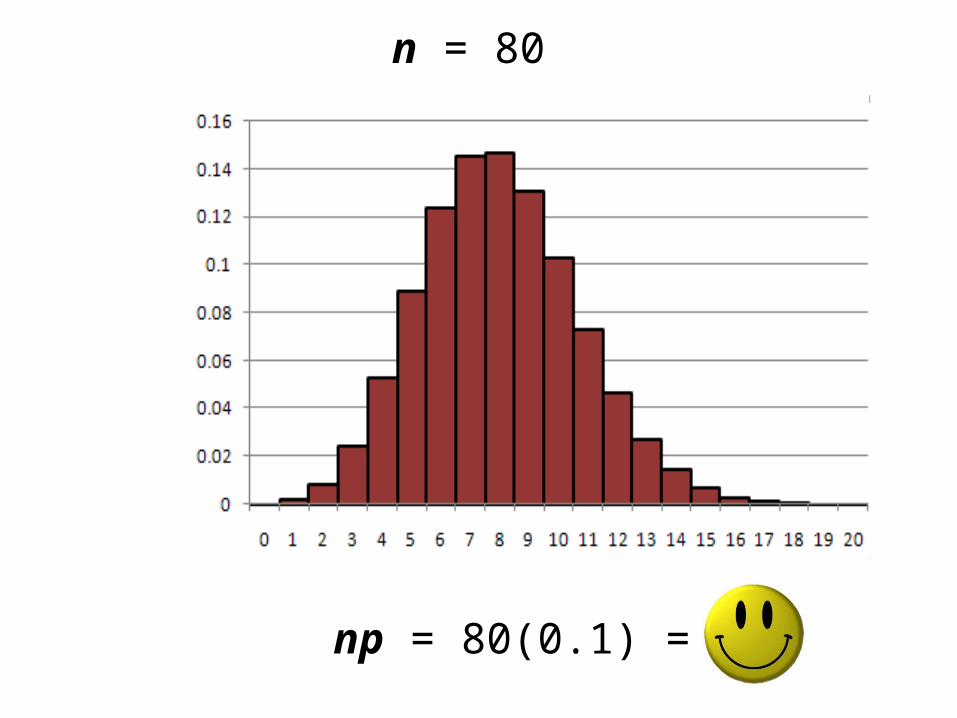
n = 80
np = 80(0.1) = 8
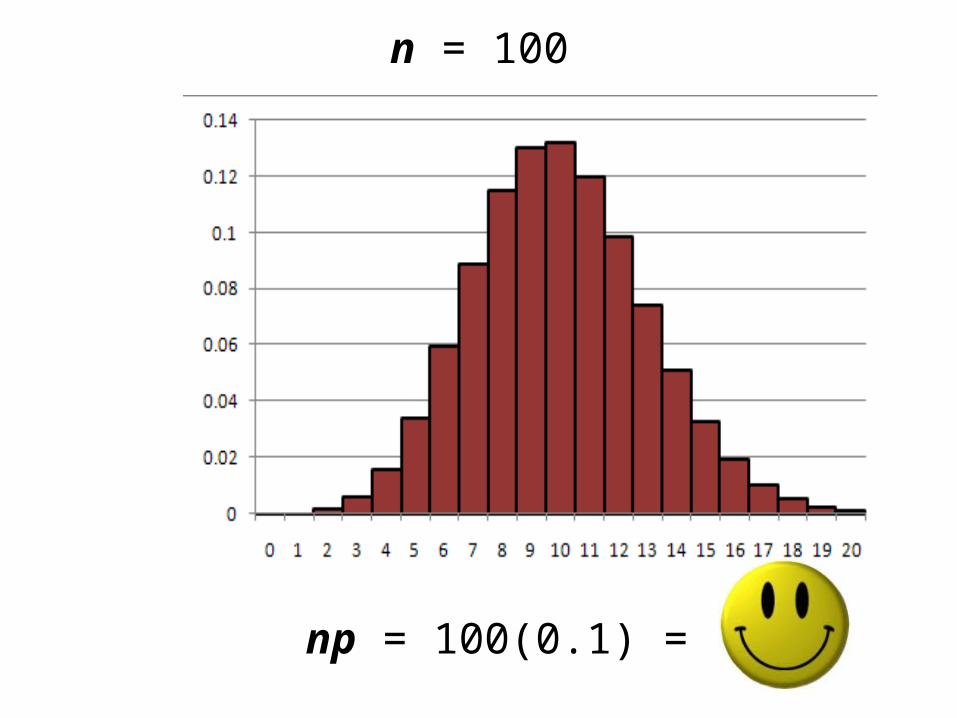
n = 100
np = 100(0.1) = 10
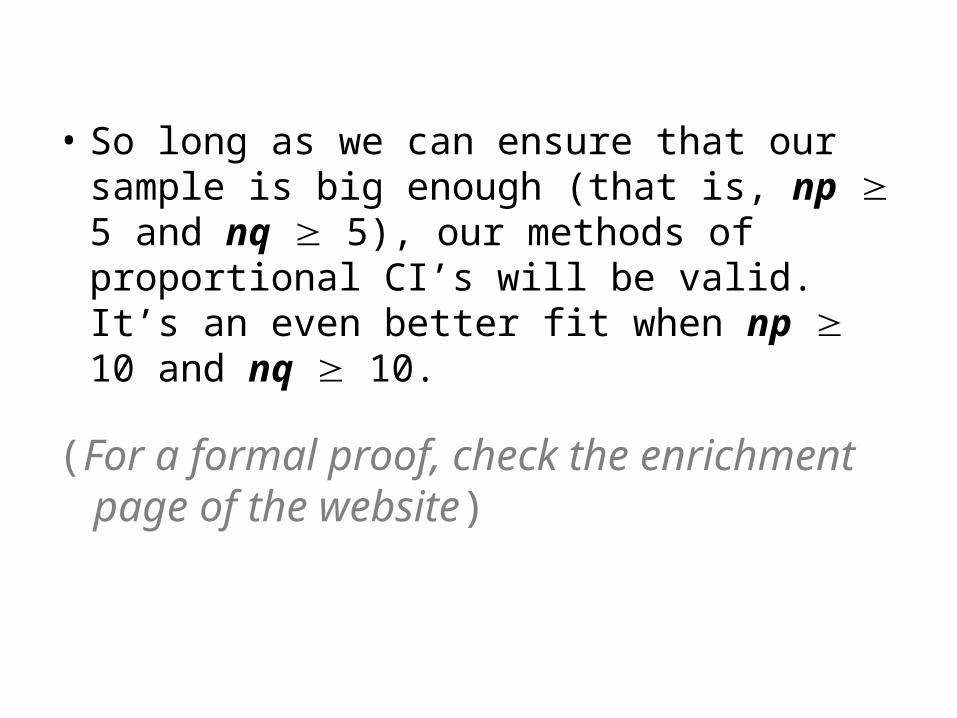
• So long as we can ensure that our sample is big enough (that is, np 5 and nq 5), our methods of proportional CI’s will be valid. It’s an even better fit when np 10 and nq 10.
(For a formal proof, check the enrichment page of the website)

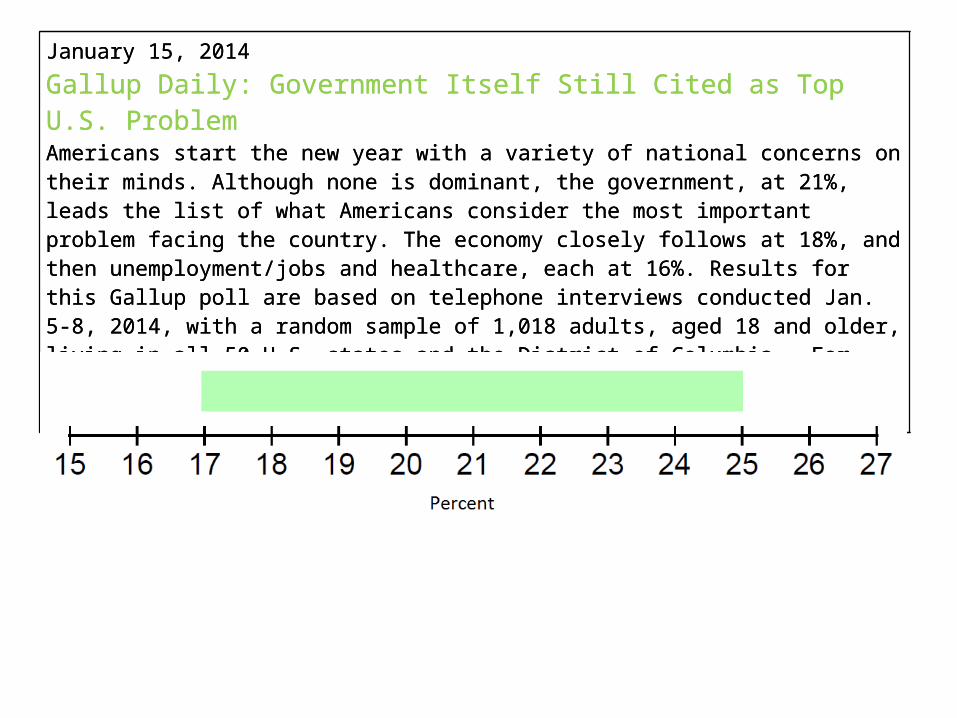
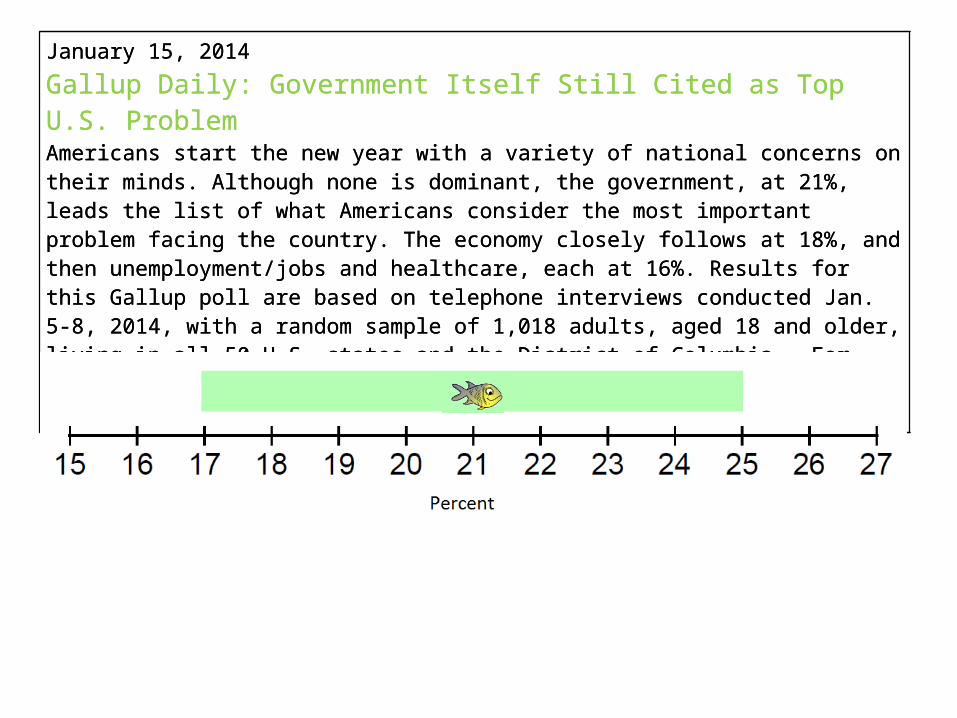
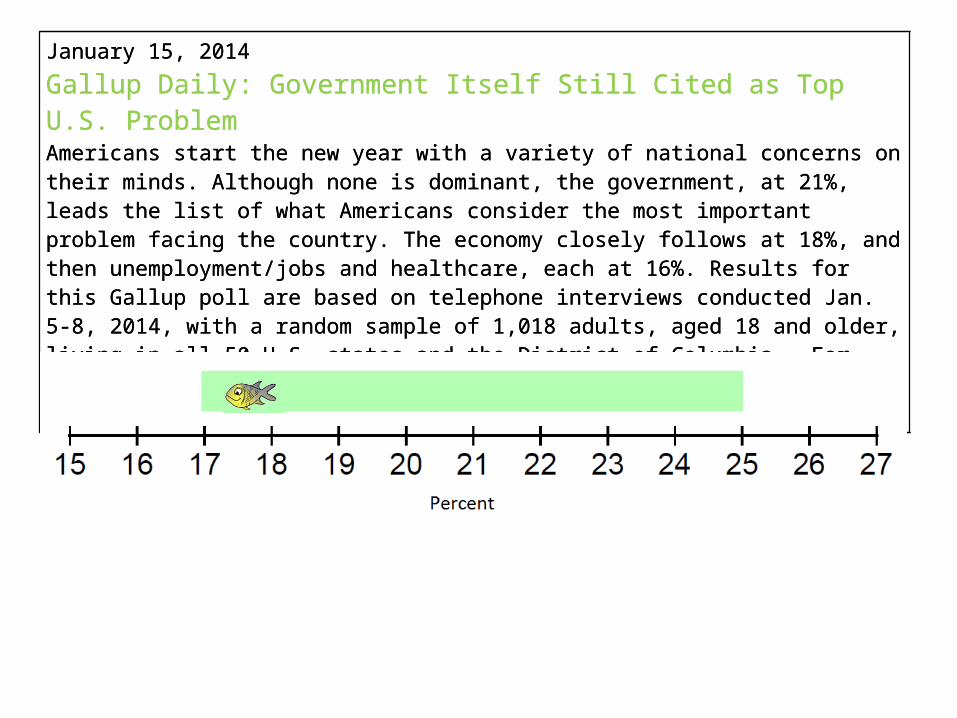
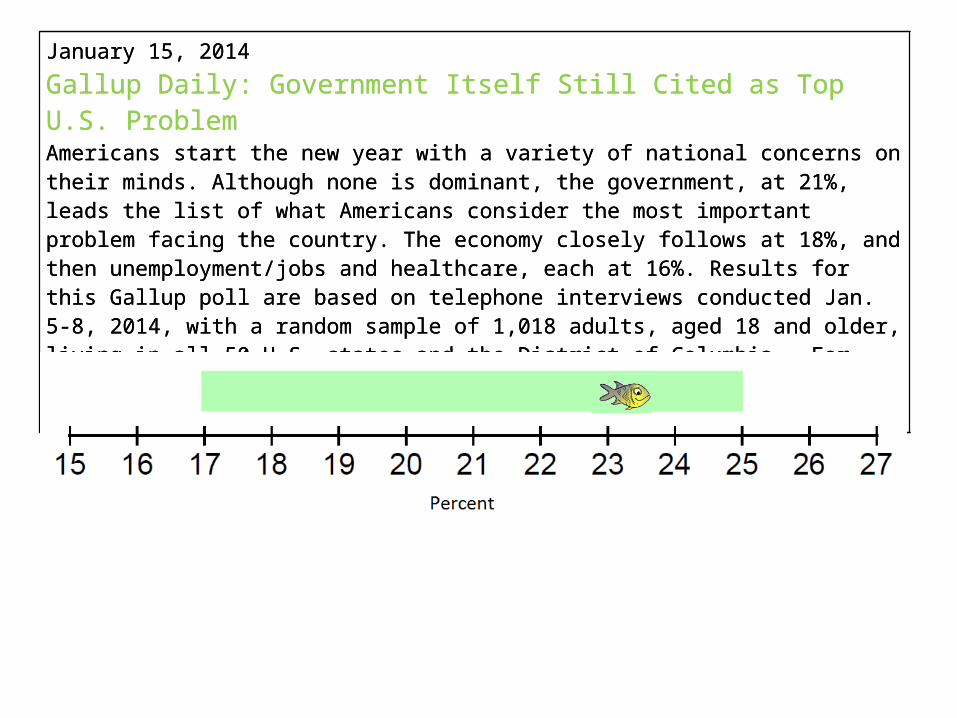
January 15, 2014Gallup Daily: Government Itself Still Cited as Top U.S. ProblemAmericans start the new year with a variety of national concerns on their minds. Although none is dominant, the government, at 21%, leads the list of what Americans consider the most important problem facing the country. The economy closely follows at 18%, and then unemployment/jobs and healthcare, each at 16%. Results for this Gallup poll are based on telephone interviews conducted Jan. 5-8, 2014, with a random sample of 1,018 adults, aged 18 and older, living in all 50 U.S. states and the District of Columbia. For results based on the total sample of national adults, the margin of sampling error is ±4 percentage points at the 95% confidence level.
January 15, 2014Gallup Daily: Government Itself Still Cited as Top U.S. ProblemAmericans start the new year with a variety of national concerns on their minds. Although none is dominant, the government, at 21%, leads the list of what Americans consider the most important problem facing the country. The economy closely follows at 18%, and then unemployment/jobs and healthcare, each at 16%. Results for this Gallup poll are based on telephone interviews conducted Jan. 5-8, 2014, with a random sample of 1,018 adults, aged 18 and older, living in all 50 U.S. states and the District of Columbia. For results based on the total sample of national adults, the margin of sampling error is ±4 percentage points at the 95% confidence level.
January 15, 2014Gallup Daily: Government Itself Still Cited as Top U.S. ProblemAmericans start the new year with a variety of national concerns on their minds. Although none is dominant, the government, at 21%, leads the list of what Americans consider the most important problem facing the country. The economy closely follows at 18%, and then unemployment/jobs and healthcare, each at 16%. Results for this Gallup poll are based on telephone interviews conducted Jan. 5-8, 2014, with a random sample of 1,018 adults, aged 18 and older, living in all 50 U.S. states and the District of Columbia. For results based on the total sample of national adults, the margin of sampling error is ±4 percentage points at the 95% confidence level.
January 15, 2014Gallup Daily: Government Itself Still Cited as Top U.S. ProblemAmericans start the new year with a variety of national concerns on their minds. Although none is dominant, the government, at 21%, leads the list of what Americans consider the most important problem facing the country. The economy closely follows at 18%, and then unemployment/jobs and healthcare, each at 16%. Results for this Gallup poll are based on telephone interviews conducted Jan. 5-8, 2014, with a random sample of 1,018 adults, aged 18 and older, living in all 50 U.S. states and the District of Columbia. For results based on the total sample of national adults, the margin of sampling error is ±4 percentage points at the 95% confidence level.
January 15, 2014Gallup Daily: Government Itself Still Cited as Top U.S. ProblemAmericans start the new year with a variety of national concerns on their minds. Although none is dominant, the government, at 21%, leads the list of what Americans consider the most important problem facing the country. The economy closely follows at 18%, and then unemployment/jobs and healthcare, each at 16%. Results for this Gallup poll are based on telephone interviews conducted Jan. 5-8, 2014, with a random sample of 1,018 adults, aged 18 and older, living in all 50 U.S. states and the District of Columbia. For results based on the total sample of national adults, the margin of sampling error is ±4 percentage points at the 95% confidence level.
January 15, 2014Gallup Daily: Government Itself Still Cited as Top U.S. ProblemAmericans start the new year with a variety of national concerns on their minds. Although none is dominant, the government, at 21%, leads the list of what Americans consider the most important problem facing the country. The economy closely follows at 18%, and then unemployment/jobs and healthcare, each at 16%. Results for this Gallup poll are based on telephone interviews conducted Jan. 5-8, 2014, with a random sample of 1,018 adults, aged 18 and older, living in all 50 U.S. states and the District of Columbia. For results based on the total sample of national adults, the margin of sampling error is ±4 percentage points at the 95% confidence level.
January 15, 2014Gallup Daily: Government Itself Still Cited as Top U.S. ProblemAmericans start the new year with a variety of national concerns on their minds. Although none is dominant, the government, at 21%, leads the list of what Americans consider the most important problem facing the country. The economy closely follows at 18%, and then unemployment/jobs and healthcare, each at 16%. Results for this Gallup poll are based on telephone interviews conducted Jan. 5-8, 2014, with a random sample of 1,018 adults, aged 18 and older, living in all 50 U.S. states and the District of Columbia. For results based on the total sample of national adults, the margin of sampling error is ±4 percentage points at the 95% confidence level.
January 15, 2014Gallup Daily: Government Itself Still Cited as Top U.S. ProblemAmericans start the new year with a variety of national concerns on their minds. Although none is dominant, the government, at 21%, leads the list of what Americans consider the most important problem facing the country. The economy closely follows at 18%, and then unemployment/jobs and healthcare, each at 16%. Results for this Gallup poll are based on telephone interviews conducted Jan. 5-8, 2014, with a random sample of 1,018 adults, aged 18 and older, living in all 50 U.S. states and the District of Columbia. For results based on the total sample of national adults, the margin of sampling error is ±4 percentage points at the 95% confidence level.
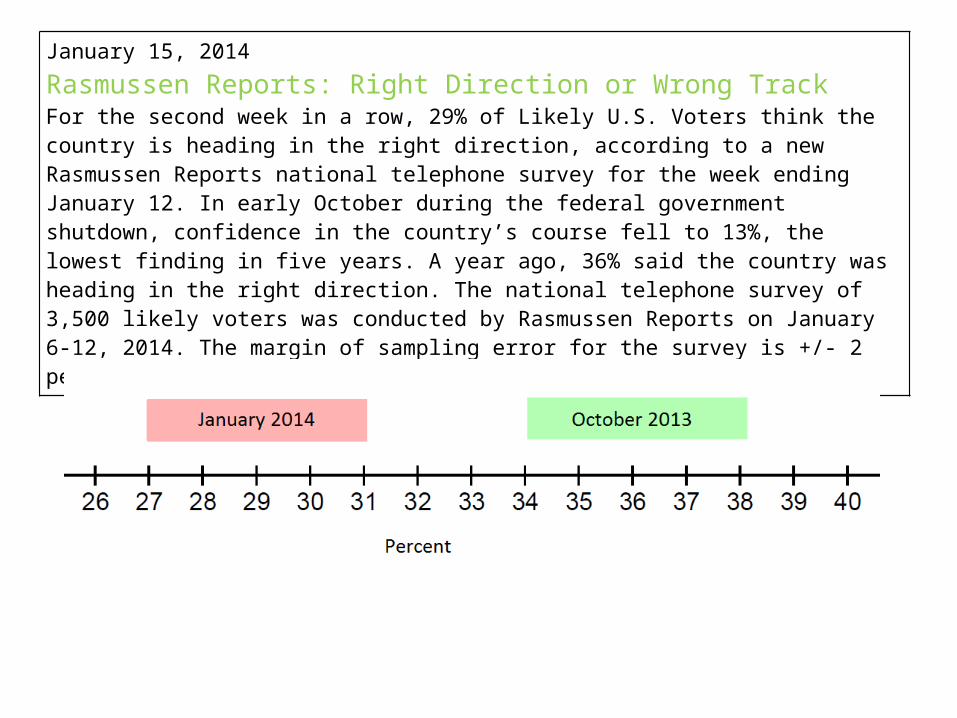
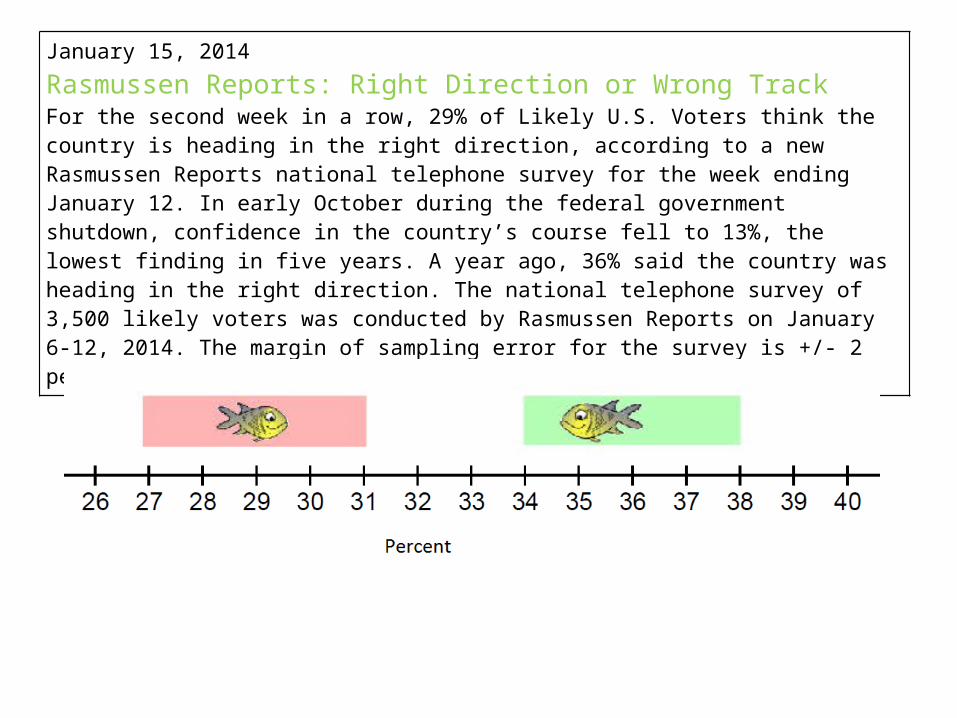
January 15, 2014Rasmussen Reports: Right Direction or Wrong TrackFor the second week in a row, 29% of Likely U.S. Voters think the country is heading in the right direction, according to a new Rasmussen Reports national telephone survey for the week ending January 12. In early October during the federal government shutdown, confidence in the country’s course fell to 13%, the lowest finding in five years. A year ago, 36% said the country was heading in the right direction. The national telephone survey of 3,500 likely voters was conducted by Rasmussen Reports on January 6-12, 2014. The margin of sampling error for the survey is +/- 2 percentage points with a 95% level of confidence.
January 15, 2014Rasmussen Reports: Right Direction or Wrong TrackFor the second week in a row, 29% of Likely U.S. Voters think the country is heading in the right direction, according to a new Rasmussen Reports national telephone survey for the week ending January 12. In early October during the federal government shutdown, confidence in the country’s course fell to 13%, the lowest finding in five years. A year ago, 36% said the country was heading in the right direction. The national telephone survey of 3,500 likely voters was conducted by Rasmussen Reports on January 6-12, 2014. The margin of sampling error for the survey is +/- 2 percentage points with a 95% level of confidence.
December 1, 2008 (date honestly doesn’t matter – this happens all the time) LA Times: Muslims - India’s New “Untouchables”According to the report, produced by a committee led by a former Indian chief justice, Rajender Sachar, Muslims are now worse off than the Dalit caste, or those called “untouchables”. Some 52% of Muslim men were unemployed, compared with 47% of Dalit men.
Hmmmmmmmmmmm...
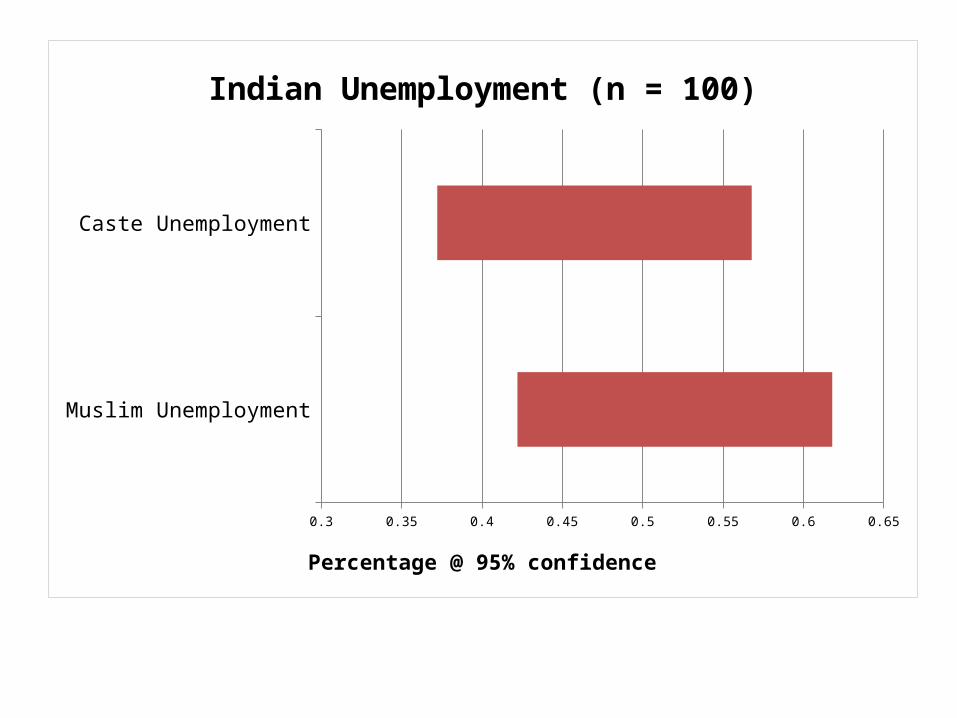
Muslim Unemployment
Caste Unemployment
0.3 0.35 0.4 0.45 0.5 0.55 0.6 0.65
Indian Unemployment (n = 100)
Percentage @ 95% confidence
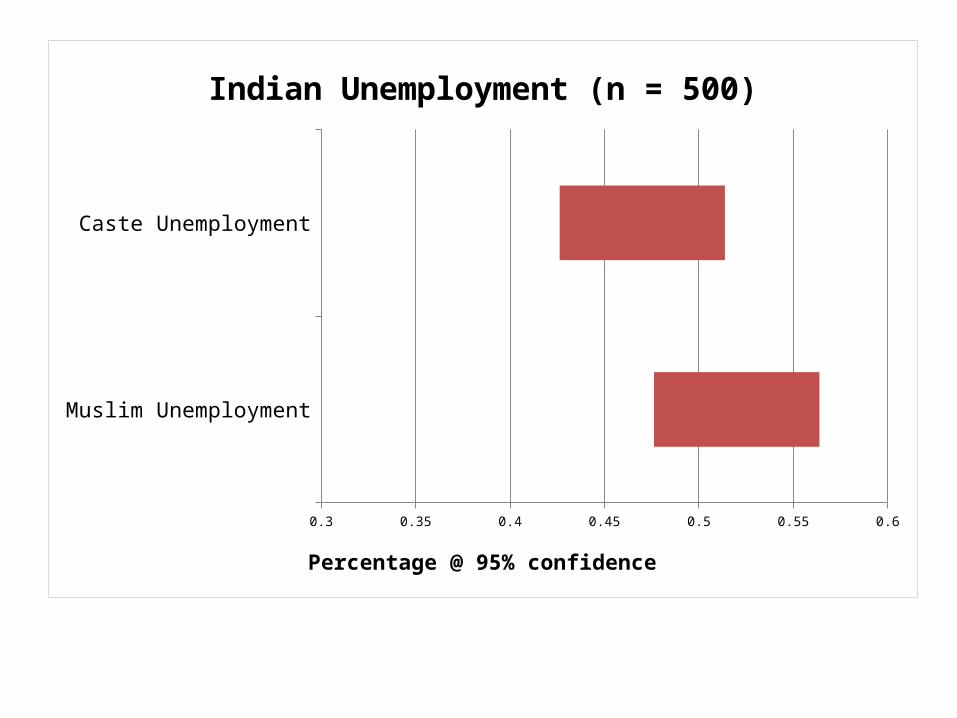
Muslim Unemployment
Caste Unemployment
0.3 0.35 0.4 0.45 0.5 0.55 0.6
Indian Unemployment (n = 500)
Percentage @ 95% confidence
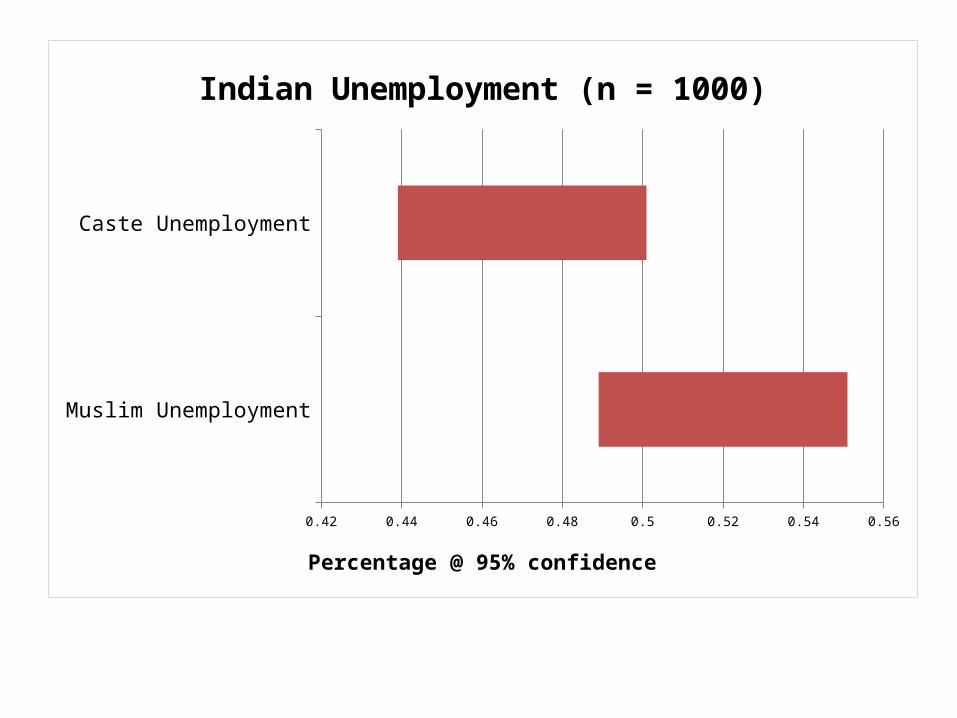
Muslim Unemployment
Caste Unemployment
0.42 0.44 0.46 0.48 0.5 0.52 0.54 0.56
Indian Unemployment (n = 1000)
Percentage @ 95% confidence
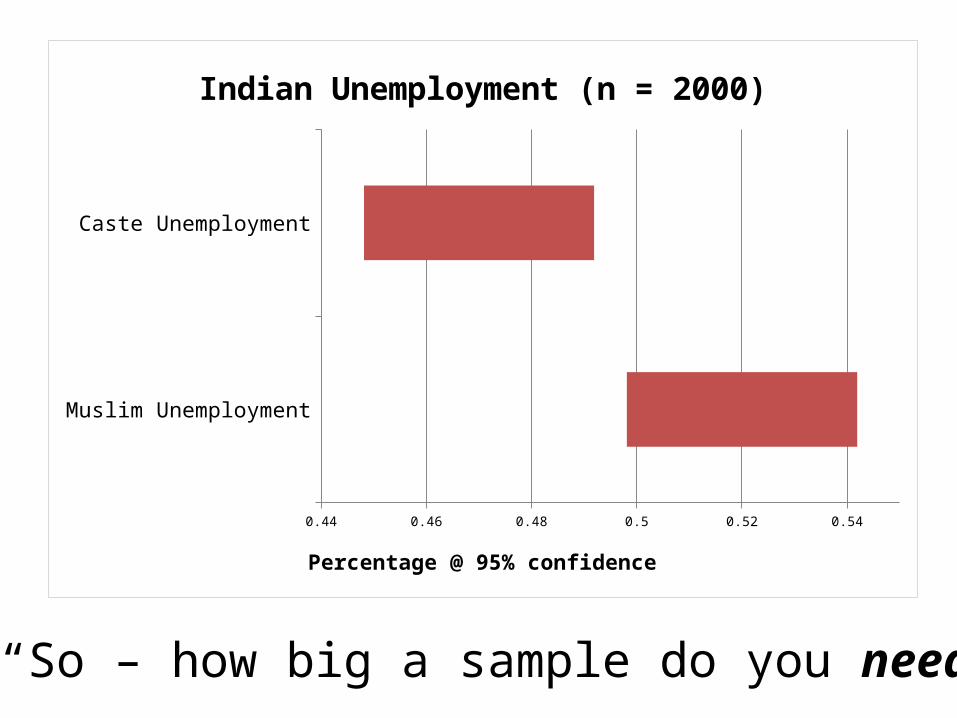
Muslim Unemployment
Caste Unemployment
0.44 0.46 0.48 0.5 0.52 0.54
Indian Unemployment (n = 2000)
Percentage @ 95% confidence
“So – how big a sample do you need?”
Related Documents