AU J.T. 11(1): 42-47 (Jul. 2007) The Case Study of 5 kHz – 25 kHz High Frequency Adjustment in Converter Circuit to Generate Ozone Gas Siseerot Ketkaew Faculty of Engineering, Ramkhamhaeng University Bangkok, Thailand <[email protected]> Abstract This paper presents a case study on changing the switching frequency in a converter circuit to generate ozone gas using a high-voltage, high-frequency, switching power supply. This supply uses a flyback converter of 100 VA (Output 3 kV), the operational frequencies are from 5 kHz to 25 kHz, and the control circuit uses a pulse- width-modulation (PWM) technique. Under the one-hour test of the ozone generator at wind velocity of 0.259 x 10 -6 m 3 /sec, the switching frequenc y of 5 – 25 kHz can generate ozone gas of 99.6 – 120.5 mgO 3 /hr. Keywords: switching frequency, flyback converter, ozone gas, control circuit. Introduction Nowadays, the ozone gas is widely brought to use for living needs such as using ozone to clean vegetables instead of using manganese, to kill diseases and to reduce the quantity of chlorine in water. However, bringing ozone to clean the air has some drawbacks. For example, if it is used at high concentration, it can irritate the body. It is health effective only if its quantity is properly controlled for a given application. Therefore, the control of the quantity of ozone gas should match some required technical specifications. This is the main reason to study the artificial generation of ozone gas. This paper presents an evaluation of the effect of changing the switching frequency in a converter circuit to generate a particular ozone quantity. The high- voltage high-frequency circuit is constructed by using the principle of switching the ac power supply. A high-voltage high-frequency signal is supplied to the load consisting of two- layer electrodes connected in series to produce ozone gas. The generation of ozone gas is based on the principle of spreading molecules of oxygen. One can produce ozone gas on the basis of the equation O 2 + O = O 3 . The ozone gas can withstand a high voltage level. Also, the heat affects the quantity of the occurring ozone gas. Therefore, both the voltage level and the applied frequency have to be controlled during the generation of ozone gas (Dalarat et al. 2004). The energy range being used to produce ozone gas from chemical components is from 493 kJ/mol to 762.23 kJ/mol. The adapting unit has the required energy within the range from 5.583 kWh/m 3 to 8.631 kWh/ m 3 . Since there is only 21% oxygen in the air, the required energy should be within the range from 1.17243 kWh/m 3 to 1.620 kWh/m 3 . It is enough to generate ozone gas in the gap of two-layer electrodes connected in series. (Dalarat et al. 2004). The Process of Generating Ozone Gas The air comprises mainly of 79% nitrogen (N 2 ) and 21% oxygen (O 2 ). The rest are inert gases and steam. The ozone gas is a gas consisting of 3 oxygen atoms under unstable status with easy dispersion that depends on both the environment and the density of the produced quantity. The production procedure relies on the process of generation of a free oxygen atom from an oxygen molecule in the air. After that the free oxygen atom is combined together with an oxygen molecule to obtain ozone gas (O 3 ) Technical Report 42

Welcome message from author
This document is posted to help you gain knowledge. Please leave a comment to let me know what you think about it! Share it to your friends and learn new things together.
Transcript
7/18/2019 The Case Study of 5 KHz – 25 KHz Generate Ozone
http://slidepdf.com/reader/full/the-case-study-of-5-khz-25-khz-generate-ozone 1/6
AU J.T. 11(1): 42-47 (Jul. 2007)
The Case Study of 5 kHz – 25 kHz High Frequency Adjustment in
Converter Circuit to Generate Ozone Gas
Siseerot Ketkaew
Faculty of Engineering, Ramkhamhaeng UniversityBangkok, Thailand
Abstract
This paper presents a case study on changing the switching frequency in a
converter circuit to generate ozone gas using a high-voltage, high-frequency, switching
power supply. This supply uses a flyback converter of 100 VA (Output 3 kV), the
operational frequencies are from 5 kHz to 25 kHz, and the control circuit uses a pulse-
width-modulation (PWM) technique. Under the one-hour test of the ozone generator at
wind velocity of 0.259 x 10⁻⁶
m3
/sec, the switching frequency of 5 – 25 kHz can generateozone gas of 99.6 – 120.5 mgO3 /hr.
Keywords: switching frequency, flyback converter, ozone gas, control circuit.
Introduction
Nowadays, the ozone gas is widely
brought to use for living needs such as using
ozone to clean vegetables instead of using
manganese, to kill diseases and to reduce the
quantity of chlorine in water. However, bringing ozone to clean the air has some
drawbacks. For example, if it is used at high
concentration, it can irritate the body. It is
health effective only if its quantity is properly
controlled for a given application. Therefore,
the control of the quantity of ozone gas should
match some required technical specifications.
This is the main reason to study the artificial
generation of ozone gas. This paper presents an
evaluation of the effect of changing the
switching frequency in a converter circuit togenerate a particular ozone quantity. The high-
voltage high-frequency circuit is constructed
by using the principle of switching the ac
power supply. A high-voltage high-frequency
signal is supplied to the load consisting of two-
layer electrodes connected in series to produce
ozone gas. The generation of ozone gas is
based on the principle of spreading molecules
of oxygen. One can produce ozone gas on the
basis of the equation O2
+ O = O3. The ozone
gas can withstand a high voltage level. Also,
the heat affects the quantity of the occurring
ozone gas. Therefore, both the voltage level
and the applied frequency have to be controlled
during the generation of ozone gas (Dalarat et
al. 2004).
The energy range being used to produce
ozone gas from chemical components is from
493 kJ/mol to 762.23 kJ/mol. The adapting unit
has the required energy within the range from
5.583 kWh/m3 to 8.631 kWh/ m3. Since there is
only 21% oxygen in the air, the required
energy should be within the range from
1.17243 kWh/m3 to 1.620 kWh/m3. It is
enough to generate ozone gas in the gap of
two-layer electrodes connected in series.
(Dalarat et al. 2004).
The Process of Generating Ozone Gas
The air comprises mainly of 79%
nitrogen (N2) and 21% oxygen (O2). The rest
are inert gases and steam. The ozone gas is a
gas consisting of 3 oxygen atoms under
unstable status with easy dispersion that
depends on both the environment and the
density of the produced quantity. The
production procedure relies on the process of
generation of a free oxygen atom from an
oxygen molecule in the air. After that the free
oxygen atom is combined together with an
oxygen molecule to obtain ozone gas (O3)
Technical Report 42
7/18/2019 The Case Study of 5 KHz – 25 KHz Generate Ozone
http://slidepdf.com/reader/full/the-case-study-of-5-khz-25-khz-generate-ozone 2/6
AU J.T. 11(1): 42-47 (Jul. 2007)
which is brought to use in both industrial and
health systems. The occurring process of ozone
gas generation forms from two sub-processes –
ionization process and dissociation process.
The ionization, spreading of gas, is based on
the increment of electron avalanche leading toan insulator breakdown where the electric
current flows through the border line of the
insulator. This follows to the occurrence of
heat due to the current flow of the insulator
breakdown which causes the ozone gas to
disintegrate due to its lower energy. Therefore,
the ozone gas production should not result in a
breakdown, i.e., the electron energy from the
electric field should be lower than the
ionization energy, but it should be high enough
to separate the oxygen atoms (Ketkaew 2005).
Co-core Cylinder:
Ozone Tube’s Structure
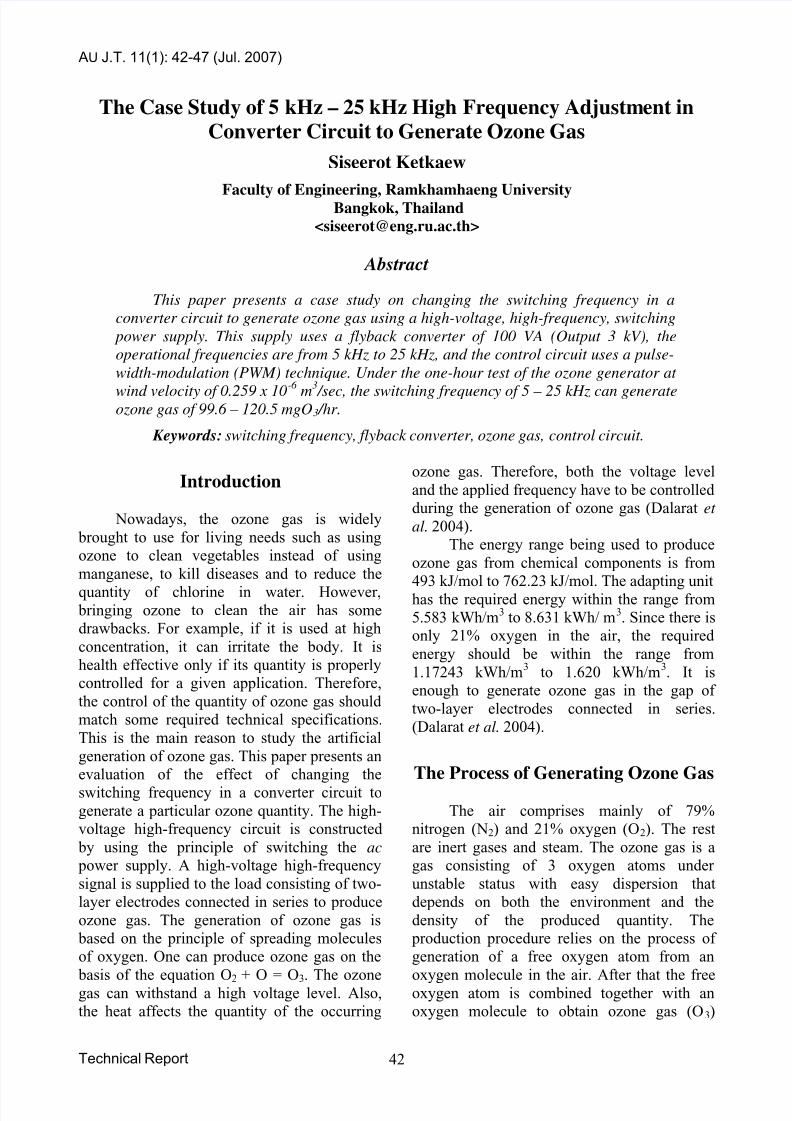
The Gauss's law for the electric field says
that the electric flux through any closed surface
is proportional to the amount of electric charge
contained within that surface, .
The electric field of a co-core cylinder oflength l and radius r , r
∫ →→
⋅=S
Ad DQ
1 ≤ r ≤ r 2, (see Fig. 1) is
given by (Dalarat et al. 2004):
r l
Qr E
1
2)(
πε
= . (1)
The voltage, V , across between both cylinders
is given by:
1
2ln 22
)(
1
2
1
r
r
l
Q
r
dr
l
Qdr r E V
er
r
r
r
πε πε
=== ∫∫ .
(2)
Therefore:
1
2ln
)(
r
r r
V r E = , r 1 ≤ r ≤ r 2. (3)
The maximum electric field stress occurs on
the inside of cylinder’s surface and is given by:
1
21
1ln
)(
r
r r
V r E E
MAX
== . (4)
Fig. 1. Co-core cylinder: Ozone tube’sstructure.
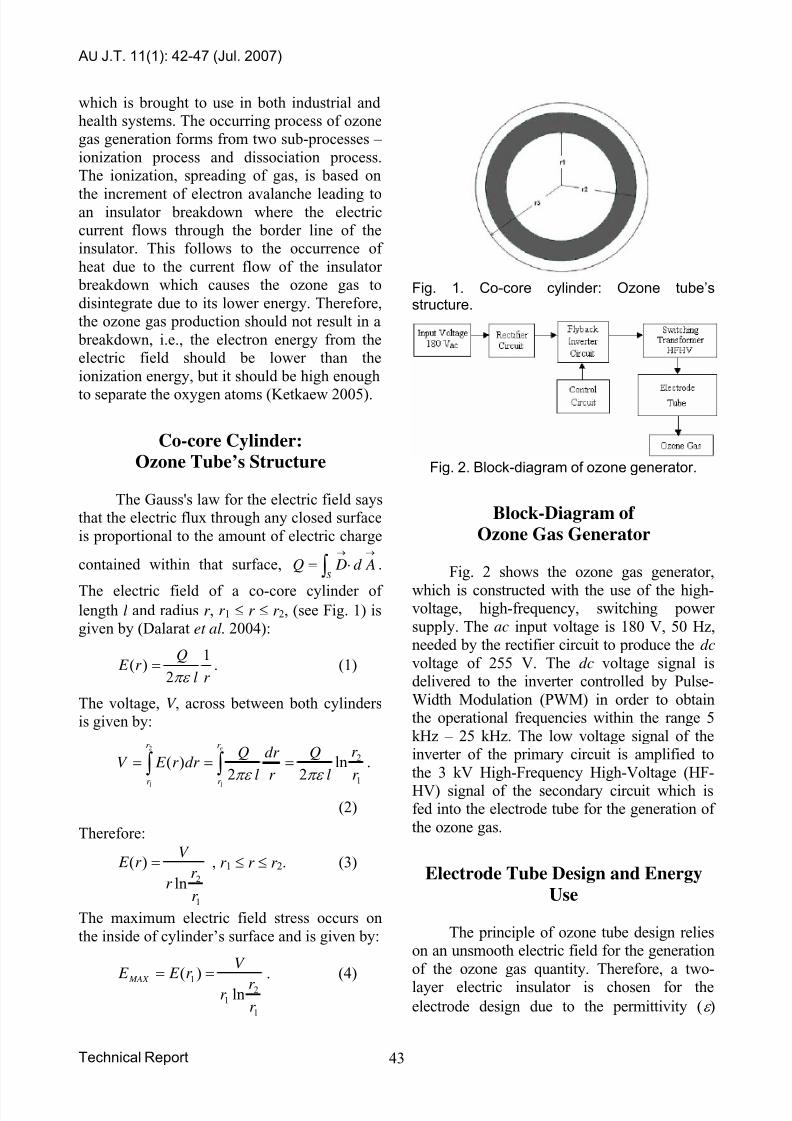
Fig. 2. Block-diagram of ozone generator.
Block-Diagram of
Ozone Gas Generator
Fig. 2 shows the ozone gas generator,
which is constructed with the use of the high-voltage, high-frequency, switching power
supply. The ac input voltage is 180 V, 50 Hz,needed by the rectifier circuit to produce the dc
voltage of 255 V. The dc voltage signal isdelivered to the inverter controlled by Pulse-
Width Modulation (PWM) in order to obtainthe operational frequencies within the range 5
kHz – 25 kHz. The low voltage signal of theinverter of the primary circuit is amplified to
the 3 kV High-Frequency High-Voltage (HF-
HV) signal of the secondary circuit which isfed into the electrode tube for the generation of
the ozone gas.
Electrode Tube Design and Energy
Use
The principle of ozone tube design relieson an unsmooth electric field for the generation
of the ozone gas quantity. Therefore, a two-
layer electric insulator is chosen for theelectrode design due to the permittivity (ε )
Technical Report 43
7/18/2019 The Case Study of 5 KHz – 25 KHz Generate Ozone
http://slidepdf.com/reader/full/the-case-study-of-5-khz-25-khz-generate-ozone 3/6
AU J.T. 11(1): 42-47 (Jul. 2007)
differences of the electric insulator. It is
suitable for the generation of a non-uniform
electric field to have variable but close to ε values of each layer under electric field stress.
As shown in Fig. 3, a two-layer co-core
cylinder for ozone tube design is chosen underthe following conditions (Ketkaew 2005):
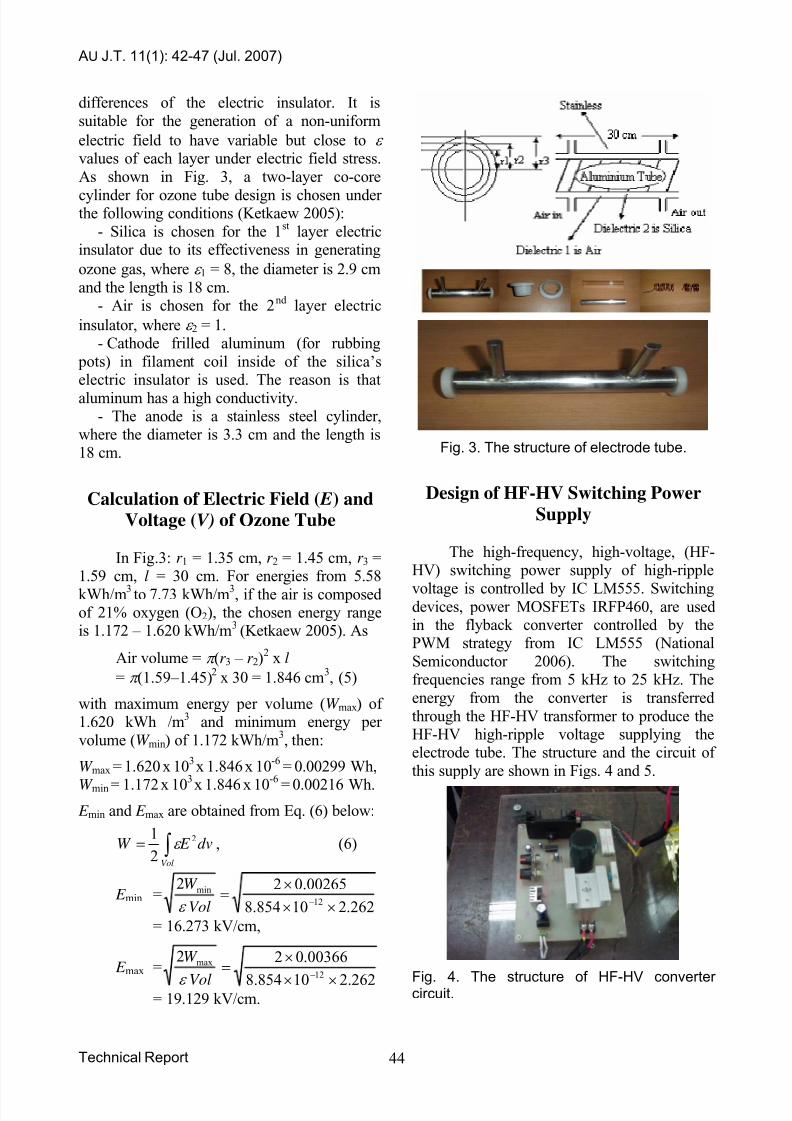
- Silica is chosen for the 1st layer electric
insulator due to its effectiveness in generating
ozone gas, where ε 1 = 8, the diameter is 2.9 cm
and the length is 18 cm.- Air is chosen for the 2nd layer electric
insulator, where ε 2 = 1.- Cathode frilled aluminum (for rubbing
pots) in filament coil inside of the silica’selectric insulator is used. The reason is that
aluminum has a high conductivity.- The anode is a stainless steel cylinder,
where the diameter is 3.3 cm and the length is18 cm. Fig. 3. The structure of electrode tube.
Design of HF-HV Switching Power
SupplyCalculation of Electric Field ( E) and
Voltage (V) of Ozone Tube
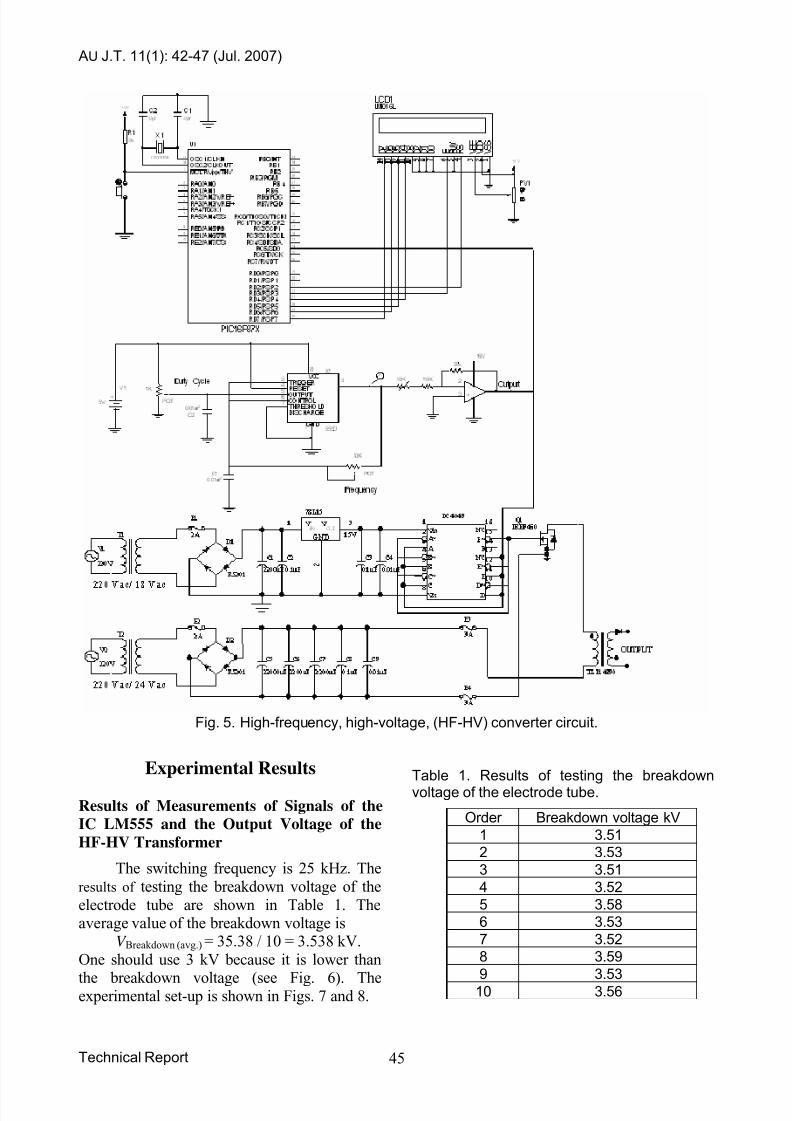
The high-frequency, high-voltage, (HF-HV) switching power supply of high-ripple
voltage is controlled by IC LM555. Switchingdevices, power MOSFETs IRFP460, are usedin the flyback converter controlled by thePWM strategy from IC LM555 (National
Semiconductor 2006). The switchingfrequencies range from 5 kHz to 25 kHz. The
energy from the converter is transferred
through the HF-HV transformer to produce theHF-HV high-ripple voltage supplying theelectrode tube. The structure and the circuit of
this supply are shown in Figs. 4 and 5.
In Fig.3: r 1 = 1.35 cm, r 2 = 1.45 cm, r 3 =1.59 cm, l = 30 cm. For energies from 5.58
kWh/m3 to
7.73 kWh/m3, if the air is composedof 21% oxygen (O2), the chosen energy rangeis 1.172 – 1.620 kWh/m3 (Ketkaew 2005). As
Air volume = π (r 3 – r 2)2 x l
= π (1.59–1.45)2 x 30 = 1.846 cm
3, (5)
with maximum energy per volume (W max) of1.620 kWh /m3 and minimum energy per
volume (W min) of 1.172 kWh/m3, then:
W max = 1.620 x 103 x 1.846 x 10
-6 = 0.00299 Wh,
W min = 1.172 x 103
x 1.846 x 10-6
= 0.00216 Wh.
E min and E max are obtained from Eq. (6) below:
∫=Vol
dv E W 2
2
1ε , (6)
E min =262.210854.8
00265.02
212
min
××
×=
−Vol
W
ε
= 16.273 kV/cm,
E max =
262.210854.8
00366.02
212
max
××
×=
−
Vol
W
ε
Fig. 4. The structure of HF-HV convertercircuit. = 19.129 kV/cm.
Technical Report 44
7/18/2019 The Case Study of 5 KHz – 25 KHz Generate Ozone
http://slidepdf.com/reader/full/the-case-study-of-5-khz-25-khz-generate-ozone 4/6
AU J.T. 11(1): 42-47 (Jul. 2007)
Fig. 5. High-frequency, high-voltage, (HF-HV) converter circuit.
Experimental Results
Results of Measurements of Signals of the
IC LM555 and the Output Voltage of the
HF-HV Transformer
The switching frequency is 25 kHz. The
results of testing the breakdown voltage of the
electrode tube are shown in Table 1. Theaverage value of the breakdown voltage is
V Breakdown (avg.) = 35.38 / 10 = 3.538 kV.
One should use 3 kV because it is lower than
the breakdown voltage (see Fig. 6). Theexperimental set-up is shown in Figs. 7 and 8.
Table 1. Results of testing the breakdownvoltage of the electrode tube.
Order Breakdown voltage kV
1 3.51
2 3.53
3 3.51
4 3.52
5 3.58
6 3.53
7 3.52
8 3.59
9 3.53
10 3.56
Technical Report 45
7/18/2019 The Case Study of 5 KHz – 25 KHz Generate Ozone
http://slidepdf.com/reader/full/the-case-study-of-5-khz-25-khz-generate-ozone 5/6
AU J.T. 11(1): 42-47 (Jul. 2007)
(a) (b)
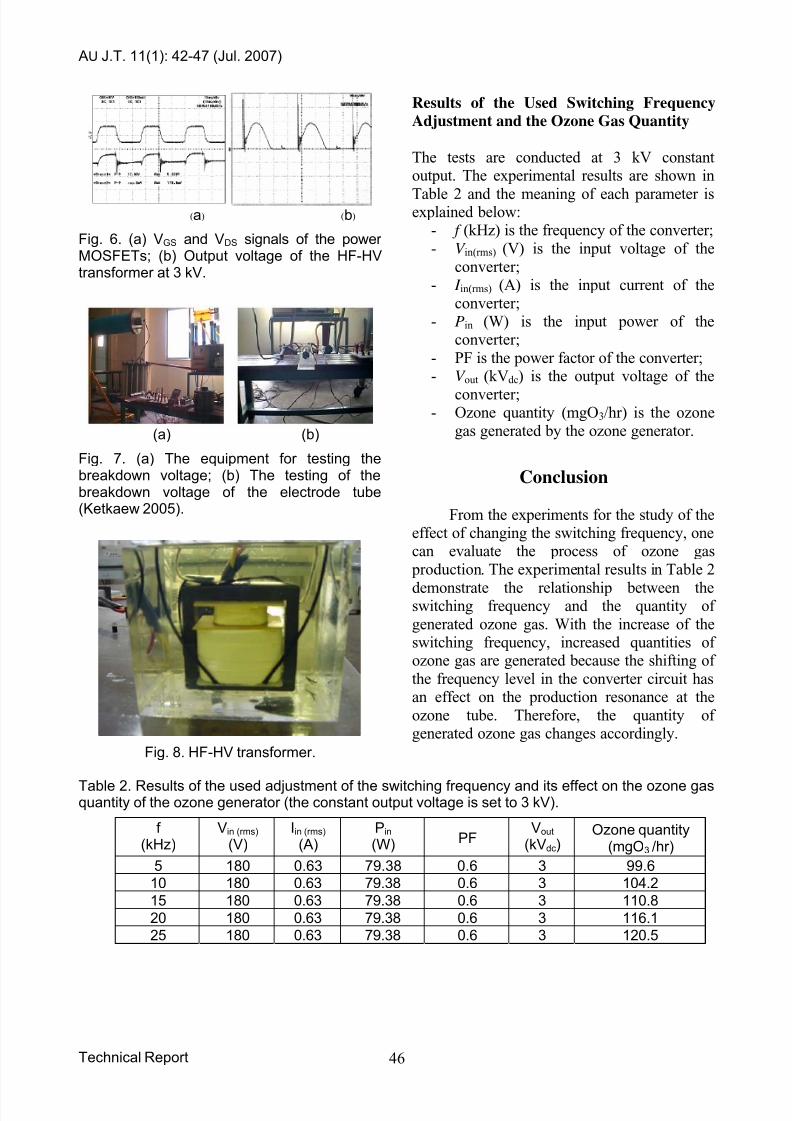
Fig. 6. (a) VGS and VDS signals of the powerMOSFETs; (b) Output voltage of the HF-HVtransformer at 3 kV.
(a) (b)
Fig. 7. (a) The equipment for testing thebreakdown voltage; (b) The testing of thebreakdown voltage of the electrode tube(Ketkaew 2005).
Fig. 8. HF-HV transformer.
Results of the Used Switching Frequency
Adjustment and the Ozone Gas Quantity
The tests are conducted at 3 kV constantoutput. The experimental results are shown in
Table 2 and the meaning of each parameter isexplained below:
- f (kHz) is the frequency of the converter;
- V in(rms) (V) is the input voltage of the
converter;- I in(rms) (A) is the input current of the
converter;- Pin (W) is the input power of the
converter;
- PF is the power factor of the converter;- V out (kVdc) is the output voltage of the
converter;- Ozone quantity (mgO3/hr) is the ozone
gas generated by the ozone generator.
Conclusion
From the experiments for the study of theeffect of changing the switching frequency, onecan evaluate the process of ozone gas
production. The experimental results in Table 2
demonstrate the relationship between theswitching frequency and the quantity of
generated ozone gas. With the increase of theswitching frequency, increased quantities ofozone gas are generated because the shifting of
the frequency level in the converter circuit hasan effect on the production resonance at the
ozone tube. Therefore, the quantity ofgenerated ozone gas changes accordingly.
Table 2. Results of the used adjustment of the switching frequency and its effect on the ozone gasquantity of the ozone generator (the constant output voltage is set to 3 kV).
f
(kHz)Vin (rms)
(V)Iin (rms)
(A)Pin
(W) PFVout
(kVdc)Ozone quantity
(mgO3 /hr)
5 180 0.63 79.38 0.6 3 99.6
10 180 0.63 79.38 0.6 3 104.2
15 180 0.63 79.38 0.6 3 110.8
20 180 0.63 79.38 0.6 3 116.1
25 180 0.63 79.38 0.6 3 120.5
Technical Report 46
7/18/2019 The Case Study of 5 KHz – 25 KHz Generate Ozone
http://slidepdf.com/reader/full/the-case-study-of-5-khz-25-khz-generate-ozone 6/6
AU J.T. 11(1): 42-47 (Jul. 2007)
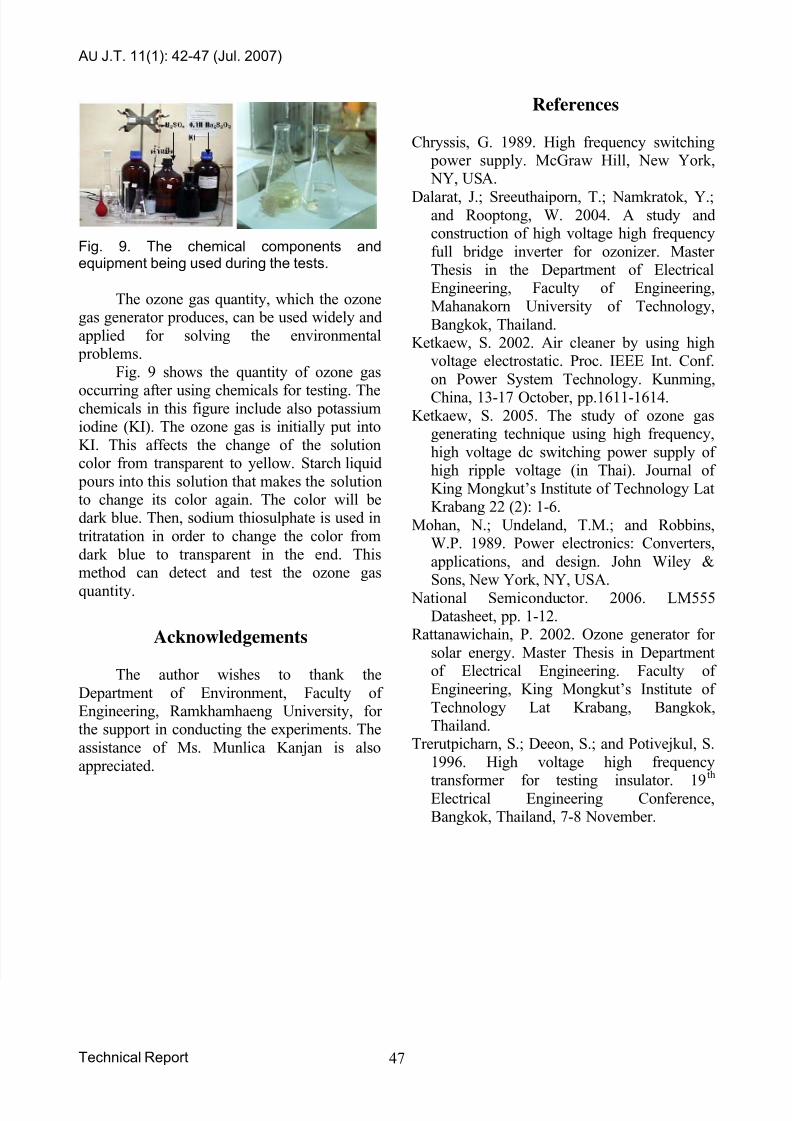
Fig. 9. The chemical components andequipment being used during the tests.
The ozone gas quantity, which the ozonegas generator produces, can be used widely and
applied for solving the environmental problems.
Fig. 9 shows the quantity of ozone gas
occurring after using chemicals for testing. Thechemicals in this figure include also potassiumiodine (KI). The ozone gas is initially put into
KI. This affects the change of the solutioncolor from transparent to yellow. Starch liquid
pours into this solution that makes the solution
to change its color again. The color will bedark blue. Then, sodium thiosulphate is used in
tritratation in order to change the color from
dark blue to transparent in the end. Thismethod can detect and test the ozone gas
quantity.
Acknowledgements
The author wishes to thank the
Department of Environment, Faculty ofEngineering, Ramkhamhaeng University, forthe support in conducting the experiments. The
assistance of Ms. Munlica Kanjan is also
appreciated.
References
Chryssis, G. 1989. High frequency switching power supply. McGraw Hill, New York, NY, USA.
Dalarat, J.; Sreeuthaiporn, T.; Namkratok, Y.;and Rooptong, W. 2004. A study andconstruction of high voltage high frequency
full bridge inverter for ozonizer. MasterThesis in the Department of ElectricalEngineering, Faculty of Engineering,
Mahanakorn University of Technology,
Bangkok, Thailand.Ketkaew, S. 2002. Air cleaner by using high
voltage electrostatic. Proc. IEEE Int. Conf.
on Power System Technology. Kunming,
China, 13-17 October, pp.1611-1614.Ketkaew, S. 2005. The study of ozone gas
generating technique using high frequency,
high voltage dc switching power supply ofhigh ripple voltage (in Thai). Journal of
King Mongkut’s Institute of Technology LatKrabang 22 (2): 1-6.
Mohan, N.; Undeland, T.M.; and Robbins,W.P. 1989. Power electronics: Converters,
applications, and design. John Wiley &Sons, New York, NY, USA.
National Semiconductor. 2006. LM555Datasheet, pp. 1-12.
Rattanawichain, P. 2002. Ozone generator for
solar energy. Master Thesis in Departmentof Electrical Engineering. Faculty of
Engineering, King Mongkut’s Institute of
Technology Lat Krabang, Bangkok,Thailand.
Trerutpicharn, S.; Deeon, S.; and Potivejkul, S.
1996. High voltage high frequency
transformer for testing insulator. 19
th
Electrical Engineering Conference,Bangkok, Thailand, 7-8 November.
Technical Report 47
Related Documents