Quarterly Results Q2FY13 THE BANKER TO EVERY INDIAN

Welcome message from author
This document is posted to help you gain knowledge. Please leave a comment to let me know what you think about it! Share it to your friends and learn new things together.
Transcript
Quarterly Results Q2FY13
THE BANKER TO EVERY INDIAN
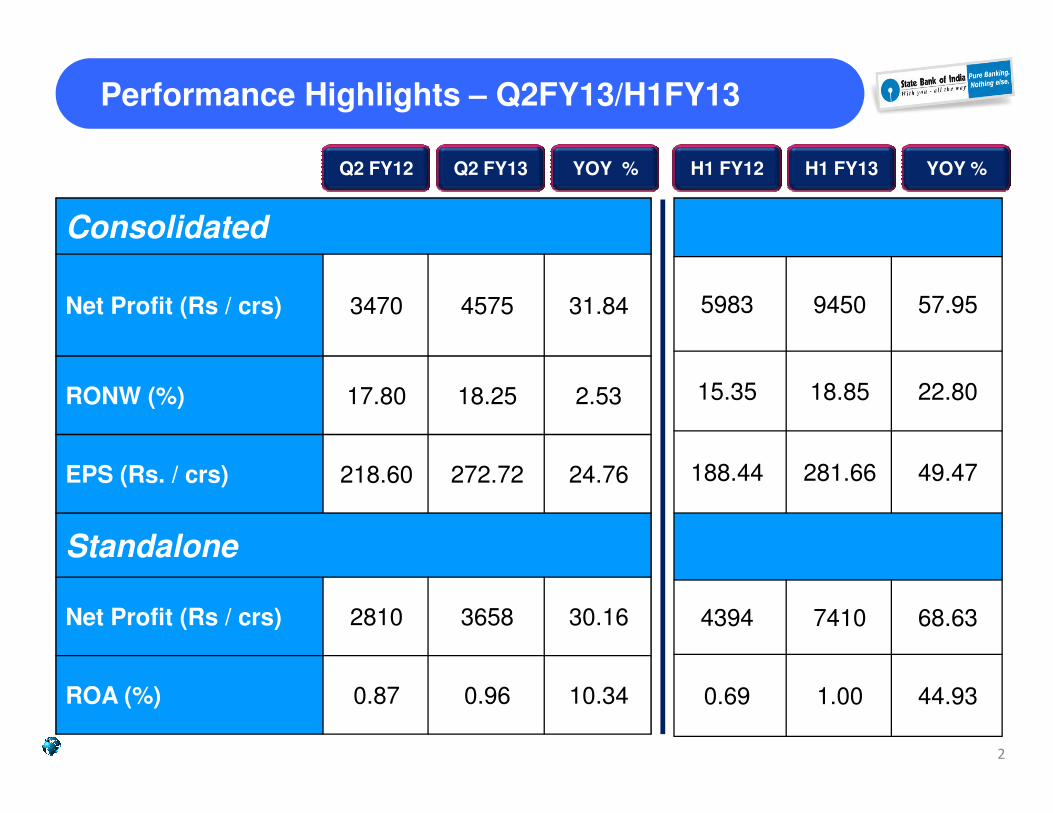
Performance Highlights – Q2FY13/H1FY13
Q2 FY12 Q2 FY13 YOY % H1 FY12 H1 FY13 YOY %
Consolidated
Net Profit (Rs / crs) 3470 4575 31.84
RONW (%) 17.80 18.25 2.53
5983 9450 57.95
15.35 18.85 22.80
2
RONW (%) 17.80 18.25 2.53
EPS (Rs. / crs) 218.60 272.72 24.76
Standalone
Net Profit (Rs / crs) 2810 3658 30.16
ROA (%) 0.87 0.96 10.34
188.44 281.66 49.47
4394 7410 68.63
0.69 1.00 44.93
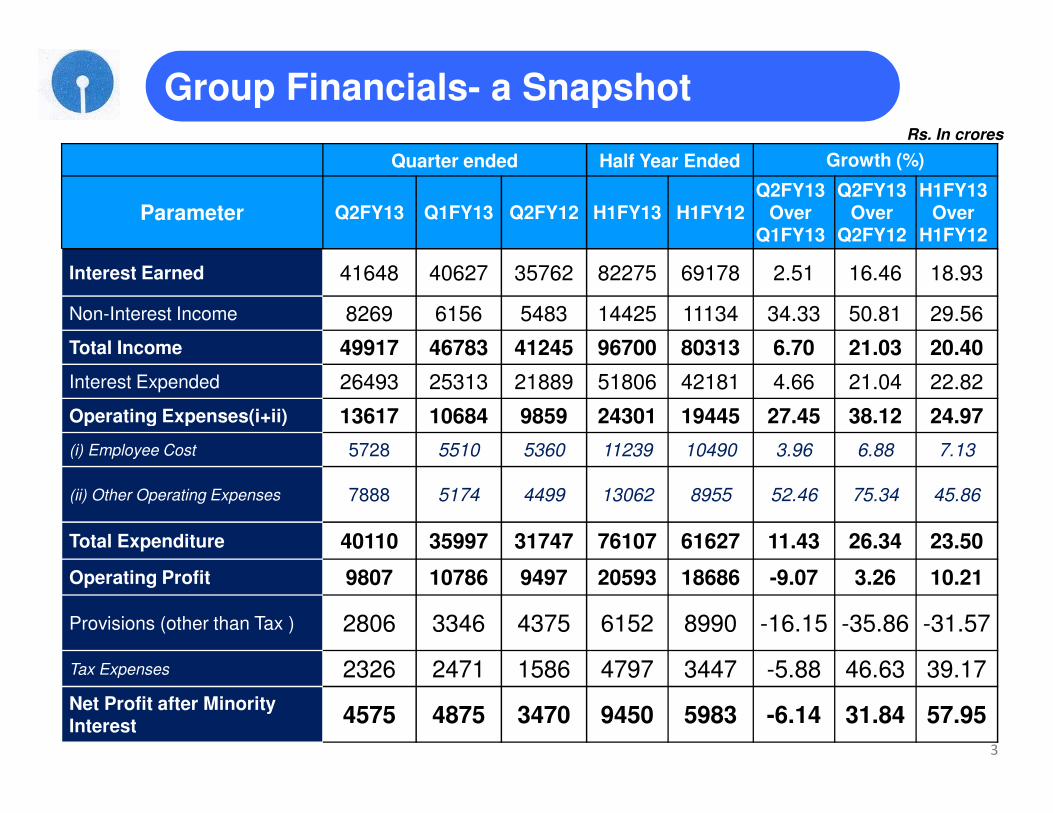
Rs. In crores
Quarter ended Half Year Ended Growth (%)
Parameter Q2FY13 Q1FY13 Q2FY12 H1FY13 H1FY12Q2FY13
Over Q1FY13
Q2FY13 Over
Q2FY12
H1FY13 Over
H1FY12
Interest Earned 41648 40627 35762 82275 69178 2.51 16.46 18.93
Non-Interest Income 8269 6156 5483 14425 11134 34.33 50.81 29.56
Total Income 49917 46783 41245 96700 80313 6.70 21.03 20.40
Interest Expended 26493 25313 21889 51806 42181 4.66 21.04 22.82
Operating Expenses(i+ii) 13617 10684 9859 24301 19445 27.45 38.12 24.97
Group Financials- a Snapshot
3
Operating Expenses(i+ii) 13617 10684 9859 24301 19445 27.45 38.12 24.97
(i) Employee Cost 5728 5510 5360 11239 10490 3.96 6.88 7.13
(ii) Other Operating Expenses 7888 5174 4499 13062 8955 52.46 75.34 45.86
Total Expenditure 40110 35997 31747 76107 61627 11.43 26.34 23.50
Operating Profit 9807 10786 9497 20593 18686 -9.07 3.26 10.21
Provisions (other than Tax ) 2806 3346 4375 6152 8990 -16.15 -35.86 -31.57
Tax Expenses 2326 2471 1586 4797 3447 -5.88 46.63 39.17
Net Profit after Minority Interest
4575 4875 3470 9450 5983 -6.14 31.84 57.95
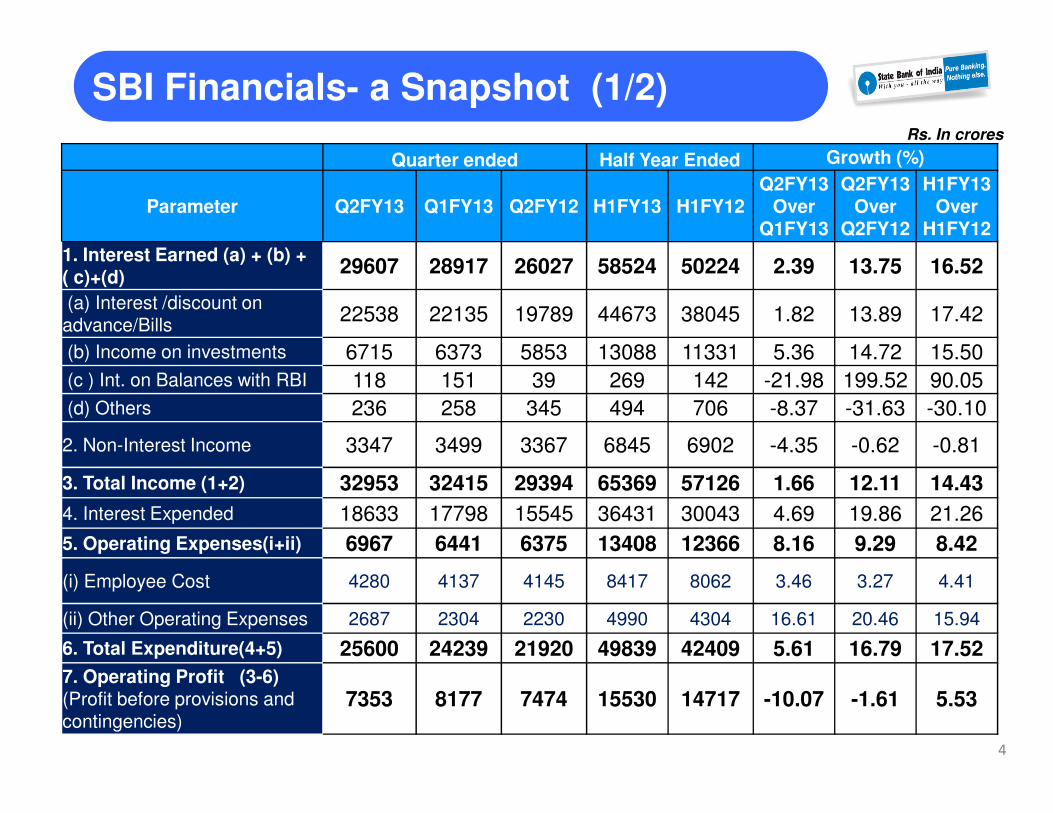
Rs. In crores
Quarter ended Half Year Ended Growth (%)
Parameter Q2FY13 Q1FY13 Q2FY12 H1FY13 H1FY12Q2FY13
Over Q1FY13
Q2FY13 Over
Q2FY12
H1FY13 Over
H1FY12
1. Interest Earned (a) + (b) + ( c)+(d)
29607 28917 26027 58524 50224 2.39 13.75 16.52
(a) Interest /discount on advance/Bills
22538 22135 19789 44673 38045 1.82 13.89 17.42
(b) Income on investments 6715 6373 5853 13088 11331 5.36 14.72 15.50
(c ) Int. on Balances with RBI 118 151 39 269 142 -21.98 199.52 90.05
(d) Others 236 258 345 494 706 -8.37 -31.63 -30.10
SBI Financials- a Snapshot (1/2)
4
(d) Others 236 258 345 494 706 -8.37 -31.63 -30.10
2. Non-Interest Income 3347 3499 3367 6845 6902 -4.35 -0.62 -0.81
3. Total Income (1+2) 32953 32415 29394 65369 57126 1.66 12.11 14.43
4. Interest Expended 18633 17798 15545 36431 30043 4.69 19.86 21.26
5. Operating Expenses(i+ii) 6967 6441 6375 13408 12366 8.16 9.29 8.42
(i) Employee Cost 4280 4137 4145 8417 8062 3.46 3.27 4.41
(ii) Other Operating Expenses 2687 2304 2230 4990 4304 16.61 20.46 15.94
6. Total Expenditure(4+5) 25600 24239 21920 49839 42409 5.61 16.79 17.52
7. Operating Profit (3-6) (Profit before provisions and contingencies)
7353 8177 7474 15530 14717 -10.07 -1.61 5.53
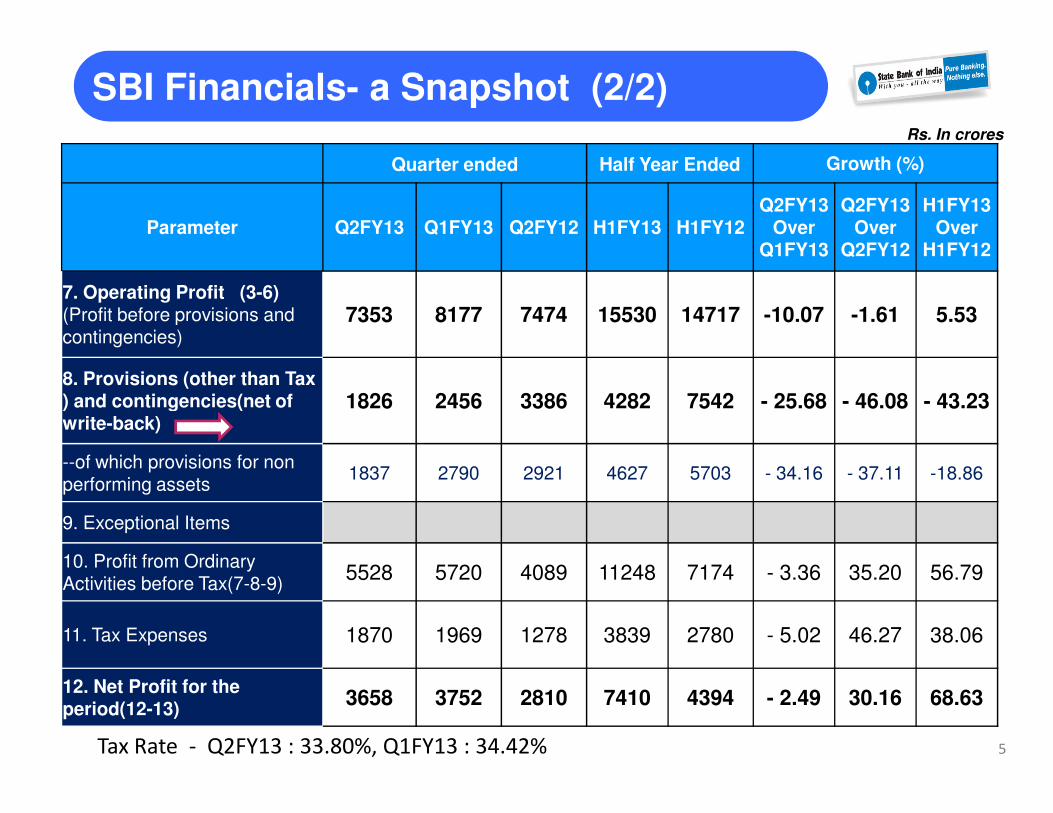
Rs. In crores
Quarter ended Half Year Ended Growth (%)
Parameter Q2FY13 Q1FY13 Q2FY12 H1FY13 H1FY12Q2FY13
Over Q1FY13
Q2FY13 Over
Q2FY12
H1FY13 Over
H1FY12
7. Operating Profit (3-6) (Profit before provisions and contingencies)
7353 8177 7474 15530 14717 -10.07 -1.61 5.53
8. Provisions (other than Tax ) and contingencies(net of 1826 2456 3386 4282 7542 - 25.68 - 46.08 - 43.23
SBI Financials- a Snapshot (2/2)
5
) and contingencies(net of write-back)
1826 2456 3386 4282 7542 - 25.68 - 46.08 - 43.23
--of which provisions for non performing assets
1837 2790 2921 4627 5703 - 34.16 - 37.11 -18.86
9. Exceptional Items
10. Profit from Ordinary Activities before Tax(7-8-9)
5528 5720 4089 11248 7174 - 3.36 35.20 56.79
11. Tax Expenses 1870 1969 1278 3839 2780 - 5.02 46.27 38.06
12. Net Profit for the period(12-13)
3658 3752 2810 7410 4394 - 2.49 30.16 68.63
Tax Rate - Q2FY13 : 33.80%, Q1FY13 : 34.42%
NII and Operating Profit (1/2)
Q2 FY12 Q2 FY13YOY Gr.%
H1 FY12 H1 FY13YOY Gr.%
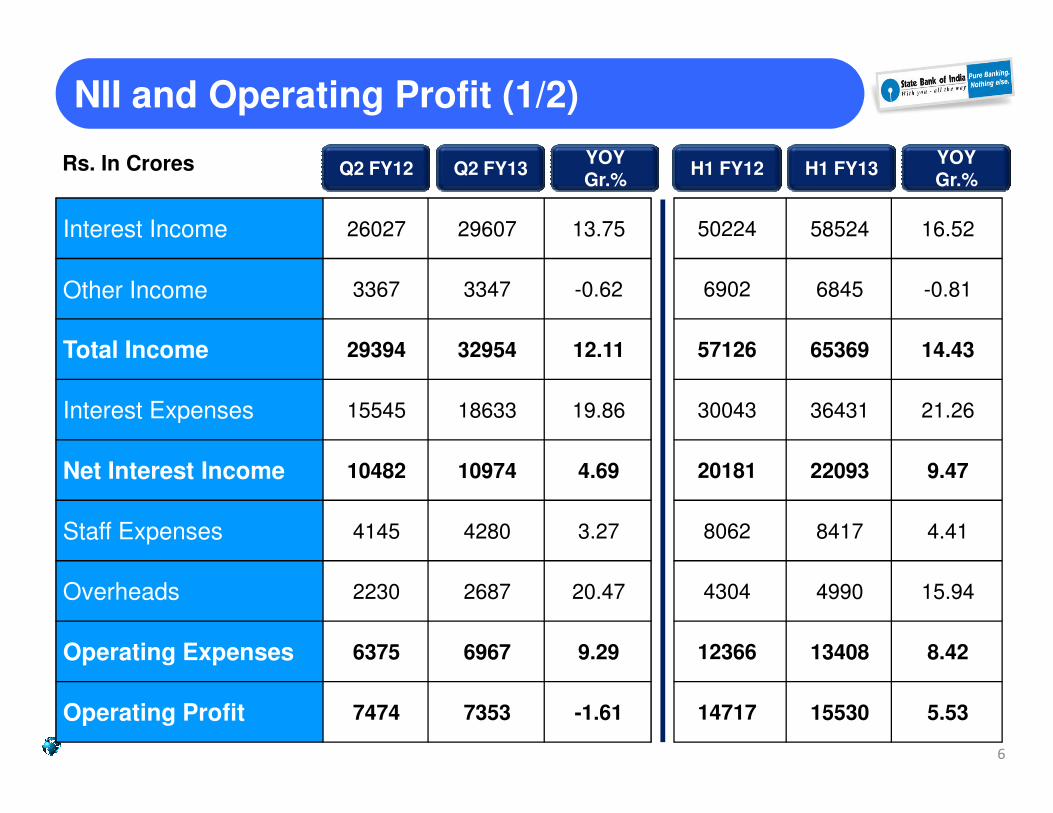
Interest Income 26027 29607 13.75
Other Income 3367 3347 -0.62
Total Income 29394 32954 12.11
Interest Expenses 15545 18633 19.86
50224 58524 16.52
6902 6845 -0.81
57126 65369 14.43
30043 36431 21.26
Rs. In Crores
6
Interest Expenses 15545 18633 19.86
Net Interest Income 10482 10974 4.69
Staff Expenses 4145 4280 3.27
Overheads 2230 2687 20.47
Operating Expenses 6375 6967 9.29
Operating Profit 7474 7353 -1.61
30043 36431 21.26
20181 22093 9.47
8062 8417 4.41
4304 4990 15.94
12366 13408 8.42
14717 15530 5.53
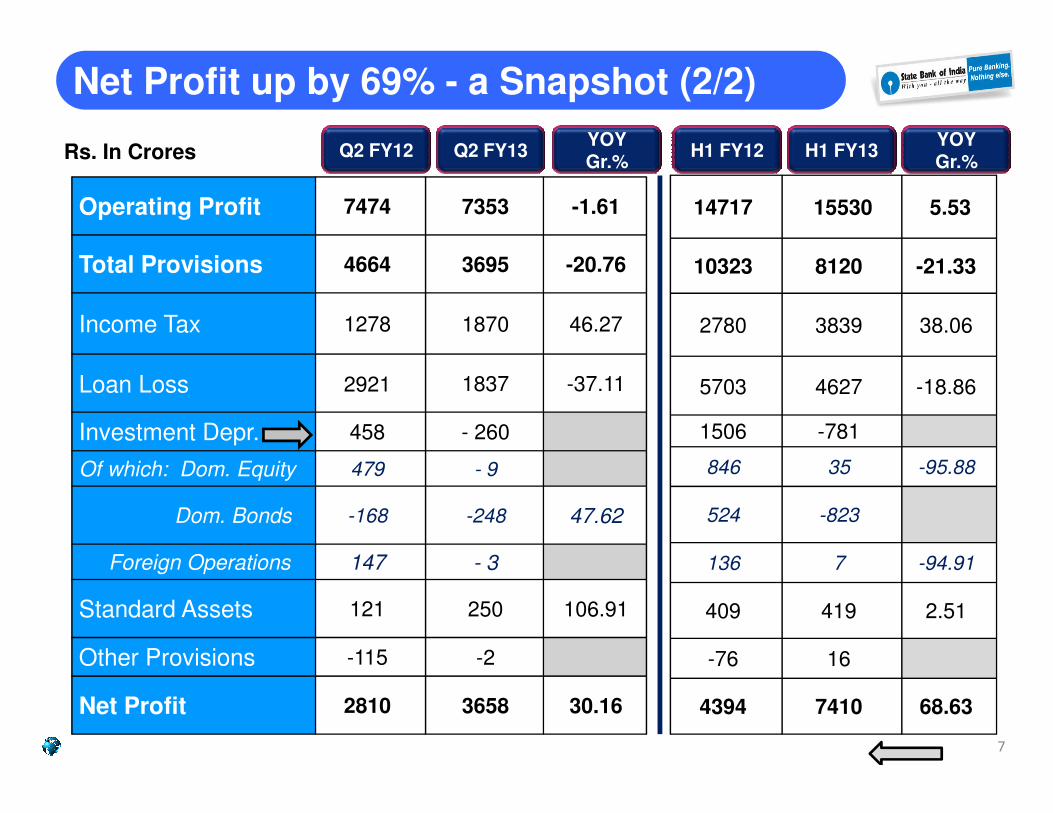
Net Profit up by 69% - a Snapshot (2/2)
YOY Gr.%
Operating Profit 7474 7353 -1.61
Total Provisions 4664 3695 -20.76
Income Tax 1278 1870 46.27
Loan Loss 2921 1837 -37.11
Rs. In Crores
14717 15530 5.53
10323 8120 -21.33
2780 3839 38.06
5703 4627 -18.86
YOY Gr.%
Q2 FY12 Q2 FY13 H1 FY12 H1 FY13
7
Investment Depr. 458 - 260
Of which: Dom. Equity 479 - 9
Dom. Bonds -168 -248 47.62
Foreign Operations 147 - 3
Standard Assets 121 250 106.91
Other Provisions -115 -2
Net Profit 2810 3658 30.16
1506 -781
846 35 -95.88
524 -823
136 7 -94.91
409 419 2.51
-76 16
4394 7410 68.63
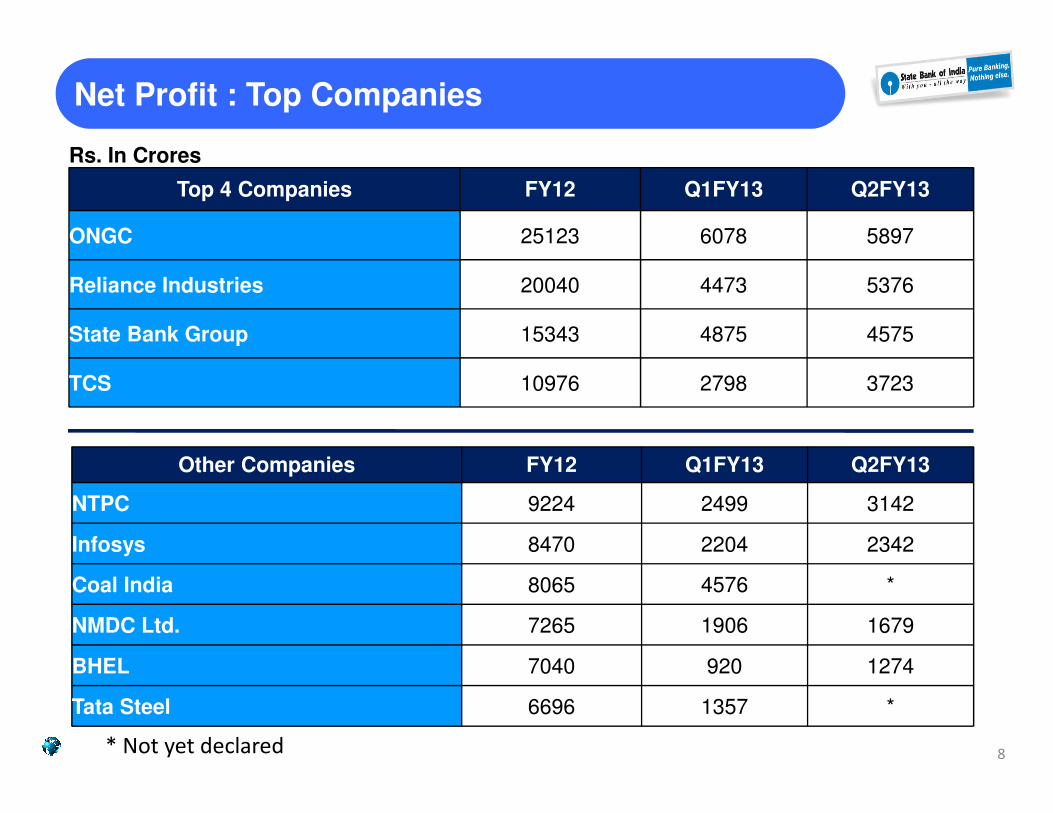
Net Profit : Top Companies
Rs. In Crores
Top 4 Companies FY12 Q1FY13 Q2FY13
ONGC 25123 6078 5897
Reliance Industries 20040 4473 5376
State Bank Group 15343 4875 4575
TCS 10976 2798 3723
Other Companies FY12 Q1FY13 Q2FY13
NTPC 9224 2499 3142
Infosys 8470 2204 2342
Coal India 8065 4576 *
NMDC Ltd. 7265 1906 1679
BHEL 7040 920 1274
Tata Steel 6696 1357 *
* Not yet declared 8
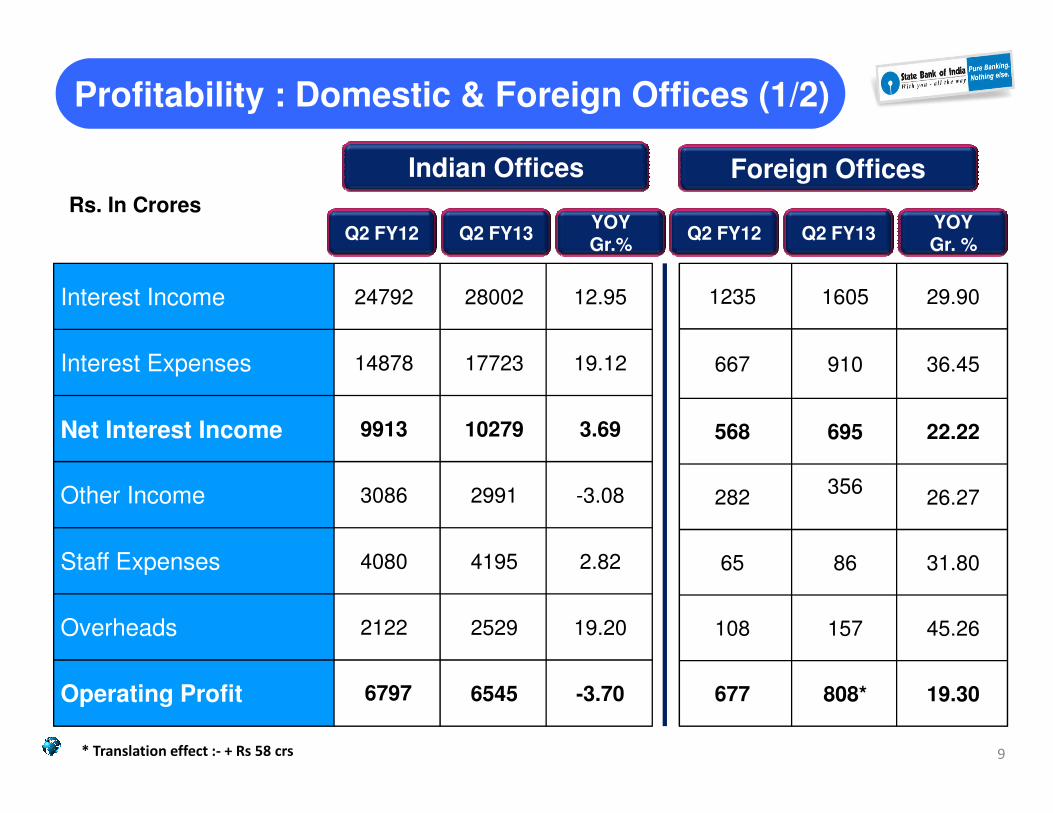
Profitability : Domestic & Foreign Offices (1/2)
Indian Offices Foreign Offices
Interest Income 24792 28002 12.95
Interest Expenses 14878 17723 19.12
1235 1605 29.90
667 910 36.45
Rs. In Crores
Q2 FY12 Q2 FY13YOY Gr.%
Q2 FY12 Q2 FY13YOY Gr. %
Net Interest Income 9913 10279 3.69
Other Income 3086 2991 -3.08
Staff Expenses 4080 4195 2.82
Overheads 2122 2529 19.20
Operating Profit 6797 6545 -3.70
568 695 22.22
282356
26.27
65 86 31.80
108 157 45.26
677 808* 19.30
* Translation effect :- + Rs 58 crs 9
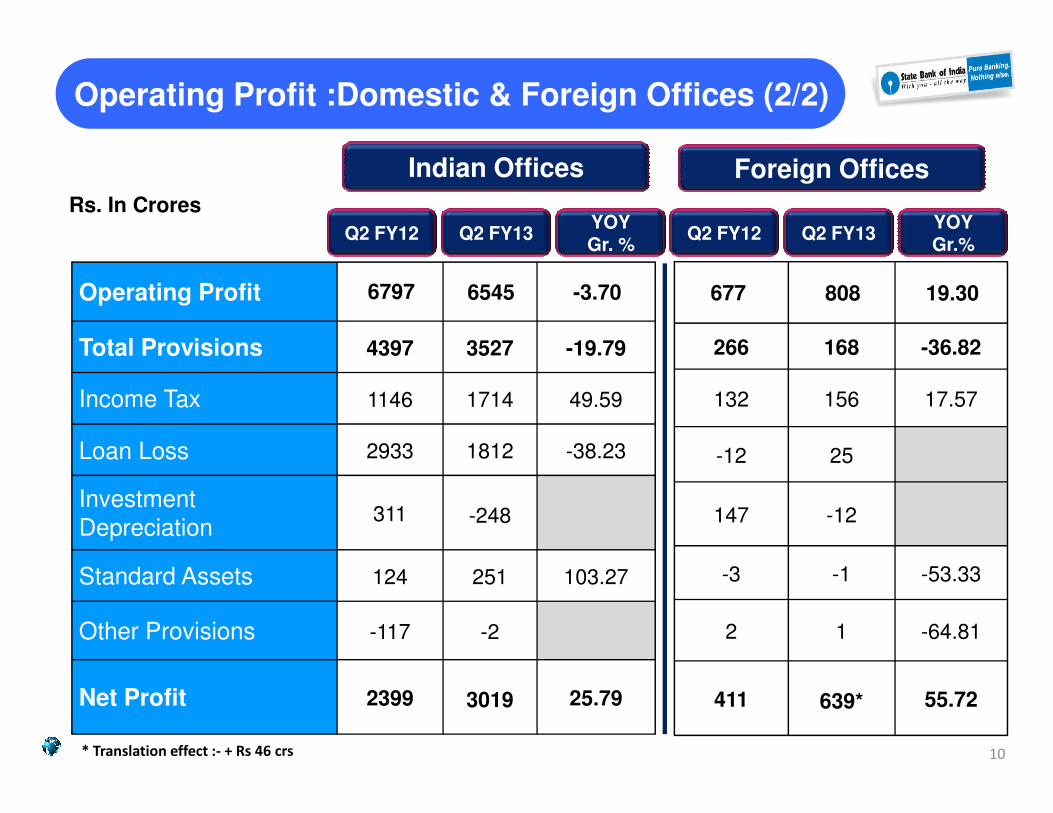
Operating Profit :Domestic & Foreign Offices (2/2)
Indian Offices Foreign Offices
Rs. In Crores
Q2 FY12 Q2 FY13YOY Gr. %
Q2 FY12 Q2 FY13YOY Gr.%
Operating Profit 6797 6545 -3.70
Total Provisions 4397 3527 -19.79
Income Tax 1146 1714 49.59
677 808 19.30
266 168 -36.82
132 156 17.57Income Tax 1146 1714 49.59
Loan Loss 2933 1812 -38.23
Investment
Depreciation311 -248
Standard Assets 124 251 103.27
Other Provisions -117 -2
Net Profit 2399 3019 25.79
132 156 17.57
-12 25
147 -12
-3 -1 -53.33
2 1 -64.81
411 639* 55.72
10* Translation effect :- + Rs 46 crs
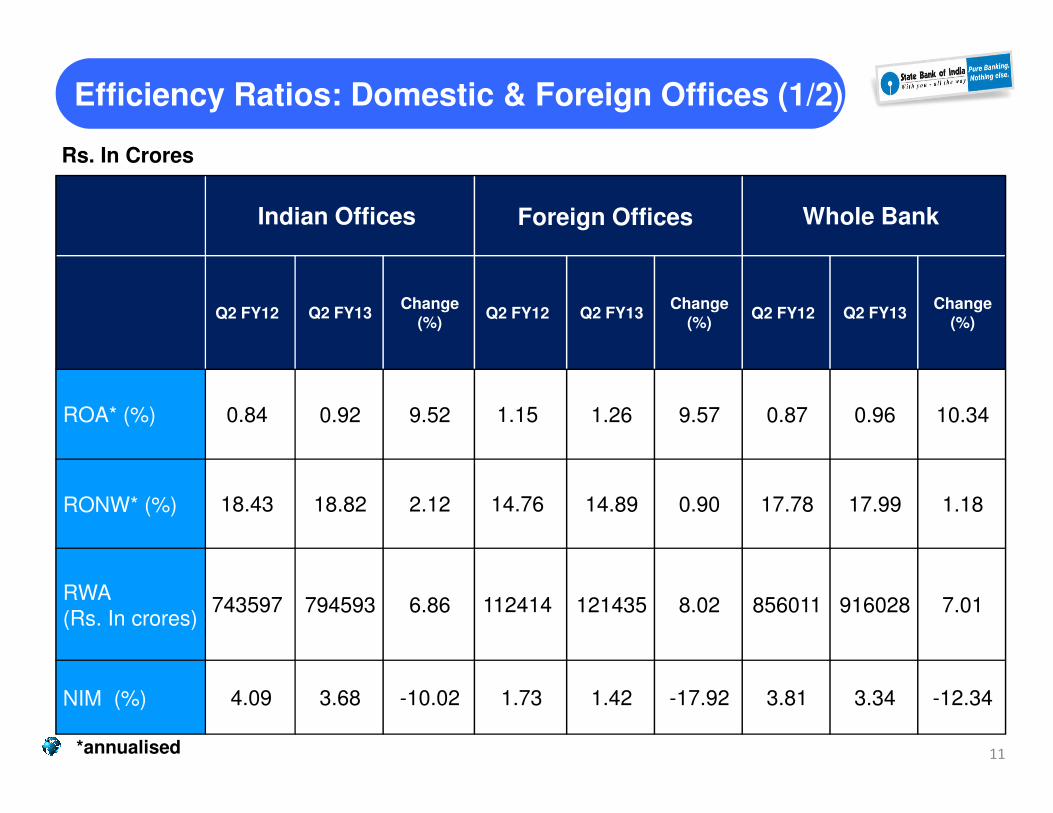
Efficiency Ratios: Domestic & Foreign Offices (1/2) Efficiency Ratios: Domestic & Foreign Offices (1/2)
Rs. In Crores
Indian Offices Foreign Offices Whole Bank
Q2 FY12 Q2 FY13Change
(%)Q2 FY12 Q2 FY13
Change (%)
Q2 FY12 Q2 FY13Change
(%)
ROA* (%) 0.84 0.92 9.52 1.15 1.26 9.57 0.87 0.96 10.34ROA* (%) 0.84 0.92 9.52 1.15 1.26 9.57 0.87 0.96 10.34
RONW* (%) 18.43 18.82 2.12 14.76 14.89 0.90 17.78 17.99 1.18
RWA
(Rs. In crores)743597 794593 6.86 112414 121435 8.02 856011 916028 7.01
NIM (%) 4.09 3.68 -10.02 1.73 1.42 -17.92 3.81 3.34 -12.34
*annualised 11
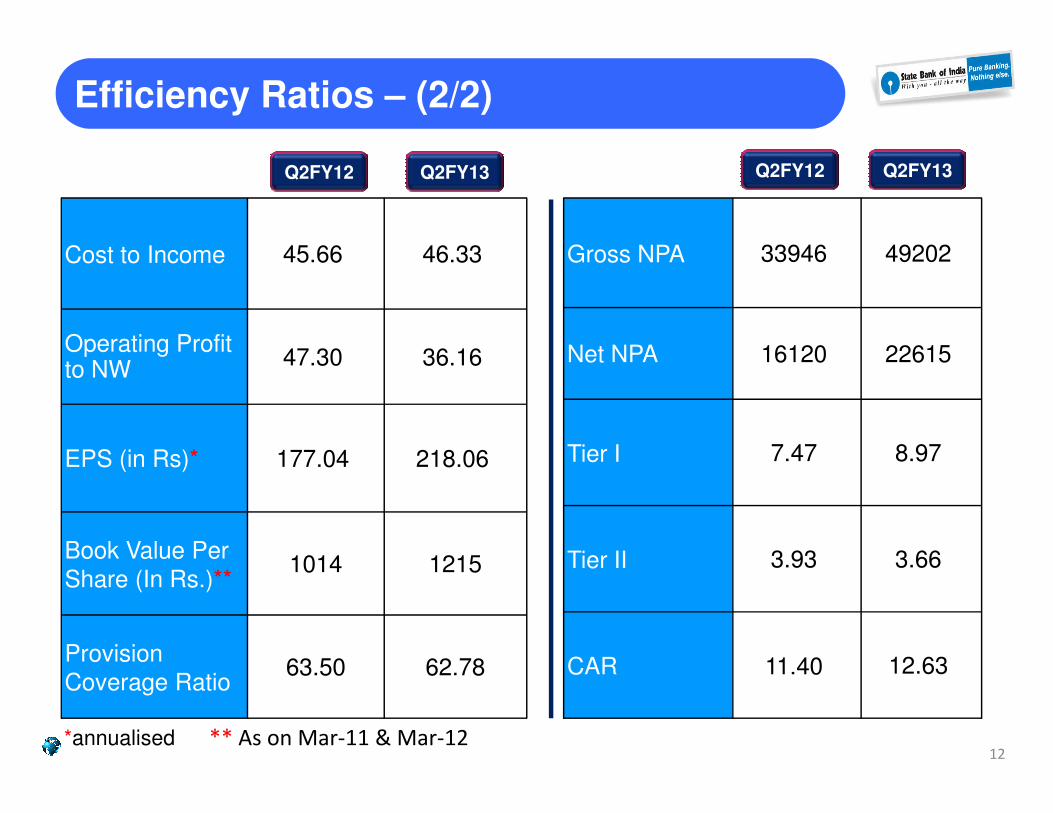
Cost to Income 45.66 46.33
Operating Profit to NW
47.30 36.16
Efficiency Ratios – (2/2)
Gross NPA 33946 49202
Net NPA 16120 22615
Q2FY12 Q2FY13 Q2FY12 Q2FY13
EPS (in Rs)* 177.04 218.06
Book Value Per
Share (In Rs.)**1014 1215
Provision
Coverage Ratio63.50 62.78
Tier I 7.47 8.97
Tier II 3.93 3.66
CAR 11.40 12.63
** As on Mar-11 & Mar-1212
*annualised
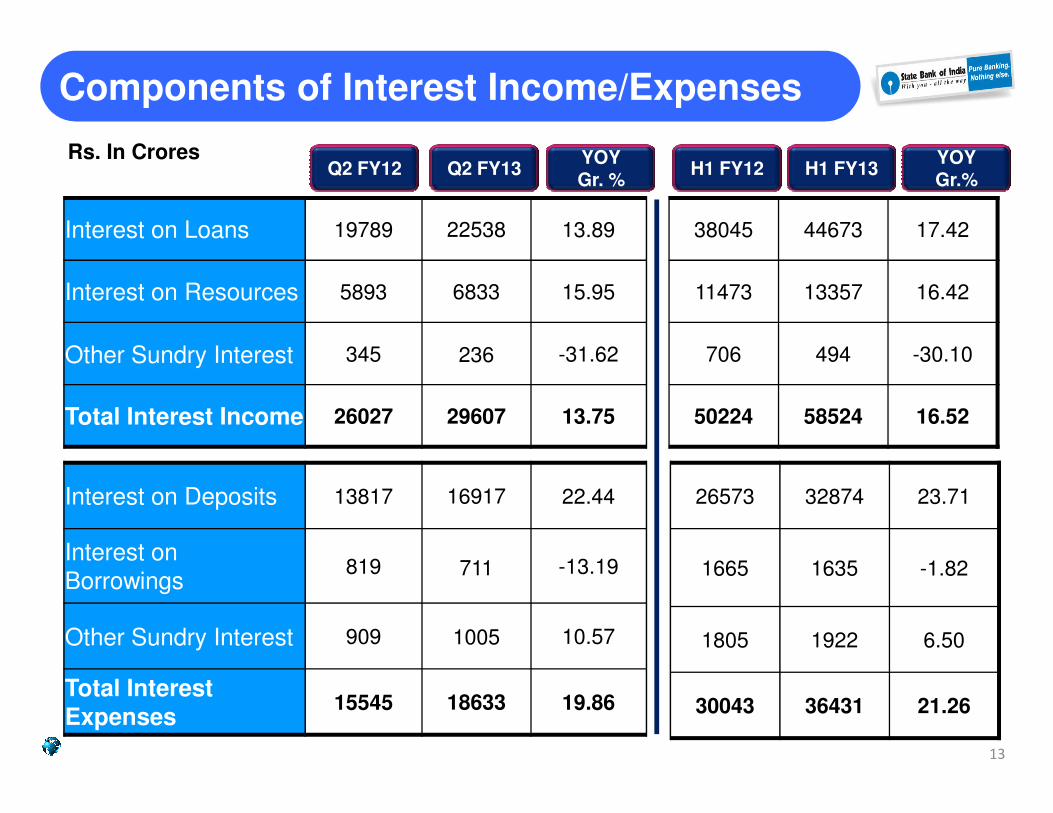
Interest on Loans 19789 22538 13.89
Interest on Resources 5893 6833 15.95
Other Sundry Interest 345 236 -31.62
Total Interest Income 26027 29607 13.75
Rs. In Crores
Components of Interest Income/Expenses
YOY Gr. %
YOY Gr.%
Q2 FY12 Q2 FY13 H1 FY12 H1 FY13
38045 44673 17.42
11473 13357 16.42
706 494 -30.10
50224 58524 16.52Total Interest Income 26027 29607 13.75 50224 58524 16.52
Interest on Deposits 13817 16917 22.44
Interest on
Borrowings819 711 -13.19
Other Sundry Interest 909 1005 10.57
Total Interest Expenses
15545 18633 19.86
26573 32874 23.71
1665 1635 -1.82
1805 1922 6.50
30043 36431 21.26
13
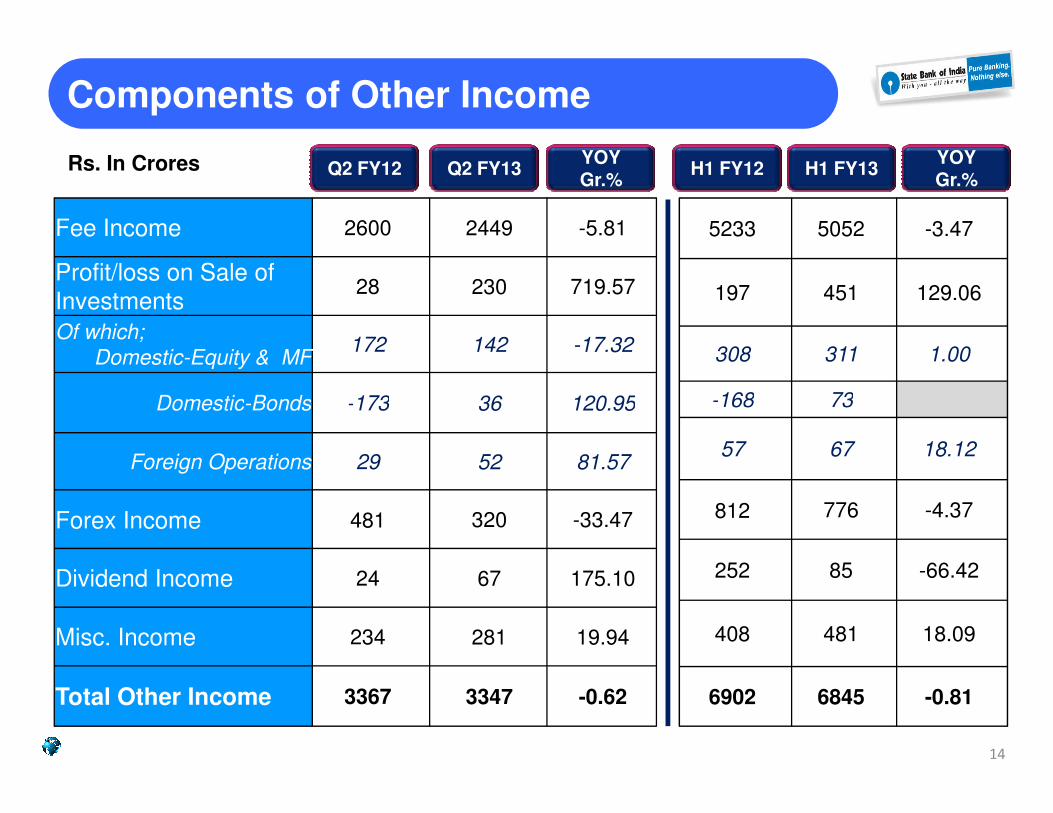
Components of Other Income
Fee Income 2600 2449 -5.81
Profit/loss on Sale of
Investments28 230 719.57
Of which;
Domestic-Equity & MF172 142 -17.32
Domestic-Bonds -173 36 120.95
5233 5052 -3.47
197 451 129.06
308 311 1.00
-168 73
Rs. In Crores YOY Gr.%
YOY Gr.%
Q2 FY12 Q2 FY13 H1 FY12 H1 FY13
Domestic-Bonds -173 36 120.95
Foreign Operations 29 52 81.57
Forex Income 481 320 -33.47
Dividend Income 24 67 175.10
Misc. Income 234 281 19.94
Total Other Income 3367 3347 -0.62
-168 73
57 67 18.12
812 776 -4.37
252 85 -66.42
408 481 18.09
6902 6845 -0.81
14
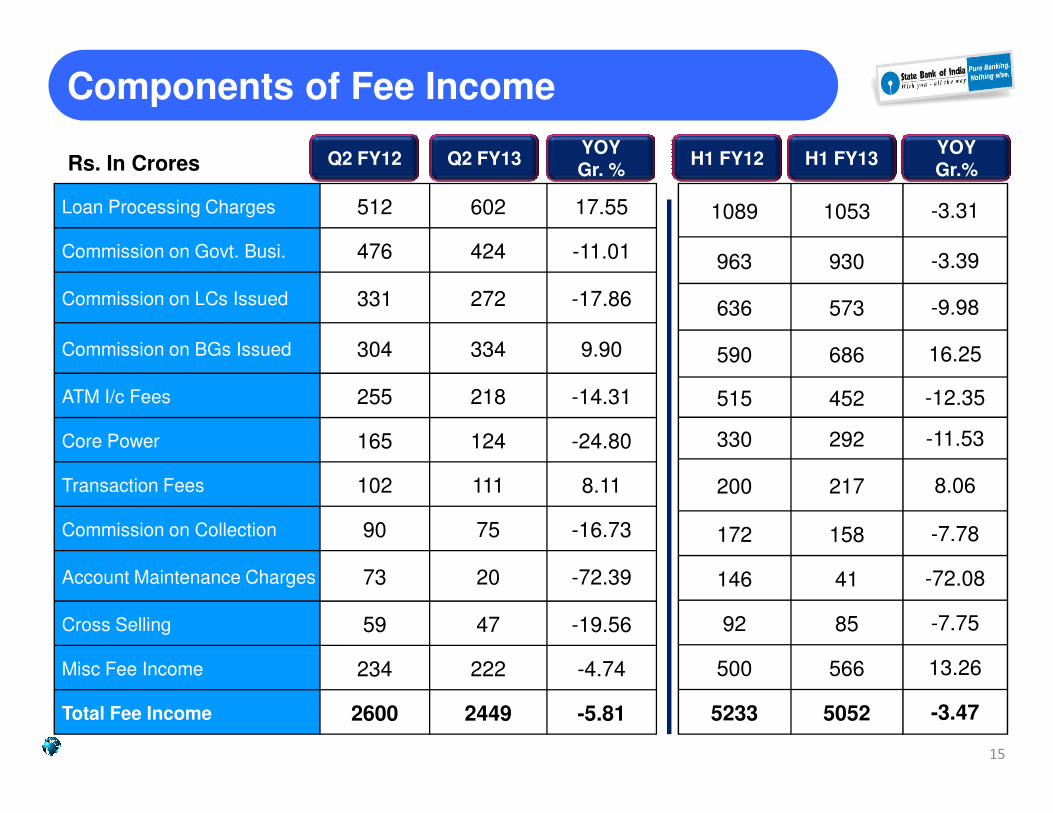
Components of Fee Income
Rs. In CroresYOY Gr. %
YOY Gr.%
Q2 FY12 Q2 FY13 H1 FY12 H1 FY13
Loan Processing Charges 512 602 17.55
Commission on Govt. Busi. 476 424 -11.01
Commission on LCs Issued 331 272 -17.86
Commission on BGs Issued 304 334 9.90
ATM I/c Fees 255 218 -14.31
1089 1053 -3.31
963 930 -3.39
636 573 -9.98
590 686 16.25
515 452 -12.35ATM I/c Fees 255 218 -14.31
Core Power 165 124 -24.80
Transaction Fees 102 111 8.11
Commission on Collection 90 75 -16.73
Account Maintenance Charges 73 20 -72.39
Cross Selling 59 47 -19.56
Misc Fee Income 234 222 -4.74
Total Fee Income 2600 2449 -5.81
515 452 -12.35
330 292 -11.53
200 217 8.06
172 158 -7.78
146 41 -72.08
92 85 -7.75
500 566 13.26
5233 5052 -3.47
15
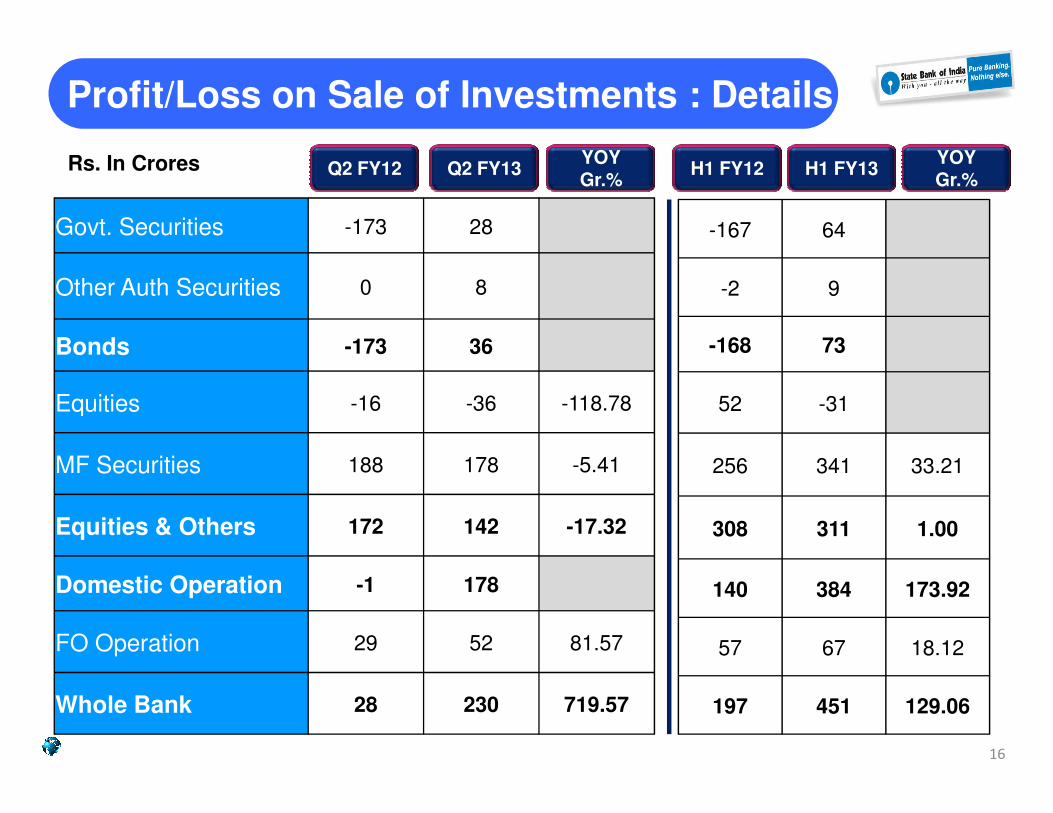
Govt. Securities -173 28
Other Auth Securities 0 8
Bonds -173 36
Equities -16 -36 -118.78
Profit/Loss on Sale of Investments : DetailsProfit/Loss on Sale of Investments : Details
Rs. In Crores
-167 64
-2 9
-168 73
52 -31
YOY Gr.%
YOY Gr.%
Q2 FY12 Q2 FY13 H1 FY12 H1 FY13
Equities -16 -36 -118.78
MF Securities 188 178 -5.41
Equities & Others 172 142 -17.32
Domestic Operation -1 178
FO Operation 29 52 81.57
Whole Bank 28 230 719.57
16
52 -31
256 341 33.21
308 311 1.00
140 384 173.92
57 67 18.12
197 451 129.06
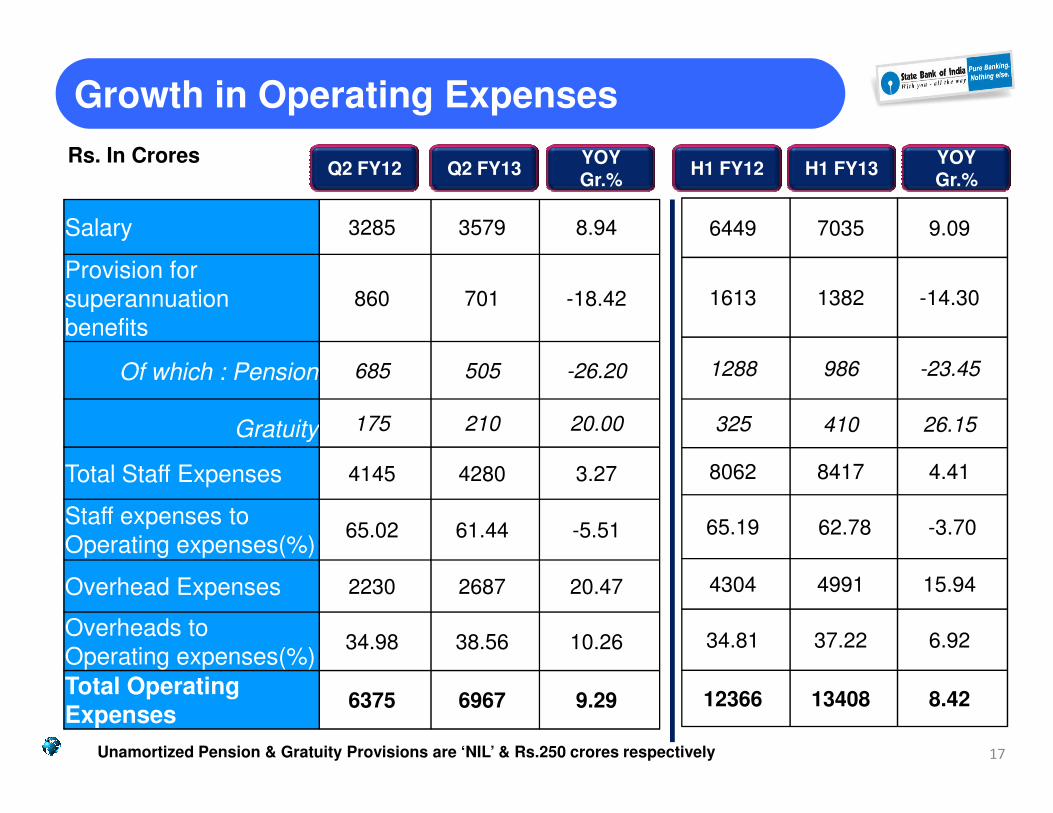
Growth in Operating Expenses
Salary 3285 3579 8.94
Provision for
superannuation
benefits
860 701 -18.42
Of which : Pension 685 505 -26.20
6449 7035 9.09
1613 1382 -14.30
1288 986 -23.45
Rs. In Crores YOY Gr.%
YOY Gr.%
Q2 FY12 Q2 FY13 H1 FY12 H1 FY13
Gratuity 175 210 20.00
Total Staff Expenses 4145 4280 3.27
Staff expenses to
Operating expenses(%)65.02 61.44 -5.51
Overhead Expenses 2230 2687 20.47
Overheads to
Operating expenses(%)34.98 38.56 10.26
Total Operating Expenses
6375 6967 9.29
325 410 26.15
8062 8417 4.41
65.19 62.78 -3.70
4304 4991 15.94
34.81 37.22 6.92
12366 13408 8.42
17Unamortized Pension & Gratuity Provisions are ‘NIL’ & Rs.250 crores respectively
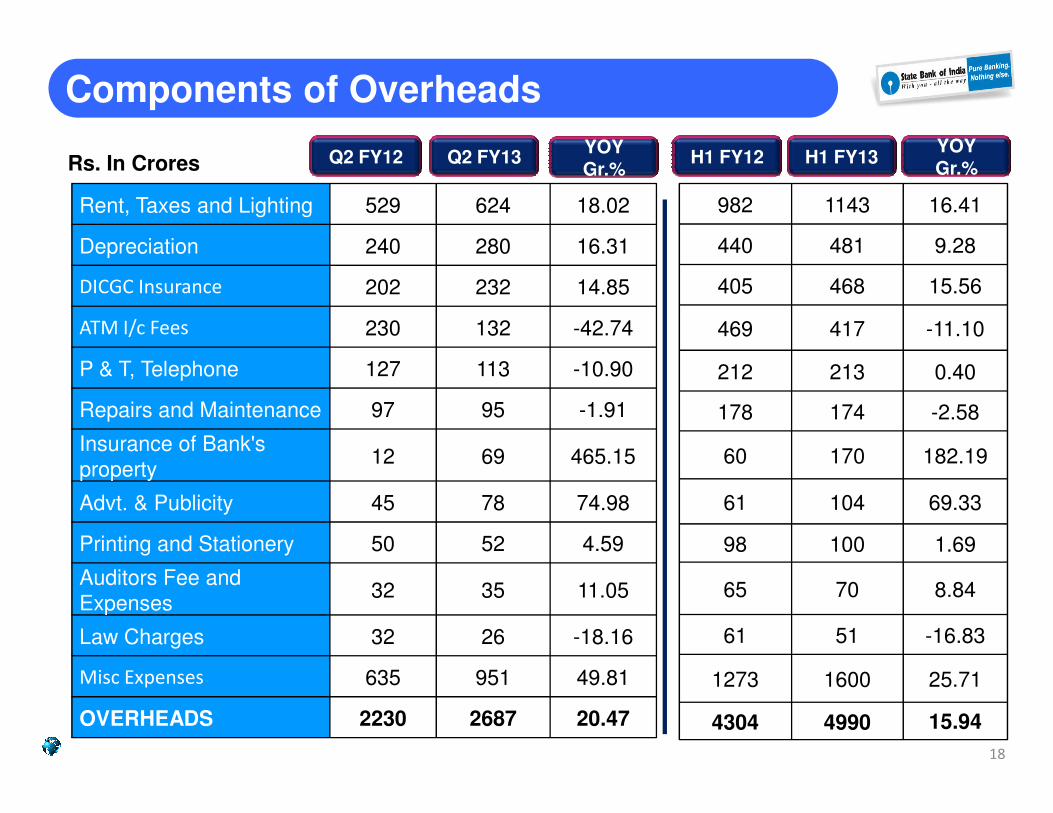
Components of Overheads
Rent, Taxes and Lighting 529 624 18.02
Depreciation 240 280 16.31
DICGC Insurance 202 232 14.85
ATM I/c Fees 230 132 -42.74
P & T, Telephone 127 113 -10.90
Repairs and Maintenance 97 95 -1.91
982 1143 16.41
440 481 9.28
405 468 15.56
469 417 -11.10
212 213 0.40
178 174 -2.58
Rs. In CroresYOY Gr.%
Q2 FY12 Q2 FY13 H1 FY12 H1 FY13YOY Gr.%
Repairs and Maintenance 97 95 -1.91
Insurance of Bank's
property12 69 465.15
Advt. & Publicity 45 78 74.98
Printing and Stationery 50 52 4.59
Auditors Fee and
Expenses32 35 11.05
Law Charges 32 26 -18.16
Misc Expenses 635 951 49.81
OVERHEADS 2230 2687 20.47
178 174 -2.58
60 170 182.19
61 104 69.33
98 100 1.69
65 70 8.84
61 51 -16.83
1273 1600 25.71
4304 4990 15.94
18
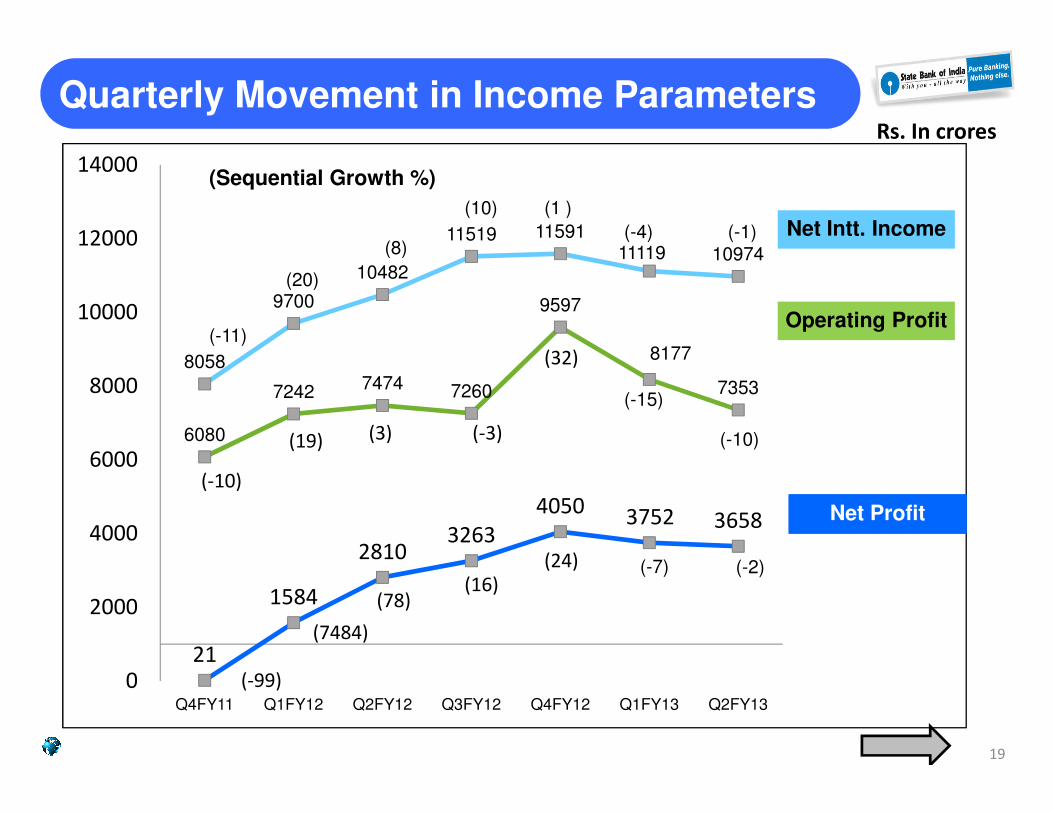
8058
9700
10482
11519 1159111119 10974
7242 7474 7260
9597
8177
73538000
10000
12000
14000
Net Intt. Income
Operating Profit
Rs. In crores
Quarterly Movement in Income Parameters
(Sequential Growth %)
(-11)
(20)
(8)
(10) (1 )
(32)
(-4)
(-15)
(-1)
21
1584
28103263
40503752 3658
6080
0
2000
4000
6000
Q4FY11 Q1FY12 Q2FY12 Q3FY12 Q4FY12 Q1FY13 Q2FY13
Net Profit
(-10)
(19) (3) (-3)
(-99)
(7484)
(78)(16)
(24)
(-15)
(-7)
19
(-10)
(-2)
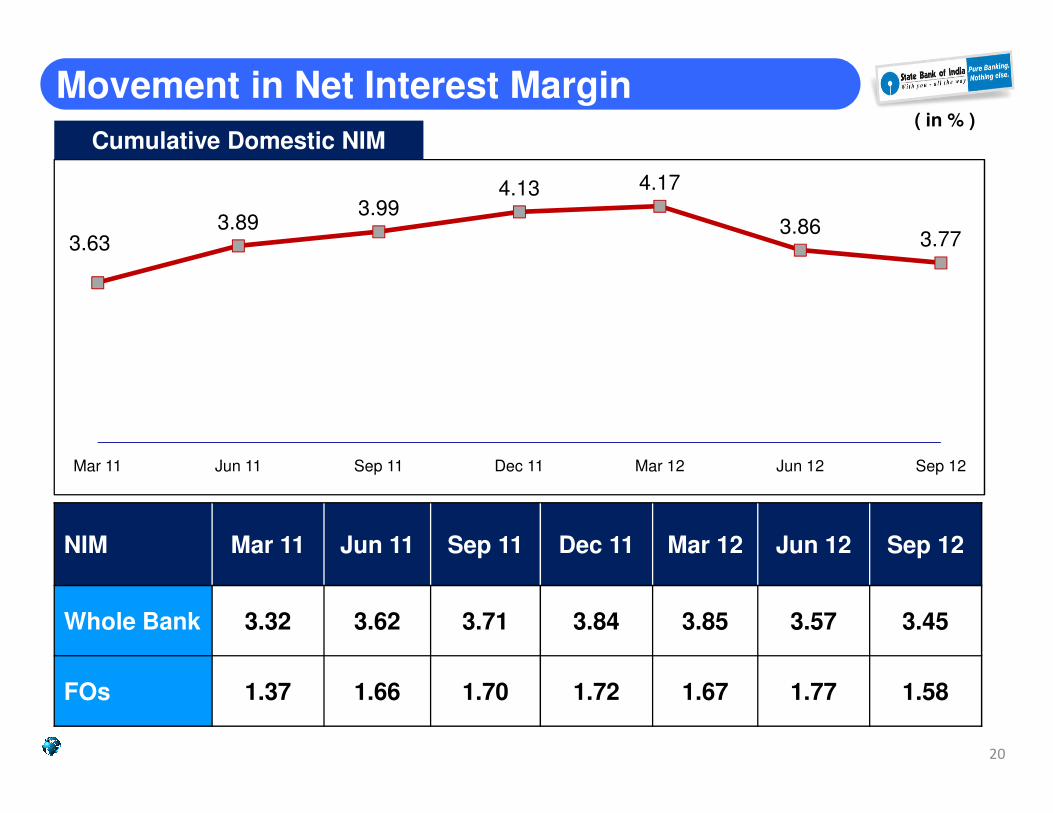
3.633.89
3.994.13 4.17
3.863.77
Movement in Net Interest Margin ( in % )
Cumulative Domestic NIM
NIM Mar 11 Jun 11 Sep 11 Dec 11 Mar 12 Jun 12 Sep 12
Whole Bank 3.32 3.62 3.71 3.84 3.85 3.57 3.45
FOs 1.37 1.66 1.70 1.72 1.67 1.77 1.58
Mar 11 Jun 11 Sep 11 Dec 11 Mar 12 Jun 12 Sep 12
20
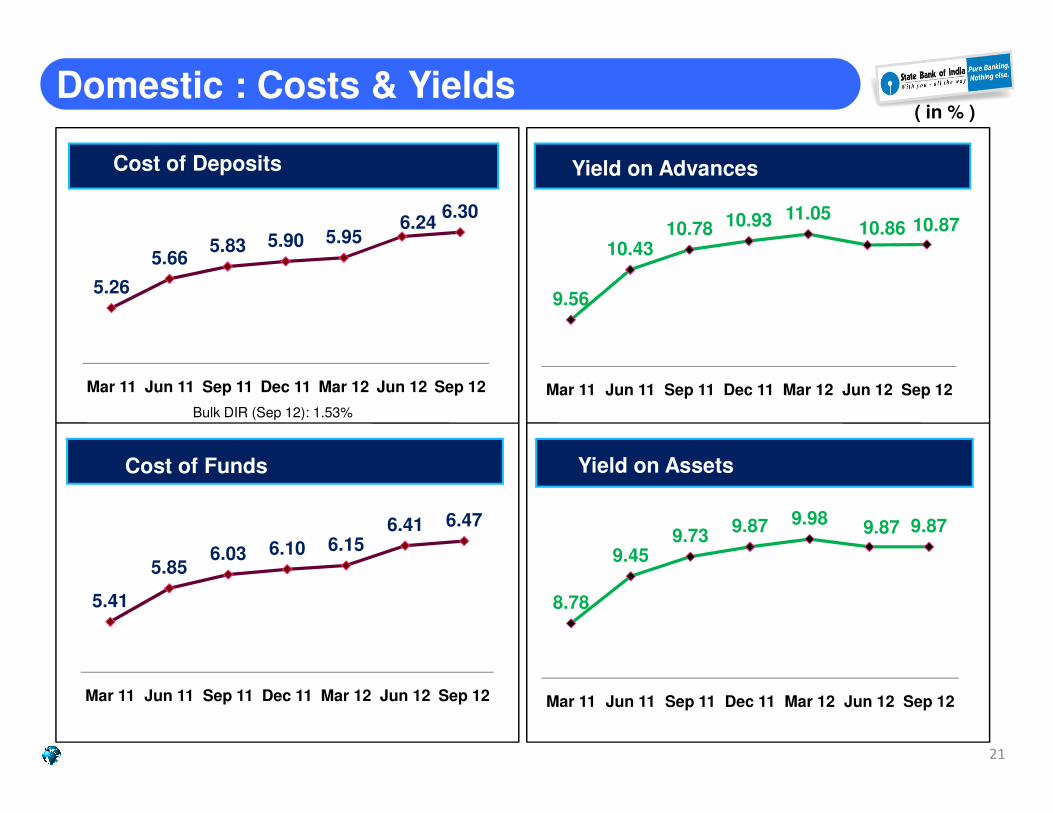
5.26
5.665.83 5.90 5.95
6.246.30
Mar 11 Jun 11 Sep 11 Dec 11 Mar 12 Jun 12 Sep 12
Yield on Advances /Yield on Assets Cost of Deposits
Domestic : Costs & Yields( in % )
9.56
10.4310.78 10.93 11.05
10.86 10.87
Mar 11 Jun 11 Sep 11 Dec 11 Mar 12 Jun 12 Sep 12
Yield on Advances
Bulk DIR (Sep 12): 1.53%
Yield on Investments
5.41
5.856.03 6.10 6.15
6.41 6.47
Mar 11 Jun 11 Sep 11 Dec 11 Mar 12 Jun 12 Sep 12
Cost of Funds
8.78
9.459.73
9.87 9.989.87 9.87
Mar 11 Jun 11 Sep 11 Dec 11 Mar 12 Jun 12 Sep 12
Yield on Assets
21
Bulk DIR (Sep 12): 1.53%
Yield on Advances /Yield on Assets Cost of Deposits
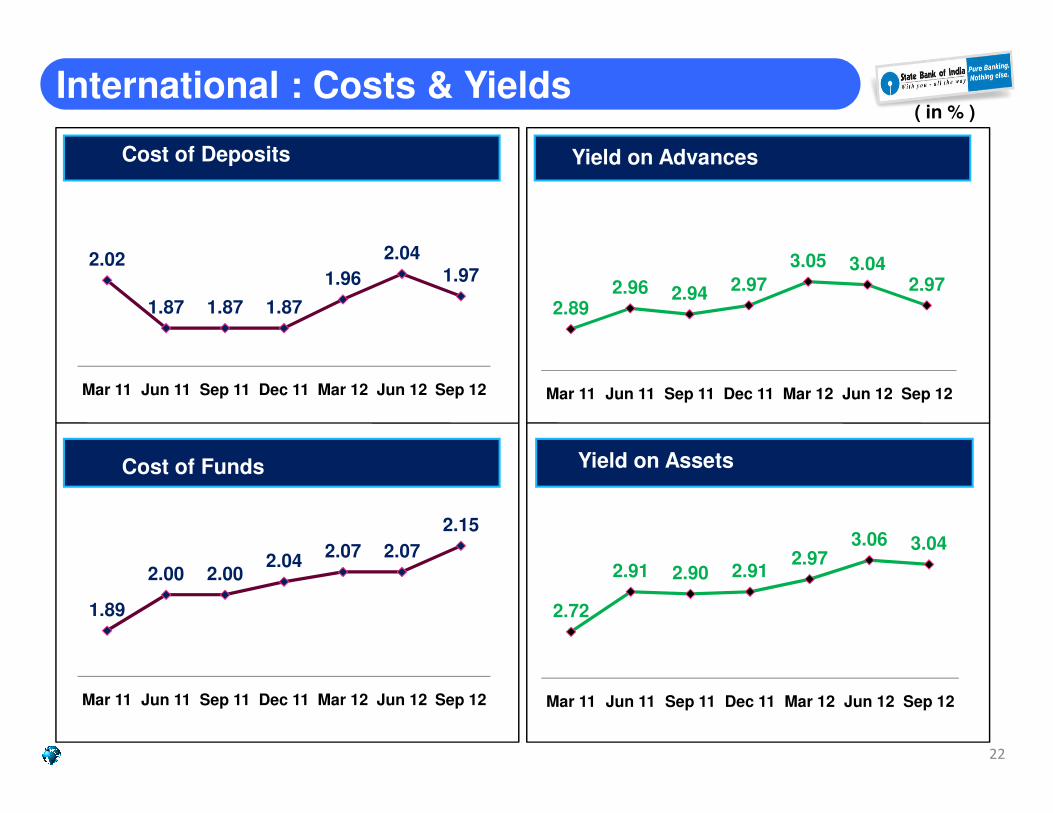
International : Costs & Yields( in % )
2.892.96 2.94 2.97
3.05 3.042.97
Mar 11 Jun 11 Sep 11 Dec 11 Mar 12 Jun 12 Sep 12
Yield on Advances
2.02
1.87 1.87 1.87
1.96
2.041.97
Mar 11 Jun 11 Sep 11 Dec 11 Mar 12 Jun 12 Sep 12
Cost of Deposits
Yield on InvestmentsCost of Funds
2.72
2.91 2.90 2.912.97
3.06 3.04
Mar 11 Jun 11 Sep 11 Dec 11 Mar 12 Jun 12 Sep 12
Yield on Assets
1.89
2.00 2.002.04
2.07 2.07
2.15
Mar 11 Jun 11 Sep 11 Dec 11 Mar 12 Jun 12 Sep 12
Cost of Funds
22
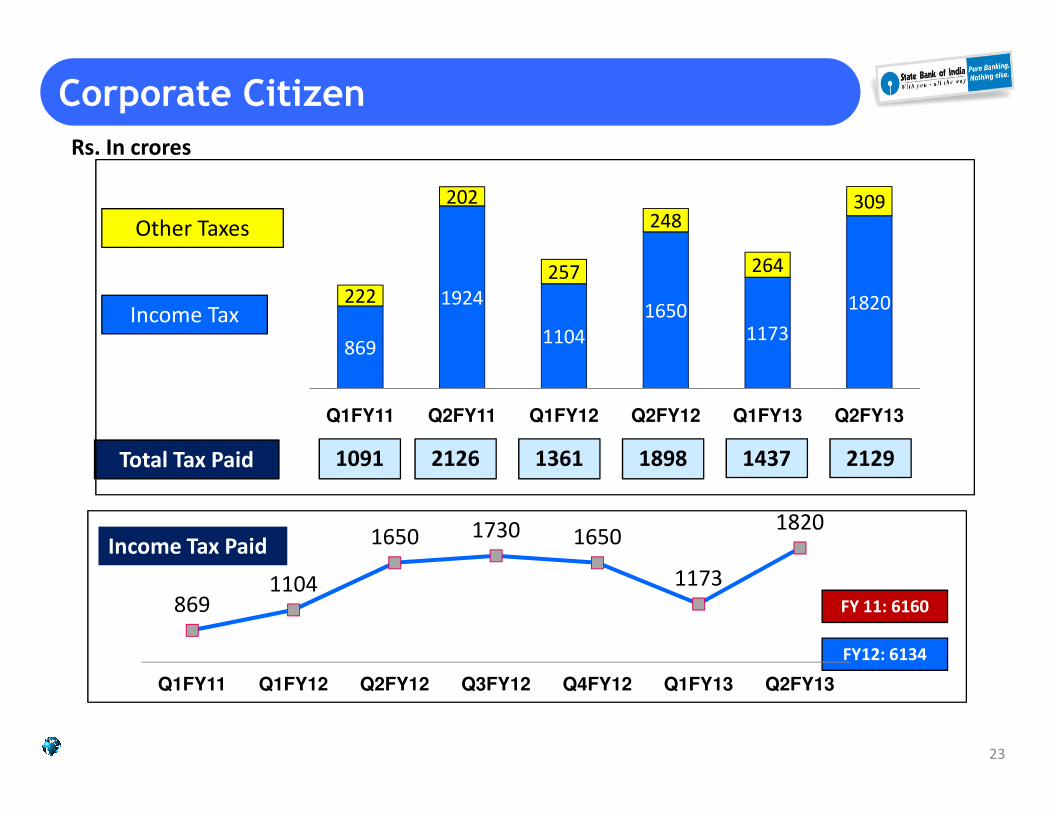
Rs. In crores
Corporate Citizen
869
1924
1104
16501173
1820222
202
257
248
264
309
Q1FY11 Q2FY11 Q1FY12 Q2FY12 Q1FY13 Q2FY13
Income Tax
Other Taxes
Q1FY11 Q2FY11 Q1FY12 Q2FY12 Q1FY13 Q2FY13
Total Tax Paid 1361 14371091
Income Tax Paid
FY 11: 6160
FY12: 6134
8691104
1650 1730 1650
1173
1820
Q1FY11 Q1FY12 Q2FY12 Q3FY12 Q4FY12 Q1FY13 Q2FY13
2126 1898
23
2129
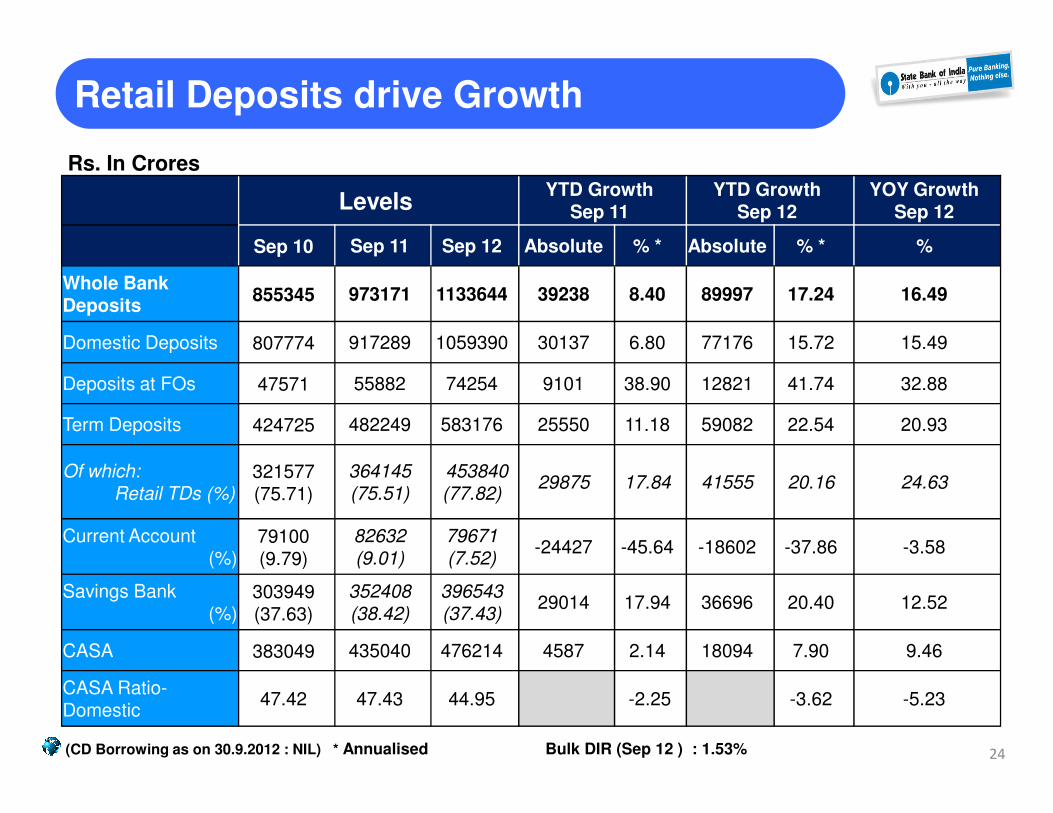
Rs. In Crores
Retail Deposits drive Growth
LevelsYTD Growth
Sep 11YTD Growth
Sep 12YOY Growth
Sep 12
Sep 10 Sep 11 Sep 12 Absolute % * Absolute % * %
Whole Bank Deposits
855345 973171 1133644 39238 8.40 89997 17.24 16.49
Domestic Deposits 807774 917289 1059390 30137 6.80 77176 15.72 15.49
Deposits at FOs 47571 55882 74254 9101 38.90 12821 41.74 32.88
Term Deposits 424725 482249 583176 25550 11.18 59082 22.54 20.93
Of which: Retail TDs (%)
321577(75.71)
364145(75.51)
453840 (77.82)
29875 17.84 41555 20.16 24.63
Current Account(%)
79100(9.79)
82632(9.01)
79671 (7.52)
-24427 -45.64 -18602 -37.86 -3.58
Savings Bank(%)
303949(37.63)
352408(38.42)
396543 (37.43)
29014 17.94 36696 20.40 12.52
CASA 383049 435040 476214 4587 2.14 18094 7.90 9.46
CASA Ratio-Domestic
47.42 47.43 44.95 -2.25 -3.62 -5.23
24(CD Borrowing as on 30.9.2012 : NIL) * Annualised Bulk DIR (Sep 12 ) : 1.53%
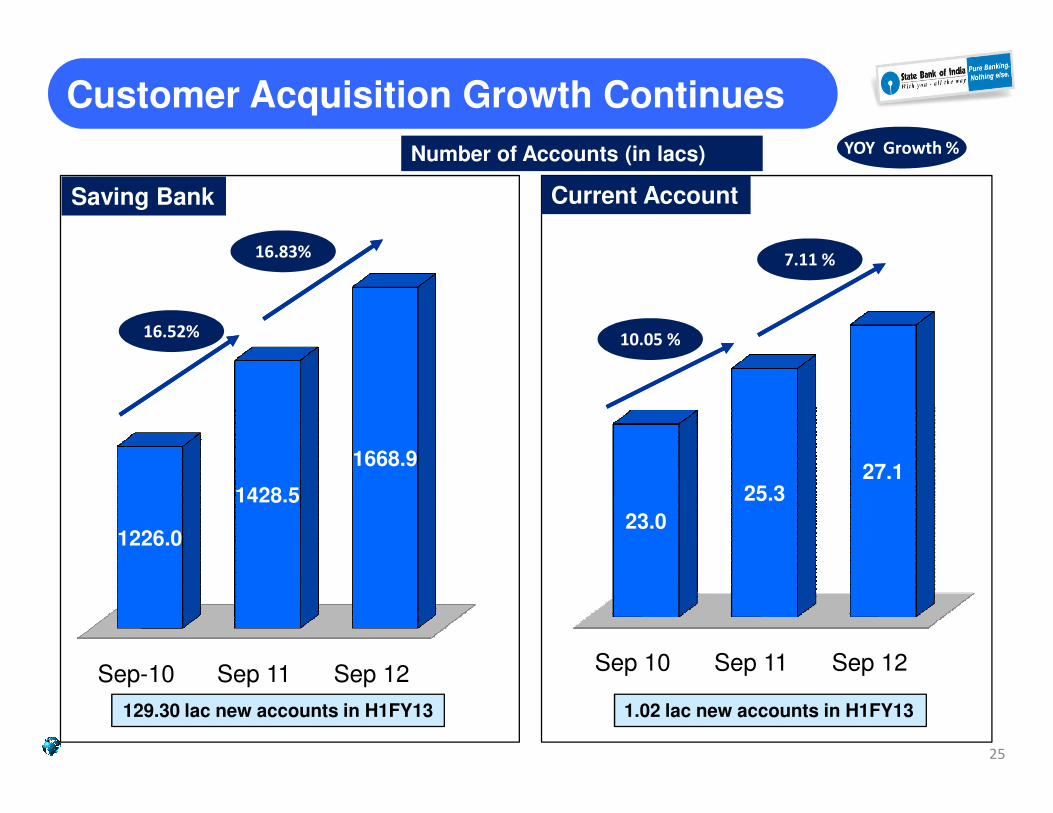
Saving Bank Current Account
Number of Accounts (in lacs)
Customer Acquisition Growth Continues
7.11 %16.83%
16.52% 10.05 %
YOY Growth %
Sep-10 Sep 11 Sep 12
1226.0
1428.5
1668.9
Sep 10 Sep 11 Sep 12
23.0
25.327.1
129.30 lac new accounts in H1FY13 1.02 lac new accounts in H1FY13
25
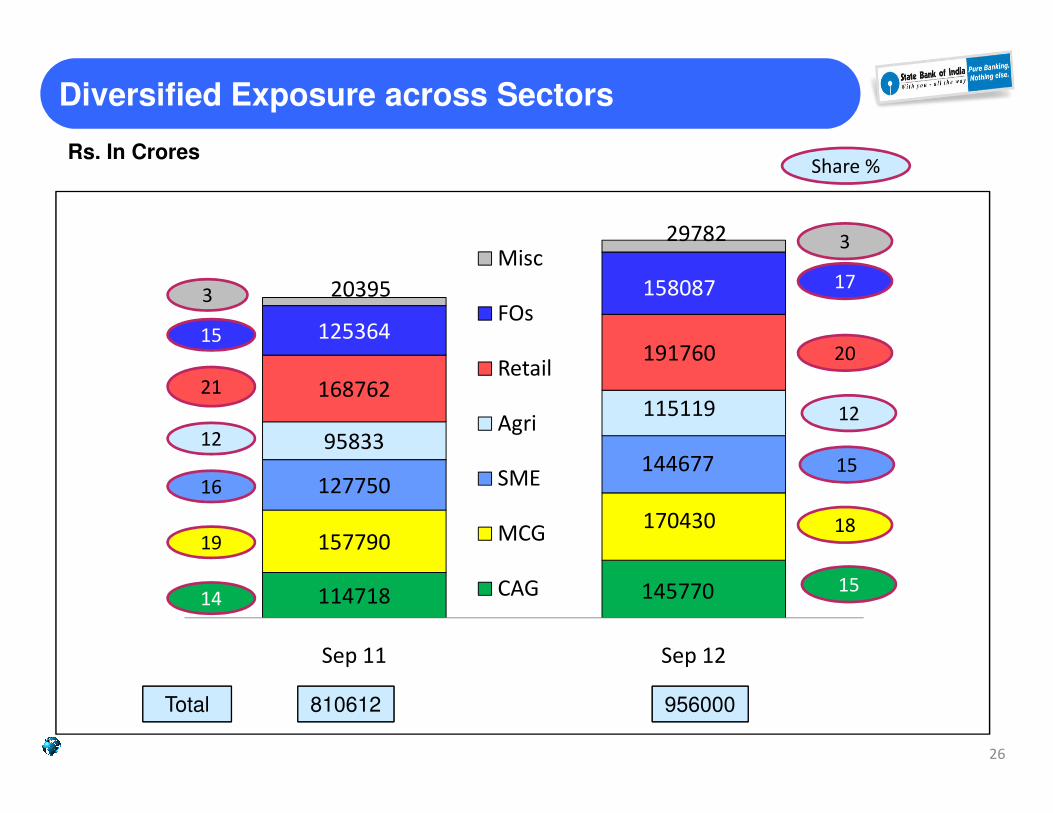
115119168762
191760125364
15808720395
29782Misc
FOs
Retail
Diversified Exposure across Sectors
15
21
17
12
20
Rs. In CroresShare %
3
3
114718 145770
157790170430
127750144677
95833
115119
Sep 11 Sep 12
Agri
SME
MCG
CAG14
19
12
16
15
18
12
15
810612Total 956000
26
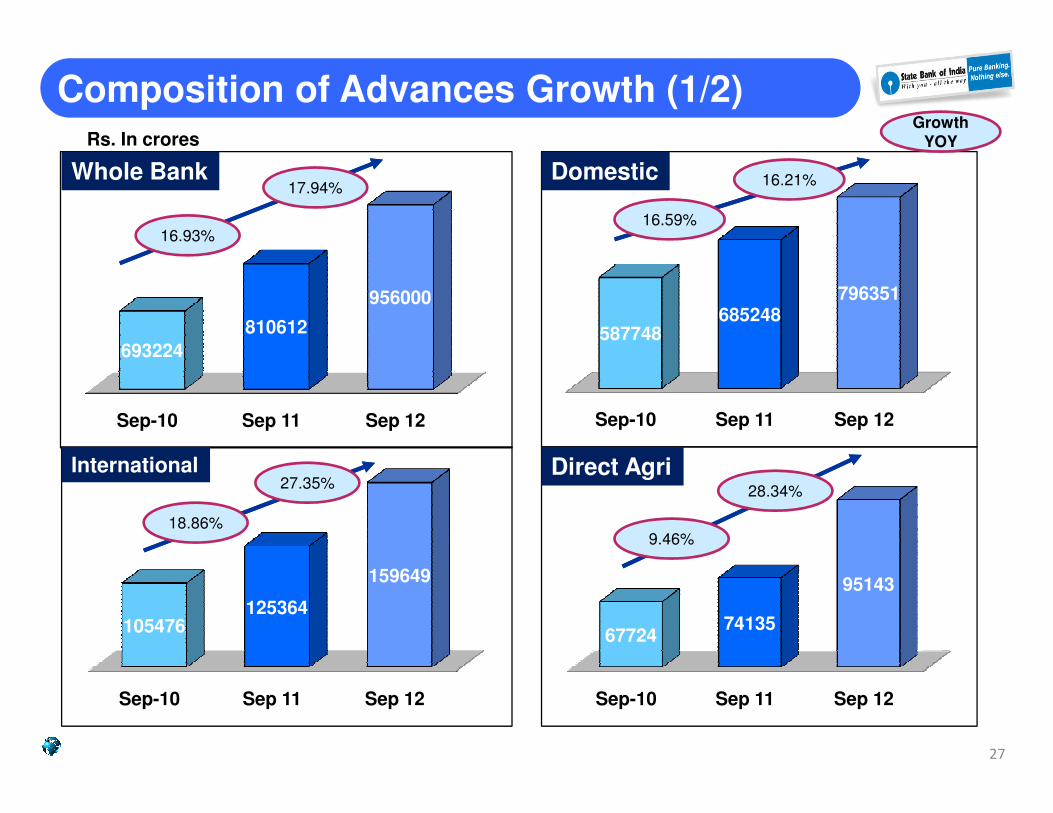
587748685248
796351
693224
810612
956000
Whole Bank Domestic
Composition of Advances Growth (1/2)
17.94%
Growth
YOYRs. In crores
16.21%
16.93%16.59%
Sep-10 Sep 11 Sep 12
Sep-10 Sep 11 Sep 12
6772474135
95143
Sep-10 Sep 11 Sep 12
105476125364
159649
Sep-10 Sep 11 Sep 12
Direct Agri28.34%
International27.35%
27
18.86%9.46%
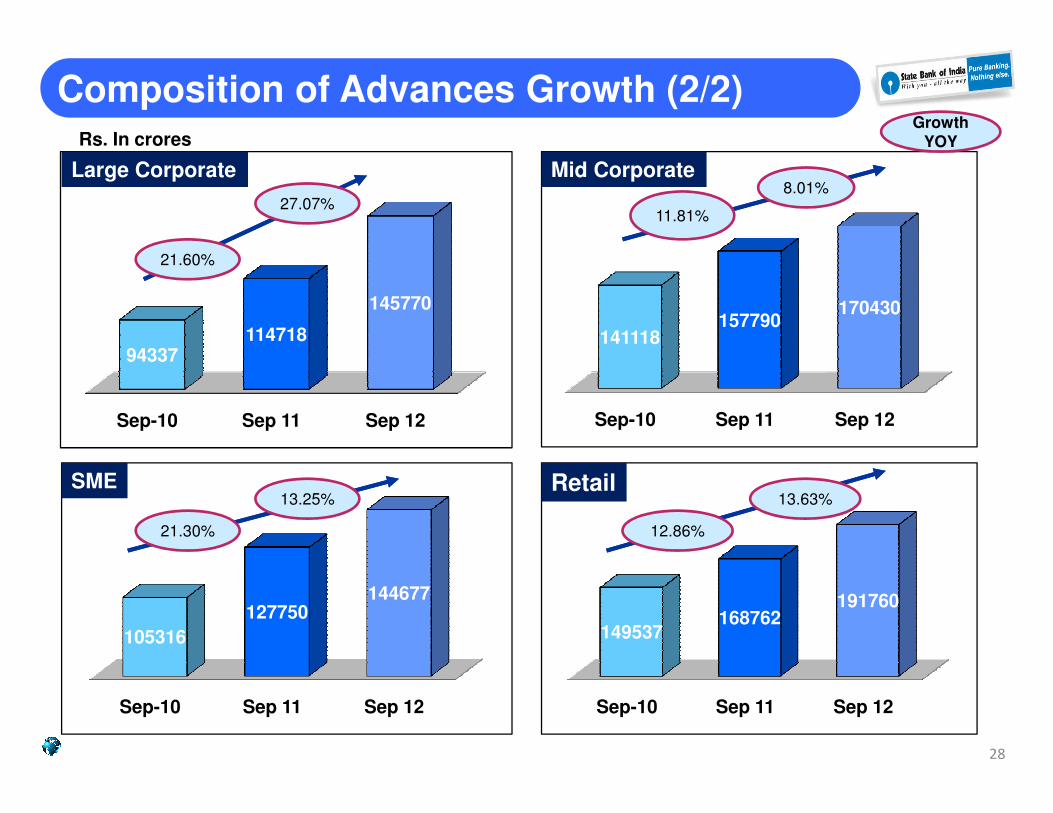
141118157790
170430
94337114718
145770
Large Corporate Mid Corporate
Composition of Advances Growth (2/2)
27.07%8.01%
Rs. In croresGrowth
YOY
21.60%
11.81%
Sep-10 Sep 11 Sep 12
149537168762
191760
Sep-10 Sep 11 Sep 12
105316
127750144677
Sep-10 Sep 11 Sep 12Sep-10 Sep 11 Sep 12
SME13.25%
Retail13.63%
28
21.30% 12.86%
Rs. In crores
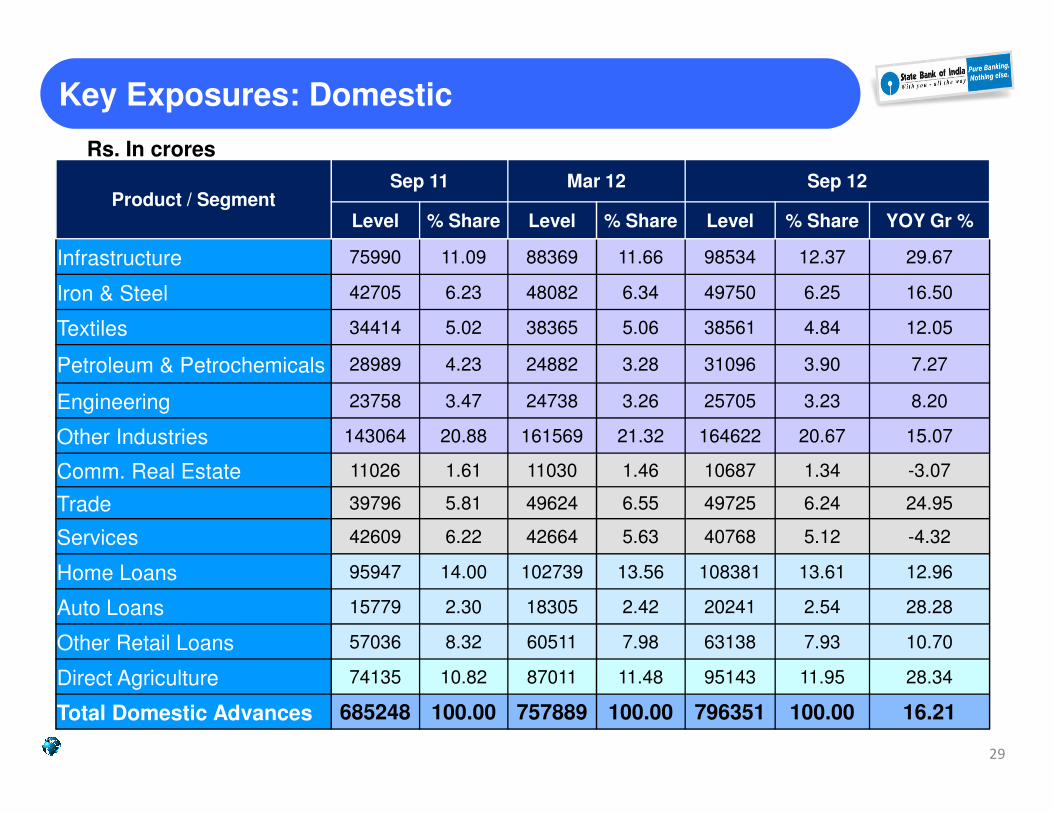
Key Exposures: Domestic
Product / SegmentSep 11 Mar 12 Sep 12
Level % Share Level % Share Level % Share YOY Gr %
Infrastructure 75990 11.09 88369 11.66 98534 12.37 29.67
Iron & Steel 42705 6.23 48082 6.34 49750 6.25 16.50
Textiles 34414 5.02 38365 5.06 38561 4.84 12.05
Petroleum & Petrochemicals 28989 4.23 24882 3.28 31096 3.90 7.27
Engineering 23758 3.47 24738 3.26 25705 3.23 8.20Engineering 23758 3.47 24738 3.26 25705 3.23 8.20
Other Industries 143064 20.88 161569 21.32 164622 20.67 15.07
Comm. Real Estate 11026 1.61 11030 1.46 10687 1.34 -3.07
Trade 39796 5.81 49624 6.55 49725 6.24 24.95
Services 42609 6.22 42664 5.63 40768 5.12 -4.32
Home Loans 95947 14.00 102739 13.56 108381 13.61 12.96
Auto Loans 15779 2.30 18305 2.42 20241 2.54 28.28
Other Retail Loans 57036 8.32 60511 7.98 63138 7.93 10.70
Direct Agriculture 74135 10.82 87011 11.48 95143 11.95 28.34
Total Domestic Advances 685248 100.00 757889 100.00 796351 100.00 16.21
29
Rs. In crores
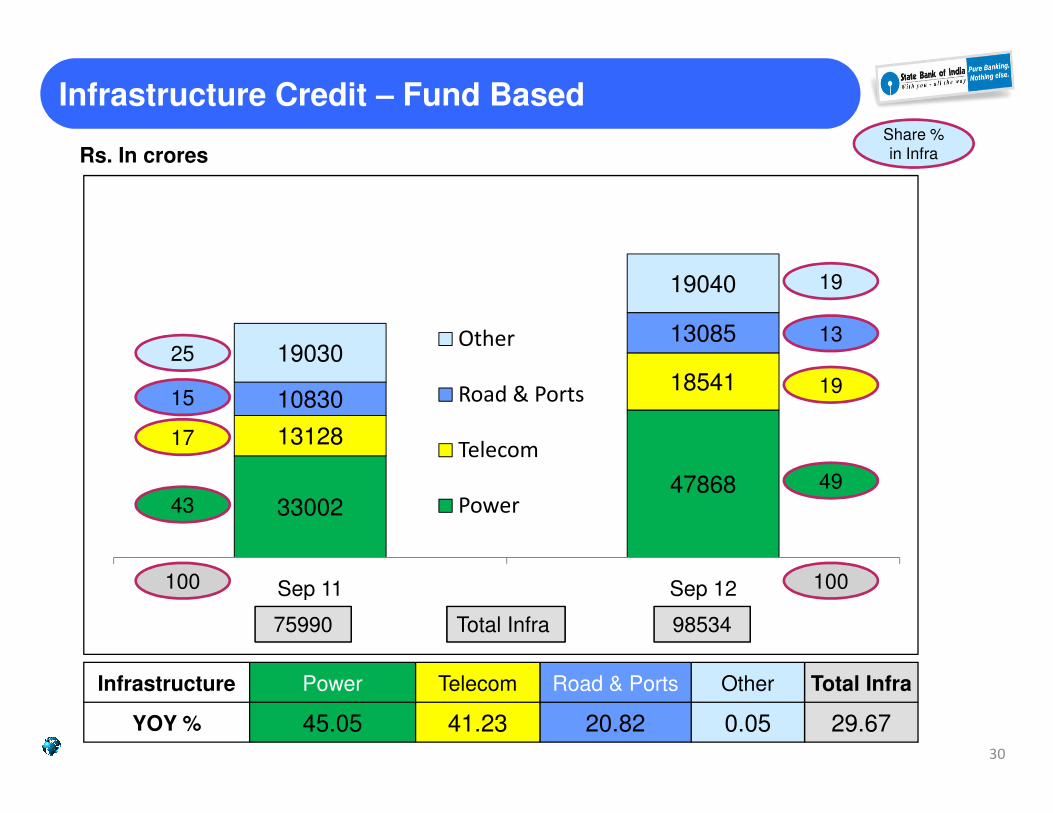
Infrastructure Credit – Fund Based
1854110830
1308519030
19040
Other
Road & Ports 19
13
19
15
25
Share %
in Infra
3300247868
13128
10830
Sep 11 Sep 12
Telecom
Power
Infrastructure Power Telecom Road & Ports Other Total Infra
YOY % 45.05 41.23 20.82 0.05 29.67
75990 Total Infra 98534
4943
17
15
30
100 100
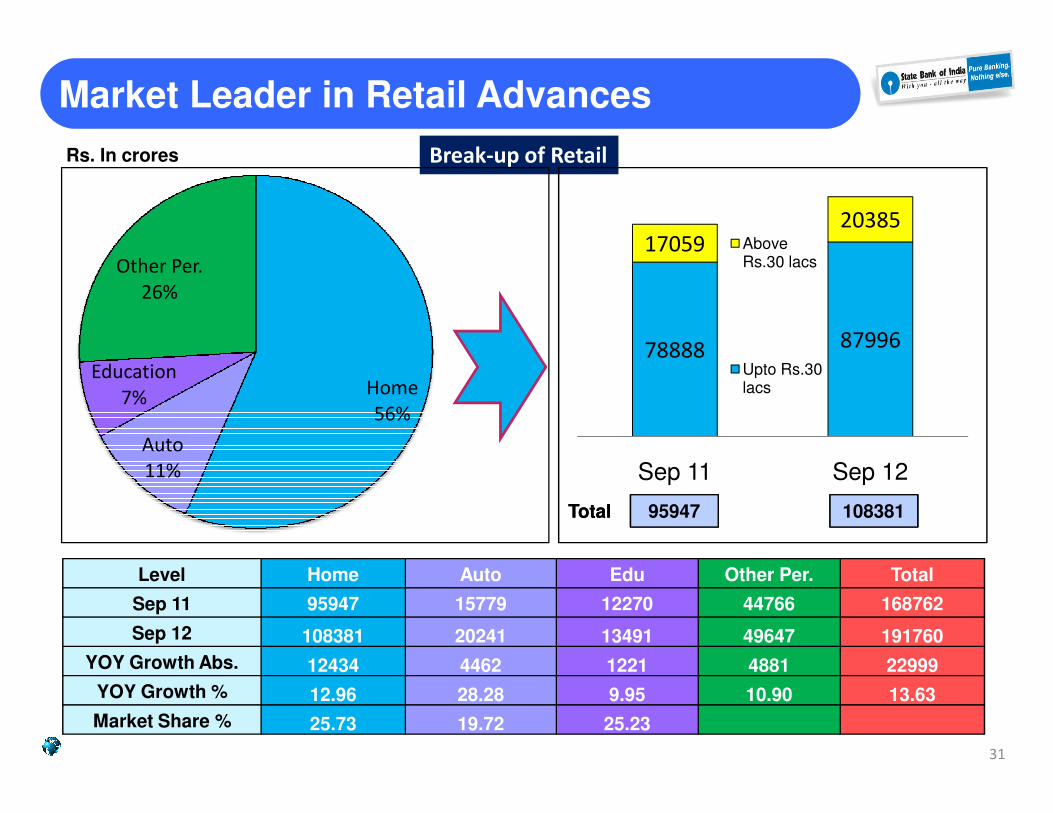
Break-up of Retail
Home
56%
Education
7%
Other Per.
26%
Market Leader in Retail Advances
78888 87996
1705920385
Above Rs.30 lacs
Upto Rs.30 lacs
Rs. In crores
56%
Auto
11%
7%
Level Home Auto Edu Other Per. Total
Sep 11 95947 15779 12270 44766 168762
Sep 12 108381 20241 13491 49647 191760
YOY Growth Abs. 12434 4462 1221 4881 22999
YOY Growth % 12.96 28.28 9.95 10.90 13.63
Market Share % 25.73 19.72 25.23
Sep 11 Sep 12
108381 108381 95947 TotalTotal
31
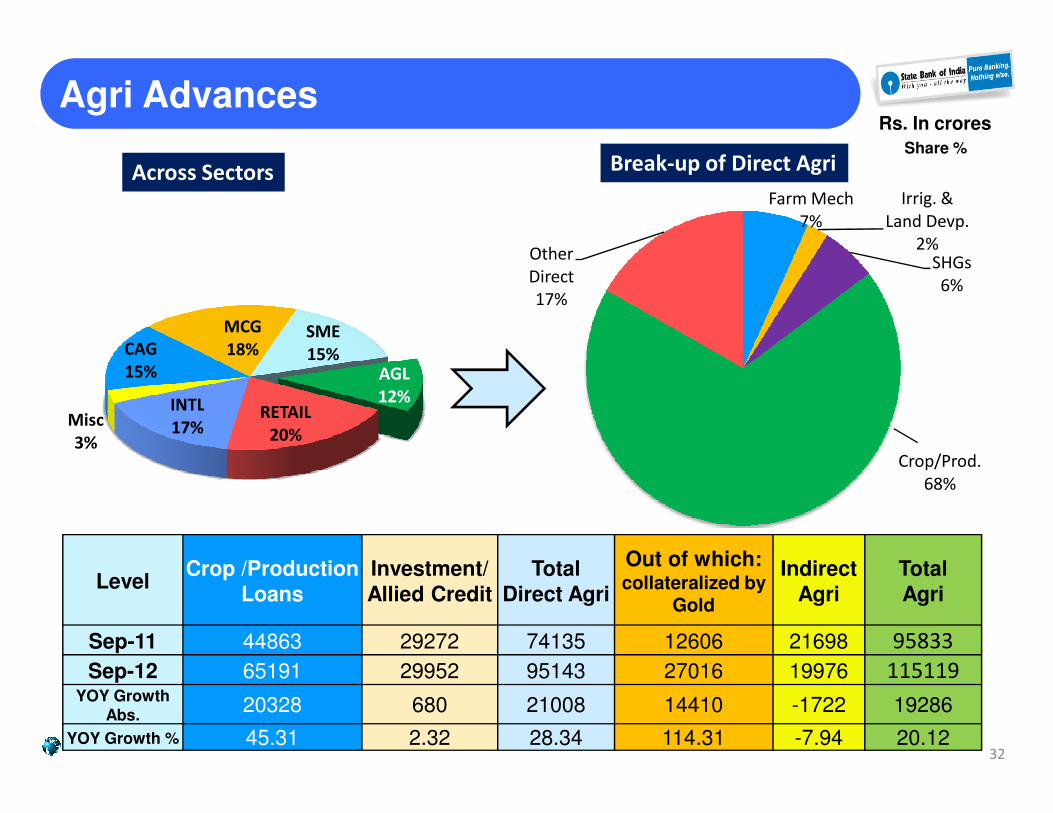
Break-up of Direct AgriAcross Sectors
CAG
15%
MCG
18%SME
15%AGL
12%RETAILINTL
Agri Advances
Farm Mech
7%
Irrig. &
Land Devp.
2%SHGs
6%
Other
Direct
17%
Share %
Rs. In crores
RETAIL
20%
INTL
17%Misc
3%
LevelCrop /Production
Loans
Investment/
Allied Credit
Total
Direct Agri
Out of which: collateralized by
Gold
Indirect
Agri
Total
Agri
Sep-11 44863 29272 74135 12606 21698 95833
Sep-12 65191 29952 95143 27016 19976 115119YOY Growth
Abs.20328 680 21008 14410 -1722 19286
YOY Growth % 45.31 2.32 28.34 114.31 -7.94 20.12
Crop/Prod.
68%
32
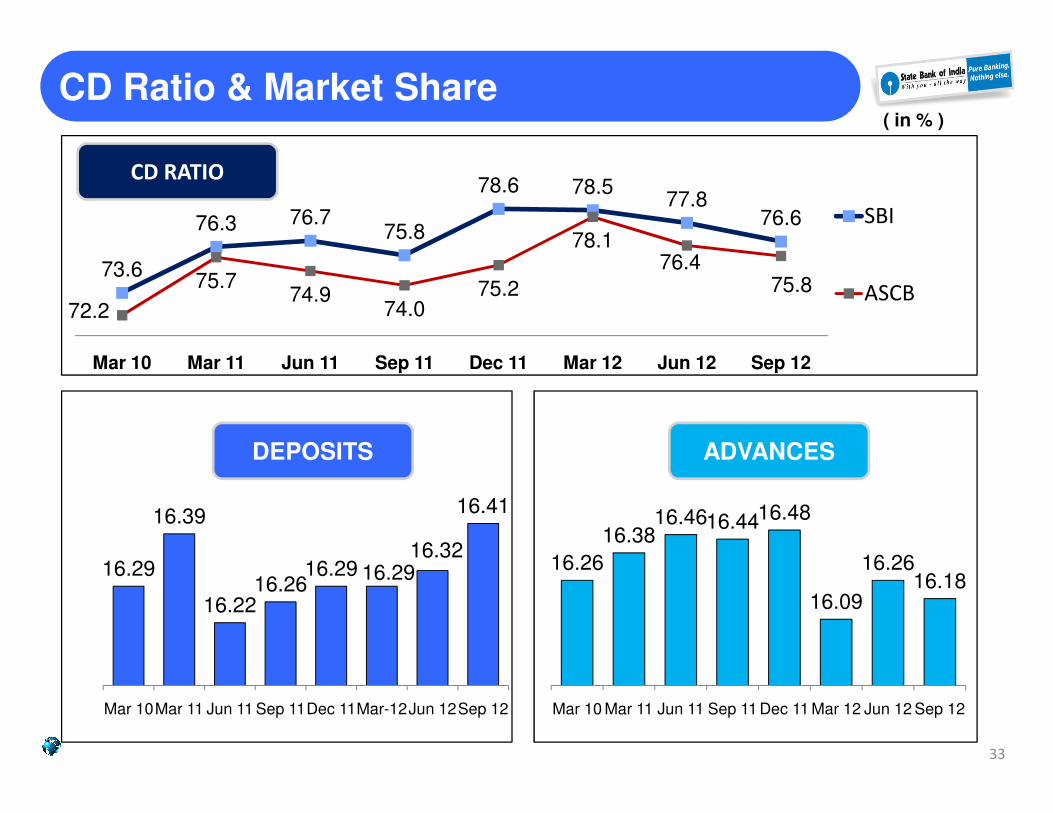
73.6
76.3 76.775.8
78.6 78.577.8
76.6
72.2
75.774.9
74.075.2
78.176.4
75.8
Mar 10 Mar 11 Jun 11 Sep 11 Dec 11 Mar 12 Jun 12 Sep 12
SBI
ASCB
CD RATIO
CD Ratio & Market Share ( in % )
16.29
16.39
16.2216.26
16.29 16.2916.32
16.41
Mar 10Mar 11 Jun 11 Sep 11Dec 11Mar-12Jun 12Sep 12
16.26
16.3816.4616.4416.48
16.09
16.2616.18
Mar 10 Mar 11 Jun 11 Sep 11 Dec 11 Mar 12 Jun 12 Sep 12
DEPOSITS ADVANCES
33
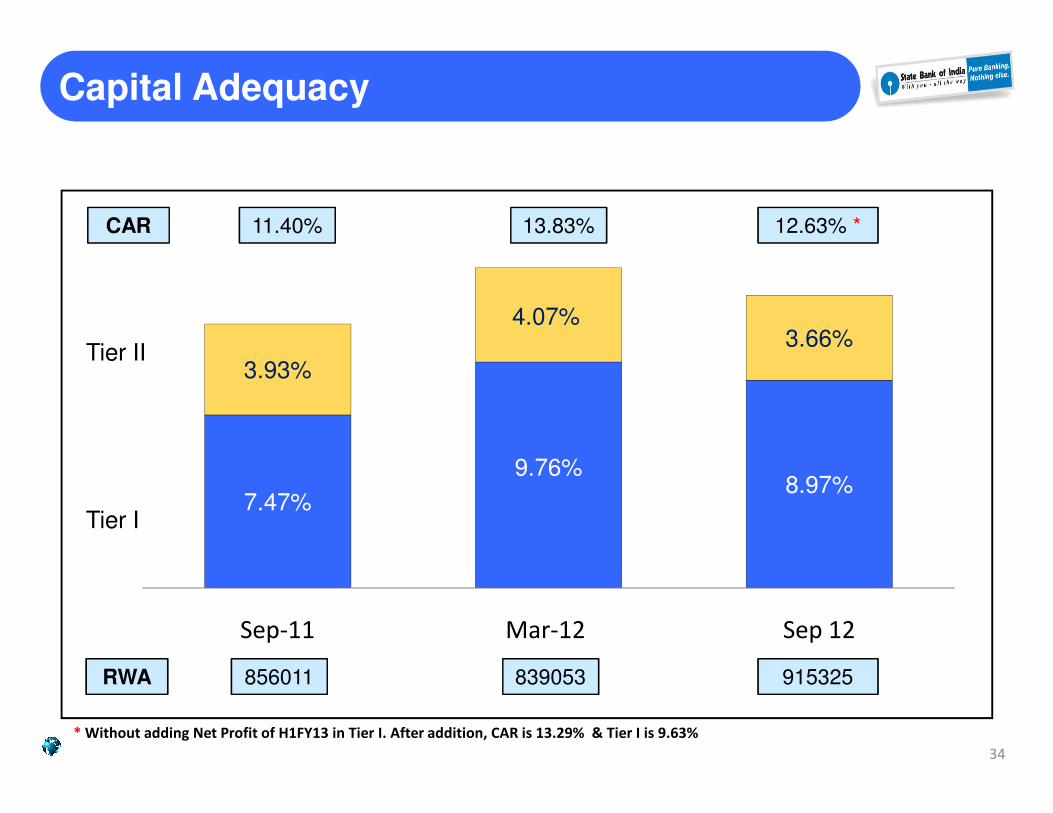
3.93%
4.07%3.66%
Capital Adequacy
Tier II
CAR 11.40% 13.83% 12.63% *
7.47%
9.76%8.97%
Sep-11 Mar-12 Sep 12
Tier I
* Without adding Net Profit of H1FY13 in Tier I. After addition, CAR is 13.29% & Tier I is 9.63%
34
RWA 856011 839053 915325
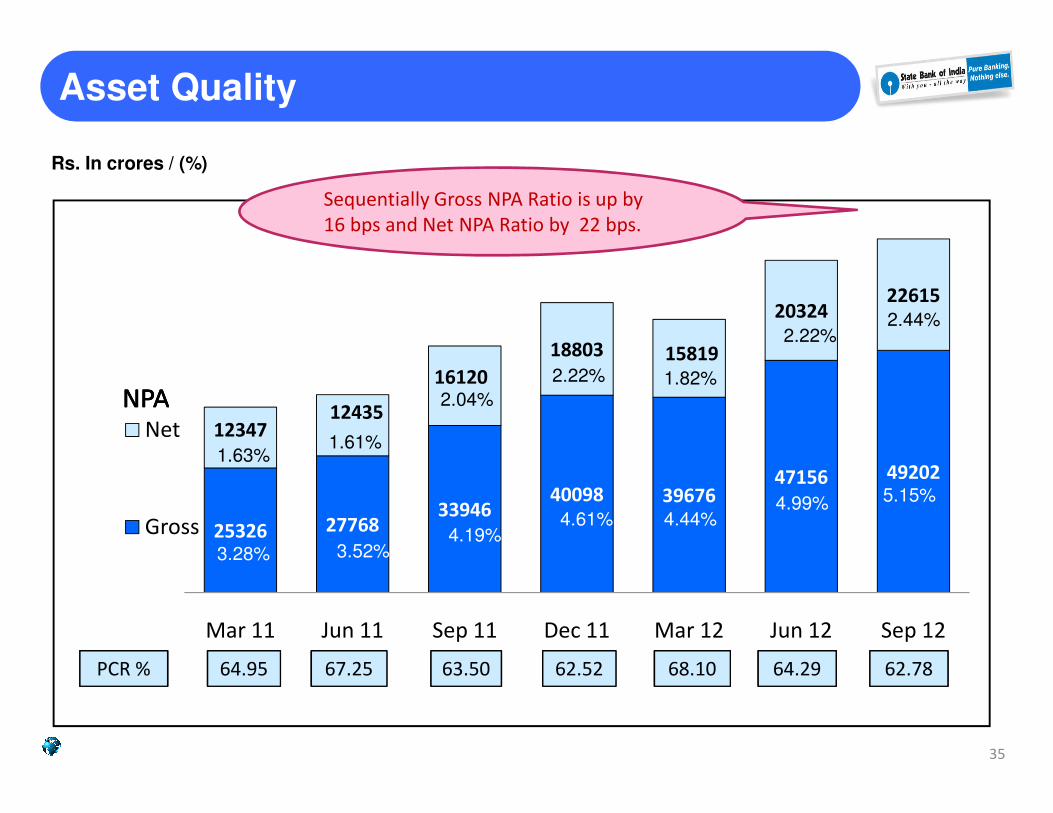
Rs. In crores / (%)
Asset Quality
12435
16120
18803 15819
2032422615
2.22%
NPANPANPANPA 2.04%
Sequentially Gross NPA Ratio is up by
16 bps and Net NPA Ratio by 22 bps.
1.82%
2.22%2.44%
25326 2776833946
40098 3967647156 49202
1234712435
Mar 11 Jun 11 Sep 11 Dec 11 Mar 12 Jun 12 Sep 12
Net
Gross3.28% 3.52%
4.61%
1.63%1.61%
NPANPANPANPA
4.19%
2.04%
64.29PCR % 64.95 67.25 63.50 62.52 68.10
4.44%4.99%
35
62.78
5.15%
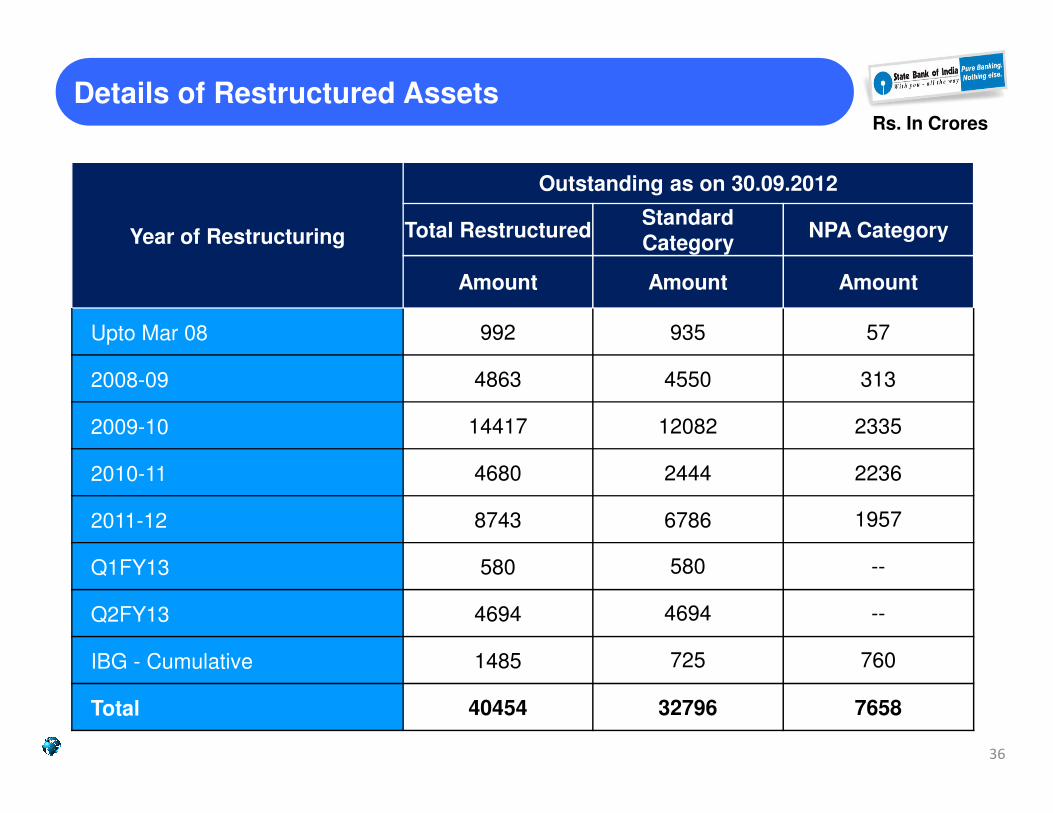
Year of Restructuring
Outstanding as on 30.09.2012
Total RestructuredStandard
CategoryNPA Category
Amount Amount Amount
Upto Mar 08 992 935 57
2008-09 4863 4550 313
Details of Restructured Assets Rs. In Crores
2009-10 14417 12082 2335
2010-11 4680 2444 2236
2011-12 8743 6786 1957
Q1FY13 580 580 --
Q2FY13 4694 4694 --
IBG - Cumulative 1485 725 760
Total 40454 32796 7658
36
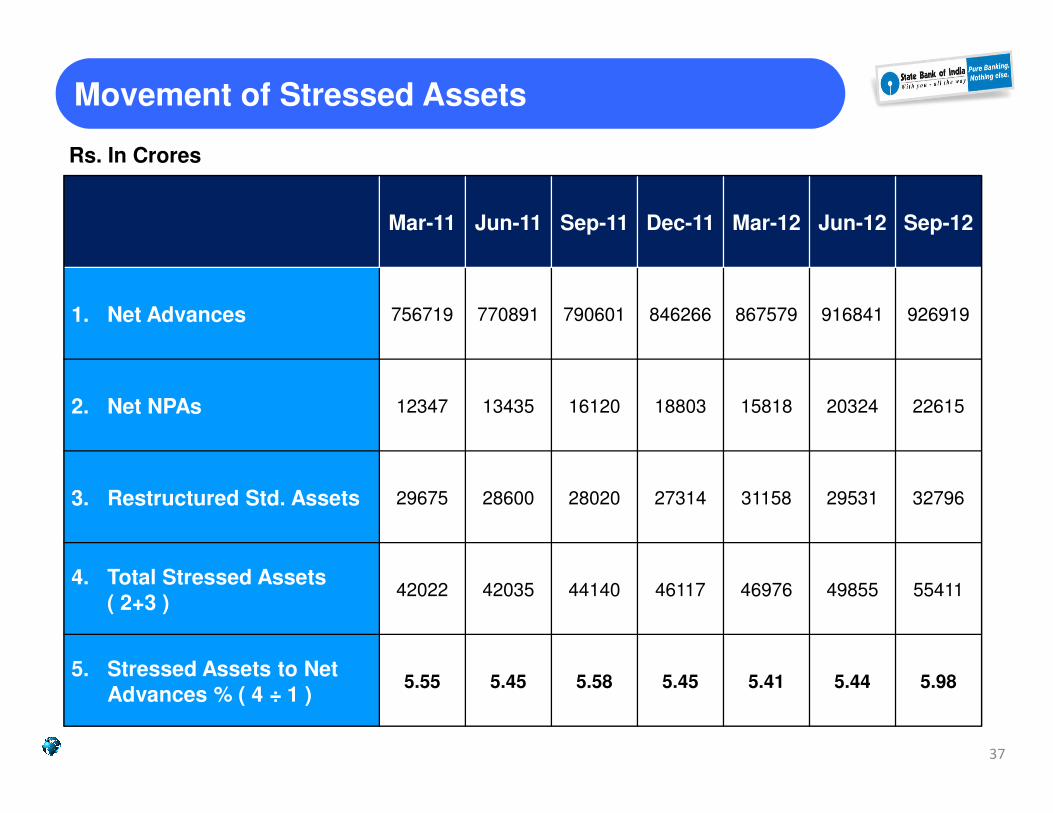
Movement of Stressed Assets
Rs. In Crores
Mar-11 Jun-11 Sep-11 Dec-11 Mar-12 Jun-12 Sep-12
1. Net Advances 756719 770891 790601 846266 867579 916841 926919
2. Net NPAs 12347 13435 16120 18803 15818 20324 22615
37
2. Net NPAs 12347 13435 16120 18803 15818 20324 22615
3. Restructured Std. Assets 29675 28600 28020 27314 31158 29531 32796
4. Total Stressed Assets
( 2+3 )42022 42035 44140 46117 46976 49855 55411
5. Stressed Assets to Net
Advances % ( 4 ÷ 1 ) 5.55 5.45 5.58 5.45 5.41 5.44 5.98
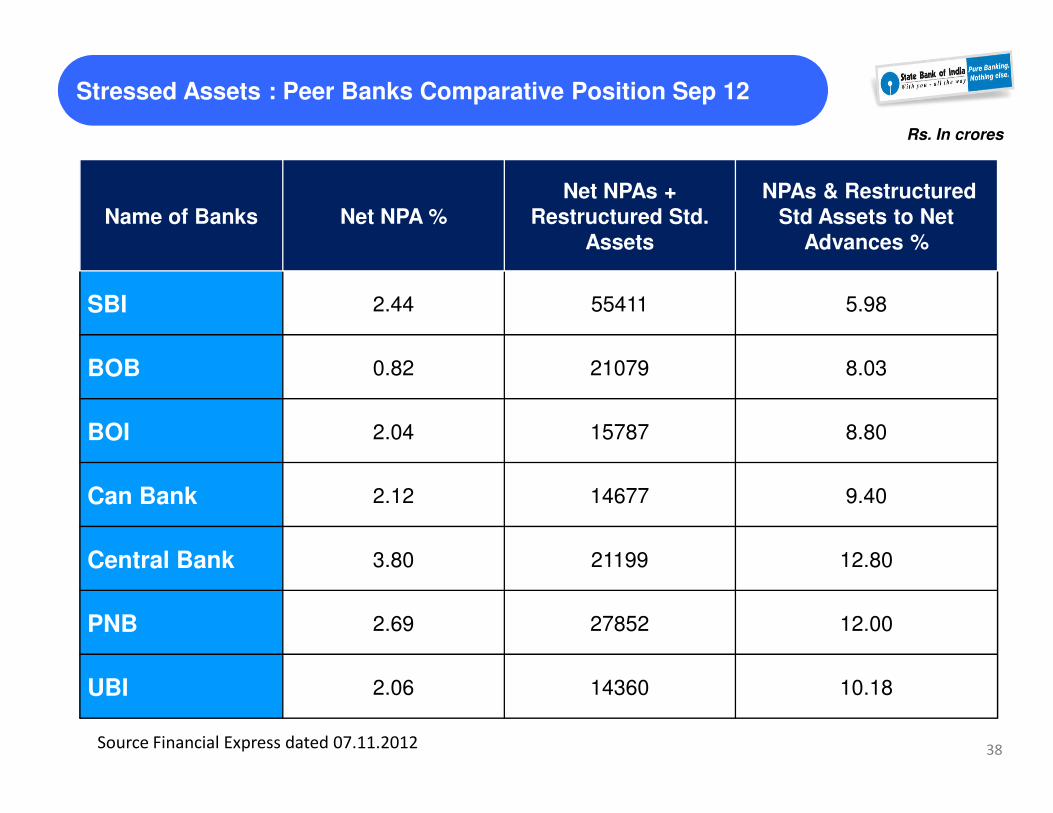
Rs. In crores
Stressed Assets : Peer Banks Comparative Position Sep 12
Name of Banks Net NPA %
Net NPAs +
Restructured Std.
Assets
NPAs & Restructured
Std Assets to Net
Advances %
SBI 2.44 55411 5.98
BOB 0.82 21079 8.03
38
BOI 2.04 15787 8.80
Can Bank 2.12 14677 9.40
Central Bank 3.80 21199 12.80
PNB 2.69 27852 12.00
UBI 2.06 14360 10.18
Source Financial Express dated 07.11.2012
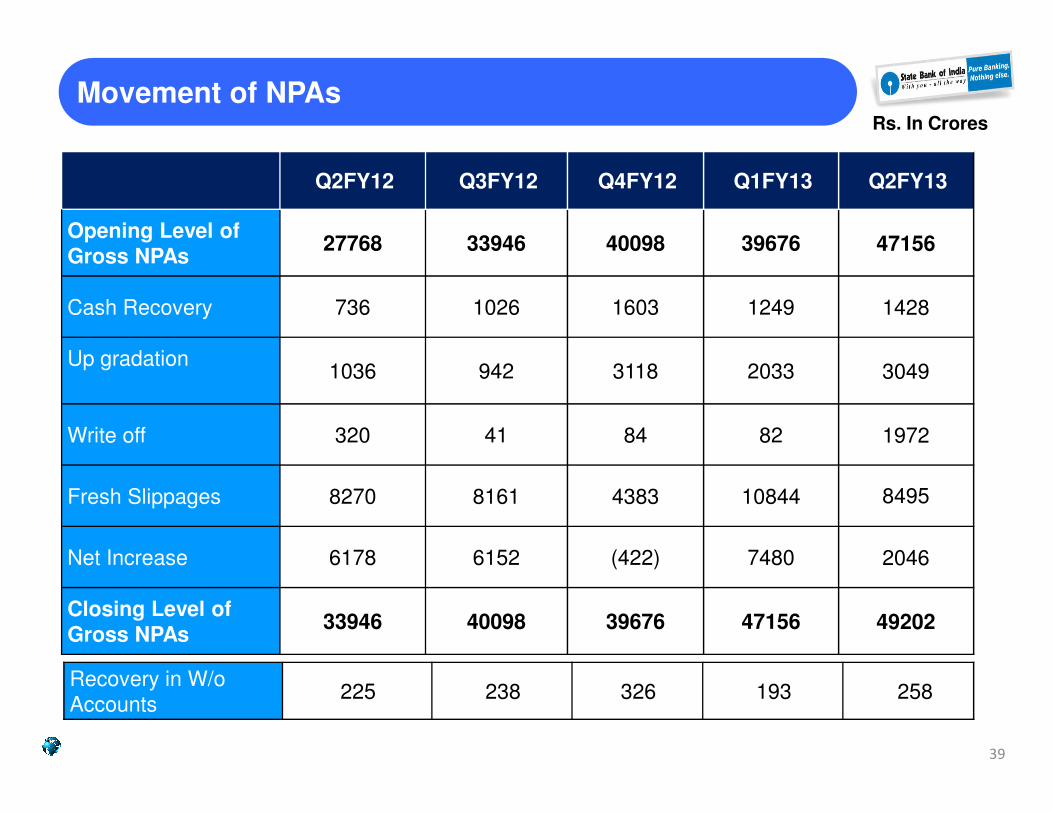
Q2FY12 Q3FY12 Q4FY12 Q1FY13 Q2FY13
Opening Level of
Gross NPAs27768 33946 40098 39676 47156
Cash Recovery 736 1026 1603 1249 1428
Up gradation1036 942 3118 2033 3049
Movement of NPAs Rs. In Crores
Write off 320 41 84 82 1972
Fresh Slippages 8270 8161 4383 10844 8495
Net Increase 6178 6152 (422) 7480 2046
Closing Level of
Gross NPAs33946 40098 39676 47156 49202
Recovery in W/o
Accounts225 238 326 193 258
39
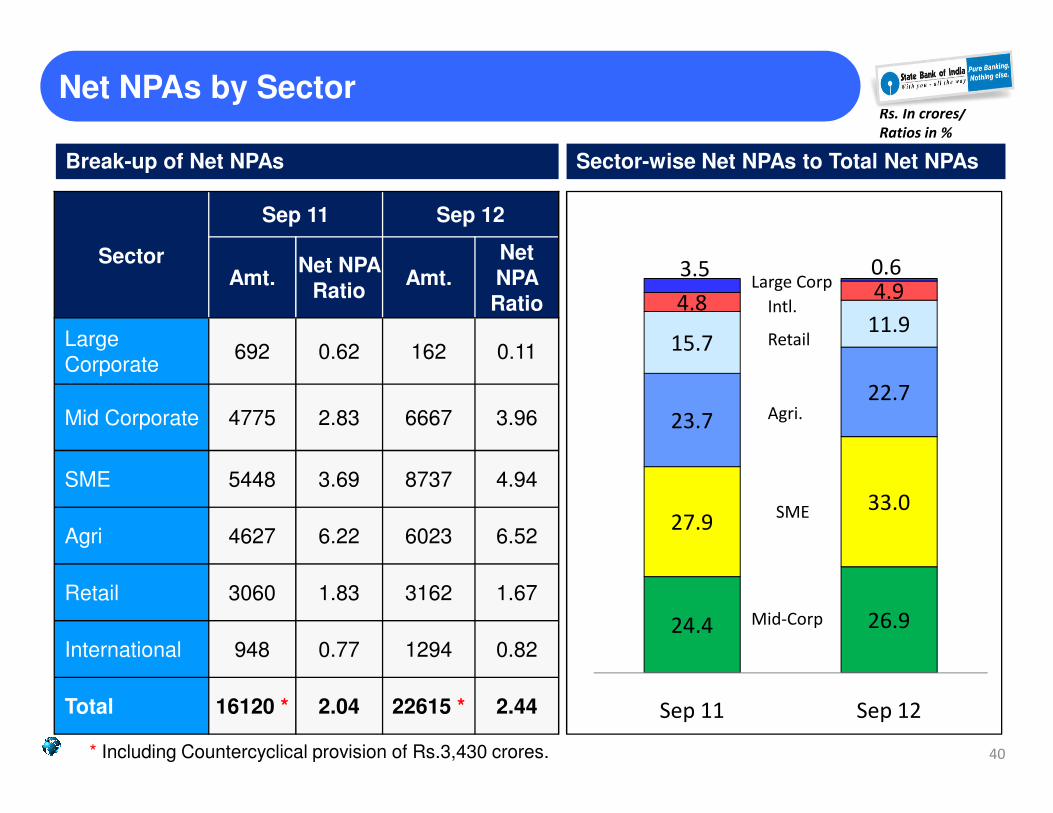
Break-up of Net NPAs
Rs. In crores/
Ratios in %
Net NPAs by Sector
Sector
Sep 11 Sep 12
Amt.Net NPA
RatioAmt.
Net
NPA
Ratio
Large
Corporate692 0.62 162 0.11
Mid Corporate 4775 2.83 6667 3.96 23.7
22.7
15.711.9
4.84.9
3.5 0.6
Intl.
Agri.
Retail
Large Corp
Sector-wise Net NPAs to Total Net NPAs
Mid Corporate 4775 2.83 6667 3.96
SME 5448 3.69 8737 4.94
Agri 4627 6.22 6023 6.52
Retail 3060 1.83 3162 1.67
International 948 0.77 1294 0.82
Total 16120 * 2.04 22615 * 2.44
40* Including Countercyclical provision of Rs.3,430 crores.
24.4 26.9
27.933.0
23.7
Sep 11 Sep 12
Agri.
SME
Mid-Corp
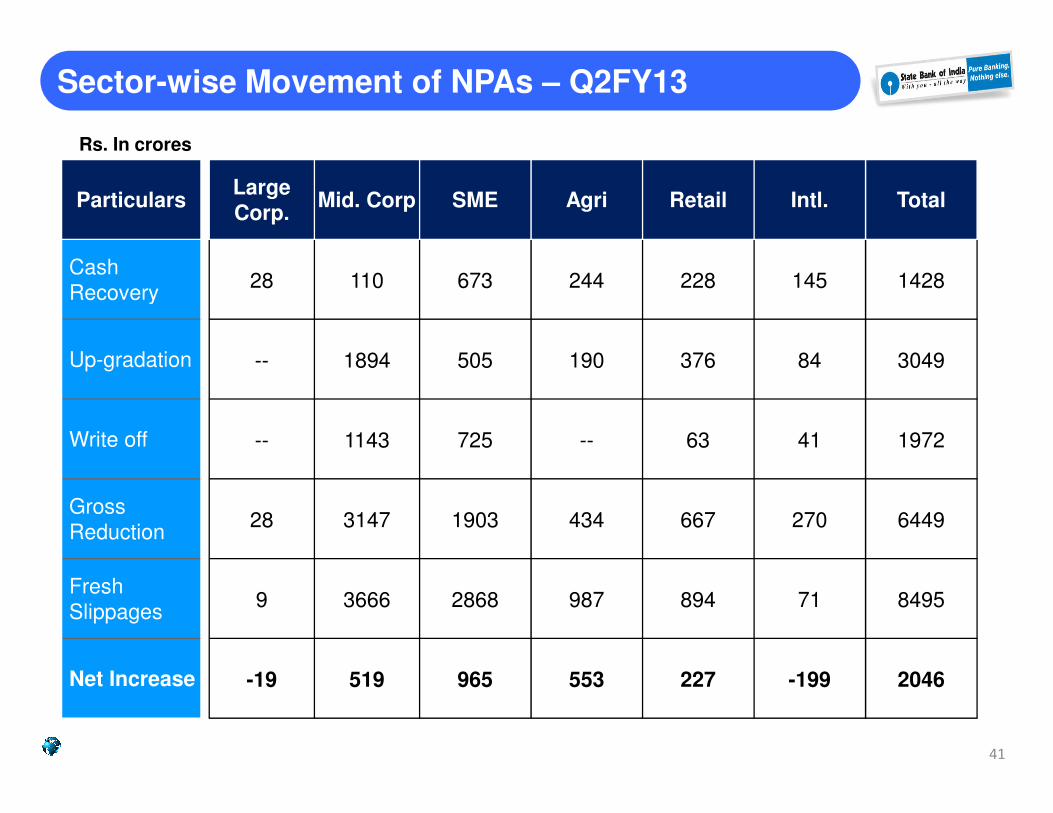
Particulars
Cash
Recovery
Up-gradation
Large
Corp.Mid. Corp SME Agri Retail Intl. Total
28 110 673 244 228 145 1428
-- 1894 505 190 376 84 3049
Sector-wise Movement of NPAs – Q2FY13
Rs. In crores
Write off
Gross
Reduction
Fresh
Slippages
Net Increase
-- 1143 725 -- 63 41 1972
28 3147 1903 434 667 270 6449
9 3666 2868 987 894 71 8495
-19 519 965 553 227 -199 2046
41
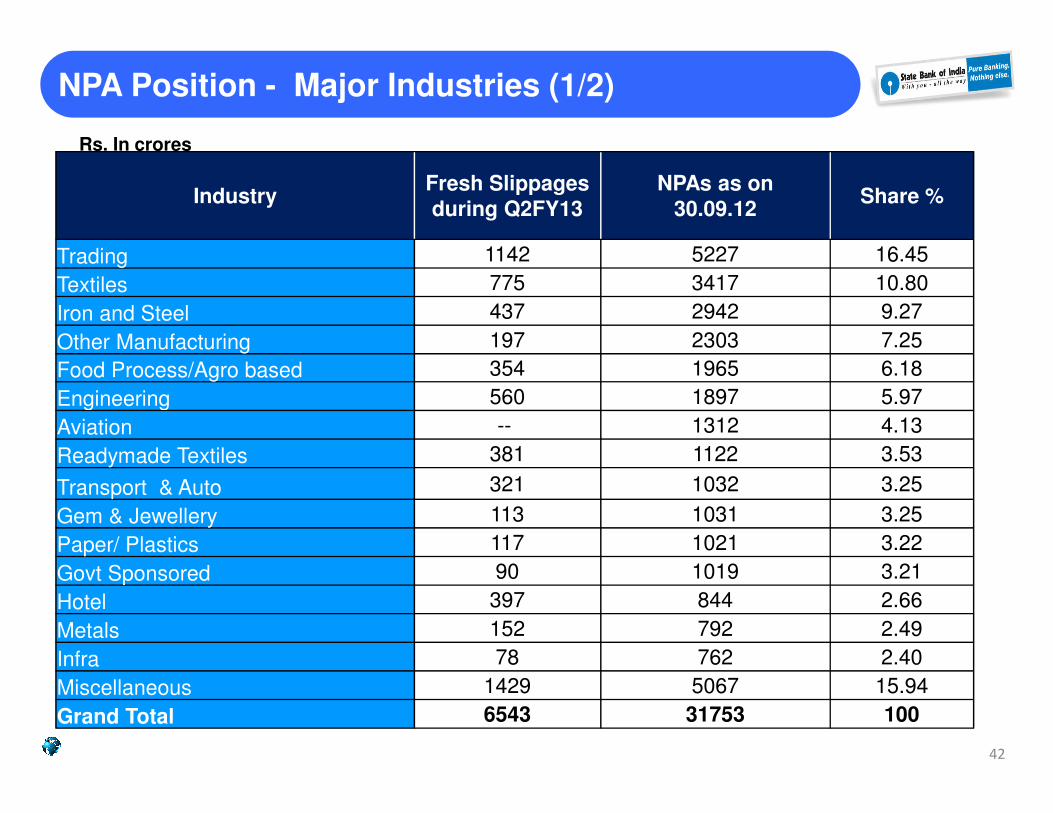
NPA Position - Major Industries (1/2)
Rs. In crores
IndustryFresh Slippages
during Q2FY13
NPAs as on
30.09.12 Share %
Trading 1142 5227 16.45
Textiles 775 3417 10.80
Iron and Steel 437 2942 9.27
Other Manufacturing 197 2303 7.25
Food Process/Agro based 354 1965 6.18
Engineering 560 1897 5.97Engineering 560 1897 5.97
Aviation -- 1312 4.13
Readymade Textiles 381 1122 3.53
Transport & Auto 321 1032 3.25
Gem & Jewellery 113 1031 3.25
Paper/ Plastics 117 1021 3.22
Govt Sponsored 90 1019 3.21
Hotel 397 844 2.66
Metals 152 792 2.49
Infra 78 762 2.40
Miscellaneous 1429 5067 15.94
Grand Total 6543 31753 100
42
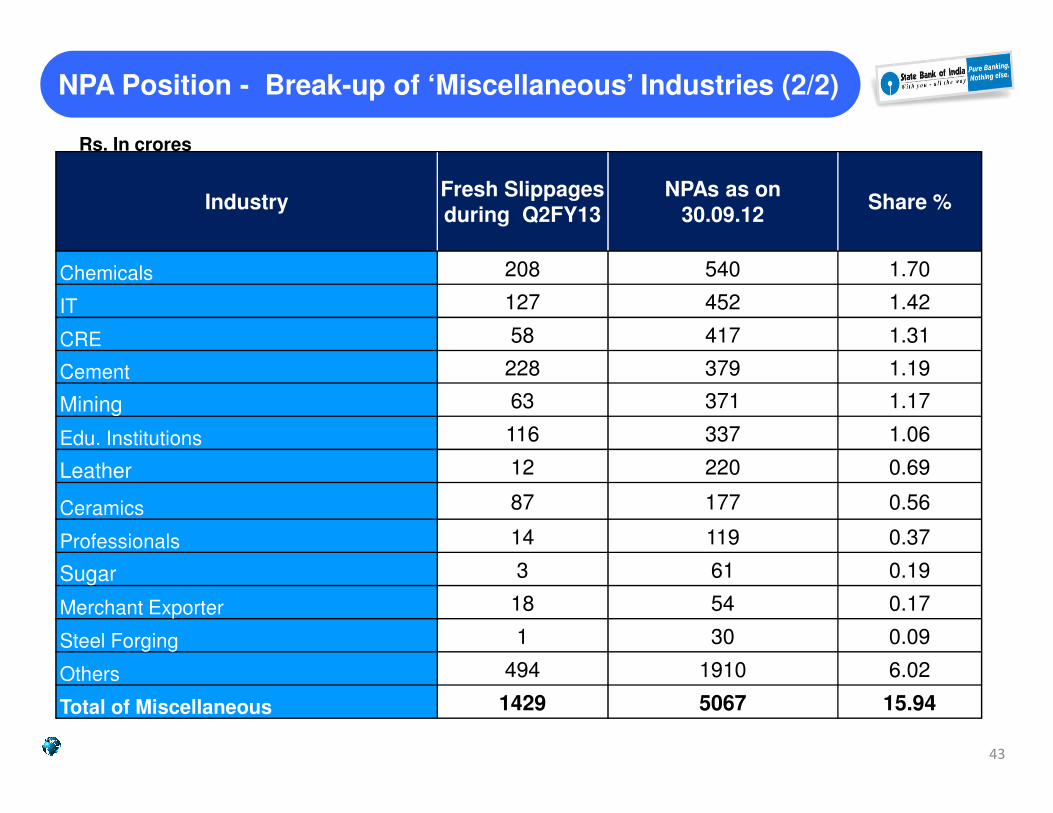
NPA Position - Break-up of ‘Miscellaneous’ Industries (2/2)
Rs. In crores
IndustryFresh Slippages
during Q2FY13
NPAs as on
30.09.12 Share %
Chemicals 208 540 1.70
IT 127 452 1.42
CRE 58 417 1.31
Cement 228 379 1.19
Mining 63 371 1.17Mining 63 371 1.17
Edu. Institutions 116 337 1.06
Leather 12 220 0.69
Ceramics 87 177 0.56
Professionals 14 119 0.37
Sugar 3 61 0.19
Merchant Exporter 18 54 0.17
Steel Forging 1 30 0.09
Others 494 1910 6.02
Total of Miscellaneous 1429 5067 15.94
43
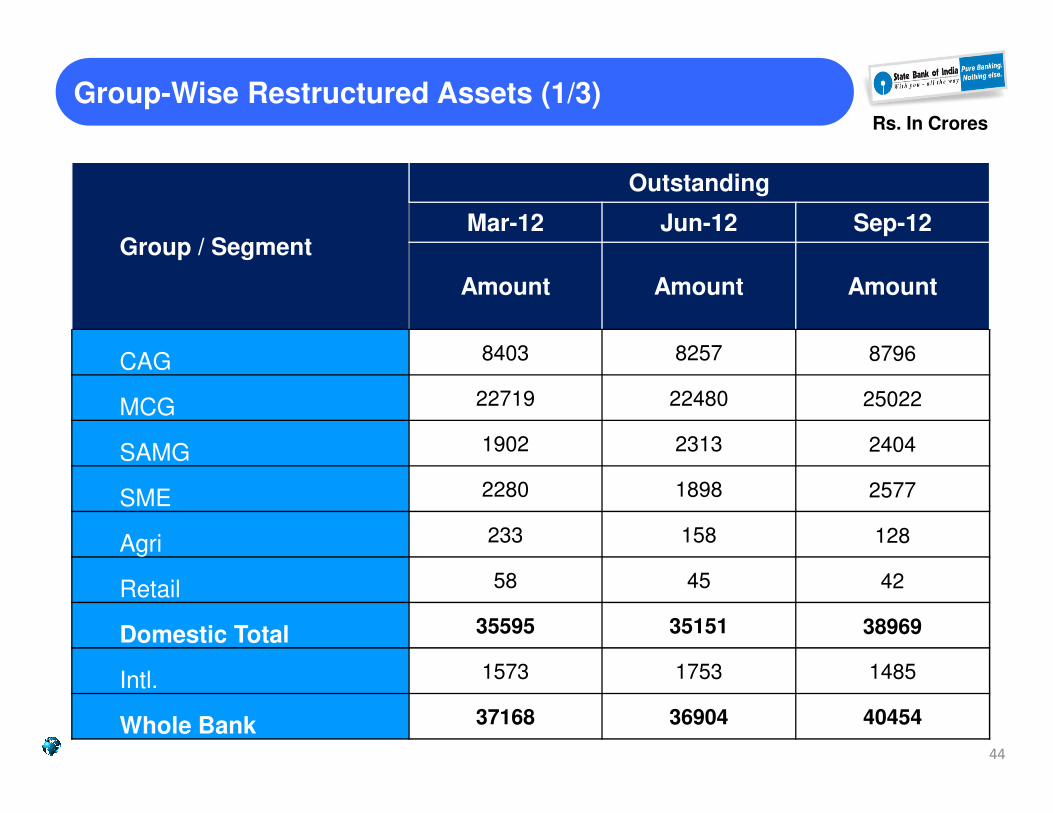
Group / Segment
Outstanding
Mar-12 Jun-12 Sep-12
Amount Amount Amount
CAG 8403 8257 8796
MCG 22719 22480 25022
Group-Wise Restructured Assets (1/3)Rs. In Crores
MCG 22719 22480 25022
SAMG 1902 2313 2404
SME 2280 1898 2577
Agri 233 158 128
Retail 58 45 42
Domestic Total 35595 35151 38969
Intl. 1573 1753 1485
Whole Bank 37168 36904 40454
44
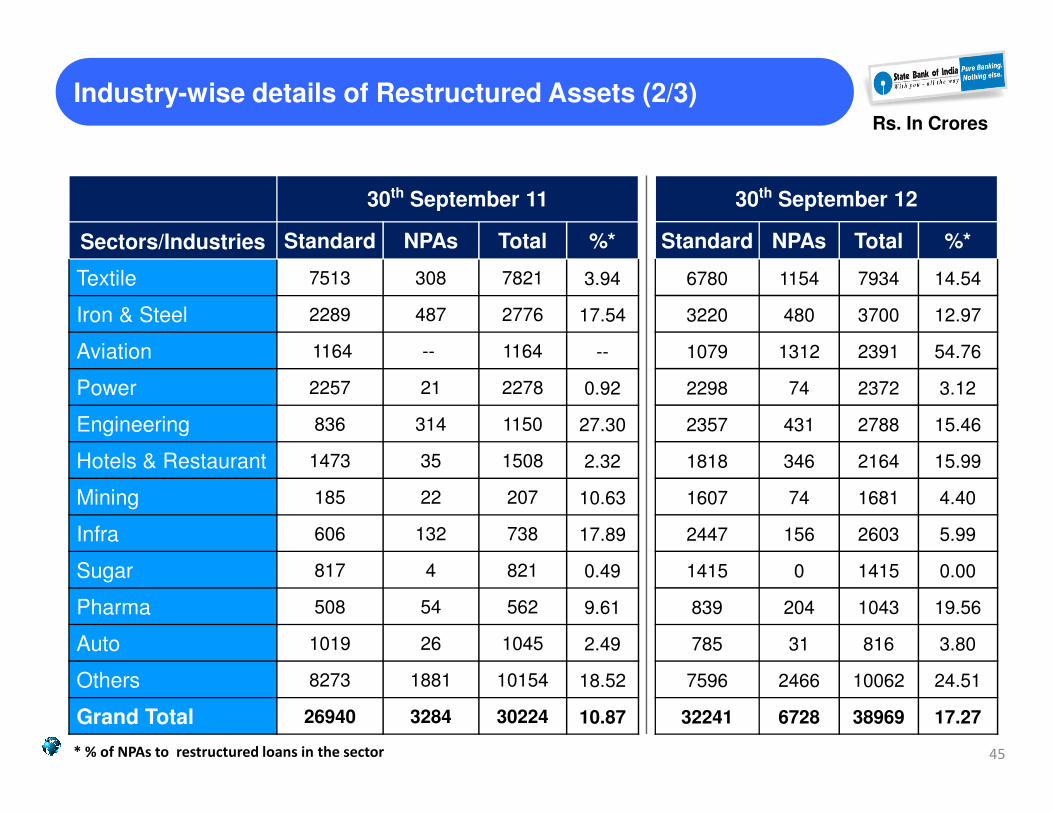
30th September 11
Sectors/Industries Standard NPAs Total %*
Textile 7513 308 7821 3.94
Iron & Steel 2289 487 2776 17.54
Aviation 1164 -- 1164 --
Power 2257 21 2278 0.92
30th September 12
Standard NPAs Total %*
6780 1154 7934 14.54
3220 480 3700 12.97
1079 1312 2391 54.76
2298 74 2372 3.12
Industry-wise details of Restructured Assets (2/3)Rs. In Crores
Engineering 836 314 1150 27.30
Hotels & Restaurant 1473 35 1508 2.32
Mining 185 22 207 10.63
Infra 606 132 738 17.89
Sugar 817 4 821 0.49
Pharma 508 54 562 9.61
Auto 1019 26 1045 2.49
Others 8273 1881 10154 18.52
Grand Total 26940 3284 30224 10.87
2357 431 2788 15.46
1818 346 2164 15.99
1607 74 1681 4.40
2447 156 2603 5.99
1415 0 1415 0.00
839 204 1043 19.56
785 31 816 3.80
7596 2466 10062 24.51
32241 6728 38969 17.27
45* % of NPAs to restructured loans in the sector
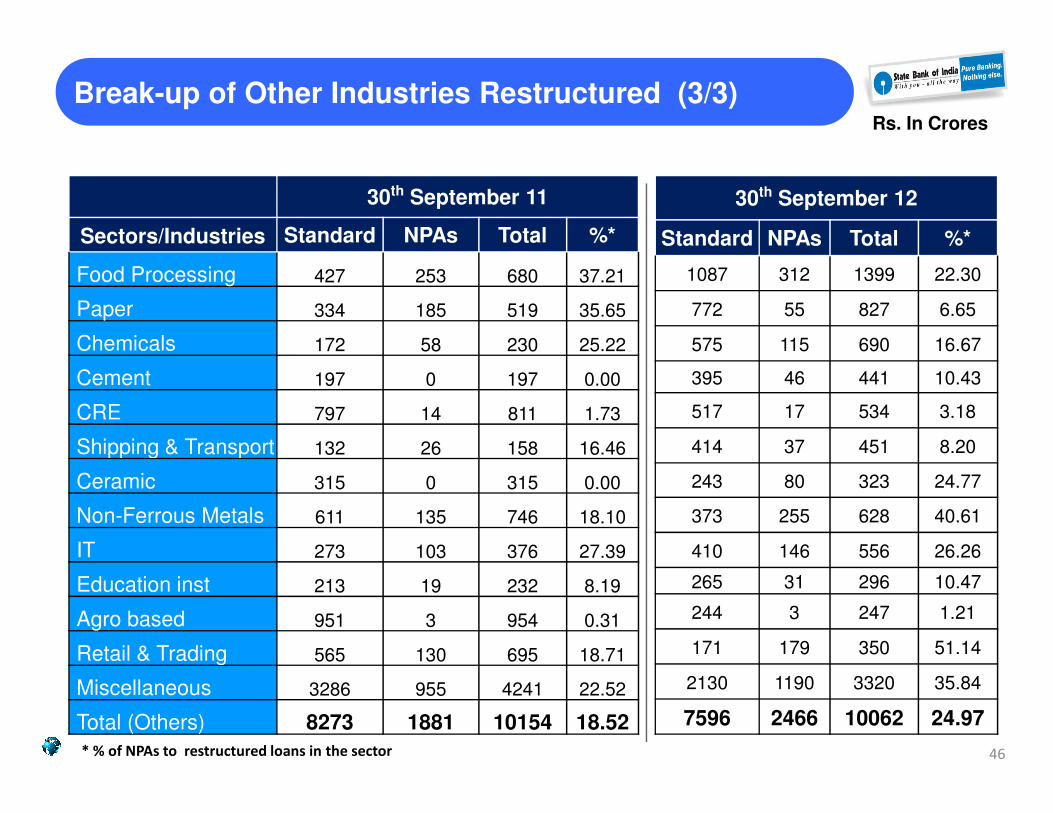
Break-up of Other Industries Restructured (3/3)Rs. In Crores
30th September 11
Sectors/Industries Standard NPAs Total %*
Food Processing 427 253 680 37.21
Paper 334 185 519 35.65
Chemicals 172 58 230 25.22
Cement 197 0 197 0.00
CRE 797 14 811 1.73
30th September 12
Standard NPAs Total %*
1087 312 1399 22.30
772 55 827 6.65
575 115 690 16.67
395 46 441 10.43
517 17 534 3.18
46
CRE 797 14 811 1.73
Shipping & Transport 132 26 158 16.46
Ceramic 315 0 315 0.00
Non-Ferrous Metals 611 135 746 18.10
IT 273 103 376 27.39
Education inst 213 19 232 8.19
Agro based 951 3 954 0.31
Retail & Trading 565 130 695 18.71
Miscellaneous 3286 955 4241 22.52
Total (Others) 8273 1881 10154 18.52
517 17 534 3.18
414 37 451 8.20
243 80 323 24.77
373 255 628 40.61
410 146 556 26.26
265 31 296 10.47
244 3 247 1.21
171 179 350 51.14
2130 1190 3320 35.84
7596 2466 10062 24.97
* % of NPAs to restructured loans in the sector
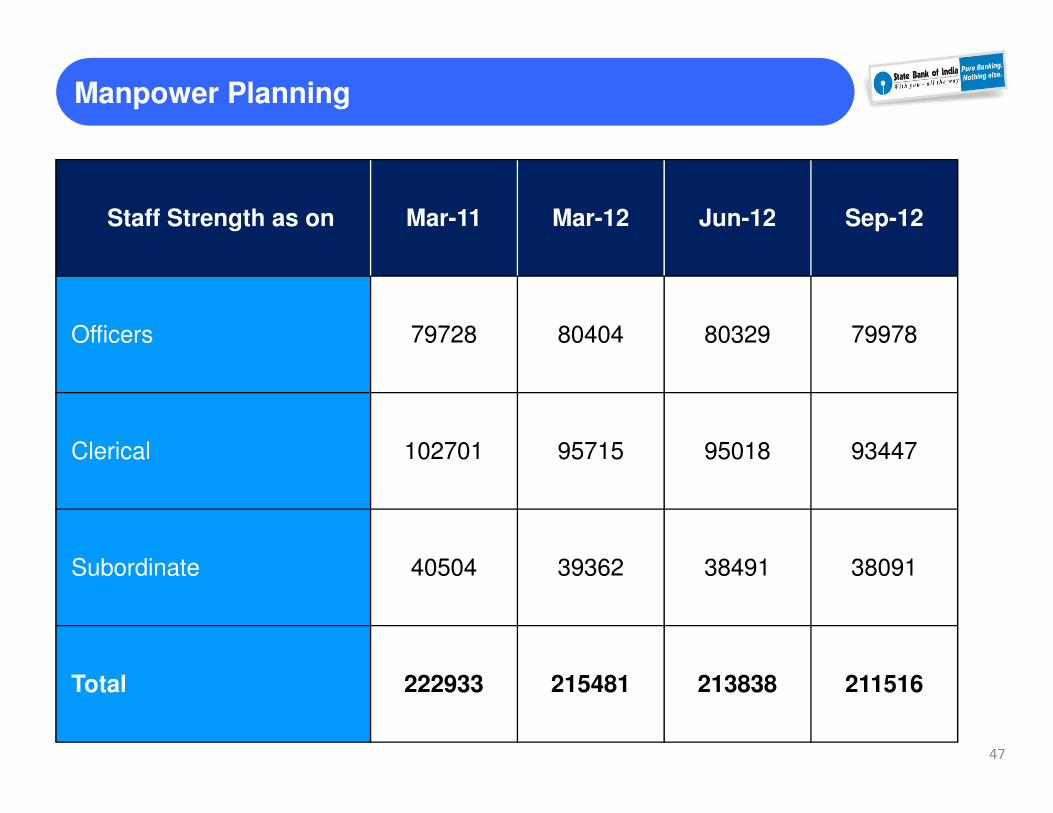
Manpower Planning
Staff Strength as on Mar-11 Mar-12 Jun-12 Sep-12
Officers 79728 80404 80329 79978
Clerical 102701 95715 95018 93447
Subordinate 40504 39362 38491 38091
Total 222933 215481 213838 211516
47
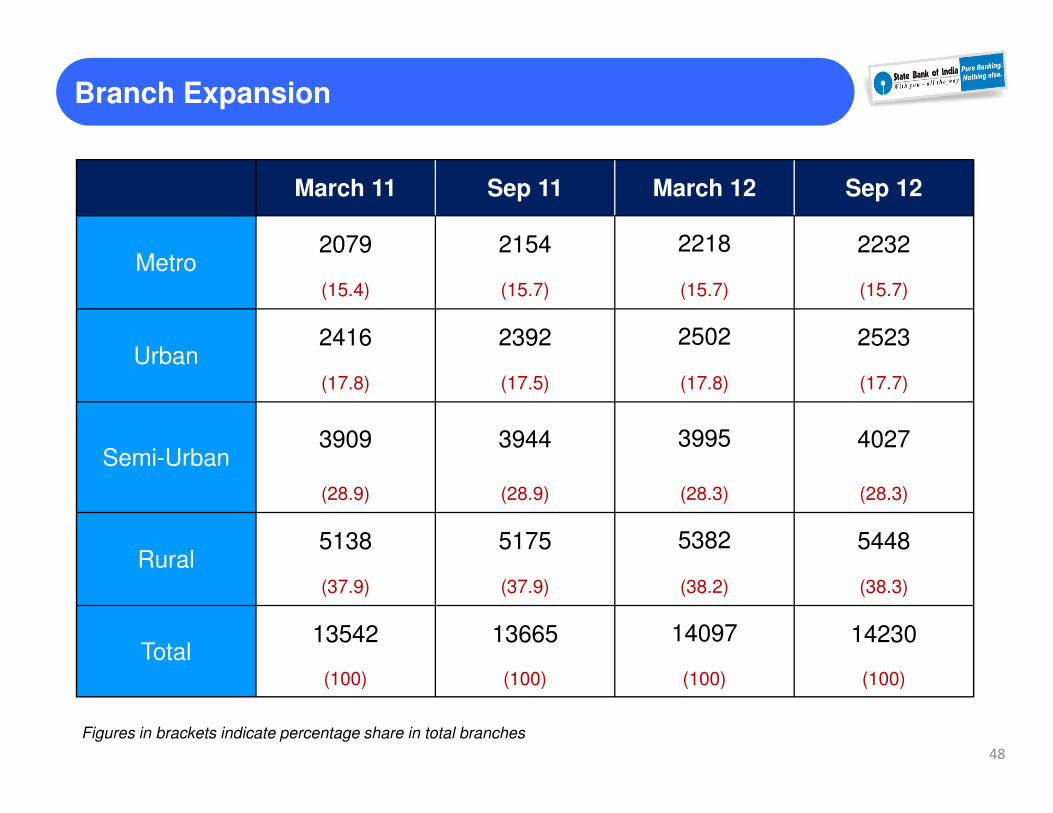
Branch Expansion
March 11 Sep 11 March 12 Sep 12
Metro 2079 2154 2218 2232
(15.4) (15.7) (15.7) (15.7)
Urban 2416 2392 2502 2523
(17.8) (17.5) (17.8) (17.7)
Semi-Urban 3909 3944 3995 4027
(28.9) (28.9) (28.3) (28.3)
Rural 5138 5175 5382 5448
(37.9) (37.9) (38.2) (38.3)
Total 13542 13665 14097 14230
(100) (100) (100) (100)
Figures in brackets indicate percentage share in total branches
48
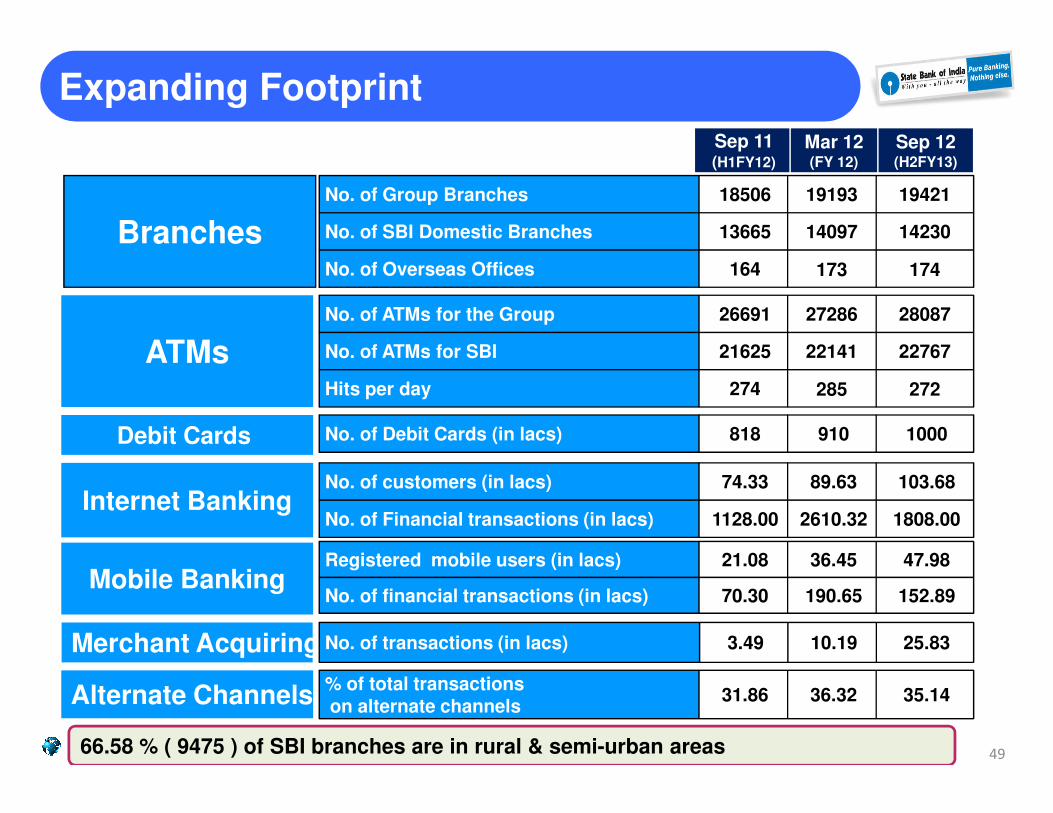
Expanding Footprint
No. of Group Branches 18506 19193 19421
No. of SBI Domestic Branches 13665 14097 14230
No. of Overseas Offices 164 173 174
No. of ATMs for the Group 26691 27286 28087
No. of ATMs for SBI 21625 22141 22767
Hits per day 274 285 272
Branches
ATMs
Sep 11(H1FY12)
Mar 12(FY 12)
Sep 12(H2FY13)
No. of Debit Cards (in lacs) 818 910 1000
No. of customers (in lacs) 74.33 89.63 103.68
No. of Financial transactions (in lacs) 1128.00 2610.32 1808.00
Registered mobile users (in lacs) 21.08 36.45 47.98
No. of financial transactions (in lacs) 70.30 190.65 152.89
% of total transactionson alternate channels
31.86 36.32 35.14
Debit Cards
Internet Banking
Mobile Banking
Alternate Channels
66.58 % ( 9475 ) of SBI branches are in rural & semi-urban areas
Merchant Acquiring No. of transactions (in lacs) 3.49 10.19 25.83
49
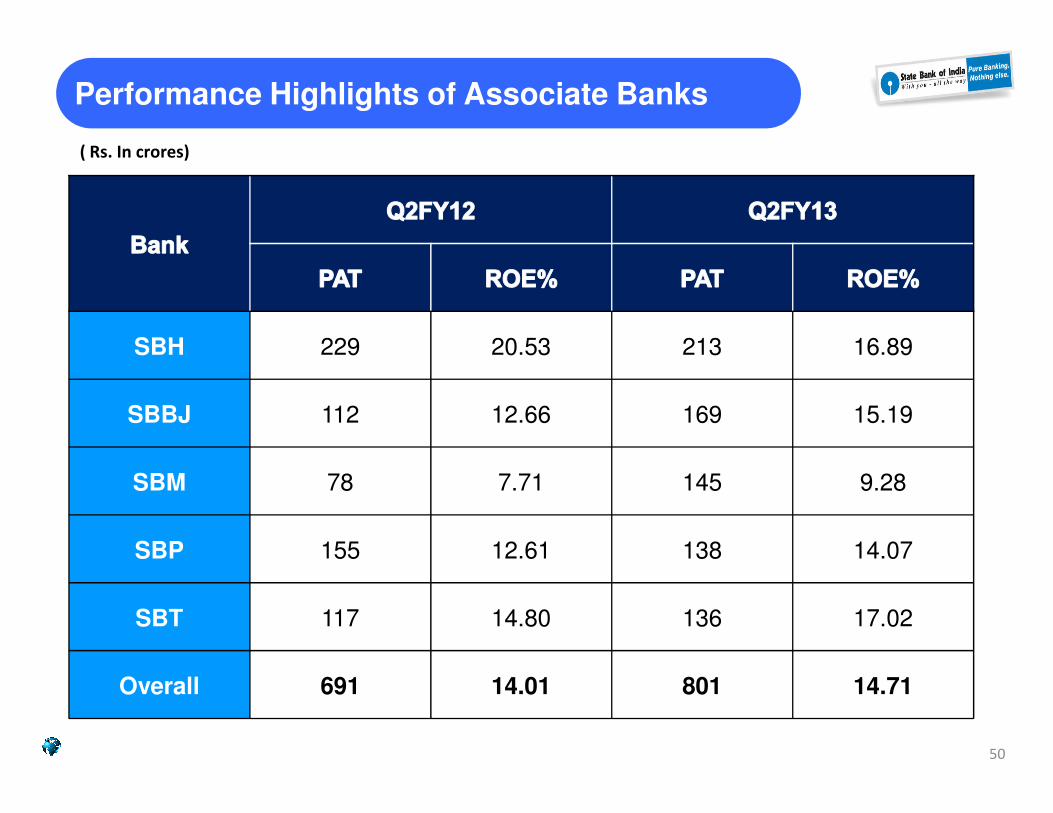
Performance Highlights of Associate Banks
SBH 229 20.53 213 16.89
SBBJ 112 12.66 169 15.19
( Rs. In crores)
SBBJ 112 12.66 169 15.19
SBM 78 7.71 145 9.28
SBP 155 12.61 138 14.07
SBT 117 14.80 136 17.02
Overall 691 14.01 801 14.71
50
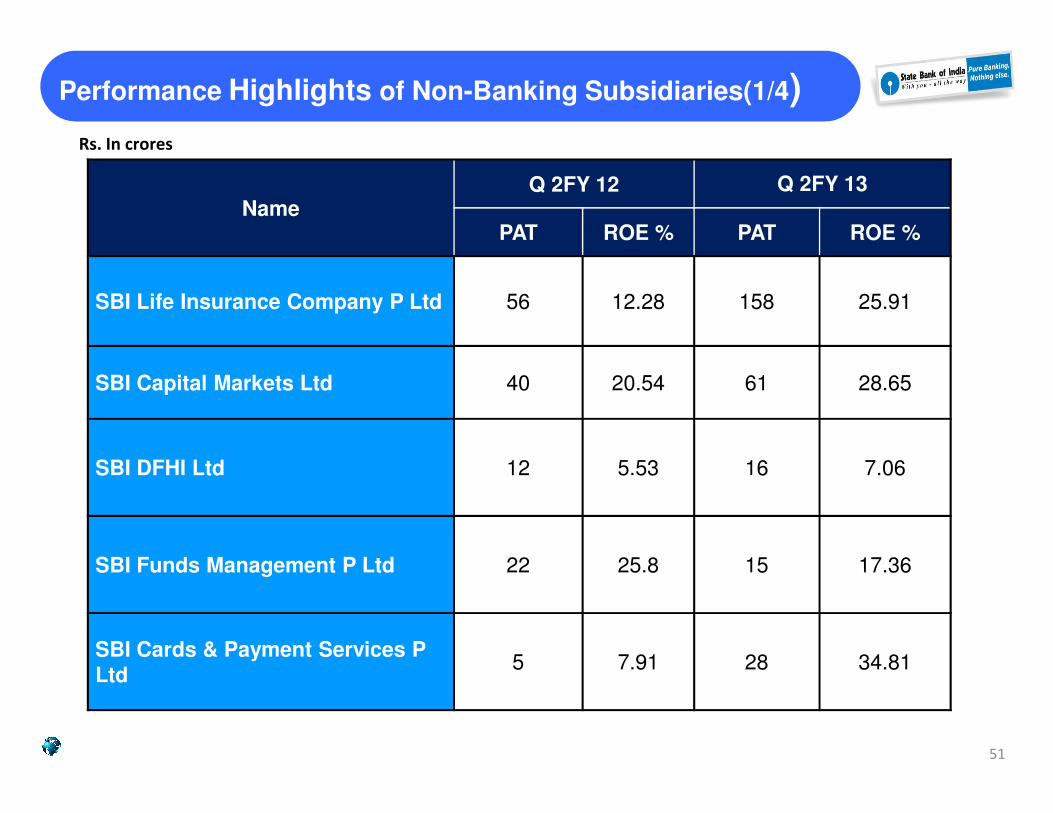
Performance Highlights of Non-Banking Subsidiaries(1/4)
NameQ 2FY 12 Q 2FY 13
PAT ROE % PAT ROE %
SBI Life Insurance Company P Ltd 56 12.28 158 25.91
SBI Capital Markets Ltd 40 20.54 61 28.65
Rs. In crores
SBI DFHI Ltd 12 5.53 16 7.06
SBI Funds Management P Ltd 22 25.8 15 17.36
SBI Cards & Payment Services P
Ltd5 7.91 28 34.81
51
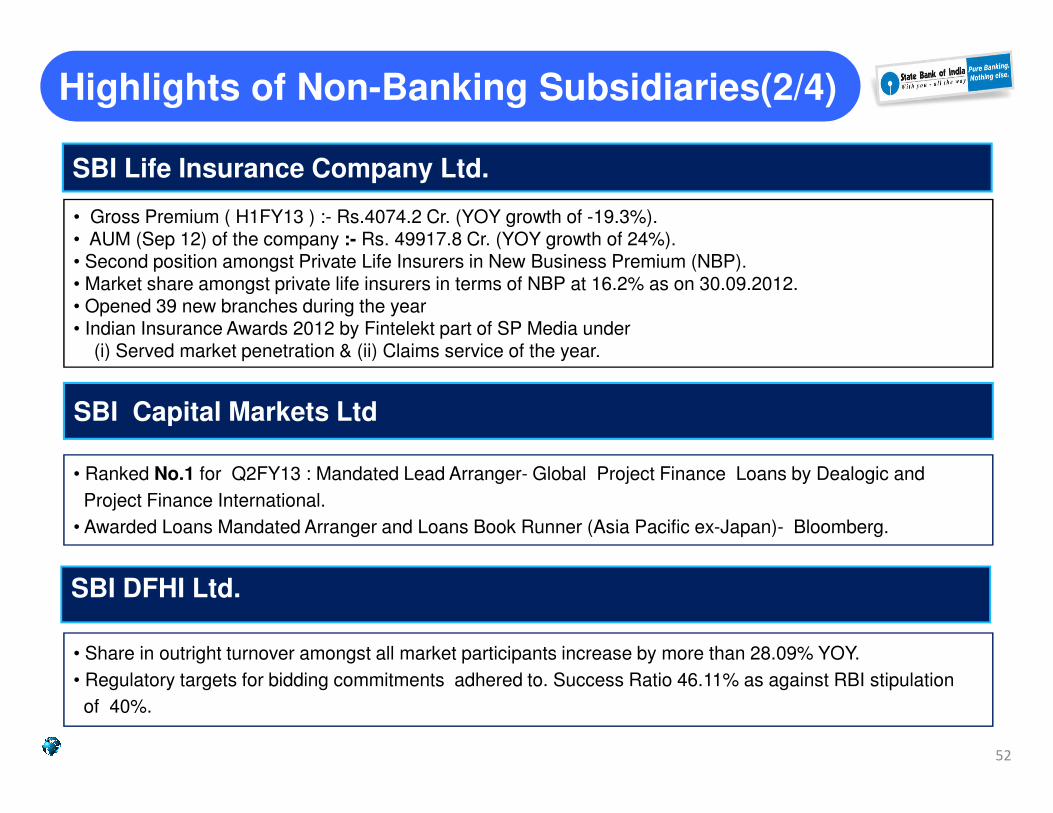
Highlights of Non-Banking Subsidiaries(2/4)
SBI Life Insurance Company Ltd.
• Gross Premium ( H1FY13 ) :- Rs.4074.2 Cr. (YOY growth of -19.3%).• AUM (Sep 12) of the company :- Rs. 49917.8 Cr. (YOY growth of 24%).• Second position amongst Private Life Insurers in New Business Premium (NBP).• Market share amongst private life insurers in terms of NBP at 16.2% as on 30.09.2012.• Opened 39 new branches during the year• Indian Insurance Awards 2012 by Fintelekt part of SP Media under
(i) Served market penetration & (ii) Claims service of the year.
SBI Capital Markets LtdSBI Capital Markets Ltd
• Ranked No.1 for Q2FY13 : Mandated Lead Arranger- Global Project Finance Loans by Dealogic and
Project Finance International.
• Awarded Loans Mandated Arranger and Loans Book Runner (Asia Pacific ex-Japan)- Bloomberg.
• Share in outright turnover amongst all market participants increase by more than 28.09% YOY.
• Regulatory targets for bidding commitments adhered to. Success Ratio 46.11% as against RBI stipulation
of 40%.
SBI DFHI Ltd.
52
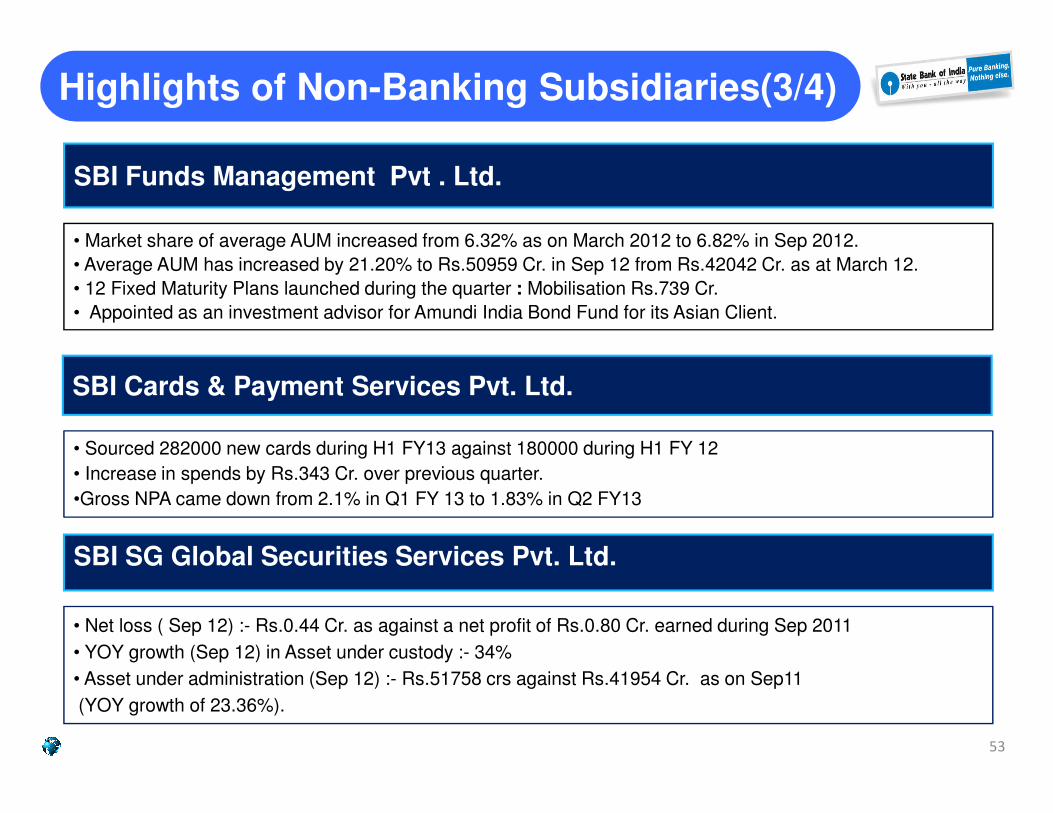
Highlights of Non-Banking Subsidiaries(3/4)
SBI Funds Management Pvt . Ltd.
• Market share of average AUM increased from 6.32% as on March 2012 to 6.82% in Sep 2012.
• Average AUM has increased by 21.20% to Rs.50959 Cr. in Sep 12 from Rs.42042 Cr. as at March 12.
• 12 Fixed Maturity Plans launched during the quarter : Mobilisation Rs.739 Cr.
• Appointed as an investment advisor for Amundi India Bond Fund for its Asian Client.
SBI Cards & Payment Services Pvt. Ltd.
• Sourced 282000 new cards during H1 FY13 against 180000 during H1 FY 12
• Increase in spends by Rs.343 Cr. over previous quarter.
•Gross NPA came down from 2.1% in Q1 FY 13 to 1.83% in Q2 FY13
SBI SG Global Securities Services Pvt. Ltd.
• Net loss ( Sep 12) :- Rs.0.44 Cr. as against a net profit of Rs.0.80 Cr. earned during Sep 2011
• YOY growth (Sep 12) in Asset under custody :- 34%
• Asset under administration (Sep 12) :- Rs.51758 crs against Rs.41954 Cr. as on Sep11
(YOY growth of 23.36%).
53
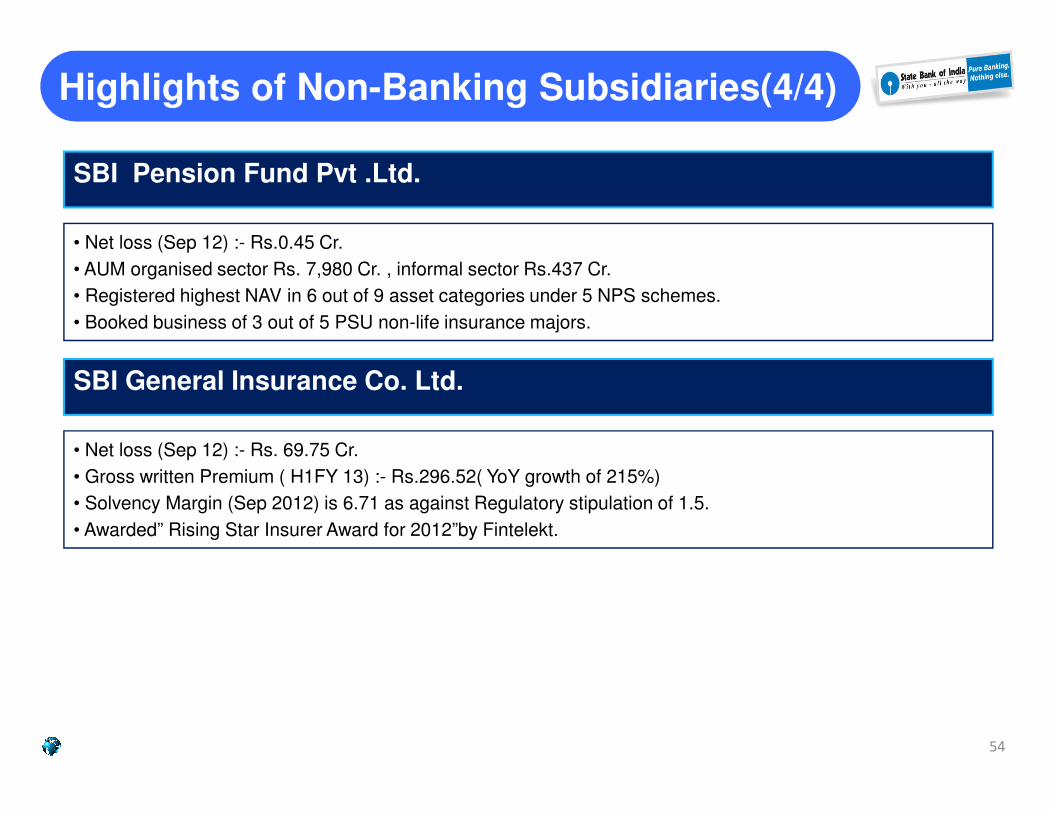
Highlights of Non-Banking Subsidiaries(4/4)
SBI General Insurance Co. Ltd.
SBI Pension Fund Pvt .Ltd.
• Net loss (Sep 12) :- Rs.0.45 Cr.
• AUM organised sector Rs. 7,980 Cr. , informal sector Rs.437 Cr.
• Registered highest NAV in 6 out of 9 asset categories under 5 NPS schemes.
• Booked business of 3 out of 5 PSU non-life insurance majors.
• Net loss (Sep 12) :- Rs. 69.75 Cr.
• Gross written Premium ( H1FY 13) :- Rs.296.52( YoY growth of 215%)
• Solvency Margin (Sep 2012) is 6.71 as against Regulatory stipulation of 1.5.
• Awarded” Rising Star Insurer Award for 2012”by Fintelekt.
54
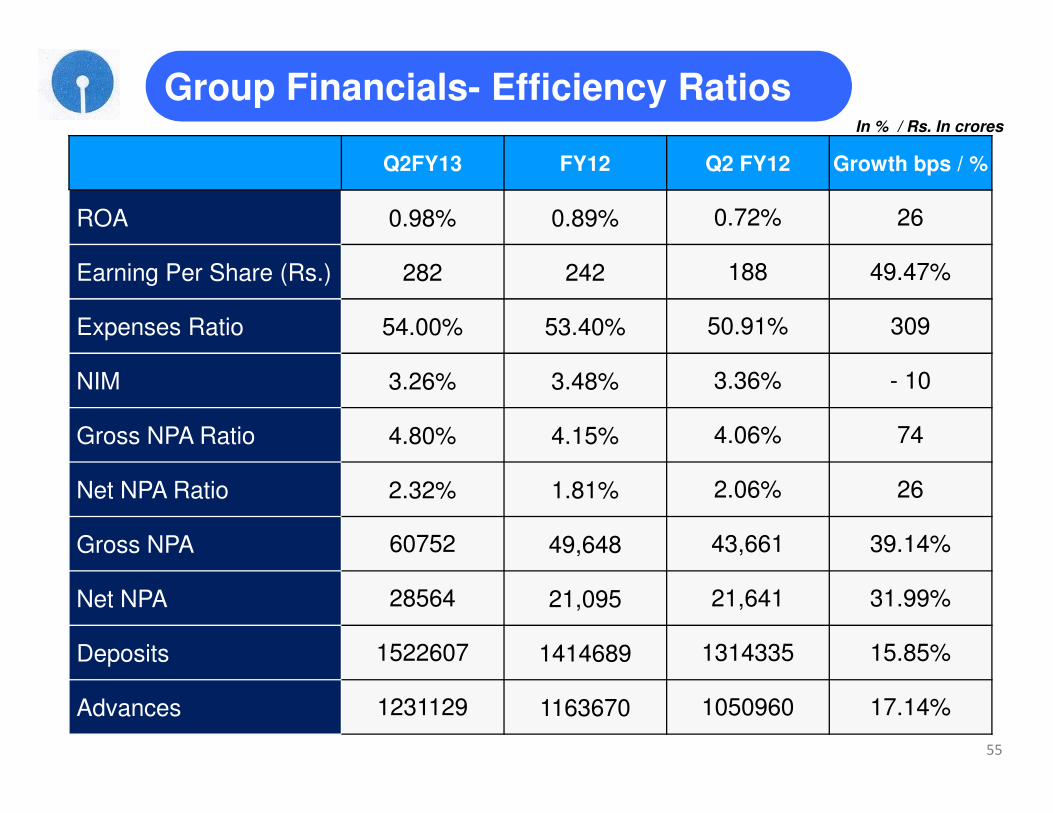
Q2FY13 FY12 Q2 FY12 Growth bps / %
ROA 0.98% 0.89% 0.72% 26
Earning Per Share (Rs.) 282 242 188 49.47%
Expenses Ratio 54.00% 53.40% 50.91% 309
NIM 3.26% 3.48% 3.36% - 10
Group Financials- Efficiency Ratios In % / Rs. In crores
Gross NPA Ratio 4.80% 4.15% 4.06% 74
Net NPA Ratio 2.32% 1.81% 2.06% 26
Gross NPA 60752 49,648 43,661 39.14%
Net NPA 28564 21,095 21,641 31.99%
Deposits 1522607 1414689 1314335 15.85%
Advances 1231129 1163670 1050960 17.14%
55
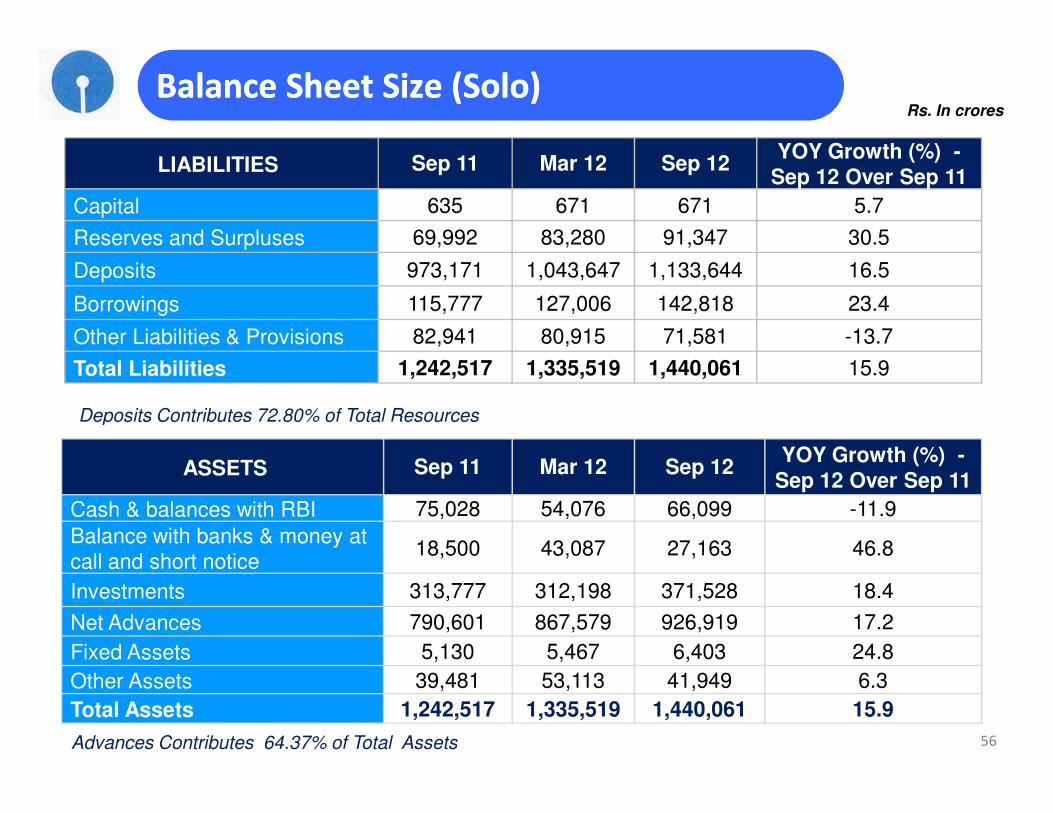
LIABILITIES Sep 11 Mar 12 Sep 12YOY Growth (%) -
Sep 12 Over Sep 11
Capital 635 671 671 5.7
Reserves and Surpluses 69,992 83,280 91,347 30.5
Deposits 973,171 1,043,647 1,133,644 16.5
Borrowings 115,777 127,006 142,818 23.4
Other Liabilities & Provisions 82,941 80,915 71,581 -13.7
Total Liabilities 1,242,517 1,335,519 1,440,061 15.9
Deposits Contributes 72.80% of Total Resources
Rs. In crores
Balance Sheet Size (Solo)Balance Sheet Size (Solo)
ASSETS Sep 11 Mar 12 Sep 12YOY Growth (%) -
Sep 12 Over Sep 11
Cash & balances with RBI 75,028 54,076 66,099 -11.9
Balance with banks & money at
call and short notice18,500 43,087 27,163 46.8
Investments 313,777 312,198 371,528 18.4
Net Advances 790,601 867,579 926,919 17.2
Fixed Assets 5,130 5,467 6,403 24.8
Other Assets 39,481 53,113 41,949 6.3
Total Assets 1,242,517 1,335,519 1,440,061 15.9
56
Deposits Contributes 72.80% of Total Resources
Advances Contributes 64.37% of Total Assets
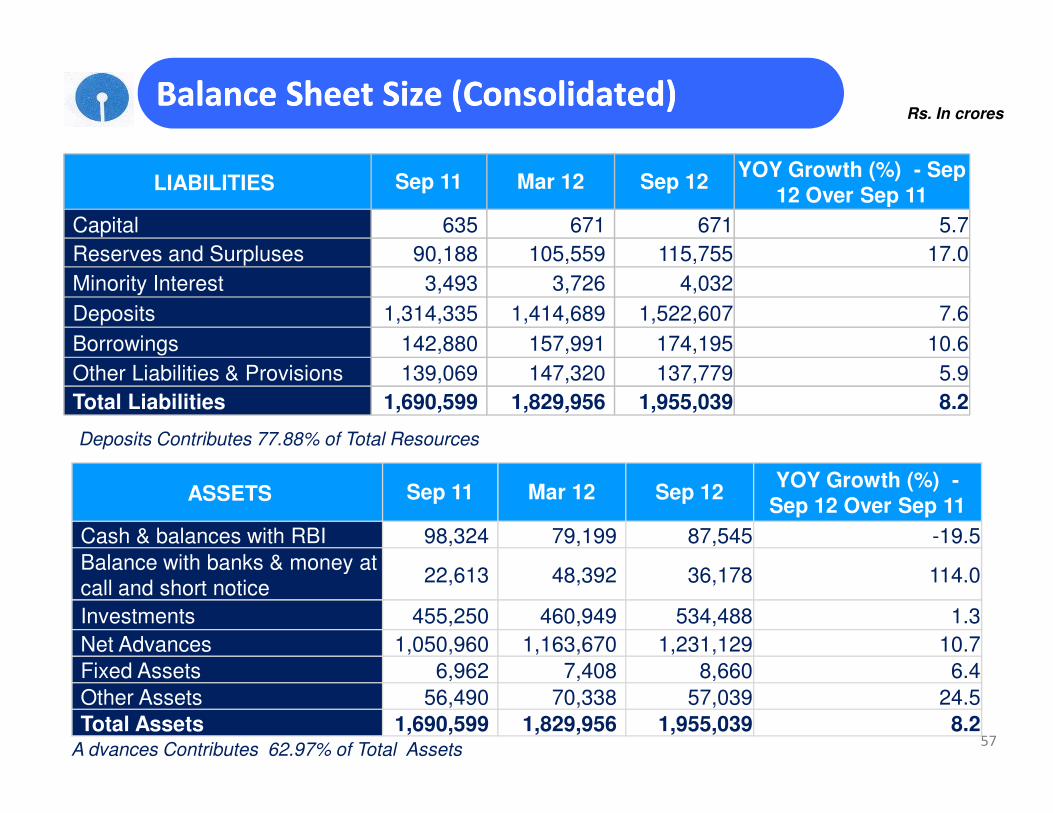
LIABILITIES Sep 11 Mar 12 Sep 12YOY Growth (%) - Sep
12 Over Sep 11
Capital 635 671 671 5.7
Reserves and Surpluses 90,188 105,559 115,755 17.0
Minority Interest 3,493 3,726 4,032
Deposits 1,314,335 1,414,689 1,522,607 7.6
Borrowings 142,880 157,991 174,195 10.6
Other Liabilities & Provisions 139,069 147,320 137,779 5.9
Total Liabilities 1,690,599 1,829,956 1,955,039 8.2
Rs. In croresBalance Sheet Size (Consolidated)Balance Sheet Size (Consolidated)
Total Liabilities 1,690,599 1,829,956 1,955,039 8.2
ASSETS Sep 11 Mar 12 Sep 12YOY Growth (%) -
Sep 12 Over Sep 11
Cash & balances with RBI 98,324 79,199 87,545 -19.5
Balance with banks & money at
call and short notice22,613 48,392 36,178 114.0
Investments 455,250 460,949 534,488 1.3
Net Advances 1,050,960 1,163,670 1,231,129 10.7
Fixed Assets 6,962 7,408 8,660 6.4
Other Assets 56,490 70,338 57,039 24.5
Total Assets 1,690,599 1,829,956 1,955,039 8.257
Deposits Contributes 77.88% of Total Resources
A dvances Contributes 62.97% of Total Assets

58
Related Documents