SOURCE: Ministry of Internal Affairs and Communications, Japan TITLE: Experience and Challenges in Collecting Mobile Broadband Statistics in Japan __________ INTERNATIONAL TELECOMMUNICATION UNION Document 010-E 26 February 2009 TELECOMMUNICATION DEVELOPMENT BUREAU Original: English 7 TH WORLD TELECOMMUNICATION/ICT INDICATORS MEETING, CAIRO, EGYPT, 3-5 MARCH 2009

Welcome message from author
This document is posted to help you gain knowledge. Please leave a comment to let me know what you think about it! Share it to your friends and learn new things together.
Transcript
SOURCE: Ministry of Internal Affairs and Communications, Japan
TITLE: Experience and Challenges in Collecting Mobile Broadband Statistics in Japan
__________
INTERNATIONAL TELECOMMUNICATION UNION
Document 010-E 26 February 2009
TELECOMMUNICATION DEVELOPMENT BUREAU Original: English
7TH WORLD TELECOMMUNICATION/ICT INDICATORS MEETING, CAIRO, EGYPT, 3-5 MARCH 2009

0
Atsushi Umino (海野 敦史)
Institute for Information and Communications PolicyMinistry of Internal Affairs and Communications of Japan
Experience and Challenges in CollectingMobile Broadband Statistics in Japan
Experience and Challenges in CollectingMobile Broadband Statistics in Japan
1
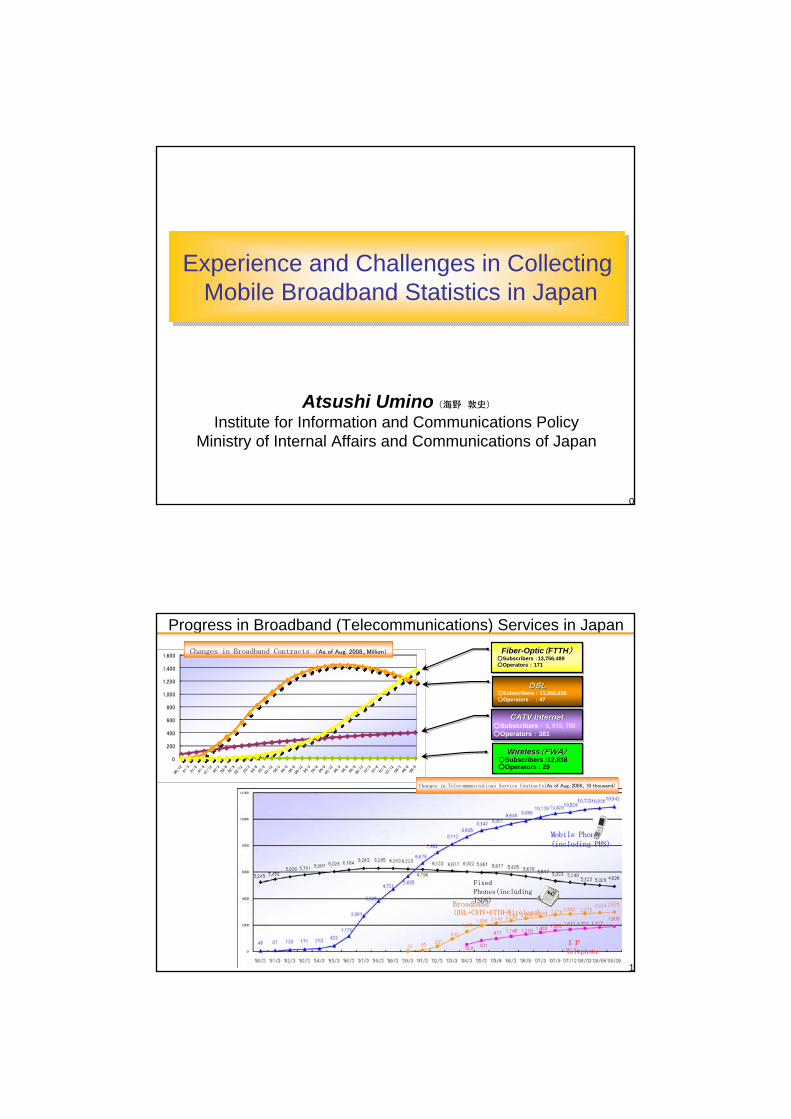
Progress in Broadband (Telecommunications) Services in Japan
0
200
400
600
800
1,000
1,200
1,400
1,600Fiber-Optic(FTTH)
○Subscribers :13,756,489○Operators : 171
FiberFiber--OpticOptic((FTTHFTTH))○○Subscribers Subscribers ::13,756,48913,756,489○○Operators Operators :: 171171
Wireless(FWA)○Subscribers :12,838○Operators : 29
WirelessWireless(FWA)(FWA)○Subscribers :12,838○Operators : 29
CATV Internet○Subscribers : 4,019,788○Operators : 381
CATV InternetCATV Internet○Subscribers : 4,019,788○Operators : 381
DSL○Subscribers : 11,966,838○Operators : 47
DSLDSL○Subscribers : 11,966,838○Operators : 47
Mobile PhonesMobile Phones(including PHS)(including PHS)
Fixed Fixed Phones(includingPhones(includingISDN)ISDN)
Broadband Broadband ((DSL+CATV+FTTH+WirelessDSL+CATV+FTTH+Wireless))
IPIPTelephoneTelephone
Changes in Broadband ContractsChanges in Broadband Contracts ((As of Aug. 2008As of Aug. 2008、、MillionMillion))
Changes in Telecommunications Service ContractsChanges in Telecommunications Service Contracts((As of Aug. 2008As of Aug. 2008、、10 thousand10 thousand))
2
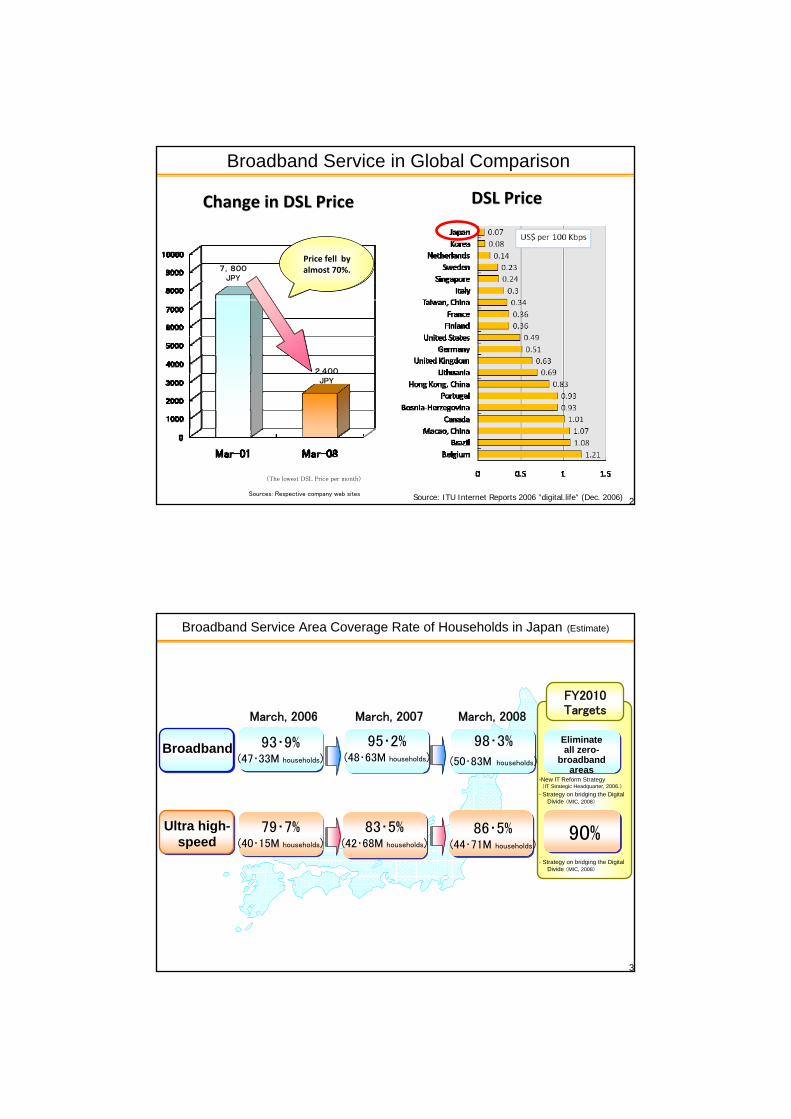
DSL PriceDSL Price
Broadband Service in Global Comparison
Source: ITU Internet Reports 2006 ”digital.life” (Dec. 2006)
7,800JPY
2,400JPY
Price fell by almost 70%.
(The lowest DSL Price per month)
Change in DSL PriceChange in DSL Price
Sources: Respective company web sites
3
Broadband Service Area Coverage Rate of Households in Japan (Estimate)
Broadband
Ultra high-speed
March, 2007
93・9%(47・33M households)
March, 2006
95・2%(48・63M households)
83・5%(42・68M households)
98・3%(50・83M households)
86・5%(44・71M households)
March, 2008
-New IT Reform Strategy(IT Strategic Headquarter, 2006.)
- Strategy on bridging the Digital Divide (MIC, 2008)
90%
Eliminate all zero-
broadband areas
FY2010Targets
79・7%(40・15M households)
- Strategy on bridging the Digital Divide (MIC, 2008)
4
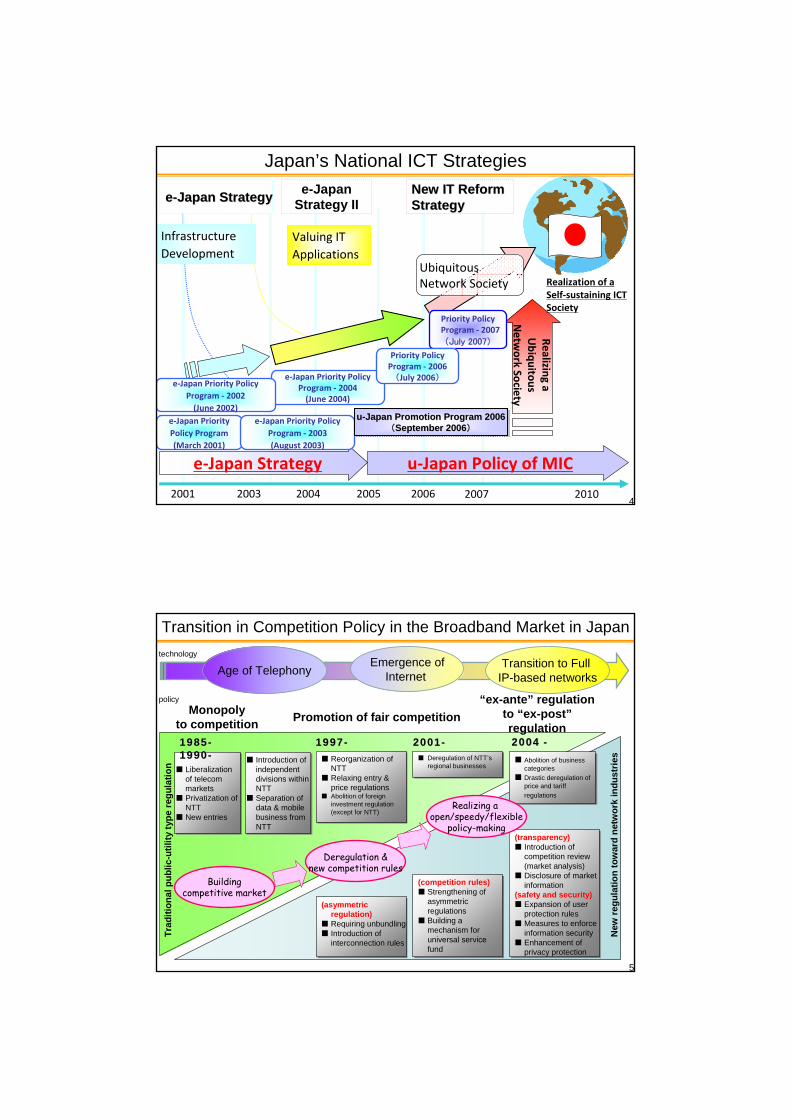
Japan’s National ICT Strategies
2001 2003 2004 2005 2006
e‐Japan Priority Policy Program(March 2001)
e‐Japan Strategy u‐Japan Policy of MIC
e‐Japan Priority Policy Program ‐ 2003(August 2003)
e‐Japan Priority Policy Program ‐ 2004(June 2004)
Realizing a Ubiquitous
Netw
ork Society
u-Japan Promotion Program 2006(September 2006)
uu--Japan Promotion Program 2006Japan Promotion Program 2006((September 2006September 2006))
Realization of a Self‐sustaining ICT Society
2007
Priority Policy Program ‐ 2007(July 2007)
Priority Policy Program ‐ 2006(July 2006)
2010
e‐Japan Priority Policy Program ‐ 2002 (June 2002)
ee--Japan StrategyJapan Strategy e-Japan Strategy II
New IT Reform New IT Reform StrategyStrategy
Infrastructure Development
Valuing IT Applications
Ubiquitous Network Society
5
Transition in Competition Policy in the Broadband Market in Japan
Liberalization of telecom marketsPrivatization of NTTNew entries
Liberalization of telecom marketsPrivatization of NTTNew entries
Reorganization of NTTRelaxing entry & price regulationsAbolition of foreign investment regulation (except for NTT)
Reorganization of NTTRelaxing entry & price regulationsAbolition of foreign investment regulation (except for NTT)
Age of TelephonyEmergence of
Internet
Abolition of business categoriesDrastic deregulation of price and tariff regulations
Abolition of business categoriesDrastic deregulation of price and tariff regulations
Monopolyto competition
“ex-ante” regulation to “ex-post”regulation
19851985--19901990--
19971997-- 20012001--
Promotion of fair competition
2004 2004 --
Transition to Full IP-based networks
technology
policy
Introduction of independent divisions within NTTSeparation of data & mobile business from NTT
Introduction of independent divisions within NTTSeparation of data & mobile business from NTT
Deregulation of NTT’s regional businessesDeregulation of NTT’s regional businesses
(competition rules)Strengthening of asymmetric regulationsBuilding a mechanism for universal service fund
(competition rules)Strengthening of asymmetric regulationsBuilding a mechanism for universal service fund
Trad
ition
al p
ublic
-util
ity ty
pe re
gula
tion
New
regu
latio
n to
war
d ne
twor
k in
dust
ries
(asymmetric regulation)Requiring unbundlingIntroduction of interconnection rules
(asymmetric regulation)Requiring unbundlingIntroduction of interconnection rules
(transparency)Introduction of competition review (market analysis) Disclosure of market information
(safety and security)Expansion of user protection rules Measures to enforce information securityEnhancement of privacy protection
(transparency)Introduction of competition review (market analysis) Disclosure of market information
(safety and security)Expansion of user protection rules Measures to enforce information securityEnhancement of privacy protection
Buildingcompetitive market
Deregulation &new competition rules
Realizing a open/speedy/flexible
policy-making
6
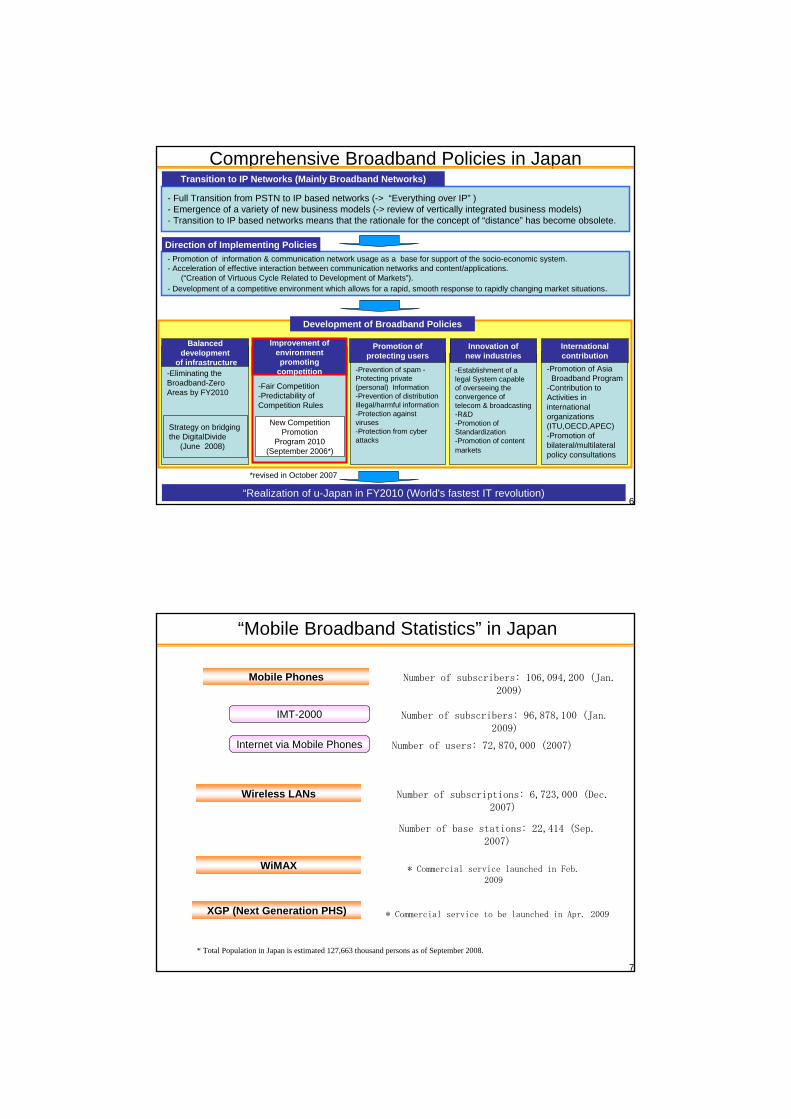
-Establishment of a legal System capable of overseeing the convergence of telecom & broadcasting-R&D-Promotion of Standardization-Promotion of content markets
-Prevention of spam -Protecting private (personal) Information-Prevention of distribution illegal/harmful information-Protection against viruses-Protection from cyber attacks
-Promotion of AsiaBroadband Program
-Contribution to Activities in international organizations (ITU,OECD,APEC)-Promotion of bilateral/multilateral policy consultations
-Fair Competition-Predictability ofCompetition Rules
-Eliminating the Broadband-Zero Areas by FY2010
Comprehensive Broadband Policies in Japan
- Full Transition from PSTN to IP based networks (-> “Everything over IP” )- Emergence of a variety of new business models (-> review of vertically integrated business models)- Transition to IP based networks means that the rationale for the concept of “distance” has become obsolete.
Transition to IP Networks (Mainly Broadband Networks)
- Promotion of information & communication network usage as a base for support of the socio-economic system.- Acceleration of effective interaction between communication networks and content/applications.
(“Creation of Virtuous Cycle Related to Development of Markets”).- Development of a competitive environment which allows for a rapid, smooth response to rapidly changing market situations.
Direction of Implementing Policies
Balanced development
of infrastructure
Improvement of environment promoting
competition
Promotion of protecting users
Innovation of new industries
International contribution
Strategy on bridging the DigitalDivide
(June 2008)
New Competition Promotion
Program 2010(September 2006*)
Development of Broadband Policies
“Realization of u-Japan in FY2010 (World's fastest IT revolution)
*revised in October 2007
7
“Mobile Broadband Statistics” in Japan
Mobile Phones
Wireless LANs
WiMAX
Internet via Mobile Phones
Number of subscribers: 106,094,200 (Jan. 2009)
IMT-2000 Number of subscribers: 96,878,100 (Jan. 2009)
Number of users: 72,870,000 (2007)
Number of subscriptions: 6,723,000 (Dec. 2007)
Number of base stations: 22,414 (Sep. 2007)
* Commercial service launched in Feb. 2009
XGP (Next Generation PHS) * Commercial service to be launched in Apr. 2009
* Total Population in Japan is estimated 127,663 thousand persons as of September 2008.
8
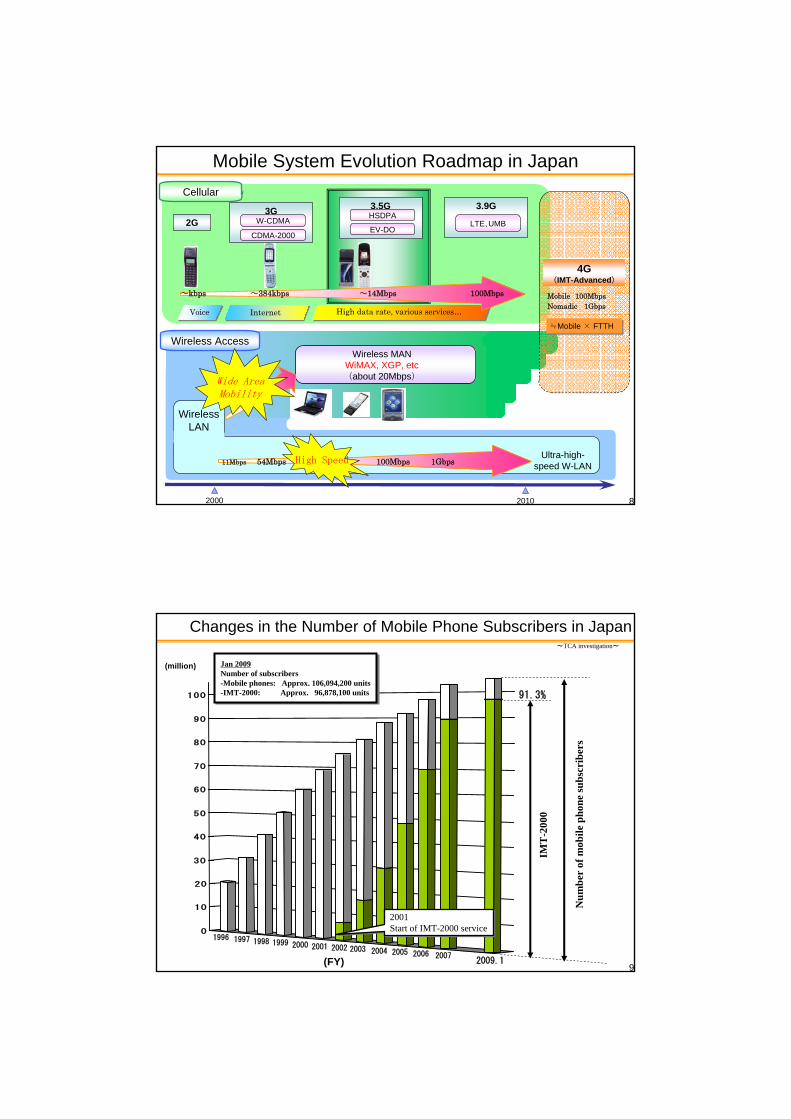
2G
Wireless Access
2000 2010
WirelessLAN
11Mbps 54Mbps 100Mbps 1GbpsUltra-high-
speed W-LAN
Mobile System Evolution Roadmap in Japan
3GW-CDMA
CDMA-2000
3.9G
LTE、UMB
Mobile 100MbpsNomadic 1Gbps
4G(IMT-Advanced)
Wireless MANWiMAX, XGP, etc(about 20Mbps)
Voice Internet
3.5GHSDPA
EV-DO
~kbps ~384kbps ~14Mbps 100Mbps
High data rate, various services…
Cellular
Wide AreaMobility
≒Mobile × FTTH
High Speed
9
0
10
20
30
40
50
60
70
80
90
100
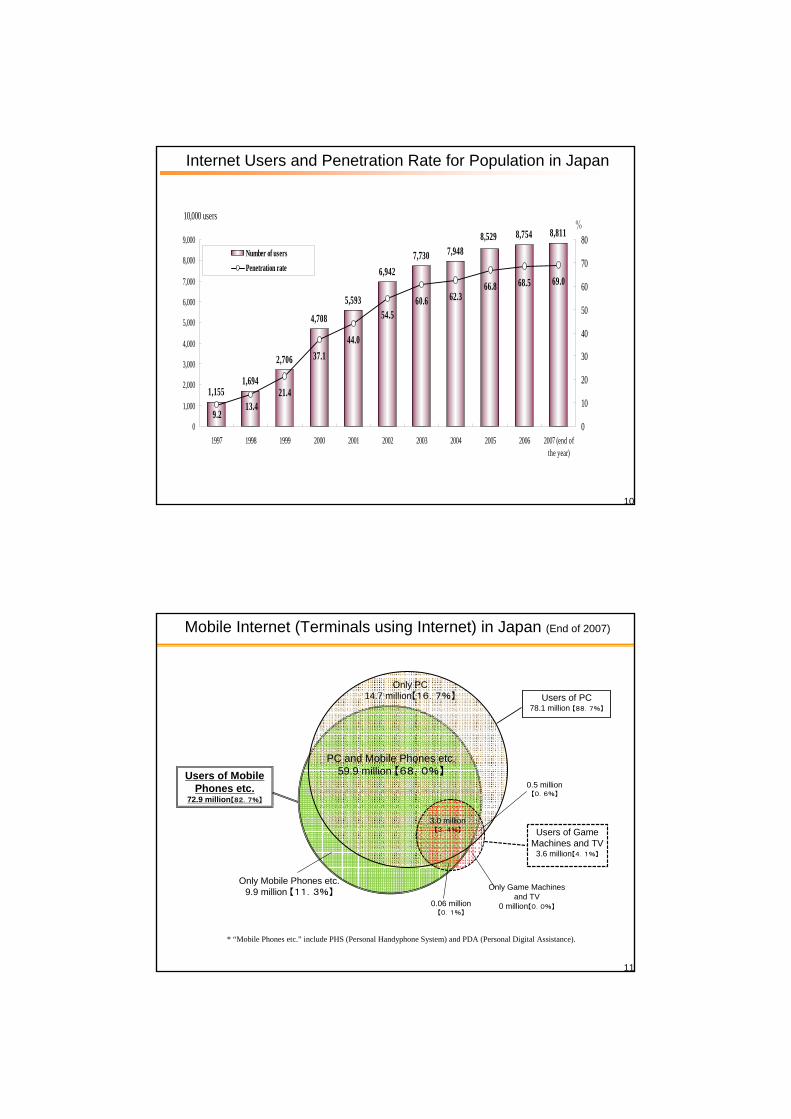
IMT
-200
0
91.3%
Num
ber
of m
obile
pho
ne su
bscr
iber
s
Jan 2009Number of subscribers-Mobile phones: Approx. 106,094,200 units-IMT-2000: Approx. 96,878,100 units
Jan 2009Number of subscribers-Mobile phones: Approx. 106,094,200 units-IMT-2000: Approx. 96,878,100 units
~TCA investigation~
Changes in the Number of Mobile Phone Subscribers in Japan
(million)
(FY)
2001Start of IMT-2000 service2001Start of IMT-2000 service
1996 1997 1998 1999 2000 2001 2002 2003 2004 20052009.1
2006 2007
10
Internet Users and Penetration Rate for Population in Japan
1,1551,694
2,706
4,708
5,593
6,9427,730 7,948
8,754 8,8118,529
21.4
37.144.0
54.560.6 62.3
66.8 68.5 69.0
13.49.2
0
1,000
2,000
3,000
4,000
5,000
6,000
7,000
8,000
9,000
1997 1998 1999 2000 2001 2002 2003 2004 2005 2006 2007 (end ofthe year)
10,000 users
0
10
20
30
40
50
60
70
80%
Number of usersPenetration rate
11
Mobile Internet (Terminals using Internet) in Japan (End of 2007)
Only PC14.7 million【16.7%】
PC and Mobile Phones etc.59.9 million 【68.0%】
Users of PC78.1 million 【88.7%】
Users of Mobile Phones etc.
72.9 million【82.7%】
Users of Game Machines and TV
3.6 million【4.1%】
Only Mobile Phones etc.9.9 million 【11.3%】
Only Game Machines and TV
0 million【0.0%】
3.0 million【3.4%】
0.5 million【0.6%】
0.06 million【0.1%】
* “Mobile Phones etc.” include PHS (Personal Handyphone System) and PDA (Personal Digital Assistance).
12
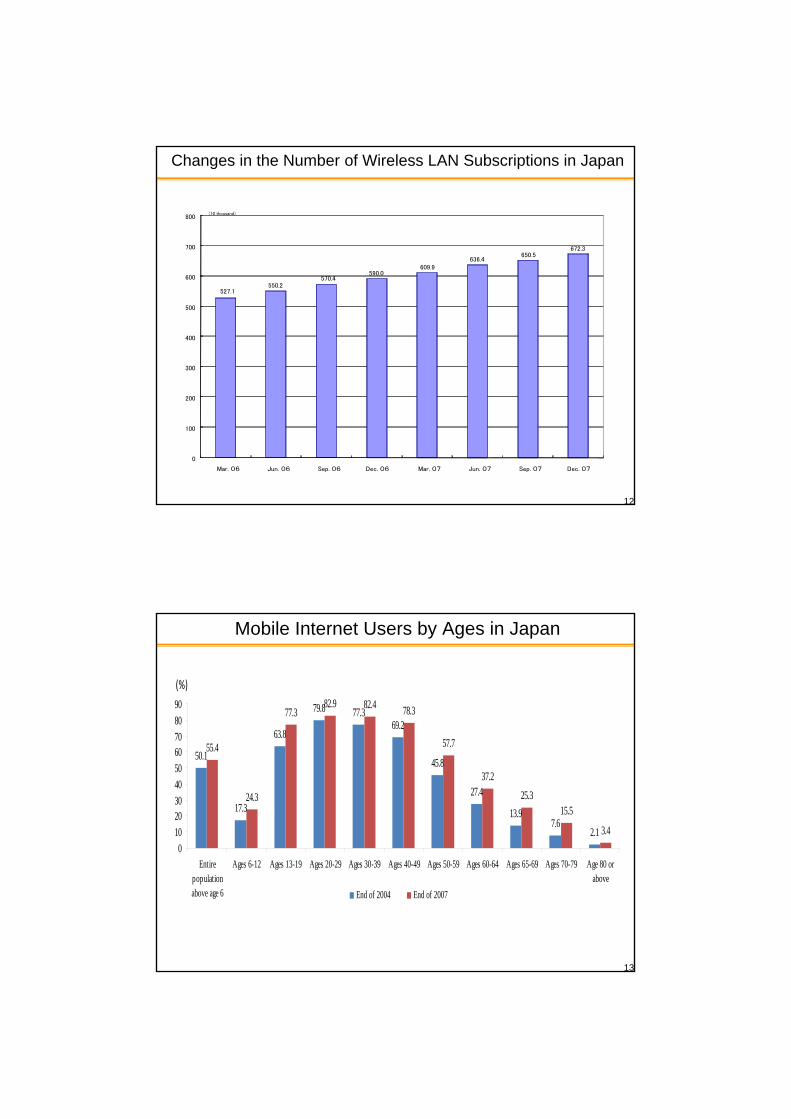
Changes in the Number of Wireless LAN Subscriptions in Japan
527.1550.2
570.4590.0
609.9636.4
650.5672.3
0
100
200
300
400
500
600
700
800
Mar. 06 Jun. 06 Sep. 06 Dec. 06 Mar. 07 Jun. 07 Sep. 07 Dec. 07
(10 thousand)
13
Mobile Internet Users by Ages in Japan
50.1
17.3
63.8
79.8 77.369.2
45.8
27.4
13.97.6
2.1
55.4
24.3
77.382.9 82.4 78.3
57.7
37.225.3
15.5
3.40
102030405060708090
Entirepopulationabove age 6
Ages 6-12 Ages 13-19 Ages 20-29 Ages 30-39 Ages 40-49 Ages 50-59 Ages 60-64 Ages 65-69 Ages 70-79 Age 80 orabove
End of 2004 End of 2007
(%)
14
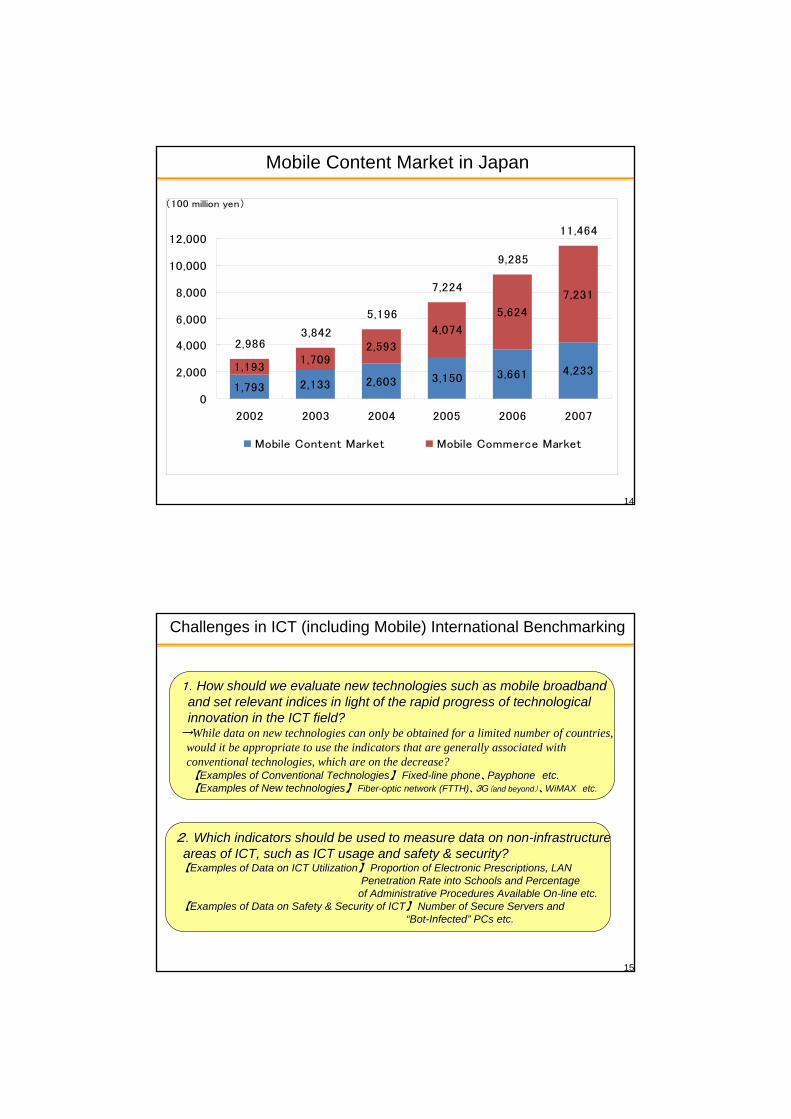
Mobile Content Market in Japan
1,793 2,133 2,603 3,150 3,661 4,2331,1931,709
2,593
4,074
5,624
7,231
2,9863,842
5,196
7,224
9,285
11,464
0
2,000
4,000
6,000
8,000
10,000
12,000
2002 2003 2004 2005 2006 2007
Mobile Content Market Mobile Commerce Market
(100 million yen)
15
Challenges in ICT (including Mobile) International Benchmarking
1.1.How should we evaluate new technologies such as mobile broadbandHow should we evaluate new technologies such as mobile broadbandand set relevant indices in light of the rapid progress of tecand set relevant indices in light of the rapid progress of technologicalhnologicalinnovation in the ICT field?innovation in the ICT field?
→→While data on new technologies can only be obtained for a limiteWhile data on new technologies can only be obtained for a limited number of countries, d number of countries, would it be appropriate to use the indicators that are generalwould it be appropriate to use the indicators that are generally associated withly associated withconventional technologies, which are on the decrease?conventional technologies, which are on the decrease?
【【Examples of Conventional TechnologiesExamples of Conventional Technologies】】 FixedFixed--line phoneline phone、、PayphonePayphone etc.etc.【【Examples of New technologiesExamples of New technologies】】 FiberFiber--optic network (FTTH)optic network (FTTH)、3、3GG((and beyondand beyond))、、WiMAXWiMAX etc.etc.
22..Which indicators should be used to measure data on nonWhich indicators should be used to measure data on non--infrastructureinfrastructureareas of ICT, such as ICT usage and safety & security?areas of ICT, such as ICT usage and safety & security?【【Examples of Data on ICT UtilizationExamples of Data on ICT Utilization】】 Proportion of Electronic Prescriptions, LAN Proportion of Electronic Prescriptions, LAN
PePenetration Rate into Schools and Percentagenetration Rate into Schools and Percentageof of Administrative Procedures Available OnAdministrative Procedures Available On--line etc.line etc.
【【Examples of Data on Safety & Security of ICTExamples of Data on Safety & Security of ICT】】 Number of Secure Servers andNumber of Secure Servers and““BotBot--InfectedInfected”” PCs etc.PCs etc.
16
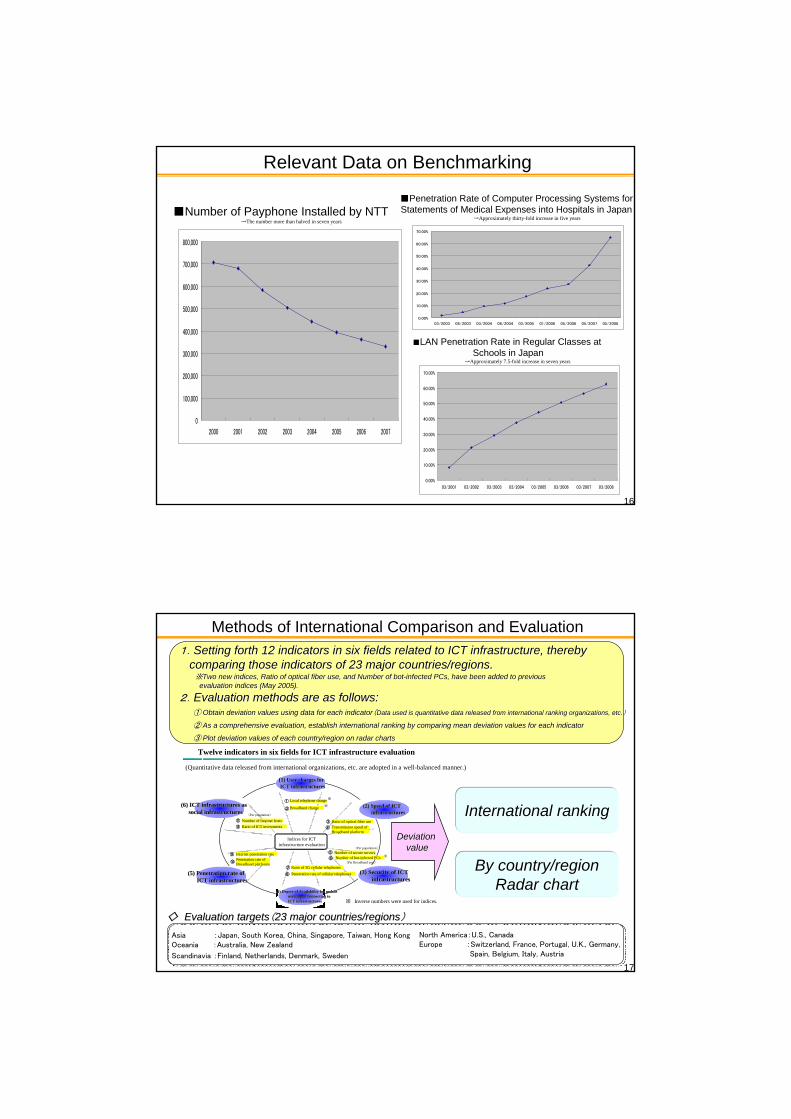
Relevant Data on Benchmarking
■Number of Payphone Installed by NTT→The number more than halved in seven years
0.00%
10.00%
20.00%
30.00%
40.00%
50.00%
60.00%
70.00%
03/2003 08/2003 03/2004 08/2004 03/2005 01/2006 05/2006 05/2007 05/2008
0.00%
10.00%
20.00%
30.00%
40.00%
50.00%
60.00%
70.00%
03/2001 03/2002 03/2003 03/2004 03/2005 03/2006 03/2007 03/2008
■Penetration Rate of Computer Processing Systems for Statements of Medical Expenses into Hospitals in Japan
→Approximately thirty-fold increase in five years
■LAN Penetration Rate in Regular Classes atSchools in Japan
→Approximately 7.5-fold increase in seven years
0
100,000
200,000
300,000
400,000
500,000
600,000
700,000
800,000
2000 2001 2002 2003 2004 2005 2006 2007
17
Methods of International Comparison and Evaluation1.1.Setting forth 12 indicators in six fields related to ICT infrastSetting forth 12 indicators in six fields related to ICT infrastructure, therebyructure, thereby
comparing those indicators of 23 major countries/regions.comparing those indicators of 23 major countries/regions.※※Two new indices, Ratio of optical fiber use, and Number of Two new indices, Ratio of optical fiber use, and Number of botbot--infected PCs, have been added to previous infected PCs, have been added to previous
evaluation indices (May 2005).evaluation indices (May 2005).
2.2.Evaluation methods are as follows:Evaluation methods are as follows:①① Obtain deviation values using data for each indicatorObtain deviation values using data for each indicator((Data used is quantitative data released from international rankiData used is quantitative data released from international ranking organizations, etc.ng organizations, etc.))
②② As a comprehensive evaluation, establish international ranking bAs a comprehensive evaluation, establish international ranking by comparing mean deviation values for each indicatory comparing mean deviation values for each indicator
③③ Plot deviation values of each country/region on radar chartsPlot deviation values of each country/region on radar charts
◇◇ Evaluation targetsEvaluation targets((23 major countries/regions23 major countries/regions))
Asia :Japan, South Korea, China, Singapore, Taiwan, Hong KongOceania :Australia, New Zealand
Scandinavia :Finland, Netherlands, Denmark, Sweden
Deviation Deviation valuevalue
International rankingInternational ranking
By country/regionBy country/regionRadar chartRadar chart
(Per population)
(Per population)
(Per Broadband user)
North America:U.S., CanadaEurope :Switzerland, France, Portugal, U.K., Germany,
Spain, Belgium, Italy, Austria
※
※
※
※ Inverse numbers were used for indices.
Twelve indicators in six fields for ICT infrastructure evaluation
①
②
③
⑥⑩
⑪
⑫
⑨ ⑤
④
⑦
⑧
(Quantitative data released from international organizations, etc. are adopted in a well-balanced manner.)
((1) User charges for 1) User charges for ICT infrastructuresICT infrastructures
(2) Speed of ICT(2) Speed of ICTinfrastructuresinfrastructures
Number of bot-infected PCs
(3) Security of ICT (3) Security of ICT infrastructuresinfrastructures
(5) Penetration rate of (5) Penetration rate of ICT infrastructuresICT infrastructures
(6) ICT infrastructures as(6) ICT infrastructures associal infrastructuressocial infrastructures
Indices for ICT infrastructure evaluation
Local telephone charge
Broadband charge
Ratio of optical fiber useTransmission speed of Broadband platform
Number of secure servers
Ratio of 3G cellular telephonesPenetration rate of cellular telephones
Internet penetration ratePenetration rate of Broadband platforms
Number of Internet hostsRatio of ICT investments
(4) Degree of Availability for mobile (4) Degree of Availability for mobile users upon connecting to users upon connecting to ICT infrastructuresICT infrastructures
18
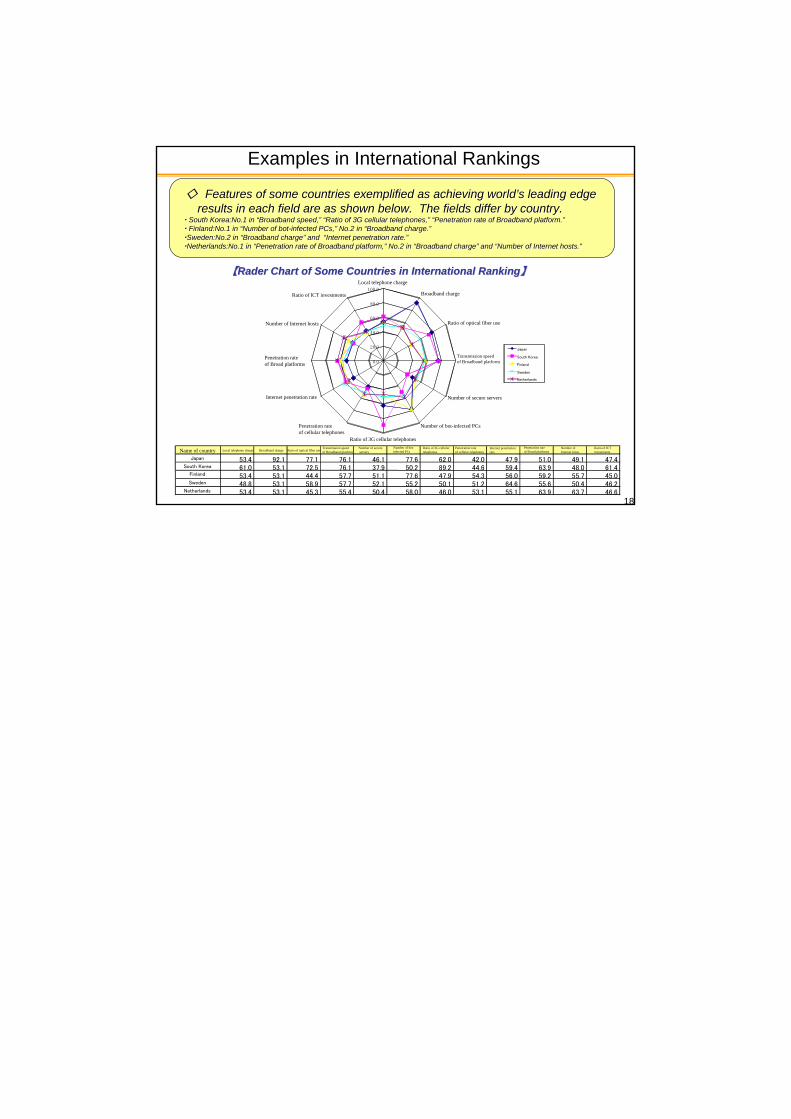
Examples in International Rankings
◇◇ Features of some countries exemplified as achieving worldFeatures of some countries exemplified as achieving world’’s leading edges leading edgeresults in each field are as shown below. The fields differ by results in each field are as shown below. The fields differ by country.country.
・・ South Korea:No.1 in South Korea:No.1 in ““Broadband speed,Broadband speed,”” ““Ratio of 3G cellular telephones,Ratio of 3G cellular telephones,”” ““Penetration rate of Broadband platform.Penetration rate of Broadband platform.””・・ Finland:No.1 in Finland:No.1 in ““Number of Number of botbot--infected PCs,infected PCs,”” No.2 in No.2 in ““Broadband charge.Broadband charge.””・・Sweden:No.2 in Sweden:No.2 in ““Broadband chargeBroadband charge”” and and ““Internet penetration rate.Internet penetration rate.””・・Netherlands:No.1 in Netherlands:No.1 in ““Penetration rate of Broadband platform,Penetration rate of Broadband platform,”” No.2No.2 in in ““Broadband chargeBroadband charge”” and and ““Number of Internet hosts.Number of Internet hosts.””
【【Rader Chart of Some Countries in International RankingRader Chart of Some Countries in International Ranking】】
Name of countryJapan 53.4 92.1 77.1 76.1 46.1 77.6 62.0 42.0 47.9 51.0 49.1 47.4
South Korea 61.0 53.1 72.5 76.1 37.9 50.2 89.2 44.6 59.4 63.9 48.0 61.4Finland 53.4 53.1 44.4 57.7 51.1 77.6 47.9 54.3 56.0 59.2 55.7 45.0Sweden 48.8 53.1 58.9 57.7 52.1 55.2 50.1 51.2 64.6 55.6 50.4 46.2
Netherlands 53.4 53.1 45.3 55.4 50.4 58.0 46.0 53.1 55.1 63.9 63.7 46.6
Local telephone charge Broadband charge Ratio of optical fiber useTransmission speedof Broadband platform
Number of secureservers
Number of bot-infected PCs
Ratio of 3G cellular telephones
Penetration rate of cellular telephones
Internet penetration rate
Penetration rateof Broad platforms
Number of Internet hosts
Ratio of ICT investments
0.0
20.0
40.0
60.0
80.0
100.0
電話基本料金
ブロードバンド料金
光ファイバー比率
ブロードバンド速度
安全なサーバ数
Bot感染PC台数
3G携帯比率
携帯電話普及率
インターネット普及率
ブロードバンド普及率
インターネットホスト数
ICT投資割合
日本
韓国
フィンランド
スウェーデン
オランダ
Local telephone charge
Broadband charge
Ratio of optical fiber use
Transmission speedof Broadband platform
Number of secure servers
Number of bot-infected PCs
Ratio of 3G cellular telephones
Penetration rate of cellular telephones
Internet penetration rate
Penetration rateof Broad platforms
Number of Internet hosts
Ratio of ICT investments
Japan
South Korea
Finland
Sweden
Netherlands
Related Documents

![ICT indicators: LIRNEasia's perspectivelirneasia.net/wp-content/uploads/2010/07/Samarajiva...ICT indicators: LIRNEasia's perspective Rohan Samarajiva ; rohan [at] lirneasia.net International](https://static.cupdf.com/doc/110x72/5f4b65d06608e07e916cd5e8/ict-indicators-lirneasias-ict-indicators-lirneasias-perspective-rohan-samarajiva.jpg)