Title Taxonomic precision of different hypervariable regions of 16S rRNA gene and annotation methods for functional bacterial groups in biological wastewater treatment Author(s) Guo, F; JU, F; Cai, L; Zhang, T Citation PLoS ONE, 2013, v. 8 n. 10, p. e76185 Issued Date 2013 URL http://hdl.handle.net/10722/215217 Rights Creative Commons: Attribution 3.0 Hong Kong License

Welcome message from author
This document is posted to help you gain knowledge. Please leave a comment to let me know what you think about it! Share it to your friends and learn new things together.
Transcript
TitleTaxonomic precision of different hypervariable regions of 16SrRNA gene and annotation methods for functional bacterialgroups in biological wastewater treatment
Author(s) Guo, F; JU, F; Cai, L; Zhang, T
Citation PLoS ONE, 2013, v. 8 n. 10, p. e76185
Issued Date 2013
URL http://hdl.handle.net/10722/215217
Rights Creative Commons: Attribution 3.0 Hong Kong License
Taxonomic Precision of Different Hypervariable Regionsof 16S rRNA Gene and Annotation Methods forFunctional Bacterial Groups in Biological WastewaterTreatmentFeng Guo, Feng Ju, Lin Cai, Tong Zhang*
Environmental Biotechnology Laboratory, The University of Hong Kong, Hong Kong SAR, China
Abstract
High throughput sequencing of 16S rRNA gene leads us into a deeper understanding on bacterial diversity for complexenvironmental samples, but introduces blurring due to the relatively low taxonomic capability of short read. For wastewatertreatment plant, only those functional bacterial genera categorized as nutrient remediators, bulk/foaming species, andpotential pathogens are significant to biological wastewater treatment and environmental impacts. Precise taxonomicassignment of these bacteria at least at genus level is important for microbial ecological research and routine wastewatertreatment monitoring. Therefore, the focus of this study was to evaluate the taxonomic precisions of different ribosomalRNA (rRNA) gene hypervariable regions generated from a mix activated sludge sample. In addition, three commonly usedclassification methods including RDP Classifier, BLAST-based best-hit annotation, and the lowest common ancestorannotation by MEGAN were evaluated by comparing their consistency. Under an unsupervised way, analysis of consistencyamong different classification methods suggests there are no hypervariable regions with good taxonomic coverage for allgenera. Taxonomic assignment based on certain regions of the 16S rRNA genes, e.g. the V1&V2 regions – provide fairlyconsistent taxonomic assignment for a relatively wide range of genera. Hence, it is recommended to use these regions forstudying functional groups in activated sludge. Moreover, the inconsistency among methods also demonstrated that aspecific method might not be suitable for identification of some bacterial genera using certain 16S rRNA gene regions. As ageneral rule, drawing conclusions based only on one sequencing region and one classification method should be avoideddue to the potential false negative results.
Citation: Guo F, Ju F, Cai L, Zhang T (2013) Taxonomic Precision of Different Hypervariable Regions of 16S rRNA Gene and Annotation Methods for FunctionalBacterial Groups in Biological Wastewater Treatment. PLoS ONE 8(10): e76185. doi:10.1371/journal.pone.0076185
Editor: Andre O. Hudson, Rochester Institute of Technology, United States of America
Received June 10, 2013; Accepted August 20, 2013; Published October 16, 2013
Copyright: � 2013 Guo et al. This is an open-access article distributed under the terms of the Creative Commons Attribution License, which permits unrestricteduse, distribution, and reproduction in any medium, provided the original author and source are credited.
Funding: This work was supported by the Hong Kong General Research Fund (7198/10E). The funders had no role in study design, data collection and analysis,decision to publish, or preparation of the manuscript.
Competing Interests: The authors have declared that no competing interests exist.
* E-mail: [email protected]
Introduction
The activated sludge process is a key process in wastewater
treatment that removes organic pollutants and nutrients (N and P)
by the action of certain bacteria. Such bacteria include hetero-
trophic organic-utilizing bacteria, ammonia oxidizing bacteria
(AOB), nitrite oxidizing bacteria (NOB), denitrifiers, polypho-
sphate accumulating organisms (PAOs), and others [1]. Many of
these bacteria perform very specific functions (like AOB and
NOB), and their activity is positively correlated with treating
efficiencies [2,3,4]. These organisms are not only crucial in
wastewater treatment plants (WWTPs), but also playing key roles
in biogeochemistry [5]. This group of bacteria will hereafter be
referred to as functional remediators. However, some other
bacteria may cause operational problems to WWTPs. These
include foaming and bulking bacteria, which may hamper solid-
liquid separation [6,7,8]. This group of bacteria will hereafter be
referred to as the operational group. In addition, the occurrence
and abundance of bacterial pathogens in activated sludge is also a
concern, since it may be highly correlated with occurrence of
pathogens in effluent discharged into receiving water [9,10,11].
Generally, the performance and environmental impacts of
WWTPs are significantly affected by the above three functional
groups Identifying them at the sufficient taxonomic level (e.g.,
genus level) is significantly important for investigations on either
microbial ecology of both full-scale plants and lab-scale reactors or
linking microbial community with sewage treatment.
During the last two decades, molecular methods have enhanced
analysis of bacterial communities and their functions in activated
sludge. Various detection methods of bacterial identification that
use the 16S rRNA gene have been developed. These include
fluorescence in situ hybridization (FISH) [12], denaturing gradient
gel electrophoresis (DGGE) [13], terminal-restriction fragment
length polymorphism (T-RFLP) [14], clone library construction
[15], quantitative PCR (qPCR) [16], and microarray [17]. Such
methods have aided in revealing invaluable knowledge of the
microbial ecology of activated sludge. However, these methods
usually target certain bacterial groups or profile communities
without much detail or resolution. For complex bacterial
communities like activated sludge, traditional molecular methods
could not provide sufficient resolution to adequately characterize
PLOS ONE | www.plosone.org 1 October 2013 | Volume 8 | Issue 10 | e76185
the bacterial community function. For example, the abundances of
AOB and NOB usually represent less than 1% of the total
bacterial population in activated sludge from full-scale WWTPs,
but they are extremely important for nitrogen removal [18].
Currently, high throughput sequencing techniques have proved
their superiority for profiling complex microbial communities
[19,20]. For engineering applications, the profiling of the
functional groups is more useful than enumerating the entire
bacterial community. Monitoring those functional bacterial groups
with high throughput sequencing may be served as routine analysis
of WWTPs components, at reduced cost and greater efficiency.
However, there are a number of limitations in analyzing 16S
rRNA by current high throughput sequencing methods such as
454 pyrosequencing and Illumina paired-end sequencing. There
are nine hypervariable regions separated by the conserved regions
across the full length 16S rRNA gene. The sequence length, i.e.
,450 bp for 454 pyrosequencing and ,200 bp for Illumina
paired-end sequencing could only cover two or three consecutive
hypervariable regions and several single regions of 16S rRNA
gene, respectively [21,22]. On one hand, a number of reports had
revealed that the selected primer sets targeting partial 16S rRNA
gene suffered from biases among taxa due to their coverage
[23,24]. On the other hand, the short read length undoubtedly
increases the uncertainty in taxonomic assignment [25]. Unfortu-
nately, most specific functional microorganisms are required to be
classified into genus level at least and the results at higher
taxonomic levels are much less meaningful for the correlation of
bacterial community and functions. Consequently it would be
valuable to study which regions may be more suitable for
identification of functional bacterial groups as precise as possible.
So far, a number of studies had evaluated the coverage the primers
for different hypervariable regions of 16S rRNA gene. Few of
them analyzed the taxonomic precision for various regions [26].
Moreover, in silico datasets usually derived from the full length
sequences are used for evaluation. These datasets may not exactly
reflect the experimental results. Also, for specific and significant
bacterial groups, such as the functional groups focused by the
present study, there is no systematic evaluation to fully check the
taxonomic precision of their partial 16S rRNA gene sequences.
In addition, the taxonomic annotation of sequences was realized
by specific classification tools. The three classification methods
commonly used in 16S rRNA gene-based prokaryotic taxonomic
analysis are Ribosomal Database Project (RDP) Classifier based on
the Bayesian algorithm, BLAST-based best-hit (BH) output that
only considers the similarity between query and reference, and
MEtaGenome ANalyzer (MEGAN) using BLAST-based lowest
common ancestor (LCA) algorithm, which cares both the
similarity between query and reference and the inconsistency of
results with close or the same similarity [27]. In some cases, these
three tools may give inconsistent results for some taxa, especially
using short reads [18,28], which will undoubtedly mislead some
judgments. Thus they should be assessed for the identification of
functional groups in activated sludge.
With an overall microbial community profiling, we recently
reported that pyrosequencing of V3V4 amplicon of 16S rRNA
gene obtained the highest bacterial diversity of a mixed AS sample
[29]. However, in this study, the same pyrosequencing data were
revisited to answer the following two questions: 1) what is the
optimal region for precise taxonomy of those functional genera in
AS samples? 2) How the biases are if using different classification
methods? Since the real bacterial community in the sample is
totally unknown, we chose to unsupervisedly compare the
classification consistency among different classification methods
to evaluate the taxonomic accuracy of different hypervariable
regions. It is well-understood that the consistently assigned results
are more likely correct. The results will be helpful not only for the
methodology of studying on microbial ecology in activated sludge
and other complex environmental samples by high throughput
sequencing, but also for routine monitoring of the functional
bacterial groups in activated sludge. More importantly, the results
will be informative to alert known biases when using pyrose-
quencing to profile the bacterial community in activated sludge or
other systems by different sequencing region or classification
methods.
Materials and Methods
List of functional groupsThe assemblage of species in each functional group was selected
based on previous reports [1,10], as shown in Table 1. Bacteria in
the remediator group include typical and well-known genera of
AOB, NOB, denitrifiers, PAOs, glycogen accumulating organisms
(GAOs) and hydrolysers. As to the bulking and foaming bacteria
group, only the formally named genera were recruited. Members
of the pathogenic group, were classified as ‘potential pathogens’,
since in many cases the 16S rRNA gene can only be used for the
identification to the genus level, while the pathogens should be
identified to the species at least. In total, the list contains 73
genera, including three multifunctional genera, Rhodococcus,
Mycobacterium and Tetrasphaera that were assigned to more than
one group. Moreover, there are three candidate genera,
‘Accumulibacter’ ‘Competibacter’ and ‘Microthrix’, which could not be
recognized by the RDP Classifier or the LCA method due to
limitation of current databases. They can only be assigned by the
BH method.
Modified Greengenes database using validatedsequences of the functional groups
Nearly full length 16S rDNA sequences (.1,250 bp and
1,444 bp in average) of all the above 73 genera were manually
downloaded from Greengenes online database [30]. After that, the
identity assigned by RDP classifier (at 80% confidence threshold
cutoff) was compared with the original Greengene assignments of
all these sequences. If the RDP results were inconsistent with the
actual identity for one sequence, the set was removed from the
downloaded dataset (about 5.1% sequences were eliminated). The
remaining sequences were added to the pre-cleaned Greengenes
database (released at May 9, 2011, totally 385,791 reference
sequences with mean length of 1,405 bp), from which the 73
genera listed in Table 1 had been removed. This was done to
produce a more comprehensive and updated database to use in the
BLAST search in this study. After removing redundancies, the
modified Greengenes database contained 415,721 sequences, with
29,930 sequences belonging to the selected functional groups
(Table 1).
Activated sludge sample preparation, pyrosequencingand data processing
FastDNAH SPIN Kit for Soil (MP Biomedicals, France) was
used to extract total DNA from the eleven activated sludge
samples [29], according to manufacturer’s instructions. We
confirm that: i) the sampling sites were not privately-owned or
protected in any way; and ii) the field studies did not involve
endangered or protected species. This kit has been found to be the
most efficient method for extracting DNA from activated sludge
[31]. Equal masses of DNA from different samples were mixed for
the following PCR amplification. The primers used in PCR and
their coverage for domain Bacteria determined by RDP ‘Probe
Variable Region Evaluation for Functional Bacteria
PLOS ONE | www.plosone.org 2 October 2013 | Volume 8 | Issue 10 | e76185
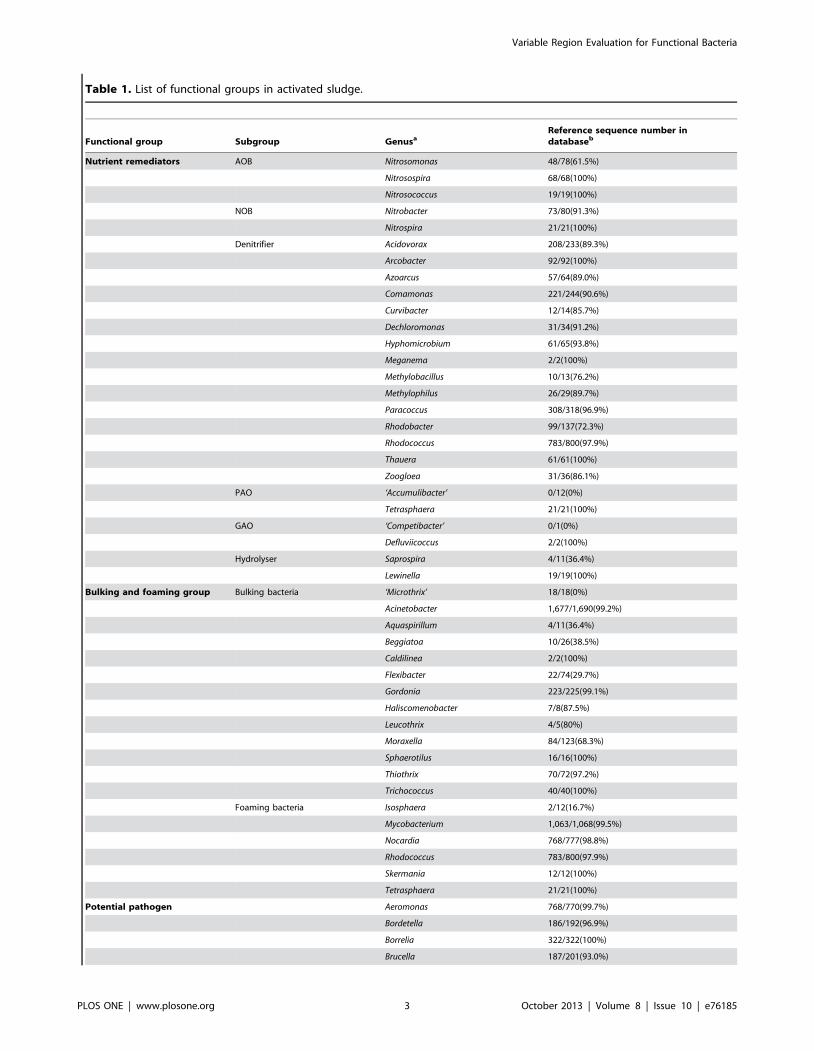
Table 1. List of functional groups in activated sludge.
Functional group Subgroup GenusaReference sequence number indatabaseb
Nutrient remediators AOB Nitrosomonas 48/78(61.5%)
Nitrosospira 68/68(100%)
Nitrosococcus 19/19(100%)
NOB Nitrobacter 73/80(91.3%)
Nitrospira 21/21(100%)
Denitrifier Acidovorax 208/233(89.3%)
Arcobacter 92/92(100%)
Azoarcus 57/64(89.0%)
Comamonas 221/244(90.6%)
Curvibacter 12/14(85.7%)
Dechloromonas 31/34(91.2%)
Hyphomicrobium 61/65(93.8%)
Meganema 2/2(100%)
Methylobacillus 10/13(76.2%)
Methylophilus 26/29(89.7%)
Paracoccus 308/318(96.9%)
Rhodobacter 99/137(72.3%)
Rhodococcus 783/800(97.9%)
Thauera 61/61(100%)
Zoogloea 31/36(86.1%)
PAO ‘Accumulibacter’ 0/12(0%)
Tetrasphaera 21/21(100%)
GAO ‘Competibacter’ 0/1(0%)
Defluviicoccus 2/2(100%)
Hydrolyser Saprospira 4/11(36.4%)
Lewinella 19/19(100%)
Bulking and foaming group Bulking bacteria ‘Microthrix’ 18/18(0%)
Acinetobacter 1,677/1,690(99.2%)
Aquaspirillum 4/11(36.4%)
Beggiatoa 10/26(38.5%)
Caldilinea 2/2(100%)
Flexibacter 22/74(29.7%)
Gordonia 223/225(99.1%)
Haliscomenobacter 7/8(87.5%)
Leucothrix 4/5(80%)
Moraxella 84/123(68.3%)
Sphaerotilus 16/16(100%)
Thiothrix 70/72(97.2%)
Trichococcus 40/40(100%)
Foaming bacteria Isosphaera 2/12(16.7%)
Mycobacterium 1,063/1,068(99.5%)
Nocardia 768/777(98.8%)
Rhodococcus 783/800(97.9%)
Skermania 12/12(100%)
Tetrasphaera 21/21(100%)
Potential pathogen Aeromonas 768/770(99.7%)
Bordetella 186/192(96.9%)
Borrelia 322/322(100%)
Brucella 187/201(93.0%)
Variable Region Evaluation for Functional Bacteria
PLOS ONE | www.plosone.org 3 October 2013 | Volume 8 | Issue 10 | e76185
Match’ were listed in Table S1 in file S1. The details for barcoded-
PCR and pyrosequencing can be found in reference [29]. We
sequenced the same amplicon from both directions. For instance,
two types of pyrotags, i.e. V12 (sequencing from V1 to V2) and
V21 (sequencing from V2 to V1) were obtained for V1&V2
regions and distinguished by the differently barcoded forward and
reverse primers. The two sub-datasets for the same amplicon
hypervariable regions were analyzed as duplications below.
After the raw reads were obtained, they were quality-checked to
remove all reads with any ambiguous bases. Then the barcodes
and primers were trimmed from the reads in RDP Pyrosequencing
Pipeline. The average sequencing length of reads (for those regions
over 400 bp) was approximately 400,430 bp, most reads could
fully cover the V1&V2 (,350 bp) and V5&V6 (,300 bp)
amplicons, but reads only partially covered the V3&V4
(440,470 bp) and V7&V8&V9 (,420 bp) amplicons. To avoid
bias caused by trimming with both primers, we trimmed the reads
of V3&V4 and V7&V8&V9 only with the single primer (at the
beginning of sequencing). Two mismatches for each primer were
allowed during trimming and only trimmed tags over certain
length (V5&V6, .200 bp; V1&V2, .250 bp; V3&V4 and
V7&V8&V9, .300 bp) were kept for further analysis. Then the
tags were further cleaned by Denoise [32] and Chimera Check
[33] using the software package of MOTHUR 1.22 [34]. After the
eight sets of cleaned pyrotags were obtained, they were randomly
normalized at the same depth of 32,000 each, except for V987 at
24,000. The raw. sff files for this study were uploaded to the
Sequence Read Archive of NCBI (SRR790735).
Evaluation of taxonomic precision of differentsequencing regions and classification methods
To evaluate taxonomic accuracies of the different variable
regions, we compared the consistency of results from three widely
used 16S-rDNA-based taxonomic assignment methods: 1) online
RDP Classifier [25], 2) BH output, and 3) MEGAN -LCA output
after BLAST against the modified Greengenes database. We
assumed that higher consistency among different methods
indicated higher precision of taxonomic assignment for that
variable region. Moreover, the more consistently classified tags
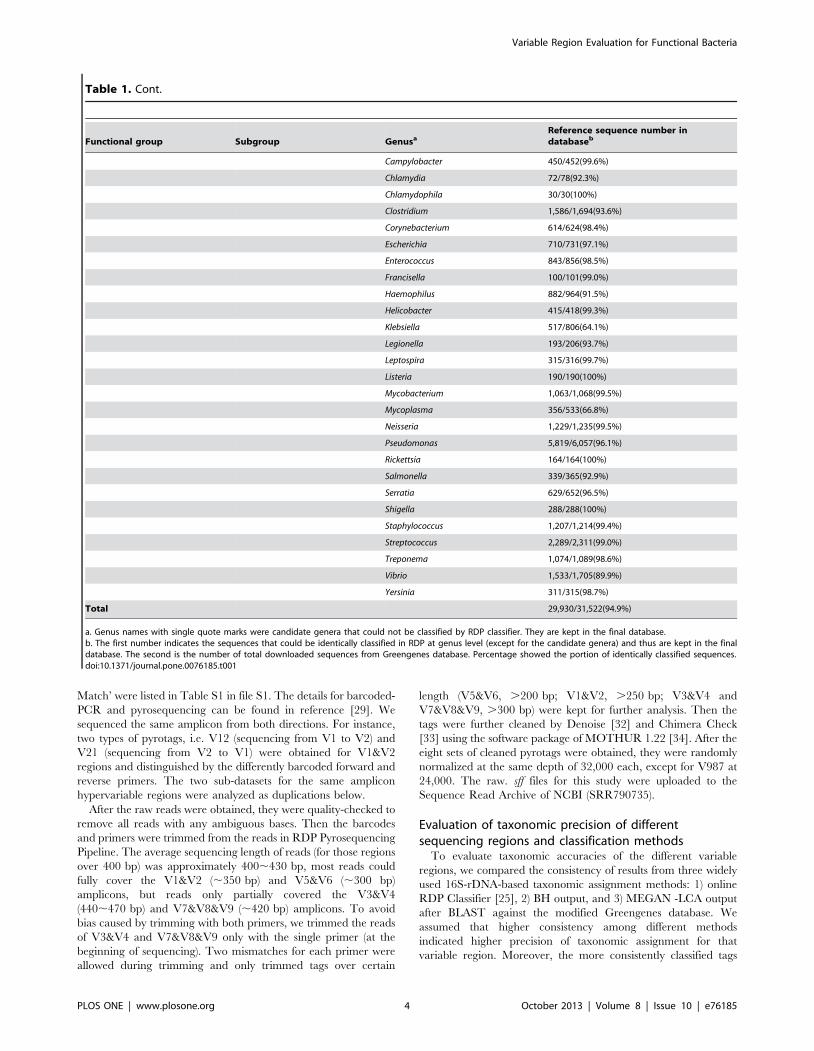
Table 1. Cont.
Functional group Subgroup GenusaReference sequence number indatabaseb
Campylobacter 450/452(99.6%)
Chlamydia 72/78(92.3%)
Chlamydophila 30/30(100%)
Clostridium 1,586/1,694(93.6%)
Corynebacterium 614/624(98.4%)
Escherichia 710/731(97.1%)
Enterococcus 843/856(98.5%)
Francisella 100/101(99.0%)
Haemophilus 882/964(91.5%)
Helicobacter 415/418(99.3%)
Klebsiella 517/806(64.1%)
Legionella 193/206(93.7%)
Leptospira 315/316(99.7%)
Listeria 190/190(100%)
Mycobacterium 1,063/1,068(99.5%)
Mycoplasma 356/533(66.8%)
Neisseria 1,229/1,235(99.5%)
Pseudomonas 5,819/6,057(96.1%)
Rickettsia 164/164(100%)
Salmonella 339/365(92.9%)
Serratia 629/652(96.5%)
Shigella 288/288(100%)
Staphylococcus 1,207/1,214(99.4%)
Streptococcus 2,289/2,311(99.0%)
Treponema 1,074/1,089(98.6%)
Vibrio 1,533/1,705(89.9%)
Yersinia 311/315(98.7%)
Total 29,930/31,522(94.9%)
a. Genus names with single quote marks were candidate genera that could not be classified by RDP classifier. They are kept in the final database.b. The first number indicates the sequences that could be identically classified in RDP at genus level (except for the candidate genera) and thus are kept in the finaldatabase. The second is the number of total downloaded sequences from Greengenes database. Percentage showed the portion of identically classified sequences.doi:10.1371/journal.pone.0076185.t001
Variable Region Evaluation for Functional Bacteria
PLOS ONE | www.plosone.org 4 October 2013 | Volume 8 | Issue 10 | e76185
suggest the higher efficiency derived from both taxonomic
capability and PCR recovery (i.e., primer coverage).
In most cases the confidence threshold for RDP classifier was set
at 80% if not mentioned. For the BLAST against the modified
Greengenes database, the expect-value (e-value) was set at 102100
and the top 50 hits were kept in the output file. The e-value was
approximately equal to 85% similarity for a 300 bp alignment
length. To filter the low similarity hits, the results were edited by
eliminating all hits with less than 95% (for LCA annotation) or
97% (for BH output) similarity. Because the IDs of the DNA
sequences from Greengenes in the BLAST output file are
Greengenes No., not names of taxa, a script was written in
Python to transform the Greengenes IDs into the lowest taxon
recorded in the modified Greengenes database. For the BH
method, a Python script was used to extract the first output line
(with the highest bit score) for each type of pyrotag, and the
abundance of all functional genera was counted by another script.
The LCA annotation by MEGAN (Version 4.70.4) was performed
using the default parameters except that ‘Min Support’ (the hit
number cutoff for output) was set at 1 instead of 5. The files
containing read names and their corresponding taxonomic names
were output at genus level for all the three methods. For each
genus and variable region, the number of pyrotags was concor-
dantly classified by all three methods, by two of the three methods,
or by only one of the methods were quantified using a Python
script.
Results
Database constructionTable 1 showed the functional groups (including remediators,
operational and pathogenic groups) of bacteria in activated sludge.
In total, 31,522 nearly full-length 16S rDNA sequences belonging
to the 73 genera were downloaded from Greengenes database,
therein 29,930 (94.9%) of them could be correctly identified by
RDP Classifier at confidence threshold of 80%. For most genera,
the eliminated sequences represented only a small portion of the
total (,10%). However, For Nitrosomonas, Beggiatoa, Klebsiella and
Mycoplasma, more than 20% were eliminated. For Saprospira,
Flexibacter, Aquaspirillum and Isosphaera, over half of the reference
sequences were eliminated.
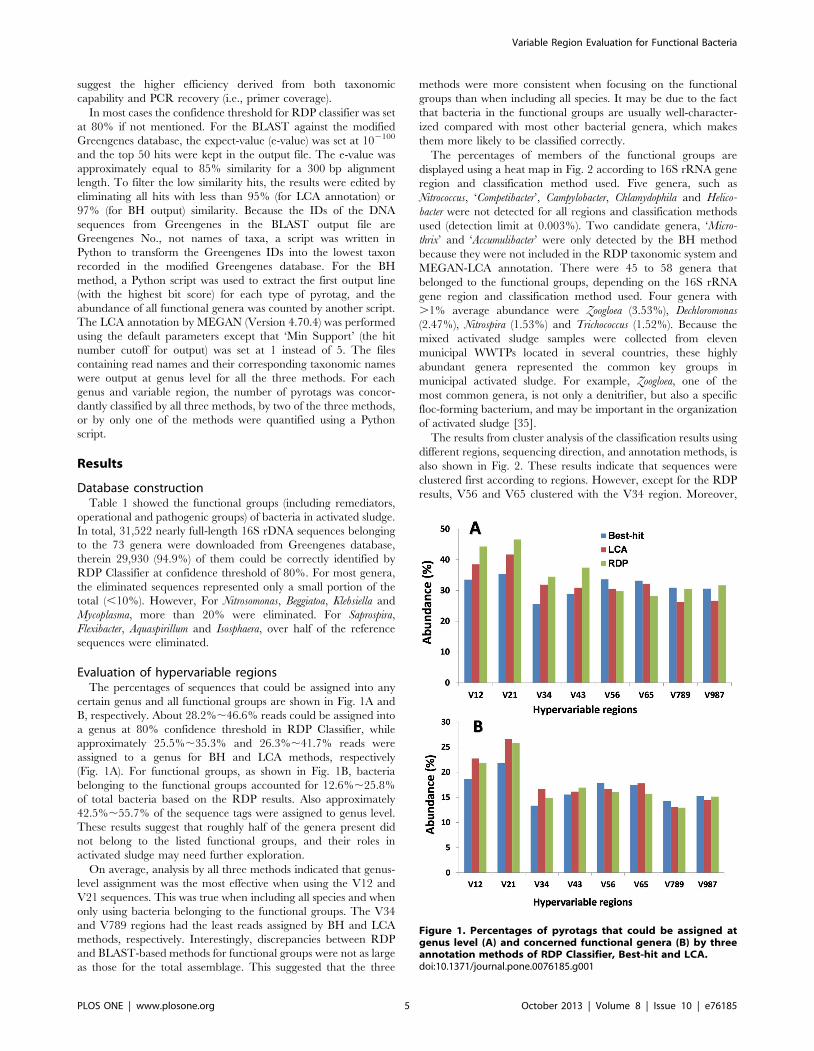
Evaluation of hypervariable regionsThe percentages of sequences that could be assigned into any
certain genus and all functional groups are shown in Fig. 1A and
B, respectively. About 28.2%,46.6% reads could be assigned into
a genus at 80% confidence threshold in RDP Classifier, while
approximately 25.5%,35.3% and 26.3%,41.7% reads were
assigned to a genus for BH and LCA methods, respectively
(Fig. 1A). For functional groups, as shown in Fig. 1B, bacteria
belonging to the functional groups accounted for 12.6%,25.8%
of total bacteria based on the RDP results. Also approximately
42.5%,55.7% of the sequence tags were assigned to genus level.
These results suggest that roughly half of the genera present did
not belong to the listed functional groups, and their roles in
activated sludge may need further exploration.
On average, analysis by all three methods indicated that genus-
level assignment was the most effective when using the V12 and
V21 sequences. This was true when including all species and when
only using bacteria belonging to the functional groups. The V34
and V789 regions had the least reads assigned by BH and LCA
methods, respectively. Interestingly, discrepancies between RDP
and BLAST-based methods for functional groups were not as large
as those for the total assemblage. This suggested that the three
methods were more consistent when focusing on the functional
groups than when including all species. It may be due to the fact
that bacteria in the functional groups are usually well-character-
ized compared with most other bacterial genera, which makes
them more likely to be classified correctly.
The percentages of members of the functional groups are
displayed using a heat map in Fig. 2 according to 16S rRNA gene
region and classification method used. Five genera, such as
Nitrococcus, ‘Competibacter’, Campylobacter, Chlamydophila and Helico-
bacter were not detected for all regions and classification methods
used (detection limit at 0.003%). Two candidate genera, ‘Micro-
thrix’ and ‘Accumulibacter’ were only detected by the BH method
because they were not included in the RDP taxonomic system and
MEGAN-LCA annotation. There were 45 to 58 genera that
belonged to the functional groups, depending on the 16S rRNA
gene region and classification method used. Four genera with
.1% average abundance were Zoogloea (3.53%), Dechloromonas
(2.47%), Nitrospira (1.53%) and Trichococcus (1.52%). Because the
mixed activated sludge samples were collected from eleven
municipal WWTPs located in several countries, these highly
abundant genera represented the common key groups in
municipal activated sludge. For example, Zoogloea, one of the
most common genera, is not only a denitrifier, but also a specific
floc-forming bacterium, and may be important in the organization
of activated sludge [35].
The results from cluster analysis of the classification results using
different regions, sequencing direction, and annotation methods, is
also shown in Fig. 2. These results indicate that sequences were
clustered first according to regions. However, except for the RDP
results, V56 and V65 clustered with the V34 region. Moreover,
Figure 1. Percentages of pyrotags that could be assigned atgenus level (A) and concerned functional genera (B) by threeannotation methods of RDP Classifier, Best-hit and LCA.doi:10.1371/journal.pone.0076185.g001
Variable Region Evaluation for Functional Bacteria
PLOS ONE | www.plosone.org 5 October 2013 | Volume 8 | Issue 10 | e76185
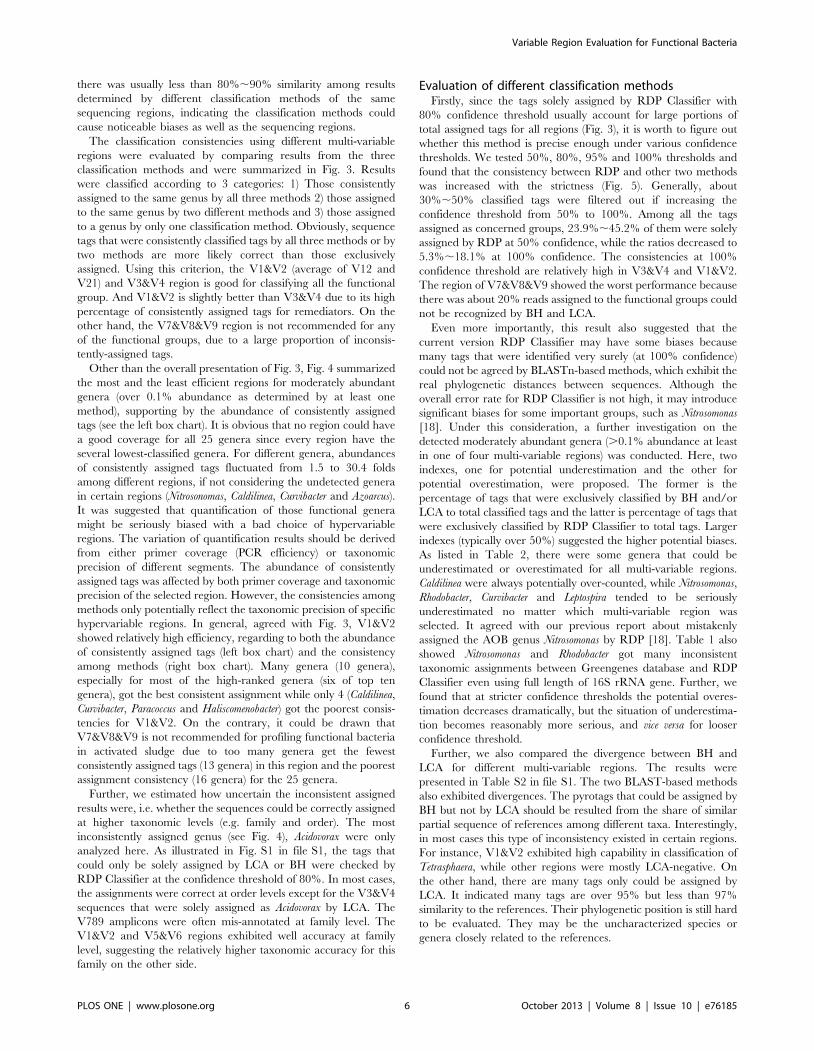
there was usually less than 80%,90% similarity among results
determined by different classification methods of the same
sequencing regions, indicating the classification methods could
cause noticeable biases as well as the sequencing regions.
The classification consistencies using different multi-variable
regions were evaluated by comparing results from the three
classification methods and were summarized in Fig. 3. Results
were classified according to 3 categories: 1) Those consistently
assigned to the same genus by all three methods 2) those assigned
to the same genus by two different methods and 3) those assigned
to a genus by only one classification method. Obviously, sequence
tags that were consistently classified tags by all three methods or by
two methods are more likely correct than those exclusively
assigned. Using this criterion, the V1&V2 (average of V12 and
V21) and V3&V4 region is good for classifying all the functional
group. And V1&V2 is slightly better than V3&V4 due to its high
percentage of consistently assigned tags for remediators. On the
other hand, the V7&V8&V9 region is not recommended for any
of the functional groups, due to a large proportion of inconsis-
tently-assigned tags.
Other than the overall presentation of Fig. 3, Fig. 4 summarized
the most and the least efficient regions for moderately abundant
genera (over 0.1% abundance as determined by at least one
method), supporting by the abundance of consistently assigned
tags (see the left box chart). It is obvious that no region could have
a good coverage for all 25 genera since every region have the
several lowest-classified genera. For different genera, abundances
of consistently assigned tags fluctuated from 1.5 to 30.4 folds
among different regions, if not considering the undetected genera
in certain regions (Nitrosonomas, Caldilinea, Curvibacter and Azoarcus).
It was suggested that quantification of those functional genera
might be seriously biased with a bad choice of hypervariable
regions. The variation of quantification results should be derived
from either primer coverage (PCR efficiency) or taxonomic
precision of different segments. The abundance of consistently
assigned tags was affected by both primer coverage and taxonomic
precision of the selected region. However, the consistencies among
methods only potentially reflect the taxonomic precision of specific
hypervariable regions. In general, agreed with Fig. 3, V1&V2
showed relatively high efficiency, regarding to both the abundance
of consistently assigned tags (left box chart) and the consistency
among methods (right box chart). Many genera (10 genera),
especially for most of the high-ranked genera (six of top ten
genera), got the best consistent assignment while only 4 (Caldilinea,
Curvibacter, Paracoccus and Haliscomenobacter) got the poorest consis-
tencies for V1&V2. On the contrary, it could be drawn that
V7&V8&V9 is not recommended for profiling functional bacteria
in activated sludge due to too many genera get the fewest
consistently assigned tags (13 genera) in this region and the poorest
assignment consistency (16 genera) for the 25 genera.
Further, we estimated how uncertain the inconsistent assigned
results were, i.e. whether the sequences could be correctly assigned
at higher taxonomic levels (e.g. family and order). The most
inconsistently assigned genus (see Fig. 4), Acidovorax were only
analyzed here. As illustrated in Fig. S1 in file S1, the tags that
could only be solely assigned by LCA or BH were checked by
RDP Classifier at the confidence threshold of 80%. In most cases,
the assignments were correct at order levels except for the V3&V4
sequences that were solely assigned as Acidovorax by LCA. The
V789 amplicons were often mis-annotated at family level. The
V1&V2 and V5&V6 regions exhibited well accuracy at family
level, suggesting the relatively higher taxonomic accuracy for this
family on the other side.
Evaluation of different classification methodsFirstly, since the tags solely assigned by RDP Classifier with
80% confidence threshold usually account for large portions of
total assigned tags for all regions (Fig. 3), it is worth to figure out
whether this method is precise enough under various confidence
thresholds. We tested 50%, 80%, 95% and 100% thresholds and
found that the consistency between RDP and other two methods
was increased with the strictness (Fig. 5). Generally, about
30%,50% classified tags were filtered out if increasing the
confidence threshold from 50% to 100%. Among all the tags
assigned as concerned groups, 23.9%,45.2% of them were solely
assigned by RDP at 50% confidence, while the ratios decreased to
5.3%,18.1% at 100% confidence. The consistencies at 100%
confidence threshold are relatively high in V3&V4 and V1&V2.
The region of V7&V8&V9 showed the worst performance because
there was about 20% reads assigned to the functional groups could
not be recognized by BH and LCA.
Even more importantly, this result also suggested that the
current version RDP Classifier may have some biases because
many tags that were identified very surely (at 100% confidence)
could not be agreed by BLASTn-based methods, which exhibit the
real phylogenetic distances between sequences. Although the
overall error rate for RDP Classifier is not high, it may introduce
significant biases for some important groups, such as Nitrosomonas
[18]. Under this consideration, a further investigation on the
detected moderately abundant genera (.0.1% abundance at least
in one of four multi-variable regions) was conducted. Here, two
indexes, one for potential underestimation and the other for
potential overestimation, were proposed. The former is the
percentage of tags that were exclusively classified by BH and/or
LCA to total classified tags and the latter is percentage of tags that
were exclusively classified by RDP Classifier to total tags. Larger
indexes (typically over 50%) suggested the higher potential biases.
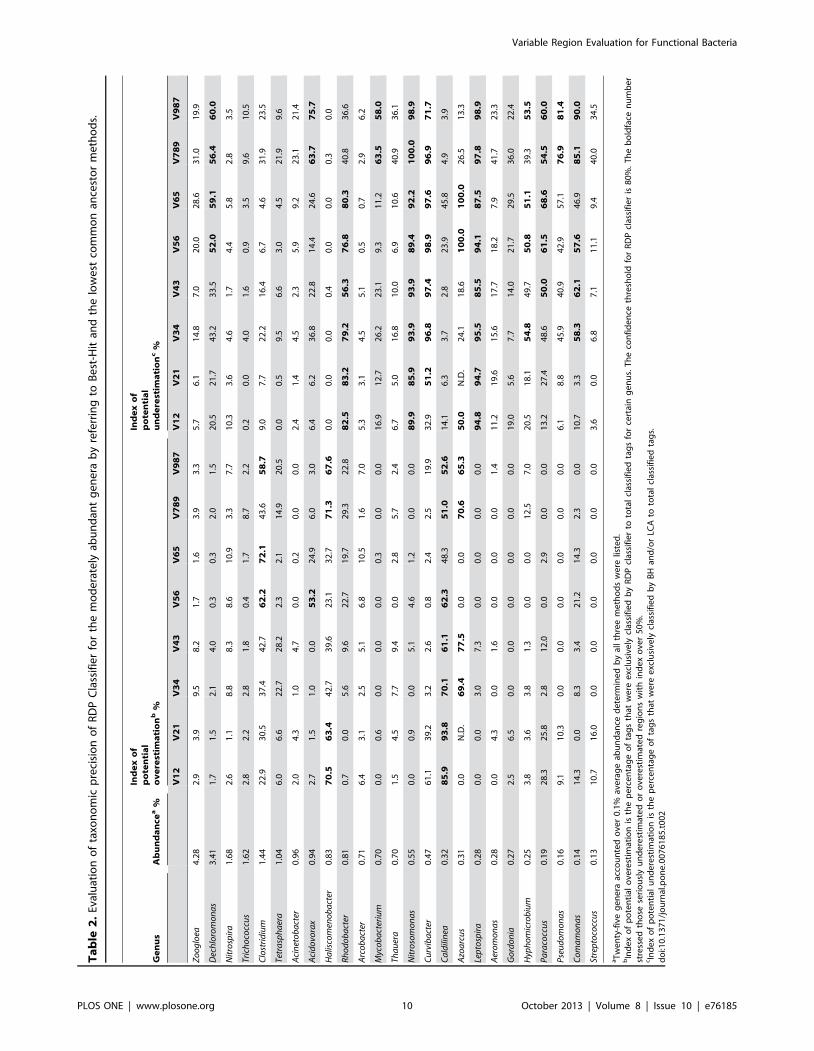
As listed in Table 2, there were some genera that could be
underestimated or overestimated for all multi-variable regions.
Caldilinea were always potentially over-counted, while Nitrosomonas,
Rhodobacter, Curvibacter and Leptospira tended to be seriously
underestimated no matter which multi-variable region was
selected. It agreed with our previous report about mistakenly
assigned the AOB genus Nitrosomonas by RDP [18]. Table 1 also
showed Nitrosomonas and Rhodobacter got many inconsistent
taxonomic assignments between Greengenes database and RDP
Classifier even using full length of 16S rRNA gene. Further, we
found that at stricter confidence thresholds the potential overes-
timation decreases dramatically, but the situation of underestima-
tion becomes reasonably more serious, and vice versa for looser
confidence threshold.
Further, we also compared the divergence between BH and
LCA for different multi-variable regions. The results were
presented in Table S2 in file S1. The two BLAST-based methods
also exhibited divergences. The pyrotags that could be assigned by
BH but not by LCA should be resulted from the share of similar
partial sequence of references among different taxa. Interestingly,
in most cases this type of inconsistency existed in certain regions.
For instance, V1&V2 exhibited high capability in classification of
Tetrasphaera, while other regions were mostly LCA-negative. On
the other hand, there are many tags only could be assigned by
LCA. It indicated many tags are over 95% but less than 97%
similarity to the references. Their phylogenetic position is still hard
to be evaluated. They may be the uncharacterized species or
genera closely related to the references.
Variable Region Evaluation for Functional Bacteria
PLOS ONE | www.plosone.org 6 October 2013 | Volume 8 | Issue 10 | e76185
Figure 2. Percentages of pyrotags identified as concerned genera for various multi-variable-regions by three methods. The clusteramong columns was based on the mean Bray-Curtis distances calculated by the percentages of each genus to total pyrotags. The outer, meddle andinner rings are corresponding to remediators, operational group and potential pathogens.doi:10.1371/journal.pone.0076185.g002
Figure 3. Agreement of pyrotags assigned as functional bacteria among RDP classifier, BH and LCA methods. The inner, middle andouter rings are corresponded to the remediators, operational groups and potential pathogens, respectively. The percentages in the pies are the ratiosof pyrotags assigned by all the three methods to total tags. Higher shared tag portions and percentage of assigned pyrotags suggested higherefficiencies of the variable regions.doi:10.1371/journal.pone.0076185.g003
Variable Region Evaluation for Functional Bacteria
PLOS ONE | www.plosone.org 7 October 2013 | Volume 8 | Issue 10 | e76185
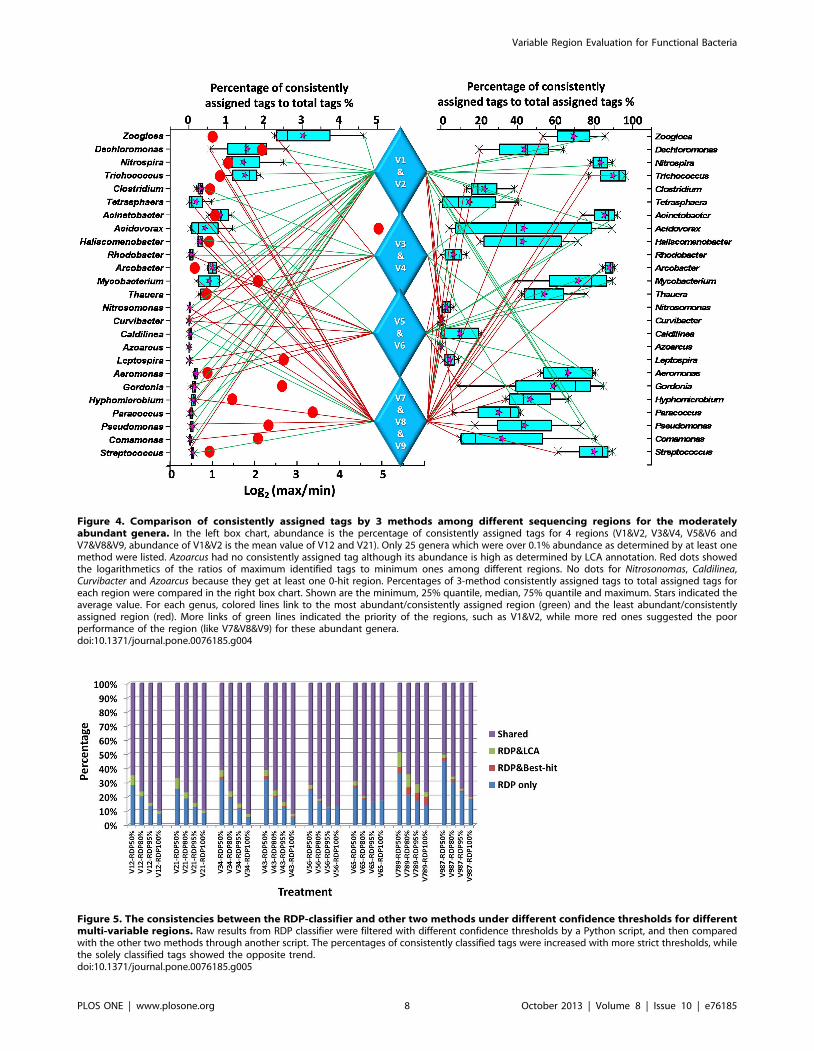
Figure 4. Comparison of consistently assigned tags by 3 methods among different sequencing regions for the moderatelyabundant genera. In the left box chart, abundance is the percentage of consistently assigned tags for 4 regions (V1&V2, V3&V4, V5&V6 andV7&V8&V9, abundance of V1&V2 is the mean value of V12 and V21). Only 25 genera which were over 0.1% abundance as determined by at least onemethod were listed. Azoarcus had no consistently assigned tag although its abundance is high as determined by LCA annotation. Red dots showedthe logarithmetics of the ratios of maximum identified tags to minimum ones among different regions. No dots for Nitrosonomas, Caldilinea,Curvibacter and Azoarcus because they get at least one 0-hit region. Percentages of 3-method consistently assigned tags to total assigned tags foreach region were compared in the right box chart. Shown are the minimum, 25% quantile, median, 75% quantile and maximum. Stars indicated theaverage value. For each genus, colored lines link to the most abundant/consistently assigned region (green) and the least abundant/consistentlyassigned region (red). More links of green lines indicated the priority of the regions, such as V1&V2, while more red ones suggested the poorperformance of the region (like V7&V8&V9) for these abundant genera.doi:10.1371/journal.pone.0076185.g004
Figure 5. The consistencies between the RDP-classifier and other two methods under different confidence thresholds for differentmulti-variable regions. Raw results from RDP classifier were filtered with different confidence thresholds by a Python script, and then comparedwith the other two methods through another script. The percentages of consistently classified tags were increased with more strict thresholds, whilethe solely classified tags showed the opposite trend.doi:10.1371/journal.pone.0076185.g005
Variable Region Evaluation for Functional Bacteria
PLOS ONE | www.plosone.org 8 October 2013 | Volume 8 | Issue 10 | e76185
Discussion
For factors affecting on bacterial consortia profiling by high
throughput sequencing, current methodological investigations
mainly focused on DNA extraction [31] and primer coverage
[29,36]. The shortages from short read length are not often
mentioned partially because the technique unprecedentedly
refined the resolution of community profile and quantitative
capability. However, in order to achieve the best taxonomic
resolution for certain groups, the selection of sequencing regions
and classification methods should be evaluated. Therefore, the real
purpose for our study is to avoid the wrong or insufficient
taxonomic assignments for those sequences that were truly
generated from certain genera as possible and to get pre-
evaluation of the potential biases for the concerned genera.
Noticeably, these biases had been luckily amended in some studies
and may be undermined in the others [18,28].
Many studies had examined the classification capability of
different variable region [23,26,37]. However, most of them
analyzed the consistency between the artificially cut partial
segments and their mother full-length sequences, which are not
really generated by PCR. More importantly, all the previously
reports targeted the overall classification without considering the
weight of those significant functional groups. Recently, a report
surveying 16S rRNA gene sequences from many environments
showed that there was no perfect primer sets to cover all the
examined sources [38]. The authors proposed that validation of
primer sets (or regions) must be pre-evaluated for specific samples.
However, besides matching of primers, obviously the different
regions of 16S rRNA gene sequences and annotation methods
have different validities for specific genera. Although our study
only focused on the highly concerned functional genera in
wastewater treatment systems, the results suggested that even for
a specific sample, it is still hard, even impossible to get unbiased
taxonomic information due to primer coverage, PCR amplifica-
tion, taxonomic precision of the various sequencing regions and
different annotation methods. To get pre-evaluated information
for the highly concerned bacterial taxa rather than sample types is
an alternative way to avoid significant biases.
For the selection of pyrosequencing region to analyze major
functional bacterial community in activated sludge, based on both
the abundance of consistently classified tags and the consistencies
among methods, V1&V2 is the preferred region and V7&V8&V9 is
the worst choice of 16S rRNA gene pyrosequencing. V1&V2 is very
suitable in length for current pyrosequencing (around 350 bp
amplicon). This primer set had been widely adopted in many
previous studies among various sample types [39,40]. Nevertheless,
we also found that several functional genera would be underesti-
mated or got the poorest taxonomic consistency in this region, such
as Caldilinea, Curvibacter, Hyphomicrobium and Streptococcus.
The result is thought to be somewhat contradictive with our
previous report that V3&V4 region is the most powerful for
bacterial diversity profiling of activated sludge [29]. Thus, it was
raised a concerning on whether there was a perfect selection of
variable regions for pyrosequencing of 16S rRNA gene for
different intentions, such as investigations on overall community or
specific groups. Our results suggested that the selection would be
never perfect even within very limited groups (genera). It also
reminded us that the classification results may be ‘fake’ or
‘blurred’. To get pre-evaluation for the most important bacteria
will be helpful for judgments.
Another interesting result is that the V1&V2 region has the
most classified pyrotags at genus-level for overall community and
functional groups. We found that the used primer set for this
region is the only one without any degenerated base. Using
degenerated base for primer will expand their coverage undoubt-
edly. However, whether it affects the quantification need further
tests.
The precision and accuracy of classification methods are highly
dependent on their databases. It should be noted that the RDP
Classifier and LCA algorithm will be very precise if their databases
are perfect since they are tree-based and supervised, respectively.
However, the Best-Hit method is only dependent on the similarity
unsupervisedly, which could hardly be consistently correct by
using a single cutoff for all bacteria. RDP classifier is very powerful
in dealing with large datasets due to its simple algorithm and the
high precision for long sequences under high confidence threshold.
Regarding to the speed, online RDP Classifier could get the
classification of the 32,000 pyrotags within a few minutes, while
several days is needed for BLAST-based methods (against
Greengenes database, with a single CPU of 2.8 G Hz). However,
the RDP might make wrong assignments for short reads [25]. In
this study, we found that RDP Classifier overestimated and/or
underestimated several genera in some regions or even all regions.
It should be highly careful to avoid drawing conclusions from the
negative results based on the absence of specific genera, which are
investigated by amplifying the inefficient region or using biased
annotation method. The false negative results were much more
misleading since significantly false positivity is hardly possible for
the complex community like activated sludge. Thus, the problem
of underestimation or even missing of certain genera using RDP
Classifier, which could only be realized and solved by applying
other methods, is more serious than overestimation. Moreover, it
was found that some genera were innately less distinguishable by
RDP Classifier no matter what regions were selected, such as
Nitrosomonas and Leptospira (see Table 2).
On the other hand, BLAST-based methods also generated
potential errors [28,41]. For taxonomic assignment of the short 16S
rDNA segments, these bugs are mainly derived from highly similar
reference sequences (at specific variable regions) that belong to
different taxa, even at genus or higher levels. The LCA algorithm
that based on the agreement of qualified ‘voters’ was invented to
solve this confuse [27]. Moreover, the reliability of BLAST-based
taxonomy elementarily relies on the accuracy and integrity of
database and suitable parameter setup. For example, the top 10%
score-cutoff (default setting) for the LCA methods in MEGAN may
require to be evaluated for the annotation on short tags.
In summary, high throughput sequencing of the segments of 16S
rRNA genes is like taking high-resolution images for microbial
community. However, current short read length that only cover a
couple of hypervariable regions may make some ‘pixels’ defective
due to PCR bias and low taxonomic precision. For studies on some
specific groups, it may introduce large and unexplainable biases
although these ‘‘pixels’’ may be insignificant in the studies about
overall microbial communities. Thus pre-evaluation is needed to
select the suitable regions and annotation methods for the
concerned specific groups. This study focusing on the highly
concerned bacterial genera in the activated sludge demonstrated an
example for the pre-evaluation on different regions and classifica-
tion methods. The results showed that there was no perfect region
for all concerning abundant functional genera, except for some
regions with less bias, i.e. V1&V2, which could be the preferred
region of functional groups in activated sludge. On the other hand,
the results also demonstrated the divergences among different
classification methods, which may cause misleading results. To
avoid drawing wrong conclusion from negative results based on only
one region or method, cross-checking using multiple regions and
Variable Region Evaluation for Functional Bacteria
PLOS ONE | www.plosone.org 9 October 2013 | Volume 8 | Issue 10 | e76185
Ta
ble
2.
Eval
uat
ion
of
taxo
no
mic
pre
cisi
on
of
RD
PC
lass
ifie
rfo
rth
em
od
era
tely
abu
nd
ant
ge
ne
rab
yre
ferr
ing
toB
est
-Hit
and
the
low
est
com
mo
nan
cest
or
me
tho
ds.
Ge
nu
sA
bu
nd
an
cea
%
Ind
ex
of
po
ten
tia
lo
ve
rest
ima
tio
nb
%
Ind
ex
of
po
ten
tia
lu
nd
ere
stim
ati
on
c%
V1
2V
21
V3
4V
43
V5
6V
65
V7
89
V9
87
V1
2V
21
V3
4V
43
V5
6V
65
V7
89
V9
87
Zo
og
loea
4.2
82
.93
.99
.58
.21
.71
.63
.93
.35
.76
.11
4.8
7.0
20
.02
8.6
31
.01
9.9
Dec
hlo
rom
on
as
3.4
11
.71
.52
.14
.00
.30
.32
.01
.52
0.5
21
.74
3.2
33
.55
2.0
59
.15
6.4
60
.0
Nit
rosp
ira
1.6
82
.61
.18
.88
.38
.61
0.9
3.3
7.7
10
.33
.64
.61
.74
.45
.82
.83
.5
Tric
ho
cocc
us
1.6
22
.82
.22
.81
.80
.41
.78
.72
.20
.20
.04
.01
.60
.93
.59
.61
0.5
Clo
stri
diu
m1
.44
22
.93
0.5
37
.44
2.7
62
.27
2.1
43
.65
8.7
9.0
7.7
22
.21
6.4
6.7
4.6
31
.92
3.5
Tetr
asp
ha
era
1.0
46
.06
.62
2.7
28
.22
.32
.11
4.9
20
.50
.00
.59
.56
.63
.04
.52
1.9
9.6
Aci
net
ob
act
er0
.96
2.0
4.3
1.0
4.7
0.0
0.2
0.0
0.0
2.4
1.4
4.5
2.3
5.9
9.2
23
.12
1.4
Aci
do
vora
x0
.94
2.7
1.5
1.0
0.0
53
.22
4.9
6.0
3.0
6.4
6.2
36
.82
2.8
14
.42
4.6
63
.77
5.7
Ha
lisco
men
ob
act
er0
.83
70
.56
3.4
42
.73
9.6
23
.13
2.7
71
.36
7.6
0.0
0.0
0.0
0.4
0.0
0.0
0.3
0.0
Rh
od
ob
act
er0
.81
0.7
0.0
5.6
9.6
22
.71
9.7
29
.32
2.8
82
.58
3.2
79
.25
6.3
76
.88
0.3
40
.83
6.6
Arc
ob
act
er0
.71
6.4
3.1
2.5
5.1
6.8
10
.51
.67
.05
.33
.14
.55
.10
.50
.72
.96
.2
Myc
ob
act
eriu
m0
.70
0.0
0.6
0.0
0.0
0.0
0.3
0.0
0.0
16
.91
2.7
26
.22
3.1
9.3
11
.26
3.5
58
.0
Tha
uer
a0
.70
1.5
4.5
7.7
9.4
0.0
2.8
5.7
2.4
6.7
5.0
16
.81
0.0
6.9
10
.64
0.9
36
.1
Nit
roso
mo
na
s0
.55
0.0
0.9
0.0
5.1
4.6
1.2
0.0
0.0
89
.98
5.9
93
.99
3.9
89
.49
2.2
10
0.0
98
.9
Cu
rvib
act
er0
.47
61
.13
9.2
3.2
2.6
0.8
2.4
2.5
19
.93
2.9
51
.29
6.8
97
.49
8.9
97
.69
6.9
71
.7
Ca
ldili
nea
0.3
28
5.9
93
.87
0.1
61
.16
2.3
48
.35
1.0
52
.61
4.1
6.3
3.7
2.8
23
.94
5.8
4.9
3.9
Azo
arc
us
0.3
10
.0N
.D.
69
.47
7.5
0.0
0.0
70
.66
5.3
50
.0N
.D.
24
.11
8.6
10
0.0
10
0.0
26
.51
3.3
Lep
tosp
ira
0.2
80
.00
.03
.07
.30
.00
.00
.00
.09
4.8
94
.79
5.5
85
.59
4.1
87
.59
7.8
98
.9
Aer
om
on
as
0.2
80
.04
.30
.01
.60
.00
.00
.01
.41
1.2
19
.61
5.6
17
.71
8.2
7.9
41
.72
3.3
Go
rdo
nia
0.2
72
.56
.50
.00
.00
.00
.00
.00
.01
9.0
5.6
7.7
14
.02
1.7
29
.53
6.0
22
.4
Hyp
ho
mic
rob
ium
0.2
53
.83
.63
.81
.30
.00
.01
2.5
7.0
20
.51
8.1
54
.84
9.7
50
.85
1.1
39
.35
3.5
Pa
raco
ccu
s0
.19
28
.32
5.8
2.8
12
.00
.02
.90
.00
.01
3.2
27
.44
8.6
50
.06
1.5
68
.65
4.5
60
.0
Pse
ud
om
on
as
0.1
69
.11
0.3
0.0
0.0
0.0
0.0
0.0
0.0
6.1
8.8
45
.94
0.9
42
.95
7.1
76
.98
1.4
Co
ma
mo
na
s0
.14
14
.30
.08
.33
.42
1.2
14
.32
.30
.01
0.7
3.3
58
.36
2.1
57
.64
6.9
85
.19
0.0
Stre
pto
cocc
us
0.1
31
0.7
16
.00
.00
.00
.00
.00
.00
.03
.60
.06
.87
.11
1.1
9.4
40
.03
4.5
aT
we
nty
-fiv
eg
en
era
acco
un
ted
ove
r0
.1%
ave
rag
eab
un
dan
ced
ete
rmin
ed
by
all
thre
em
eth
od
sw
ere
liste
d.
bIn
de
xo
fp
ote
nti
alo
vere
stim
atio
nis
the
pe
rce
nta
ge
of
tag
sth
atw
ere
exc
lusi
vely
clas
sifi
ed
by
RD
Pcl
assi
fie
rto
tota
lcl
assi
fie
dta
gs
for
cert
ain
ge
nu
s.T
he
con
fid
en
ceth
resh
old
for
RD
Pcl
assi
fie
ris
80
%.
Th
eb
old
face
nu
mb
er
stre
sse
dth
ose
seri
ou
sly
un
de
rest
imat
ed
or
ove
rest
imat
ed
reg
ion
sw
ith
ind
ex
ove
r5
0%
.cIn
de
xo
fp
ote
nti
alu
nd
ere
stim
atio
nis
the
pe
rce
nta
ge
of
tag
sth
atw
ere
exc
lusi
vely
clas
sifi
ed
by
BH
and
/or
LCA
toto
tal
clas
sifi
ed
tag
s.d
oi:1
0.1
37
1/j
ou
rnal
.po
ne
.00
76
18
5.t
00
2
Variable Region Evaluation for Functional Bacteria
PLOS ONE | www.plosone.org 10 October 2013 | Volume 8 | Issue 10 | e76185
annotation methods should be proposed for taxonomic assignment
of pyrosequences of short 16S rRNA gene amplicons.
Supporting Information
File S1 File containing Figure S1, Tables S1 and S2.Figure S1. Accuracies at family and order levels for the tags that
solely assigned as Acidovorax by LCA (A) or BH (B) of different
regions. The tags were extracted and then checked with RDP
Classifier at confidence thresholds of 80%. The RDP results of
Comamonadaceae at family level and Burkholderiales at order level were
cataloged as accurate assignments. The V12 amplicons had no tag
that was solely assigned by BH.
(DOCX)
Acknowledgments
We would like to thank the Hong Kong General Research Fund (7198/
10E). Dr. Feng Guo and Lin Cai want to thank the University of Hong
Kong for the postdoctoral fellowship. Mr. Feng Ju wished to thank the
University of Hong Kong for the postgraduate studentship.
Author Contributions
Conceived and designed the experiments: FG TZ. Performed the
experiments: FG LC. Analyzed the data: FG FJ TZ. Contributed
reagents/materials/analysis tools: FG FJ TZ. Wrote the paper: FG FJ
LC TZ.
References
1. Seviour RJ, Nielsen PH (2010) Microbial communities in activated sludge plants.
In: Seviour RJ, Nielsen PH, editors. Microbial Ecology of Activated Sludge.London: IWA Publishing. pp. 95–126.
2. Seviour RJ, Mino T, Onuki M (2003) The microbiology of biological
phosphorus removal in activated sludge systems. FEMS Microbiology Reviews27(1): 99–127.
3. Yang Q, Peng YZ, Liu XH, Zeng W, Mino T, et al. (2007) Nitrogen removal vianitrite from municipal wastewater at low temperatures using real-time control to
optimize nitrifying communities. Environmental Science & Technology 41(23):
8159–8164.4. Zhang T, Ye L, Tong AHY, Shao MF, Lok S (2011) Ammonia-oxidizing Archaea
and Ammonia-oxidizing Bacteria in six full-scale wastewater treatment bioreac-tors. Applied Microbiology and Biotechnology 91(4): 1212–1225.
5. Daims H, Michael WT, Wagner M (2006) Wastewater treatment: a modelsystem for microbial ecology. Trends in Biotechnology 24(11): 483–489.
6. Soddell JA, Seviour RJ (1990) Microbiology of foaming in activated-sludge
plants. Journal of Applied Bacteriology 68(2): 145–176.7. Martins AMP, Pagilla K, Heijnen JJ, van Loosdrecht MCM (2004) Filamentous
bulking sludge – a critical review. Water Research 38(4): 793–817.8. Guo F, Zhang T (2012) Profiling bulking and foaming bacteria in activated
sludge by high throughput sequencing. Water Research 46(8): 2772–2782.
9. Chen LH, Xiong ZH, Sun LL, Yang J, Jin Q (2012). VFDB 2012 update:toward the genetic diversity and molecular evolution of bacterial virulence
factors. Nucleic Acids Research 40: 641–645.10. Ye L, Zhang T (2011) Pathogenic bacteria in sewage treatment plants as
revealed by 454 pyrosequencing. Environmental Science & Technology 45(17),
7173–7179.11. Redman JA, Grant SB, Olson TM, Estes MK (2001) Pathogen filtration,
heterogeneity, and the potable reuse of wastewater. Environmental Science &Technology 35(9): 1798–1805.
12. Wagner M, Amann R, Lemmer H, Schleifer K (1993) Probing activated sludgewith oligonucleotides specific for proteobacteria: Inadequacy of culture-
dependent methods for describing microbial community structure. Applied
Environmental Microbiology 59: 1520–1525.13. Muyzer G, Dewaal EC, Uitterlinden AG (1993) Profiling of complex microbial-
populations by denaturing gradient gel-electrophoresis analysis of polymerasechain reaction-amplified genes coding for 16S ribosomal RNA. Applied
Environmental Microbiology, 59(3): 695–700.
14. Liu WT, Marsh TL, Cheng H, Forney LJ (1997) Characterization of microbialdiversity by determining terminal restriction fragment length polymorphisms of
genes encoding 16S rRNA. Applied Environmental Microbiology, 63(11): 4516–4522.
15. Zhang T, Jin T, Yan Q, Shao M, Wells G, et al. (2009) Occurrence of ammonia-oxidizing Archaea in activated sludges of a laboratory scale reactor and two
wastewater treatment plants. Journal of Applied Microbiology, 107: 970–977.
16. Zhang T, Fang HHP (2006) Applications of real-time polymerase chain reactionfor quantification of microorganisms in environmental samples. Applied
Microbiology and Biotechnology, 70: 281–289.17. Xia SQ, Duan LA, Song YH, Li JX, Piceno YM, et al. (2010). Bacterial
community structure in geographically distributed biological wastewater
treatment reactors. Environmental Science and Technology 44: 7391–7396.18. Ye L, Shao MF, Zhang T, Tong AHY, Lok S (2011) Analysis of the bacterial
community in a laboratory-scale nitrification reactor and a wastewater treatmentplant by high-throughput pyrosequencing. Water Research 45(15): 4390–4398.
19. Hamady M, Lozupone C, Knight R (2010) Fast UniFrac: facilitating high-throughput phylogenetic analyses of microbial communities including analysis of
pyrosequencing and PhyloChip data. ISME Journal 4(1): 17–27.
20. Zhang T, Shao MF, Ye L (2012) 454 Pyrosequencing reveals bacterial diversityof activated sludge from 14 sewage treatment plants. ISME Journal. 6(6):1137–
1147.21. Kircher M, Kelso J (2010) High-throughput DNA sequencing-concepts and
limitations. Bioessays 32(6): 524–536.
22. Bartram AK, Lynch MDJ, Sterns JC, Moreno-Hagelsieb G, Neufeld JD (2011)Generation of multimillion-sequence 16S rRNA gene libraries from complex
microbial communities by assembling paired-end Illumina reads. Applied and
Environmental Microbiology 77(11): 3846–3852.
23. Kumar PS, Brooker MR, Dowd SE, Camerlengo T (2011) Target region
selection is a critical determinant of community fingerprints generated by 16S
Pyrosequencing. PLoS ONE 6(6): e20956.
24. Wang Y, Qian PY (2009) Conservative fragments in bacterial 16S rRNA genes
and primer design for 16S ribosomal DNA amplicons in metagenomic studies.
PLoS ONE 4(10): e7401.
25. Wang Q, Garrity GM, Tiedje JM, Cole JR (2007) Naive Bayesian classification
for rapid assignment of rRNA sequences into the new bacterial taxonomy.
Applied and Environmental Microbiology 73(16): 5261–5267.
26. Liu ZZ, DeSantis TZ, Andersen GL, Knight R (2008) Accurate taxonomy
assignments from 16S rRNA sequences produced by highly parallel pyrose-
quencers. Nucleic Acids Research 36(18): e120.
27. Huson DH, Auch AF, Qi J, Schuster SC (2007) MEGAN analysis of
metagenomic data. Genome Research 17(3): 377–386.
28. Kan JJ, Clingenpeel S, Macur RE, Inskeep WP, Lovalvo D, et al. (2011)Archaea in Yellowstone Lake. ISME Journal 5(11): 1784–1795.
29. Cai L, Ye L, Tong AHY, Lok S, Zhang T (2013) Biased diversity metrics
revealed by bacterial 16S pyrotags derived from different primer sets. PLoSONE 8(1): e54649. doi:10.1371/journal.pone.0053649.
30. DeSantis TZ, Hugenholtz P, Larsen N, Rojas M, Brodie EL, et al. (2006)Greengenes, a chimera-checked 16S rRNA gene database and workbench
compatible with ARB. Applied and Environmental Microbiology, 72(7): 5069–
5072.
31. Guo F, Zhang T (2013) Biases during DNA extraction of activated sludge
samples revealed by high throughput sequencing. Applied Microbiology and
Biotechnology: DOI 10.1007/s00253-012-4244-4.
32. Huse SM, Welch DM, Morrison HG, Sogin ML (2010) Ironing out the
wringkles in the rare biosphere through improved OTU clustering. Environ-
mental microbiology 12: 1889–1898.
33. Haas BJ, Gevers D, Earl AM, Feldgarden M, Ward DV, et al. (2011) Chimeric
16S rRNA sequence formation and detection in Sanger and 454-pyrosequenced
PCR amplicons. Genome Research 21: 494–504.
34. Schloss PD, Westcott SL, Ryabin T, Hall JR, Hartmann M, et al. (2009)
Introducing mothur: Open-source, platform-independent, community-support-
ed software for describing and comparing microbial communities. Applied andEnvironmental Microbiology 75: 7537–7541.
35. McKinney RE, Weichlein RG (1953) Isolation of floc-producing bacteria from
activated sludge. Applied and Environmental Microbiology 1(5): 259–261.
36. Claesson MJ, Wang QO, O’Sullivan O, Greene-Diniz R, Cole JR, et al. (2010)
Comparison of two next-generation sequencing technologies for resolving highly
complex microbiota composition using tandem variable 16S rRNA gene regions.Nucleic Acids Research 38(22): e200.
37. Vasileiadis S, Puglisi E, Arena M, Cappa F, Cocconcelli PS, et al. (2012) Soilbacterial diversity screening using single 16S rRNA gene V regions coupled with
multi-million read generating sequencing technologies. PLoS ONE 7(8): e42671.
38. Soergel DAW, Dey N, Knight R, Brenner SE (2012) Selection of primers foroptimal taxonomic classification of environmental 16S rRNA gene sequences.
ISME Journal 6(7): 1440–1444.
39. Engelbrektson A, Kunin V, Wrighton KC, Zvenigorodsky N, Chen F, et al.(2010) Experimental factors affected PCR-based estimates of microbial species
richness and evenness. ISME Journal 4(5): 642–646.
40. Hamady M, Walker JJ, Harris JK, Gold NJ, Knight R (2008) Error-correctingbarcoded primer for pyrosequencing hundreds of samples in multiplex. Nature
Methods 5: 235–237.
41. Tripp HJ, Hewson I, Boyarsky S, Stuart JM, Zehr JP (2011) Misannotations ofrRNA can now generated 90% false positive protein matches in metatran-
scriptomic studies. Nucleic Acids Research 39(20): 8792–8802.
Variable Region Evaluation for Functional Bacteria
PLOS ONE | www.plosone.org 11 October 2013 | Volume 8 | Issue 10 | e76185
Related Documents


![SoftwareVITCOMIC: visualization tool for taxonomic ... · Bacteria and Archaea, mosaic structures of highly con-served regions and variable regions [6,7], and little possi-bility](https://static.cupdf.com/doc/110x72/5f43005a95b55a7de2477d19/softwarevitcomic-visualization-tool-for-taxonomic-bacteria-and-archaea-mosaic.jpg)


![Untitled-1 [] · taxonomic characters. Zoological Nomenclature, origin of code, ICZN. UNIT V : Taxonomic Records And Publications Taxonomic keys, Taxonomic characters description,](https://static.cupdf.com/doc/110x72/5e60819b810ee55ab507dd7d/untitled-1-taxonomic-characters-zoological-nomenclature-origin-of-code-iczn.jpg)