SWE 423: Multimedia Systems Chapter 4: Graphics and Images (2)

SWE 423: Multimedia Systems Chapter 4: Graphics and Images (2)
Dec 19, 2015
Welcome message from author
This document is posted to help you gain knowledge. Please leave a comment to let me know what you think about it! Share it to your friends and learn new things together.
Transcript
SWE 423: Multimedia Systems
Chapter 4: Graphics and Images (2)
Outline• Will discuss the human visual system and our
perception of color• Covered from Chapter 3 of Multimedia
Signals and Systems– Sections 3.1 and 3.2 concerning the human visual
system are assigned as a reading assignment, in which a reading quiz will be conducted on Monday 30 October 2006.
– Color Models (Sections 3.3, 3.3.1...3.3.4)– More Color Models and Transformation of
Primaries (Section 3.3.5)
Color Representation
• Although we can differentiate a hundred different grey-levels, we can easily differentiate thousands of colors
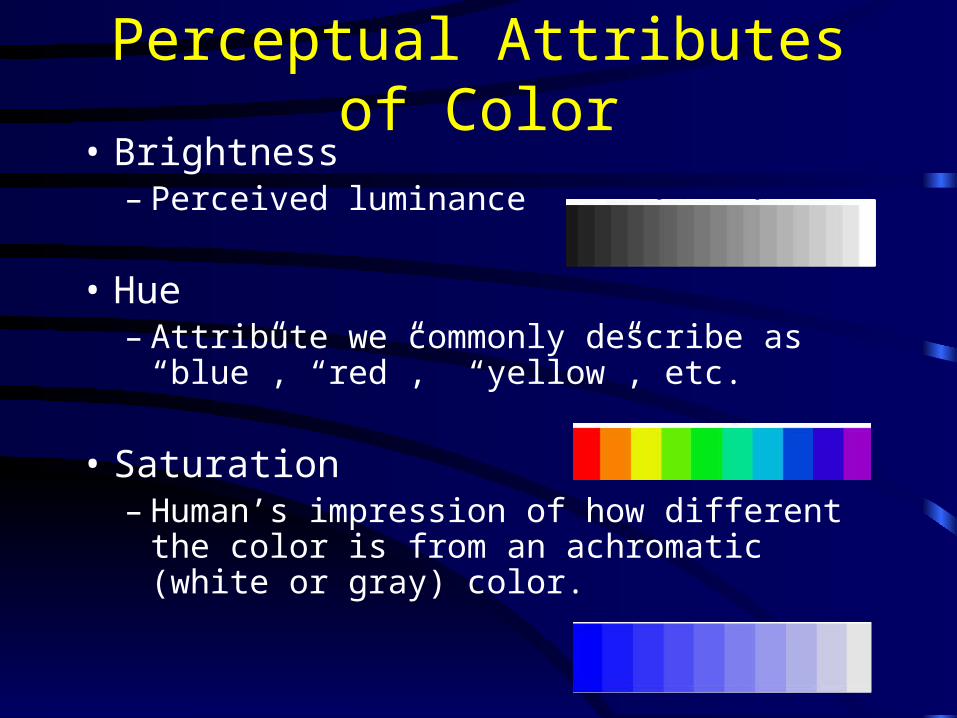
Perceptual Attributes of Color• Brightness
– Perceived luminance
• Hue– Attribute we commonly describe as “blue”,
“red”, “yellow”, etc.
• Saturation– Human’s impression of how different the color
is from an achromatic (white or gray) color.
Hue
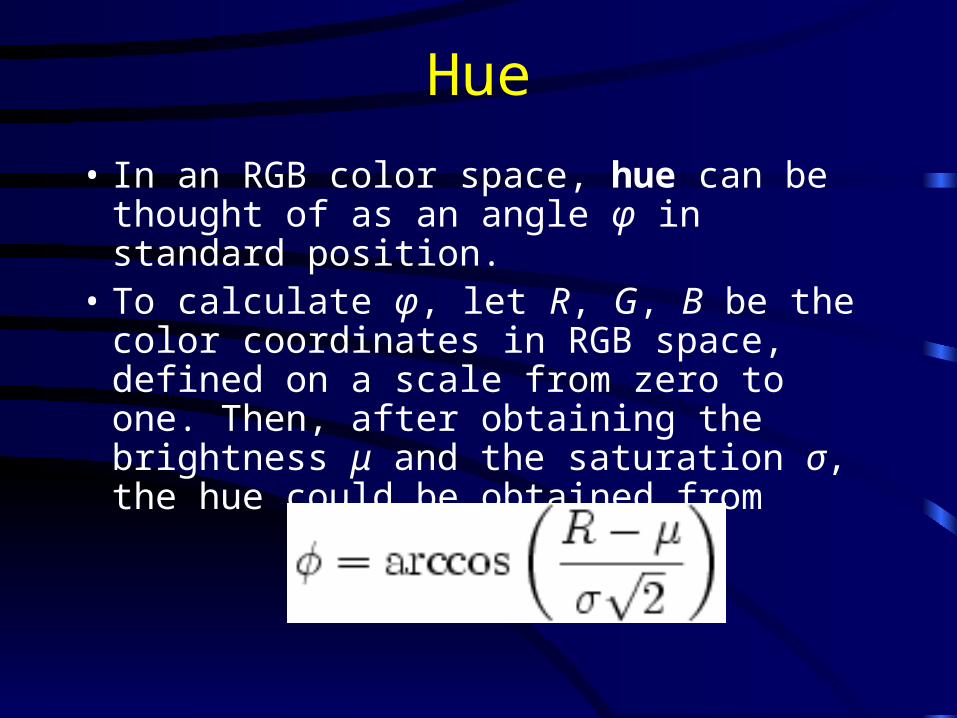
• In an RGB color space, hue can be thought of as an angle φ in standard position.
• To calculate φ, let R, G, B be the color coordinates in RGB space, defined on a scale from zero to one. Then, after obtaining the brightness μ and the saturation σ, the hue could be obtained from
Saturation
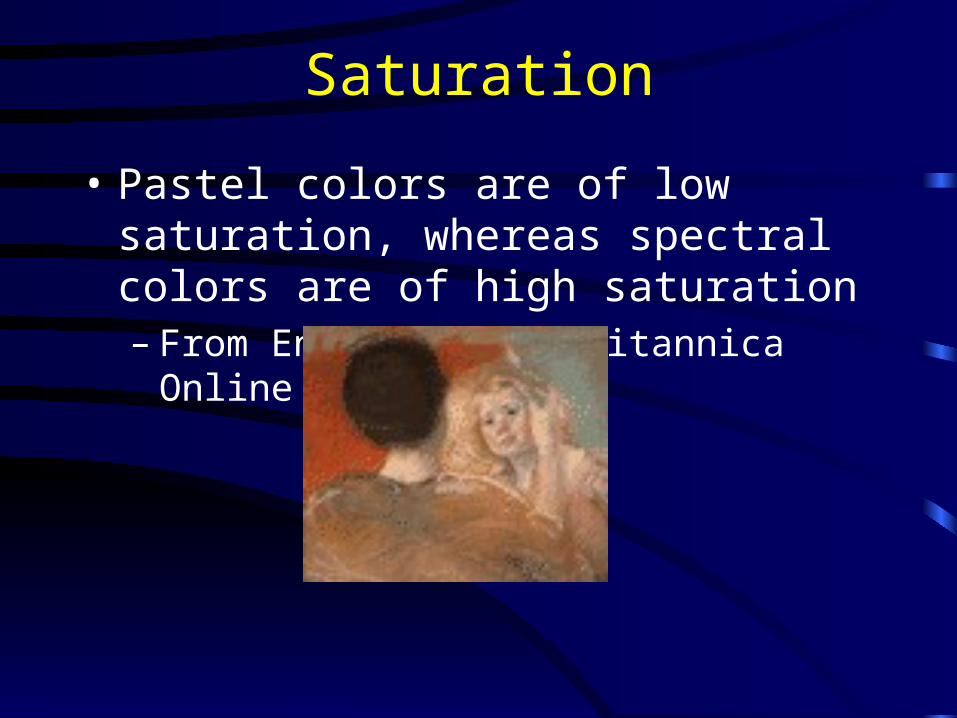
• Pastel colors are of low saturation, whereas spectral colors are of high saturation– From Encyclopedia Britannica Online
Saturation
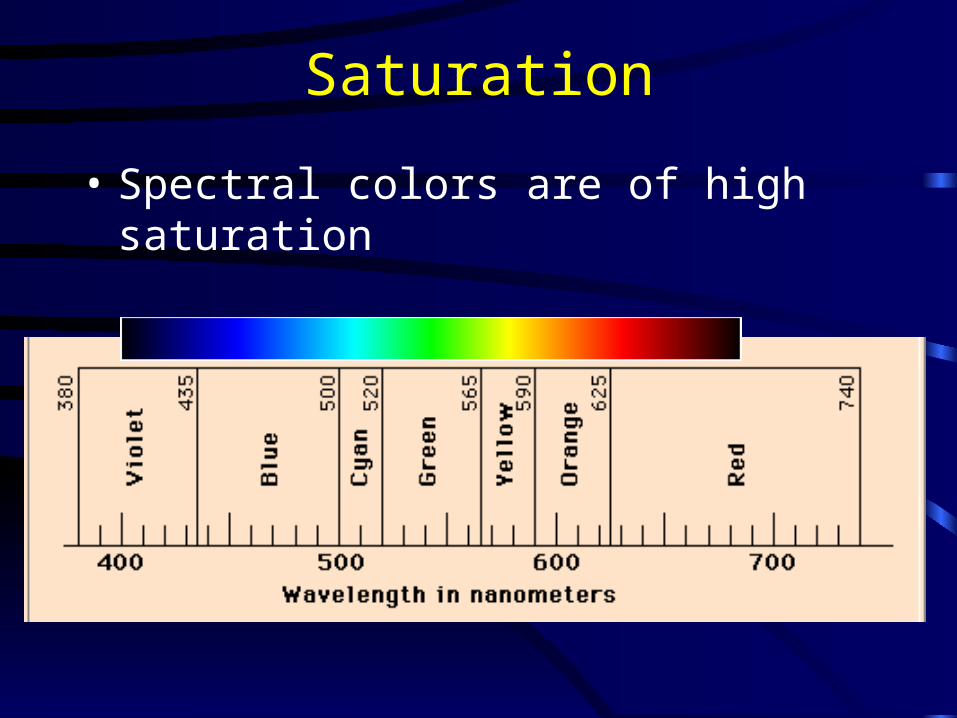
• Spectral colors are of high saturation
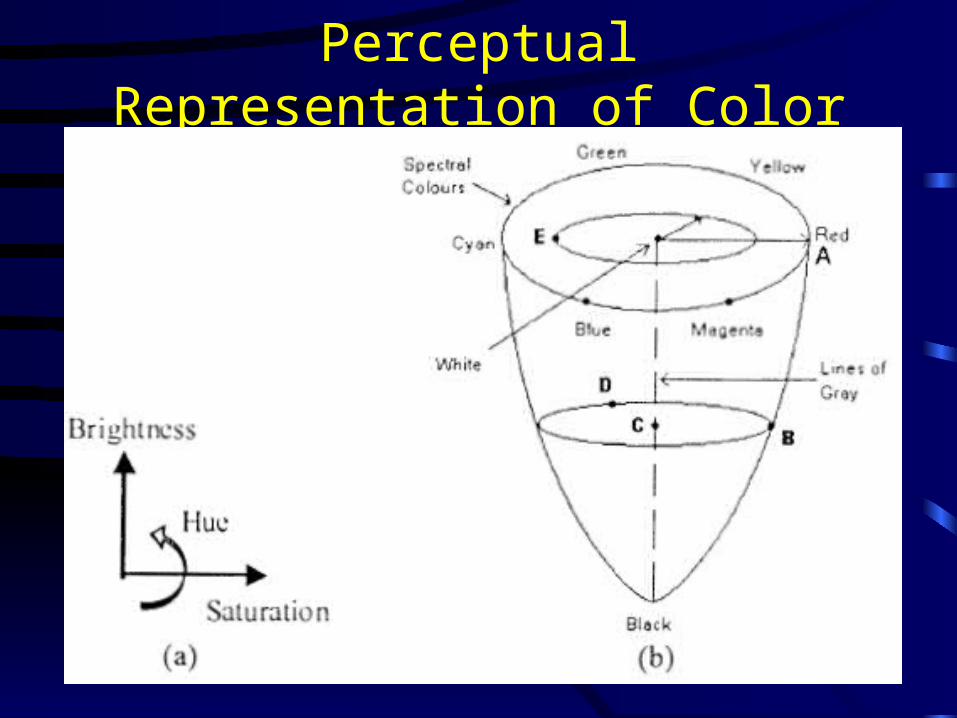
Perceptual Representation of Color
Three-Receptor Model
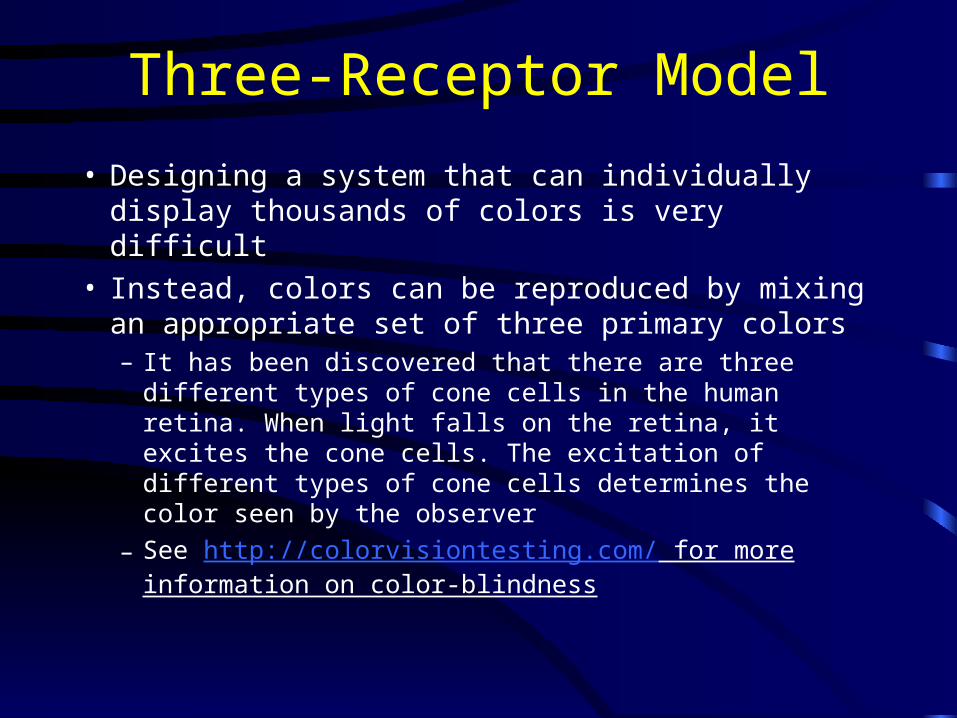
• Designing a system that can individually display thousands of colors is very difficult
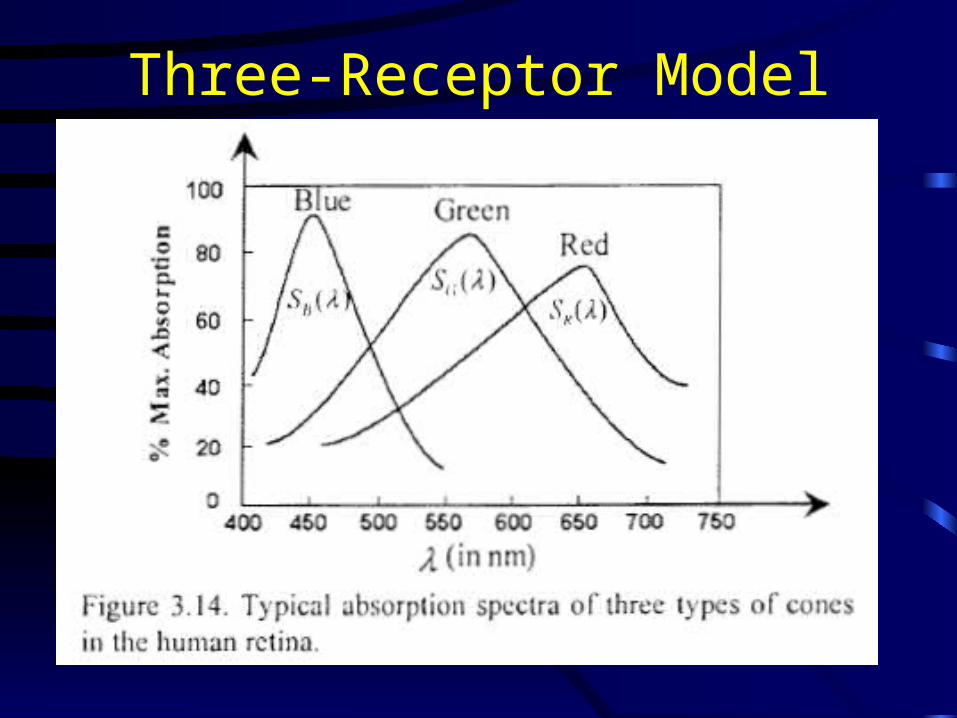
• Instead, colors can be reproduced by mixing an appropriate set of three primary colors– It has been discovered that there are three different
types of cone cells in the human retina. When light falls on the retina, it excites the cone cells. The excitation of different types of cone cells determines the color seen by the observer
– See http://colorvisiontesting.com/ for more information on color-blindness
Three-Receptor Model
Three-Receptor Model
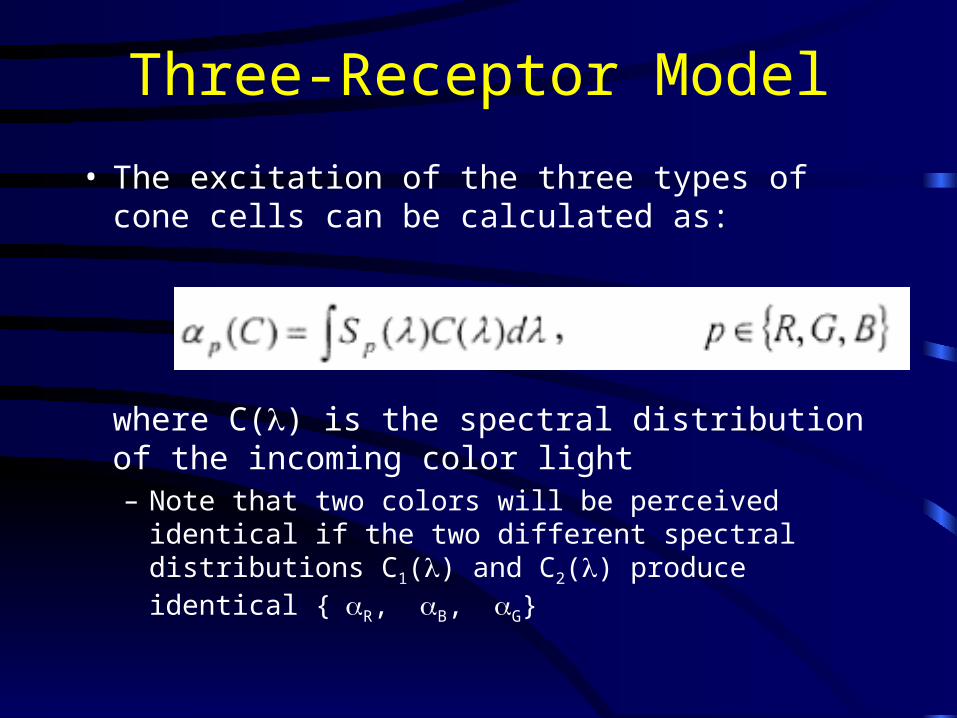
• The excitation of the three types of cone cells can be calculated as:
where C() is the spectral distribution of the incoming color light– Note that two colors will be perceived identical if the
two different spectral distributions C1() and C2() produce identical {R, B, G}
Color Matching
• The science of color measurement is known as colorimetry.
• Some laws for color matching– Any color can be matched by mixing at most three
colored lights– The luminance of a color mixture = sum of the
luminance of its components– Color Addition: If colors A & B match with colors C &
D, respectively, then color (A+B) matches color (C+D).– Color Subtraction: If color (A+B) matches color
(C+D), and color A matches color C, then color B matches color D.
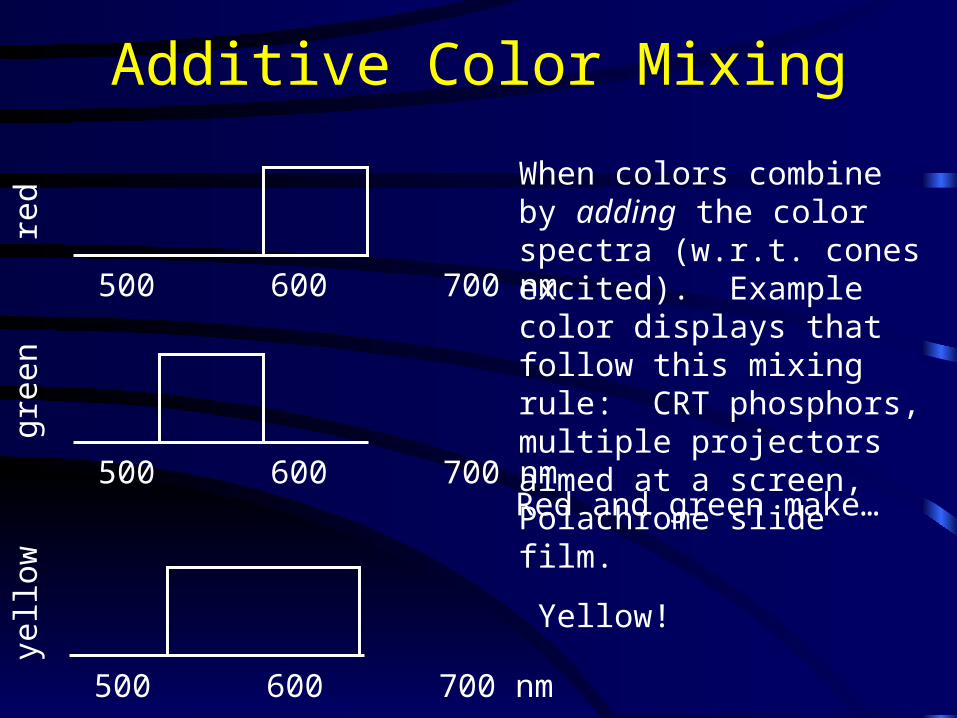
Additive Color Mixing
400 500 600 700 nm
400 500 600 700 nm
red
gree
n
Red and green make…
400 500 600 700 nm
yell
ow
Yellow!
When colors combine by adding the color spectra (w.r.t. cones excited). Example color displays that follow this mixing rule: CRT phosphors, multiple projectors aimed at a screen, Polachrome slide film.
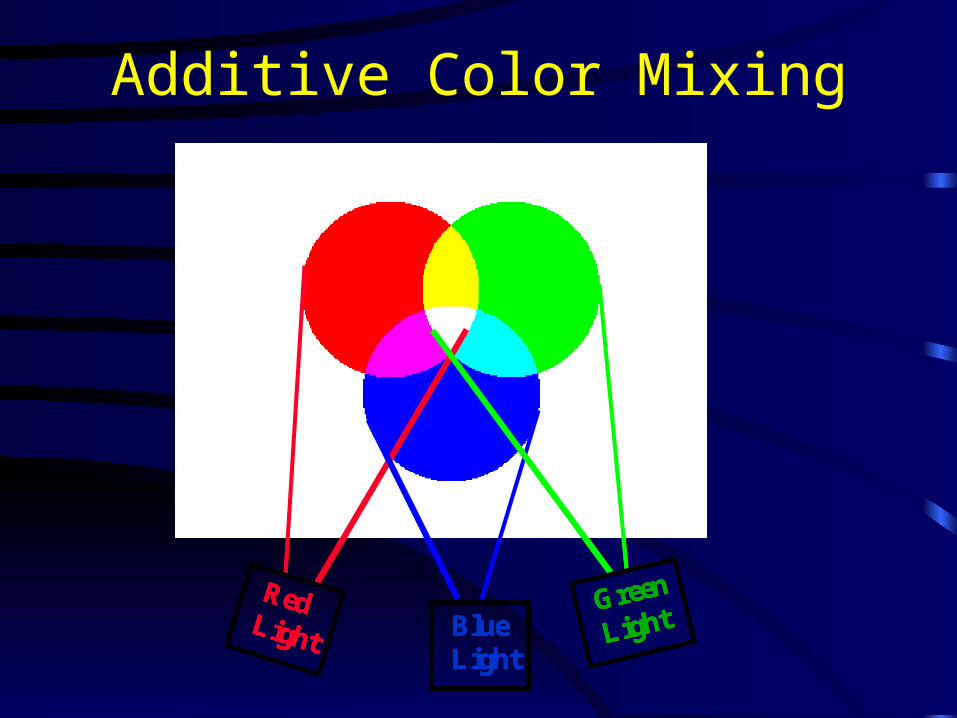
Additive Color Mixing
BlueLight
Green
LightBlueLightBlueLight
Green
LightGreen
Light
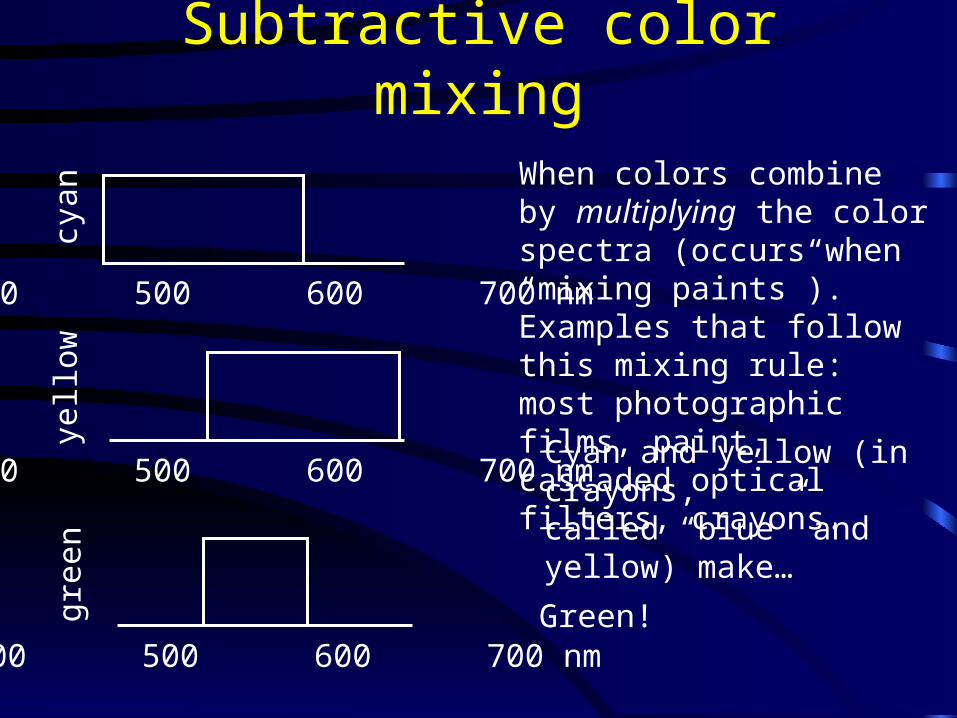
Subtractive color mixing
When colors combine by multiplying the color spectra (occurs when “mixing paints”). Examples that follow this mixing rule: most photographic films, paint, cascaded optical filters, crayons.
400 500 600 700 nm
cyan
yell
ow
400 500 600 700 nm
Cyan and yellow (in crayons,called “blue” and yellow) make…
400 500 600 700 nmGreen!gr
een
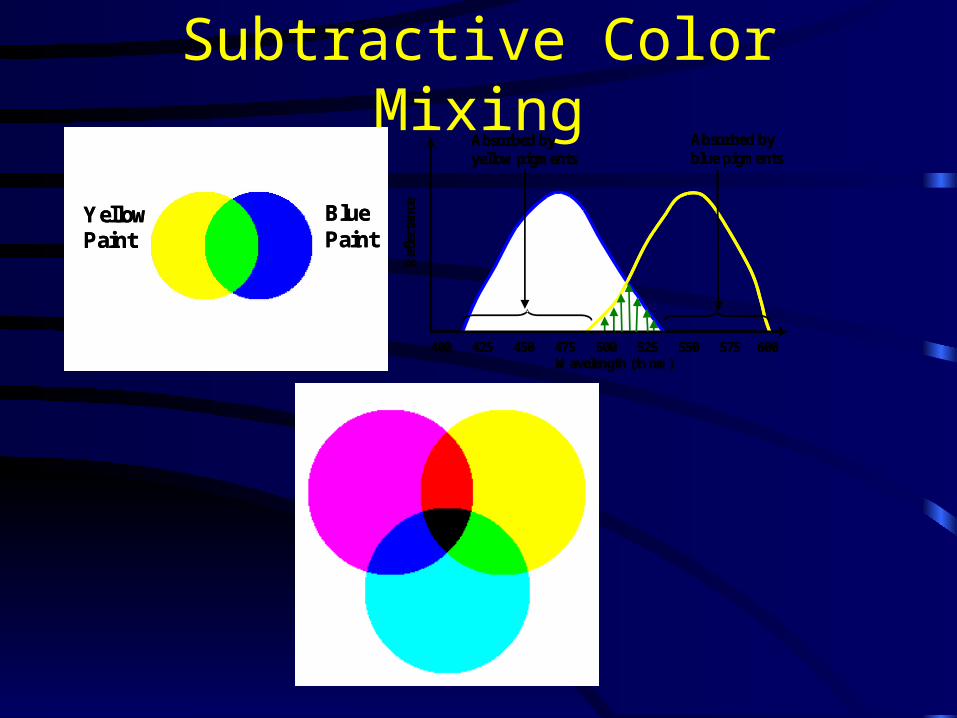
Subtractive Color Mixing
Yellow Paint
Blue Paint
Yellow Paint
Blue Paint
Yellow Paint
Blue Paint
400 425 450 475 500 525 550 575 600
Ref
lect
ance
Wavelength (in nm)
Absorbed byyellow pigments
Absorbed byblue pigments
400 425 450 475 500 525 550 575 600
Ref
lect
ance
Wavelength (in nm)
Absorbed byyellow pigments
Absorbed byblue pigments
Tristimulus Value
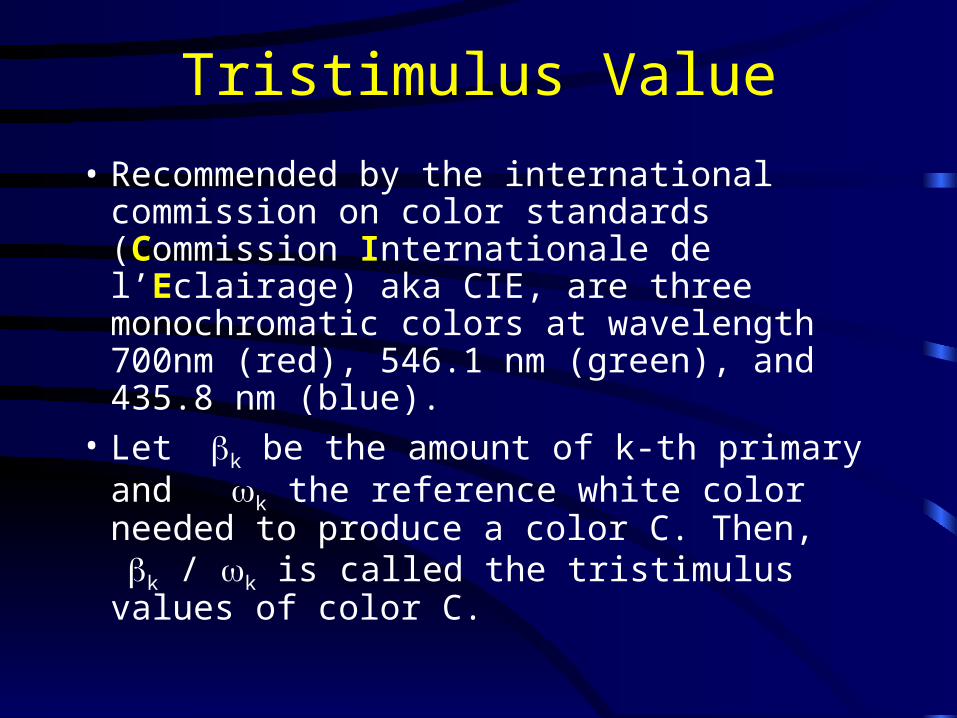
• Recommended by the international commission on color standards (Commission Internationale de l’Eclairage) aka CIE, are three monochromatic colors at wavelength 700nm (red), 546.1 nm (green), and 435.8 nm (blue).
• Let k be the amount of k-th primary and k the reference white color needed to produce a color C. Then, k / k is called the tristimulus values of color C.
Tristimulus Value
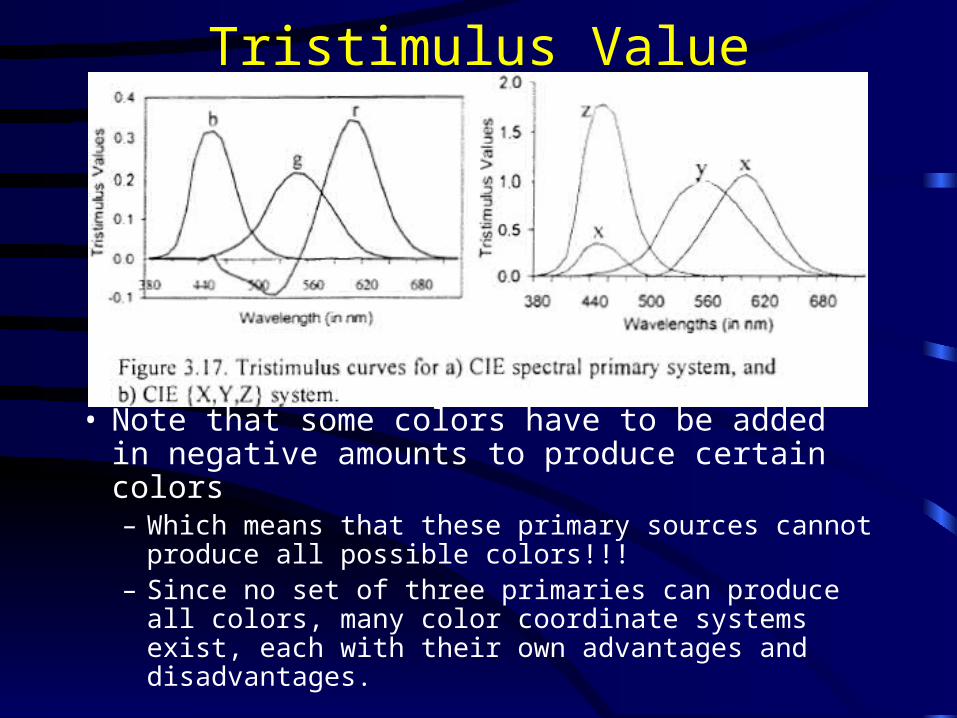
• Note that some colors have to be added in negative amounts to produce certain colors– Which means that these primary sources cannot
produce all possible colors!!!– Since no set of three primaries can produce all colors,
many color coordinate systems exist, each with their own advantages and disadvantages.
Tristimulus Value
• Example Color Coordinate Systems– CIE {X,Y,Z} system with hypothetical primary
sources such that all the spectral tristimulum values are positive
• X: Supersaturated red
• Y: Green
• Z: Blue
Chromaticity Diagram
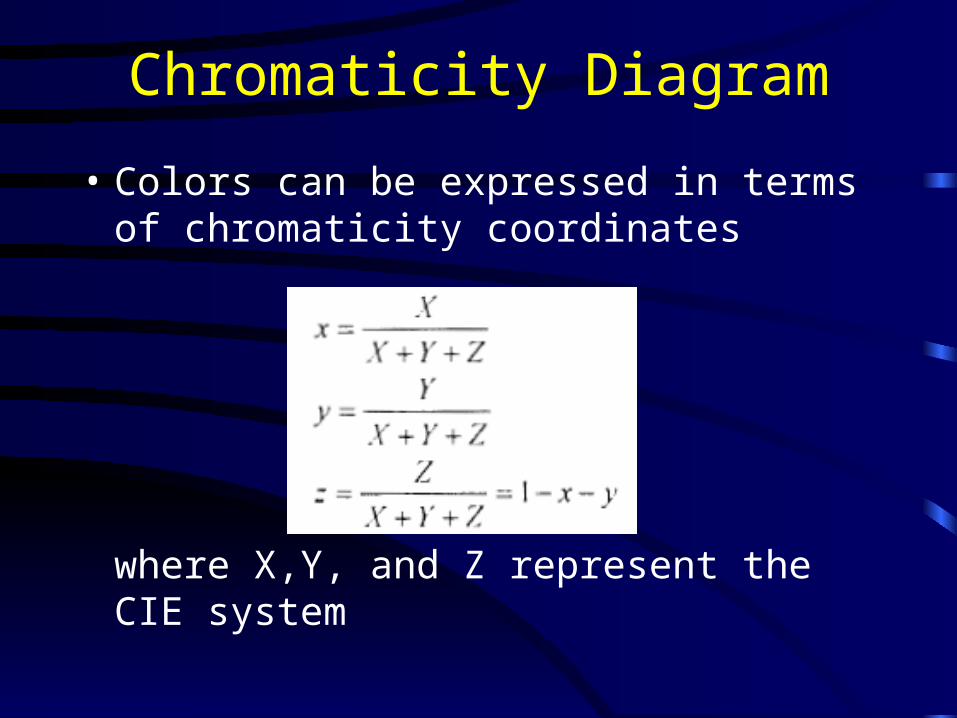
• Colors can be expressed in terms of chromaticity coordinates
where X,Y, and Z represent the CIE system
Color Models and Transformation of Primaries
• A single application may use two different color representations of the same visual signal– E.g. NTCS Receiver System vs. NTCS
Transmission System
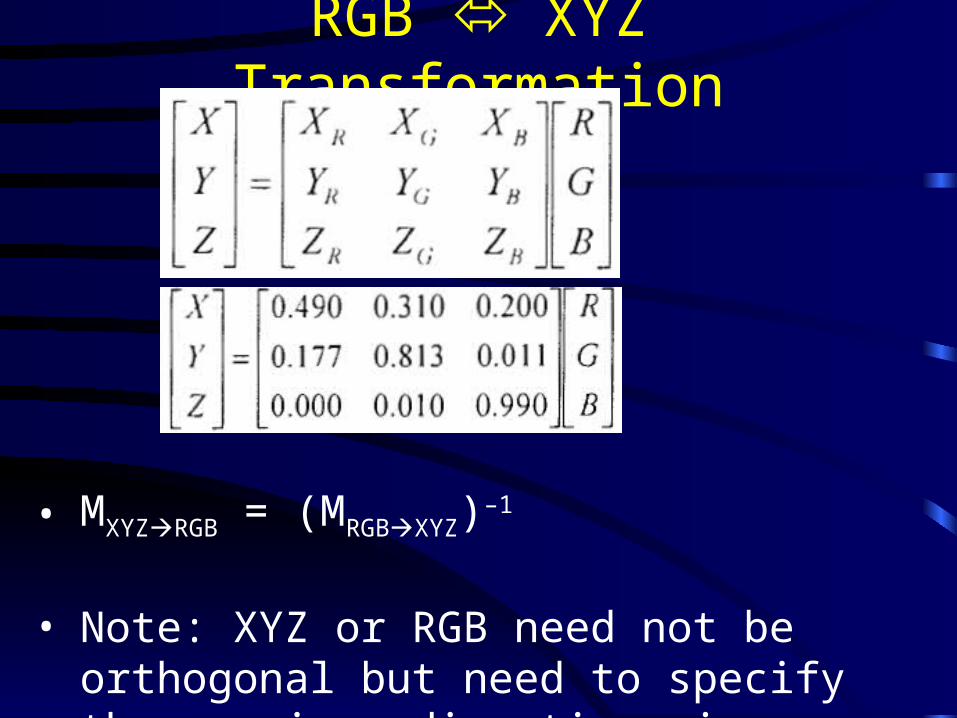
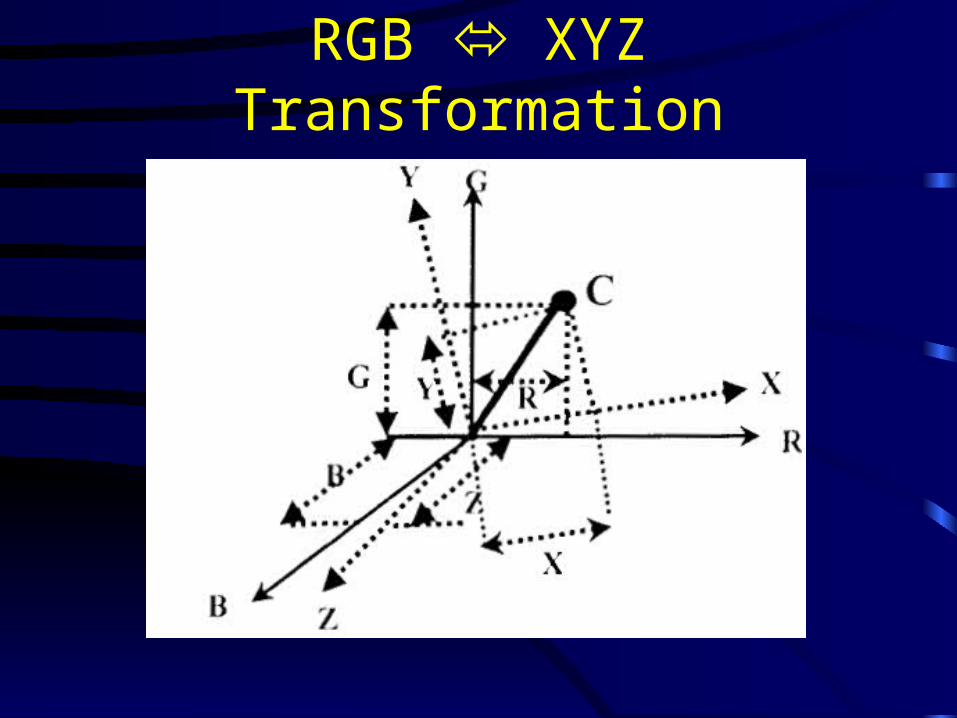
RGB XYZ Transformation
• MXYZRGB = (MRGBXYZ)–1
• Note: XYZ or RGB need not be orthogonal but need to specify three unique directions in space
RGB XYZ Transformation
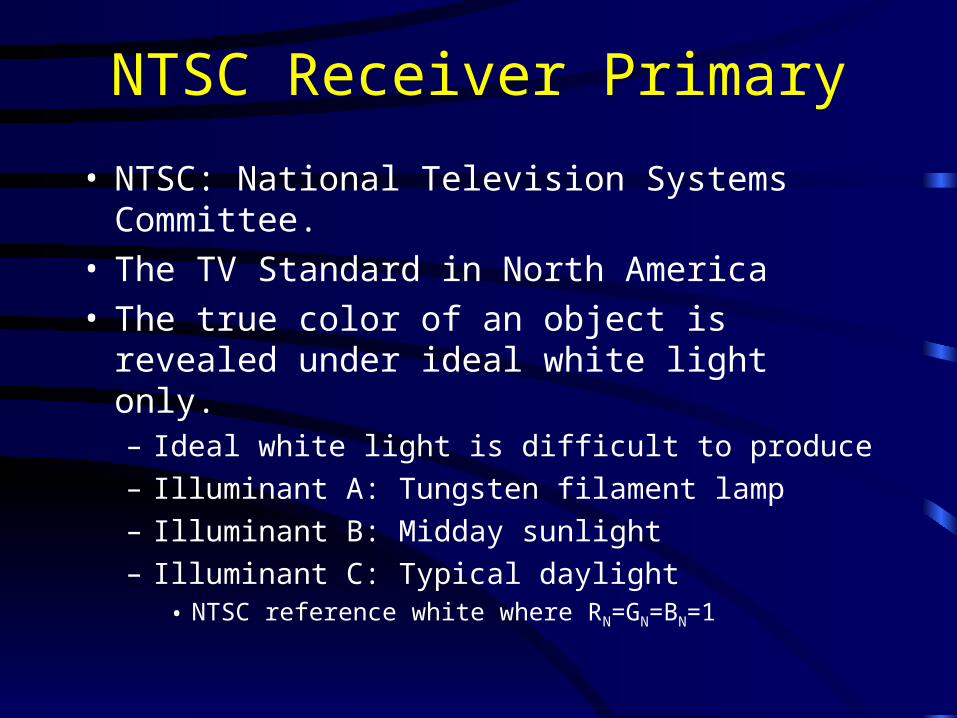
NTSC Receiver Primary
• NTSC: National Television Systems Committee.• The TV Standard in North America• The true color of an object is revealed under ideal
white light only.– Ideal white light is difficult to produce
– Illuminant A: Tungsten filament lamp
– Illuminant B: Midday sunlight
– Illuminant C: Typical daylight• NTSC reference white where RN=GN=BN=1
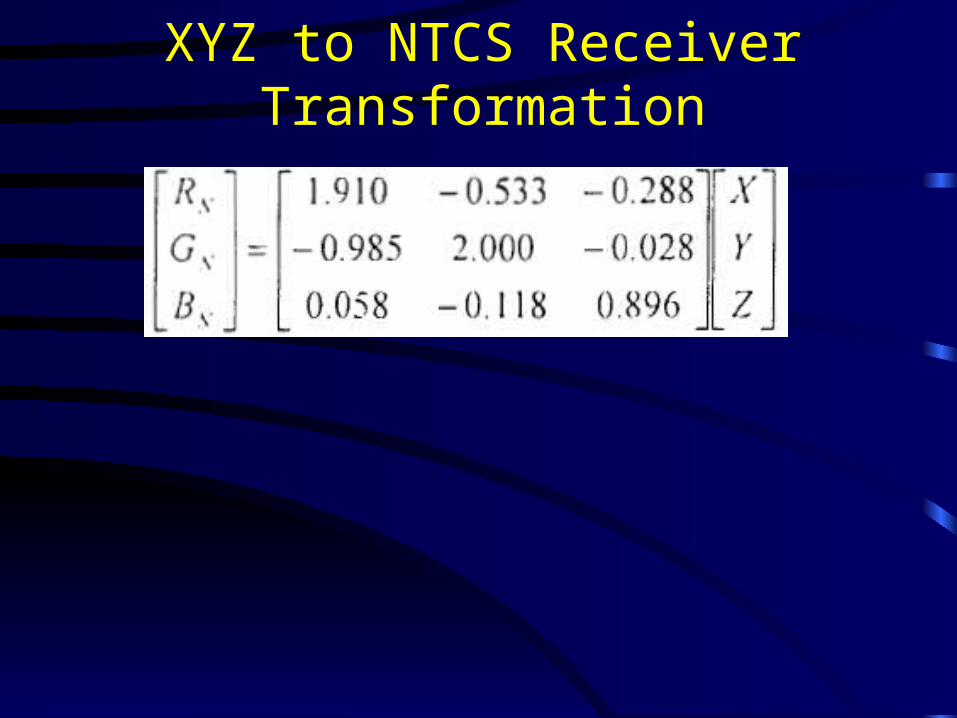
XYZ to NTCS Receiver Transformation
NTSC Transmission System
• Employs YIQ system to facilitate the use of monochrome television channels without increasing the bandwidth.– Y: Luminance of the color and simultaneously
acts as the monochrome channel in a monochrome receiver
– I and Q: Jointly represent the hue and saturation of the color.
– The bandwidth required for I and Q is much less than that for Y.
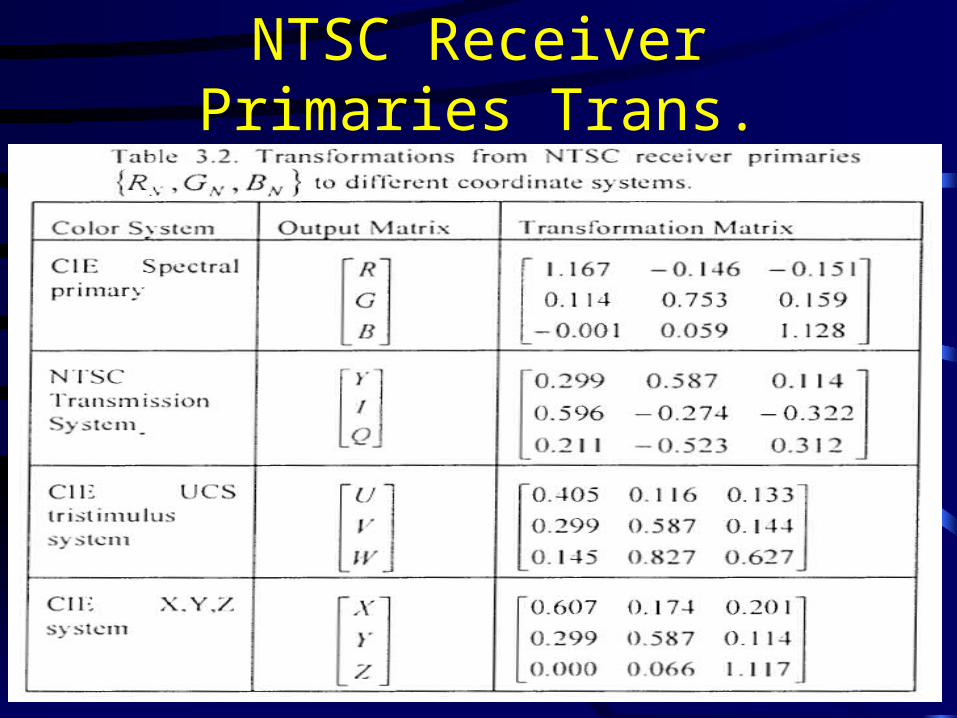
NTSC Receiver Primaries Trans.
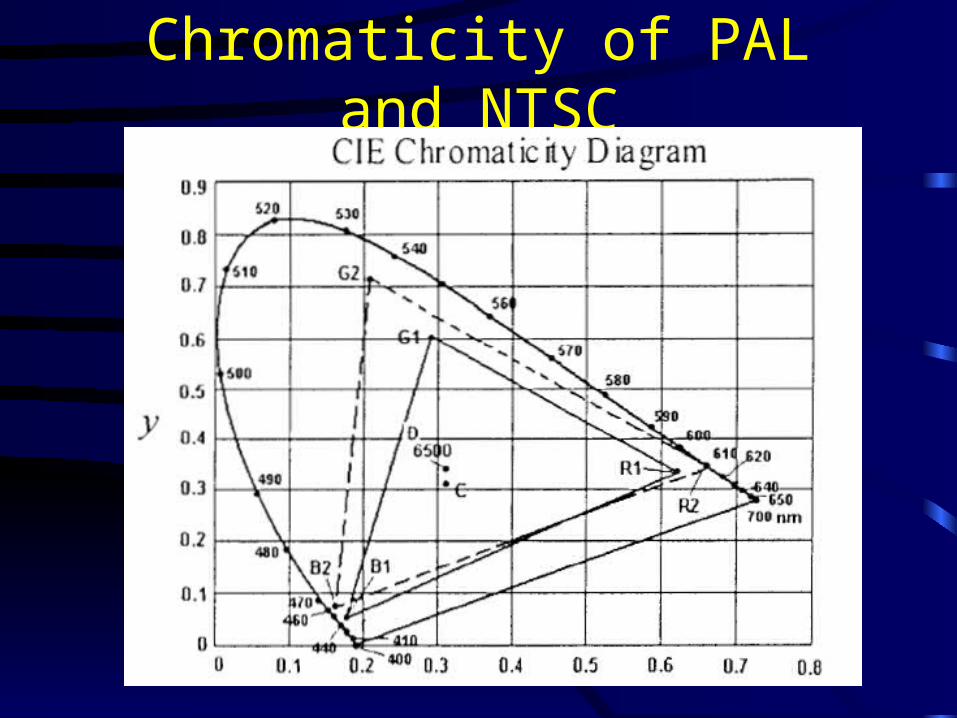
Chromaticity of PAL and NTSC
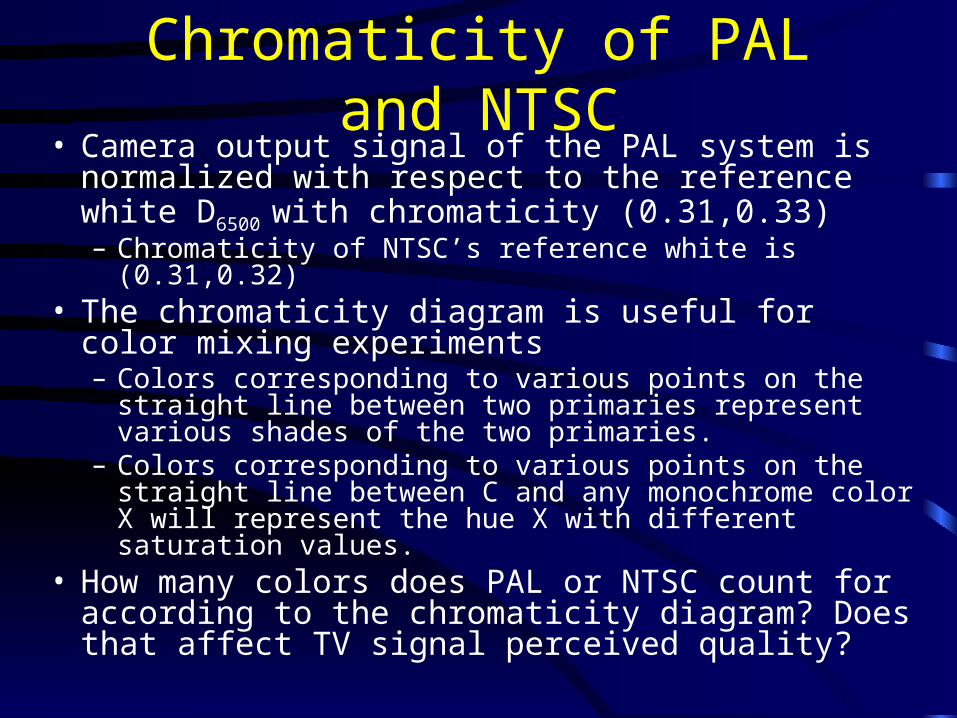
Chromaticity of PAL and NTSC• Camera output signal of the PAL system is normalized
with respect to the reference white D6500 with chromaticity (0.31,0.33)– Chromaticity of NTSC’s reference white is (0.31,0.32)
• The chromaticity diagram is useful for color mixing experiments– Colors corresponding to various points on the straight line
between two primaries represent various shades of the two primaries.
– Colors corresponding to various points on the straight line between C and any monochrome color X will represent the hue X with different saturation values.
• How many colors does PAL or NTSC count for according to the chromaticity diagram? Does that affect TV signal perceived quality?
Example
• Determine the tristimulus and chromaticity values of cyan (GN=BN=1, RN=0) in CIE primary and XYZ systems.
• Solution:
CIE-UCS Color Coordinates
• One disadvantage of the previous color system coordinates is that the Euclidean distance between two colors may not necessarily represent the perceptual “distance”.
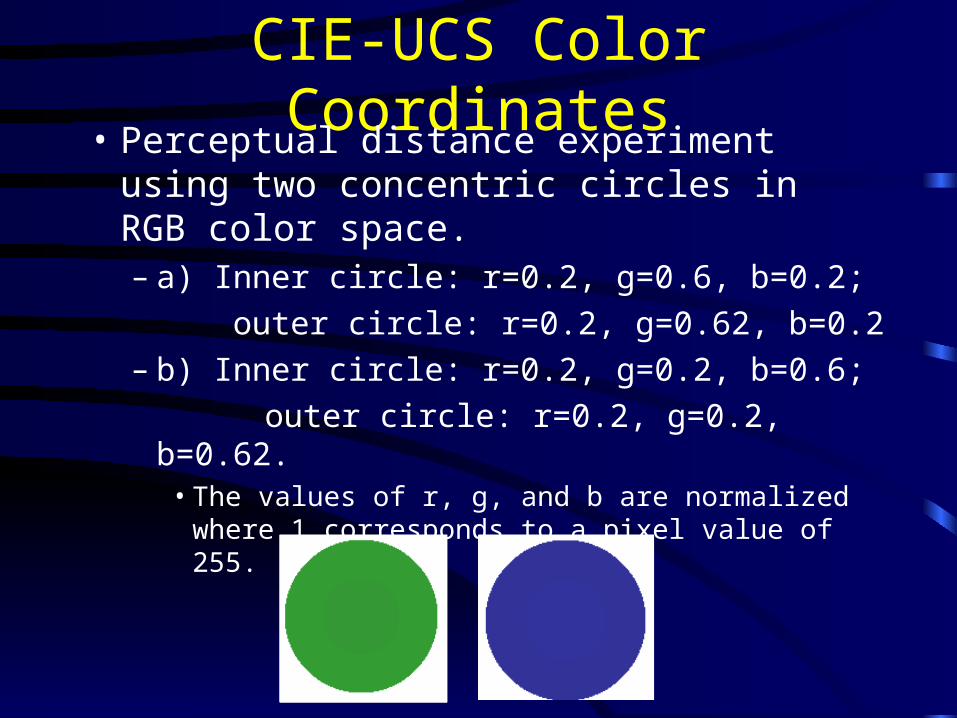
CIE-UCS Color Coordinates• Perceptual distance experiment using two
concentric circles in RGB color space. – a) Inner circle: r=0.2, g=0.6, b=0.2;
outer circle: r=0.2, g=0.62, b=0.2 – b) Inner circle: r=0.2, g=0.2, b=0.6;
outer circle: r=0.2, g=0.2, b=0.62. • The values of r, g, and b are normalized where 1
corresponds to a pixel value of 255.
CIE-UCS Color Coordinates
• The CIE Uniform Chromaticity Scale diagram was derived from the CIE chromaticity diagram by stretching it unevenly such that the chromaticity distance corresponded more closely to the perceptible difference.
• This color space is denoted by UVW and its transformation matrix has been shown earlier.
CMY Model
• Since printing applications employ the subtractive color model, the RGB model is not suitable.
• Instead, the three primaries used for color printing are – Cyan = White – Red– Magenta = White – Green– Yellow = White – Blue
CMY Model
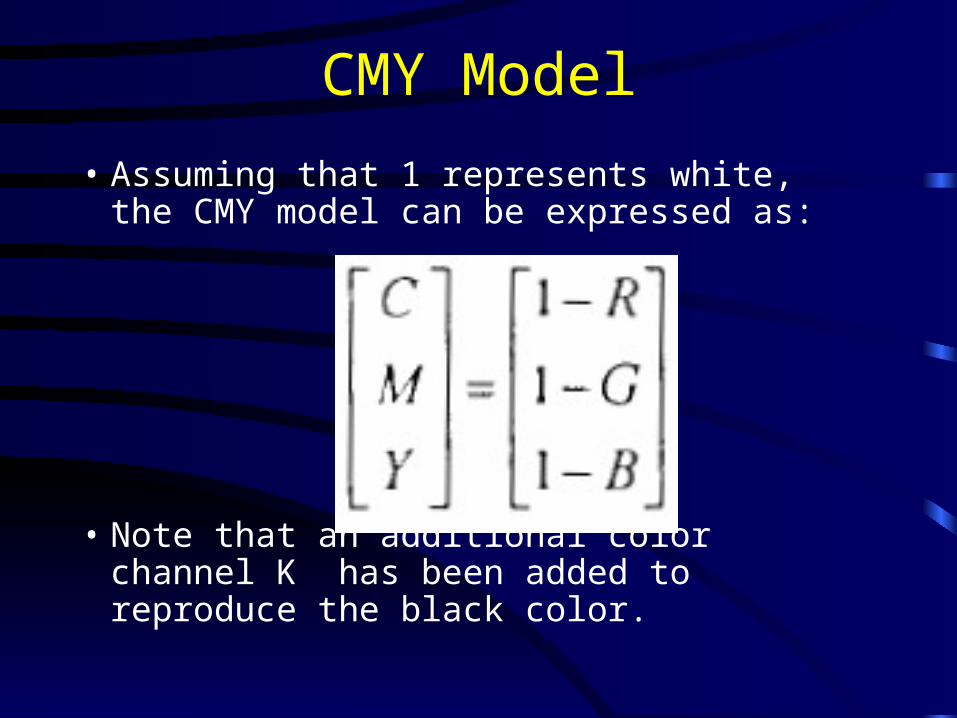
• Assuming that 1 represents white, the CMY model can be expressed as:
• Note that an additional color channel K has been added to reproduce the black color.
Related Documents