SYNOPSIS U~~lClAL ~llt COPY International Association for Hydraulic Research SURGES IN A TRAPEZOIDAL CANAL DUE TO PUMP FLOW REJECTION by w. E. Wagner and D. L. King Head, Structures and F.quipment section and Hydraulic Research Engineer, respectively, Hydraulics Branch, Division of Research, Office of Chief Engineer Bureau of Reclamation United states Department of the Interior Denver, Colorado United States of America This paper describes hydraulic model studies of surge formation and propagation i n a large trapezoidal canal supplying water to a pumping plant, following re- j ection of the canal flow due to pump stoppage caused by power failure. The studies were conducted in the Hydraulic Laboratory of the Division of Research, Bureau of Reclamation, Denver, Colorado. The forms of the surge waves resulting from complete canal flow rejection with and without the superimposed surge due to discharge line backflow were investi- gated. Characteristics such as average bore heights, heights of maximum oscil- lation peaks, wave velocities, and wave lengths of the surge were determined for complete rejection of the inflow. The attenuating effect of a 1,500-foot- (457.2-meter-) long weir on the canal side slope was determined for various values of the Froude number of the canal flow. , RESUME Ce rapport <Merit les etudes-modeJ.es hydra.uliques sur la formation de lame et sa propagation dans un grand canal en forine de trapeze fournissant l'eau a une usine de pan:page, sur le rejet de l'ecoulement du canal, d<l a l'~t de panpage, cause :pe.r une pa.nne d'electricite. Les etudes furent dirigees dans le Iaboratoire Hydraulique du Departement de Recherche, Bureau of Reclamation, Denver, Colorado. Des enqu~tes tres precises furent poursuivi~s en vue de determiner les forines des lames de fond resultant du rejet ccmplet de l'ecoulement du canal avec ou sans lame de fond superposee dGe au courant inverse. Les hauteurs moyennes de la barre d'eau, les hauteurs des pointes maximum d'oscillations, les dif- ferentes vitesses de lame et les longueurs de lame constituerent des elements L cara.cteristiques, qui furent determines pour le rejet canplet du courant. I L'effet attenua.nt d'un long barrage de 1500 pieds (soit 457,2 metres) sur les t rives d 'un ca.Dal fut determine pour differentes valeurs du Nanbre Froude de l'ecoulement d'arrivee initial.

Welcome message from author
This document is posted to help you gain knowledge. Please leave a comment to let me know what you think about it! Share it to your friends and learn new things together.
Transcript
SYNOPSIS
U~~lClAL ~llt COPY
International Association for Hydraulic Research
SURGES IN A TRAPEZOIDAL CANAL DUE TO PUMP FLOW REJECTION
by w. E. Wagner and D. L. King Head, Structures and F.quipment section
and Hydraulic Research Engineer, respectively, Hydraulics Branch, Division of Research,
Office of Chief Engineer Bureau of Reclamation
United states Department of the Interior Denver, Colorado
United States of America
This paper describes hydraulic model studies of surge formation and propagation i n a large trapezoidal canal supplying water to a pumping plant, following rejection of the canal flow due to pump stoppage caused by power failure. The studies were conducted in the Hydraulic Laboratory of the Division of Research, Bureau of Reclamation, Denver, Colorado.
The forms of the surge waves resulting from complete canal flow rejection with and without the superimposed surge due to discharge line backflow were investigated. Characteristics such as average bore heights, heights of maximum oscillation peaks, wave velocities, and wave lengths of the surge were determined for complete rejection of the inflow.
The attenuating effect of a 1,500-foot- (457.2-meter-) long weir on the canal side slope was determined for various values of the Froude number of the canal flow.
, RESUME
Ce rapport <Merit les etudes-modeJ.es hydra.uliques sur la formation de lame et sa propagation dans un grand canal en forine de trapeze fournissant l'eau a une usine de pan:page, sur le rejet de l'ecoulement du canal, d<l a l'~t de panpage, cause :pe.r une pa.nne d'electricite. Les etudes furent dirigees dans le Iaboratoire Hydraulique du Departement de Recherche, Bureau of Reclamation, Denver, Colorado.
Des enqu~tes tres precises furent poursuivi~s en vue de determiner les forines des lames de fond resultant du rejet ccmplet de l'ecoulement du canal avec ou sans lame de fond superposee dGe au courant inverse. Les hauteurs moyennes de la barre d'eau, les hauteurs des pointes maximum d'oscillations, les differentes vitesses de lame et les longueurs de lame constituerent des elements
L cara.cteristiques, qui furent determines pour le rejet canplet du courant.
I L'effet attenua.nt d'un long barrage de 1500 pieds (soit 457,2 metres) sur les t rives d 'un ca.Dal fut determine pour differentes valeurs du Nanbre Froude de
l'ecoulement d'arrivee initial.
\
INTRODUCTION
The San Luis Unit of the Bureau of Reclamation's Central Valley Project in California includes a system to store surplus water during the winter for release during the summer months. The Forebay Canal and Forebay Pumping Plant, as part of this system, will divert water from the existing Delta-Mendota Canal at a maximum rate of 4,200 cfs (118.9 ems) into the Foreba;y Reservoir. The water will then be lifted by pump-generator units into the San Luis Reservoir. subsequent releases back into the Forebay Reservoir will generate power and provide required irrigation flows. ·
Although safeguards have been included in the design, a remote possibility exists that power failure might occur at the Forebay Pumping Plant, resulting in a stoppage of the pumps. Should such a power failure occur, a surge wave would be propagated upstream in the Forebay Canal due to rejection of the canal flow and backflow drainage from the pump discharge lines. This surge; if allowed to travel unreduced through the Delta-Mendota Canal, would overtop the concrete lining and necessarily result in costly additions to the freeboard.
Alternative methods of reducing the surge to an allowable height were considered. The first alternative consisted of radial gates located in the bifurcation from the Delta-Mendota Canal to the Forebay Canal. These gates would open automatically upon power failure at the pumping plant, draw down the water surface to accommodate the initial surge wave, and remain open to divert the rejected canal discharge. The second alternative, which was included in the model investigation, consisted of a weir along the side of the trapezoidal Forebay Canal which would reduce the surge to an allowable value before reaching the bifurcation. The side weir has the advantages of essentially maintenance-free operation and freedom from reliance on mechanical devices.
Citrini1 has developed a theoretical approach to the action of a lateral spillway in reducing the height of a positive surge in a rectangular channel, and DeMa.rchi2 and GentiliniJ have presented supporting experimental data.
THE EXPERIMENTAL MODEL
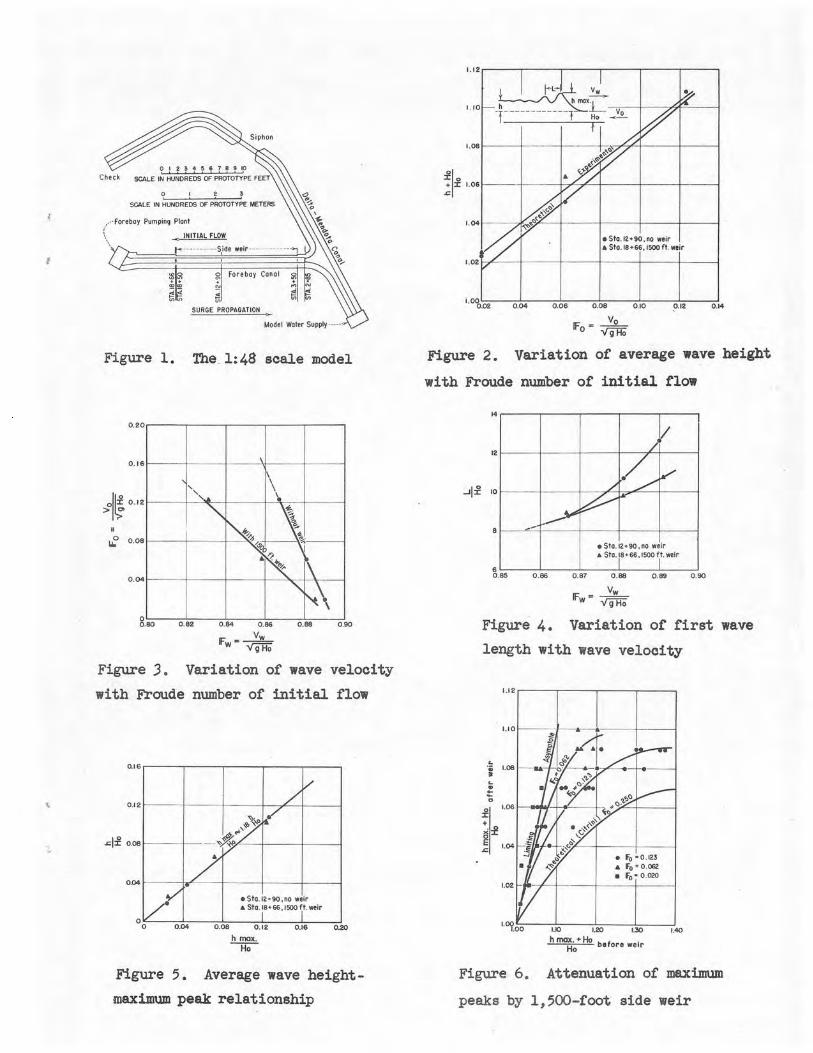
The 1:48 scale model included the Forebay Canal and the transition to the pumping plant intakes, the bifurcation from the Delta-Mendota Canal to the Forebay Canal, and several hundred feet of the Delta-Mendota Canal as shown in Figure 1. The discussion presented in this paper will be limited to the formation, propagation, and attenuation of the surge in the Forebay Canal. The model canal section had a bottom width of 20 inches (50.8 cm) with 1-1/2:1 side slopes, an average flow depth of approximately J.75 inches (9.6 cm), and a length of approximately 48 feet (15 m). The maximum model discharge was 0.26J cfs (7.45 1/s) corresponding to a prototype discharge of 4,200 cfs (118.9 ems).
lCitrini, Giulio. "Sull' attenuazione di un'·onda positiva ad opera di uno sfioratore laterale (attenuation of a positive wave by means of a lateral spillway)." L'Energia Elettrica, Milano, Volume XXVI, No. 10, 1949.
2DeMarchi, Giulio. "Action of side weirs and tilting gates on translation waves in canals." Proceedings of the Minnesota International Hydraulics Conference, August 195J.
JGentilini, Bruno. "L'Azione Di Uno Sfioratore Laterale Sull'onda Positiva Ascendente In Un Canale (The action of a side weir on the positive wave moving upstream in an open channel)." Memorie e Studi Dell'Istituto Di Idraulica e Costruzioni Idrauliche Del Politecnico Di Milano, Centro Lombardo Di Ricerche Idrauliche Del Consiglio Nazionale Delle Ricerche, No. 78, 1950.
Rejection of the canal inflow was accomplished by rapid closure of slide gates located at the pump intakes. Backflow from the pump discharge lines was simulated by head tanks which were allowed to drain through orifices sized to produce the required maximum backf'low rate.
Tests showed that flow depths of less than approximately 0.2 inch (5 nm) over the weir were affected by forces of surface tension and viscosity, indicating a weir efficiency greater than that of the corresponding prototype. Similar findings were presented by Schoder and Turner4 in tests on sharp-crested weirs.
INSTRUMENTATION
Basic model instrumentation consisted of six capacitance-type wave probes connected to a 6-channel direct-writing oscillograph. The probes proved to be very successful in measuring the size and form of the surge wave. Some nonlinearity occurred because of the plasticized-enamel dielectric wire coating5. A careful calibration routine was necessary to obtain linearity and separate calibrations were made for each test run to ensure accurate data. It was also necessary to insulate caref'ul.ly the impedance bridge circuit of each probe to prevent zero datum drift caused by room temperature variations.
According to other experimenters6, meniscus effects result in an error of approximately ±0.015 inch (0.38 mm) which was not considered significant. The errors were found to be greatest at the wave troughs, which .were not of primary importance in this stu~.
CHARACTERISTICS OF THE SURGE WAVE
The size and form of the surge wave were first recorded following complete rejection of the inflow, without backflow fran the pump discharge lines. Three wave probes were placed at each measuring station to determine both the longitudinal and transverse form of the wave. Data were recorded at a section approximately 13 feet (4 m) (model) upstream from the pumping plant at Station 18+66 (the. weir, which ended at station 18+50, was in place for this test but data would be identical without the weir), and a section approximately 25 feet (7.6 m) upstream from the pumping plant at Station 12+90 {without the weir). Three conditions of initial inflow were imposed: maximum discharge (6-pump operation), one-half maximum discharge (3 pumps), and one-sixth maximum discharge (one pump). The depth of flow in the canal remained constant at an average depth of 3.75 inches (9.6 cm) for all test runs. Flow was stopped by rapid closure of the downstream slide gates.
Figure 2 illustrates the variation of average surge height, following complete flow rejection, with the Froude number of the canal flow. The linear relationship indicated by the limited data is supported by the accompanying theoretical curve, which was derived from the equations of continuity and momentum., using an electronic digital computer. The scatter in the data is probably due to slight variations in the initial inflow conditions, since each section was recorded at a different time. Although agreement is quite good, the experimental curve lies above the theoretical curve. No conclusions should be drawn from this until more data are available to more carei'ully define the experimental curve. Experiments i n rectangular channels have shown good agreement with theory.
4schoder, E.W • ., and Turner., K. B., "Precise weir measurements." Transactions, American Society of Civil Engineers. Volume 9J, 1929.
5pearlman., Michael D. 11.o,na.mic calibration of wave probes." MIT Department of Naval Architecture and Marine Engineering. July 1963.
6eandover, J. A., and Zienkiewicz, o. c. "Experiments on surge waves." Water Power. November 1957.
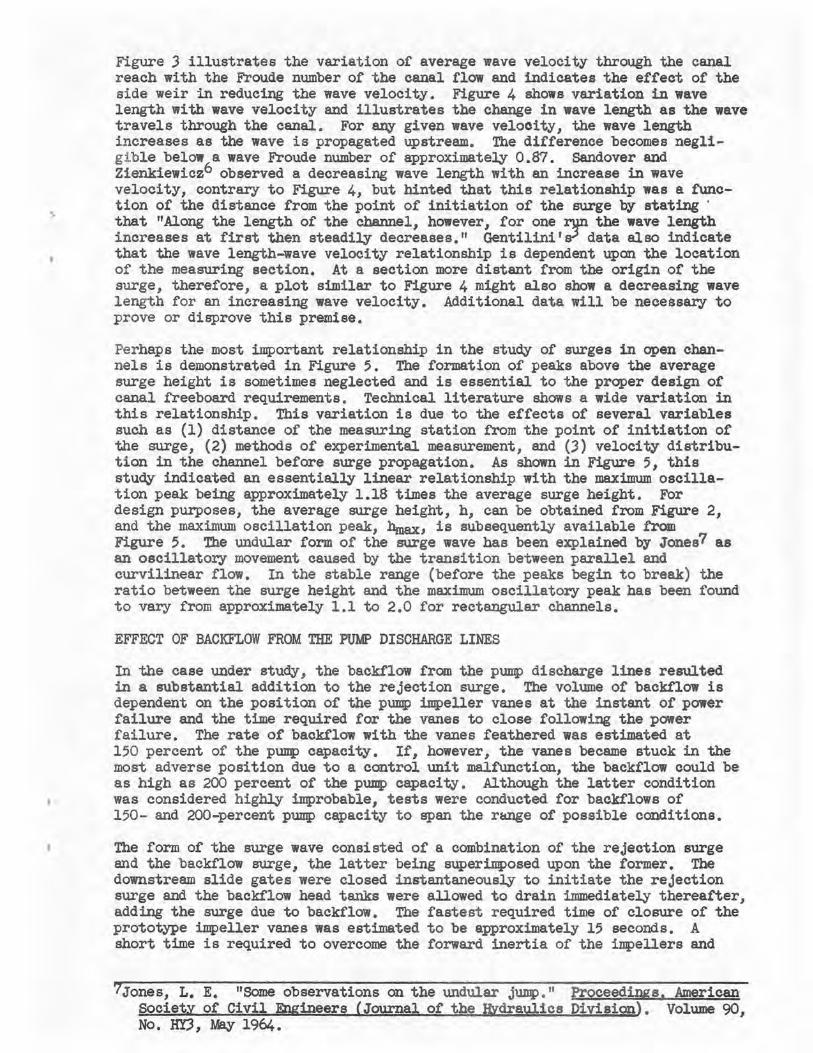
Figure 3 illustrates the variation of average wave velocity through the canal reach with the Froude number of the canal flow and indicates the effect of the side weir in reducing the wave velocity. Figure 4 shows variation in wave length with wave velocity and illustrates the change in wave length as the wave travels through the canal. For any given wave velocity, the wave length increases as the wave is propagated upstream. The difference becomes negligi.ble below a wave Froude number of approximately 0.87. Sandover and Zienkiewicz6 observed a decreasing wave length with an increase in wave velocity, contrary to Figure 4, but hinted that this relationship was a function of the distance from the point of initiation of the surge by stating · that "Along the length of the channel, however, for one z,µi the wave length increases at first then steadily decreases. 11 Gentilini' s-' data also indicate that the wave length-wave velocity relationship is dependent upon the location of the measuring section. At a section more distant from the origin of the surge, therefore, a plot similar to Figure 4 might also show a decreasing wave length for an increasing wave velocity. Additional data will be necessary to prove or disprove this premise.
Perhaps the most important relationship in the study of surges in open channels is demonstrated in Figure 5. The formation of pea.ks above the average surge height is sometimes neglected and is essential to the proper design of canal freeboard requirements. Technical literature shows a wide variation in this relationship. This variation is due to the effects of several variables such as (1) distance of the measuring station from the point of initiation of the surge, (2) methods of experimental measurement, and (3) velocity distribution in the channel before surge propagation. As shown in Figure 5, this study indicated an essentially linear relationship with the maximum oscillation peak being approximately 1.18 times the average surge height. For design purposes, the average surge height, h, can be obtained from Figure 2, and the maximum oscillation peak, hmax, is subsequently available from Figure 5. The undular form of the surge wave has been explained by Jones 7 as an oscillatory movement caused by the transition between parallel and curvilinear flow. In the stable range (before the peaks begin to break) the ratio between the surge height and the maximum oscillatory peak has been found to vary from approximately 1.1 to 2.0 for rectangular channels.
EFFECT OF BACKFLOW FROM THE PUMP DISCHARGE LINES
In the case under study, the backflow from the pump discharge lines resulted in a substantial addition to the rejection surge. The volume of backflow is dependent on the position of the pump impeller vanes at the instant of power failure and the time required for the vanes to close following the power failure. The rate of backflow with the vanes feathered was estimated at 150 percent of the pump capacity. If, however, the vanes became stuck in the most adverse position due to a control unit malfunction, the backflow could be as high as 200 percent of the pump capacity. Although the latter condition was considered highly improbable, tests were conducted for backflows of 150- and 200-percent pump capacity to span the rtl.Ilge of possible conditions.
The form of the surge wave consisted of a combination of the rejection surge and the backflow surge, the latter being superimposed upon the former. The downstream slide gates were closed instantaneously to initiate the rejection surge and the backflow head tanks were allowed to drain immediately therea~er, adding the surge due to backflow. The fastest required time of closure of the prototype impeller vanes was estimated to be approximately 15 seconds. A short time is required to overcome the forward inertia of the impellers and
7Jones, L. E. "Some observations on the undular jump. 11 Proceedings, American society of Civil Engineers (Journal of the Hydraulics Division). Volume 90, No. HD, May 1964.
provide for acceleration of the backflow. Velocities of the rejection surge and backflow surge, measured independently in the model, indicated that the backflow surge would overtake the rejection surge at the downstream end of the side weir if initiated 1.5 seconds after rejection. It was, therefore, desirable to determine the attenuating effect of the weir with the backflow surge superimposed on the rejection surge, which would be the worst possible condition that could occur in the prototype.
ATTENUATING EFFECT OF THE SIDE WEIR
Preliminary tests on a 2,07J-foot-(6Jl.8-m) long side weir indicated that a 1,500-foot- (457.2-m) long weir would attenuate the surge to an allowable height. The weir was installed between station J+50 and Station 18+50 and data were collected for the three inflow conditions previously described. Surges were initiated for complete rejection without backflow, with 150-perCE!It backflow, and with 200-percent backflow. The crest of the weir was an average of 0.5 foot (prototype) above the initial water surface.
Figure 6 shows the reduction in peak surge height after traversing the weir section. The curves actually demonstrate the combined attenuating effect of the side weir and the decay of the maximum backflow peak due to instability. The unfortunate scatter of data is at least partially due to the inability to duplicate repeatedly and exactly the backflow from the manually operated head tanks for all test runs. The theoretical curve for a Froude number of 0.250 in a rectangular channel is extracted from Citrini's paperl. The curves compare favorably. Citrini's curve is for a weir length-channel width ratio of 10, whereas the weir under study corresponds to a ratio of approximately 11.8.
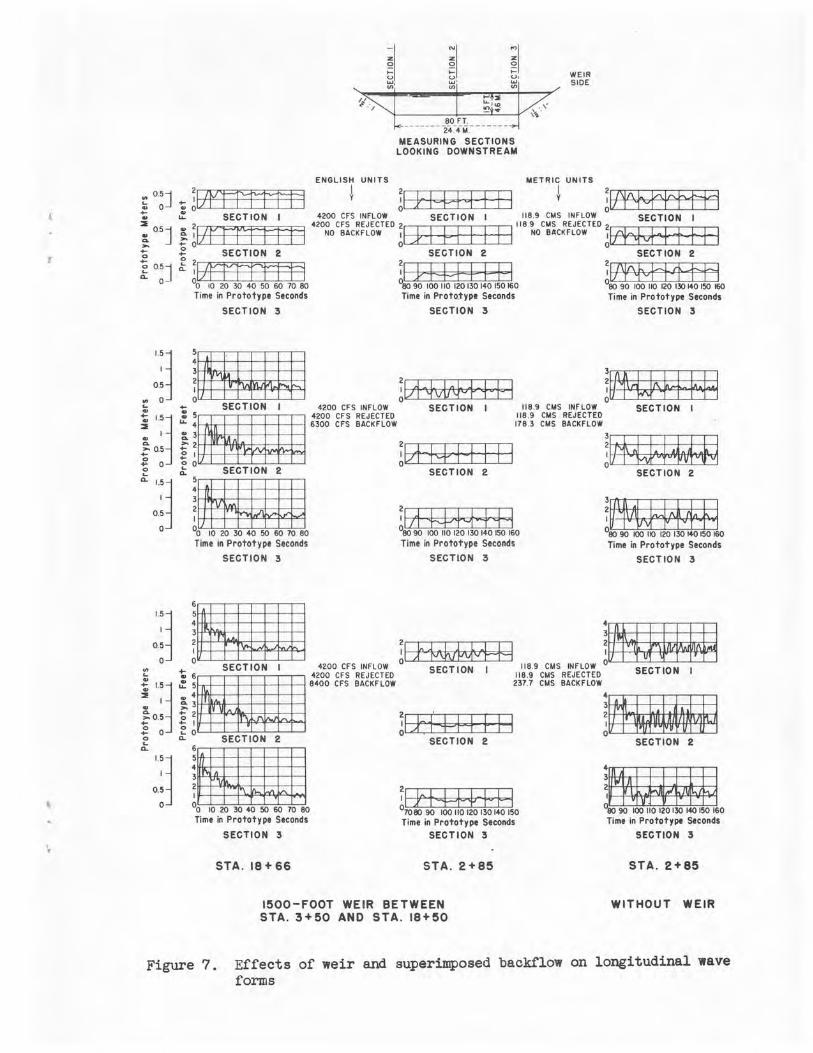
Figure 7 summarizes wave forms with and without the weir for the described conditions of inflow and backflow. Some general observations on the form of the surge wave should be noted. First, the records illustrate errors encountered in relying on data from a single measuring section, such as the canal centerline. Differences in surge heights from one side of the channel to the other were nearly indistinguishable for small surges, either with or without the weir. As surge heights increased, particularly with the superimposed backflow surge, the initial peaks of the surge exhibited a concave form (lower in the center).
The attenuation of the surge without the effect of the side weir can be determined by comparing the left and right columns of Figure 7. The rejection wave is reduced by friction and the heights of the oscillation peaks vary along the channel as the surge approaches full development (the latter premise was observed but is not distinguishable in Figure 7). Friction has negligible effect on the maximum peak of the rejection surge without backflow. However, the friction effect is readily apparent in the average surge height and in the depths of the troughs. Sandover and Zienkiewicz6 observed similar results. The backflow surge is attenuated by friction and, to a greater extent, by a tendency for the trailing slope of the wave to flatten out.
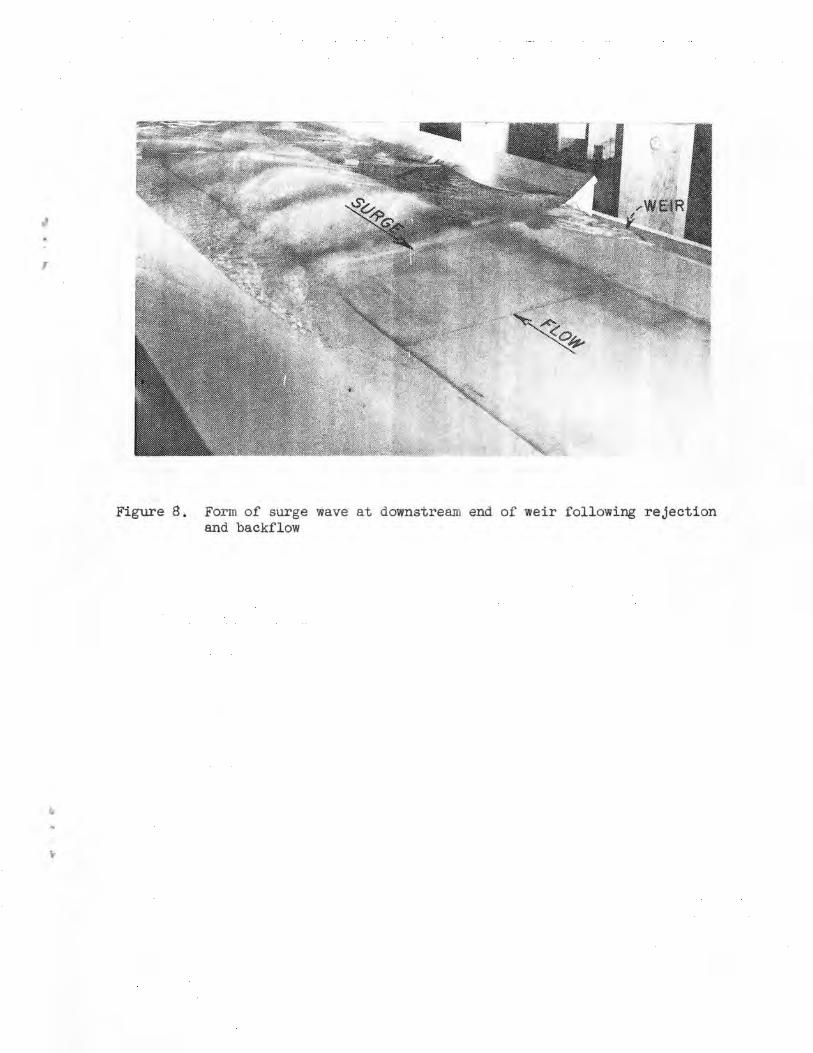
Figure 8 shows the form of the surge following rejection of the maximum discharge of 4,200 cfs (118.9 ems) with a backflow rate of 200 percent of pump capacity. The breaking edge noted on either side of the channel is due to instability caused by the lesser flow depth over the side slopes.
CONCLUSIONS
A hydraulic model was used successfully to determine the mechanics of surge formation and propagation in a large trapezoidal canal, and to study the attenuating effect of a side weir.
t
The average wave height increased linearly with the Froude number of the canal flow and agreed quite favorably with theory. Contrary to results observed by other experimenters, the surge wave length increased with wave velocity, which supports the premise that the wave length-wave velocity relationship is a function of the distance from the surge source. Generally, the studies showed that the maximum surge peak was about 1.18 times the average surge height.
The side weir significantly reduced the average wave heights and wave velocities. The attenuating effect of the 1,500-foot-long weir on the maximum peaks compared favorably with theory derived for rectangular channels.
The data presented should be generally applicable to other trapezoidal channels of this relative size and shape. Factors such as velocity distribution, friction, and the ratio of wave height to channel depth, however, affect the formation and propagation of the surge. Where unusual accuracy is necessary, a model study of the particular channel may be warranted.
'
FIGURE CAP.rIONS
Figure 1. The 1: 48 scale model ·
Figure 1. Example a l'echelle 1:48
Figure 2.
Figure 2.
Figure 3.
Figure 3.
Figure 4.
Figure 4.
Figure 5.
Figure 5.
Figure 6.
Figure 6.
Figure 7.
Figure 7.
Figure 8.
Figure 8.
Variation of average wave height with Froude number of initial flow
Variation de la hauteur moyenne de la lame avec un Nanbre Froude de l'ecoulement initial
Variation of wave velocity with Froude number of initial flow
Variation de la vitesse de la lame avec un Nanbre Froude de l'ecoulement initial
Variation of first wave length with wave velocity
Variation de la premiere hauteur de la lame avec sa vitesse
Average wave height-maximum peak relationship
Rapport entre la hauteur moyenne de la lame et sa pointe maximum
Attenuation of maximum pea.ks by 1,500-foot side weir
Attenuation des points maximum par un barrage de 1500 pieds
Effects of weir and superimposed backflow on longitudinal wave forms
E:f'fets du barrage et du courant inverse superpose sur les fonnes de la lame
Form of surge wave at downstream end of weir following rejection and backflow
Forme de la lame de fond a l'extremite en aval du barrage, apres rej et et coura.nt inverse
f
01234!56789!0
SCALE IN HUNDREDS OF PROTOTYPE FEET
2 3
SCALE IN HUNDREDS Of PROTOTYPE METERS
{.·.·.·· Foreboy Pumping Plant
-< INITIAL FLOW
\ t4- -- --------Side weir --------- ---->i
f Forebay Canal
~ ~ SURGE PROPAGATION
Model Woter Supply ------
Figure 1. The_l:48 scale model
0.20.----.----.-----.-----,----,
Q_ 16 i---- -+-----t--- -\l----+-----1
~,~ 0.12 ' ' '
\ I \
8.'c:ao:----::-o_.,.e2,----=o-"=.84-,----o-'-.es---o-'_ee----1o.oo
Vw IFw s _'\/aHo_g_H_o
Figure 3. Variation of wave velocity
with Froude number of initial flow
0.16r---.---,----,----,----,
• eSta.12•90,no weir • Sto.18+66, 1500 ft. weir
0 o~--:-o.04-:-:------,-o . .J.08::----o-'_,-2 __ o_J.1Ls--o_..20
h max_ Ho
Figure 5 • Average wave height
maximum peak relationship
1.12.-----.----.-----.-----,---~---.
1.10
:c 0 01 ; J: 1.06
'-<l<b'-=.02=----::-0_04-:-:----::-0.-=-os=----=o-'=.o-::-8--o=-'.1-::-o---,-o_'-,2--~o.14
Figure 2. Variation of average wave height
with Froude number of initial flow
14.----.----.-----.----~---,
• Sta. 12 + 90, no weir • Sto.18+66, 1500 ft. weir
6 .__ __ _._ __ ....__ __ -'----'----'
0.85 0_86 0.87 0.88 0.89 0.90
Figure 4. Variation of first wave
length with wave velocity
.. ·.; • .. ~ a
0 :c + ~£ E ,:;
1.12.----.----.-----.----~
1.08
1.06
1.04
• F0 •0.123 • F0 =o.062 • F0 • 0.020
'-O\'o~O---,-,.L:,I0---,-'-.20--__J_L30 __ __Jl.40
h ma~~+ Ho before weir
Figure 6. Attenuation of maximum
peaks by 1,500-foot side weir
I
' \.
'"0.5j ~ 0 +.. 2 ~ 0.5] >, +-0
~ 0.5] Q. 0
ii .... . V)
80 FT. 24 .4M.
ii u, .... V)
MEASURING SECTIONS LOOKING DOWNSTREAM
WEIR SIDE
ENGLISH UNITS METRIC UNITS
t !IJITITttH i !I J· I++ 1 1 f I i !lll\+0 Ptftf4 .!'. SECT ION I 4200 CFS INFLOW SECTION I 118.9 CMS INFLOW SECTION 1
2 4200 CFS REJECTED 2~~~~~~~~ 118 9 CMS REJECTED 2 . ! ~1/[Frtttfj NO BACKFLOW ~, j, I ~ I I I I I NO 84CKFLOW JPfo~;J '1 ± f j I ~ SECTION 2 SECTION 2 SECTION 2
~ lZFlltttH ~I H+d -ft I I ~ll'r'16v61±H 0o 10 20 30 40 50 60 70 80 °80 90 100 110 120 130 140 150 160 °80 90 100 110 120 130 140 150 160 Time in Prototype Seconds Time in Proto.type Seconds Time in Prototype Seconds
SECTION 3 SECTION 3 SECTION 3
~;~ llAWII r +- SECTION I 4200 CFS INFLOW
!M 'tvWv+ 1°H ffNffl+f +·l ! ':~ ; :1 ff m :1gg m :u~m~ i oj f U-=~-=-==== !8°hl j I I I j
SECTION I 118.9 CMS INFLOW 118 .9 CMS REJECTED 178 .3 CMS BACKFLOW
£::~·11m :13;:~E O
0o 10 20 30 40 50 60 70 80 °80 90 100 110 120 130 140 150 160 Time in Prototype Seconds Time in Prototype Seconds
SECTION 3 SECTION 3
SECTION I
W1vtffi#+J 080 90 100 IIO 120 130 140 150 160
Time in Prototype Seconds
SECTION 3
~] 1111 :1 H~ !mMM :: t 6 SECTION I 42~gocg\~NJ'ELCOT~D SECT ION I 11~~\~~\~J~~~~D SECTION I °t 1.5~ ,!'. 5~ 8400 CFS BACKFLOW 237.7 CMS BACKFLOW
i,:j fl~ HH+I EH j~~ ;; ''.~ .
1~ SECTION 2 SECTION 2
''j :~ :1 }f::i::R, F-H ;mg O
0o 10 20 30 40 50 60 70 80 °roeo 9-0l00tt0120 13014()150 °80 90 100 110120130140150 160 Time in Prototype Seconds Time in Prototype Seconds Time in Prototype Seconds
SECTION 3 SECTION 3 SECTION 3
STA . 18 + 66 STA. 2+8!5
1!500-FOOT WEIR BETWEEN STA. 3+!50 AND STA. 18+!50
STA. 2+8!5
WITHOUT WEIR
Figure 7. Effects of weir and superimposed backflow on longitudinal wave forms
.,
T
ii ----
Figure 8. For m of surge wave at downstream end of weir following rejection and backflow
Related Documents


![REGULARIZAÇÃO E PROTECÇÃO CONTÍNUA DE CURSOS DE · arrastamentos no canal trapezoidal [7]. ..... 44 Figura 3.15 - Circulação secundária (representada pelas setas) numa secção](https://static.cupdf.com/doc/110x72/5c62be4109d3f263208b6f81/regularizacao-e-proteccao-continua-de-cursos-de-arrastamentos-no-canal.jpg)