Chapter 3 SUPPLY AND DEMAND IN REGIONAL LABOUR MARKETS: POPULATION GROWTH, MIGRATION, PARTICIPATION, AND EARNINGS DIFFERENTIALS A. INTRODUCTION The 1989 issue of the Employment Outlook presented estimates of unemployment rates consistent with national “standardized” rates for 182 regions in 22 OECD countries, and analysed long-term trends in regional unemployment differentials for 10 of these countriesl. The unemployment rate alone, however, gives only a partial picture of differences in labour market conditions across regions. It may understate regional labour market imbalance, if high-unemployment regions also have low activity rates. The loss of per-capita income resulting from high unemployment may be offset, in some cases, by high earnings for those at work. There are also questions concerning the contribution of other factors to unemployment differences. What is the role of the industrial structure of employment in regional unem- ployment? Do regional increases in unemployment reflect a slow pace of employment creation or, mainly, strong demographic pressures? How important have migration flows been, and in particular flows towards the low- unemployment regions? How large have been changes in the level of earnings at the regional level, and what has been their relationship to local labour market conditions? This chapter addresses some of these questions. Section B presents regional estimates of labour force participation rates, in the form of a coloured map, and gives indicators of disparities across regions in this statistic. Section C looks at the relative contributions of population growth, labour force participation, and employment growth to the evolution of regional unemployment patterns. Section D looks at geographical mobility and its role in redistributing excess labour supply across regions, and Section E presents information on regional earnings differentials. Sections B to E confirm the complexity and importance of regional labour market differences. High- unemployment regions do often suffer, in addition, from both low labour force participation and low earnings. Although country experiences are varied, it is clear that unemployment often cannot be attributed to such simple factors as high earnings and rapid population growth, and that adjustment through migration is, at best, part of the solution. Against this background, what role have active policies, aiming to move jobs to depressed regions or to reduce regional imbalance in other ways, played in the past and what role may they play in the future? Regional policies, which have in various measures tried to assist depressed regions through improving infrastructure, specific incentives for job creation, and general improvements in business climate, are briefly reviewed in Section F. Section G concludes. B. LABOUR FORCE PARTICIPATION RATES IN REiGIONS OF OECD COUNTRES Chart 3.1 presents labour force participation rates for 182 regions within 22 OECD countries. The partici- pation rates shown are estimates of the ratio of the total labour force of all ages to the resident population of working age, defined as the population 15 to 64 years of age, in 19872. OECD (1989~) describes the construction of the labour force estimates, which are based upon countries’ labour force surveys. Regional population totals in labour force surveys were corrected onto a common age basis as described in Annex 3.B, and benchmarked onto the population aged 15 to 64 as given in OECD Labour Force Statistics. The chart shows participation rates within ranges, with the highest range, shown in light blue, indicating a participation rate above 83 per cent, and the lowest range, indicating a participation rate below 55 per cent, in red. Intermediate ranges each cover an interval of 2.33 percentage points of participation. 1. Regional patterns of participation rates in the OECD area Chart 3.1 shows distinct supra-national patterns in the disiribution of participation rates within the OECD area, 77

Welcome message from author
This document is posted to help you gain knowledge. Please leave a comment to let me know what you think about it! Share it to your friends and learn new things together.
Transcript
Chapter 3
SUPPLY AND DEMAND IN REGIONAL LABOUR MARKETS: POPULATION GROWTH, MIGRATION, PARTICIPATION, AND EARNINGS DIFFERENTIALS
A. INTRODUCTION
The 1989 issue of the Employment Outlook presented estimates of unemployment rates consistent with national “standardized” rates for 182 regions in 22 OECD countries, and analysed long-term trends in regional unemployment differentials for 10 of these countriesl. The unemployment rate alone, however, gives only a partial picture of differences in labour market conditions across regions. It may understate regional labour market imbalance, if high-unemployment regions also have low activity rates. The loss of per-capita income resulting from high unemployment may be offset, in some cases, by high earnings for those at work. There are also questions concerning the contribution of other factors to unemployment differences. What is the role of the industrial structure of employment in regional unem- ployment? Do regional increases in unemployment reflect a slow pace of employment creation or, mainly, strong demographic pressures? How important have migration flows been, and in particular flows towards the low- unemployment regions? How large have been changes in the level of earnings at the regional level, and what has been their relationship to local labour market conditions?
This chapter addresses some of these questions. Section B presents regional estimates of labour force participation rates, in the form of a coloured map, and gives indicators of disparities across regions in this statistic. Section C looks at the relative contributions of population growth, labour force participation, and employment growth to the evolution of regional unemployment patterns. Section D looks at geographical mobility and its role in redistributing excess labour supply across regions, and Section E presents information on regional earnings differentials.
Sections B to E confirm the complexity and importance of regional labour market differences. High- unemployment regions do often suffer, in addition, from both low labour force participation and low earnings. Although country experiences are varied, it is clear that unemployment often cannot be attributed to such simple
factors as high earnings and rapid population growth, and that adjustment through migration is, at best, part of the solution. Against this background, what role have active policies, aiming to move jobs to depressed regions or to reduce regional imbalance in other ways, played in the past and what role may they play in the future? Regional policies, which have in various measures tried to assist depressed regions through improving infrastructure, specific incentives for job creation, and general improvements in business climate, are briefly reviewed in Section F. Section G concludes.
B. LABOUR FORCE PARTICIPATION RATES IN REiGIONS OF OECD COUNTRES
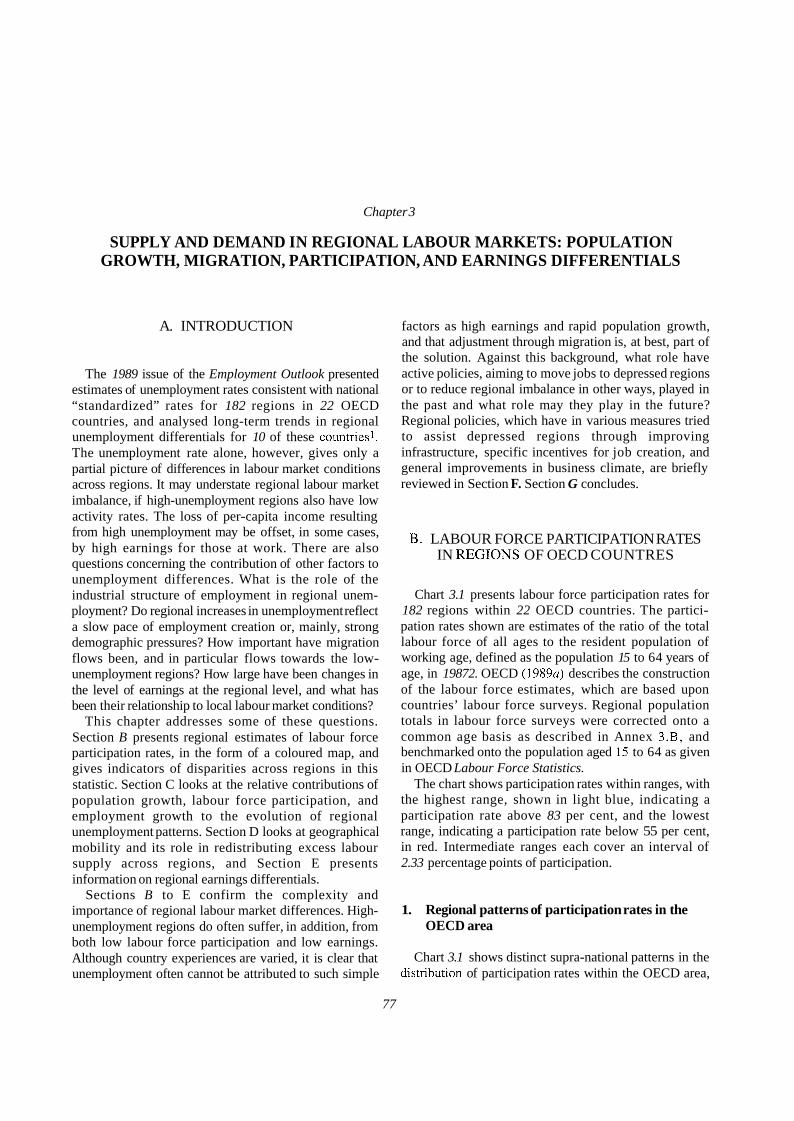
Chart 3.1 presents labour force participation rates for 182 regions within 22 OECD countries. The partici- pation rates shown are estimates of the ratio of the total labour force of all ages to the resident population of working age, defined as the population 15 to 64 years of age, in 19872. OECD ( 1 9 8 9 ~ ) describes the construction of the labour force estimates, which are based upon countries’ labour force surveys. Regional population totals in labour force surveys were corrected onto a common age basis as described in Annex 3.B, and benchmarked onto the population aged 15 to 64 as given in OECD Labour Force Statistics.
The chart shows participation rates within ranges, with the highest range, shown in light blue, indicating a participation rate above 83 per cent, and the lowest range, indicating a participation rate below 55 per cent, in red. Intermediate ranges each cover an interval of 2.33 percentage points of participation.
1. Regional patterns of participation rates in the OECD area
Chart 3.1 shows distinct supra-national patterns in the disiribution of participation rates within the OECD area,
77
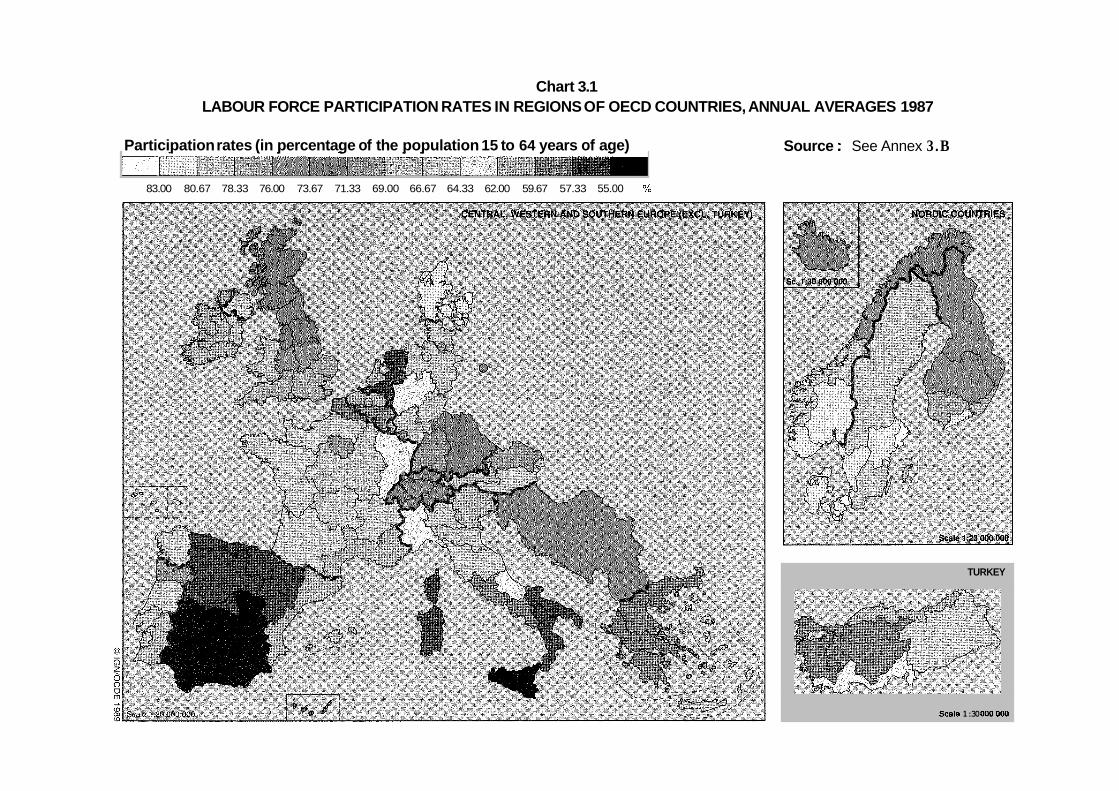
Chart 3.1 LABOUR FORCE PARTICIPATION RATES IN REGIONS OF OECD COUNTRIES, ANNUAL AVERAGES 1987
Participation rates (in percentage of the population 15 to 64 years of age) Source : See Annex 3.B
83.00 80.67 78.33 76.00 73.67 71.33 69.00 66.67 64.33 62.00 59.67 57.33 55.00 Yo
TURKEY
Scale 1 :30 O 0 0 O 0 0
O IGN/OCDE 1989
with the highest rates concentrated in Nordic countries, particularly in Denmark and in the southern regions of Sweden, Norway and Finland, in the south-eastern regions of the United Kingdom, in the central and eastern states of North America, and in the central region of Japan. Relatively low rates of labour force participation characterise the southern regions of Southern European countries.
Within Europe, participation rates are consistently high in Nordic countries, with the partial exception of the north of Norway and Finland. Regions in the United Kingdom span six ranges, from the fairly high rates of the southern regions to the fairly low rates of Northern Ireland and Wales. Low rates, always below 62 per cent, characterise the Netherlands and Belgium. Other countries in Central and Western Europe, such as Germany, France and Austria, record intermediate levels of participation rates, with low rates for regions on the German-French borders, and in the south of France and Austria. In France the range of variation is considerable, spanning seven of the ranges on the map. Finally, in countries in Southern Europe, participation rates are low, except in the northern region of Portugal. The regions Castilla-Mancha, Extremadura, and Andalucia in the south of Spain, and Sicily in the south of Italy, have the lowest participation rates in OECD countries - around two-thirds of the rates in the prosperous regions of Denmark. These differences mainly reflect variations in the labour force participation of women: according to Eurostat (1989), in 1986 differences between the high-activity rate regions of Denmark and the low-activity rate regions of Italy and Spain were in a range of 6 to 9 percentage points for men, but 36 to 42 points for women (Eurostat, however, uses a slightly different definition of the activity rate).
In Japan participation rates span six of the ranges shown on the map, with comparatively low rates in the peripheral regions at the southern and northern extremes of the country. In North America, most regions have rates in the next-to-highest ranges, with some tendency to decline in the southern United States. However, Newfoundland in Canada and West Virginia in the United States stand out with sharply lower rates, below 62 per cent.
2. Disparities in participation rates and their relationship with unemployment rates
Table 3.1 complements Chart 3.1 with summary statistical indicators for differences in participation rates and their relationship to unemployment rates. The table confirms some patterns visible in the chart. Among countries with high dispersion are Japan and Canada, and within Europe, Germany, France, Italy, Spain and Turkey.
Columns 5 to 7 of Table 3.1 examine the relationship between participation and unemployment. From one point of view, high participation may tend to cause unemployment, because it increases the labour force. However, high unemployment rates may discourage people who would otherwise seek work. Table 3.1 indicates the importance of the latter mechanism, because there is a widespread tendency for regions where unemployment is high to have low participation rates. Correlation coefficients between participation rates and unemployment are negative for the great majority of countries, often strongly so. A regression of participation rates on unemployment across regions within countries suggests that, on average, a 1 per cent increase in the unemployment rate is associated with a 0.83 per cent fall in participation. This association of high unemployment and low labour force participation is in line with cross- country evidence and time-series evidence that participation rates rise slightly at cyclical peaks [OECD (1983, Note A; 1989~2, p. 22)]. It implies significant differences in employment/population ratios across OECD regions.
Variations in the composition of the population may be another factor generating an association of low participation and high unemployment across regions: unskilled workers, youth, and older workers tend to have both low labour force participation and high unemployment rates.
The United States is a partial exception, for the negative relationship between unemployment and participation there is relatively weak. In Turkey and Ireland, the relationship is reversed. In Turkey, high unemployment is associated with high employment of family workers in agricultural activities, reflecting the possibilities for substitution of family work for economic inactivity that arise in agriculture.
High unemployment can arise in both industrial and agricultural regions. Unemployment in agricultural regions is qualitatively different from unemployment in regions dominated by industries, such as mining, textiles, or heavy industry, that are declining due to shifts in demand, production technology or international competition. Nicol and Yuill (1982), for example, argue that incomes are not so low in depressed industrial regions as in depressed agricultural regions, and relate this to the “national” character of wage negotiation in the industrial sector 3 . The presence in industrialised regions of a developed infrastructure and of an industrial labour force may give them a potential for rapid regeneration that is lacking for agricultural regions.
Most often, agricultural regions tend to be characterised by relatively high unemployment, shown by the positive correlation coefficient in the last column of Table 3.1. Within Europe, the proportion of employment in agriculture is over 50 per cent in the
80
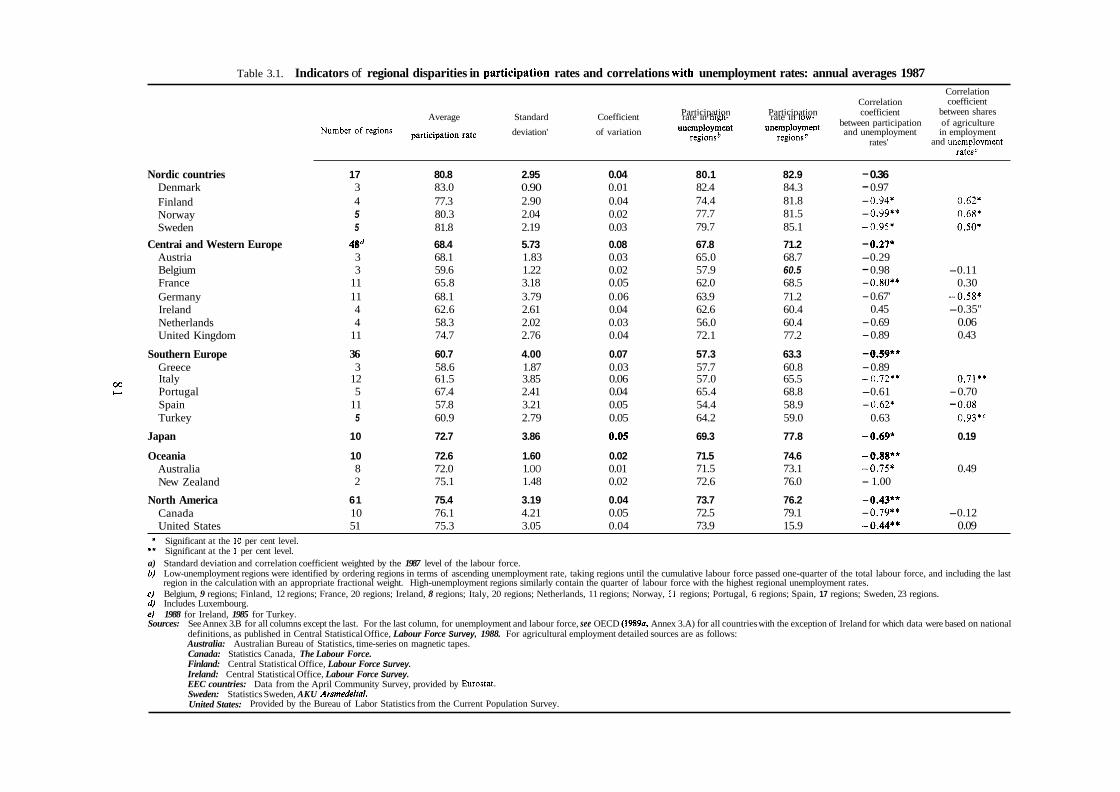
Table 3.1. Indicators of regional disparities in partkipation rates and correlations with unemployment rates: annual averages 1987 Correlation coefficient
between shares unemployment unemployment between participation of agriculture
Number of regions participation rate deviation' of variation and unemployment in employment
Correlation Participation Participation coefficient Average Standard Coefficient rate in high- rate in low-
and unemuloment rates' regionsb regionsb . .
ratesc
Nordic countries 17 80.8 2.95 0.04 80.1 82.9 - 0.36 Denmark 3 83.0 0.90 0.01 82.4 84.3 - 0.97 Finland 4 77.3 2.90 0.04 74.4 81.8 - 0.94* 0.62* Norway 5 80.3 2.04 0.02 77.7 81.5 - 0.99** 0.68* Sweden 5 81.8 2.19 0.03 79.7 85.1 -0.95* 0.50*
Centrai and Western Europe 48d 68.4 5.73 0.08 67.8 71.2 - 0.27* Austria 3 68.1 1.83 0.03 65.0 68.7 -0.29 Belgium 3 59.6 1.22 0.02 57.9 60.5 - 0.98 -0.11 France 11 65.8 3.18 0.05 62.0 68.5 - 0.80** 0.30 Germany 11 68.1 3.79 0.06 63.9 71.2 - 0.67' -O.%* Ireland 4 62.6 2.61 0.04 62.6 60.4 0.45 -0.35" Netherlands 4 58.3 2.02 0.03 56.0 60.4 - 0.69 0.06 United Kingdom 11 74.7 2.76 0.04 72.1 77.2 - 0.89 0.43
Southern Europe 36 60.7 4.00 0.07 57.3 63.3 - 0.59** Greece 3 58.6 1.87 0.03 57.7 60.8 - 0.89
oo Italy 12 61.5 3.85 0.06 57.0 65.5 -0.72** 0.71** F Portugal 5 67.4 2.41 0.04 65.4 68.8 -0.61 - 0.70
Spain 11 57.8 3.21 0.05 54.4 58.9 - 0.62* - 0.08 Turkey 5 60.9 2.79 0.05 64.2 59.0 0.63 0.93*'
Japan 10 72.7 3.86 0.05 69.3 77.8 -0.69* 0.19
Oceania 10 72.6 1.60 0.02 71.5 74.6 -0.88** Australia 8 72.0 1 .OO 0.01 71.5 73.1 -0.75* 0.49 New Zealand 2 75.1 1.48 0.02 72.6 76.0 - 1.00
North America 61 75.4 3.19 0.04 73.7 76.2 - 0.43** Canada 10 76.1 4.21 0.05 72.5 79.1 - 0.79** -0.12 United States 51 75.3 3.05 0.04 73.9 15.9 -O&** 0.09
* Significant at the 10 per cent level. ** Significant at the 1 per cent level. a) Standard deviation and correlation coefficient weighted by the 1987 level of the labour force. b) Low-unemployment regions were identified by ordering regions in terms of ascending unemployment rate, taking regions until the cumulative labour force passed one-quarter of the total labour force, and including the last
region in the calculation with an appropriate fractional weight. High-unemployment regions similarly contain the quarter of labour force with the highest regional unemployment rates. c) Belgium, 9 regions; Finland, 12 regions; France, 20 regions; Ireland, 8 regions; Italy, 20 regions; Netherlands, 11 regions; Norway, 11 regions; Portugal, 6 regions; Spain, 17 regions; Sweden, 23 regions. d) Includes Luxembourg. e) 1988 for Ireland, 1985 for Turkey. Sources: See Annex 3.B for all columns except the last. For the last column, for unemployment and labour force, see OECD (1989% Annex 3.A) for all countries with the exception of Ireland for which data were based on national
definitions, as published in Central Statistical Office, Labour Force Survey, 1988. For agricultural employment detailed sources are as follows: Australia: Australian Bureau of Statistics, time-series on magnetic tapes. Canada: Statistics Canada, The Labour Force. Finland: Central Statistical Office, Labour Force Survey. Ireland: Central Statistical Office, Labour Force Survey. EEC countries: Data from the April Community Survey, provided by Eurostat. Sweden: Statistics Sweden, AKU Arsmedeltal. United States: Provided by the Bureau of Labor Statistics from the Current Population Survey.
high-unemployment north and eastern regions of Turkey, and over 20 per cent in several high-unemployment regions of southern Italy. A similar pattern is present in Norway, Finland, Sweden and to a lesser extent in Japan and Australia. Two factors which may cause agricultural regions to experience high unemployment are the near- universal long-term decline in agricultural employment, and the seasonal nature of agricultural work. Both of these factors are, however, much more important in some countries than in others.
There are a number of countries where unemployment is low in the more agricultural regions. In Portugal, agriculture accounts for almost 40 per cent of employment in the low-unemployment Central region. The province of Luxembourg in the south of Belgium, and Drenthe in the north of the Netherlands, Galicia in Spain and Saskatchewan in Canada, are all regions with relatively high agricultural employment and relatively low unemployment rates. In Ireland too, unemployment tends to be low in the highly-agricultural central and western regions.
Statistics for the share of industry and of services in total employment were also examined, but neither of these showed any consistent association with unemployment. However, other research has found some evidence that more detailed industry structure is associated with regional levels of income and unem- ployment 5.
There are significant differences in the ways in which regions starting from a similar pattern of specialisation adapt to subsequent changes. Massachusetts and Baden- Württemberg are examples of regions starting with a strong manufacturing base in traditional activities in the early 1970s which successfully compensated for the decline of traditional manufacturing through the development of high-tech industry and sophisticated services, in the case of Massachusetts, or through the adaptation of the traditional manufacturing sectors, in the case of the German region [Sabel, Herrigel, Deeg and Kazis (1987)l. However, Massachusetts’ experience shows that all strategies carry risks, for unemployment there has recently risen sharply following declines in demand in its high-tech defence, financial service, and mini-computer sectors [The Economist, 5th May 19901.
C. THE ROLES OF SUPPLY AND DEMAND IN CHANGING LABOUR MARKET BALANCE
In considering variations in unemployment rates by region over time, the 1989 Employment Outlook [OECD (1989a)l contrasted countries in which labour market fortunes have shifted markedly across regions with
others in which regional differences have remained near fixed over the last twenty or thirty years. Unemployment rate differentials may change because of differences in the pace of employment growth at the regional level, because of differences in labour supply pressures stemming from demographic increases, because of participation rate changes, or because of some combination of these factors. Some analytic perspectives stress a particular side of the labour market - for example, the theory of “cumulative causation” [OECD (1989a, Section B. 1 .c)] sees divergences in employment generation, rather than labour supply changes, as the driving force. Assessment of the relative contribution of the factors is important for policy design.
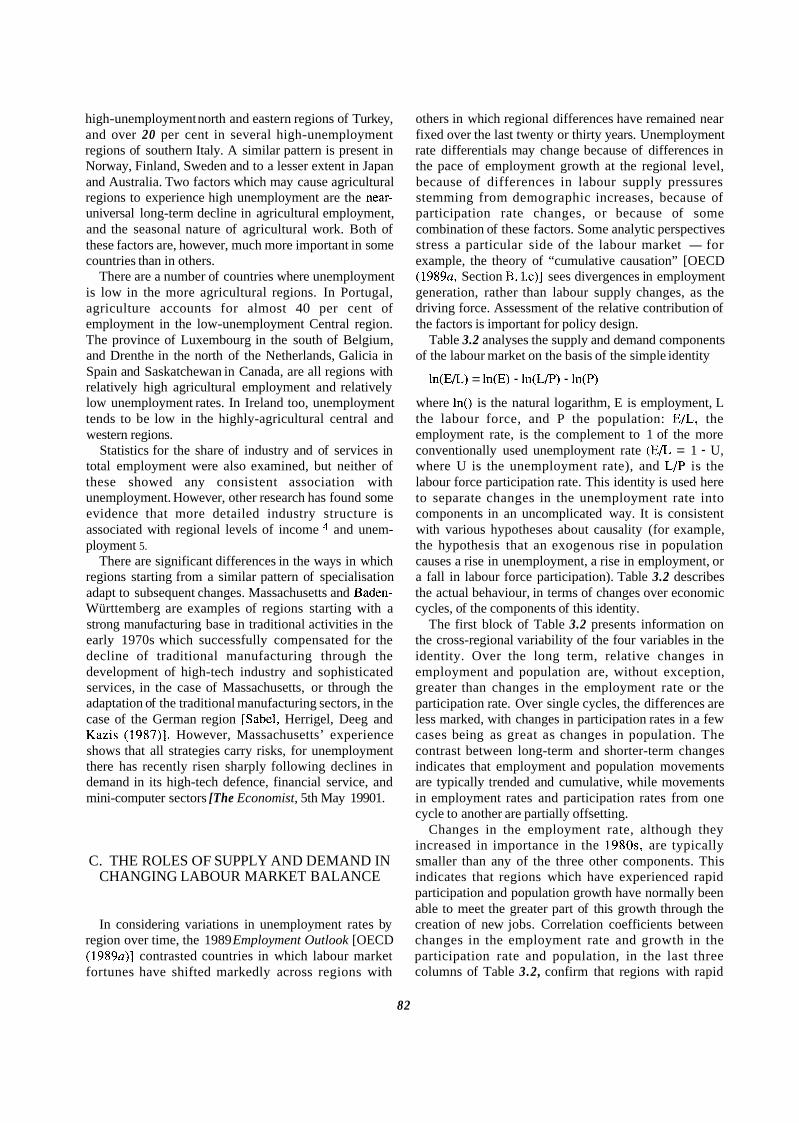
Table 3.2 analyses the supply and demand components of the labour market on the basis of the simple identity
ln(E/L) = ln(E) - ln(L/P) - ln(P)
where in() is the natural logarithm, E is employment, L the labour force, and P the population: E/L, the employment rate, is the complement to 1 of the more conventionally used unemployment rate ( E L = 1 - U, where U is the unemployment rate), and L/P is the labour force participation rate. This identity is used here to separate changes in the unemployment rate into components in an uncomplicated way. It is consistent with various hypotheses about causality (for example, the hypothesis that an exogenous rise in population causes a rise in unemployment, a rise in employment, or a fall in labour force participation). Table 3.2 describes the actual behaviour, in terms of changes over economic cycles, of the components of this identity.
The first block of Table 3.2 presents information on the cross-regional variability of the four variables in the identity. Over the long term, relative changes in employment and population are, without exception, greater than changes in the employment rate or the participation rate. Over single cycles, the differences are less marked, with changes in participation rates in a few cases being as great as changes in population. The contrast between long-term and shorter-term changes indicates that employment and population movements are typically trended and cumulative, while movements in employment rates and participation rates from one cycle to another are partially offsetting.
Changes in the employment rate, although they increased in importance in the 1980s, are typically smaller than any of the three other components. This indicates that regions which have experienced rapid participation and population growth have normally been able to meet the greater part of this growth through the creation of new jobs. Correlation coefficients between changes in the employment rate and growth in the participation rate and population, in the last three columns of Table 3.2, confirm that regions with rapid
82
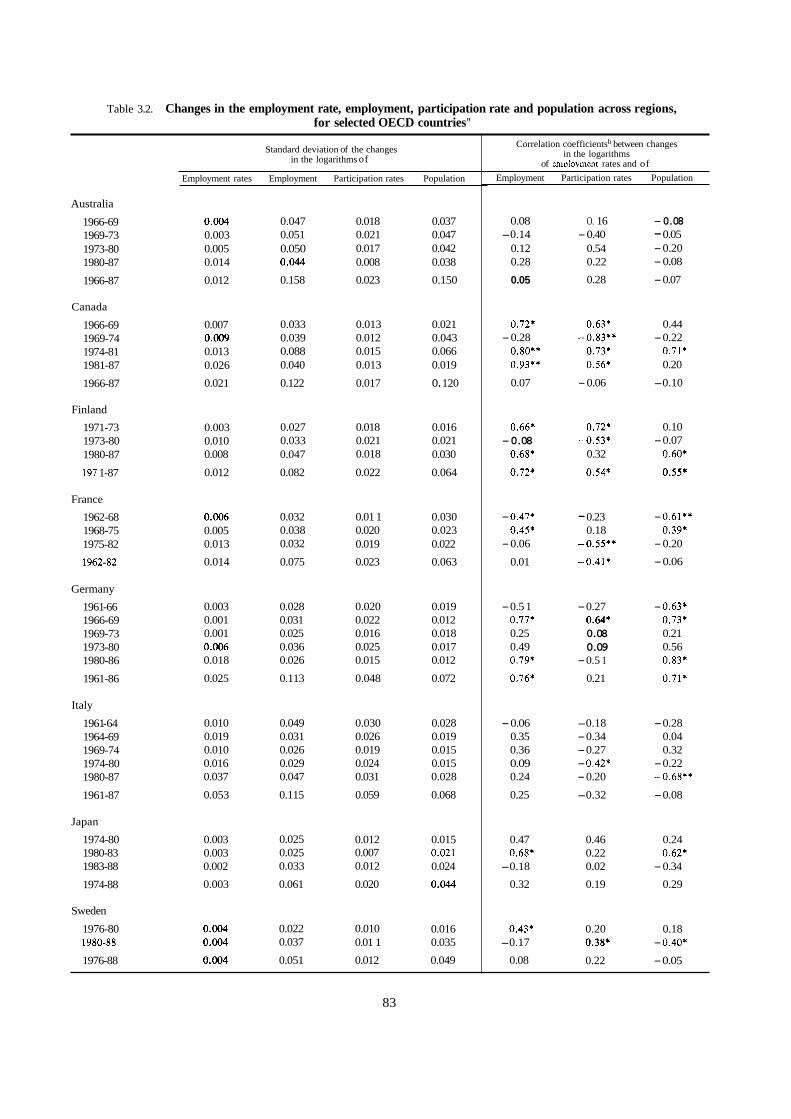
Table 3.2. Changes in the employment rate, employment, participation rate and population across regions, for selected OECD countries"
Standard deviation of the changes in the logarithms of
Employment rates Employment Participation rates Population
Australia
1966-69 1969-73 1973-80 1980-87
1966-87
Canada
1966-69 1969-74 1974-81 1981-87
1966-87
Finland
197 1-73 1973-80 1980-87
197 1-87
France
1962-68 1968-75 1975-82
1962-82
Germany
1961 -66 1966-69 1969-73 1973-80 1980-86
196 1-86
Italy
1961 -64 1964-69 1969-74 1974-80 1980-87
1961-87
Japan
1974-80 1980-83 1983-88
1974-88
Sweden
1976-80 1980-88
1976-88
0.004 0.003 0.005 0.014
0.012
0.007 0.009 0.013 0.026
0.021
0.003 0.010 0.008
0.012
0.006 0.005 0.013
0.014
0.003 0.001 0.001 0.006 0.018
0.025
0.010 0.019 0.010 0.016 0.037
0.053
0.003 0.003 0.002
0.003
0.004 0.004
0.004
0.047 0.051 0.050 0.044
0.158
0.033 0.039 0.088 0.040
0.122
0.027 0.033 0.047
0.082
0.032 0.038 0.032
0.075
0.028 0.031 0.025 0.036 0.026
0.113
0.049 0.031 0.026 0.029 0.047
0.115
0.025 0.025 0.033
0.061
0.022 0.037
0.051
0.018 0.021 0.017 0.008
0.023
0.013 0.012 0.015 0.013
0.017
0.018 0.021 0.018
0.022
0.01 1 0.020 0.019
0.023
0.020 0.022 0.016 0.025 0.015
0.048
0.030 0.026 0.019 0.024 0.031
0.059
0.012 0.007 0.012
0.020
0.010 0.01 1
0.012
0.037 0.047 0.042 0.038
0.150
0.021 0.043 0.066 0.019
o. 120
0.016 0.021 0.030
0.064
0.030 0.023 0.022
0.063
0.019 0.012 0.018 0.017 0.012
0.072
0.028 0.019 0.015 0.015 0.028
0.068
0.015 0.021 0.024
0.044
0.016 0.035
0.049
Correlation coefficientsb between changes in the logarithms
of emulovment rates and of Employment Participation rates Population
0.08 -0.14
0.12 0.28
0.05
0.72*
0.80** 0.93**
0.07
- 0.28
0.66*
0.68*
0.72*
- 0.08
- 0.47*
- 0.06
0.01
0.45*
- 0.5 1 0.77* 0.25 0.49 0.79*
0.76*
- 0.06 0.35 0.36 0.09 0.24
0.25
0.47 0.68*
-0.18
0.32
0.43* -0.17
0.08
O. 16 - 0.40
0.54 0.22
0.28
0.63*
0.73* 0.56*
-0.83**
- 0.06
0.72*
0.32
0.54*
-0.53*
- 0.23 0.18
-0.55**
-0.41*
- 0.27 0.64* 0.08 0.09
- 0.5 1
0.21
-0.18 - 0.34 - 0.27 - 0.42* - 0.20
-0.32
0.46 0.22 0.02
0.19
0.20 0.38*
0.22
- 0.08 - 0.05 - 0.20 - 0.08
- 0.07
0.44 - 0.22
0.71* 0.20
-0.10
0.10 - 0.07
0.60*
0.55*
- 0.61**
- 0.20
- 0.06
0.39*
- 0.63* 0.73* 0.21 0.56 0.83*
0.71*
- 0.28 0.04 0.32
- 0.22 -0.68**
- 0.08
0.24 0.62*
- 0.34
0.29
0.18 - 0.40*
- 0.05
83
Table 3.2 (Continued). Changes in the employment rate, employment, participation rate and population across regions, for selected OECD countries"
United Kingdom
1961 -64 1964-68 1968-73 1973-79 1979-81 1981-87
1961-87
United States
1960-66 1966-69 1969-73 1973-78 1978-87 1960-87
Standard deviation of the changes in the logarithms of
EmDlOYment rates Employment Participation rates Population
0.004 0.015 0.006 0.008 0.003 0.014 0.009 0.013 0.005 0.025 0.013 0.017 0.008 0.022 0.016 0.018 0.015 0.028 0.012 0.005 0.012 0.052 0.030 0.019
0.031 0.127 0.052 0.074
0.009 0.052 0.033 0.059 0.004 0.031 0.013 0.023 0.009 0.067 0.023 0.049 0.010 0.066 0.025 0.054 0.023 0.097 0.023 0.083 0.019 0.263 0.041 0.239
Correlation coefficients* between changes in the logarithms
of emDloMnent rates and of: Employment Participation rates Population
0.79** 0.30 0.49
-0.12 0.96** 0.68*
0.79**
- 0.02 0.16 0.39** 0.48** 0.21
0.02
0.36 0.30 0.28
0.73* 0.46
0.59*
- 0.49
0.21 0.09 0.19 0.22 0.14
- 0.30
0.70* -0.15
0.22 -0.15
0.53* 0.49
0.53*
- 0.29* - 0.01
0.27* 0.29*
- 0.06
- 0.01 *
** a)
Significant at the 10 per cent level. Significant at the 1 per cent level. In terms of the notation of the main text, In(E/L) = In(1 -U) = - U. Due to this mathematical relationship, the logarithm of the employment rate as used in this table is to a good approximation the negative of the unemployment rate. For example, at U = 0.01, In(E/L) = -0.01005 and at U = 0.10, In(E/L) = -0.10536. The standard deviation of In(E/L) may be interpreted as the standard deviation of the unemployment rate, and the correlation coefficients, reversed in sign, may be interpreted as correlations with the unemployment rate.
0) Correlation coefficients weighted by 1980 labour force. Time periods are selected on the basis of the beak-to-peak) major cycles in Gross Domestic Product [Nilsson (1987, Annex Table A)]. For France the time periods correspond to census dates.
Sources: For the employment and unemployment series, see OECD (19890, Annex 3.B). For population data, sources and definitions are as follows: Australia: Population 15 years old and over, from the monthly Labour Force Surveys. Canada: Population 15 years old and over, from the monthly Labour Force Surveys. Finland: Population 15 to 74 years of age, Labour Force Survey. France: Population of all ages, from the population censuses. Germany: Italy: Population of all ages, supplied by ISTAT. Japan: Population 15 years old and over, from the monthly Labour Force Survey. Sweden: United Kingdom: Uniied States: Population 16 years old and over; data from the labour force survey have been extrapolated back to 1970 on the basis of data for total resident population 16 years old and over, supplied by the U.S. Bureau of the Census, and readjusted to conform to the labour force survey value for the United States; a similar method has been used for the years 1960-69 where, however, data for resident population of all ages, also supplied by the US Bureau of the Census, have been used.
Population of all ages, from the Mikrozensus.
Population 16 to 64 years of age, from the Labour Force Survey. Population of all ages, supplied by CSO.
population growth have as often experienced relatively large falls in employment rates (and hence relatively large rises in unemployment rates), as the opposite. Regions with rapid participation growth have, in about two-thirds of the cycles examined, actually experienced a relative rise in their employment rate (which means a relative fall in their unemployment rate); this finding reflects, in terms of changes over time, the negative relationship between unemployment and participation already reported for a given point in time in Section B.
These results indicate that it is not generally useful to think of regional unemployment changes as being due in a rather mechanical way to the population or labour force growth exceeding growth in a relatively static stock of available jobs. Although in some countries and
at some times this interpretation may have seemed plausible, it has just as often broken down completely. The overview here, based on the experience of many countries over many time-periods, shows that growth or decline in the population and labour force typically affect employment, rather than the employment and unemployment rates.
D. REGIONAL MIGRATION
Geographical mobility of workers and their families across regions with different labour market conditions is one important component of population increase at the
84
regional level, and an important dimension of labour market flexibility. Inter-regional migration may be examined in terms of gross and net flows. Gross flows, even when they are offsetting in quantitative terms, may be a vital element in labour market adjustment because they permit a better match between available jobs and the skill characteristics of workers. Net flows are the appropriate measure for the direct effect of migration on population and excess labour supply at the regional level.
1. Size and trends in regional migration flows
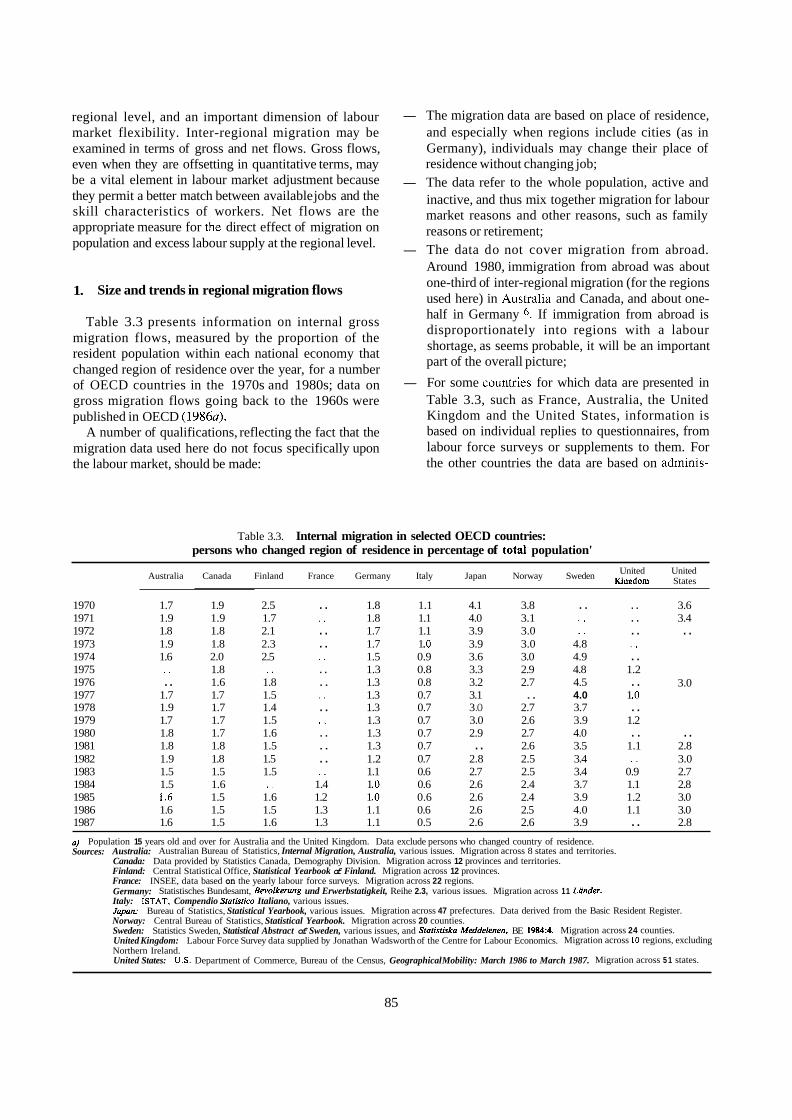
Table 3.3 presents information on internal gross migration flows, measured by the proportion of the resident population within each national economy that changed region of residence over the year, for a number of OECD countries in the 1970s and 1980s; data on gross migration flows going back to the 1960s were published in OECD (1986~).
A number of qualifications, reflecting the fact that the migration data used here do not focus specifically upon the labour market, should be made:
- The migration data are based on place of residence, and especially when regions include cities (as in Germany), individuals may change their place of residence without changing job;
- The data refer to the whole population, active and inactive, and thus mix together migration for labour market reasons and other reasons, such as family reasons or retirement;
- The data do not cover migration from abroad. Around 1980, immigration from abroad was about one-third of inter-regional migration (for the regions used here) in Ausîralia and Canada, and about one- half in Germany 6. If immigration from abroad is disproportionately into regions with a labour shortage, as seems probable, it will be an important part of the overall picture;
- For some countxies for which data are presented in Table 3.3, such as France, Australia, the United Kingdom and the United States, information is based on individual replies to questionnaires, from labour force surveys or supplements to them. For the other countries the data are based on adminis-
Table 3.3. Internal migration in selected OECD countries: persons who changed region of residence in percentage of total population'
United United States Australia Canada Finland France Germany Italy Japan Norway Sweden
3.0
~~
1970 1.7 1.9 2.5 .. 1.8 1.1 4.1 3.8 . . .. 3.6 1971 1.9 1.9 1.7 . . 1.8 1.1 4.0 3.1 . . . . 3.4 1972 1.8 1.8 2.1 .. 1.7 1.1 3.9 3.0 . . .. .. 1973 1.9 1.8 2.3 .. 1.7 1 .O 3.9 3.0 4.8 .. 1974 1.6 2.0 2.5 . . 1.5 0.9 3.6 3.0 4.9 .. 1975 . . 1.8 . . .. 1.3 0.8 3.3 2.9 4.8 1.2 1976 .. 1.6 1.8 .. 1.3 0.8 3.2 2.7 4.5 . . 1977 1.7 1.7 1.5 .. 1.3 0.7 3.1 .. 4.0 1 .O 1978 1.9 1.7 1.4 .. 1.3 0.7 3 .O 2.7 3.7 .. 1979 1.7 1.7 1.5 . . 1.3 0.7 3.0 2.6 3.9 1.2 1980 1.8 1.7 1.6 . . 1.3 0.7 2.9 2.7 4.0 . . .. 1981 1.8 1.8 1.5 .. 1.3 0.7 .. 2.6 3.5 1.1 2.8 1982 1.9 1.8 1.5 .. 1.2 0.7 2.8 2.5 3.4 .. 3.0 1983 1.5 1.5 1.5 .. 1.1 0.6 2.7 2.5 3.4 0.9 2.7 1984 1.5 1.6 . . 1.4 1 .O 0.6 2.6 2.4 3.7 1.1 2.8 1985 1.6 1.5 1.6 1.2 1 .O 0.6 2.6 2.4 3.9 1.2 3.0 1986 1.6 1.5 1.5 1.3 1.1 0.6 2.6 2.5 4.0 1.1 3.0 1987 1.6 1.5 1.6 1.3 1.1 0.5 2.6 2.6 3.9 .. 2.8
a) Population 15 years old and over for Australia and the United Kingdom. Data exclude persons who changed country of residence. Sources: Australia: Australian Bureau of Statistics, Internal Migration, Australia, various issues. Migration across 8 states and territories.
Canada: Data provided by Statistics Canada, Demography Division. Migration across 12 provinces and territories. Finland: Central Statistical Office, Statistical Yearbook of Finland. Migration across 12 provinces. France: INSEE, data based on the yearly labour force surveys. Migration across 22 regions. Germany: Statistisches Bundesamt, Bevolkerung und Erwerbstatigkeit, Reihe 2.3, various issues. Migration across 1 1 Lander. Italy: ISTAT, Compendio Statistic0 Italiano, various issues. Japan: Bureau of Statistics, Statistical Yearbook, various issues. Migration across 47 prefectures. Data derived from the Basic Resident Register. Norway: Central Bureau of Statistics, Statistical Yearbook. Migration across 20 counties. Sweden: Statistics Sweden, Statistical Abstract of Sweden, various issues, and Statistiska Meddelenen, BE 1984:4. Migration across 24 counties. United Kingdom: Labour Force Survey data supplied by Jonathan Wadsworth of the Centre for Labour Economics. Migration across 10 regions, excluding Northern Ireland. United States: US. Department of Commerce, Bureau of the Census, Geographical Mobility: March 1986 to March 1987. Migration across 5 1 states.
85
trative population registers or on other administra- tive files, and the value of these data will depend on the accuracy and completeness of the registers, as well as on the stringency of administrative regu- lations governing changes in residence 7.
Furthermore, gross migration flows depend upon the size of the administrative regions considered. Sub- division of countries into a larger number of regions will increase the gross flows recorded and aggregations among regions will reduce the flows. Differences in the size of regions (however defined) used in different countries therefore make cross-country comparisons of inter-regional migration rates uncertain. Such limitations are however less important when attention is focused on changes in these flows over time.
Among the countries for which information in Table 3.3 goes back to the early 1970s, there is a significant and uninterrupted reduction in gross migration rates for Germany and Italy, exceeding 50 per cent in the case of Italy and almost approaching that level for Germany. Data for other countries suggest, however, a different pattern. Finland, Canada and Japan record an interruption of the fall in gross inter-regional migration rates after 1978, 1983 and 1984, respectively; while Australia, France, Norway, Sweden and the United Kingdom have recently recorded slight increases. In France census data (not shown in the table) on changes of residence relative to the previous census date suggest that mobility declined between 1968-1975 and 1975- 1982. Interstate gross migration flows in the United States, after the declines recorded in the early 1970s, have stabilized thereafter 8.
In the European countries especially, the initial falls in regional migration took place mainly during and immediately after the sharp recession of 1974-75. Cessation or reversal of the downwards trend during the 1980s seems to be related to general improvements in labour market conditions. Thus high national unem- ployment, for a given size of regional differentials, appears on balance to discourage, rather than to encourage, internal migration.
2. Regional migration and unemployment differentials
Even when substantial, migration flows may fail to achieve a significant redistribution of population and labour force among different areas, because the same region may experience simultaneously both in- and out- migration. Further, inter-regional migration flows will act to reduce regional unemployment differentials directly through adjusting the labour force only when migrants move from high-unemployment-rate to low-
unemployment-rate regions. Evidence on both dimen- sions is provided by Table 3.4.
Ratios of net to gross migration, shown in the first column, are always low, above 10 per cent only in Australia, Canada, Greece, Italy and Spain. The average value for the 14 countries included in the table is slightly below 10 per cent, indicating that for 100 movements the average net in-migration region experiences 45 out-migrations and 55 in-migrations, and conversely for the average net out-migration region 9.
Information on the “direction” of regional migration flows in the second and third columns shows that in most countries net migration is away from high- unemployment and into low-unemployment regions. In 7 of the 14 countries, losses from one-quarter of regions with highest Unemployment rates and/or gains by the one-quarter of regions with lowest unemployment rates are over half of total net migration. However, the net inflows or outflows involved average only about 3 per cent of gross migration.
Australia and Spain are exceptions to the general pattern. In Australia, Victoria has low unemployment and out-migration, and Queensland has high unemployment and net in-migration. In Spain the north- west agricultural regions (Galicia, Castilla y Leon) experience out-migration, while high-unemployment Andalucia in the south experiences in-migration, and the main migratory flows are towards the capital region of Madrid (with intermediate unemployment rate). Greece and the United Kingdom also experience net outflows from low unemployment regions; for the United Kingdom this mainly reflects outflows from the London area as a consequence of growing congestion of the metropolitan area and higher housing costs.
Survey-based data for some OECD countries provide information about migrants’ characteristics and their reasons for moving. For Australia in 1987, for example, the main reason for changing usual residence was employment-related for 44 per cent of migrants. Only for one-quarter of these was the reason “to look for work”. Data based on the labour force survey for England and Wales confirm the limited importance of unemployment reasons in aggregate migration flows. Hughes and McCormick (1989, p. 3) stress the importance of “job transfers” within migration flows: “Just over 40 per cent of migrant heads of household worked for the same employer before and after the move”. Also, migration probabilities are much lower among manual workers relative to non-manual, in spite of higher regional unemployment disparities for the first group of workers. An order-of-magnitude estimate of the impact of internal migration on labour market balance, based on the information presented in Table 3.4 for top and bottom unemployment-rate regions, can be made as follows. Since annual gross flows involve about
86
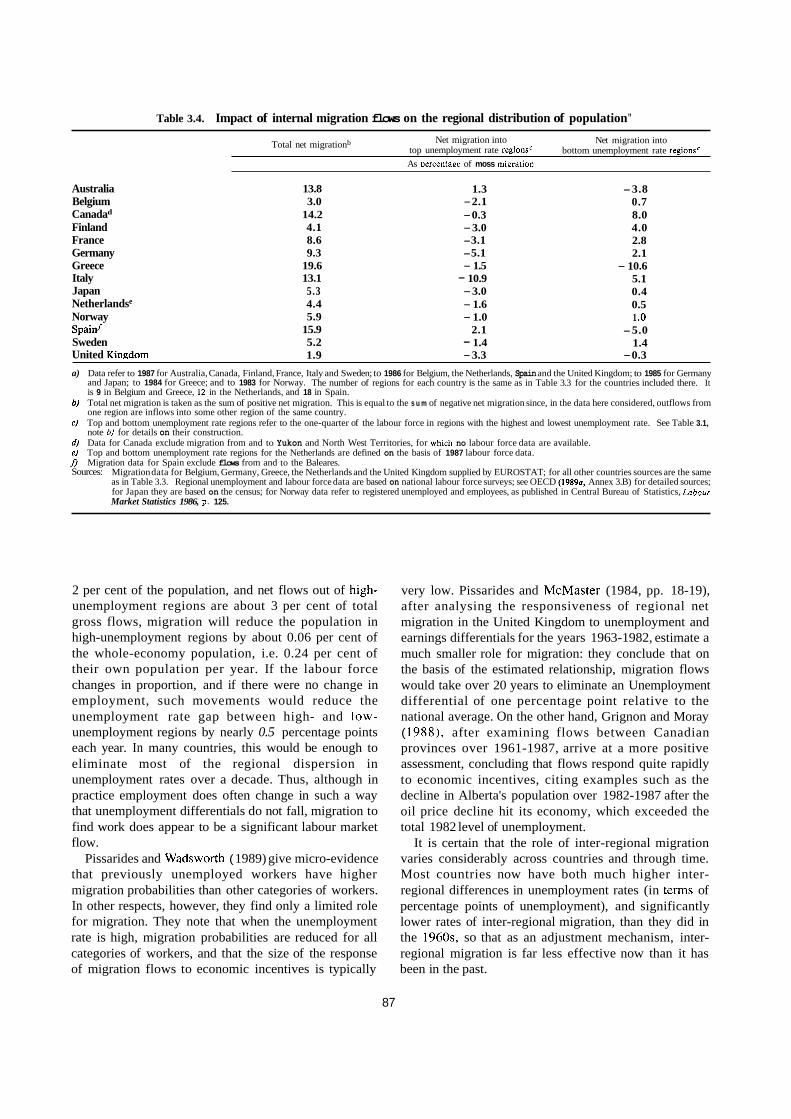
Table 3.4. Impact of internal migration flows on the regional distribution of population"
Net migration into top unemployment rate regionsc
Net migration into bottom unemployment rate regionsC Total net migrationb
As Dercentane of moss miaration
Australia Belgium Canadad
Finland France Germany Greece Italy Japan Netherlandse
Norway SpainJ Sweden United Kinadorn
13.8 3.0
14.2 4.1 8.6 9.3
19.6 13.1 5.3 4.4 5.9
15.9 5.2 1.9
1.3 - 2.1 - 0.3 - 3.0 -3.1 -5.1 - 1.5 - 10.9 - 3.0 - 1.6 - 1.0
2.1 - 1.4 - 3.3
-3.8 0.7 8.0 4.0 2.8 2.1
- 10.6 5.1 0.4 0.5 1 .O
-5.0 1.4
- 0.3
a) Data refer to 1987 for Australia, Canada, Finland, France, Italy and Sweden; to 1986 for Belgium, the Netherlands, Spain and the United Kingdom; to 1985 for Germany and Japan; to 1984 for Greece; and to 1983 for Norway. The number of regions for each country is the same as in Table 3.3 for the countries included there. It is 9 in Belgium and Greece, 12 in the Netherlands, and 18 in Spain.
b) Total net migration is taken as the sum of positive net migration. This is equal to the s u m of negative net migration since, in the data here considered, outflows from one region are inflows into some other region of the same country.
c) Top and bottom unemployment rate regions refer to the one-quarter of the labour force in regions with the highest and lowest unemployment rate. See Table 3.1, note b) for details on their construction.
d) Data for Canada exclude migration from and to Yukon and North West Territories, for which no labour force data are available. e) Top and bottom unemployment rate regions for the Netherlands are defined on the basis of 1987 labour force data. fl Migration data for Spain exclude flows from and to the Baleares. Sources: Migration data for Belgium, Germany, Greece, the Netherlands and the United Kingdom supplied by EUROSTAT; for all other countries sources are the same
as in Table 3.3. Regional unemployment and labour force data are based on national labour force surveys; see OECD (1989u, Annex 3.B) for detailed sources; for Japan they are based on the census; for Norway data refer to registered unemployed and employees, as published in Central Bureau of Statistics, Lubour Market Statistics 1986, p. 125.
2 per cent of the population, and net flows out of high- unemployment regions are about 3 per cent of total gross flows, migration will reduce the population in high-unemployment regions by about 0.06 per cent of the whole-economy population, i.e. 0.24 per cent of their own population per year. If the labour force changes in proportion, and if there were no change in employment, such movements would reduce the unemployment rate gap between high- and low- unemployment regions by nearly 0.5 percentage points each year. In many countries, this would be enough to eliminate most of the regional dispersion in unemployment rates over a decade. Thus, although in practice employment does often change in such a way that unemployment differentials do not fall, migration to find work does appear to be a significant labour market flow.
Pissarides and Wadsworth ( 1989) give micro-evidence that previously unemployed workers have higher migration probabilities than other categories of workers. In other respects, however, they find only a limited role for migration. They note that when the unemployment rate is high, migration probabilities are reduced for all categories of workers, and that the size of the response of migration flows to economic incentives is typically
very low. Pissarides and McMaster (1984, pp. 18-19), after analysing the responsiveness of regional net migration in the United Kingdom to unemployment and earnings differentials for the years 1963- 1982, estimate a much smaller role for migration: they conclude that on the basis of the estimated relationship, migration flows would take over 20 years to eliminate an Unemployment differential of one percentage point relative to the national average. On the other hand, Grignon and Moray ( 1988), after examining flows between Canadian provinces over 1961-1987, arrive at a more positive assessment, concluding that flows respond quite rapidly to economic incentives, citing examples such as the decline in Alberta's population over 1982-1987 after the oil price decline hit its economy, which exceeded the total 1982 level of unemployment.
It is certain that the role of inter-regional migration varies considerably across countries and through time. Most countries now have both much higher inter- regional differences in unemployment rates (in terms of percentage points of unemployment), and significantly lower rates of inter-regional migration, than they did in the 1960s, so that as an adjustment mechanism, inter- regional migration is far less effective now than it has been in the past.
87
E. REGIONAL EARNINGS DIFFERENTIALS
Regional earnings differentials are one factor that may influence both migration decisions and employment creation at the regional level. This section looks at evidence on their development through time and their relationship to local labour market conditions.
1. Trends in earnings differentials by region
Previous issues of the Employment Outlook have looked at earnings differentials by industry, occupation, age and sex. Earnings are also differentiated by region, and some factors operate specifically upon regional earnings differentials. In a number of European countries, such as France and Italy, minimum earnings for local areas were fixed in the post-war period through collective bargaining; the abolition of these “wage zones” at the end of the 1970s, under the pressure of egalitarian considerations, gave a particular impetus to equalisation of earnings differentials by region. Nevertheless, wage drift has played a role in the continuation of these differentials.
Average earnings in a region reflect differences in the occupational and industry composition of jobs, as well as regional differences in pay for similar jobs. This is clear in the case of some capital cities such as London, where high earnings are due both to the fact that many firms explicitly pay higher rates, and to a concentration of employment in high-paid non-manual occupations. A detailed study that corrected earnings differentials for the effect of employment structure found that for industry in 1978 in France, Italy, and Germany, the gaps between the highest and the lowest regional earnings levels were 8 to 16 per cent for manuals, and 8 to 13 per cent for non-manuals, depending upon the country. The corrections applied - which took account of qualification, sex, job tenure, detailed industry and establishment size - explained about half of the variance of regional earnings [CERC (1988, Tables III- 10, VI-3, VI-4)). Podgursky and Swaim (1984) for the United States explain nearly all the regional variance in nominal earnings by controlling for metropolitan/non- metropolitan area, education, job tenure, sex, race, establishment size, union membership, occupation, and broad industry.
The regional statistics reported in this section are in nominal terms. Differences in real earnings (after applying region-specific price indices) would probably be smaller than the differences in nominal earnings discussed below: prices tend to be higher in high-earning regions, if only because earnings for some people are the price of services for others.
Chart 3.2 presents trends in regional earnings dispersion, measured by the weighted coefficient of variation. Large differences in the coverage, source and definition of the data sets used (see Annex 3.C), as well as the differences in the degree of regional detail available, affect cross-country comparisons of both the levels and trends. Chart 3.2 does, however, identify a number of common patterns.
For the majority of countries included in Chart 3.2, regional earnings dispersion fell in the 1960s and 1970s, although often with considerable short-term fluctuations. In the 1980s, a new trend towards greater dispersion appeared. The fall in earnings dispersion in the 1960s and 1970s is particularly evident for European countries, but is also present in the United States, Australia and - to a lesser extent - Canada; only in Japan is the picture one of relative stability. Trends in the 1980s are more differentiated across countries. In the United Kingdom, the United States, France and Japan, regional dispersion clearly increased. In Sweden and Germany, the series in the chart show little change, but other series (not shown) for non-manual workers suggest an increase in dispersion 10. Only Australia and Canada seem, so far, to have escaped this tendency to a reopening in regional earnings differentials.
2. Changes in earnings at the regional level and their relationship with local labour market conditions
Information on the correlation between recent and historical patterns of earnings by region is presented in Table 3.5. Changes in relative earnings at the regional level have been substantial, especially in non-European OECD countries.
The structure of regional earnings differences has been remarkably stable - with correlation coefficients between relative earnings at different dates never falling below 0.90 - in France since the 1960s, and in the United Kingdom and Sweden since the 1970s. These countries have been characterised by continual relatively large differentials between the highly-urbanised capital regions and peripheral regions. In France, the earnings gap between the capital region of Ile-de-France and the rest of the country fell slightly until the end of the 1970s (from 1.30 to 1.22 of the national level) but it increased thereafter, while several regions - such as Picardie in the north, Alsace and Franche-Comté in the east, Aquitaine and Midi-Pyrénées, in the south-west, Languedoc-Roussillon in the Mediterranean region - drew substantially closer to the national average [see CERC (1989) for a more detailed analysis]. In the United Kingdom, earnings in the capital region of south-east fell
88
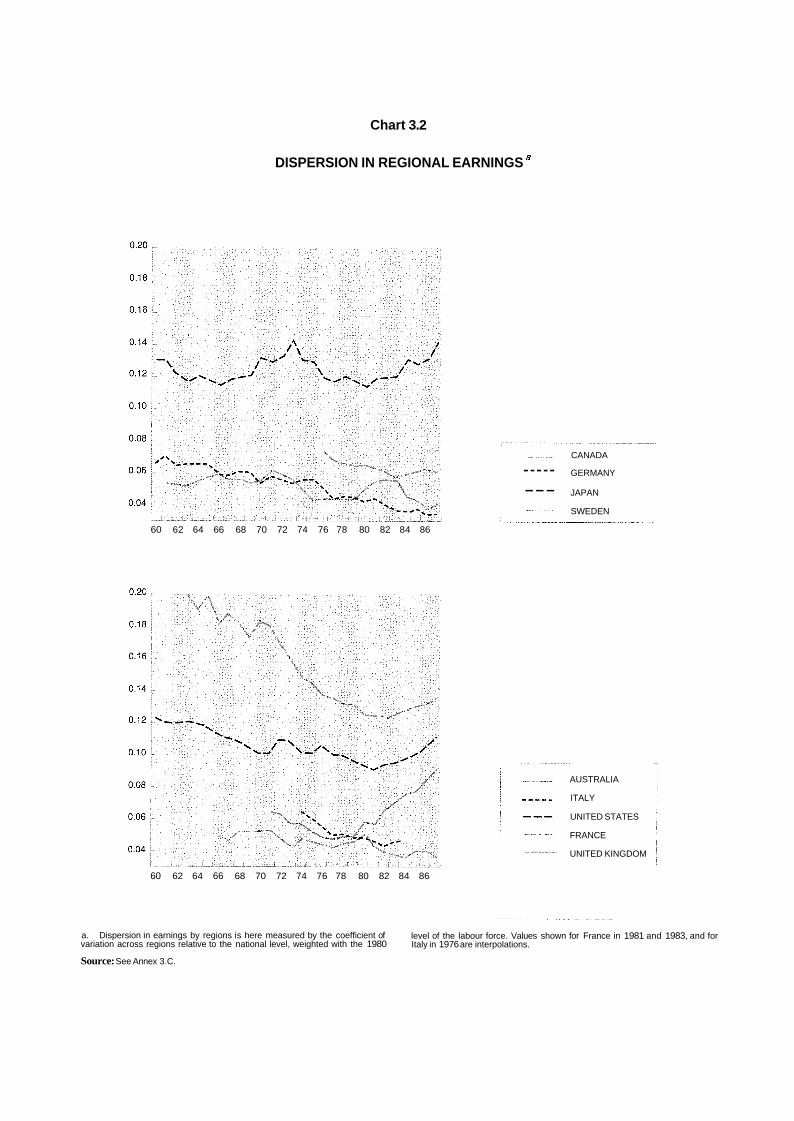
Chart 3.2
DISPERSION IN REGIONAL EARNINGS a
60 62 64 66 68 70 72 74 76 78 80 82 84 86
60 62 64 66 68 70 72 74 76 78 80 82 84 86
-- ~~ __ CANADA
----- GERMANY
--- JAPAN
SWEDEN _ _ _ _ _ _
AUSTRALIA
ITALY
UNITED STATES
FRANCE
UNITED KINGDOM
a. Dispersion in earnings by regions is here measured by the coefficient of variation across regions relative to the national level, weighted with the 1980
Source: See Annex 3.C.
level of the labour force. Values shown for France in 1981 and 1983, and for Italy in 1976 are interpolations.
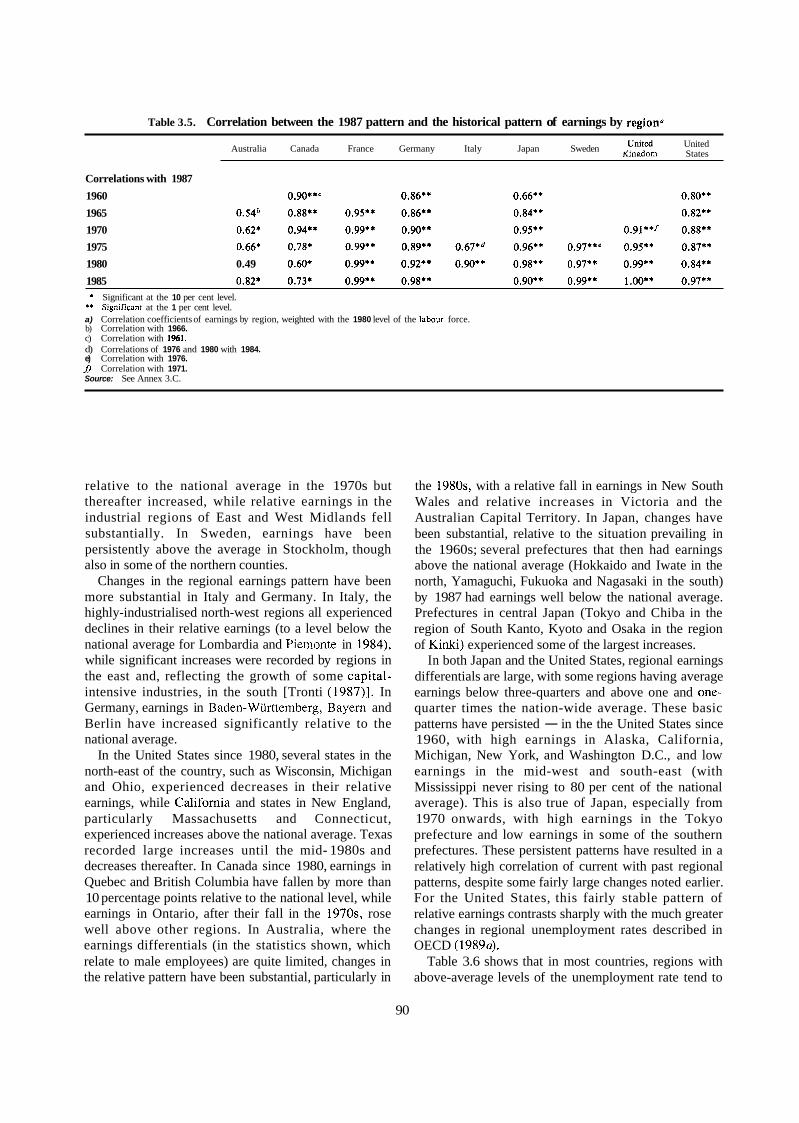
Table 3.5. Correlation between the 1987 pattern and the historical pattern of earnings by regionn
United Kingdom States Japan Sweden United Australia Canada France Germany Italy
Correlations with 1987 1960 0.90**' 0.86** O.&** 0.80** 1965 0.54b 0.88** 0.95** 0.86** 0.84** 0.82** 1970 0.62* 0.94** 0.99** O N * * 0.95** 0.91**/ 0.88** 1975 0.66* 0.78* 0.99** 0.89** 0.67*d 0.96** 0.97**' 0.95** 0.87** 1980 0.49 0.60* 0.99** 0.92** O M * * 0.98** 0.97** 0.99** 0.84** 1985 0.82* 0.73* 0.99** 0.98** O M * * 0.99** 1.00** 0.97** * Significant at the 10 per cent level.
** Significanf at the 1 per cent level. a) Correlation coefficients of earnings by region, weighted with the 1980 level of the labour force. b) Correlation with 1966. c) Correlation with 1%1. d) Correlations of 1976 and 1980 with 1984. e) Correlation with 1976. f) Correlation with 1971. Source: See Annex 3.C.
relative to the national average in the 1970s but thereafter increased, while relative earnings in the industrial regions of East and West Midlands fell substantially. In Sweden, earnings have been persistently above the average in Stockholm, though also in some of the northern counties.
Changes in the regional earnings pattern have been more substantial in Italy and Germany. In Italy, the highly-industrialised north-west regions all experienced declines in their relative earnings (to a level below the national average for Lombardia and Piemonte in 1984), while significant increases were recorded by regions in the east and, reflecting the growth of some capital- intensive industries, in the south [Tronti (1987)l. In Germany, earnings in Baden-Württemberg, Bayern and Berlin have increased significantly relative to the national average.
In the United States since 1980, several states in the north-east of the country, such as Wisconsin, Michigan and Ohio, experienced decreases in their relative earnings, while California and states in New England, particularly Massachusetts and Connecticut, experienced increases above the national average. Texas recorded large increases until the mid- 1980s and decreases thereafter. In Canada since 1980, earnings in Quebec and British Columbia have fallen by more than 10 percentage points relative to the national level, while earnings in Ontario, after their fall in the 1970s, rose well above other regions. In Australia, where the earnings differentials (in the statistics shown, which relate to male employees) are quite limited, changes in the relative pattern have been substantial, particularly in
the 1980s, with a relative fall in earnings in New South Wales and relative increases in Victoria and the Australian Capital Territory. In Japan, changes have been substantial, relative to the situation prevailing in the 1960s; several prefectures that then had earnings above the national average (Hokkaido and Iwate in the north, Yamaguchi, Fukuoka and Nagasaki in the south) by 1987 had earnings well below the national average. Prefectures in central Japan (Tokyo and Chiba in the region of South Kanto, Kyoto and Osaka in the region of Kinki) experienced some of the largest increases.
In both Japan and the United States, regional earnings differentials are large, with some regions having average earnings below three-quarters and above one and one- quarter times the nation-wide average. These basic patterns have persisted - in the the United States since 1960, with high earnings in Alaska, California, Michigan, New York, and Washington D.C., and low earnings in the mid-west and south-east (with Mississippi never rising to 80 per cent of the national average). This is also true of Japan, especially from 1970 onwards, with high earnings in the Tokyo prefecture and low earnings in some of the southern prefectures. These persistent patterns have resulted in a relatively high correlation of current with past regional patterns, despite some fairly large changes noted earlier. For the United States, this fairly stable pattern of relative earnings contrasts sharply with the much greater changes in regional unemployment rates described in OECD (19894.
Table 3.6 shows that in most countries, regions with above-average levels of the unemployment rate tend to
90

Table 3.6. Correlation coefficients between earnings and unemployment rates“
United United Kingdom States Australia Canada France Germany Italy Japan
Correlations between the levels in 1987* -0.41 -0.46 -0.53* 0.52 0.44* 0.06 -0.31 -0.72* -0.26*
Average of the correlation between 1-year changes in earnings and unemployment rates -0.18 -0.14 0.06 -0.18 -0.09 0.04 -0.16 -0.30
Average of the correlation between 5-year changes in earnings and unemployment rates -0.23 -0.06 -0.03 -0.50 -0.09 -0.18 0.14 -0.32 -0.23
* Significant at the 10 per cent level. U) All correlation coefficients are weighted by 1980 labour force. See Annex 3.C for time periods considered. b) 1985 for Japan; 1984 for Italy. Sources: Annex 3.C for earnings data and OECD (1989a, Annex 3.B) for unemployment rates. Correlations for Japan and France refer to census-based and survey-based
unemployment rates respectively.
have below-average earnings, with the exception of Italy (where earnings in industry are relatively high in many high-unemployment southern regions) and Germany (where earnings in the low-unemployment southern region of Bayern are relatively low). Also, in most countries, increases in earnings and increases in unemployment, over a 1-year or a 5-year period, are negatively correlated’ ’ .
The statistical relationship between unemployment and earnings depends upon the direction of causality that is supposed. Increases in unemployment generally tend to cause earnings to fall: this effect is well known in macroeconomics as the Phillips curve. However, insofar as earnings increases cause a fall in the demand for labour, unemployment will be positively correlated with earnings. While exact significance levels cannot be easily computed for the correlation coefficients shown in Table 3.6, because they are averages over time, negative signs clearly dominate indicating that, as far as contemporaneous correlations are concerned, the Phillips curve direction of causality is generally stronger.
predecessor has been to emphasize that the widely differing experiences of regions should be taken into account in nearly all areas of analysis and policy.
Nevertheless, it has generally been considered that certain specific policies are also needed to improve the spatial distribution of economic activity. The main elements of traditional “regional policy” have been:
- Incentives, in the form of grants, subsidised loans, or investment tax allowances, available to firms that set up or expand production in particular “designated regions” of the country;
- Policies that bias government-financed infrastruc- ture investment (roads, railways, industrial estates, etc.) towards designated regions. Where investment is not directly administered by the national government, this policy may take the form of differentiated rates of grant contribution towards investments managed by local authorities;
- Planning controls that at times have discouraged new building and investment in already over- crowded or overheated regions;
- Direct administrative decisions to locate state industry in the problem regions and to disperse government offices.
E REGIONAL POLICIES IN THE 1980s 12
Most government consumption and investment expenditure implicitly involves decisions about the allocation of the expenditure across regions. Even apparently economy-wide policy changes, such as a change in progressivity of the personal income tax schedule or a higher exchange rate, may have markedly different effects on different regions within the country 13. Much of the purpose of this chapter and its
One indication of the flexible coverage of the concept of “regional policy” is that in relatively few countries does it have a separate national administration agency. In some countries, most policy is administered by the regions themselves. More often, regional policy is administered by a Ministry of Industry, Economic Affairs, or (especially as regards infrastructure investment) Environment, and sometimes the Ministry of Labour.
91
During the 1950s most OECD countries did not have an explicit regional policy and those which did, like Italy, laid most emphasis on basic infrastructure measures; in fact, most of the economic policy activity was focused in those years on national recovery and reconstruction, more than on its spatial distribution. The pendulum began to swing in favour of regional policy towards the end of the decade, a development that reflected the increased importance of distributive considerations in policy-making and the increased visibility of the regional problems in the OECD area. The trend continued into the 1960s and mid-1970s. The priority and expenditure accorded to regional policy measures increased and a variety of instruments were in force; financial incentives, in the form of grants, loans at subsidised interest rates, transport subsidies, equity support and tax allowances, designed to encourage the relocation of firms and investment into problem areas; the provision of physical infrastructure; disincentives and controls in growth regions; strategies based on regional structural planning (as in Norway) and inter- regional transfer system (such as in Austria and Switzerland); direct government intervention, such as public works programmes in the United States, the planned location of state industry in Italy, and the dispersal of government offices and public sector jobs in Denmark, Finland, France, the Netherlands and the United Kingdom.
The favourable environment for regional policy changed markedly following the oil crisis of the mid- 1970s. No longer was overheating and the threat of congestion in the pressured regions a problem: and unemployment, no longer limited to traditional problem regions, came to be seen as a national problem, and not one which governments were necessarily able to solve. As is often the case in policy-making, actual policy changes took longer to feed through. Cutbacks were relatively limited in the latter half of the 1970s and indeed, regional policy expenditure continued to increase in real terms in most countries. By the 1980s, however, general pressures on public expenditure led to cuts in funding for regional assistance in several countries 14.
More recently, interest in regional policy has begun to revive, reflecting, among other influences, overheating again becoming a problem in certain more prosperous regions (for instance, in a number of Nordic countries) and a renewed awareness that - as this chapter and its predecessor have shown - regional disparities remain serious and have in some cases increased during the 1980s, visibly in particular lagging regions (for example in the south of Italy).
At the same time, the 1980s have seen considerable changes in the direction of regional policy. In Europe, a number of very important general incentive schemes, available relatively automatically within designated
regions, have been abolished. The policies for promotion of investment that remain are more often based on capital grants, with much more discretion in their administration. They are more closely targeted, with reference to both the areas concerned15, the dimension of the beneficiary enterprises (with small and medium-sized firms being preferred to large ones) and the nature of the projects (with start-up projects preferred to expansion ones).
From a labour market point of view, incentives for inwards capital investment, although they “create jobs” in a visible way, have certain disadvantages: the investment generated has sometimes been in capital- intensive projects providing relatively few jobs in relation to the expenditure involved, and has been managed by large companies with headquarters outside the region. One danger with management from outside the region is that operations in development regions may be regarded as peripheral when shifts in demand make cut-backs necessary. It may also fail to develop indigenous management skills, or undermine confidence in them.
Efforts at improving the employment content of regional spending are quite common. Some countries (such as France and Spain) have tried to avoid overly capital-intensive investment by designing schemes that lay down maximum amounts of aid per job, or specify that projects must involve an increase in employment. While general subsidies to employment in disadvantaged regions have never been widespread, in some countries (Italy, Belgium, Sweden) there are subsidies or reductions in social security contributions for new hires. However, it can be difficult to verify that new jobs have in fact been created, particularly when restructuring is taking place and jobs are changing in content.
There has generally not been a regional labour market policy as such, distinct both from general regional policy and labour market policy16. However, the service offered by employment offices to the unemployed in a sparsely- populated region cannot be exactly the same as that offered in a city. The allocation of resources across regions varies depending upon the weight given to such criteria as ease of access and local unemployment and vacancy levels. Except in the Unites States and Switzerland, local market authorities are under political control at the national level, but regional units are also important in other federal countries such as Canada, Australia, Germany and Austria. The financing method may affect expenditure patterns, and it has been claimed that financing through social insurance funds rather than general federal taxation in Germany has allowed the regions with already more favourable labour market situations to benefit disproportionately from active labour market spending [Schmid and Reissert (1988)l. Other countries, including Belgium, Finland, France and
92
the Netherlands, have in recent years devolved some of the responsibility for the implementation of labour market policy to regional authorities [OECD (1990c)l. While decentralisation is a response to differing regional needs, it does not fill the traditional regional policy aim of redistributing resources from advantaged to disadvantaged regions.
In 1964, the OECD Council adopted a Recommendation on Manpower Policy which gave a prominent place to geographic mobility, and suggested such measures as travel and resettlement allowance and housing schemes. Many countries either had or introduced such schemes, but on the whole this did not lead to as much mobility as was hoped for. Also, in some countries the schemes ran into strong political opposition, based on the feeling that the measures encouraged the exit of people of working age from already depopulated areas [OECD (1978)l. However, in Sweden and Norway in particular, relocation and resettlement grants remain important in the range of measures which aim to improve general economic and labour market adjustment.
With an awareness of the importance of structural changes and the growing contribution of new technologies, general regional policies have started to gain inspiration from labour market policy trends. New initiatives focus more on service enterprises than on manufacturing plants, more on information networks than on roads, railways and industrial estates, and more on human than on physical capital. Policy tries to encourage new technology, innovation in products and marketing, and entrepreneurship, and to improve the general business environment by providing technical resources, business consultancy services, education and training.
Recognition of the importance of small business and of innovation in terms of products, process and market for employment has led to a shift away from attempts at attracting mature companies, towards promotion of indigenous business. The OECD’s ILE (Local Employment Initiatives) Programme aims to give practical advice on promotion of innovation and entrepreneurship, and on improvement of the local business climate. It emphasizes the importance of building up local capabilities, and in particular encouraging partnerships that combine existing local resources, within the private sector and between the public and private sectors, in new ways.
Local employment measures and national policy implementation should complement each other, and regional policy-makers have increasingly made efforts to co-ordinate national initiatives (especially in the fields of education and training and R&D) for the benefit of the problem regions”. Strengthened monitoring of the regional distribution of national spending in such areas,
and indeed of expenditure generally, is one ingredient for the success of this approach; it needs to be complemented by measures which, by strenghening local entrepreneurship, avoid translating higher demand into higher imports with little effect on the local labour market.
Within Europe, the activities of the European Community Regional Development Fund and of the Social Fund have supplemented national regional policies in the provision of infrastructure development and in the support of training activities, employment creation and other schemes to improve the social environment [Begg ( 1989)l. Increasingly, with the approaching of the single European market of 1992, fears are expressed that the gains and losses of increased integration may be unevenly distributed across regions, due to persistent gaps in productivity levels and trends. While historically national economies have been able to mitigate some of their competitivity problems through exchange rate or compensatory fiscal policies, the use of some of these instruments may be constrained in the Community context, while factor mobility between regions may be insufficient to counteract a process of polarisation [Boltho (1989)l. The recent agreement to double the Community Structural Funds and to concentrate their support on worst-off regions - which include the whole of Portugal, Ireland and Greece - confirms the growing importance attached to regional policy at the Community level.
Thus the 1990s may see a swing in favour of regional policy. However, the issues involved will bring demands for a broader approach - with a concern for space management in a wider sense, and the utilisation of national policy measures to bolster regional policy initiatives. The shift of emphasis by regional policy- makers towards business services and human capital suggests that regional considerations in labour market policy, in particular, may become increasingly important.
G. SUMMARY AND CONCLUSIONS
This chapter has aimed at complementing and extending the analysis of last year’s Employment Outlook, by looking at several mechanisms that have a bearing on labour market adjustment in a regional context. The analysis has focused on developments for broad administrative units within each national economy and, as noted in OECD (1989a), administrative boundaries do not always coincide with economic ones. Large differences can exist between urban and rural areas, across smaller districts, and indeed across sectors of a single city, and these differences have not been
93
taken into account. With this proviso, the main empirical findings here are as follows: - Unemployment and participation rates differ
substantially by region, with a tendency for depressed regional labour markets to experience both high measured unemployment and low participation rates, particularly for women. Within a typical OECD country, overall participation in the lower-unemployment regions is 5 or 6 per cent higher than in the higher-unemployment regions.
- Industrial structure is often an important factor in regional unemployment, with evidence of two kinds of problem regions: regions where agriculture still represents a significant fraction of total employ- ment, with weak industrial basis and traditional service activities, and industrial regions suffering long-term decline due to shifts in demand and increased competition from low-wage developing countries. While an adverse industry mix is often significant as an element in the evolution of unemployment, regions have in several cases been able to overcome such problems by shifting from industries in relative decline to rapidly expanding ones or by reinforcing their traditional speciali- sation.
- Large inter-regional differences in rates of population growth are, on the whole, associated with equally large changes in employment growth. Unemployment changes are generally much smaller than changes in employment and population, and there is no systematic tendency for regions with the most rapid population growth to experience rising unemployment. Thus, unemployment cannot generally be interpreted as arising through the mechanical difference between changes in labour supply and a relatively inert stock of jobs.
- While both migration and wage adjustment are often suggested as important equilibrating mechanisms, the evidence presented here suggests that their roles are not simple. Internal migration flows, after the falls recorded in most OECD countries in the 1970s and early 1980s, have tended to recover. The dominant pattern in the direction of these flows is one of outflows from high-unemployment regions and inflows into low-unemployment regions. These flows are small in relation to the gross flows, yet in the longer term they may become a significant element in labour market balance.
- Regional earnings differentials are large, parti- cularly in Japan and the United States, where despite substantial changes in particular regions the
general pattern has been stable. For the United States, the partial stability in the earnings pattern over time contrasts with the great changes in the regional unemployment patterns observed in OECD (1989a). Changes in the regional pattern of earnings have been significant in Italy and Germany but smaller in France, Sweden, the United Kingdom. Within countries, regions with above-average unemployment tend, in a majority of cases, to experience low earnings, and a weak negative relationship between changes in earnings and changes in unemployment rates exists, so that the influence of local labour market conditions upon regional earnings is more visible than influence of low labour costs in generating job growth. The overall size of earnings differentials, after some fairly sharp declines up to the late 1970s, has more recently increased in most countries.
Not all regional differentials imply inefficiencies in labour market adjustment; in the short run, growth of earnings differentials may be part of a self-correcting mechanism, restoring equilibrium in the face of adverse economic shocks. Even long-run earnings and unemployment differences across regions may be compensated by other characteristics. Yet many countries do feel that persistent differentials are a matter for concern. While regional policies aim to supplement the operation of equilibrating mechanisms, helping to improve general economic efficiency and speed movement towards regional equilibrium, they also generally aim to counter tendencies towards excessive concentration of economic activity in particular areas.
The priority attached to regional policies seems to have increased in the last part of the 1980s, reflecting among other things the increased visibility of regional disparities in several OECD countries. Increasingly, these policies are directed at encouraging the development and competitive position of indigenous industries, more than simply attracting outside investment. The emphasis has tended to shift from heavy infrastructure and automatic subsidies to physical investment in designated areas, into encouragement for entrepreneurship, small firms, the service sector, and provision of education, training and business consultancy. Regional policy-makers have given increased attention towards ensuring that national policies in these areas benefit problem regions. Few areas of economic policy have a regionally uniform effect, and awareness of the ways in which different regions experience policies of all kinds is essential to the general conduct of policy in the labour market and beyond.
94
NOTES
1. Since the analysis in OECD (1989a) was undertaken, additional regional time-series for employment and unemployment in Austria, the Netherlands, Norway, Spain and Switzerland have been assembled, broadly confirming the pattern previously observed for other European countries. The ratio between the highest unemployment rates and the lowest has in all five countries declined since 1970 or 1980, while differences in terms of percentage points of unemployment have risen, with the partial exception of Austria and the Netherlands (see Chart 3.A.1). The regional pattern of unemployment has remained strongly correlated through time (with correlation coefficients of 0.7 or more) in Austria, Norway and Spain. More marked changes occurred in the Netherlands, where the provinces of Noord-Brabant and Limburg in the south had nearly the highest unemployment rates in 1981, yet by 1987 had unemployment close to or below the national average. The largest changes in terms of relativities between regions have been in Switzerland, although the total numbers involved were small, and changes are associated with canton-specific developments in administration of the employment services. Thus, summarising the evidence provided both in Section D of OECD (1989~) and here, changes in the regional pattern of unemployment have been most marked in Australia, France, Germany, Switzerland and the United States. It may be significant that with the exception of France, these countries have a federal system of government allowing the member states relatively great autonomy, and with the exception of Switzerland these countries are geographically relatively large. While the study of regional differences in this chapter and its predecessor has concentrated on economic aspects, political and geographical factors are clearly important in regional developments.
2. While more recent information was available for many countries, Chart 3.1 takes 1987 as its reference year in order to allow an immediate comparison with the patterns of regional unemployment rates presented in last year’s Employment Outlook.
3. Regional indicators of Gross Domestic Product per unit of the resident population in 1987, collected by the Secretariat for the regional units shown in Chart 3.1 and benchmarked on national totals at Purchasing Power Parities exchange rates, tend partially to confirm this picture. The dispersion in this statistic is
higher in Portugal and Italy (with weighted coefficients of variation of 0.26 and 0.24), where agriculture still accounts for a large share of employment in several regions, than in other OECD countries. High regional dispersion in per capita GDP also characterise France and Belgium (with coefficients of variation of 0.23 and 0.19), while most other countries record broadly similar levels of dispersion in this statistic (0.17 for the Netherlands; 0.16 in the United States and Japan; 0.15 in Finland, Spain and Canada; and 0.14 for the United Kingdom and Germany). Low dispersion in GDP per capita characterises the other Nordic Countries, Oceania but also agriculture-dominated Ireland and Greece within Europe. An analysis of changes in regional income differentials in the United States suggests that after several decades of pronounced and persistent differentials, a major fall in regional disparities occurred in the 1940s and continued at a more modest pace since the early 1950s; data for some major EEC countries suggest a narrowing of income differentials between 1960 and 1983 in Italy and Spain, but stagnation in France, Germany and the United Kingdom [Boltho (1989)l.
4. Study of the role of industry specialisation using 17 industries, for EEC countries in the 1970s, found that regions specialising in declining industries did tend to have low levels of income per head, but with a considerable number of exceptions. Perhaps surprisingly, sectoral structure did not seem to have been an important influence on evolution of regional GDP during the 1970s [Commission of the European Communities (1981)l.
5. The analysis of McGee (1985) is based on the construction of industry-mix unemployment rates (the unemployment rate a state would have if each industry in the state had the same unemployment rate as the national rate for the industry), and considers both direct and indirect (multiplier induced) effect of the industry mix. The conclusion of the author is that: “industry mix adjustment - both direct and indirect - shows that each percentage of comparative advantage in industrial mix results in more than two percentage points less unemployment” (p. 3 1).
6. See OECD (1986a, Tables 11-7 and 11-23), and OECD (1990~) for recent information on rates of migration from abroad.
95
7. The influence of different collection methods on the size and trends of internal migration flows may be illustrated by the experience of countries for which both survey-based and administrative data are available. In Japan, for example, data based on the household-based Employment Status Survey indicate that around 2.3 per cent of the population 15 years old and over changed prefecture of residence over the year, against a value of 2.6 per cent for total population indicated by the population register. Both data sources however indicate similar trends over time, with significant increases in the 1960s, a fall in the 1970s, and a recovery in the 1980s.
8. Inter-state migration rates based on moves occurring during the five years prior to the census date for the United States indicate a slight fall in the period 1965- 70 relative to 1955-60 (from 8.9 to 8.6) and a significant increase in 1975-80 (to a level of 9.75) [Grignon and Moray (198S)l.
9. Data for four broad geographical regions of the United States indicate that during the 1980s net migration, which is into the South and West, fell although gross migration increased. Since 1983 the ratio of net to gross has been around 10 per cent [Bureau of the Census (1989)l.
10. In Sweden, differentials for white-collar workers, after a decline recorded up to 1983 - from a level of the weighted standard deviation of 0.068 in 1976 to 0.044 in 1983 - increased considerably, to reach a level of 0.054 in 1987. For Germany, the weighted standard deviation of earnings differentials for non-manual workers in industry and trade fell in the 1960s and 1970s - from a level of 0.045 per cent in 1961 to 0.027 per cent in 1982 - but rose back to 0.031 per cent by 1986.
11. The low correlations in Table 3.6 for one-year changes may reflect short-term fluctuations, which are important in most earnings data. For a similar study, see Freeman (1988, p. 298), who reports that over 1979-1985, for 61 regions in the United Kingdom wages are uncorrelated with unemployment at a point in time but declined in areas with relatively rising unemployment, while for 50 states in the United States wages are higher in high-unemployment regions and increases in unemployment have only a modest impact on wages.
12. This section draws upon a report by Kevin Allen, Douglas Yuill and John Bachtler of the European
13.
14.
15.
16.
17.
Policies Research Centre, University of Strathclyde, Glasgow, on developments in regional policies in the 1980s. The 1980s have seen a general and quite substantial reduction in top rates of income tax, but not a reduction in general levels of taxation on earnings [Hagemann et al. (1988)], and it seems possible that in some countries, reductions in income tax progressivity have involved greateT shifts of Tesources than any explicit “regional policy” [see also OECD (1989e)l. The industrial Midlands region of the United Kingdom is generally believed to have particularly suffered from the high exchange rate of the early 1980s. According to Begg (1989) :”..in the UK, the real value of regional assistance has halved in the last decade, and will fall further in the next three years according to government expenditure plans” (p. 100). Data for Italy similarly suggest a reduction in the volume of regional contributions on capital and on interest accounts of around 60 and 70 per cent respectively in the early 1980s relative to the mid- 1970s, only partially compensated by an increase in employers’ exemption from social security charges [Sarcinelli (1989), p. 1411. According to data in Yuill, Allen, Bachtler and Wishlade (1989) the population coverage of the designated problem regions has decline dsignificantly in most European countries during the 1980s. The fall exceeded one-half in Sweden, and was around 25 per cent in Denmark, the Netherlands and the United Kingdom, and 15 to 20 per cent in Belgium and Germany. In France, Italy and Luxembourg the coverage has remained largely unchanged, while Ireland, Greece, Portugal and Spain have tended to extend their designated problem regions, reflecting the availability of European Community funding for the worst-off parts of the Community in all or much of the country. However, regional policy often has labour market objectives: witness the following statement in the 1977 “Regional Development Programme” of the United Kingdom: “The primary objective of the United Kingdom regional policy is to bring the supply and demand for labour in the Assisted Areas more closely into balance by safeguarding existing employment and creating new jobs in those areas” [quoted in Armstrong and Taylor (1985)l. For a detailed if rather dated study of regional factors in education and education policy, see OECD (1979).
96
Annex 3. A
TRENDS IN UNEMPLOYMENT RATE DIFFERENTIALS FOR AUSTRIA, THE NETHERLANDS, NORWAY, SPAIN AND SWITZERLAND
Chapter 3 of the 1989 Employment Outlook analysed regional unemployment differentials in historical perspective for ten countries. For this chapter, historical data series have been gathered for five more European countries. For these countries, average unemployment rates of the bottom quarter, middle half and top quarter of regions by unemployment rate are shown in Chart 3.A.1. The data sources for Chart 3.A.1 are as follows:
Austria
Statistics for employees in employment and for registered unemployment by Lander were taken from the Statistical Yearbooks 1976, 1981 and 1988. Due to a slight statistical break, unemployment data for 1963 to 1973 were chained onto the basis of the later series. The nine regions used in time-series analysis were those listed in Table 3.A.2 of the OECD (1989~).
Netherlands
Data for total employment and unemployment for 1971 and 1975-1987 (odd dates only) on a labour force survey basis were supplied to the Secretariat by the Department for Statistics of Employment and Wages of the Central Bureau of Statistics. The labour force survey definition of employment was broadened in 1981 to include students and unpaid family workers working less than 15 hours per week, and before 1987 the survey took place only in Spring, while for 1987 the data refer to the whole year, but no correction was made for these breaks. Because the statistical region Flevoland, which first appeared in 1987 statistics, contains territory that was formerly in Ceiderland and Overijssel, these three regions were aggregated into one for the analysis. With this proviso, the ten regions used in time-series analysis were those listed in Table 3.A.2 of OECD (1989~).
Norway
Data for total employment 1961-1970 were taken from tables “Salaried employees and wage earners and self- employed by county” in Arbeidsmarkedstatistikk, 1967 and 1970. Data for total employment 1975-1988 were taken from tables “Population aged 16-74 by region and labour force status” referring to labour force survey data, while data for unemployment for the whole period 1961-1988
were taken from tables “Unemployed persons registered at employment offices by county. Annual average”, in these and later copies of Arbeidsmarkedstatistikk. (While labour force survey data for unemployment exist, in some regions total unemployment was rounded to 1 or 2 thousand, and it was not possible to compare unemployment rates across regions reliably in these data.) Unemployment rates on the 1975-1988 basis were chained back to 1961 assuming movements proportional to numbers unemployed over 1970-1975 and to unemployment rates on the older employment basis over 1961-1970. The distribution of employment between Oslo and Akershus differs considerably between the 1961-1970 and the 1975-1988 data: however, summary statistics recomputed taking unemployment rates on the 1961-1970 basis as the benchmark were very similar. The regions used in time- series analysis were the 11 groups of counties used in the labour force survey (Akershus; Oslo;Hedmark/Oppland; BuskerudITelemark; 0stfold/Vestfold; Aust-AgderIVest- Agdermogaland; HordalandISogn og Fjgrdane; Mgre og Romsdal; Sgr- og Nord-Trgndelag; Nordland; Tromsl Finnmark).
Spain
Statistics from the quarterly labour force survey were taken from the magnetic tape supplied to the OECD by the Institut0 Nacional de Estadistica, and used to compute annual averages for employment and unemployment. Recent statistics in this series appear in the publication Encuesta de Poblacion Activa. The overseas region of Ceuta y Melilla, for which statistics are not available before 1988, was omitted from the analysis. The 17 regions used in time-series analysis were those listed in Table 3.A.2 of OECD (1989~).
Switzerland
Numbers of registered wholly unemployed by canton 1975-1988 were taken from the Bank of Switzerland tape: annual data also appear in the Statistisches Jahrbuch der Schweiz (SJS). Labour force by canton was estimated from statistics in the SJS. Census statistics for 1970 and 1980 were taken as benchmarks, chained to 1975 using data for 1970 and 1975 in the table “Exploitations et personnes occupées par canton”, and chained to 1985 using the table “Recensement des entreprises, personnes occupées 1975 et
97
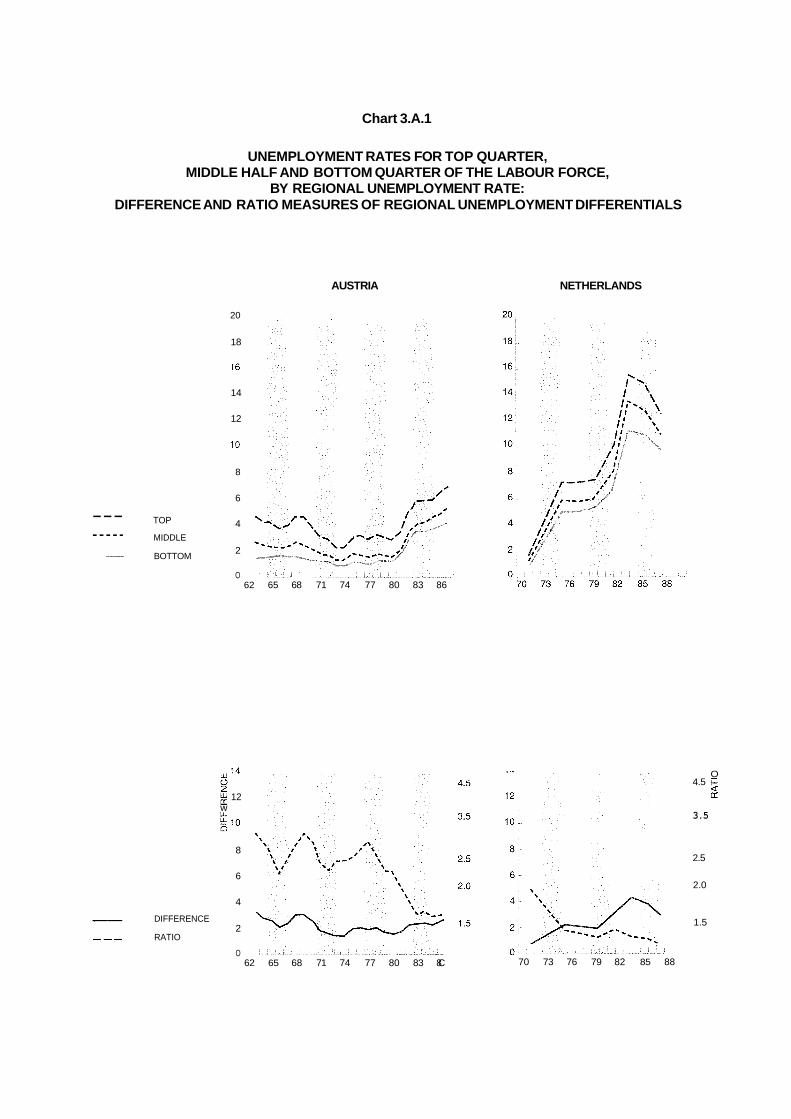
Chart 3.A.1
UNEMPLOYMENT RATES FOR TOP QUARTER, MIDDLE HALF AND BOTTOM QUARTER OF THE LABOUR FORCE,
BY REGIONAL UNEMPLOYMENT RATE: DIFFERENCE AND RATIO MEASURES OF REGIONAL UNEMPLOYMENT DIFFERENTIALS
AUSTRIA NETHERLANDS
TOP --- -- - - - MIDDLE
BOTTOM
- DIFFERENCE
_I-_. RATIO
20
18
16
14
12
10
8
6
4
2
O 62 65 68 71 74 77 80 83 86
U 1 4
g 12 O 2
w LL
10
8
6
4
2
O 62 65 68 71 74 77 80 83 8C 70 73 76 79 82 85 88
O
L r
4.5 Q
3.5
2.5
2.0
1.5
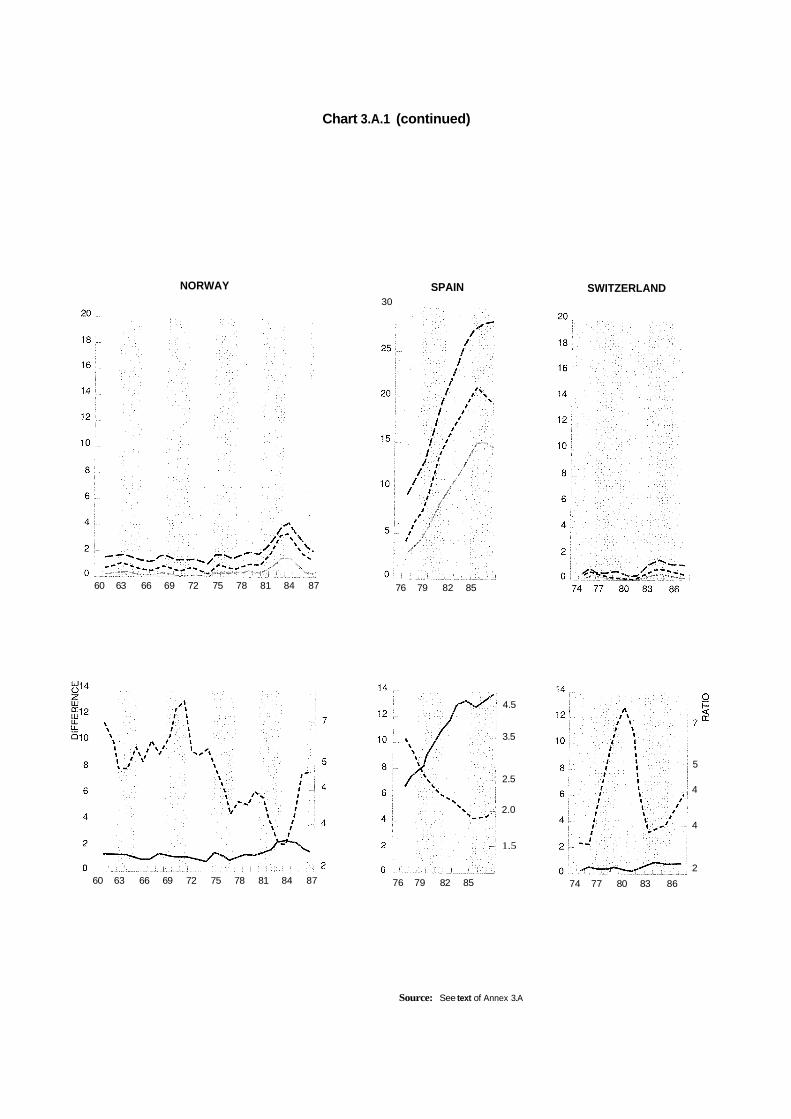
Chart 3.A.1 (continued)
NORWAY SPAIN 30
60 63 66 69 72 75 78 81 84 87 76 79 82 85
60 63 66 69 72 75 78 81 84 87 76 79 82 85
4.5
3.5
2.5
2.0
1.5
74 77 80 83 86
SWITZERLAND
0 Q
7 n
5
4
4
2
Source: See text of Annex 3.A

1985”. For intermediate years the labour force was estimated by simple interpolation, and for 1986 and 1987 it was estimated using quarterly indices of employment which appear in Die Volkswirtschaft. A multiplicative correction was applied to reconcile these cantonal estimates with annual statistics relating to the whole of Switzerland from OECD Labour Force Statistics. The resulting estimates of the labour force between census dates are approximate, but in the application here (computing unemployment rates) the distortion caused is likely to be small. In analysis, the canton of Jura which had before 1979 been part of Bern was aggregated with it. With this proviso, the 25 cantons used in
time-series analysis were those listed in Table 3.A.2 of OECD (19894.
xxx
Time-series statistics for employment, unemployment and the labour force by region, collected for this chapter and its 1989 counterpart, now cover 15 OECD countries. A publication of the original data in the form of an “Occasional Paper” is in preparation and interested readers should request a copy from the Central Analysis Division, Social Affairs and Manpower Directorate of the OECD.
1 O0
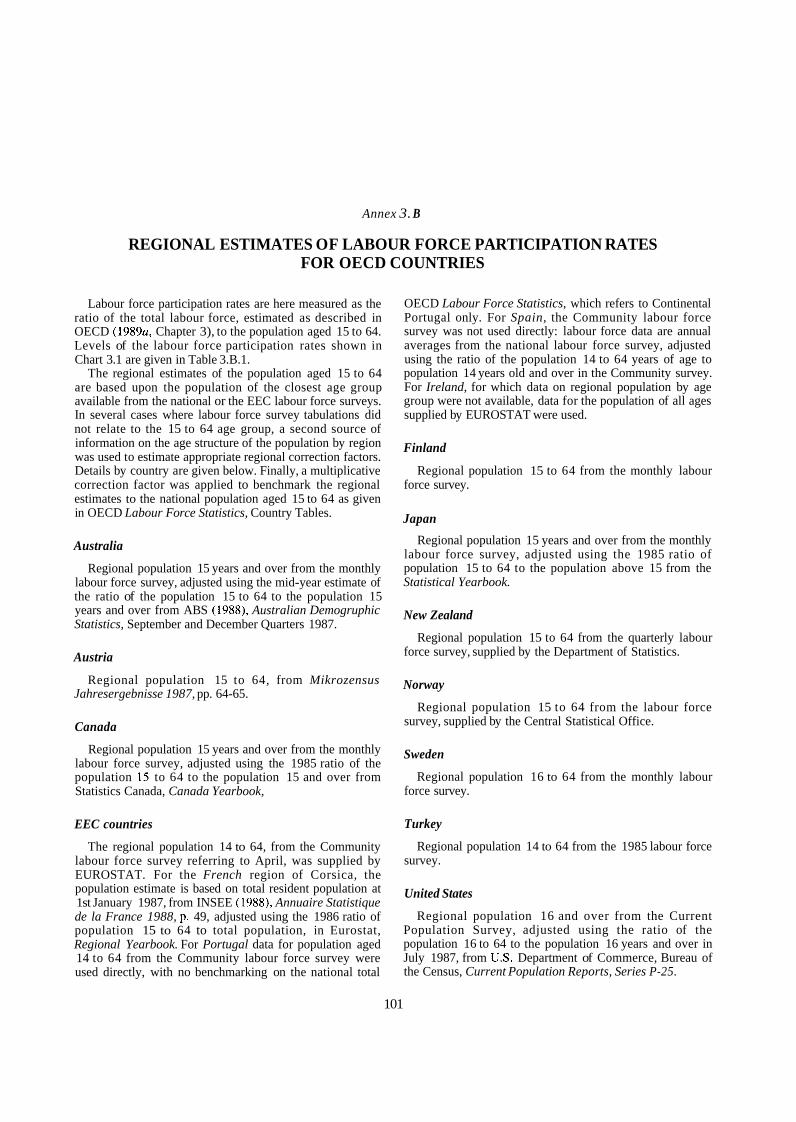
Annex 3. B
REGIONAL ESTIMATES OF LABOUR FORCE PARTICIPATION RATES FOR OECD COUNTRIES
Labour force participation rates are here measured as the ratio of the total labour force, estimated as described in OECD (1989a, Chapter 3), to the population aged 15 to 64. Levels of the labour force participation rates shown in Chart 3.1 are given in Table 3.B.1.
The regional estimates of the population aged 15 to 64 are based upon the population of the closest age group available from the national or the EEC labour force surveys. In several cases where labour force survey tabulations did not relate to the 15 to 64 age group, a second source of information on the age structure of the population by region was used to estimate appropriate regional correction factors. Details by country are given below. Finally, a multiplicative correction factor was applied to benchmark the regional estimates to the national population aged 15 to 64 as given in OECD Labour Force Statistics, Country Tables.
Australia
Regional population 15 years and over from the monthly labour force survey, adjusted using the mid-year estimate of the ratio of the population 15 to 64 to the population 15 years and over from ABS (1988), Australian Demogruphic Statistics, September and December Quarters 1987.
Austria
Jahresergebnisse 1987, pp. 64-65. Regional population 15 to 64, from Mikrozensus
Canada
Regional population 15 years and over from the monthly labour force survey, adjusted using the 1985 ratio of the population 15 to 64 to the population 15 and over from Statistics Canada, Canada Yearbook,
EEC countries
The regional population 14 to 64, from the Community labour force survey referring to April, was supplied by EUROSTAT. For the French region of Corsica, the population estimate is based on total resident population at 1st January 1987, from INSEE (1988), Annuaire Statistique de la France 1988, p. 49, adjusted using the 1986 ratio of population 15 to 64 to total population, in Eurostat, Regional Yearbook. For Portugal data for population aged 14 to 64 from the Community labour force survey were used directly, with no benchmarking on the national total
OECD Labour Force Statistics, which refers to Continental Portugal only. For Spain, the Community labour force survey was not used directly: labour force data are annual averages from the national labour force survey, adjusted using the ratio of the population 14 to 64 years of age to population 14 years old and over in the Community survey. For Ireland, for which data on regional population by age group were not available, data for the population of all ages supplied by EUROSTAT were used.
Finland
Regional population 15 to 64 from the monthly labour force survey.
Japan
Regional population 15 years and over from the monthly labour force survey, adjusted using the 1985 ratio of population 15 to 64 to the population above 15 from the Statistical Yearbook.
New Zealand
Regional population 15 to 64 from the quarterly labour force survey, supplied by the Department of Statistics.
Norway
survey, supplied by the Central Statistical Office. Regional population 15 to 64 from the labour force
Sweden
Regional population 16 to 64 from the monthly labour force survey.
Turkey
Regional population 14 to 64 from the 1985 labour force survey.
United States
Regional population 16 and over from the Current Population Survey, adjusted using the ratio of the population 16 to 64 to the population 16 years and over in July 1987, from U S . Department of Commerce, Bureau of the Census, Current Population Reports, Series P-25.
101
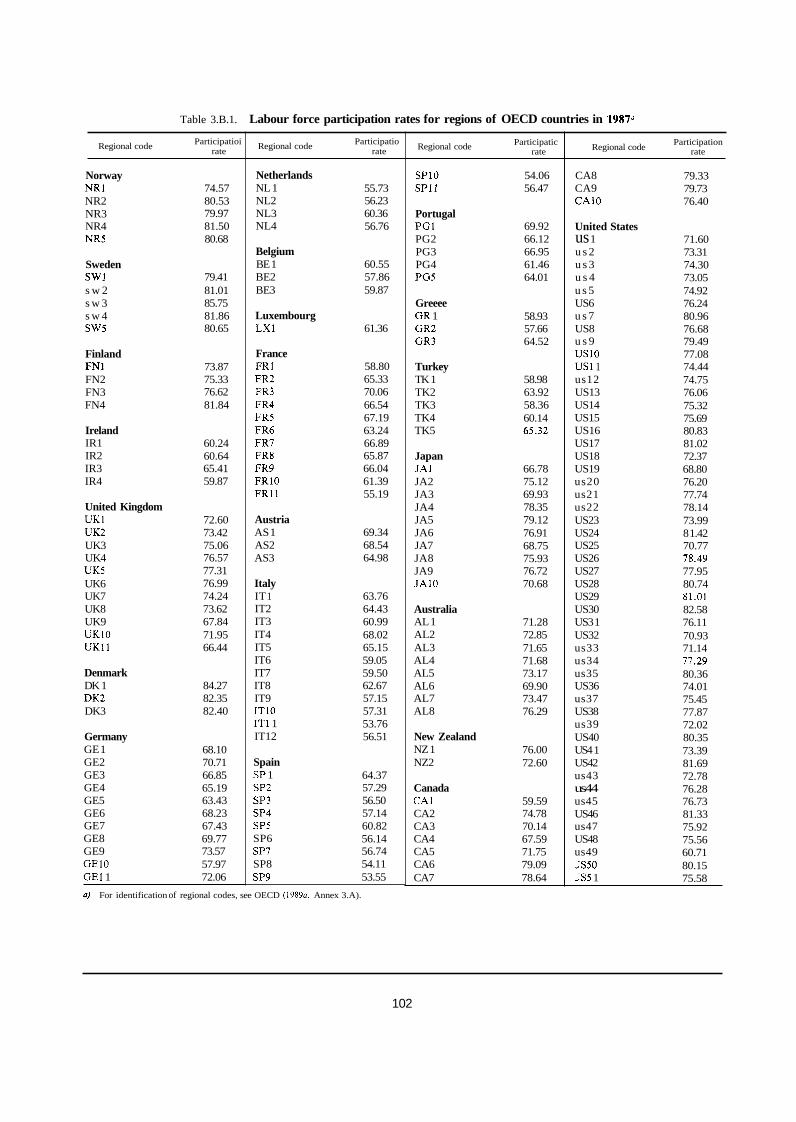
Table 3.B.1. Labour force participation rates for regions of OECD countries in 19870
Regional code Participatioi rate
Norway NRl NR2 NR3 NR4 NR5
Sweden SWl s w 2 s w 3 s w 4 s w 5
Finland FNI FN2 FN3 FN4
Ireland IR1 IR2 IR3 IR4
United Kingdom UKl UK2 UK3 UK4 UK5 UK6 UK7 UK8 UK9 UKlO UKll
Denmark DK 1 DK2 DK3
Germany GE 1 GE2 GE3 GE4 GE5 GE6 GE7 GE8 GE9 GE10
74.57 80.53 79.97 81.50 80.68
79.41 81.01 85.75 81.86 80.65
73.87 75.33 76.62 81.84
60.24 60.64 65.41 59.87
72.60 73.42 75.06 76.57 77.31 76.99 74.24 73.62 67.84 71.95 66.44
84.27 82.35 82.40
68.10 70.71 66.85 65.19 63.43 68.23 67.43 69.77 73.57 57.97
GE1 1 72.06
Regional code Participatio rate
Netherlands NL 1 NL2 NL3 NL4
Belgium BE 1 BE2 BE3
Luxembourg LXl
France FRl FR2 FR3 FR4 FR5 FR6 FR7 FR8 FR9 FRlO FRll
Austria AS 1 AS2 AS3
Italy IT 1 IT2 IT3 IT4 IT5 IT6 IT7 IT8 IT9 IT10 IT1 1 IT12
Spain SP 1 SP2 SP3 SP4 SP5 SP6 SP7 SP8
55.73 56.23 60.36 56.76
60.55 57.86 59.87
61.36
58.80 65.33 70.06 66.54 67.19 63.24 66.89 65.87 66.04 61.39 55.19
69.34 68.54 64.98
63.76 64.43 60.99 68.02 65.15 59.05 59.50 62.67 57.15 57.31 53.76 56.51
64.37 57.29 56.50 57.14 60.82 56.14 56.74 54.11
SP9 53.55 U) For identification of regional codes, see OECD (19890, Annex 3.A).
Regional code Participatic rate
SPlO SPl l
Portugal PGl PG2 PG3 PG4 PG5
Greeee GR 1 GR2 GR3
Turkey TK 1 TK2 TK3 TK4 TK5
Japan JAl JA2 JA3 JA4 JA5 JA6 JA7 JA8 JA9 JAlO
Australia AL 1 AL2 AL3 AL4 AL5 AL6 AL7 AL8
New Zealand NZ 1 NZ2
Canada CA1 CA2 CA3 CA4 CA5 CA6
54.06 56.47
69.92 66.12 66.95 61.46 64.01
58.93 57.66 64.52
58.98 63.92 58.36 60.14 65.32
66.78 75.12 69.93 78.35 79.12 76.91 68.75 75.93 76.72 70.68
71.28 72.85 71.65 71.68 73.17 69.90 73.47 76.29
76.00 72.60
59.59 74.78 70.14 67.59 71.75 79.09
CA7 78.64
Regional code Participation rate
CA8 CA9 CA10
United States us 1 u s 2 u s 3 u s 4 u s 5 US6 u s 7 US8 u s 9 us10 u s 1 1 us12 US13 US14 US15 US16 US17 US18 US19 us20 us21 us22 US23 US24 US25 US26 US27 US28 US29 US30 US3 1 US32 us33 us34 us35 US36 us37 US38 us39 US40 US4 1 US42 us43 us44 us45 US46 us47 US48 us49 JS50 JS5 1
79.33 79.73 76.40
71.60 73.31 74.30 73.05 74.92 76.24 80.96 76.68 79.49 77.08 74.44 74.75 76.06 75.32 75.69 80.83 81.02 72.37 68.80 76.20 77.74 78.14 73.99 8 1.42 70.77 78.49 77.95 80.74 81.01 82.58 76.11 70.93 71.14 77.29 80.36 74.01 75.45 77.87 72.02 80.35 73.39 81.69 72.78 76.28 76.73 81.33 75.92 75.56 60.71 80.15 75.58
102
Annex 3. C
TIME-SERIES DEVELOPMENTS IN REGIONAL EARNINGS
This annex provides information on the sources and definitions of the regional earnings series presented in Section E.
Australia
Statistics of average weekly earnings of male employees in September were provided by the Australian Bureau of Statistics. The establishment-based series available from 1981 was extended back by multiplicative linking with the earlier payroll-tax-based series. Earnings in Northern Territory and Australian Capital Territory, first available in 1974, were assumed to have been a fixed proportion of the national level in earlier years. Analysis relates to 8 states and territories over 1966-1987.
Canada
Average weekly earnings (including overtime) of employees, annual averages, from Statistics Canada, Employment, Earnings and Hours, various issues. The series available from 1983, when coverage of the establishment survey changed, was extended back by multiplicative linking with the earlier series. Analysis relates to 10 provinces over 1961 to 1987.
France
Annual earnings of non-agricultural full-time employees, net of social security contributions. Data for 1985 to 1987 were provided by INSEE: for earlier years, see INSEE, Statistiques et indicateurs des régions francaises, and Les salaires dans l’industrie, le commerce et les services, various issues. Data for Corsica (not separately available before 1974) were aggregated with those of Provence- Alpes-Côte d’Azur, using 1974 employment as weight. Analysis relates to 21 regions over 1963 to 1987.
Germany
Average weekly earnings of manual workers in industry as published in Statistisches Jahrbuch, various issues. Data for Schleswig-Holstein were aggregated with Hamburg; for Niedersachsen with Bremen; for Rheinland-Pfalz with Saarland. Analysis relates to 8 regions over 1960 to 1987.
Italy
Average hourly earnings of manual workers in industry, published in Minister0 del Lavoro, Supplemento al
Bollettino Statistiche del Lavoro, various issues. Data for Val d’Aosta have been aggregated with those of neighbouring Piemonte. Analysis relates to 19 regions over 1974 to 1984.
Japan
Average monthly cash earnings per regular employee in establishments with 30 workers and more, all industries (excluding services), by prefecture (excluding Okinawa), from Statistical Yearbook of Japan, various issues. Analysis relates to 46 prefectures over 1960 to 1987.
Sweden
Average monthly earnings of white- and blue-collar employees in the industrial sector. Data on monthly earnings and number of workers in the two categories, based on establishment survey, have been provided by Statistics Sweden, and then aggregated by the Secretariat. For 1979, when monthly earnings of white-collar employees were not available, it was assumed that the ratio of their earnings to blue-collar earnings was the average of its 1978 and 1980 values. Analysis relates to 24 counties over 1976 to 1987.
United Kingdom
Average gross weekly earnings of manual and non- manual employees, male and female, on adult rates of pay, whose pay was not affected by absence. Data as published in New Earnings Survey, various issues, for Great Britain, supplemented by information from the Northern Ireland New Earnings Survey. The series available from 1983, when age coverage changed, was extended back by multiplicative linking with the earlier series. Analysis relates to 11 regions over 1971 to 1987.
United States
Average annual pay of workers covered by State and Federal Unemployment Insurance. These data, based on the Employment and Wages Program, were supplied by the Bureau of Labor Statistics. No adjustment was made for breaks in the series at 1972 and 1978 due to changes in the coverage of the Program. Analysis relates to 51 states over 1960 to 1987.
103

Related Documents