ORIGINAL RESEARCH Supplementing long-chain n-3 polyunsaturated fatty acids in canned wild Pacific pink salmon with Alaska salmon oil Trina J. Lapis 1 , Alexandra C. M. Oliveira 1 , Charles A. Crapo 1 , Brian Himelbloom 1 , Peter J. Bechtel 2 & Kristy A. Long 3 1 Kodiak Seafood and Marine Science Center, School of Fisheries and Ocean Sciences, University of Alaska Fairbanks, 118 Trident Way, Kodiak, Alaska, 99615-7401 2 USDA-ARS Subarctic Agricultural Research Unit, University of Alaska Fairbanks, 118 Trident Way, Kodiak, Alaska, 99615-7401 3 Cooperative Extension Service, University of Alaska Fairbanks, 213 Cooperative Extension Building, Fairbanks, Alaska, 99775-6180 Keywords Canned salmon, Pacific salmon, salmon oil, seafood composition Correspondence Alexandra C. M. Oliveira, Kodiak Seafood and Marine Science Center, School of Fisheries and Ocean Sciences, University of Alaska Fairbanks, 118 Trident Way, Kodiak, AK 99615-7401. Tel: 907-486-1530; Fax: 907-486-1540; E-mail: [email protected] Funding Information USDA-CSREES Special Project Grant # 332677-62003 funded this research project. In addition, the Alaska Sea Grant College generously provided funds to cover graduate student tuition. Received: 25 July 2012; Revised: 20 September 2012; Accepted: 24 September 2012 Food Science & Nutrition 2013; 1(1): 15–26 doi: 10.1002/fsn3.4 Abstract Establishing n-3 polyunsaturated fatty acid contents in canned wild Alaska pink salmon products is challenging due to ample natural variation found in lipid content of pink salmon muscle. This study investigated the effect of adding sal- mon oil (SO) to canned pink salmon produced from fish exhibiting two oppo- site degrees of skin watermarking, bright (B) and dark (D). Specific goals of the study were to evaluate the benefits of adding SO to canned pink salmon with regard to nutritional value of the product, sensory characteristics, and the oxi- dative and hydrolytic stability of the lipids over thermal processing. Six groups of canned pink salmon were produced with variable levels of SO, either using bright (with 0, 1, or 2% SO) or dark (with 0, 2, or 4% SO) pink salmon. Com- positional analysis revealed highest (P < 0.05) lipid content in sample B2 (8.7%) and lowest (P < 0.05) lipid content in sample D0 (3.5%). Lipid content of samples B0, B1, D2, and D4 was not significantly different (P > 0.05) rang- ing from 5.7% to 6.8%. Consequently, addition of SO to canned pink salmon allowed for consistent lipid content between bright and dark fish. Addition of 1% or 2% SO to canned bright pink salmon was not detrimental to the sensory properties of the product. It is recommended that canned bright pink salmon be supplemented with at least 1% SO, while supplementation with 2% SO would guarantee a minimum quantity of 1.9 g of n-3 fatty acids per 100 g of product. Addition of 4% SO to canned dark pink salmon was detrimental to product texture and taste, while supplementation with 2% SO did not nega- tively affect sensorial properties of the product. Accordingly, canned dark pink salmon should be supplemented with 2% SO so that a minimum n-3 fatty acids content of 1.5 g per 100 g of product. Introduction In Alaska, pink salmon annual harvests averaged 175,000 t from 2005 to 2009, comprising about half of the total salmon catch (Alaska Department of Fish and Game 2009). Approximately, 55% of the pink salmon catch volume is processed into cans (Franz 2006). Between 2000 and 2004, U.S. consumption of Pacific salmon species averaged 284,000 tons, 16% of which was canned salmon (Knapp et al. 2007). Canned salmon is a staple of U.S. diet (Liese et al. 2007) with domestic consumption upwards of 60,000 tons on years of high catch volumes (Knapp et al. 2007). Canned salmon is also exported to Europe and Asia and is a staple food item in the United Kingdom and Japan (Knapp et al. 2007). During the past decade, consumer awareness regarding the need to increase dietary intake of long chain n-3 poly- unsaturated fatty acids (LC n-3 PUFA) has increased sig- nificantly (Ruxton et al. 2005). Research has shown that daily consumption of fatty fish or fish oil containing these fatty acids reduces risk of coronary disease and decrease progression of atherosclerosis in coronary patients (Simo- ª 2012 The Authors. Food Science & Nutrition published by Wiley Periodicals, Inc. This is an open access article under the terms of the Creative Commons Attribution License, which permits use, distribution and reproduction in any medium, provided the original work is properly cited. 15

Welcome message from author
This document is posted to help you gain knowledge. Please leave a comment to let me know what you think about it! Share it to your friends and learn new things together.
Transcript

ORIGINAL RESEARCH
Supplementing long-chain n-3 polyunsaturated fatty acidsin canned wild Pacific pink salmon with Alaska salmon oilTrina J. Lapis1, Alexandra C. M. Oliveira1, Charles A. Crapo1, Brian Himelbloom1, Peter J. Bechtel2 &Kristy A. Long3
1Kodiak Seafood and Marine Science Center, School of Fisheries and Ocean Sciences, University of Alaska Fairbanks, 118 Trident Way, Kodiak,
Alaska, 99615-74012USDA-ARS Subarctic Agricultural Research Unit, University of Alaska Fairbanks, 118 Trident Way, Kodiak, Alaska, 99615-74013Cooperative Extension Service, University of Alaska Fairbanks, 213 Cooperative Extension Building, Fairbanks, Alaska, 99775-6180
Keywords
Canned salmon, Pacific salmon, salmon oil,
seafood composition
Correspondence
Alexandra C. M. Oliveira, Kodiak Seafood
and Marine Science Center, School of
Fisheries and Ocean Sciences, University of
Alaska Fairbanks, 118 Trident Way, Kodiak,
AK 99615-7401.
Tel: 907-486-1530;
Fax: 907-486-1540;
E-mail: [email protected]
Funding Information
USDA-CSREES Special Project Grant #
332677-62003 funded this research project.
In addition, the Alaska Sea Grant College
generously provided funds to cover graduate
student tuition.
Received: 25 July 2012; Revised: 20
September 2012; Accepted: 24 September
2012
Food Science & Nutrition 2013; 1(1): 15–26
doi: 10.1002/fsn3.4
Abstract
Establishing n-3 polyunsaturated fatty acid contents in canned wild Alaska pink
salmon products is challenging due to ample natural variation found in lipid
content of pink salmon muscle. This study investigated the effect of adding sal-
mon oil (SO) to canned pink salmon produced from fish exhibiting two oppo-
site degrees of skin watermarking, bright (B) and dark (D). Specific goals of the
study were to evaluate the benefits of adding SO to canned pink salmon with
regard to nutritional value of the product, sensory characteristics, and the oxi-
dative and hydrolytic stability of the lipids over thermal processing. Six groups
of canned pink salmon were produced with variable levels of SO, either using
bright (with 0, 1, or 2% SO) or dark (with 0, 2, or 4% SO) pink salmon. Com-
positional analysis revealed highest (P < 0.05) lipid content in sample B2
(8.7%) and lowest (P < 0.05) lipid content in sample D0 (3.5%). Lipid content
of samples B0, B1, D2, and D4 was not significantly different (P > 0.05) rang-
ing from 5.7% to 6.8%. Consequently, addition of SO to canned pink salmon
allowed for consistent lipid content between bright and dark fish. Addition of
1% or 2% SO to canned bright pink salmon was not detrimental to the sensory
properties of the product. It is recommended that canned bright pink salmon
be supplemented with at least 1% SO, while supplementation with 2% SO
would guarantee a minimum quantity of 1.9 g of n-3 fatty acids per 100 g of
product. Addition of 4% SO to canned dark pink salmon was detrimental to
product texture and taste, while supplementation with 2% SO did not nega-
tively affect sensorial properties of the product. Accordingly, canned dark pink
salmon should be supplemented with 2% SO so that a minimum n-3 fatty acids
content of 1.5 g per 100 g of product.
Introduction
In Alaska, pink salmon annual harvests averaged 175,000 t
from 2005 to 2009, comprising about half of the total
salmon catch (Alaska Department of Fish and Game 2009).
Approximately, 55% of the pink salmon catch volume is
processed into cans (Franz 2006). Between 2000 and 2004,
U.S. consumption of Pacific salmon species averaged
284,000 tons, 16% of which was canned salmon (Knapp
et al. 2007). Canned salmon is a staple of U.S. diet (Liese
et al. 2007) with domestic consumption upwards of 60,000
tons on years of high catch volumes (Knapp et al. 2007).
Canned salmon is also exported to Europe and Asia and is
a staple food item in the United Kingdom and Japan
(Knapp et al. 2007).
During the past decade, consumer awareness regarding
the need to increase dietary intake of long chain n-3 poly-
unsaturated fatty acids (LC n-3 PUFA) has increased sig-
nificantly (Ruxton et al. 2005). Research has shown that
daily consumption of fatty fish or fish oil containing these
fatty acids reduces risk of coronary disease and decrease
progression of atherosclerosis in coronary patients (Simo-
ª 2012 The Authors. Food Science & Nutrition published by Wiley Periodicals, Inc. This is an open access article under the terms of
the Creative Commons Attribution License, which permits use, distribution and reproduction in any medium,
provided the original work is properly cited.
15
poulos 1991, Harris et al. 2008). Balk et al. (2006) indi-
cated that evidence supports a dose-dependent effect of
fish oil on reducing levels of serum triglycerides and cho-
lesterol. These fatty acids may also benefit treatment and
prevention of systemic inflammatory diseases (Wall et al.
2010), such as ulcerative colitis, psoriasis (Simopoulos
1991), and rheumatoid arthritis (Calder 2006). Additional
studies suggest that LC n-3 PUFA may reduce risk of pro-
gression of psychotic disorders, such as schizophrenia, in
young people with subthreshold psychotic states (Ammin-
ger et al. 2010). Richardson (2006) reported on the
potential effects of LC n-3 PUFA on patients displaying
symptoms of attention deficit/hyperactivity disorder,
while SanGiovanni and Chew (2005) described the role of
LC n-3 PUFA in health and disease of the retina. Despite
the many health benefits attributed to LC n-3 PUFA, con-
troversy exists on their potential effects on reducing can-
cer risk (Larsson et al. 2004; MacLean et al. 2006).
Larsson et al. (2004) described several mechanisms of
action of LC n-3 PUFA in modifying the carcinogenic
process. MacLean et al. (2006) conducted a systematic
study that synthesized published and unpublished evi-
dence in this area and concluded that no significant asso-
ciations between LC n-3 PUFA consumption and cancer
incidence were found for numerous types of cancers.
Pink salmon is high in protein and a good source of
LC n-3 PUFA (~30%), especially of 20:5n-3 (eicosapenta-
enoic acid, EPA) and 22:6n-3 (docosahexaenoic acid,
DHA) (Kong et al. 2008). Nonetheless, there is high natu-
ral variability in the lipid content of wild Alaska pink sal-
mon, which vary from 2% up to 9% (Hardy and King
1989). High natural variability in the lipid content of wild
salmon makes the disclosure of LC n-3 PUFA content,
and in particular of EPA and DHA contents, in the prod-
uct nutritional label difficult. The main cause of variabil-
ity of lipid content in wild Pacific salmon is sexual
maturity and spawning migration (Ando et al. 1985).
During spawning migration, the feeding activity of Pacific
salmon decreases and stored lipids are used as energy,
and this causes a decrease in total lipid content of muscle
as fish near spawning (Ando et al. 1985; Durance and
Collins 1991; Reid et al. 1993). Concomitantly, the lipid-
soluble pigments responsible for the natural rose to
orange color of salmon fillets migrate from flesh to skin,
and in the case of females to the eggs (Durance and Collins
1991; Reid et al. 1993). Migration of pigments from flesh
to skin cause a skin blushing effect, ordinarily referred
to as “skin watermarking” (Ando et al. 1985; Huynh and
Mackey 1990; Durance and Collins 1991). Alaska seafood
processors use degree of skin watermarking as one of the
grading parameters for Pacific salmon species, separating
fish within each species as bright, semi-bright, and dark
(Oliveira et al. 2005). Dark fish, most prevalent in the
commercial catch during the late part of the salmon run,
are also designated as pale-meat salmon because of the
absence of the naturally occurring pigments in the flesh of
heavily skin-watermarked fish. Huynh and Mackey (1990)
conducted a quality study of late-run chum salmon and
noted that muscle quality is greatly impacted by the bio-
chemical changes that occur during spawning migration.
Late-run salmon muscle often has less desirable texture
and flavor, flesh softness, poor taste, and develops a dis-
tinct “late-odor” that reduces value of the product (Huynh
and Mackey 1990). When compared with canned pink sal-
mon produced from bright grade A fish, pale-meat canned
pink salmon had a distinct profile of chemical volatiles;
notwithstanding, a specific chemical compound that
imparted “late-odor” notes to product was not readily
identifiable (Oliveira et al. 2005).
In the early days of the Alaska salmon industry, canning
often included the addition of salmon oil (SO) rendered
from salmon heads. However, in the late 1960s, most
canned salmon processors in Alaska discontinued this prac-
tice, and production of SO for human use ceased. In the
last decade, growing interest in fish oils due to their nutri-
tional benefit has increased the price of this commodity,
prompting a revival of edible SO production in Alaska
(Bimbo 2009). Pacific salmon stores lipids in their head
and content of oil, despite variable between species, may be
as high as 16% w/w (Sathivel et al. 2005; Smiley et al.
2010). Salmon heads are a major byproduct of salmon pro-
cessing, and currently the production of edible SO in
Alaska is a lucrative business. SO produced in Alaska con-
tains about 65–93 mg/g oil EPA and 74–102 mg/g oil DHA
(Oliveira et al. 2010), and is the only optional ingredient
other than salt permitted by the standard of identity for
canned Pacific salmon by the Code of Federal Regulation
(21 CFR 161.70) (United States Food and Drug Adminis-
tration 2010). Adding SO to canned Alaska pink salmon
will boost the lipid content of heavily watermarked fish, or
pale-meat pink salmon, improving its nutritional value and
product consistency. This study investigated the effect of
adding Alaska edible wild SO to canned Alaska pink salmon
produced from fish exhibiting two opposite degrees of skin
watermarking, bright and dark. Specific goals of the study
were to evaluate the benefits of adding SO to canned pink
salmon with regard to nutritional value of the product, sen-
sorial characteristics, and the oxidative stability of the lipids
over thermal processing.
Materials and Methods
Fish procurement and processing
A total of 250 pink salmon (Oncorhynchus gorbuscha)
were procured from a processing plant in Kodiak, Alaska.
16 ª 2012 The Authors. Food Science & Nutrition published by Wiley Periodicals, Inc.
Supplementing Canned Pink Salmon With Salmon Oil T. J. Lapis et al.
Fish were seine-caught near Afognak Island, Kodiak
Archipelago, Alaska, during the summer of 2008. Of
which, 125 pink salmon exhibited no signs of skin water-
marking and were commercially graded as grade A bright
fish, while the remaining 125 pink salmon procured were
heavily skin-watermarked and received a commercial
graded of dark. Fish were less than 24 h postmortem and
gutted using an iron butcher at the commercial plant.
Fish were brought in iced totes to the Kodiak Seafood
and Marine Science (University of Alaska, Kodiak, AK)
pilot plant and canned the same day. A quantity of 15 L
of human-grade SO, rendered from salmon heads during
summer of 2008, was procured from a SO processor
(Alaska Protein Recovery, Juneau, AK; http://alas-
kaproteinrecovery.com/salmonoil) in August of 2008.
Bright pink salmon were cut into 215 g steaks and
placed in 307 9 200.25 cans with 3 g NaCl and 0, 1, or
2% (w/w) human-grade Alaska SO, and mirrored stan-
dard commercial salmon canning practices in Alaska.
Dark pink salmon were processed in identical fashion;
however, the levels of SO added to cans were 0, 2, or 4%
(w/w). The cans were filled at room temperature. The
total weight of SO added was converted to the corre-
sponding volume using product density, 0.9 g/mL (Sathi-
vel 2005), and values were rounded off such that 1, 2,
and 4% corresponded to 2.5, 5, and 10 mL, respectively.
The two-piece cans were vacuum-sealed, retorted at 120°Cfor 69 min and water-cooled (National Food Processors
Association 1982). A total of 960 cans of pink salmon, 160
for each of the six treatments, were produced. The treat-
ments were canned bright pink salmon with 0% (B0), 1%
(B1), and 2% (B2) human-grade SO, and canned dark pink
salmon with 0% (D0), 2% (D2), and 4% (D4) human-
grade SO.
Canned salmon sampling for chemicalanalyses
After 8–10 months of storage at room temperature (20–24°C), 24 canned pink salmon samples were randomly
selected from each of the six groups (B0, B1, B2, D0, D2,
and D4) for chemical analyses. Two cans within a treat-
ment (including bone, skin, and liquid) were homo-
genized at a time, using a Waring Commercial laboratory
blender (Blender 7012S, Torrington, CT), to produce one
sample that contained approximately 450 g of product,
which was sufficient material to conduct all chemical
analyses planned. Therefore, 12 sample replicates were
produced from each of the six treatments, each composed
of contents from two identical salmon cans.
Samples were individually frozen to �30°C overnight
in a tray placed in a walk-in freezer (Bally®, Morehead
City, NC). Frozen samples were placed in the freeze drier
(VirTis Virtual 52ES Freeze Dryer Lyophilizer, Gardiner,
NY) and maintained at �30°C for 30 min then at �40°Cfor 30 min with a condenser temperature of �50°C and
chamber pressure of 53.33 kPa. The primary freeze drying
parameters for shelf temperature and drying time were
�40°C for 6 h, �30°C for 5 h, �20°C for 4 h, �10°Cfor 3 h, and 0°C for 2 h, all under 8 Pa. The secondary
drying was set at 25°C for 3 h at 8 Pa. The freeze-drying
process took 24 h and was based on processing parame-
ters established for pink salmon fillets (Crapo et al. 2010).
The freeze-dried samples removed from the freeze-drier
chamber and immediately comminuted to powder using
a Mr. Coffee® IDS-50 coffee grinder (Shelton, CT). A
quantity of 0.5 g of sample from each tray was used to
measure water activity (aW), which was determined using
an AquaLab® water activity meter (Series 3 TE, Pullman,
WA). Upon verification that all samples had water activity
equal or below 0.2, samples were vacuum packaged (Koch
Ultravac® 2100, Kansas City, MO) and promptly frozen
at �30°C until chemically analyzed.
Proximate composition analysis
A total of 12 samples from each sample group (B0, B1,
B2, D0, D2, and D4), each containing the entire contents
of two identical cans of pink salmon, were used for analy-
sis. Moisture content was the only parameter measured
for wet samples, while moisture, ash, protein, and lipid
contents were determined using the freeze-dried samples
counterparts. Moisture and ash contents were determined
using Official Methods of Analysis of AOAC International
(AOAC) methods #952.08 and #938.08, respectively
(AOAC 2005). Nitrogen content was accessed by pyro-
lysis, as described in AOAC method 968.06 with a LECO
FP-2000 nitrogen analyzer (LECO Co., St. Joseph, MO),
and protein content was calculated as 6.25 times % N
(AOAC 2005). Lipids were determined gravimetrically
using an ASE200 Accelerated Solvent Extractor (Dionex,
Sunnyvale, CA) using an adaptation to the procedure pre-
viously described by Oliveira et al. (2006). Approximately,
4–5 g of freeze-dried samples were mixed with an equal
amount of hydromatrix (Varian, Inc., Palo Alto, CA), and
accurate sample weights were recorded using an analytical
balance (AX105 DeltaRange®, Mettler Toledo, Columbus,
OH). The mixture was placed in a 33 mL extraction cell
with a cellulose filter and quartz sand (Accusand®, Uni-
min Corp., Le Sueur, MN) to fill dead-volume at both
ends of the cell. Lipids were extracted using dichlorome-
thane as solvent, and the extraction parameters were
1500 psi pressure, 100°C, and three static cycles of 5 min
extraction for each sample producing a total of 50–55 mL
extracted volume. For the lipid yield data, the solvent
extract collected in a preweighed 60 mL collection vial
ª 2012 The Authors. Food Science & Nutrition published by Wiley Periodicals, Inc. 17
T. J. Lapis et al. Supplementing Canned Pink Salmon With Salmon Oil
was dried at 40°C under a stream of nitrogen until con-
stant weight using a Turbovap LV (Caliper Life Sciences,
Hopkinton, MA). Extracted lipids were dissolved in hex-
ane with 0.01% butylated hydroxytoluene (BHT), at a
ratio of about 1:10, and kept at �80°C until further anal-
ysis. Proximate composition data, reported on a wet
weight basis, was calculated using moisture content of
wet samples, and lipid, protein and ash contents deter-
mined in their freeze-dried counterparts. The proximate
composition values on a wet weight basis were also
adjusted using the moisture contents of each of the
freeze-dried samples to the moisture level of the corre-
sponding sample determined from wet tissues.
Salt content analysis
A total of 12 freeze-dried samples from each sample
group (B0, B1, B2, D0, D2, and D4), each containing
the entire contents of two identical cans of pink sal-
mon, were used for analysis. One gram of freeze-dried
sample was weighed into 9-mL screw-capped test tube
and 8 mL of deionized water added. The contents were
mixed for 1 min using a mini vortexer (VWR, West
Chester, PA) then centrifuged at 2000 rpm using a
Centra CL2 Thermo IEC benchtop centrifuge (Thermo
Fisher Scientific, Inc., Waltham, MA) for 30 min. The
supernatant liquid was isolated and diluted 1:15 with
deionized water. The resulting mixture was analyzed for
salt content using an M926 Chloride Analyzer (Nelson-
Jameson, Inc., Marshfield, WI) and reported as mg/
100 g of wet sample.
Fatty acids analysis
Fatty acid methyl esters were prepared, in duplicates,
using 20 mg of lipids extracted with the ASE200 from
each freeze-dried sample, which had been extracted. Fatty
acid methyl esters were also prepared, in duplicates, using
20 mg of SO (Alaska Protein Recovery, Juneau, AK;
http://alaskaproteinrecovery.com/salmonoil). The esterifi-
cation procedure followed the method described by Max-
well and Marmer (1983) using 1 mg of tricosanoic acid
methyl ester as internal standard. Fatty acid methyl esters
were transferred into 1.5-mL snap-cap amber vials (Agi-
lent Technologies, Wilmington, DE) and immediately
analyzed using a gas chromatographer (GC) model 6850
(Agilent Technologies, Wilmington, DE) fitted with a DB-
23 (60 m 9 0.25 mm id., 0.25 lm film) capillary column
(Agilent Technologies, Wilmington, DE). Hydrogen was
used as the carrier gas at a constant flow of 1.0 mL/min
and average velocity of 30 cm/sec. The initial nominal
inlet pressure was 15.26 psi, total flow was 58.6 mL/min,
and temperature was 250°C. The inlet was operated in
split mode at 50:1 ratio, and the oven programming was
as follows: 140–180°C at 2°C/min, 180–200°C at 2.5°C/min, 200–210°C at 0.5°C/min, and 210–230°C at 10°C/min. Total analysis time was 50 min. The GC was cou-
pled to a flame ionization detector operated at 275°C.Detector make-up gas flow was 35 mL N2/min, and air
and hydrogen flows were 450 mL/min and 40 mL/min,
respectively. An auto-sampler performed the GC injec-
tions of standards and samples, and injection volume was
1 lL. Data were collected and analyzed using the GC
ChemStation program (Rev.A.08.03 [847], Agilent Tech-
nologies 1990-2000, Wilmington, DE). Identification of
peaks was performed using the following Supelco® (Belle-
fonte, PA) standards: Marine Oil #1, Marine Oil #3,
S189-19, and Bacterial Acid Methyl Esters Mix. Results
were determined as milligrams of fatty acids per gram of
oil then converted to mg/100 g of product (serving size
stipulated in this study) based on the fat content of the
sample.
Lipid hydrolysis and oxidation analysis
Lipid hydrolysis and lipid oxidation parameters were
determined, in duplicates, for canned pink salmon sam-
ples and for the SO (Alaska Protein Recovery, Juneau,
AK; http://alaskaproteinrecovery.com/salmonoil) using
American Oil Chemists’ Society methods (AOCS 2004).
The free fatty acid values (FFA, reported as % oleic acid),
peroxide values (PV), and 2-thiobarbituric acid (TBA)
followed AOCS methods # Ca 5a-40, Cd 8-53, and Cd
19-90, respectively (AOCS 2004).
Consumer attribute analysis test
A group of eight people (faculty and graduate students)
from the University of Alaska Seafood Science Graduate
Program (KSMSC, Kodiak, AK) defined the attributes
used during the Consumer Test during a preliminary sen-
sory evaluation of the canned pink salmon samples. The
group tasted and smelled samples from each of the six
treatments (B0, B1, B2, D0, D2, and D4) and determined
attributes most relevant in the samples to be appearance,
color, overall taste, saltiness, bitterness, fattiness, fish fla-
vor, and texture. The main sensory evaluation conducted
was a consumer attribute analysis (CAA) test as previ-
ously described by Oliveira et al. (2004). The CAA test
was conducted in October of 2008 at the University of
Alaska Fairbanks (UAF) campus, Fairbanks (Alaska), with
the assistance of the Cooperative Extension Service (CES)
personnel of UAF. The panelists were community mem-
bers of Fairbanks, and students, staff, and faculty of UAF
ranging in age from 18 to 80 years old. The age average
of participants was 31 years old, the ratio of females to
18 ª 2012 The Authors. Food Science & Nutrition published by Wiley Periodicals, Inc.
Supplementing Canned Pink Salmon With Salmon Oil T. J. Lapis et al.
males was approximately 1:1.5 and about 8% of the par-
ticipants did not disclose gender information. Panelists
were selected based on their liking of fish and fishery
products and their frequency of eating fish, which should
be at least twice a month.
Unstructured scales (15 cm) with verbal anchors on
both ends were used (Oliveira et al. 2004), and instruc-
tion on the use the scale was given to each panelist. Each
can of sample was opened and the liquid, commercially
designated as canned salmon liquor, was poured equally
into four plastic cups with lids (118 mL volume). Canned
pink salmon steak was divided into four equal parts and
placed into the cups with their respective portioned
liquor. Unsalted crackers and commercial bottled water
were provided for palate rinsing. The panelists were asked
to evaluate the samples from left to right. Panelists rated
samples based on the sensory attributes requested by plac-
ing a vertical line anywhere within the scale where they
thought best described the sample. The panelists’ scores
were determined by measuring the length (cm) with a
ruler from the left verbal anchor to the vertical line
placed by the panelist for each sample code. Scores were
recorded up to 1 decimal place with 0 and 15 as lower
and upper limits, respectively, for all attributes. The CAA
Test was conducted through four consecutive days, and
in day 1 and day 2, product comparisons carried out were
B0 versus B1 versus B2 (107 panelists) and D0 versus D1
versus D2 (103 panelists), respectively. In day 1 and 2,
each participant received one tray containing three sample
cups. In day 3, two separate product comparisons were
conducted, B0 versus D0 (101 panelists) and B1 versus
D2 (105 panelists), and each panelist received two sepa-
rate trays each containing two sample cups. Order of pre-
sentation for first and second sample pairs was
randomized. Similarly, in day 4, two separate product
comparisons were conducted, B2 versus D4 (103 panel-
ists) and B2 versus D4 (105 panelists). In day 1 and 2 of
the CAA test, approximately 90 cans of salmon were used
each day, while in days 3 and 4 about 120 cans were used
each day. In total, the CAA test required approximately
420 cans of salmon.
Statistical analysis
Significant differences between canned salmon groups
were determined using one-way analysis of variance
(ANOVA; P < 0.05) followed by Tukey’s Honestly Signifi-
cance Difference Test (P < 0.05). All analyses were con-
ducted using Statistica version 8.0 (StatSoft Inc., Tulsa,
OK). Results for chemical analysis are reported as
weighted means (n = 12) and respective standard devia-
tions for each canned salmon group (B0, B1, B2, D0, D2,
and D4). Results for sensory analysis are reported as the
average of sensory scores and respective standard devia-
tions.
Results and Discussion
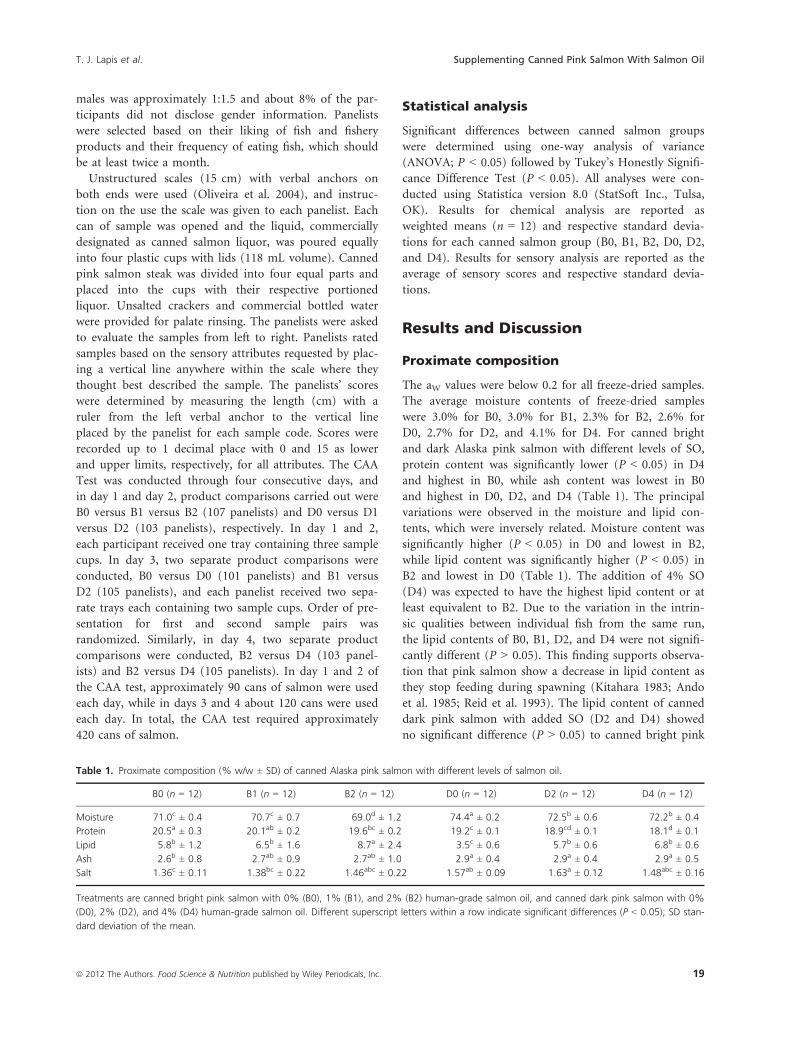
Proximate composition
The aW values were below 0.2 for all freeze-dried samples.
The average moisture contents of freeze-dried samples
were 3.0% for B0, 3.0% for B1, 2.3% for B2, 2.6% for
D0, 2.7% for D2, and 4.1% for D4. For canned bright
and dark Alaska pink salmon with different levels of SO,
protein content was significantly lower (P < 0.05) in D4
and highest in B0, while ash content was lowest in B0
and highest in D0, D2, and D4 (Table 1). The principal
variations were observed in the moisture and lipid con-
tents, which were inversely related. Moisture content was
significantly higher (P < 0.05) in D0 and lowest in B2,
while lipid content was significantly higher (P < 0.05) in
B2 and lowest in D0 (Table 1). The addition of 4% SO
(D4) was expected to have the highest lipid content or at
least equivalent to B2. Due to the variation in the intrin-
sic qualities between individual fish from the same run,
the lipid contents of B0, B1, D2, and D4 were not signifi-
cantly different (P > 0.05). This finding supports observa-
tion that pink salmon show a decrease in lipid content as
they stop feeding during spawning (Kitahara 1983; Ando
et al. 1985; Reid et al. 1993). The lipid content of canned
dark pink salmon with added SO (D2 and D4) showed
no significant difference (P > 0.05) to canned bright pink
Table 1. Proximate composition (% w/w ± SD) of canned Alaska pink salmon with different levels of salmon oil.
B0 (n = 12) B1 (n = 12) B2 (n = 12) D0 (n = 12) D2 (n = 12) D4 (n = 12)
Moisture 71.0c ± 0.4 70.7c ± 0.7 69.0d ± 1.2 74.4a ± 0.2 72.5b ± 0.6 72.2b ± 0.4
Protein 20.5a ± 0.3 20.1ab ± 0.2 19.6bc ± 0.2 19.2c ± 0.1 18.9cd ± 0.1 18.1d ± 0.1
Lipid 5.8b ± 1.2 6.5b ± 1.6 8.7a ± 2.4 3.5c ± 0.6 5.7b ± 0.6 6.8b ± 0.6
Ash 2.6b ± 0.8 2.7ab ± 0.9 2.7ab ± 1.0 2.9a ± 0.4 2.9a ± 0.4 2.9a ± 0.5
Salt 1.36c ± 0.11 1.38bc ± 0.22 1.46abc ± 0.22 1.57ab ± 0.09 1.63a ± 0.12 1.48abc ± 0.16
Treatments are canned bright pink salmon with 0% (B0), 1% (B1), and 2% (B2) human-grade salmon oil, and canned dark pink salmon with 0%
(D0), 2% (D2), and 4% (D4) human-grade salmon oil. Different superscript letters within a row indicate significant differences (P < 0.05); SD stan-
dard deviation of the mean.
ª 2012 The Authors. Food Science & Nutrition published by Wiley Periodicals, Inc. 19
T. J. Lapis et al. Supplementing Canned Pink Salmon With Salmon Oil
salmon without added SO (B0). More importantly, this
implied that 2% or 4% SO added prior to commercial
canning of dark fish would result in consistent lipid con-
tent in the product.
Shostrom et al. (1924), studying traditional canned
pink salmon (bone-free) obtained from nine different dis-
tricts in Alaska at the end of the canning season, sug-
gested a wide variation in lipid content (4–8%). Similarly,
5–13% lipid content was determined in traditional cans
produced during early and late pink salmon runs from
the north and south coasts of British Columbia (Vanders-
toep et al. 1990). Also, traditional canned pink salmon
produced by three different processors in Japan, in Octo-
ber 1987 and June and November 1988, had 4–15% lipid
content (Sasaki et al. 1989). These reports imply a varia-
tion in the sexual maturity of the pink salmon sample
and the lipid contents of B0 and D0 in the present study
confirmed the hypothesis. Furthermore, the lipid contents
(4.7% and 5.3%) for two commercial samples of tradi-
tional canned pink salmon purchased from Lafayette, IN
stores (Shim et al. 2004) were within the range observed
for B0 and D0. The USDA (2012) data for canned pink
salmon, solids with bone and liquid, were 74.04% mois-
ture, 4.97% lipid, 19.68% protein, and 1.31% ash and
were close to the values given in Table 1.
Aside from pink salmon, other species of salmon are
canned. Coho salmon (O. kisutch), following a traditional
canning method used in villages in interior Alaska,
showed a low 2% lipid content and high 6% ash content
(Bower et al. 2007). In their study, spawning coho salmon
were harvested and brined before canning, which allowed
uptake of moisture in fillets and making lipid content
proportionally lower. Farmed coho salmon (La Coruna,
Spain) canned in sunflower oil resulted in higher lipid
content (3–4%) than unsupplemented product (Rodri-
guez et al. 2009). Sockeye salmon (O. nerka) from two
different processors in Japan contain 7–8% lipid in the
cans (Ota et al. 1990). Other commercially canned fish
species contain lipids ranging from 6% to 8% for light
tuna, 5% to 6% for white and albacore tuna, and 4% to
5% for mackerel (Shim et al. 2004).
Salt content
The salt content in pink salmon cans ranged from 1.36%
to 1.63% of the total wet weight of the cans (Table 1).
There were significant differences detected, and D2 had the
highest salt content while B0 had the lowest (P < 0.05).
Overall, the 0.27% salt content difference between highest
and lowest values is relatively small, and significant differ-
ences reflect precision of the measurement. The range in
salt content observed in this study is slightly higher than
the 0.8–1.4% for commercial British Columbia canned
pink salmon (Vanderstoep et al. 1990). In their study, 1.8–2 g of salt were added per 213 g can of salmon compared
with the 3 g of salt per 215 g can of salmon in this study,
which followed Alaska salmon canning industry practices.
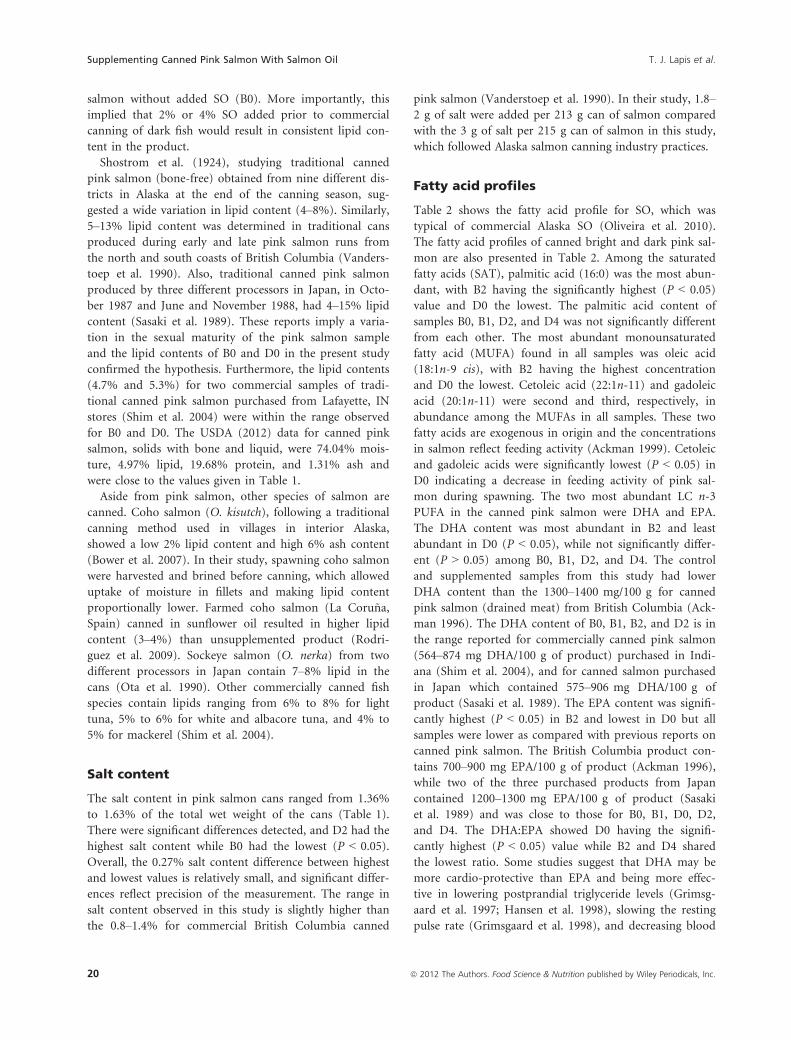
Fatty acid profiles
Table 2 shows the fatty acid profile for SO, which was
typical of commercial Alaska SO (Oliveira et al. 2010).
The fatty acid profiles of canned bright and dark pink sal-
mon are also presented in Table 2. Among the saturated
fatty acids (SAT), palmitic acid (16:0) was the most abun-
dant, with B2 having the significantly highest (P < 0.05)
value and D0 the lowest. The palmitic acid content of
samples B0, B1, D2, and D4 was not significantly different
from each other. The most abundant monounsaturated
fatty acid (MUFA) found in all samples was oleic acid
(18:1n-9 cis), with B2 having the highest concentration
and D0 the lowest. Cetoleic acid (22:1n-11) and gadoleic
acid (20:1n-11) were second and third, respectively, in
abundance among the MUFAs in all samples. These two
fatty acids are exogenous in origin and the concentrations
in salmon reflect feeding activity (Ackman 1999). Cetoleic
and gadoleic acids were significantly lowest (P < 0.05) in
D0 indicating a decrease in feeding activity of pink sal-
mon during spawning. The two most abundant LC n-3
PUFA in the canned pink salmon were DHA and EPA.
The DHA content was most abundant in B2 and least
abundant in D0 (P < 0.05), while not significantly differ-
ent (P > 0.05) among B0, B1, D2, and D4. The control
and supplemented samples from this study had lower
DHA content than the 1300–1400 mg/100 g for canned
pink salmon (drained meat) from British Columbia (Ack-
man 1996). The DHA content of B0, B1, B2, and D2 is in
the range reported for commercially canned pink salmon
(564–874 mg DHA/100 g of product) purchased in Indi-
ana (Shim et al. 2004), and for canned salmon purchased
in Japan which contained 575–906 mg DHA/100 g of
product (Sasaki et al. 1989). The EPA content was signifi-
cantly highest (P < 0.05) in B2 and lowest in D0 but all
samples were lower as compared with previous reports on
canned pink salmon. The British Columbia product con-
tains 700–900 mg EPA/100 g of product (Ackman 1996),
while two of the three purchased products from Japan
contained 1200–1300 mg EPA/100 g of product (Sasaki
et al. 1989) and was close to those for B0, B1, D0, D2,
and D4. The DHA:EPA showed D0 having the signifi-
cantly highest (P < 0.05) value while B2 and D4 shared
the lowest ratio. Some studies suggest that DHA may be
more cardio-protective than EPA and being more effec-
tive in lowering postprandial triglyceride levels (Grimsg-
aard et al. 1997; Hansen et al. 1998), slowing the resting
pulse rate (Grimsgaard et al. 1998), and decreasing blood
20 ª 2012 The Authors. Food Science & Nutrition published by Wiley Periodicals, Inc.
Supplementing Canned Pink Salmon With Salmon Oil T. J. Lapis et al.
pressure (Bao et al. 1998). British Columbia canned pink
salmon (drained meat) had 1.7–1.8 DHA:EPA (Ackman
1996), which was similar to B0, B1, and D2. Lower DHA
to EPA ratios (0.6–1) were recorded for canned pink sal-
mon purchased in Indiana (Shim et al. 2004), and the
range of 0.6–0.8 for two of three types of canned pink
salmon purchased in Japan (Sasaki et al. 1989). A third
sample of canned pink salmon purchased in Japan had a
DHA:EPA of 2 (Sasaki et al. 1989), which was similar to
that for D0. Compared with other species of canned sal-
mon, the DHA to EPA ratios of 1.5–2 for canned sockeye
salmon from Japan (Ota et al. 1990) are similar with that
of pink salmon from this study. On the other hand,
canned coho salmon from interior Alaska showed a
higher DHA:EPA of 2.4 (Bower et al. 2007). The majority
of commercial canned light tuna and albacore tuna pur-
chased in Indiana has a higher DHA to EPA ratio ranging
from 3 to 8 (Shim et al. 2004). However, the EPA and
DHA contents for canned tuna were lower than those
determined from this study and were 32–58 mg/100 g of
product and 181–300 mg/100 g of product, respectively,
except for one sample of canned albacore tuna with
190 mg EPA/100 g of product and 741 mg DHA/100 g of
product (Shim et al. 2004). Canned mackerel purchased
in Indiana has a lower DHA:EPA of 1.2–1.3 (Shim et al.
2004) than that of the canned pink salmon in this study.
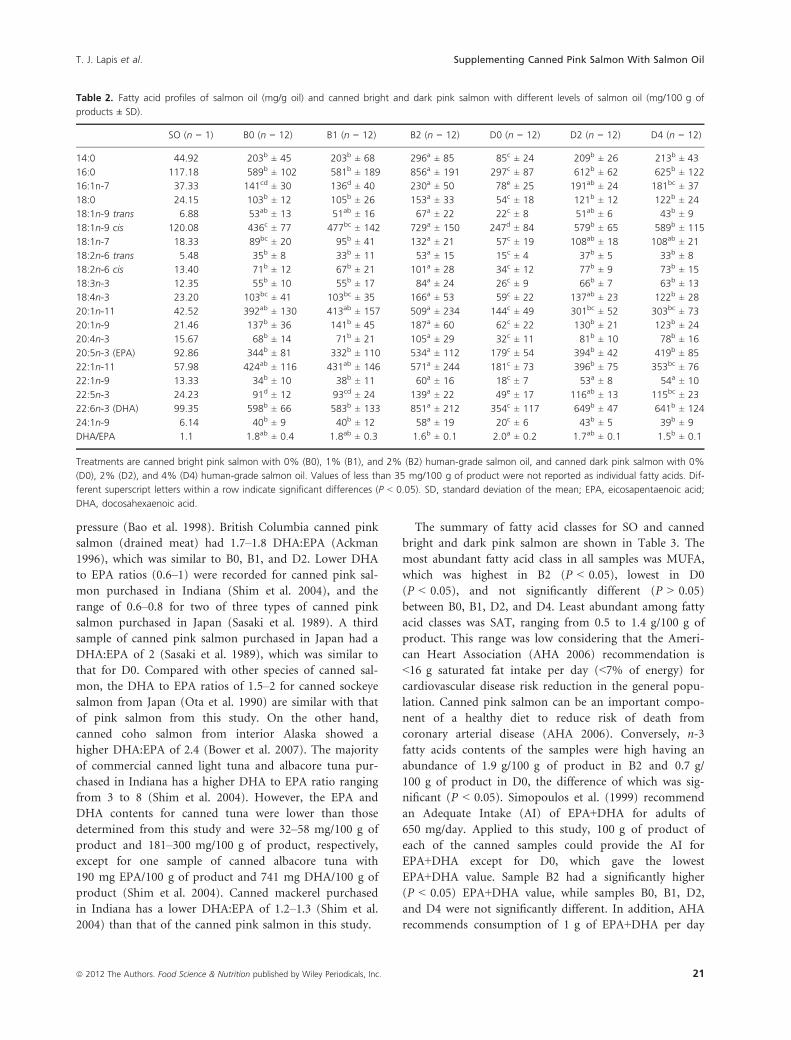
The summary of fatty acid classes for SO and canned
bright and dark pink salmon are shown in Table 3. The
most abundant fatty acid class in all samples was MUFA,
which was highest in B2 (P < 0.05), lowest in D0
(P < 0.05), and not significantly different (P > 0.05)
between B0, B1, D2, and D4. Least abundant among fatty
acid classes was SAT, ranging from 0.5 to 1.4 g/100 g of
product. This range was low considering that the Ameri-
can Heart Association (AHA 2006) recommendation is
<16 g saturated fat intake per day (<7% of energy) for
cardiovascular disease risk reduction in the general popu-
lation. Canned pink salmon can be an important compo-
nent of a healthy diet to reduce risk of death from
coronary arterial disease (AHA 2006). Conversely, n-3
fatty acids contents of the samples were high having an
abundance of 1.9 g/100 g of product in B2 and 0.7 g/
100 g of product in D0, the difference of which was sig-
nificant (P < 0.05). Simopoulos et al. (1999) recommend
an Adequate Intake (AI) of EPA+DHA for adults of
650 mg/day. Applied to this study, 100 g of product of
each of the canned samples could provide the AI for
EPA+DHA except for D0, which gave the lowest
EPA+DHA value. Sample B2 had a significantly higher
(P < 0.05) EPA+DHA value, while samples B0, B1, D2,
and D4 were not significantly different. In addition, AHA
recommends consumption of 1 g of EPA+DHA per day
Table 2. Fatty acid profiles of salmon oil (mg/g oil) and canned bright and dark pink salmon with different levels of salmon oil (mg/100 g of
products ± SD).
SO (n = 1) B0 (n = 12) B1 (n = 12) B2 (n = 12) D0 (n = 12) D2 (n = 12) D4 (n = 12)
14:0 44.92 203b ± 45 203b ± 68 296a ± 85 85c ± 24 209b ± 26 213b ± 43
16:0 117.18 589b ± 102 581b ± 189 856a ± 191 297c ± 87 612b ± 62 625b ± 122
16:1n-7 37.33 141cd ± 30 136d ± 40 230a ± 50 78e ± 25 191ab ± 24 181bc ± 37
18:0 24.15 103b ± 12 105b ± 26 153a ± 33 54c ± 18 121b ± 12 122b ± 24
18:1n-9 trans 6.88 53ab ± 13 51ab ± 16 67a ± 22 22c ± 8 51ab ± 6 43b ± 9
18:1n-9 cis 120.08 436c ± 77 477bc ± 142 729a ± 150 247d ± 84 579b ± 65 589b ± 115
18:1n-7 18.33 89bc ± 20 95b ± 41 132a ± 21 57c ± 19 108ab ± 18 108ab ± 21
18:2n-6 trans 5.48 35b ± 8 33b ± 11 53a ± 15 15c ± 4 37b ± 5 33b ± 8
18:2n-6 cis 13.40 71b ± 12 67b ± 21 101a ± 28 34c ± 12 77b ± 9 73b ± 15
18:3n-3 12.35 55b ± 10 55b ± 17 84a ± 24 26c ± 9 66b ± 7 63b ± 13
18:4n-3 23.20 103bc ± 41 103bc ± 35 166a ± 53 59c ± 22 137ab ± 23 122b ± 28
20:1n-11 42.52 392ab ± 130 413ab ± 157 509a ± 234 144c ± 49 301bc ± 52 303bc ± 73
20:1n-9 21.46 137b ± 36 141b ± 45 187a ± 60 62c ± 22 130b ± 21 123b ± 24
20:4n-3 15.67 68b ± 14 71b ± 21 105a ± 29 32c ± 11 81b ± 10 78b ± 16
20:5n-3 (EPA) 92.86 344b ± 81 332b ± 110 534a ± 112 179c ± 54 394b ± 42 419b ± 85
22:1n-11 57.98 424ab ± 116 431ab ± 146 571a ± 244 181c ± 73 396b ± 75 353bc ± 76
22:1n-9 13.33 34b ± 10 38b ± 11 60a ± 16 18c ± 7 53a ± 8 54a ± 10
22:5n-3 24.23 91d ± 12 93cd ± 24 139a ± 22 49e ± 17 116ab ± 13 115bc ± 23
22:6n-3 (DHA) 99.35 598b ± 66 583b ± 133 851a ± 212 354c ± 117 649b ± 47 641b ± 124
24:1n-9 6.14 40b ± 9 40b ± 12 58a ± 19 20c ± 6 43b ± 5 39b ± 9
DHA/EPA 1.1 1.8ab ± 0.4 1.8ab ± 0.3 1.6b ± 0.1 2.0a ± 0.2 1.7ab ± 0.1 1.5b ± 0.1
Treatments are canned bright pink salmon with 0% (B0), 1% (B1), and 2% (B2) human-grade salmon oil, and canned dark pink salmon with 0%
(D0), 2% (D2), and 4% (D4) human-grade salmon oil. Values of less than 35 mg/100 g of product were not reported as individual fatty acids. Dif-
ferent superscript letters within a row indicate significant differences (P < 0.05). SD, standard deviation of the mean; EPA, eicosapentaenoic acid;
DHA, docosahexaenoic acid.
ª 2012 The Authors. Food Science & Nutrition published by Wiley Periodicals, Inc. 21
T. J. Lapis et al. Supplementing Canned Pink Salmon With Salmon Oil
for patients with documented coronary heart disease (AHA
2006). Consumption of 100 g per day of B2, as well as sam-
ples B0, B1, D2, and D4 can provide adequate EPA+DHA
requirement for patients with documented coronary heart
disease. In summary, conventionally canned bright pink
salmon (B0) may provide the AI for EPA+DHA for adults
and AHA’s recommendation for daily intake for patients
with coronary heart disease, while canned unsupplemented
dark fish (D0) may not. The significant difference between
the EPA+DHA values of B0 and D0 reflects the natural var-
iation, thus inconsistent lipid-related composition and
nutritional quality of canned pink salmon. This variation
can become a concern if consumption of canned pink
salmon is recommended as part of coronary heart disease
patients’ diets. In this study, the concern was resolved with
the addition of SO to canned dark pink salmon. The
EPA+DHA values for traditional canned pink salmon
determined from other studies were higher: 2.1–2.3 g/
100 g of drained meat product from British Columbia
(Ackman 1996), 0.9–2.1 g/100 g and 1.5–1.8 g/100 g of
product from those purchased in Japan (Sasaki et al. 1989)
and Indiana (Shim et al. 2004), respectively. In compari-
son, canned coho salmon had 0.5 g of EPA+DHA/100 g of
product (Bower et al. 2007), while canned sockeye from
Japan had 1.3–1.4 g/100 g of product (Ota et al. 1990).
Other canned fish species contained 0.1–0.3 g/100 g of
product for light tuna, 0.2–0.9 g/100 g of product for
albacore tuna, and 0.5–1.2 g/100 g of product for mackerel
(Shim et al. 2004).
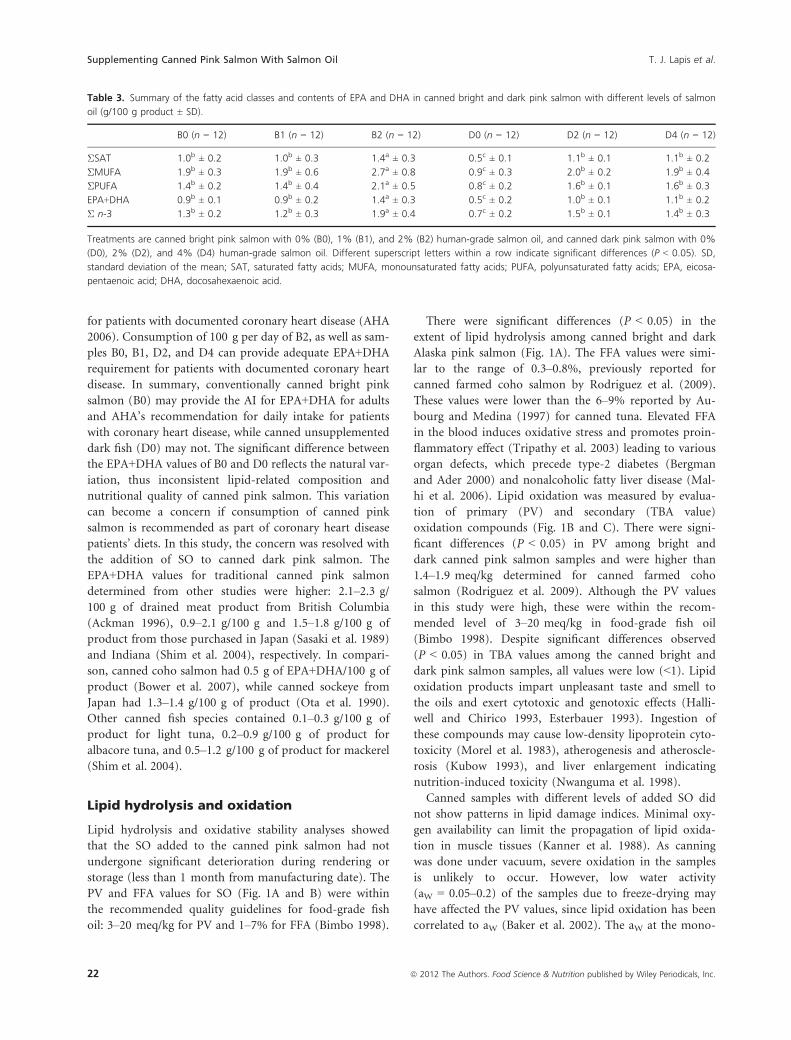
Lipid hydrolysis and oxidation
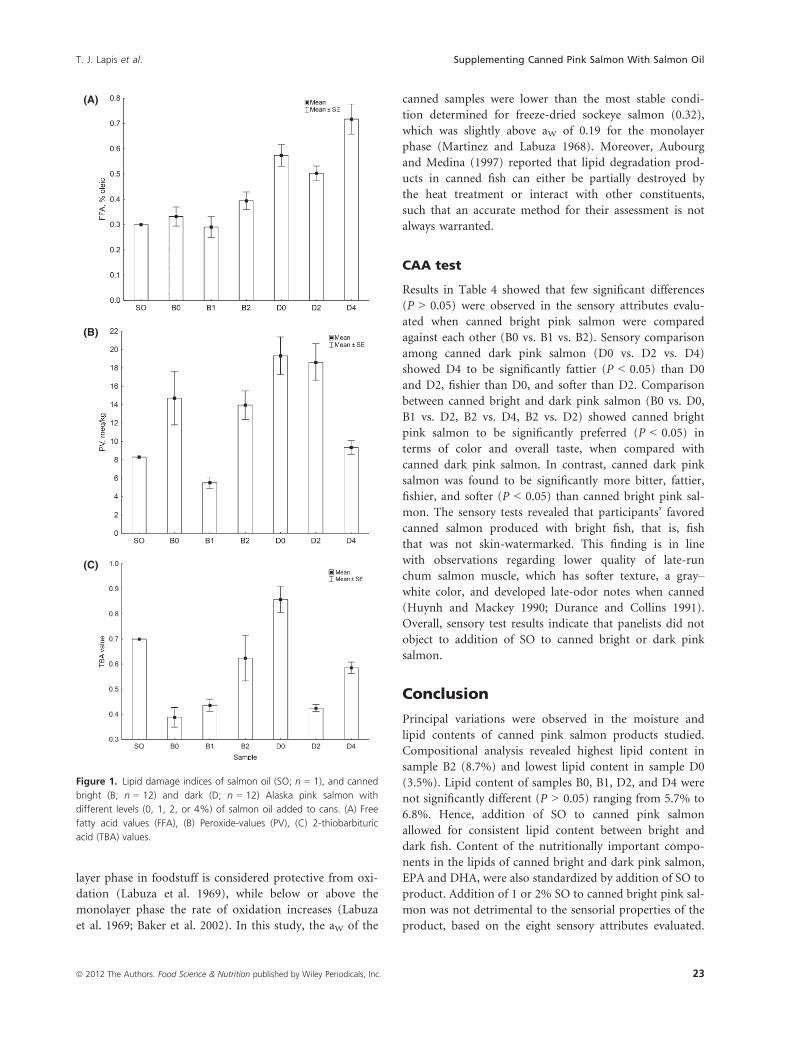
Lipid hydrolysis and oxidative stability analyses showed
that the SO added to the canned pink salmon had not
undergone significant deterioration during rendering or
storage (less than 1 month from manufacturing date). The
PV and FFA values for SO (Fig. 1A and B) were within
the recommended quality guidelines for food-grade fish
oil: 3–20 meq/kg for PV and 1–7% for FFA (Bimbo 1998).
There were significant differences (P < 0.05) in the
extent of lipid hydrolysis among canned bright and dark
Alaska pink salmon (Fig. 1A). The FFA values were simi-
lar to the range of 0.3–0.8%, previously reported for
canned farmed coho salmon by Rodriguez et al. (2009).
These values were lower than the 6–9% reported by Au-
bourg and Medina (1997) for canned tuna. Elevated FFA
in the blood induces oxidative stress and promotes proin-
flammatory effect (Tripathy et al. 2003) leading to various
organ defects, which precede type-2 diabetes (Bergman
and Ader 2000) and nonalcoholic fatty liver disease (Mal-
hi et al. 2006). Lipid oxidation was measured by evalua-
tion of primary (PV) and secondary (TBA value)
oxidation compounds (Fig. 1B and C). There were signi-
ficant differences (P < 0.05) in PV among bright and
dark canned pink salmon samples and were higher than
1.4–1.9 meq/kg determined for canned farmed coho
salmon (Rodriguez et al. 2009). Although the PV values
in this study were high, these were within the recom-
mended level of 3–20 meq/kg in food-grade fish oil
(Bimbo 1998). Despite significant differences observed
(P < 0.05) in TBA values among the canned bright and
dark pink salmon samples, all values were low (<1). Lipidoxidation products impart unpleasant taste and smell to
the oils and exert cytotoxic and genotoxic effects (Halli-
well and Chirico 1993, Esterbauer 1993). Ingestion of
these compounds may cause low-density lipoprotein cyto-
toxicity (Morel et al. 1983), atherogenesis and atheroscle-
rosis (Kubow 1993), and liver enlargement indicating
nutrition-induced toxicity (Nwanguma et al. 1998).
Canned samples with different levels of added SO did
not show patterns in lipid damage indices. Minimal oxy-
gen availability can limit the propagation of lipid oxida-
tion in muscle tissues (Kanner et al. 1988). As canning
was done under vacuum, severe oxidation in the samples
is unlikely to occur. However, low water activity
(aW = 0.05–0.2) of the samples due to freeze-drying may
have affected the PV values, since lipid oxidation has been
correlated to aW (Baker et al. 2002). The aW at the mono-
Table 3. Summary of the fatty acid classes and contents of EPA and DHA in canned bright and dark pink salmon with different levels of salmon
oil (g/100 g product ± SD).
B0 (n = 12) B1 (n = 12) B2 (n = 12) D0 (n = 12) D2 (n = 12) D4 (n = 12)
ΣSAT 1.0b ± 0.2 1.0b ± 0.3 1.4a ± 0.3 0.5c ± 0.1 1.1b ± 0.1 1.1b ± 0.2
ΣMUFA 1.9b ± 0.3 1.9b ± 0.6 2.7a ± 0.8 0.9c ± 0.3 2.0b ± 0.2 1.9b ± 0.4
ΣPUFA 1.4b ± 0.2 1.4b ± 0.4 2.1a ± 0.5 0.8c ± 0.2 1.6b ± 0.1 1.6b ± 0.3
EPA+DHA 0.9b ± 0.1 0.9b ± 0.2 1.4a ± 0.3 0.5c ± 0.2 1.0b ± 0.1 1.1b ± 0.2
Σ n-3 1.3b ± 0.2 1.2b ± 0.3 1.9a ± 0.4 0.7c ± 0.2 1.5b ± 0.1 1.4b ± 0.3
Treatments are canned bright pink salmon with 0% (B0), 1% (B1), and 2% (B2) human-grade salmon oil, and canned dark pink salmon with 0%
(D0), 2% (D2), and 4% (D4) human-grade salmon oil. Different superscript letters within a row indicate significant differences (P < 0.05). SD,
standard deviation of the mean; SAT, saturated fatty acids; MUFA, monounsaturated fatty acids; PUFA, polyunsaturated fatty acids; EPA, eicosa-
pentaenoic acid; DHA, docosahexaenoic acid.
22 ª 2012 The Authors. Food Science & Nutrition published by Wiley Periodicals, Inc.
Supplementing Canned Pink Salmon With Salmon Oil T. J. Lapis et al.
layer phase in foodstuff is considered protective from oxi-
dation (Labuza et al. 1969), while below or above the
monolayer phase the rate of oxidation increases (Labuza
et al. 1969; Baker et al. 2002). In this study, the aW of the
canned samples were lower than the most stable condi-
tion determined for freeze-dried sockeye salmon (0.32),
which was slightly above aW of 0.19 for the monolayer
phase (Martinez and Labuza 1968). Moreover, Aubourg
and Medina (1997) reported that lipid degradation prod-
ucts in canned fish can either be partially destroyed by
the heat treatment or interact with other constituents,
such that an accurate method for their assessment is not
always warranted.
CAA test
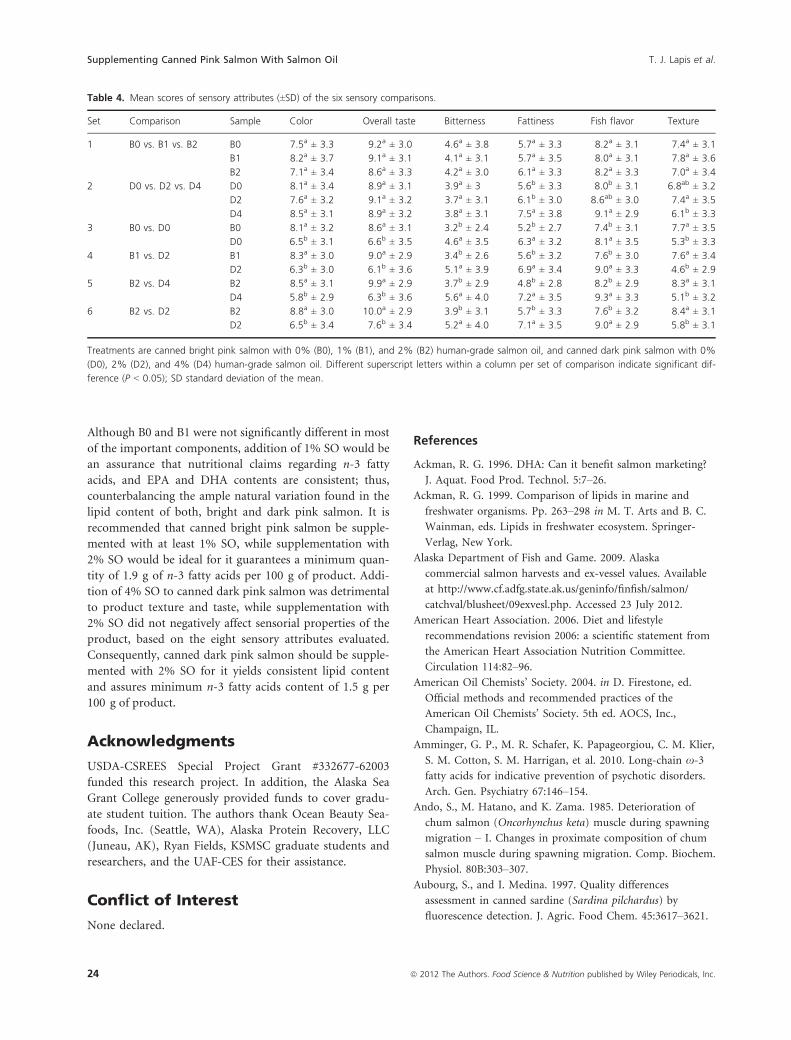
Results in Table 4 showed that few significant differences
(P > 0.05) were observed in the sensory attributes evalu-
ated when canned bright pink salmon were compared
against each other (B0 vs. B1 vs. B2). Sensory comparison
among canned dark pink salmon (D0 vs. D2 vs. D4)
showed D4 to be significantly fattier (P < 0.05) than D0
and D2, fishier than D0, and softer than D2. Comparison
between canned bright and dark pink salmon (B0 vs. D0,
B1 vs. D2, B2 vs. D4, B2 vs. D2) showed canned bright
pink salmon to be significantly preferred (P < 0.05) in
terms of color and overall taste, when compared with
canned dark pink salmon. In contrast, canned dark pink
salmon was found to be significantly more bitter, fattier,
fishier, and softer (P < 0.05) than canned bright pink sal-
mon. The sensory tests revealed that participants’ favored
canned salmon produced with bright fish, that is, fish
that was not skin-watermarked. This finding is in line
with observations regarding lower quality of late-run
chum salmon muscle, which has softer texture, a gray–white color, and developed late-odor notes when canned
(Huynh and Mackey 1990; Durance and Collins 1991).
Overall, sensory test results indicate that panelists did not
object to addition of SO to canned bright or dark pink
salmon.
Conclusion
Principal variations were observed in the moisture and
lipid contents of canned pink salmon products studied.
Compositional analysis revealed highest lipid content in
sample B2 (8.7%) and lowest lipid content in sample D0
(3.5%). Lipid content of samples B0, B1, D2, and D4 were
not significantly different (P > 0.05) ranging from 5.7% to
6.8%. Hence, addition of SO to canned pink salmon
allowed for consistent lipid content between bright and
dark fish. Content of the nutritionally important compo-
nents in the lipids of canned bright and dark pink salmon,
EPA and DHA, were also standardized by addition of SO to
product. Addition of 1 or 2% SO to canned bright pink sal-
mon was not detrimental to the sensorial properties of the
product, based on the eight sensory attributes evaluated.
(A)
(B)
(C)
Figure 1. Lipid damage indices of salmon oil (SO; n = 1), and canned
bright (B; n = 12) and dark (D; n = 12) Alaska pink salmon with
different levels (0, 1, 2, or 4%) of salmon oil added to cans. (A) Free
fatty acid values (FFA), (B) Peroxide-values (PV), (C) 2-thiobarbituric
acid (TBA) values.
ª 2012 The Authors. Food Science & Nutrition published by Wiley Periodicals, Inc. 23
T. J. Lapis et al. Supplementing Canned Pink Salmon With Salmon Oil
Although B0 and B1 were not significantly different in most
of the important components, addition of 1% SO would be
an assurance that nutritional claims regarding n-3 fatty
acids, and EPA and DHA contents are consistent; thus,
counterbalancing the ample natural variation found in the
lipid content of both, bright and dark pink salmon. It is
recommended that canned bright pink salmon be supple-
mented with at least 1% SO, while supplementation with
2% SO would be ideal for it guarantees a minimum quan-
tity of 1.9 g of n-3 fatty acids per 100 g of product. Addi-
tion of 4% SO to canned dark pink salmon was detrimental
to product texture and taste, while supplementation with
2% SO did not negatively affect sensorial properties of the
product, based on the eight sensory attributes evaluated.
Consequently, canned dark pink salmon should be supple-
mented with 2% SO for it yields consistent lipid content
and assures minimum n-3 fatty acids content of 1.5 g per
100 g of product.
Acknowledgments
USDA-CSREES Special Project Grant #332677-62003
funded this research project. In addition, the Alaska Sea
Grant College generously provided funds to cover gradu-
ate student tuition. The authors thank Ocean Beauty Sea-
foods, Inc. (Seattle, WA), Alaska Protein Recovery, LLC
(Juneau, AK), Ryan Fields, KSMSC graduate students and
researchers, and the UAF-CES for their assistance.
Conflict of Interest
None declared.
References
Ackman, R. G. 1996. DHA: Can it benefit salmon marketing?
J. Aquat. Food Prod. Technol. 5:7–26.
Ackman, R. G. 1999. Comparison of lipids in marine and
freshwater organisms. Pp. 263–298 in M. T. Arts and B. C.
Wainman, eds. Lipids in freshwater ecosystem. Springer-
Verlag, New York.
Alaska Department of Fish and Game. 2009. Alaska
commercial salmon harvests and ex-vessel values. Available
at http://www.cf.adfg.state.ak.us/geninfo/finfish/salmon/
catchval/blusheet/09exvesl.php. Accessed 23 July 2012.
American Heart Association. 2006. Diet and lifestyle
recommendations revision 2006: a scientific statement from
the American Heart Association Nutrition Committee.
Circulation 114:82–96.
American Oil Chemists’ Society. 2004. in D. Firestone, ed.
Official methods and recommended practices of the
American Oil Chemists’ Society. 5th ed. AOCS, Inc.,
Champaign, IL.
Amminger, G. P., M. R. Schafer, K. Papageorgiou, C. M. Klier,
S. M. Cotton, S. M. Harrigan, et al. 2010. Long-chain x-3fatty acids for indicative prevention of psychotic disorders.
Arch. Gen. Psychiatry 67:146–154.
Ando, S., M. Hatano, and K. Zama. 1985. Deterioration of
chum salmon (Oncorhynchus keta) muscle during spawning
migration – I. Changes in proximate composition of chum
salmon muscle during spawning migration. Comp. Biochem.
Physiol. 80B:303–307.
Aubourg, S., and I. Medina. 1997. Quality differences
assessment in canned sardine (Sardina pilchardus) by
fluorescence detection. J. Agric. Food Chem. 45:3617–3621.
Table 4. Mean scores of sensory attributes (±SD) of the six sensory comparisons.
Set Comparison Sample Color Overall taste Bitterness Fattiness Fish flavor Texture
1 B0 vs. B1 vs. B2 B0 7.5a ± 3.3 9.2a ± 3.0 4.6a ± 3.8 5.7a ± 3.3 8.2a ± 3.1 7.4a ± 3.1
B1 8.2a ± 3.7 9.1a ± 3.1 4.1a ± 3.1 5.7a ± 3.5 8.0a ± 3.1 7.8a ± 3.6
B2 7.1a ± 3.4 8.6a ± 3.3 4.2a ± 3.0 6.1a ± 3.3 8.2a ± 3.3 7.0a ± 3.4
2 D0 vs. D2 vs. D4 D0 8.1a ± 3.4 8.9a ± 3.1 3.9a ± 3 5.6b ± 3.3 8.0b ± 3.1 6.8ab ± 3.2
D2 7.6a ± 3.2 9.1a ± 3.2 3.7a ± 3.1 6.1b ± 3.0 8.6ab ± 3.0 7.4a ± 3.5
D4 8.5a ± 3.1 8.9a ± 3.2 3.8a ± 3.1 7.5a ± 3.8 9.1a ± 2.9 6.1b ± 3.3
3 B0 vs. D0 B0 8.1a ± 3.2 8.6a ± 3.1 3.2b ± 2.4 5.2b ± 2.7 7.4b ± 3.1 7.7a ± 3.5
D0 6.5b ± 3.1 6.6b ± 3.5 4.6a ± 3.5 6.3a ± 3.2 8.1a ± 3.5 5.3b ± 3.3
4 B1 vs. D2 B1 8.3a ± 3.0 9.0a ± 2.9 3.4b ± 2.6 5.6b ± 3.2 7.6b ± 3.0 7.6a ± 3.4
D2 6.3b ± 3.0 6.1b ± 3.6 5.1a ± 3.9 6.9a ± 3.4 9.0a ± 3.3 4.6b ± 2.9
5 B2 vs. D4 B2 8.5a ± 3.1 9.9a ± 2.9 3.7b ± 2.9 4.8b ± 2.8 8.2b ± 2.9 8.3a ± 3.1
D4 5.8b ± 2.9 6.3b ± 3.6 5.6a ± 4.0 7.2a ± 3.5 9.3a ± 3.3 5.1b ± 3.2
6 B2 vs. D2 B2 8.8a ± 3.0 10.0a ± 2.9 3.9b ± 3.1 5.7b ± 3.3 7.6b ± 3.2 8.4a ± 3.1
D2 6.5b ± 3.4 7.6b ± 3.4 5.2a ± 4.0 7.1a ± 3.5 9.0a ± 2.9 5.8b ± 3.1
Treatments are canned bright pink salmon with 0% (B0), 1% (B1), and 2% (B2) human-grade salmon oil, and canned dark pink salmon with 0%
(D0), 2% (D2), and 4% (D4) human-grade salmon oil. Different superscript letters within a column per set of comparison indicate significant dif-
ference (P < 0.05); SD standard deviation of the mean.
24 ª 2012 The Authors. Food Science & Nutrition published by Wiley Periodicals, Inc.
Supplementing Canned Pink Salmon With Salmon Oil T. J. Lapis et al.
Baker, G. L., C. A. Sims, D. A. Gorbert, T. H. Sanders, and S.
F. O’Keefe. 2002. Storage water activity effect on oxidation
and sensory properties of high-oleic peanuts. J. Food Sci.
67:1600–1603.
Balk, E. M., A. H. Lichtenstein, M. Chung, B. Kupelnick, P.
Chew, and J. Lau. 2006. Effects of omega-3 fatty acids on
serum markers of cardiovascular disease risk: a systematic
review. Atherosclerosis 189:19–30.
Bao, D. Q., T. A. Mori, V. Burke, I. B. Puddey, and L. J.
Beilin. 1998. Effects of dietary fish and weight reduction on
ambulatory blood pressure in overweight hypertensives.
Hypertension 32:710–717.
Bergman, R. N., and M. Ader. 2000. Free fatty acids and
pathogenesis of type 2 diabetes mellitus. Trends Endocrinol.
Metab. 11:351–356.
Bimbo, A. P. 1998. Guidelines for characterizing food grade
fish oils. Inform 9:473–483.
Bimbo, A. P. 2009. Alaska seafood byproducts: potential
products, markets and competing products. Available at
http://www.afdf.org/past_research/2008_by_product_
mkt_study.pdf. Accessed 23 July 2012.
Bower, C. K., C. L. Malemute, and A. C. M. Oliveira. 2007.
Preservation methods for retaining n-3 polyunsaturated fatty
acids in Alaska coho salmon (Oncorhynchus kisutch)
products. J. Aquat. Food Prod. Technol. 16:45–54.
Calder, P. C. 2006. n-3 Polyunsaturated fatty acids,
inflammation, and inflammatory diseases. Am. J. Clin. Nutr.
83:S1505–S1519.
Crapo, C. A., A. C. M. Oliveira, D. X. Nguyen, P. J. Bechtel,
and Q. Fong. 2010. Development of a method to produce
freeze-dried cubes from three Pacific salmon species. J. Food
Sci. 75:E269–E275.
Durance, T. D., and L. S. Collins. 1991. Quality enhancement
of sexually mature chum salmon Oncorhynchus keta in
retort pouches. J. Food Sci. 56:1282–1286.
Esterbauer, H. 1993. Cytotoxicity and genotoxicity of lipid-
oxidation products. Am. J. Clin. Nutr. 57:779S–786S.
Franz, N. 2006. FISH INFOnetwork market report on salmon.
Available at http://www.eurofish.dk/dynamiskSub.php4?
id=3391. Accessed 23 July 2012.
Grimsgaard, S., K. H. Bønaa, J. B. Hansen, and A. Nordøy.
1997. Highly purified eicosapentaenoic acid and
docosahexaenoic acid in humans have similar
triacylglycerol-lowering effects but divergent effects on
serum fatty acids. Am. J. Clin. Nutr. 66:649–659.
Grimsgaard, S., K. H. Bønaa, J. B. Hansen, and E. S. P. Myhre.
1998. Effects of highly purified eicosapentaenoic acid and
docosahexaenoic acid on hemodynamics in humans. Am. J.
Clin. Nutr. 68:52–59.
Halliwell, B., and S. Chirico. 1993. Lipid peroxidation: its
mechanism, measurement, and significance. Am. J. Clin.
Nutr. 57:715S–725S.
Hansen, J. B., S. Grimsgaard, H. Nilsen, A. Nordøy, and K. H.
Bønaa. 1998. Effects of highly purified eicosapentaenoic acid
and docosahexaenoic acid on fatty acid absorption,
incorporation into serum phospholipids and postprandial
triglyceridemia. Lipids 33:131–138.
Hardy, R. W., and I. B. King. 1989. Variation in n-3 fatty acid
content of fresh and frozen salmon. Omega 3 News IV:1–4.
Harris, W. S., M. Miller, A. P. Tighe, M. H. Davidson, and E.
J. Schaefer. 2008. Omega-3 fatty acids and coronary heart
disease: clinical mechanistic perspectives. Arteriosclerosis
19:12–24.
Huynh, M. D., and J. Mackey. 1990. A quality study of late-run
chum salmon. Pp. 163–175 in E. G. Bligh, ed. Seafood science
and technology. Fishing News Book Ltd., Oxford, U.K.
Kanner, J., I. Shegalovich, S. Harel, and B. Hazan. 1988.
Muscle lipid peroxidation dependent on oxygen and free
metal ions. J. Agric. Food Chem. 36:412–415.
Kitahara, T. 1983. Behavior of carotenoids in the chum
salmon (Oncorhynchus keta) during anadromous migration.
Comp. Biochem. Physiol. 76B:97–101.
Knapp, G., C. A. Roheim, and J. L. Anderson. 2007. P. 302 in
The great salmon run: competition between wild and farmed
salmon. World Wildlife Fund, Inc., Washington, DC.
Kong, F., A. C. M. Oliveira, J. Tang, B. Rasco, and C. A.
Crapo. 2008. Effect of salt addition on the quality changes
of salmon fillet during thermal processing. Food Chem.
106:957–966.
Kubow, S. 1993. Lipid oxidation products in food and
atherogenesis. Nutr. Rev. 51:33–40.
Labuza, T. P., H. Tsuyuki, and M. Karel. 1969. Kinetics of
linoleate oxidation in model systems. J. Am. Oil Chem. Soc.
46:409–416.
Larsson, S. C., M. Kumlin, M. Ingelman-Sundberg, and A.
Wolk. 2004. Dietary long-chain n-3 fatty acids for the
prevention of cancer: a review of potential mechanisms. Am.
J. Clin. Nutr. 79:935–945.
Liese, A. D., K. E. Weis, D. Pluto, E. Smith, and A. Lawson.
2007. Food store types, availability, and cost of foods in a
rural environment. J. Am. Diet. Assoc. 107:1916–1923.
MacLean, C. H., S. J. Newberry, W. A. Mojica, P. Khanna, A. M.
Issa, M. J. Suttorp, et al. 2006. Effects of omega-3 fatty acids
on cancer risk: a systematic review. JAMA 295:403–415.
Malhi, H., S. F. Bronk, N. W. Werneburg, and G. J. Gores.
2006. Free fatty acids induce JNK-dependent hepatocyte
lipoapoptosis. J. Biol. Chem. 281:12093–12101.
Martinez, F., and T. P. Labuza. 1968. Rate of deterioration of
freeze-dried salmon as a function of relative humidity. J.
Food Sci. 33:241–247.
Maxwell, R. J., and W. N. Marmer. 1983. Systematic protocol
for the accumulation of fatty acid data for multiple tissues
sample: tissue handling, lipid extraction, lipid class
separation, and gas chromatographic analysis. Lipids
18:453–459.
Morel, D. W., J. R. Hessler, and G. M. Chisolm. 1983. Low
density lipoprotein cytotoxicity induced by free radical
peroxidation of lipid. J. Lipid Res. 24:1070–1076.
ª 2012 The Authors. Food Science & Nutrition published by Wiley Periodicals, Inc. 25
T. J. Lapis et al. Supplementing Canned Pink Salmon With Salmon Oil
National Food Processors Association. 1982. P. 51 in Thermal
processes for low-acid foods in metal containers. Bulletin
26-L. 12th ed. National Food Processors Association,
Washington, DC.
Nwanguma, B. C., A. C. Achebe, L. U. S. Ezeanyika, and L. C.
Eze. 1998. Toxicity of oxidized fats II: levels of peroxides in
rats fed a thermally oxidized corn oil diet. Food Chem.
Toxicol. 37:413–416.
Official Methods of Analysis of AOAC International. 2005.
Official methods of analysis of the association of official
analytical chemists. 5th ed. Official Analytical Chemists,
Inc., Arlington, VA.
Oliveira, A. C. M., S. F. O’Keefe, M. O. Balaban, C. A. Sims,
and K. M. Portier. 2004. Influence of commercial diets on
quality aspects of cultured Gulf of Mexico sturgeon
(Ancipenser oxyrinchus desotoi). J. Food Sci. 69:S278–S284.
Oliveira, A. C. M., C. A. Crapo, B. Himelbloom, C. Vorholt,
and J. Hoffert. 2005. Headspace gas chromatography-mass
spectrometry and electronic nose analysis of volatile
compounds in canned Alaska pink salmon having various
grades of watermarking. J. Food Sci. 70:S419–S426.
Oliveira, A. C. M., B. Himelbloom, C. A. Crapo, C. Vorholt,
Q. Fong, and R. RaLonde. 2006. Quality of Alaskan
maricultured oysters (Crassostrea gigas): a one year study. J.
Food Sci. 71:C532–C543.
Oliveira, A. C. M., T. J. Lapis, T. Popp, B. H. Himelbloom, S.
Smiley, P. J. Bechtel, et al. 2010. The chemical composition
and oxidative stability of Alaska commercial salmon oils.
Pp. 241–257 in P. J. Bechtel and S. Smiley, eds. A
sustainable future: fish processing byproducts. Alaska Sea
Grant, University of Alaska Fairbanks, Fairbanks, AK.
Ota, T., S. Sasaki, T. Abe, and T. Takagi. 1990. Fatty acid
compositions of the lipids obtained from commercial
salmon products. Nippon Suisan Gakkaishi 56:323–327.
Reid, R. A., T. D. Durance, D. C. Walker, and P. E. Reid.
1993. Structural and chemical changes in the muscle of
chum salmon (Oncorhynchus keta) during spawning
migration. Food Res. Int. 26:1–9.
Richardson, A. J. 2006. Omega-3 fatty acids in ADHD and
related neurodevelopmental disorders. Int. Rev. Psychiatry
18:155–172.
Rodriguez, A., N. Carriles, J. M. Gallardo, and S. P. Aubourg.
2009. Chemical changes during farmed coho salmon
(Oncorhynchus kisutch) canning: effect of a preliminary
chilled storage. Food Chem. 112:362–368.
Ruxton, C. H. S., P. C. Calder, S. C. Reed, and M. J. A.
Simpson. 2005. The impact of long-chain n-3
polyunsaturated fatty acids on human health. Nutr. Res.
Rev. 18:113–1219.
SanGiovanni, J. P., and E. Y. Chew. 2005. The role of omega-3
long-chain polyunsaturated fatty acids in health and disease
of the retina. Prog. Retin. Eye Res. 24:87–138.
Sasaki, S., T. Ota, and T. Takagi. 1989. Composition of fatty
acids in the lipids of masu salmon and pink salmon and
latter canned flesh. Nippon Suisan Gakkaishi 55:1655–1660.
Sathivel, S. 2005. Thermal and flow properties of oils from
salmon heads. J. Am. Oil Chem. Soc. 82:147–152.
Sathivel, S., S. Smiley, and W. Prinyawiwatkul, and P. J.
Bechtel. 2005. Functional and nutritional properties of red
salmon (Onchurynchus nerka) enzymatic hydrolysates. J.
Food Sci. 70:C401–C406.
Shim, S. M., L. E. Dorworth, J. A. Lasrado, and C. R. Santerre.
2004. Mercury and fatty acids in canned tuna, salmon, and
mackerel. J. Food Sci. 69:C681–C684.
Shostrom, O. E., R. W. Clough, and E. D. Clark. 1924. A
chemical study of canned salmon. Ind. Eng. Chem. 16:283–
289.
Simopoulos, A. P. 1991. Omega-3 fatty acids in health and
disease and in growth and development. Am. J. Clin. Nutr.
54:438–463.
Simopoulos, A. P. 2008. The importance of the omega-6/
omega-3 fatty aid ratio in cardiovascular diseases and other
chronic diseases. Exp. Biol. Med. 233:674–688.
Simopoulos, A. P., A. Leaf, and N. Salem Jr. 1999. Essentiality
of and recommended intakes for omega-6 and omega-3
fatty acids. Ann. Nutr. Metab. 43:127–130.
Smiley, S., N. Demir, A. C. M. Oliveira, and P. J. Bechtel.
2010. Characterization of dried heads from five Pacific
salmon species (Oncorhynchus spp.), dried at different
temperatures. Pp. 55–66 in P. J. Bechtel and S. Smiley,
eds. A sustainable future: fish processing byproducts.
University of Alaska Fairbanks, Fairbanks, AK, Alaska Sea
Grant.
Tripathy, D., P. Mohanty, S. Dhindsa, T. Syed, H. Ghanim, A.
Aljada, et al. 2003. Elevation of free fatty acids induces
inflammation and impairs vascular reactivity in healthy
subjects. Diabetes 52:2882–2887.
United States Food and Drug Administration. 2010.
Requirement for specific standardized fish and shellfish.
Canned Pacific salmon. 21CFR161.170. Available at http://
www.accessdata.fda.gov/scripts/cdrh/cfdocs/cfcfr/CFRSearch.
cfm. Accessed 13 July 2010.
United States Department of Agriculture (USDA). 2012.
National nutrient database for standard reference release 24.
Nutrient data for 15084, fish, salmon, pink, canned, total
can contents. Available at http://ndb.nal.usda.gov/ndb/foods/
show/4527. Accessed 10 October 2012.
Vanderstoep, J., S. Weintraub, and K. Barber. 1990.
Nutritional composition of British Columbia canned
salmon. Can. Inst. Food Sci. Technol. J. 23:121–124.
Wall, R., R. P. Ross, G. F. Fitzgerald, and C. Stanton. 2010.
Fatty acids from fish: the anti-inflammatory potential of
long-chain omega-3 fatty acids. Nutr. Rev. 68:
280–289.
26 ª 2012 The Authors. Food Science & Nutrition published by Wiley Periodicals, Inc.
Supplementing Canned Pink Salmon With Salmon Oil T. J. Lapis et al.
Related Documents