SUPPLEMENTING FAMILY INCOME Copies of this paper may be obtained from 77re Economic and Social Research Institute (Limited Company No. 18269). Registered Office." 4 Burlington Road, Dublin 4. Price IR£8.00 (Special rate for students IR£4.00)

Welcome message from author
This document is posted to help you gain knowledge. Please leave a comment to let me know what you think about it! Share it to your friends and learn new things together.
Transcript

SUPPLEMENTING FAMILY INCOME
Copies of this paper may be obtained from 77re Economic and Social Research Institute(Limited Company No. 18269). Registered Office." 4 Burlington Road, Dublin 4.
Price IR£8.00
(Special rate for students IR£4.00)

Tim Callan is a Senior Research Officer with The Economic and SocialResearch Institute. Ciar,’fn J. O’Neill is a former Research Assistant, andCathal O’Donoghue is currently a Research Assistant at the ESRI. Thispaper has been accepted for publication by the Institute, which is notresponsible for either the content or the views expressed therein.
ii

SUPPLEMENTING FAMILY INCOME
Tim Callan, Ciar~in J. O’Neill and Cathai O’Donoghue
© THE ECONOMIC AND SOCIAL RESEARCH INSTITUTEDUBLIN, 1995
ISBN 0 7070 01560
iii

Acknowledgements
The authors would like to thank those who read earlier drafts of thispaper. Particular thanks are due to the Director of the Institute, KieranKennedy, and to our colleagues Patrick Honohan, Brian Nolan, PhilipO’Connell, Barry Merriman, Richard O’Leary and Colin O’Reardon fortheir comments.
We are grateful to the Department of Social Welfare for supporting theresearch on which this study is based, and for helpful comments. The paperdraws extensively on the ESRI Survey of Income Distribution, Poverty andUsage of State Services: thanks are also due to those involved in the designand conduct of that survey.
We would also like to thank Pat Hopkins and Mary McEIhone for theirusual sterling efforts in copying and preparation of the manuscript forpublication respectively.
Responsibility for the content of the study rests wholly with theauthors.
iv
Chapter
I
2
3
4
5
AcknowledgementsGeneral Summary
CONTENTS
INTRODUCTION
FAMILY INCOME SUPPLEMENT:GENESIS AND STRUCTURE
FAMILY INCOME SUPPLEMENT:ELIGIBILITY AND TAKE-UP
POLICY OPTIONS: IN-WORK BENEFITS
CONCLUSIONS
Bibliography
Pageivix
19
37
59
70

Table
2.1
2.2
2.3
2.4
3.1
3.2
3.3
4. l
4.2
4.3
4.4
LIST OF TABLES
Page
Hypothetical Replacement Rates at 2/3 of the AverageIndustrial Wage, 1983 6
Changes to FIS, 1986- 1994 9
Numbers Receiving FIS and Average Payment,1985-1993 10
Hypothetical Replacement Ratios Before and After FISfor Married Couples, 1994/95 11
Survey-based Estimates of the FIS Population, 1987 22
Estimated Take-up Rates for Family IncomeSupplement, 1987 23
Estimated Take-up Rates for Family IncomeSupplement, 1987 and 1994 28
Gross and Dispbsable Incomes of FIS Recipient: CurrentStructure 39
Gross and Disposable Incomes of FIS Recipient: AfterTax Income Structure 42
Alternative Estimates of Cost of Moving to Assessmentof FIS on a Net Income Basis 45
Distribution of Changes in FIS Entitlements: Net Incomevs Gross Income as a Basis of Assessment 47
vi

Figure
2.1
2.2
4.1
5.1
LIST OF FIGURES
Page
Gross Earnings and Disposable Income, 1986 and 1994 14
Gross Earnings and Marginal Tax Rates, 1986 and 1994 14
Disposable-from-Gross Income Schedules for AlternativeFIS Schemes: Current Structure and Net Earnings Basis 43
Gain or Loss in Disposable Income from EmploymentEarnings: 1994 Structure and Child Benefit Supplement 64
vii

GENERAL SUMMARY
Context of the StudyState support for the incomes of families with children aims to achieve
a balance between sometimes competing objectives. These include:poverty alleviation through the provision of income support tolow-income households with children; sharing of the costs of childrenacross the community and across the life-cycle - through the provision of auniversal child benefit to all families with dependent children; and themaintenance of work incentives - by ensuring that families with childrenwill gain from employment and from increased earnings.
Almost nine-tenths of expenditure on the current system is accountedfor by Child Dependant Additions (CDAs) - typically just over £13 perchild per week - for social welfare recipients; and Child Benefit - averagingabout £5 per child per week - paid to all families with children. But a keyrole in maintaining work incentives has been given to two smaller elementsof the child income support system: the Family Income Supplement,introduced in 1984, and the system of child additions to income taxexemption limits, introduced in 1988. The Family Income Supplementpays a benefit to full-time employees (over 20 hours per week), with grossincomes below a limit depending on the number of children. The amountof the benefit is a proportion of the gap between actual income and therelevant income limit. For example, an individual or couple with 4children, and earnings of £ 150 per week, could receive a payment of £ 14.25per child per week in FIS. Child additions to the income tax exemptionlimits have a somewhat lower value of under £5 per child per week.
How effective are these supports in maintaining work incentives?What are the problems arising from their operation and their interaction?Could these problems be overcome by incremental changes? And howwould such incremental improvements compare with the gains sought froma more radical restructuring of the child income support system? Thisstudy aims to shed light on these questions.
ix
SUPPLEMENTING FAMILY INCOME
Family Income SupplementPayments under most social welfare schemes, including
Unemployment Benefit and Unemployment Assistance, take account of thenumber of people depending on the beneficiary. Wages do not, in general,take account of the number of people depending on the wage-earner. Thismeans that the gap between incomes in-work and out-of-work tends to benarrower the greater the number ofdependants. The "unemployment trap",whereby a family may be financially "better off on the dole" is an extremecase of this.
The primary aim of the Family Income Supplement has been to ensurethat incomes in work are significantly higher than incomes out of work forlow income families supported by an employee. To qualify for a payment,an individual or couple must be employed for at least 20 hours per week,have at least one dependent child, and have a gross income below a limitdepending on family size. The amount of the payment is now 60 per centof the gap between actual income and the relevant income limit. Forexample, a 4-child family with earnings of £150 per week would receive£57 per week in Family Income Supplement.
This structure has had some success, at a modest budgetary cost, inensuring that employment, even at low earnings, carries a financial rewardfor families. Thus, it helps to combat what is often called the"unemployment trap". But the interaction of FIS and the income tax systemhas contributed to the creation of what is often termed a "poverty trap",whereby an increase in gross earnings can leave a family worse off in termsof disposable income. An extra £10 per week in earnings can lead to areduction in FIS of £6 per week, and an increase in tax and PRS1 of over£4 per week, leaving the family worse off. Over time, improvements in theincome support offered to low in’come families by F1S and by theintroduction of child additions to the income tax exemption limits havehelped to combat the "unemployment trap" but have tended to expand the"poverty trap". While the most severe form of "poverty trap" - a marginaltax-cum-benefit withdrawal rate of 100 per cent or more - may not affectvery many families, there is a strong case that the maximum rate facing allfamilies should be much lower than 100 per cent.
Take-up of Family Income SupplernentOne of the main problems with Family income Supplement in Ireland,
and with similar schemes in other countries, is that it may not reach itsintended recipients. The extent to which it does reach the target populationis measured by the rate of "take-up": the proportion of those eligible for a

GENERAL SUMMARY xi
payment who actually receive it. Estimates of take-up based on the ESRI’s1987 Survey suggest that take-up was, at that time, very low. More limitedestimates of take-up were developed using the ESRI’s tax-benefit model totake account of changes in policies, incomes and population characteristicsbetween 1987 and 1994. These estimates are subject to considerableuncertainty. They suggest some increase in take-up over the period, butthat low take-up remains a substantial problem. It seems likely that nomore than half of potential expenditure on FIS is actually claimed andreceived by its intended recipients.
The reasons underlying low rates of take-up for in-work benefits aremany and complex, as research in other countries has shown. But lowtake-up certainly reduces the effectiveness of F1S in improving theincentives facing those currently unemployed to move into employment.US evidence suggests that a high rate of take-up - over 80 per cent - isachieved for a somewhat similar scheme which operates through the taxsystem. While there are considerable differences in the nature of taxadministration in Ireland, this does suggest that the possibility of effectinga FIS-type payment through the tax system should be investigated.
Policy OptionsThere is a widespread consensus that the current system of child
income support is in need of reform. Views differ, however, as to the extentof the changes needed and the broad shape which a reformed system mighttake. Options analysed in this study, and an earlier, related study (Callan,O’Donoghue and O’Neill, 1994) offer a menu ranging from incrementalreforms at low budgetary cost to radical, and sometimes quite costly,reforms.
If the FIS structure is to be retained, a substantial increase in thetake-up rate should be a priority for policy. In our view, this is most likelyto be achieved by making use of the tax system to identify, and if possibleto pay, potential beneficiaries. An incremental reform of the FIS structure,making the payment dependent on income after, rather than before, tax andPRSI deductions would help to eliminate the most severe forms of"povertytrap" found in the current structure. Families would face marginaltax-cum-benefit withdrawal rates of no more than 75 to 80 per cent at most.The cost of a F1S reform package along these lines could range from £20mto £50m per year, depending on the degree of success in increasing take-up.

xii SUPPLEMENTING FAMILY INCOME
A more substantial restructuring was suggested by the incominggovernment in December 1994. It centres around a Child BenefitSupplement "payable to all social welfare recipients and to low and middleincome families", and replacing FIS and Child Dependant Additions. Ourpreliminary investigation identified some of the key decisions which wouldhave to be made in designing such a Supplement, building on the earlieranalysis of FIS. Our assessment indicates some of the advantages anddisadvantages of a Child Benefit Supplement, based on a payment of about£13 per week, withdrawn gradually over incomes ranging from £9,000 to£20,000 for most families. These can be compared with the pros and consof other restructured schemes: a "basic income for children" - involving aChild Benefit of about £80 per child per month - and an "integrated childbenefit" - a similar scheme, but with the increased child benefit being liablefor tax. In our view, both an "integrated child benefit" and a Child BenefitSupplement offer scope for significant improvements over the currentsystem. The balance of advantages between these two broad approachesdepends not only on the weight attached to different objectives, but on thedetails of implementation, which deserve further investigation.

Chapter I
INTRODUCTION
1.1 Context of the StudyThe position of families depending on low-paid employment has been
a focus of concern lot income maintenance policy for some time. In recentyears, the phenomena known as the "poverty trap" (whereby an increase ingross eanaings can leave a family worse off in ternls of disposable income)and the "unemployment trap" (whereby a family may be worse off infinancial terms when a member is in employment rather than unemployed)have attracted particular attention. Employees with low earnings relativeto their family size - or unemployed persons with dependants and lowpotential earnings - are those most seriously affected by these disincentives,which arise from the complex interplay of tax and welfare policies,particularly as they relate to state-provided child income support.
The current system of child income support can be seen as attemptingto balance concerns about work incentives for low income families with anumber of other objectives. Nolan (1993b) identifies four objectives withwhich child income support may be concerned: poverty alleviation; asharing of the costs of child rearing across the lifecycle and across thecommunity; maintenance of adequate incentives to work at low incomelevels; and the provision of some independent income to mothers workingin the home. Child income support uses a combination of four instrumentsto strike a balance between these sometimes conflicting objectives, and theoverall budgetary cost of child income support:
1. Child benefit is a universal payment, made in respect of alldependent children at a rate of £20 per month for each of thefirst two children, and £25 for the third and subsequentchildren;
2. Child dependant additions (CDAs) are paid to those relyingon the various social welfare schemes, such as UnemploymentBenefit and Unemployment Assistance, at a rate of £13.20 perweek for each dependent child (a higher rate is paid to widowsand other lone parents);
3. Child additions to income taa" exemption limits (CAITELs)help to reduce or eliminate tax liabilities for those on lowincomes. The general income tax exemption limit is raised by
SUPPLEMENTING FAMILY INCOME
£450 for each of the first two children, and by £650 for eachsubsequent child: these additions have a maximum value ofabout £5 per week per child;
4. Family Income Supplement (FIS) pays a benefit to thoseemployed for over 20 hours per week, and With gross incomesbelow a limit depending on the number of children. Theamount paid depends on the gap between income and therelevant income limit: higher amounts are paid to those withmore children and with lower earnings. For example,someone with 4 children, earning £ 150 per week could receiveabout £14.25 per child per week in FIS.
Total expenditure (including income tax foregone) under theseheadings was almost £600m in 1994. Over nine-tenths of this expenditurewas accounted for by Child Benefit and CDAs. Roughly equal anaountswere spent on each of these schemes~: Child Benefit was paid for over onemillion children, and CDAs for about half that number, but the much higherrate of payment for CDAs brings total expenditure on the two schemes intoapproximate balance. The cost of the child additions to income taxexemption limits and of FIS was about £20m each in 1994. Despite thislow share of aggregate expenditure on child income support, FIS and childadditions to exemption limits play a key role in providing income supportand a financial incentive to work for a specific target group: families withlow earnings relative to their size.
The development of the child income support system to its currentstate, and the continuing debate about the overall structure of the systemhas been well documented (NESC, 1979, 1990; McCashin, 1988 andCarroll, 1994). NESC’s most recent detailed appraisal (NESC, 1990)2
concludes that the consolidation of all existing child income supports intoa single, taxable child benefit remains a benchmark against whichincremental changes in the system should be evaluated. Such a reform wasproposed by the National Planning Board, and endorsed by the governmentin 1984, stating that:
A new Child Benefit scheme will be introduced, which will unifyin a single payment State support towards the cost of rearingchildren. Selectivity in favour of the less well-off will be achieved
~Recent estimates suggest expenditure of £267m on Child Benefit and £28fim on CDAs.
2NESC (1993) concludes that the recommendations made on this issue in 1990 are still appropriate:this includes a diminution in the scope of CDAs. and an enhanced role for Child Benefit.

INTRODUCTION 3
mainly by treating the new monthly child benefits as assessableincome for tax purposes. The restructured scheme will becarefully designed to channel available resources to those most inneed and to provide an independent income for mothers whosework is in the home. It will also help to improve the incentive towork by being more neutral than the existing system as betweensituations in which a head of family is in employment or out ofwork (heland, 1984).
In the event, these formally stated intentions were not fully implemented,and the system evolved in a more complex fashion. FIS, a highly targetedincome support was introduced in 1984. Child tax allowances3 wereabolished in 1986, while the universal payment (renamed child benefit) wasincreased: this change was in line with the intentions stated in 1984. Childadditions to the income tax exemption limits were introduced in 1988,providing further targeted income support to low income earners. CDAshave remained a very important part of the structure, with different ratesacross schemes gradually being aligned, and the overall level remaininghigh relative to the universal child benefit payment.
This integrated (taxable) child benefit proposal, and a similar radicalproposal for a single non-taxable "basic income for children" were thesubject of a recent report (Callan, O’Donoghue and O’Neill, 1994). Arecurring theme in the debate on these issues is that such proposals for "rootand branch" reform of the system of child income support are costly, andthat a more targeted approach to the suppfementation of family income maybe preferable. Opinions on this issue will undoubtedly vary according tothe weight placed on different objectives - such as poverty alleviation, workincentives and the share which society should take in the costs of rearingchildren. But information on the experience to date with such targetedschemes, and on the scope for improvements in targeted schemes is clearlyessential for strategic choices on this issue.
It is this information which the present study seeks to provide. Itreviews the structure and scope of the Family Income Supplement, notingits interaction with the income tax system; examines the difficulties whichthe scheme has had in reaching its target population; and considers somechanges to the structure which could help to improve the trade-off between
JChild tax allowances should be distinguished from child additions to income tax exemption limits.Child tax nllowances reduce the liabilities of all taxpayers with children, and benefit top ratetaxpayers most: child additions to income tax exemption benefits those with incomes just above thecurrenl exemption limits, with 11o gain accruing to those on the highest incomes.

SUPPLEME~NVrING FAMILY INCOME
the level of support at low incomes, marginal tax-cure-benefit withdrawalrates for recipients, and the budgetary cost of the scheme. The final chapterdraws on these findings to reconsider some of the broader strategic issuesin restructuring child income support. The strategy indicated in AGovernment of Renewal (the policy agreement which led to the formationof a new government in December 1994) includes a proposal for a ChildBenefit Supplement, replacing FIS and CDAs, which would be paid to allsocial welfare recipients and to low and middle income earners. Theconcluding chapter also builds on earlier analysis to elucidate the trade-offsinvolved in such a strategy.
1.2 Stnlcture of the ReportChapter 2 describes the background to the introduction of the Family
Income Supplement scheme, and the objectives it was designed to achieve.It also shows how the structure of the scheme itself, and its interaction withthe income tax system, have changed over time. Chapter 3 reviews theevidence on take-up of FIS at the time of the ESRI’s Survey of IncomeDistribution, Poverty and Usage of State Services in 1987. The manychanges in the scheme since that date have led to significant increases inthe numbers claiming the benefit, and in expenditure on the scheme. Butthe effects of the changes on take-up are not clear, because the numberseligible, and the amount of their entitlement, may have grown equally ormore rapidly. This issue is assessed with the help of estimates from theESRI tax-benefit model. Some options for the improvement of take-up arealso considered.
Chapter 4 deals with analyses of possible changes to the currentstructure and scope of the Family Income Supplement. It compares theoptions of basing FIS assessments on net income after tax and PRSIdeductions with a change to a UK-style Family Credit scheme; and alsodiscusses the alternative structure provided by the US-style Earned IncomeTax Credit. Each of these options would remove the extreme "povertytrap" phenomenon inherent in the current interaction between FIS and theincome tax system. Reforms of the FIS structure involving a net incomebasis of assessment are analysed by simulating entitlements using the ESRImodel. The cost and other implications of the changes are clarified in thisway. The final chapter summarises the main conclusions and sets them inthe context of the broader debate on restructuring of child income support.Particular attention is given to the proposal in A Government of Renewalfor a Child Benefit Supplement, replacing FIS and CDAs, which would bepaid to all social welfare recipients and to low and middle income earners.

Chapter 2
FAMILY INCOME SUPPLEMENT:GENESIS AND STRUCTURE
2.1 IntroductionIn this chapter, we look back at the origins of the Family Income
Supplement, and the objectives which it was intended to serve. The basicstructure of the scheme is set out, and the major changes made since itsinception are noted. The interaction between FIS and the income taxsystem in determining disposable incomes at various gross income levelsis addressed. The implications of recent changes in the strncture of FIS andthe structure of the income tax system are also explored.
2.2 Genesis of FISDuring the 1970s and early 1980s, unemployment rose sharply in
Ireland, as in many other OECD countries. Macroeconomic shocks, suchas the two oil price hikes, and the associated international recessions,obviously played a major role in this rise. But in Ireland, as elsewhere,increasing attention was also given to the possible role of microeconomicfactors in explaining the rise in unemployment. One factor which receivedparticular attention was the potential disincentive effect of unemploymentcompensation payments which were high relative to potential earnings.~ Anextreme form of this phenomenon is often labelled an "unemployment trap"- a situation in which a person is financially better off unemployed andreceiving social welfare benefits rather than working. At a more generallevel, situations in which incomes when unemployed formed a highproportion of potential net income in employment (a high "replacementrate") were seen as potentially damaging the incentive to work for suchindividuals.
A number of developments in the Irish income tax and social welfaresystems in the 1970s and early 1980s tended to reduce the disposableincome achieveable at low earnings relative to the income available fromunemployment compensation. Income tax allowances were not indexed inline with inflation, and rates of tax also increased. RevenueCommissioners’ statistics show a rise in the "average effective rate of
ISee, for example. Blackwell (1985).
5

6 SUPPLEMENTING FAMILY INCOME
income tax" from 21.5 per cent in 1976/77 to 25.2 per cent in 1983184.These developments put downward pressure on in-work incomes, at a timewhen there were significant increases in the amounts payable inUnemployment Benefit, including an element of pay-~’elated benefit from1974 on.
Table 2.1 : H3Tothetical Replacement Rates at 2/3 of the Average Industrial Wage,1983
Marital/family statas
Unemployment Shtgle Married, Married, Married,compensation no children 2 chiMren 4 chiMren
Replacement rate (per cent)
UB plus maximum PRB 76 89* 109" 124"
Flat-rate U B 47 65 86 102
Long-term UA 39 57 76 90
Notes: Calculations are based on weekly cash benefits; secondary benefits, possible
income tax refunds, and non-cash benefits are not taken into account.*Restriction of pay-related benefit under the "wage-stop" rule could have limitedratios marked with an asterisk to 85 per cent of net earnings in employment.
The potential impact of these developments is illustrated bycalculations of hypothetical replacement rates for 1983, the year before FISwas introduced. (Table 2.1). These show disposable income whenunemployed, and receiving alternative forms of unemploymentcompensation, as a proportion of disposable income when employed. Theexamples chosen involve single individuals or single-earner marriedcouples, taxed under PAYE and paying employee PRS1 contributions at thestandard rate. It is assumed that when unemployed, the individual or familyreceives Unemployment Benefit and the maximum Pay-Related Benefit(row 1); the maxinaum flat-rate Unemployment Benefit (row 2); or themaximum long-run Unemployment Assistance (row 3). Secondary benefits(such as fuel allowances and Christmas bonus) and income-relatednon-cash.benefits (such as the value of a medical card or reduced rentsunder the local authority differential rent scheme) are not taken into
FIS: GENESIS AND STRUCTURE
account. It is assumed in all cases that in-work income is at two-thirds ofthe average industrial wage: this is because the replacement rate issue is ofparticul,’u" concern at low wages, and the avera~ge potential wage of theunemployed is below that of other individuals." At higher wage levels,replacement rates are, of course, lower. But a sit’nilar 15attern ofreplacement rates across marital and family status is found at higher wagelevels.
For each type of unemployment compensation, replacement rates arehigher for one-earner married couples than for single people; and rise withthe number of children in the family. This reflects the fact thatunemployment compensation includes elements of income support foradult dependants (the "adult dependant addition" or ADA), and childdependants ("cbild dependant additions" or CDAs). Wage rates do not, ingeneral, take account of the number of people depending on the earner.This means that the gap between in-work and out-of-work income tends tobe narrower for those with an adult dependant, and narrower still for thosewith large numbers of children.
It was against this background that the Family Income Supplementscheme was introduced in 1984.3 It was designed to improve the positionof low income families supported by an employee. Official statements atthe time emphasised the need to combat labour market rigidities byimproving the position of working families on low pay relative to what theywould receive on social welfare. "The main objective of the scheme is tomaintain the incentive to work by providing cash support for workers withfamilies who are on low incomes and as a result, are only marginally betteroff working than if they were claiming Social Welfare benefits",(Comprehensive Public Expenditure Programmes, 1984, p.291).
’Nohln (1987) reports that average pre-unemptoyment wages in O’Mahony’s (1983)sample were 72 per cent of the average industrial wage; and Callan, O’Donoghue andO’Neill find that the average predicted wage rate for those currently unemployed, on theb:~sis of their education, experience and other characteristics, was aboul two-thirds of the
average hourly wage rate in industry.
:’The introduction of a FIS-type scheme was considered in a repon to NESC (NESC, 1979)
as a means of tackling poverty among the in-work poptdation. The Cotmcil hoped that achild benefit scheme might reduce or eliminate the need for a FIS-type scheme, butaccepted that if this were not practicable a FIS-type scheme should be considered.

8 SUPPLEMENTING FAMILY INCOME
The evolution of replacement rates over the period since theintroduction of FIS has been subject to many conflicting influences.Pay-related benefit (PRB) was one of the main factors contributing to highreplacement rates in the early 1980s. The reduction of rates of PRB overtime, and its eventual elimination for recipients of Unemployment Benefitin the 1994 Budget, have therefore been a factor tending to reduce thesehigh replacement rates over time. On the other hand, special increases inthe rates of payment for Long-Term Unemployment Assistance have beena factor tending to increase replacement rates for groups dependent on thisscheme. The development of FIS, and the introduction of child additionsto the income tax exemption limits, have been part of the policy packageaimed at improving the balance between incomes in work and out of work.An indication of the role of FIS within the current policy package is givenin Section 2.4 below, which shows the impact of FIS on replacement ratesfacing those with low earnings relative to family size.
2.3 Structure of FISThe structure of FIS is as follows. To be eligible to receive the benefit,
a claimant must be working a certain minimum number of hours per weekand must also have at least one child dependant. Until 1989 a claimant hadto work this minimum number of hours himself or herself but since then, ithas been possible to combine the hours worked by both spouses/partners toreach the minimum. The definition of dependent children for FIS is personsaged under 18 (or between 18 and 21 if in full-time education) whonormally reside with the claimant.
Once eligibility has been established, FIS payments are then calculatedas a percentage of the shortfall between the family’s gross income (fromany source, though some items such as child benefit and investment incomeare excluded) and fixed income limits for each family size. Until 1991,there was a further provision that payments could not exceed a specifiedmaximum amount for each family size. The income limits are designed toensure that the benefits are restricted to employees with low pay relative totheir family size. The percentage rate applied to the shortfall has a dual role.On the one hand, it acts as a multiplier providing income support to the lowpaid by closing a portion of the gap between gross income and a "target"income (the income limit). On the other hand, it also acts as a withdrawalrate which serves to gradually withdraw the benefit as gross income getscloser to the income limit. In effect, it is a tax rate since, for every extra £1

FIS: GENESIS AND STRUCTURE
of gross earned income, a portion of benefit (specifically the increase ingross income, in this case £1, multiplied by the withdrawal rate) iswithdrawn.
FIS has changed quite substantially since its introduction. The mainchanges are set out in Table 2.2 below. These include substantial increasesin the weekly income limits, a reduction in the required minimum hours ofwork and an increase in the FIS multiplier/withdrawal rate. However, withthe exception of the removal of the maximum payment condition in 1991and the introduction of a minimum guaranteed payment of £5 in the sameyear, the basic structure of FIS, as described above, has remained intact.
Table 2.2: Changes to FIS. 1986-1994
Income Limits 1986 1987 1988 1989 1990 1991 1992 1993 1994£ p w
Family with
I child 100 104 108 112 118 140 155 175 185
2 children 120 126 131 136 143 160 175 195 205
3 children 140 148 154 160 168 180 195 215 225
4 children 160 170 177 184 193 200 215 235 245
5 children 180 192 200 208 218 225 240 260 270
6 children 180 192 200 218 229 242 260 280 290
7 children 180 192 200 228 240 259 277 297 307
8 children 180 192 200 238 251 276 294 314 324
Maximum payment-I child 10 16 NO LIMIT-4 children 22 37 NO LIMIT
Minimum Hours 30 24 24 24 20 20 20 20 20
Multiplier/Withdrawal rate 33% 50°0 50% 60% 60% 60% 60% 60% 60%
MinimumPayment, £s 0 0 0 0 0 5 5 5 5
Source: Social Welfare Rates Booklets, 1986-1994.

10 SUPPLEMENVFING FAMILY INCOME
Income limits have been raised by about 65 per cent, on average, forthe period 1986 to 1993, substantially more than the rate of inflation.4 Thishas had the effect of extending the scope of the scheme to higher realincome levels. This, coupled with the relaxation of the minimum hoursrequirement, has tended to increase the numbers eligible for FIS payments.At the same tirne, the removal of the maximum payment limits and theincrease in the multiplier/withdrawal rate, together with the increase in theincome limits, has served to make FIS payments increasingly generousover the period concerned. There have, indeed, been increases in both thenumber of recipients and the average payment per family over the period,shown in Table 2.3 below. The average weekly payment per family almosttrebled between 1986 and 1993, while the number of recipient familiesalmost doubled during the same period.
Table 2.3: Numbers Receiving FIS and Average Payment, 1985-1993
1985 1986 1987 1988 1989 1990 1991 1992 1993
Number ofFamilies 4,664 4.979 5,532 5,159 6,066 6,569 7,157 7,735 9,605
EaT~enditure,(£ O00s) 2.211 3,020 4,373 5,022 6.323 8,745 10.370 12,631 16,438
Average WeeklyPayment PerFamilyI (£) 9.1 11.7 15.2 18.7 20.0 25.6 27.3 31.4 32.9
Source: Statistical Information on Social Welfare Services, 1985 to 1992
Notes: I. Calculated as total expenditure divided by number of families
Two other interesting points arise from these recent changes to FIS.First, given the possible increase in the eligible population as a result of theincrease in income limits and the relaxation of the minimum hoursrequirement, it is unclear whether the substantial increase in the number ofrecipients represents an increased, decreased or unchanged rate of take-up
"~l’he highest increases were for those with small or large numbers of children (about 80
per cent for those with I child or with 8 children), with the lowest increases (about 50 percent) for those with 4 or 5 children.

[:IS: GENESIS AND STRUCTURE I1
for FIS on a case-load basis. Second, given the increase in FIS entitlements,the nature of the change in the take-up of FIS on an expenditure basis, isequally unclear. These points are taken up again in the next chapter.
2.4 The hnpact of FIS on hicentivesAt the outset of this chapter, the concept of an unemployment trap (the
situation where, given the interaction between the tax and benefit systems,there is little financial incentive for the unemployed to take up paidemployment) was discussed. It was noted that this was an importantjustification for a scheme offering benefits to low-paid ernployees. Indeed,the development of FIS since its introduction clearly demonstrates that "thesupplement has been targeted at those facing the highest replacement rates]land, thus] it has concentrated on alleviating the unemployment trap",(Feeney, 1990, p.38). To illustrate this, some hypothetical replacementratios for families of various sizes and income levels in 1994 are set outbelow in Table 2.4. By showing the calculated ratios before and after FIS,we can get an idea of the effect which FIS has on the balance betweenincome in work and income when unemployed.
Table 2.4: Hypothetical Replacement Ratios Before and After I"IS, 1994/95
Replacement Ratios
Married Couple, 2 Children Married Couple, 4 Children
Gross Weekly Without FIS With FIS Without FIS With FISEarnhtgs
% % % %
£100 128 80 149 85
£125 105 76 123 81
£150 90 74 105 78
£175 82 74 92 75
£200 76 74 87 76
£225 71 71 81 77
£250 66 66 76 76
Note: The calculations of unemployment income are based on the rate of Long-TermUnemployment Assistance, which is identical with the Unemployment Benefitrate.

12 SUPPLEMENTING FAMILY INCOME
It is clear that FIS entitlements can reduce replacement ratios verysignificantly for families with children. The reduction is very substantial atthe lowest pay levels. But even for jobs at £150 per week, FIS reduces thereplacement rate by almost 30 percentage points for the 4-child family andby 16 percentage points for the smaller family. Microsimulation estimatesin Callan, O’Donoghue and O’Neill (1994, Table 6.4, p. 69) explore theimpact of FIS on the distribution of replacement rates facing theunemployed. They show that if F1S could reach all those eligible for thepayment, the proportion with replacement rates over 80 per cent would bejust over 4 per cent; but at a take-up rate of one-third, almost 10 per centof the unemployed would face a replacement rate of over 80 per cent.These calculations show that FIS has an important potential impact on thetarget group; but that the degree to which it reaches that target group -measured by the take-up rate - is of critical importance if that potential isto be realised.
Replacement rates are designed to summarise the incentivessurrounding decisions concerning employment and unemployment. Butthey do not capture all of the effects of FIS on work incentives. If a personis in employment, and in receipt of FIS, can he or she improve familyincome by working longer hours or earning higher wages? And what ofthe incentive facing a spouse to take up paid employment? The structureof FIS, particularly when it interacts with the income tax system, can havequite damaging effects on these work incentives. For families inemployment and in receipt of FIS, benefit withdrawal combined with taxescan make it difficult to increase the net disposable income of the family byincreasing the work hours or earnings of either partner.
The introduction of FIS exacerbated disincentive problems of this typesince the combination of the FIS withdrawal rate, the marginal relief rateof income tax and the rate of PRSI can mean that, over some incomeranges, effective marginal tax rates can exceed 100 per cent.5 The policy ofincreasing the FIS multiplier/withdrawal rate over time - with the primaryaim of increasing in-work incomes for FIS recipients at a modest budgetarycost - has improved the balance between in-work and out-of-work incomesfor the target group, but makes it more difficult for these same families toachieve higher disposable incomes through increases in earned income.The experience with F1S highlights the trade-off faced by policy in dealing
~Withdrawal of non-cash benefits, such as a medical card. or. for local atahority tenants,
increases in rent under the differential rent scheme, can also contribute to high effectivemarginal tax rates.

FIS: GENESIS AND STRUCTURE 13
with the two disincentive effects discussed here, commonly labelled the"unemployment trap" and the "poverty trap". On the one hand, increases inF1S income limits and in the FIS withdrawal rate, have improved theposition of families entering the labour market relative to the benefits theyreceived when out of work. On the other hand, the increases in themuhiplier/withdrawal rate have added to the disincentive facing thosealready in low paid employment.
2.5 Interactions between FIS and Income Taxes, 1986 and 1994Some calculations of the interaction of FIS and the income tax system
in 1986, the changes since then and the current situation are describedbelow with a view to looking at the problem of high marginal tax rates atlow family income levels. As with the replacement ratios presented above,care should be taken in interpreting data on the disincentives facinglow-paid families. The nature of the disincentives will depend on the exactspecification of disposable income (e.g., whether the purchasing powerequivalent of a medical card or housing subsidies in local authority rent hasbeen included) and "there is considerable scope for disagreement aboutinaportant aspects of the calculations involved" (NESC, 1990, p.213). Moregenerally, any specific calculatiou refers only to the unit (in this section, amarried couple with 4 children) for whom the calculations are made, andcare must be taken to see that conclusions drawn frorn such examples arenot misleading.
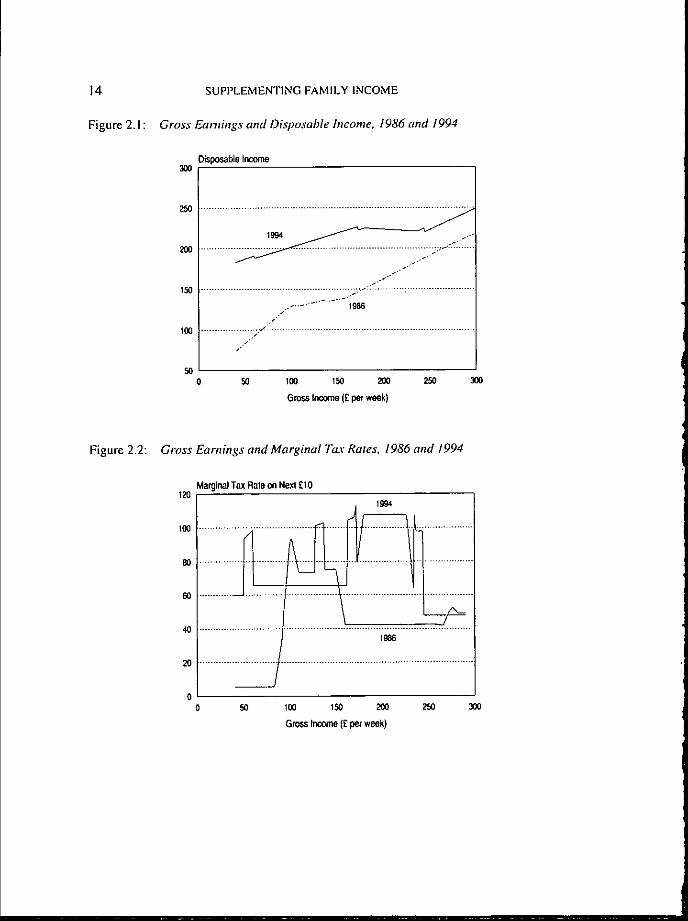
Figure 2.1 shows the relationship between gross and disposableincomes for a married couple with 4 children (one PAYE earner) in 1986and 1994. Disposable incomes are defined as gross incomes less taxes andPRSI plus FIS payments and child benefit. The imputed value of a medicalcard is not included but the fact that employees with medical cards do nothave to pay the Health and Employment and Training Levies is taken intoaccount.6 Figure 2.2 shows the effective marginal tax rates derived fromthis table. At every income level it shows the total amount taken in incometax, PRSI, levies and/or withdrawal of Family Income Supplement from a£10 increase in weekly earnings.
6Until 1994. liability for the Health Contribution and the Employment and Training Leviesfor employees who were medical card holders lay with the employer. The 1994 Budgetremoved this anomaly, as recommended by the Expert Working Group on Integration ofthe Income Tax and Social Welfare Systems. The Budget also provided a similarexemption for those earning less than £9.000 per annunl (£173 per week).
14
Figure 2. I :
SUPPLEMENTING FAMILY INCOME
Gross Earnings and Disposable Income, 1986 and 1994
Disposable Income3OO
250 ..............................................
~"~
i.,
..... - ......... 1986s-
,i
16O ..................... 1: .........................................................................../,
Ji*
50 100 150 200 250 300
Gross Income (£ per week)
Figure 2.2: Gross Earnings and Marginal Ta.r Rates, 1986 and 1994
Marginal Tax Rate on Nexl £10120
t6o
80
6O
4O
2O
0SO 100 15,0 2(X~ 25,0 36O
Gross Incune (£ per week)
FIS: GENESIS AND STRUCTURE 15
Over the period 1986 to 1994, a variety of welfare and tax measureswere aimed specifically at those in low paid employment. The changes onthe welfare side (i.e., in FIS) have been described above. From the pointof view of the effective marginal tax rates facing FIS recipients, a keyfeature was the rise in the FIS withdrawal rate to 60 per cent. On the incometax side, key changes included modest increases in personal allowances;more substantial increases in the general exemption limits; the introductionof child additions to the income tax exemption limits; a reduction in thestandard rate of income tax from 35 to 27 per cent; and a reduction in themarginal relief rate to 40 per cent, which led to a widening of the incomerange over which marginal relief applied. Two main changes were madeto the PRS1/levy rates for low income workers. All those with incomesbelow £9,000 per annum, equivalent to a weekly income of£173, are nowexempt from the Health Contribution and Employment and Training levy.In addition, those whose weekly earnings are below £60 are (since 1990)exempted completely from PRSI. Figures 2.1 and 2.2 show how thesechanges affected incomes and incentives for various positions on theincome scale: it should be remembered that average wages increased byabout 55 pet" cent over the period.
It is clear from Figure 2.1 that this combination of policy changes hasincreased disposable income at every level of earnings. The removal of themaxima on FIS payments is of particular importance for those at the lowestincomes; for those at low incomes, increases in the generosity of the FISscheme (higher income limits and a higher multiplier/benefit withdrawalrate) play the major role; and at somewhat higher income levels, reductionsin income tax rates, increases in income tax exemption limits, includingchild additions to those limits, also contribute to increased net incomes.
In 1986, the effective marginal tax rate over most of the income rangeillustrated (£40 to £300 per week) was less than 50 per cent. For incomesbetween about £100 per week and £160 per week, however, marginal taxrates were substantially higher: about 75 per cent over much of the range,when the stand~u’d rate of income tax (35 per cent) was combined withwithdrawal of FIS (a further 33 percentage points) and PRSI and levies(about 8 percentage points). An effective rate of over 100 per cent appliedover a narrow range of incomes, affected either by the combination of themarginal relief rate of income tax, FIS withdrawal and PRSI, or by thewithdrawal of a medical card. It is likely that the numbers in this groupwere quite small: some estimates of the numbers actually and potentiallyfacing these disincentives are presented later in this section.

16 SUPPLEMENTING FAMILY INCOME
In 1994, the income range over which the highest effective marginaltax rates apply is much wider, and is at a higher (nominal and real) incomelevel. Over much of the range between £163 per week and about £245 perweek, a £10 increase in income attracts an effective marginal tax rate ofover 100 per cent. For most Of this range, the key factors are the marginalrelief rate of income tax (40 per cent) combined with FIS withdrawal (60per cent) and PRSI (at least 5.5 per cent). At £ 173 per week, the exemptionlimit for the Health Contribution and Employment/Training Levy is passed.For earnings below that level, the employee does not contribute to theselevies; but for earnings above that level, the levy is payable on all earnings.When considering a £10 increase in pay which moves an employee abovethis limit, a loss of almost £4 per week in PRS1 has to be combined withFIS withdrawal of£6, so that the effective tax rate is close to 100 per cent.This disincentive problem is reinforced by a similar change in employers’
PRS1 at the £173 income level, which means that both eml~loyers andemployees face an incentive to keep earnings below that level.
The band of income over which highest marginal tax-cure-benefitwithdrawal rates (at or over 100 per cent) apply is now wider than in 1986,and the income range over which these rates apply has been shifted up theincome scale in real terms. It might be expected that this would increasethe numbers actually and potentially affected by such rates. The numberspotentially affected are those in the relevant income range who are entitledto FIS payments; the evidence in the next chapter on changes in the eligiblepopulation is relevant here. But the greatest concern may be for those whoactually face such disincentives to increased earnings.
Atkinson and Sutherland (1990) discuss the potential and problems ofadministrative statistics in measuring the size of such problems.Translating these concerns into the Irish context, two problems in particularmay be noted. First, the statistics on FIS recipients do not have fullinformation on the characteristics relevant to income tax liabilities; but anestimate of the tax position is needed in order to predict the tax-cure-benefitwithdrawal rate. Second, while it may be possible to estimate the marginaltax-cum-benefit withdrawal rate on an extra £1 of earnings using publishedstatistics, it will not be possible to say what the corresponding rate on an
7If the value of a medical card were taken into account the "spike" in the effective
marginal tax rate at this point would be even more dramatic, as the medical card incomelimit for a 4 child famil;( is about £175 per week. There is also a similar spike in theeffective marginal tax rate close to the £245 earnings level, at which the family loses itsentitlement to the minimum FIS payment of £5 per week.

FIS: GENESIS AND STRUCTURE 17
extra £20 of earnings would be. While recognising these problems, wehave attempted to establish limits on the numbers facing the highest taxrates (of 100 per cent or more) in 1986 and 1992 from published data onthe numbers of families receiving FIS payments at different levels,cross-classified by family size. This analysis assumes standard allowancesand exemption limits for married couples, and takes account of the extremedisincentives faced by the small number of lone parent FIS recipients. Itsuggests that fewer than 1,000 FIS recipient families could have faced ratesin excess of 100 per cent in 1986; and fewer than 3,000 families could havefaced such rates in 1992.
Changes between 1992 and 1994 may have increased these numberssignificantly. The reduction in the marginal relief rate from 48 per cent to40 per cent implied a substantial widening in the band of incomes overwhich marginal relief apl~lied. The "levy" exemption limit at £173 perweek introduced in 1994,° may also affect greater numbers, including notonly families with children but all individuals in particular regions of theearnings distribution, irrespective of marital and family status. But evenwith substantial increases, the numbers of families facing a poverty traprelated to FIS would be modest in absolute terms.
Do these relatively low numbers indicate that the FIS-related povertytrap phenomenon is unimportant? As pointed out by Dilnot and Webb "thefact that there are relatively few people in the poverty trap may in factimply tl~at high marginal tax rates are important and that individuals haveadjusted their labour supply accordingly" (Dilnot and Webb, 1988, p. 40).But what form would such adjustment take? Disposable income ismaxinaised by a gross income which is just below the income taxexemption limit; it is reduced by opting out of work, since FIS improvesthe incentive to take up a job. Again, the administrative statistics show noindication of substantial numbers altering their behaviour in this way.
There are, however, two broader reasons why the existence of such asevere poverty trap has, quite rightly, become a focus of concern, despitethe limited numbers directly affected. First, it must be regarded as unfairthat two almost identical families could end up with different disposableincomes, whereby the family with the greater earned income would have alower disposable income. Avoidance of this sort of "horizontal inequity"may be regarded as a constraint which policy ought to satisfy. Second, insome circumstances, the existence of the low income poverty trap may
SA similar exemption applied to the temporary income levy in 1993.

18 SUPPLEMENrrlNG FAMILY INCOME
make certain job offers financially unattractive relative to income fromunemployment benefits. While it may be the case that an individual couldachieve a higher disposable income if a lower wage or shorter hours couldbe agreed, it seems unlikely that such renegotiation of job offers iscommon. Thus, while there is in general a trade-off between policy effortsto tackle the two distinct incentive issues - the incentive to take up orremain in low paid employment, and the incentive to increase earnings inlow income employment - a policy change which eliminated effective taxrates of over 100 per cent could represent an improvement on both fronts.
2.6 ConclusionFIS was introduced in large part as a response to the existence of high
replacement rates for low-paid earners with children. Its primary aim,therefore, has been to ensure that incomes in work are significantly higherthan incomes out of work for such families. Changes in the scherne overtime, such as the increase in the multiplier/withdrawal rate and the removalof the maximum payment have strengthened its role in providing a floor toincomes in work, which is above the income available if unemployed. Partof the trade-off for increasing this floor, without substantial increases in thecost of the scheme, has been an increase in effective marginaltax-cum-benefit-withdrawal rates facing such families. High marginal taxrates on increased earnings, given the overall public finance constraint,may be seen as part of the price for a floor for in-work incomes which liessignificantly above the level of unemployment compensation. Buteffective marginal rates above 100 per cent, which arise because of theinteraction with the income tax system, are not desirable on any grounds.Changes in FIS and the income tax structure in recent years have tended towiden the band of income to which such rates apply, and shift it up theincome scale. The number of families actually affected by such rates is notvery large; nor do many families appear to have reacted to this incentivestructure by reducing their earnings. Thus, some of the concerns expressedabout the impact of the current policy structures may be misplaced.However, there is still cause for concern. The phenomenon may mean thatthe disposable income associated with certain job offers is financiallyunattractive. Perhaps more fundamentally, the horizontal inequity createdby the current system may simply be regarded as unacceptable. Changes inpolicy which could deal with these concerns will be examined in Chapter 4.

Chapter 3
FAMILY INCOME SUPPLEMENT."ELIGIBILITY AND TAKE- UP
3. I IntroductionIn this chapter we attempt to identify those eligible for FIS, so that we
can explore the characteristics of the relevant population, and estimate ratesof take-up. We begin by re-examining these questions in the context of theESRI’s 1987 Survey data, to establish a baseline estimate for the size ofthe relevant population, and a range within which take-up fell in 1987. Thisprocess involves a more detailed modelling of potential FIS entitlementthan the earlier work in Callan, Nolan et al. (1989), and an intensiveexamination of the cases which were found to be eligible for FIS.
As seen in the previous chapter there have been considerable changesin FIS since 1986/87. The amounts payable under the scheme have beenincreased by a number of factors, and a number of measures designed toincrease take-up have also been introduced. The numbers of claimants andthe amount of benefit claimed have grown substantially. But what hashappened to rates of take-up? In order to consider this question, we attemptin Section 3.3 to uprate the model and data to 1994 levels. This allows usto derive estimates of the size of the eligible population, and its FISentitlements, for 1994. When combined with administrative data on actualcaseload and expenditure on FIS, this can give some idea - though not aprecise estimate - of where the take-up rate now stands.
In Section 3.4 we turn to the causes of non-take-up. Because FIS isreceived by such a small proportion of the population, a general surveysuch as that conducted by the ESRI produces a very limited number ofcases in receipt. This means that detailed analysis of the characteristics ofthose taking up the benefit, as against those not taking up the benefit, is notpossible. The relevant sample size is also too limited for econometricanalysis of the causes of non-take-up. But it is possible to draw on studiesof non-take-up in other countries to shed some light on the issues involved.UK studies dealing with Family Income Supplement, and its replacement,Family Credit, are likely to be of particular relevance, and are given specialattention. Section 3.5 considers some options for the improvement oftake-up, and the main conclusions of the chapter are drawn together inSection 3.6.
19

20 SUPPLEMENTING FAMILY INCOME
3.2 Eligibility and Take-up of FIS in 1987Initial estimates of the population eligible for FIS, based on the ESRI
Survey, were set out in Callan, Nolan et al. (1989). It was estimated on thisbasis that approximately 20,000 families were eligible for FIS on the basisof their current incomes and family circumstances. Blackwell (1989)arrived at a similar estimate based on alternative sources, noting that theerror of estimate could be as much as plus or minus 5,000. These estimatessuggested very low rates of take-up. No more than one family out of everyfive families entitled to FIS appeared to receive it; and no more than £2out of every £5 of FIS entitlement appeared to be claimed. These take-uprates were considerably lower than take-up rates for FIS in the UK, whichhad themselves given rise to concern about the effectiveness of the scheme.
In this section we re-estimate the eligible population and rates oftake-up, using the ESRI Survey. The revised estimates share the problemof small sample numbers with the earlier estimates, but in some otherrespects they are of higher quality. First, they incorporate any revisions orcorrections to the data used earlier, following intensive checking of therelevant cases. Second, they pay close attention to the date at whichfamilies were interviewed: this has implications for both the FIS ruleswhich are applied in estimating entitlemenl~, and for the appropriate officialstatistics with which comparisons may be made. The estimates are still, ofcourse, dependent on the accuracy of the earnings data reported in thesurvey. The extensive validation checks reported in Callan (1991) suggestthat there is a high degree of concordance between the distribution oftaxable income in the survey and the distribution as recorded in theRevenue Commissioners’ statistical reports. There is a particularly closecorrespondence between survey-based figures and those of the RevenueCommissioners for the PAYE sector, which is of most relevance whenmodelling FIS.I
We begin by clarifying some of the concepts underlying the measuresof take-up actually implemented. First it should be noted that entitlementto FIS, once established, lasts for a period of one year. This means thatsome of those currently receiving FIS would not qualify if assessed on thebasis of current circumstances. Similarly, not all of those who could
tEvidence to the Tribunal of Inquiry into the Beef Processing Industry suggested that in certaincases, employee pay as reported to the Rt:venue Commissioners did not reflect full cashremuneration of the employee. Such practices could result in survey-based estimates tending tounder-estimate take-up rates; but some of Ihe survey-based estimates presented here are based onassumptions which are likely to have an offsetting tendency.

FIS: ELIGIBILITY AND TAKE-UP 21
potentially be receiving FIS at a given date would qualify on the basis oftheir circumstances at that date. This leads to two distinct concepts oftake-up, as pointed out by Atkinson (1984):
(I) Those currently receiving FIS as a proportion of all thosewho could have qualified during the past year;
(2) Those currently receiving FIS, whose claims would stillsucceed if re-evaluated at present, as a proportion of all thosewhose claims would succeed at present.
In practice, most surveys, including the ESRI’s 1987 Survey, can only beused to estimate take-up rates of the second type. They do not containenough infornlation on income changes during the previous 12 months tobe able to estimate the total pool of those who could be entitled to IriS.Thus, they must concentrate on eligibility at the date of interview.
Secondly, the difference between take-up rates calculated on the basisof "caseload" and "expenditure" should be clarified. The term "caseload"is used to refer to a take-up rate which is defined in terms of the number ofrecipient units and the number of eligible units, including eligiblenon-recipients. It does not take account of the size of the potentialpayment. An expenditure-based take-up rate, on the other hand, isconcerned with the amount of expenditure on the scheme, as a proportionof the expenditure if all eligible cases received their full entitlement.Several UK studies have found that small amounts of entitlement are lesslikely to be taken up. Other things being equal, this will lead to a higherrate of take-up on an expenditure basis than on a caseload basis - with theextent of the difference giving some indication of the strength of therelationship between size of entitlement and receipt of the benefit.
Thirdly, it should be noted that the ESRI Survey somewhatunderestimates the number of F1S recipients: the revised survey-basedestimates show 3, 156 families recorded as receiving FIS, as against a figureof 4,947 cases actually being paid in December 1986. The implicationsdepend on the nature of the underrepresentation. If the surveyunderrepresents both recipients and eligible non-recipients of FIS to asimilar extent, then the rate of take-up estimated from survey data alonemay well be quite accurate. If, instead, the survey underrepresents FISrecipients, but represents eligible non-recipients accurately, the take-up ratecalculated from the survey estimates will be too low. A correction usingadministrative data to measure the number of recipients, and survey data tomeasure the number of eligible non-recipients, is possible. Such a measurehas been used, for example, by the Department of Social Security in theUK. A third possibility is that FIS claimants are underrepresented in the
22 SUPPLEMENTING FAMILY INCOME
survey data, and eligible non-claimants are overrepresented. This mightarise, for example, if receipt of the benefit was not declared by a respondinghousehold, or was misclassified. Particular attention was given to therecording of FIS payments in the survey, so that this combination ofcircumstances does not seem especially plausible. Alternatively, the rateof non-response might be higher than average among recipients, but lowerthan average among eligible non-recipients. Again, this is not particularlyplausible: precisely the opposite is often argued, on the basis that awillingness to respond to surveys is positively correlated with a willingnessto fill in application forms such as that for FIS. Nevertheless, we includeestimates of take-up rates which allow for this possibility by usingadministrative data to measure the numbers of recipients, and survey datato estimate the numbers of all those eligible, both claimants andnon-claimants. Estimates on this basis may be thought of as an upperbound on take-up; and it will be of interest to see how close other estimatesmay be to this upper bound, since the upper botmd estimate is the only oneavailable to us when considering developments since 1987.
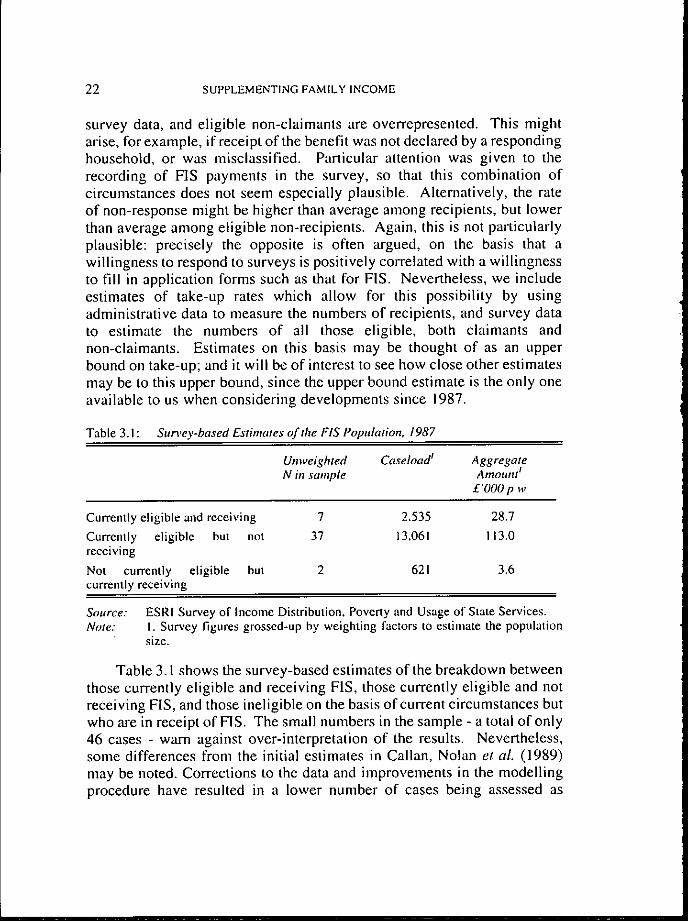
Table 3. I : Sura,ey-based Estimates of the FIS Population, 1987
Unweighted CaseloadI AggregateN in sample Amount#
£’000 p w
Currently eligible and receiving 7 2.535 28.7
Currently eligible but not 37 13,061 113.0receiving
Not currently eligible but 2 621 3.6currently receiving
Saurce:Note:
ESRI Survey of Income Distribution, Poverty and Usage of State Services.I. Survey figures grossed-up by weighting factors to estimate the population
size.
Table 3.1 shows the survey-based estimates of the breakdown betweenthose currently eligible and receiving F1S, those currently eligible and notreceiving FIS, and those ineligible on the basis of current circumstances butwho are in receipt of F1S. The small numbers in the sample - a total of only46 cases - warn against over-interpretation of the results. Nevertheless,some differences from the initial estimates in Callan, Nolan et al. (1989)may be noted. Corrections to the data and improvements in the modellingprocedure have resulted in a lower number of cases being assessed as

FIS: ELIGIBILITY AND TAKE-UP 23
eligible for FIS. A significant contributory factor is that almost 90 per centof the relevant cases were interviewed before mid-July 1987. Thus, themininlunl hours cut-off, and the rates of payment, are set at their 1986values in the vast majority of cases. We have seen that some take-up ratesrequire the use of administrative data on the number of cases in payment.The initial estimates of such rates were based on data for December 1987.But it is clear from the fact that the vast majority of the relevant cases wereassessed under 1986 rules that the administrative data for December 1986(when the 1986 rates and conditions were in force) are more appropriatethan data for December 1987 (when the 1987 rates had come intooperation). This makes relatively little difference to figures concerningcaseload (4,947 in 1986 as against 5,532 in 1987), but average weeklyexpenditure per case differed by about £6 in the two years, so it does havean impact on expenditure-based take-up rates.
Table 3.2: Estintated Take-up Rates for Family Income Supplement, 1987
Method Caseload AggregateE.t7)enditure
(A) Survey-based estimatet 16% 25%
(B) Administrative data for recipients", survey 23% 38%estimate for eligible non-recipients
(C) Administrative data for recipients", survey 25% 46%estimate for all those eligible
SOllFCe:
Notes:
ESRI Survey of Income Distribution. Poverty and Usage of State Services.
I. Based entirely on sample data.2. In using the administrative data, it is necessary to take account of the factthat some cases currently in payment would not qualify for FIS on the basis oftheir current circumstances. This is done by muhiplying the numbers officiallyrecorded as being in receipt by a sample estimate of the proportion of casescurrently in receipt who would qualify on the basis of current circumstances; asimilar adjustment is made by the DSS in their take-up estimates (see Craig.1991, p.541). About 80 per cent of cases in payment were found to becurrently qualified, accounting for 89 per cent of expenditure. Accordingly,these figures are used as adjustmeut factors to the administrative statistics.Given the very small number of cases in payment which are found in the ESRIsample, these adjustment factors are subject to a high degree of error. UKestimates suggest that a lower proportion of cases and expenditure wouldqualify for FIS on the basis of current circumstances; this leads to loweradjustment factors, which tend to reduce estimated take-up rates.

24 SUPPLEMENTING FAMILY INCOME
These counterbalancing influences are reflected in the estimatedtake-up rates presented in Table 3.2. The revised estimates of take-up ratesare between 16 and 25 per cent on a caseload basis, and between 25 and 46per cent on an expenditure basis. These ranges lie somewhat above thosein the initial analysis of Callan, Nolan et al. (1989), but the broad pictureof low take-up rates remains. At most about 1 family in 4 of those eligiblefor a payment receives FIS. The take-up rate on an expenditure basis ishigher, though a rate of over 40 per cent depends on some strongassumptions regarding the nature of non-response to the ESRI sample. Wehave seen earlier that approach (C) requires some non-recording of FIS bysurvey respondents, or a lower response rate for FIS recipients than eligiblenon-recipients, neither of which is judged to be very likely.
The higher rate of take-up on an expenditure basis suggests asignificant relationship between take-up and the amount of the entitlement.But low take-up is not confined to those with low entitlement. The take-uprate for cases with an entitlement of over £5 per week is estimated atbetween 27 and 39 per cent (using methods A to C). The averageunclaimed entitlement (including those with entitlements of less than £5per week) is estimated at about £6.50 per week.
Going behind these figures, what can be said about the characteristicsof the eligible population? Once again, the small sample size (44 casescurrently eligible) does not allow for detailed breakdowns. Somecharacteristics, however, do stand out. All but one of the eligible cases inthe ESRI sample are made up of married couples: this pattern is also foundin the administrative data on recipients, where upwards of 95 per cent ofcases are married. But there may, in fact, be a significant number ofeligible non-recipients who are lone parents. Administrative data on theLone Parent’s Allowance in 1991 showed a significant number who are noton the maximum rate of payment; for many of these, the reason may be thatthey are in employment. Given the structure of the means test for LoneParent’s Allowance, it seems likely that many of this group could also beentitled to FIS. Recent changes in the means test for Lone Parent’sAllowance eased the withdrawal of benefit from lone parents who took upemployment; one might expect, therefore, that the number of lone parentseligible for FIS could have increased further since 1991.
In the ESRI sample, in all but four of the families eligible, the husbandis an employee, while the wife is not engaged in paid work. Thus, thetypical eligible family in the sample consists of a male employee in asingle-earner family. About a quarter of the families have 1 or 2 children,half have 3 or 4, and the remainder have 5 or more. The composition of
FIS: ELIGIBILITY AND TAKE-UP 25
recipients in the official statistics is somewhat more skewed to higherfamily sizes, in line with the tendency for take-up to be greater for higherentitlements.
In the UK those eligible for FIS were often also eligible for housingbenefit. Part of the explanation for low take-up of FIS in thesecircumstances may have been that housing benefit provided an easier routeto achieving a similar disposable income level. Is it possible that in irishcircumstances some individuals classed as eligible for F1S but not in receiptof it are receiving other social welfare payments which leave them at leastas well off?. In particular, it might be thought that some individualsworking regularly for part of a week might find that part-weekunemployment compensation would pay them more than FIS.
This possibility was investigated from a number of differentperspectives. Unemployment benefit or assistance can continue to be paidwhile an individual is on systematic short-time for up to 3 days per week.In such circumstances, the combination of pay from employment andunemployment compensation could yield a higher disposable income thana combination of pay and FIS. But this does not contribute to anexplanation of low take-up of F1S. In many circumstances, an individualcombining part-week work with part-week unemployment compensationwould find themselves above the F1S thresholds; thus they would not bemeasured as being part of the eligible non-recipient population, orcontributing to a "problem" of non-take-up. If they did find themselvesbelow the FIS threshold, they would still appear to qualify for FIS, albeitfor a reduced payment: in such a case they would genuinely be part of theeligible non-recipient population. In the ESRI data we find little evidenceof this combination actually occurring: only 2 of the 44 families eligible forFIS are actually in receipt of any short-term social welfare payment, andtheir modelled entitlement to FIS is very small. Thus, overall, the receiptof other social welfare benefits does not contribute significantly to anexplanation of low take-up of FIS.
3.3 What Has Happened to Take-up?Since 1986/87, there have been considerable efforts to improve the rate
of take-up of FIS. An extensive information campaign was developed andcontinued to make those eligible aware of their potential entitlement; aminimum payment of £5 per week has been introduced; and the exclusionof FIS payments from medical cards means tests has been formalisednationwide. At the same time, there have been substantial changes in thescope of the FIS scheme, and the level of payments. The reduction in the
26 SUPPLEMENTING FAMILY INCOME
minimum number of hours of work required to qualify for FIS, togetherwith the over-indexation of the income limits, will have tended to increasethe potential client pool. The total potential expenditure under the schemehas also been increased by the increased income limits, and by a number ofother factors, including the abolition of maximum payments, and theincrease in the "multiplier" or "withdrawal rate".
Given the increase in the potential client pool for FIS, increased ratesof payment, and the efforts to increase the rate of take-up, substantialgrowth in the numbers of FIS recipients and expenditure on the schemecould have been expected. There have, indeed, been increases in thenumbers of FIS claimants and in the anaounts claimed, as shown in Chapter2. But have rates of take-up, on either a caseload or expenditure basis,increased, decreased, or remained roughly stable? In order to answer thisquestion, we attempt to estimate the size of the eligible population in 1994.
Because the microsimulation model explicitly takes into accountpolicy parameters such as FIS income limits, there is no difficulty in takinginto account relevant policy changes between 1987 and 1994. The dataused by the model must also be uprated in order to capture the keycharacteristics of the 1994 population for FIS purposes. The methods usedto uprate the data are outlined in Callan, O’Donoghue and O’Neill (1994,Chapter 6). Here we may note that the basic method involved reweightingof the survey households to represent changes in the composition of thepopulation. From the point of view of FIS analysis the important factorswere a rise in employment, and a fall in the number of children, particularlya fall in the number of larger families. Incomes were uprated using separategrowth factors for employment income, self-employment income and farmincome. For present purposes, it is not necessary that this uprating ofincomes should be accurate for the entire population. It would suffice if itis accurate in respect of the relevant population: low income familiescontaining an employee. The key factor here is the growth in employmentincomes for each employee in that population.
One estimate of this growth rate can be provided by assuming thatgrowth in earnings per employee was equally spread over the wagedistribution, so that the incomes of each employee in the sample areincreased by the same percentage: the average growth in wage income per

FIS: ELIGII31LITY AND TAKE-UP 27
employee at national level (41 per cent over the period 1987 to 1994).z Inorder to give some idea of the sensitivity of our estimates to theuncertainties inherent in the uprating procedures, we consider alternativeestimates of wage growth 5 percentage points higher and lower than thisfigure (i.e., wage growth for the relevant population of 36 or 46 per cent).
Having uprated the ESRI database to 1994 incomes in this way, wethen apply the rules of the 1994 FIS scheme to estimate the eligiblepopulation. The central estimates suggest that the number of familieseligible for FIS more than doubled between 1987 and 1994, to a level ofabout 33,000. Potential expenditure on FIS is estimated to have increasedabout five-fold, to a level of over £37m per year. Actual numbers ofclaimants almost doubled and actual expenditure on FIS increased almostfive-fold over the same period. These figures suggest that take-up changedrather little over the period, an issue to which we now turn.
In the previous section, take-up rates for 1987 were calculated usingthree distinct methods. One was based purely on survey data; the secondcombined administrative data on receipt with survey estimates of eligiblenon-recipients; and the third used administrative data on benefit receipt incombination with a survey estimate of the eligible population, whetherreceiving or eligible non-recipients. In estimating take-up for 1994 basedon uprated 1987 survey data, only the last of these methods can be used.This is because it is not possible to distinguish eligible non-recipients fromrecipients in 1994 without having up-to-date survey data. Implicit in themethod used, therefore, is the assumption that the ESRI Surveyunderrepresents FIS claimants but overrepresents eligible non-claimants.As noted earlier, this assumption is not particularly persuasive, but it canprovide an upper bound on the estimate of take-up. In the present contextthen, the focus should not be on the level of the take-up estimate for 1994,but on the change in the take-up rate between 1987 and 1994.
’Nalional accounts data or estimates are used for the increase in non-agricuhural wages and salaries;Labour Force Survey data or estimates are used for the growth in employment. We make similarassumptions with respect to income from other sources - farming, self-employment and socialwelfare transfers - but because of tile composition of incomes in the relevant population, changes inthe~ assumptions have very little impact.

28 SUPPLEMENTING FAMILY INCOME
Table 3.3: Estimated Take-Up Rates for Family Income Supplement, 1987 and 1994
1987
1994 Earnings growth of 41 per cent
Earnings growth of 46 per cent
Earnings growth of 36 per cent
Caseload AggregateExpenditure
25% 46%
26% 50%
29% 57%
23% 43%
Notes: Take-up rates based on estimates of the eligible population from SWITCH, the
ESRI tax-benefit model, combined with estimates from administrative data onactual caseload and expenditure in 1994. An adjustment is made to allow foran estimated 20% of caseload and 1 I% of expenditure not eligible for FIS on
the basis of current circumstances, as outlined in the notes to Table 3.2.
The central estimate, assuming earnings growth of 41 per cent applieduniformly across the wage distribution, suggests that take-up was roughlyconstant on a caseload basis, but increased slightly on an expenditure basis.A higher earnings growth figure of 46 per cent for the relevant low paidpopulation would mean that take-up had risen by about 4 to 1 I percentagepoints for caseload and expenditure respectively. But take-up would havefallen slightly between 1987 and 1994 if earnings growth for the low paidwas below average. The Programme for National Recovery and theProgramme for Economic and Social Progress made special provisions forminimum flat-rate increases in pay at low income levels, which could havegiven higher percentage increases to the low paid. If this tendency was notoffset by other factors, take-up may have risen somewhat over the period.However, it seems probable that there were offsetting factors3 so that thecentral estimate, implying only a small rise in take-up, is the one on whichwe concentrate.
There are obvious difficulties in the process of uprating incomes andother data to attempt to capture changes in the population. It may bedifficult to capture shifts in the composition of employment as betweenlow-paid and high-paid groups, or differential increases in wage growth.While the estimates presented here are, of course, affected by these
:These could include failure to pay these minimum increases for a variety of reasons, and additionalincreases huving been received by higher paid groups in both Ihe private and public sectors.

FIS: ELIGIBILITY AND TAKE-UP 29
difficulties, they do help to give some indication of developments intake-up over the period. A slightly different approach was taken in upratingtake-up estimates for 1992, but re’rived at similar conclusions.
Given that there is a relationship between size of entitlement andtake-up, the distribution of entitlements by size is relevant to changes intake-up rates. If the changes between 1987 and 1994 had produced largenumbers of small entitlements, this might tend to depress the take-upfigures for the later year. But this does not seem to have been the case. In1987, about half of the entitlements seem to have been less than or equalto £5 per week. In 1994, £5 per week was the minimum payment. But evenuprating the £5 per week cut off by the average increase in wages, we findthat the proportion of small entitlements had fallen substantially. Thus, animprovement in take-up might have been expected on this basis alone. Ourestimates suggest that the rise in take-up was rather modest.
As regards the level of take-up, it should be remembered that themethod used to estinaate take-up for 1994 is not comparable with, forexample, those used to derive take-up estimates in the UK. While themethod used here is the only one available to us in deriving a 1994 estimate,it was found to produce a higher estimate of take-up than the two alternativemethods in 1987. Thus, it seems likely that rates of take-up on both acaseload and expenditure basis remain below the rates obtaining in the UKfor Family Income Supplement and its successor, Family Credit.Department of Social Security estimates for 1985/86 put take-up of FamilyIncome Supplement at 48 per cent on a caseload basis and 54 per cent onan expenditure basis (DSS, 1991). Other estimates also suggest figures ofclose to 50 per cent. Recent estimates (Marsh and McKay, 1992) puttake-up of Family Credit for employees at 64 per cent on a caseload basisand 70 per cent on an expenditure basis.4 Part of the explanation of lowtake-up of FIS in the UK was that potential claimants could end up almostas well off by making a claim for Housing Benefit instead. This factor doesnot seem to operate in Ireland, since the eligible non-claimants identifiedin the ESRI Survey were not in receipt of other social welfare payments.Thus, the take-up problem for FIS in Ireland seems to be more severe thanthat in the UK.
~Because of differences in data sources, Marsh and McKay caution against a straightforwarddeduction that take-up of Family Credit is higher than that for FIS.

30 SUPPLEMENTING FAMILY INCOME
3.4 Explanations and Causes of Non-take-upThus far we have concentrated on measuring take-up of FIS, by
identifying those eligible for the benefit from ESRI Survey data. This wasthe starting point for research on take-up in the UK, and indeed in manyother countries. But as Craig’s ( 1991) recent review makes clear, there areother strands in the UK research on take-up.5 In particular, there have beena number of approaches to the identification of factors causing non-take-upof benefit; and the development of alternative models which attempt toestablish how these different factors fit together.
Early qualitative studies attempted to identify individual factorsleading to non-take-up of benefits. The results pointed towards a numberof factors inhibiting take-up: administrative complexity, ignorance andmisperceptions of the schemes, and stigma. A more structured approach tothe identification of factors influencing take-up was provided by Kerr’s(1983) model of the claiming process. His model posited six thresholdswhich must be passed before a claim is made:
1. Perceived need: the individual’s perception of his or herdifficulty in making ends meet.
2. Basic knowledge: the individual’s awareness of the existenceof the benefit;
3. Perceived eligibility: the individual’s perception of thelikelihood that he or she is eligible for the benefit;
4. Perceived utility: the individual’s perception of the utility ofthe benefit in meeting his or her specific needs;
5. Beliefs and feelings about the application procedure andconsequences of applying;
6. Perceived stability of circumstancesA failure at any one of these thresholds is regarded as preventing a claim.Kerr’s model does not allow for the possibility that a high score on onethreshold can counteract a low score on another threshold. An alternativeview, to be found in several studies of take-up, is that there may be scopefor at least some trade-offs between factors influencing take-up. Forexample, a strong perceived need may help to compensate for negativefeelings about the application procedure. Davies and Ritchie (1988) findevidence that the strict threshold model tends to predict non-claiming better
SMuch of the review of research which follows draws on Craig (1991).
FIS: ELIGIBILITY AND TAKE-UP 31
than claiming. This, they argue, is due to the fact that each threshold istreated as a necessary condition for a claim, so that negative factors areoverstated, while the effects of strongly positive forces are discounted.
The competing models can have differing implications for the designof strategies to improve take-up. A threshold model suggests that it maybe necessary to take actions which will increase the likelihood ofindividuals passing more than one threshold. A trade-off model suggestsinstead that actions which markedly increase one key positive factor, orreduce a key negative factor, could be as effective. There is someagreement, however, on the key areas for intervention from research basedon the threshold model (Corden, 1983; Graham, 1984) and approacheswhich allow for some trade-offs between different factors (Davies andRitchie, 1988; Corden and Craig, 1991).
Corden’s (1983) study of the process of claiming FIS found that thethreshold of "perceived eligibility" was numerically the most significant;and that "beliefs and feelings" about the consequences of applying alsoplayed a strong role. Corden’s work also pointed to the fact that negativefeelings arising from the experience of claiming other benefits could havea spillover effect on the likelihood of claiming FIS; and that the fear ofrejection played a significant role in making claims less likely. Graham(1984) also found that perceived eligibility was important in explainingwhether or not eligible persons claimed FIS; and that beliefs and feelings,not just about the FIS procedures, but about the role of welfare and thenature of eligible groups, could have an influence through several routes.
Davies and Ritchie (1988), in a study which included FIS, but wasnumerically dominated by individuals eligible for Supplementary Benefitand Housing Benefit, found three significant negative factors inhibitingtake-up: a lack of perceived need, uncertainty about eligibility and negativeattitudes towards the claiming process. They found that these factors wereinterlinked, and suggest that a change in any one of the elements couldreduce the deterrent effect of the other. On the positive side, they foundthat personal advice or encouragement to claim could play a key role intriggering a claim. More recently, Corden and Craig’s (1991) study of theearly experience with Family Credit, found a similar link betweenperceptions of eligibility and perceptions of need. State benefits are oftenseen as being for traditional "needy" groups - the old, the sick and theunemployed. This attitude may be coupled with negative connotations ofdependence on state benefit, and can reduce likelihood of claiming. Cordenand Craig also found that women were more willing to investigate thepossibility of an entitlement to Family Credit and to apply for it. There was
32 SUPPLEMENTING FAMILY INCOME
more resistance to the idea from husbands. It may be, therefore, thatinformation spread through networks which reach women may be moreeffective in terms of increasing take-up.
Corden and Craig’s (1991) study contains some new insights into thevalue of the scheme as an incentive to move into, or stay in, paid work.They undertook detailed interviews with a small number of claimants, oflikely eligible non-claimants, and with potential claimants, i.e., thosecurrently not at work but with recent labour market contact. The FamilyCredit scheme which replaced FIS in the UK aimed at ensuring thatfamilies would be better off in work than out of work. But the experienceof claimants pointed to the risk and delay involved in establishing asuccessful claim as factors tending to reduce the incentive value of thescheme. Even without the risk factor, the transitional period while theclaim was established and processed (information on pay for 5 weeks, or 2months for those paid monthly, being required) was found to be a difficultone, during which debts and arrears could build up.
Increases in housing costs which accompanied a move fromunemployment to employment were also found to be significant. Whilethis reflects the nature of Housing Benefit in the UK, similar considerationscould be relevant in Ireland: assistance with housing costs under theSupplementary Welfare Allowance is not provided to those in full-timework, and a move from unemployment :o employment could trigger asignificant increase in differential rent. Despite the small scale of theCorderdCraig study, it is noteworthy that they found no individual who hadworked out his or her entitlement to Fanaily Credit before moving intowork; some had, however, relied on advice from other sources that theywould find themselves better off in employment.
From the point of view of individuals already in work, some of thesefactors are less important. But re-assessment at six-monthly intervals doesgive rise to some insecurity. It is possible also that claimants could becomediscouraged as pay increases get eaten up by a combination of taxes andbenefit withdrawal.
3.5 Measures to Improve Take-upFor take-up and incentive reasons, it is important that those who are
currently unemployed and have children should know about FIS. Cordenand Craig’s small scale study found little evidence of Family Credit beingperceived as an incentive to work by such "potential recipients". Given thateven those who did claim the benefit were found not to have calculated itin advance, it seems likely that if such schemes are to have maximum

FIS: ELIGIBILITY AND TAKE-UP 33
incentive effect, additional efforts to inform potential recipients of theirpotential entitlement would be worth considering. It might be possible, forexample, to tailor information on their likely entitlements to their familycircumstances. For a recipient of Unemployment Benefit or Assistance, thenumber of children for which unemployment compensation is paid isknown, as is the fact of whether or not the spouse of the claimant is earningabove £55 per week. It seems possible, therefore, that currentlyunemployed individuals could be infornled of their likely entitlementsunder FIS at different rates of pay. Whether or not this would be a costeffective strategy would depend on a number of factors. This might beinvestigated using a pilot scheme.
As regards those currently in employment, it may be useful to explorethe potential of tax records for identifying potential FIS recipients. Aprecise identification of those eligible for FIS is not possible from theannual tax returns processed by the Revenue Commissioners; but therewould appear to be sufficient information in these data to identify thoselikely to be eligible for FIS. For example, the Revenue Commissioners mayhave information that a taxpayer is exempt from income tax, or receivesmarginal relief from income tax, on the basis of a certain number ofchildren. Given that the number of children is known, examples of theirlikely FIS entitlement at different weekly wage rates could be providedwhich might encourage take-up.
A more fundamental question is whether the tax system could bedeveloped in such a way that it could make a FIS-type paymentautomatically. The experience with the Earned Income Tax Credit (EITC)scheme in the US would be relevant here. The differences between thestructure of FIS, the UK-style Family Credit (FC), and the US-style EITC
are considered in the next chapter. Here we consider only those issueswhich are linked to the implementation of the payment through the taxsystem. Estimates suggest that take-up of EITC, which operates through thetax system in the US, are high: Scholz (1994) suggests rates of over 80 percent. These high rates reflect the fact that in the US most taxpayers do filean annual return with the tax authorities, and the fact that such returns havebeen adjusted by the tax authorities to give the benefit of the EITC toeligible taxpayers, even if it was not specifically claimed. The structure oftax administration in this country is rather different: many taxpayers do notmake an annual return, and the role played by employers can be moreimportant. This may mean that the US model of administration cannot bedirectly applied in the Irish case; but a closer examination of the scope forachieving high take-up through the tax system is in order.

34 SUPPLEMENTING FAMILY INCOME
F1S, Family Credit and E1TC are each designed to support families inlow income employment. FIS works from an assessment of income overa period of weeks, with a 12 month entitlement. FC also works with arelatively short period of assessment, and a 6 month entitlement. ForEITC, the fiscal year is both the basis of assessment and the period ofentitlement. If FIS was to be paid through the income tax system, somechange in its assessment basis would be necessary; but this need not be seenas a drawback. The strongest arguments in favour of the current basis ofassessment seem to be based on practicalities rather than principle. If theoverall objective of supporting families in low income employment can beattained more effectively through different administrative mechanisms, weneed only be concerned that these new mechanisms are themselvespractical.
A switch in the basis of assessment is not simply a technical matter:one issue of principle does arise. Under an annual income basis ofassessment, support would be provided not only to families with a lowweekly income from employment, but also to those with a higher weeklyemployment income if they experienced a sufficiently long spell ofunemployment during the tax year. This would increase the exchequer costof the support provided; in some circumstances, it could lead to anincentive to give up employment for a part of the tax year. This potentialdrawback is related to the fact that unemployment assistance is not includedin taxable income, and FIS is related to gross rather than net income. If eachof these conditions changed, the use of an annual income basis to provideincome support to working families might be considerably more attractive.
If, for whatever reason, it is decided that an annual income basis is notappropriate, can the tax system still serve as an automatic paymentmechanism for income support? One possibility would be that the "taxcredit" element would operate only for weeks in which there was anemployment income. This is somewhat at odds with the cumulative andannual nature of the income tax assessment, but is similar in structure to the£60 per week PRSI exemption limit. In other words, the tax credit couldoperate on the basis of current weekly or monthly income. But this wouldrequire that it be implemented by employers, rather than directly by the taxauthorities. A key difference between the PRSI exemption scheme and the"tax credit" scheme is that PRSI depends wholly on individualcircumstances, while the tax credit would depend on family circumstances,including the earnings of a spouse and the number of children. Mostcouples eligible for income support of this type are likely to have only oneearner, so it might be productive to examine ways around this difficulty.

FIS: ELIGIBILITY AND TAKE-UP 35
3.6 ConclusionsRe-examination of the ESRI Survey data for 1987 confirms that
take-up of Family Income Supplement in Ireland was then at rather lowlevels. No more than about a quarter of eligible families appeared to bereceiving the benefit, and no more than £3 to £4 out of every £10 ofpotential expenditure was claimed. Estimates of the rates of take-up for1994, based on uprating of the incomes in the ESRI Survey, and of therelevant policy rules, were subject to even more uncertainty. However,they provide the only available information on that subject. They suggestthat take-up remains rather low, even when compared with take-up rates forFamily Credit in the UK. Low take-up cannot be explained on the basis ofsmall entitlements not being taken up. Changes since 1986 have not led toa rise in the proportion of entitlements which are small; indeed, the reverseis the case.
Some important questions about the eligible population cannot yet beanswered definitively - even in the UK context, where take-up has been thesubject of many research studies. For example, what proportion of thatpopulation are only eligible for a brief period? And what are the mainroutes out of eligibility - transitions to unemployment, or to higher paidemployment? To answer these questions we would need relativelylarge-scale dynamic studies, capable of identifying the eligible populationaccurately. Walker and Ashworth (1994, Chapter 8) use administrativerecords to provide some insights into the first of these questions. They findthat most claims for Family Credit are for a single 6-month period; repeatedspells on benefit are the exception.6 This suggests, they argue, that FamilyCredit functions as a transitional benefit for most claimants, "bridgingfamilies across a short-lived set of circumstances". If this is so, it may helpto explain why take-up can be a greater problem for such benefits: mostpotential claimants will not have previous experience of making a claim.
The small size of the target population for FIS means that ve~ smallnumbers are found in a general household sample such as that surveyed bythe ESRI. This greatly limits the analysis of causes of non-take-up whichcan be identified in the ESRI data. There was evidence that in 1987, morethan half of eligible non-claimants were unaware of the existence of thescheme. Information campaigns in the 1987-94 period are likely to havehad an impact on this figure. But, as UK research has shown, basicinformation is a necessary but insufficient condition for a benefit to be
~’Ncvertheless, a snapshol of those in receipt at a point in time will find quite a high proportion ofrepeat claimants, as they tend Io accumulate in the "live caseload’.

36 SUPPLEMENTING FAMILY INCOME
taken up. Research on UK experience with FIS and Family Credit pointstowards perceived eligibility being a major factor inhibiting claims for FIS,together with negative attitudes towards dependence on state benefit andthe process of claiming. Encouragement to claim is also seen as a powerfulfactor in stimulating take-up of benefit. Corden and Craig’s qualititativestudy also suggests that families do not attempt to calculate theirentitlement, even under the somewhat more transparent Family Creditstructure; and that misperceptions of eligibility can arise from focusing oninappropriate examples. This suggests that information on likelyentitlements at a range of wages, for the relevant family size, may havemore impact than information which requires potential applicants to maketheir own calculations.
The possible attractions of using information from the tax system tomake an automatic FIS-type or "tax credit" payment were noted. Onemajor issue which arises is what impact a move to an annual basis ofassessment would have. The tax status of unemployment compensationpayments is critical in this regard. Unless all unemployment compensationpayments (Unemployment Assistance as well as Unemployment Benefit)are included in taxable income, an annual income basis for a tax creditmight not be desirable. There would seem to be greater difficulties in usingthe tax system to make a payment based on weekly or monthly income. Butif the form of income support provided is to make transitions fromunemployment to employment more attractive, a system which provides anautomatic and quick response would be desirable. The feasibility of usingthe tax system to make an automatic short-term payment is therefore worthfurther consideration.
Chapter 4
POLICY OPTIONS: IN-WORK BENEFITS
4. I IntroductionThe problems caused by the interaction of the existing FIS and income
tax structures were outlined in Chapter 2. Here we return to these issues,in the context of some possible refornls of the FIS structure itself. The focusin this chapter is on refornas of the structure of in-work benefits foremployees, and on possible extensions of the scope of such benefits. Theconcluding chapter sets the findings in a broader context, including otherpossible reforms of the child income support system.
We begin by setting out in detail the relationship between disposableand gross income~ for families in work under 1994/95 tax and socialwelfare policies. This provides a baseline against which ahernatives canbe compared. The first specific alternative structure considered is a moveto the assessment of FIS on a net income basis. The nature of therelationship between disposable and gross income implied by this reformis clarified, and the cost, distributive and incentive implications areinvestigated using SWITCH, the ESRI tax-benefit model to simulate FISentitlements under the existing and reformed policies for a nationallyrepresentative sample of households.
Two systems in operation in other countries - the UK Family Creditscheme, and the US Earned Income Tax Credit (EITC) - are sometimesseen as offering an improvement in the trade-off between the level ofincome support at low incomes, the height of effective marginal tax rateson beneficiaries, and the numbers affected by such tax rates over and abovewhat can be offered by a FIS-type structure. In Section 4.3, we clarify thenature of the UK Family Credit scheme and the US EITC. We show thatthe Family Credit scheme is, in effect, rather similar to a FIS schemeoperating on a net income basis. Neither it nor the EITC represent a clearimprovement in the trade-off from which policy makers must choose: theydo, however, represent rather different choices from similar trade-offs.
~More precisely, it is the relationship between income before transfers and income after transferswhich is of interest: but in the examples illustrated income before transfers coincides with grossincome, so we use the more familiar term.
37

38 SUPPLEMENTING FAMILY INCOME
Two extensions of the scope of the existing F’IS structure are alsoconsidered. The first is an extension to include couples, at least one ofwhom is at work, but who do not have children: there is at present no"safety-net" income support for such individuals. Microsimulationmodelling is used to assess the cost and extent of the support which wouldbe implied by this change. Self-employed individuals, particularly thoseoutside the farm sector, can also fall outside the "safety-net" provided bythe welfare system. The difficulties in extending income support to suchgroups are also considered.
4.2 FIS on a Net Income BasisIt is useful to begin by illustrating the differences between the
disposable-from-gross income schedules for the existing tax-welfarestructure, under which FIS is assessed on a gross income basis, and astructure involving FIS on a net income basis. Table 4.1 shows the FISentitlement, tax and PRSI liability and disposable income (including childbenefit of almost £21 per month) of a one-earner married couple with 4children at different gross income levels. The tax and FIS rules are thoseapplying in 1994/95; thus the income limit for FIS is £245 per week, andthe exemption limit for income tax purposes, including the additions forchildren, is approximately £180 per week. The precise shape of theschedule will be influenced by a number of factors not taken into accountin this hypothetical example,2 and family size will also affect the shape andlocation of the schedule; but the impact of the different bases of assessmentis similar. The microsimulation analysis later in this chapter will takeaccount of the diversity of family circumstances relevant to tax and welfarepolicies.
2For example, the composition of gross income is relevant: here it is assumed that the gross incomeis from earnings as an employee, but for some families, payments under other social welfare schemeswill be relevant.

Table 4.1:
POLICY OPTIONS: IN-WORK BENEFITS
Gross and Di~7)osable Incomes of FIS Recipient : Current Structure(Married recipient with 4 chiMren)
39
Weekh" Gross FIS T(L~" Liability PRSI DisposableIncome £ £ £ Income i£ £
40 123.00 0.00 0.00 183.7960 III.00 0.00 0.00 191.7980 99.00 0.130 4.40 195.39100 87.00 0.00 5.50 202.29120 75.00 0.00 6.60 209.19140 63.00 0.00 7.70 216.09160 51.00 0.00 8.80 222.99180 39.00 0.00 13.95 225.84200 27.00 7.89 15.50 224.40220 15.00 15.89 17.05 222.85240 5.00 23.89 18.60 223.30260 0.00 31.89 20.15 228.75280 0.00 39.89 21.70 239.20300 0.00 47.89 23.25 249.65
Note: I. Disposable income includes child benefil of almost £21 per week.Memorandum item: A couple on Long-tern1 Unemployment Assistance with 4 children
would receive a total cash income of £171.19 per week, includingchild benefit.
Gross income levels below £40 per week are neglected, since aminimum of 20 hours per week is required to qualify for FIS; few if any ofthose likely to qualify for FIS will, therefore, have a weekly wage belowthis level. Cash income if unemployed, and receiving long-termUnet-nployment Assistance would be £171.19 per week (including childbenefit). FIS payments ensure that disposable income in work is above thislevel, by about £30 for a wage of £100 per week, rising to £55 for a wageof £180 per week. The tax-cure-benefit withdrawal rate starts at 60 percent, and rises to over 100 per cent for incomes between about £173 and£235. While marginal rates fall thereafter, there is no gain in disposableincome for an increase in gross income from £173 to about £255. Thisextreme form of "poverty trap" has been the focus of much cotlcern.3
sit also affects the balance between disposable income in work and out of’.vork: the gap falls to about£50 per week for earnings of £235 per week.
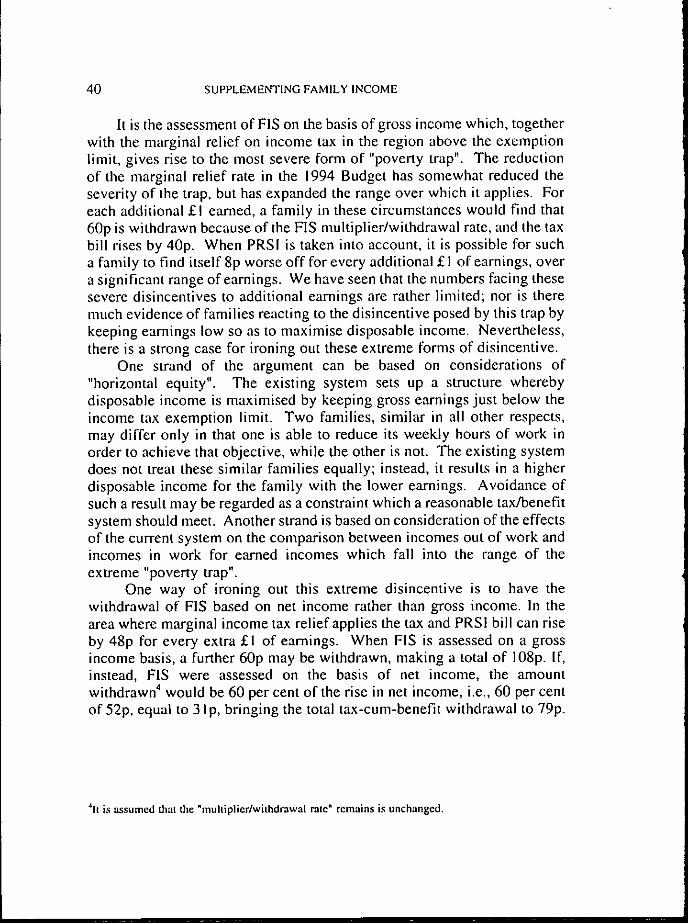
4O SUPPLEMENTING FAMILY INCOME
It is the assessment of F1S on the basis of gross income which, togetherwith the marginal relief on income tax in the region above the exemptionlimit, gives rise to the most severe form of "poverty trap". The reductionof the marginal relief rate in the 1994 Budget has somewhat reduced theseverity of the trap, but has expanded the range over which it applies. Foreach additional £1 earned, a family in these circumstances would find that60p is withdrawn because of the FIS multiplier/withdrawal rate, and the taxbill rises by 40p. When PRSI is taken into account, it is possible for sucha family to find itself 8p worse off for every additional £ I of earnings, overa significant range of earnings. We have seen that the numbers facing thesesevere disincentives to additional earnings are rather limited; nor is theremuch evidence of families reacting to the disincentive posed by this trap bykeeping earnings low so as to maximise disposable income. Nevertheless,there is a strong case for ironing out these extreme forms of disincentive.
One strand of the argument can be based on considerations of"horizontal equity". The existing system sets up a structure wherebydisposable income is maximised by keeping gross earnings just below theincome tax exemption limit. Two families, similar in all other respects,may differ only in that one is able to reduce its weekly hours of work inorder to achieve that objective, while the other is not. The existing systemdoes not treat these similar families equally; instead, it results in a higherdisposable income for the family with the lower earnings. Avoidance ofsuch a result may be regarded as a constraint which a reasonable tax/benefitsystem should meet. Another strand is based on consideration of the effectsof the current system on the comparison between incomes out of work andincomes in work for earned incomes which fall into the range of theextreme "poverty trap".
One way of ironing out this extreme disincentive is to have thewithdrawal of FIS based on net income rather than gross income. In thearea where marginal income tax relief applies the tax and PRSI bill can riseby 48p for every extra £1 of earnings. When FIS is assessed on a grossincome basis, a further 60p may be withdrawn, making a total of 108p. If,instead, FIS were assessed on the basis of net income, the amountwithdrawn4 would be 60 per cent of the rise in net income, i.e., 60 per centof 52p, equal to 31 p, bringing the total tax-cure-benefit withdrawal to 79p.
4It is assumed that the "multiplier/withdrawal rate" remains is unchanged.

POLICY OPTIONS: IN-WORK BENEFITS 41
Thus a £1 rise in earnings would result in an increase of about 21p indisposable income, when FIS is assessed on the basis of net income, ratherthan a decrease of 8p, when FIS is based on gross income.
Table 4.2 presents information on the relationship between disposableand gross income for a FIS scheme which uses net income as the basis ofassessment.51n order to ensure that no family’s FIS emitlement can be
reduced under the transition to the scheme, the current FIS income limitsand FIS multiplier/withdrawal rate have been retained. This ensures thateven at the lowest incomes, no losses can arise. Thus at earnings of£40 perweek, disposable income after taxes and FIS is still found to be £184 perweek. But at higher income levels, where PRSI and/or income tax drive awedge between gross earnings and net earnings, FIS entitlements anddisposable incomes under the revised scheme are greater, as is clear frumthe table. This is because entitlements are calculated as a percentage of thedifference between the original income limits and what is now a lowerincome figure: net earnings after tcLr and PRSI. A corollary of this changeis that FIS is now payable at higher gross income levels than before. Underthe current FIS structure, FIS was not payable for gross income levelsabove £245; but under the revised structure, some FIS is payable at grossincome levels above £300.
5A choice has to be made between the u~ of standard allowances and actual allowances (including
elements such as mortgage relief) in detemllning net income. In general, actual allowances will begreater than or equal to standard allowances. This means that the cosls of a FIS scheme on a netincome basis should be lower if aelual allowances are used as the basis for assessnlellt. There aresome exceptions to this rule: actual allowances may incorporate a reduclion in respect of rentalincome, which would reduce net income and potentially increase the FIS payment. Bul the numberof such exceptions is likely to be very small. In general, a procedure which took income net of taxand PRSI as shown on a payslip would be relatively simple and accurate. Checks might be neededto ensure that allowances were not left temporarily unclaimed in order to nmximise a I=lS payment.In the modelling process, actual allowances have been used in calculating FIS on a nel income basis.
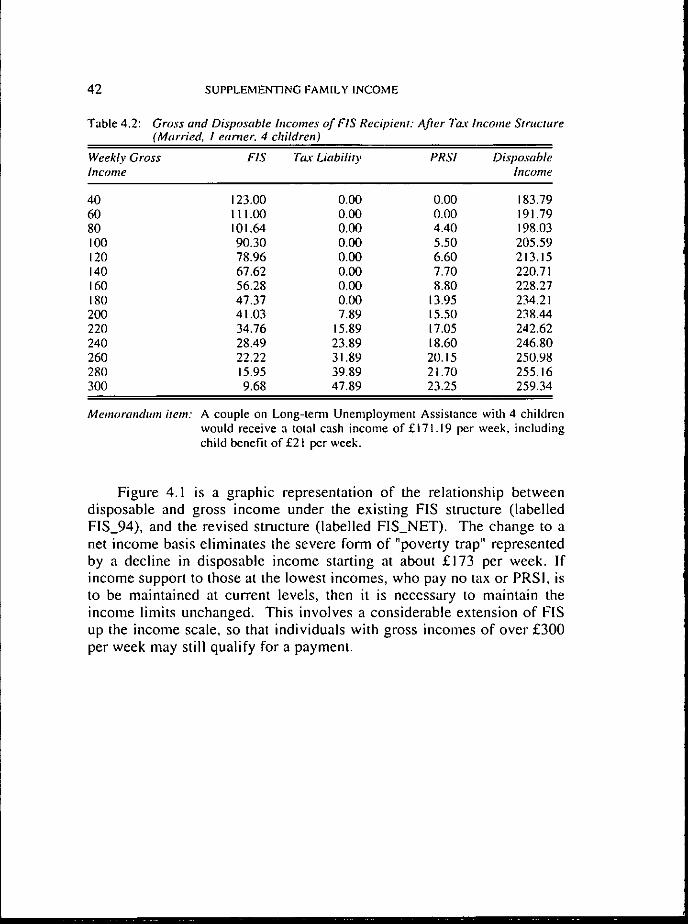
42
Table 4.2:
SUPPLEMENTING FAMILY INCOME
Gross and Disposable Inconles of FIS Recipient: After Tax Income Stractare(Married, I earner. 4 children)
Weekly Gross FIS Tax Liability PRSI DisposableIncome Income
40 123.00 0.00 0.00 183.7960 IIh00 0.00 0.00 191.7980 101.64 0.00 4.40 198.03100 90.30 0.00 5.50 205.59120 78.96 0.00 6.60 213.15140 67.62 0.00 7.70 220.71160 56.28 0.00 8.80 228.27180 47.37 0.00 13.95 234.21200 41.03 7.89 15.50 238.44220 34.76 15.89 17.05 242.62240 28.49 23.89 18.60 246.80260 22.22 31.89 20.15 250.98280 15.95 39.89 21.70 255.16300 9.68 47.89 23.25 259.34
Memorondum item: A couple on Long-term Unemployment Assistance with 4 childrenwould receive a total cash income of £171.19 per week, includingchild benefit of£2t per week.
Figure 4.1 is a graphic representation of the relationship betweendisposable and gross income under the existing FIS structure (labelledFIS_94), and the revised structure (labelled FIS_NET). The change to anet income basis eliminates the severe form of "poverty trap" representedby a decline in disposable income starting at about £173 per week. Ifincome support to those at the lowest incomes, who pay no tax or PRSI, is
to be maintained at current levels, then it is necessary to maintain theincorne limits unchanged. This involves a considerable extension of FISup the income scale, so that individuals with gross incomes of over £300per week may still qualify for a payment.
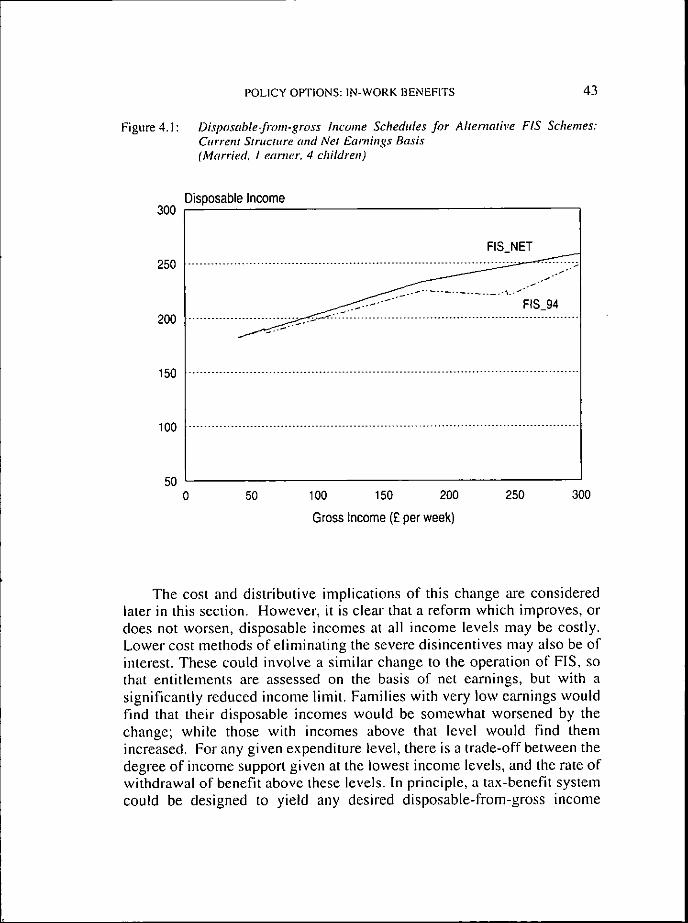
Figure4.1:
POLICY OVrlONS: IN-WORK BENEFrFS 43
Disposable-from-gross Income Schedules for Ahernative FIS Schemes:Current Structure and Net Earnings Basis(Married, I earner. 4 children)
Disposable Income300
250
200
150
100
50
FIS_NET
......................................................................................J ................ .,j 17 -
0 50 100 150 200 250 300
Gross Income (£ per week)
The cost and distributive implications of this change are consideredlater in this section. However, it is clear that a reform which improves, ordoes not worsen, disposable incomes at all income levels may be costly.Lower cost methods of eliminating the severe disincentives may also be ofinterest. These could involve a similar change to the operation of FIS, sothat entitlements are assessed on the basis of net earnings, but with asignificantly reduced income limit. Families with very low earnings wouldfind that their disposable incomes would be somewhat worsened by thechange; while those with incomes above that level would find themincreased. For any given expenditure level, there is a trade-off between thedegree of income support given at the lowest income levels, and the rate ofwithdrawal of benefit above these levels. In principle, a tax-benefit systemcould be designed to yield any desired disposable-from-gross income

44 SUPPLEMENTING FAMILY INCOME
schedule. But the menu of options which can be achieved with the existingincome tax structure and a move from gross to net assessment of F1S ismuch more restricted: full integration of the tax and benefit systems, or adegree of co-ordination which matched this, would be required to give fullflexibility.
The situation is complicated still further by the structure of PRSIcontributions. To show the nature of this we first simplify by consideringincomes below the "levy exemption" limit of £173 per week, and below theincome tax exemption limit (about £180 for a 4-child family), and abovethe £60 per week PRSI exemption limit. All families under considerationare, therefore, exempt from income tax, but pay PRSI at the rate of 5.5 percent. FIS on a net income basis, with the same income limits as used in theexisting system, will imply an increased payment to such families, becausenet income is typically (100-5.5)=94.5 per cent of gross income. This factoralone will also result in higher payments further up the income scale. Thusexchequer expenditure will increase because all existing recipients wouldthen receive higher payments.
Can this additional expenditure, related purely to PRSI liabilitieswhich are not central to the major disincentive to be addressed, be avoided?In principle, it is not possible to do so without creating potential losses forsome existing FIS recipients. But in practice it may be possible to do sowithout imposing substantial losses.6 One option would to re-scale the FISincome limits and the withdrawal rate to take account of the differencebetween net and gross income created by PRSI.7 Under the existingsystem, FIS payments are determined as:
FIS_GROSS = 0.60 x (Gross Income - Gross Income Limit)If net income is to be the basis of the assessment, FIS payments will bedetermined by
FIS_NET = Withdrawal rate x (Net Income - Net Income Limit)
Since, at the lowest income levels, net income is simply equal to 94.5 percent of gross income, it is possible to ensure that the same payment is given
SPotential losses could arise for public servants paying a low rate of PRSI, who were exempt from
income tax. and claiming FIS, but the amounL~ involved are probably rather small.
7Another approach would be to make FIS assessable on the basis of income after tax, but withoutallowing for PRSI deductions: this would make the income concept used less familiar to recipientsthan net income after tax and PRSI.
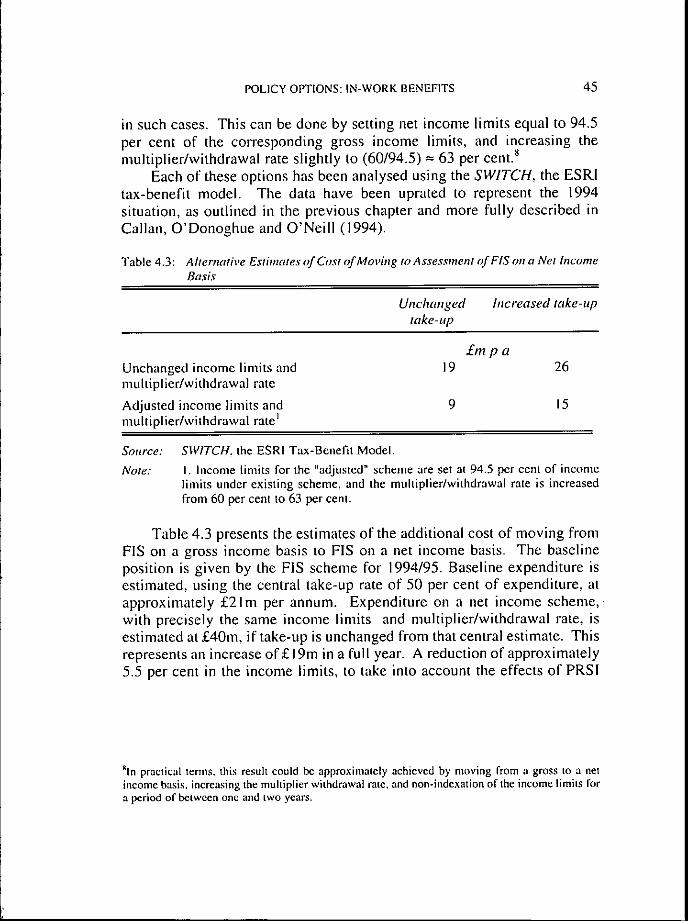
POLICY OPTIONS: IN-WORK BENEFITS 45
in such cases. This can be done by setting net income limits equal to 94.5per cent of the corresponding gross income limits, and increasing themultiplier/withdrawal rate slightly to (60/94.5) = 63 per cent.s
Each of these options has been analysed using the SWITCH, the ESRItax-benefit model. The data have been uprated to represent the 1994situation, as outlined ill the previous chapter and rnore fully described inCallan, O’Donoghue and O’Neill (1994).
Table 4.3: Alternative Estimates of Cost of Moving to Assessment of FIS on a Net IncomeBasis
Unchangedtake-up
htcreased take-up
Unchanged income limits andmultiplier/withdrawal rate
Adjusted income limits andmultiplier/withdrawal rate~
£m p a
19 26
9 15
Sottrcd:
Note."
SWITCH, the ESRI Tax-Benefit Model.
I. Income limits for the "adjusted" scheme are set at 94.5 per cent of incomelimits under existing scheme, and the multiplier/withdrawal rate is increasedfrom 60 per cent to 63 per cent.
Table 4.3 presents the estimates of the additional cost of moving fromFIS on a gross income basis to FIS on a net income basis. The baselineposition is given by the FIS scheme for 1994/95. Baseline expenditure isestimated, using the central take-up rate of 50 per cent of expenditure, atapproximately £21m per annum. Expenditure on a net income scheme,with precisely the same income limits and multiplier/withdrawal rate, isestimated at £40m, if take-up is unchanged from that central estimate. Thisrepresents an increase of£19m in a full year. A reduction of approximately5.5 per cent in the income limits, to take into account the effects of PRSI
gin practical terms, this result could be approximalely achieved by moving from a gross to a netincome basis, increasing the multiplier withdrawal rate, and non-indexation of the income limits fora period of between one and two years.

46 SUPPLEMENTING FAMILY INCOME
liabilities on FIS, would reduce this cost to £9m in a full year. If take-upincreased substantially, to about 60 per cent, expenditure could rise by afurther £7m on a full year basis.
The near-doubling of expenditure, assuming constant take-up and"adjusted" income limits, reflects a modest increase in the average paymentand a very substantial increase in the number of families who would qualifyfor a F1S payment. The average payment (initially about £22 per week)increases by less than 5 per cent; but the number of families qualifying fora payment increases by over 80 per cent. Thus, while the move to a netincome basis reduces the numbers facing effective tax-cum-benefitwithdrawal rates in excess of 90 or 100 per cent, it increases the numbersfacing rates in the region of 70 to 80 per cent. It was recognised, andaccepted, that the UK move to Family Credit would involve a similartrade-off.
The fact that the increased expenditure arises mainly from an increasein numbers rather than aggregate expenditure does not give a clearindication of the distributional consequences of the change. It is possiblethat the additional entitlements tend to be small, while the existingentitlements are increased substantially. But inherent in the objective of thereform is an increase in income for those in the income tax net rather thanbelow the income tax exemption limit. What does this mean for the overalldistributional consequences of such a reform? There are obviousdifficulties in attempting a distributional analysis of the change. It isknown that take-up rates are low; that they are related to size of entitlement;and that they may be affected by the change in the FIS scheme which isenvisaged. Nevertheless, an analysis of the distributive effects of thechange based on 100 per cent take-up of the baseline and reformed systemsis of some value in pointing to the likely distributive implications.

POLICY OPTIONS: IN-WORK BENEFITS 47
Table 4.4: DistribtttionofChangesinFISEntitlentents:NethtcomevsGrosshlcomeasa Basis of Assessmentt
Disposable income pet" adult % of % of % ofequivalentz under 1994/95 population gainers aggregateta.r-benefit system gain
More than Less than£ pet" week
55.44 7.0 0 055.44 59.20 8. I 0 059.20 62.60 12.2 0 062.60 70.60 I 1.2 2 I70.60 83.22 I 0.1 48 5683.22 108.70 10.4 39 34
108.70 135.75 9.3 9 8135.75 165.41 9.9 I I165.41 212.90 10.4 0 0212.90 I 1.5 0 0
A LL 100.0 100.0 100.0
Source:
I. The change involves a move from a gross to a net income basis of assessmentfor FIS. with unchanged income limits.2. The equivalence scale used to derive income per adult equivalent (incomeadjusted for family size and compositiou) is I for the first member of a "taxunit". 0.66 for a spouse, and 0.33 for each child.
ESRI Survey of Income Distribution, Poverty and Usage of State Services.
Most of those who gain from a move to a net income basis ofassessment are found close to the median income level - in the fifth andsixth deciles of the income distribution adjusted for family size andcomposition.9 There are no gains in the bottom three deciles. This is notsurprising. In part it reflects the fact that current FIS entitlements bringmost of the relevant population up from the very lowest income levels. Thepotential aggregate gain in money terms is also heavily concentrated close
’~,Vhile the income ranges in the table do not correspond precisely to deciles (equal 10 per centgroups of the population, ranked from poorest to richest), it is clear that the gains are concentratedin the 5th and 6th deciles.
48 SUPPLEMENTING FAMILY INCOME
to the median income level: about 90 per cent of potential expenditure goesto families in the fifth and sixth deciles of income. - a weekly disposableincome of between £71 and £109 per adult equivalent.~°
The microsimulation analysis of the option involving a net incomebasis with reduced income limits and an increased multiplier finds a smallnumber of cases where FIS entitlements would be reduced. This possibilitycan arise because some income - usually social welfare income in the casesidentified here - is not subject to (full) PRSI. The number of cases involvedis very small, and a high proportion of these may not face a loss in actualincome because they are not taking up their existing entitlement. Thepotential losses are less than £3 per week on. average.
The fact that making FIS assessable on a net income basis results inthe extension of FIS to higher gross incomes, and a lower effectivetax-cum-benefit withdrawal rate might suggest that an alternative strategycould be used to achieve similar results: reduction in the FIS multiplier, toreduce the tax-cum-benefit-withdrawal rate, coupled with increases in thegross income limits, to ensure that the.amounts paid to those on the lowestincomes are not adversely affected. We have examined this strategy as a"stand-alone" option, and as a possible "staging-post" for a transition to FISon a net income basis. In order to achieve a similar reduction in theeffective tax-cum-benefit withdrawal rate, the reduction in the FISmultiplier would have to be quite substantial. The change to a 40 per centmarginal relief rate of tax in the 1994 Budget has widened the income rangeover which this rate applies. A reduction in the FIS muhiplier to about 32per cent would be required to cut the effective tax-cum-benefit withdrawalrate facing those on FIS and marginal relief to around 80 per cent.
Our microsimulation analysis indicates that such an option would bemuch more costly than simply putting FIS on a net income basis.Furthermore, a 2-stage process, whereby a move to a net income basisfollowed an initial income limit increase and multiplier reduction, wouldbe substantially more expensive than a direct move to a net income basisfor FIS. This 2-stage option is therefore unattractive: it requires a greatercost to achieve the same reduction in marginal tax cum benefit rates for thegroup most affected, or given the same resources, would not achieve asmuch as a direct move to a net income basis for FIS.
"The gains in the upper half of the income distribution refer mainly to a small number of loneparents, who receive the same level of income support as two-parent families under FIS; theytherefore have higher incomes per adult equivalent.

POLICY OPTIONS: IN-WORK BENEFITS 49
4.3 UK Family Credit and US Earned Income Tax CreditDo the UK-style Family Credit scheme and/or the US style Earned
Income Tax Credit (EITC) represent distinct alternatives, which might bepreferred to F1S assessed on the basis of net earnings? Here we assess thesequestions purely in terms of the relationship between disposable and grossincome which each scheme gives rise to. Other factors may enter into thechoice between these schemes, such as the degree of transparency, or thelikely effects on take-up; but the question of primary interest in this sectionis whether Family Credit and/or EITC enriches the menu of possible policyoptions from the point of view of the disposable-from-gross incomeschedule.
A brief description of the UK Family Credit scheme is set out inAppendix 4. I. The essential features of that structure are that entitlementsare assessed on the basis of after-tax incomen; a threshold income; and amaximum credit, which depends on the number of children.~2 If after-taxincome falls below the threshold, then the family is entitled to a ma.rimumfamily credit consisting of an adult credit plus additional credits for eachchild. The child credits are set at the same level as the additions for childrenunder the Income Support scheme. The threshold income is equal to theentitlement of a claimant plus spouse under Income Support. These twofeatures are designed to rationalise payment structures across schemes, andensure that there is an incentive to take tip (full-time) employment. Ifincome exceeds this threshold, the payment is reduced by a proportion ofthe excess:Family Credit = Ma.~’imttm Credit - Taper x (Net Earnings - Threshold)
This structure appears to be rather different from that of FIS on a netearnings basis. Indeed, there are significant differences between the optionof assessing FIS on the basis of net income, and implementing a UK-styleFamily Credit structure with similar parameters to those in the UK. But thedifferences arise simply from the choice of parameters under each scheme.
nThe income measure used takes capital assets into account in establishing eligibility andentitlement. This does not bear on the central issue’, capital assets could be taken into account in asimilar way within a FIS-type structure.
~"Child credits are age-related; this reflects the use of age-related scales for children throughout theUK social security syslem. Since the Irish system does nol generally use age-related payments, thisaspect - which, again, does not bear on the central issue of relationships between disposable andgross income - is neglected here.

5O SUPPLEMENTING FAMILY INCOME
It can be shown that FIS on a net earnings basis can be adjusted to yieldexactly the same payments at each gross income level as Family Credit, andvice versa, as demonstrated in Appendix 4.2.
The US Earned Income Tax Credit (EITC) also appears, at first sight,to represent a very different structure. The scheme was revamped under theOmnibus Budget Reconciliation Act of 1993, which envisaged theexpansion of EITC to become "the largest cash or near-cash programdirected at low-income households" (Scholz, 1994). The structure of therevised scheme can be illustrated using the figures envisaged for 1996,deflated to 1994 prices. Taxpayers with 2 or more dependent childrenwould be eligible for a refundable tax credit~3 at the rate of 40 per cent ofearnings, up to an income of $8,425 per annum. Thus, the maximum taxcredit would be about $64 per week, which would be payable on earningsbetween about $160 and $210 per week. The tax credit would then bereduced by just over 21 cents for every dollar of income above $210 perweek, implying that the credit would be fully withdrawn when incomereached about $517 per week. One-child families would receive a slightlylower level of support (34 per cent of earnings with a maximum credit ofjust under $40 per week) with a lower withdrawal rate of just under 16 percent.14
This structure differs significantly from FIS on either a net or grossincome basis. One of the key differences is that the amount of supportoffered under the EITC structure does not increase for families with morethan 2 children. Given the structure of child dependant additions in theIrish social welfare system, it is critically important that the anaount ofin-work benefit for families with children should increase with the numberof children. However, it would be possible to envisage an EITC structurewhich did increase support in line with the number of children. A furtherdifference is that the amount of support at the lowest incomes is positivelyrather than negatively related to earnings. Under the current FIS structure,very high amounts are payable to those on the lowest incomes; under anEITC structure, the amounts payable are very small.
t~A refundable tax credit means thai if the tax credit is greater than the person’s tax bill, he or shewould receive a refund of the difference.
~4A limited support (7.65 per cent of earnings, up to a maximum credit of just under $6 per week)was also available to taxpayers without children, and was phased OUl at a much lower rate (7.65 perCeNt).
POLICY OPTIONS: IN-WORK BENEFITS 51
One of the main attractions of the EITC structure is that the withdrawalrate is very much lower than FIS, at 16 per cent for a I-child family andjust over 21 per cent for a 2-child family. The withdrawal rate for the initial(1975) EITC scheme was 10 per cent, but over time there have beenincreases in the level of support at low incomes, with increases in thewithdrawal rate helping to restrict the budgetary cost. A further attractionis that take-up rates for the programme appear to be high. Scholz (1994)reports estimated take-up rates of between 80 and 86 per cent. As noted inChapter 3, the high take-up is related the use of the tax system, under whichmost of the relevant taxpayers file an annual return with the US taxauthorities.
Despite these attractions, the EITC structure does not offer a clear-cutimprovement in achieving the objectives of the FIS scheme. In broadterms, it is similar to a slowly tapered FIS, offering lower levels of supportat low incomes than the current FIS scheme. The differences in structureare significant; but the most important difference is in the trade-off chosenbetween the amount of support offered at low incomes, the rate at whichthat support is withdrawn, and the budgetary cost of the scheme. If incomesupport at low income levels was to continue at the rates currently providedby FIS, the use of a low withdrawal rate would lead to a substantial increasein the numbers qualifying for support, and corresponding increases in costs.For example, FIS would currently provide of £75 per week to a 4-childfamily with earnings of £120 per week. If this support were to bewithdrawn at the rate of 21 per izent, then a 4-child family with an annualincome of over £25,000 would qualify for support.
4.4 Extending the Scope of FISAs noted earlier, the introduction of FIS was in many respects a
response to the problems posed by high replacement rates facing low-paidearners with children. But FIS can also be seen as playing a role in ensuringan adequate income for such families. It is, however, restricted to familieswith children. There is no corresponding income support to childlesscouples in work, which may partly reflect the fact that they tend to facelower replacement rates. It is of interest, therefore, to see whether theextension of the FIS scheme to provide income support to low-paid earnerswithout children could play a role in reducing poverty among thoseworking as employees.
52 SUPPLEMENTING FAMILY INCOME
Many of those below low pay thresholds (such as the lowest decile ofadult male earnings) are young single people, living in their parentalhouseholds. This results in a very limited overlap between low pay(defined on an individual basis) and poverty (defined on a household basis).Nolan (1993a) finds that the first round cash gains from a nationalminimum wage (abstracting from employment effects) would be widelyspread across the equivalent income distribution. If FIS were payable toall individuals, irrespective of family circumstances, this would havesimilar effects. But what if FIS were extended in a more limited way, toprovide income support to childless couples as well as families withchildren?
Analysis using the ESRI model suggests that the potential client poolfor such an extension of FIS would be very small. Using data and FISpolicy parameters uprated to approximate 1993 values, no more than about3,000 childless couples would appear to qualify. The sample numbers donot permit an analysis of the characteristics of this small population; but itis noteworthy that most of the individuals concerned are over 50 years ofage. In contrast to the effects of a national minimum wage the gains indisposable income under an extended FIS would accrue to those towardsthe bottom of the income distribution. Over 80 per cent of potentialexpenditure under this extension would go to tax units in the bottom 30 percent of the income distribution. Even if take-up rates were higher thanaverage for this new group, additional expenditure under the scheme wouldbe unlikely to exceed £2m in a full year.
FIS is also confined at present to low-paid employees. But there aresignificant numbers of farmers and other self-employed individuals whoare in similar circumstances to low-paid employees. It might be argued,therefore, that an extension of FIS to provide income support toself-employed individuals would be desirable. Some income support isprovided to low-income farmers and the self-employed via theunemployment assistance scheme, although the rates and structure aredifferent from those inherent in FIS. However, the implicit benefitwithdrawal rate is 100 per cent. It could be argued that a FIS-type schemefor the self-employed would improve the incentive to become, or remain,self-employed rather than unemployed; and would help to provide a"safety-net" level of income to this group similar to that provided foremployees. A major difficulty, however, is the measurement ofself-employment income which is required to identify the individuals whowould qualify for such support.

POLICY OPTIONS: IN-WORK BENEFITS 53
The self-employed were included as part of the population eligible forFIS in the UK. Income was assessed on the basis of business accounts.With the move to Family Credit, the assessment system was changed.Applicants could either provide business accounts,~5 or a simple summary
of incomings and outgoings over the 26 weeks prior to application. Theseapproaches will tend to produce differing estimates of income. It is notclear a priori which is the more appropriate for purposes of benefitassessment; but in the current UK system, the applicant is free to choosewhich is used. It is possible, therefore, that applicants will tend to use themethod which produces a lower income measure, in order to maximisetheir Family Credit payment. But this tendency may be offset by the costin terms of time and effort of producing the relevant information for eachapproach. Applicants who regularly produce standard business accountsmay claim on that basis; while others may rely on the simpler statement ofincomings and outgoings.
Whichever method, or combination of methods, is used to assessself-employment income, the issue of equity with respect to employeesarises. There are widespread concerns that self-employment income asmeasured by normal business accounting conventions for income taxpurposes does not adequately represent the command over resourcesenjoyed by self-employed individuals. The evidence on living standards atsimilar measured income levels in the ESRI Survey provides some supportfor this view. Tax liabilities for farmers and the self-employed estimatedfrom the ESRI data are higher than the actual tax payments; this suggeststhat recorded incomes for farmers and the self-employed are higher in theESRI Survey than incomes reported to the tax authorities. Despite this,comparisons of indicators of standard of living suggest that householdsheaded by a farmer or self-employed person are better off than otherhouseholds at similar measured income levels (Callan, Nolan and Whelan,1993). Thus, it would seem that income as measured for tax purposes doestend to understate the "command over resources" which is more closelyrelated to actual living standards.
There is, then, a dilemma concerning the treatment of self-employedindividuals. There are undoubtedly significant numbers of self-employedpersons whose incomes, if measured on a comparable basis to employees,would fall below the thresholds used for FIS. Restriction of FIS toemployees can, therefore, leave the incomes of some self-employed
t~lt was initially proposed that only audited accounts would be acceptable, but the requirement fora formal audit was dropped in December 1988.

54 SUPPLEMENTING FAMILY INCOME
individuals below what their entitlements would be if unemployed. On theother hand, there may be many self-employed individuals who have ahigher living standard than employees on F1S, but because of the nature ofself-employment income, and the methods used to measure it, would beable to arrange to qualify for F1S. Thus, the extension of FIS to theself-employed or farm sectors could run the risk of a large increase inexpenditure going to groups whose living standards were not adequatelyreflected by their incomes.
There is no clear resolution of this dilemma. The experience of theUK Family Credit system in dealing with the self-employed, which iscurrently under review, and the experience of the Irish social welfaresystem in dealing with low-income farmers may help to provide someguidance. Differences between the nature of employment andself-employment, and the different kinds of self-employment have to berecognised. Thus, while a F1S-type structure may be suitable for those inemployment, something more akin to the "safety-net" structure ofsmallholder’s unemployment assistance may be more appropriate to theself-employed. One must also ask if a one-period loss for anyself-employed individual is to be taken as sufficient to qualify for suchincome support. The UK system appears to allow for Family Creditpayments on the basis of a 6-month or one year period of lowself-employment income, but it is not clear that this is desirable. It couldbe argued that the level of income over a number of years may also berelevant. An enterprise might have experienced losses in the most recent6-months or year, but have given rise to a high profit over a multi-yearperiod.
4.5 ConclusionsThe interaction between the current FIS scheme, based on gross
incomes, and the income tax system can give rise to effectivetax-cum-benefit withdrawal rates of over 100 per cent. Such rates are notdesirable on any grounds, and have given rise to considerable concern. Oneway of reducing these rates, to something in the order of 80 per cent, is tobase F1S entitlements on calculations involving after-tax income. The costsof doing so were estimated at about £19m in a full year, if income limitswere to remain unchanged: this would ensure that no family could losefrom the change, and almost all would benefit to some degree. These costscould be reduced to around £9m if income limits were adjusted to take into
POLICY OPTIONS: IN-WORK BENEFITS 55
account the increase in FIS entitlements which would accrue purelybecause of PRSI deductions, under the revised scheme: a small number offamilies might lose slightly from such a change.
It may be useful to sun~marise what would and would not be achievedby such a move. First, it would remove the anomaly of effectivetax-cum-benefit withdrawal rates in excess of 100 per cent. This woulddirectly improve the incentives to increase earnings over the relevant partof the income range. It would also remove the inherent unfairness ofpenalising extra work with a reduction in disposable income. Second, itwould improve the incentive to take up employment in this range ofincome: the balance between in-work income at such levels, and out ofwork income, would be improved. Third, the aggregate increase inexpenditure would be concentrated in the middle of the incomedistribution. Fourth, the change would almost double the number offamilies entitled to FIS payments. One corollary is that the numbers facingmarginal tax rates of close to 80 per cent would be increased. It would not,therefore, eliminate the problem of high effective marginal tax rates facinglow earners. Fifth, it would not improve the incentive to take up or remainin employment for those at the lowest earnings levels.

56 SUPPLEMENTING FAMILY INCOME
Appendix 4. I UK Family Credit Scheme
Family Credit was introduced in the UK as a replacement for theFamily Income Supplement, after the implementation in 1988 of the 1986Social Security Act. As with F1S, the scheme is designed to supplementthe incomes of low-income families in full-time work with responsibilityfor at least 1 child. The benefit is available to married and unmarriedcouples and to lone parents as long as they satisfy the conditions. Theparameters of the scheme, and the general eligibility rules are set out below.
Full Time Work: In 1992, this means that the claimant or their partner (butnot both combined) must be working a total of 16 hours per week (this maybe in more than one job). For those working irregular hours, a weeklyaverage is calculated.
Reponsibilityfor a Child: The claimant, or partner, must be responsible forat least 1 child under the age of 16, or a young person aged 16-18 infull-time education up to A-level standard who is living with them as amember of their family.
Income: The amount of family credit depends on the normal earnings of thefamily plus any other income they may have coming in (whether receivedby the claimant or the partner). Income so calculated includes take-homepay, commissions, bonuses, tips, occupational or personal pensions, sickpay, some social security benefits, net weekly profits for those inself-employment (actual receipts less business expenses), and any tariffincome (income front capital- see below).
Capital: The value of any savings, investments, lunlp-sum payments andproperly (except principal residence and personal possessions) are alsorelevant to the calculation of family credit eligibility and entitlement.Capital, so defined, is treated in the following way. The first £3,000 ofcapital is ignored. For capital values between £3,000 and £8,000, £1 ofweekly tariff income is added to calculated family take-home income (asabove) for every £250 of capital - an implicit rate of return of over 20 percent. If total capital is greater than £8,000, however, the family will not beeligible for any payment.
General Eligibility Formula: If the total weekly income (so-calculated) ofeligible claimants, falls below a specific threshold (£66.60 in 1992), thefamily is entitled to the maximum family credit. This consists of an adult

POLICY OPTIONS: IN-WORK BENEFITS 57
credit (only one per family) with additional child credits for each child(dependent on the age of the child). The April 1992 rates of maximumfamily credit are shown below.
Table A.4. I: M(Lrimunz Credits under UK Family Credit Scheme. 1992
Description £ per week
Adult Credit- one per family 41.00Child Credit- for each child aged under I 1 10.40Child Credit- for each child aged I I to 15 17.25Child Credit- for each child aged 16 to 17; 21.45Child Credit- for each child aged 18" 29.90
¯ Must be in full-time education up to A-level. or equivalent, standard.
However, if income exceeds the threshold a credit withdrawal rate of 70per cent is applied to the amount of that excess. In this case,
Family Credit = Maximum Family Credit-(70 per cent of [hwome less Threshold]).
Entitlement is reviewed every 26 weeks; previously, FIS was paid for 52weeks regardless of changes in the family’s circumstances. The use of netincome as the basis for assessment was intended to overcome the worstcases of the poverty trap. Two other important aspects of the scheme arethat
(a) credits for children are consistent across the Income Supportand Family Credit schemes
(b) that the threshold for Family Credit is the same as the basicpersonal allowance for a married couple on Income Support.
These features were designed to ensure that there would be a financialincentive to accept job offers, at least if the gross weekly wage were at orabove the threshold level.

58 SUPPLEMENTING FAMILY INCOME
Appendix 4.2 Relationship between Family Creditand FIS on a Net Income Basis
The fact that Family Credit remains at a constant level below thresholdincome can be captured by a maximum payment under a FIS structure; buta net income based FIS structure without a maximum payment can beapproximated by a Family Credit structure with a sufficiently low threshold- say, zero income - and a sufficiently high adult credit. The way in whichparameters must be set to ensure equality of payments under FIS andFamily Credit can be demonstrated algebraically, as follows.
For the after-tax FIS scheme, entitlements are defined by
F1S =([Income Limit less Income After Tax] x FIS withdrawal rate)
or
FIS = (Income Limit x Withdrawal rate)- (Income After Tax x Withdrawal rate)
For the Family Credit-type scheme, the formula is
FC = Maximum Credit - (Taper x [Income after tax - Threshold])
The taper for Family Credit must be equal to the multiplier/withdrawal rateunder the FIS scheme; and, if the FC Threshold is set at 0, the formula forentitlement to Family Credit simplifies to:
FC = Maximum Credit - (Income after tax x Withdrawal rate)
From this it isclear that if the FC Maximum Credit is set equal to the FISIncome Limit times the Multiplier/withdrawal rate, the two schemes willgive identical entitlements to all cases with positive incomes.
The consistency between child credits and child dependant additionsunder income support can be achieved in a FIS structure by setting theincome limits so that the addition to the income limit per child, multipliedby the FIS multiplier/withdrawal rate, is equal to the child dependantaddition. The existing FIS income limits approximate this structure.
Chapter 5
CONCL USIONS
5.1 IntroductionIn this chapter we draw some lessons from the experience to date with
the Family Income Supplement (FIS), based on our analysis. Section 5.2pays particular attention to the scope for improvement of FIS, in two keyareas: the extent to which the scheme reaches its intended recipients, andthe high marginal tax-cum-benefit withdrawal rates which arise from theinteraction of FIS with the income tax system. In the remainder of thechapter, we set our findings in a broader context, which takes into accountthe lessons of our detailed study of FIS for the wider debate on therestructuring of child income support. Section 5.3 sets out some of the keyquestions arising in the design of a Child Benefit Supplement to replace FISand the Child Dependant Additions (CDAs) currently paid to social welfarerecipients. Many of the trade-offs involved in the design of the scheme areillustrated, building on our earlier analysis. Section 5.4 considers some ofthe implications for the broad debate on restructuring of child incomesupport, in which a "basic income for children" - an increased, non-taxablechild benefit payment sufficient to allow for the abolition of CDAs and F1S- and an "integrated child benefit" - a similar scheme, but with the childbenefit payment included in taxable income - have figured prominently.
5.2 Famib, Income SupplementThe Family Income Supplement scheme was introduced with the
primary aim of improving the balance between in-work and out-of-workincomes by providing support to low income families in employment.Over the years, increases in income limits and the FIS muhiplier have ledto greatly increased snpport for such families. There are, however, twomajor difficulties associated with the scheme. First, the rate of take-upappears to have remained stubbornly low, despite extensive efforts toimprove access to the benefit. Our estimates suggest that out of fourfamilies eligible in 1987, only one was likely to take-up the benefit.Because families with greater benefits were more likely to apply, a higherproportion of potential expenditure was likely to reach its target: perhapsup to 40 per cent. Take-up seems to have increased somewhat in the lastseven years, but not dramatically. Even on an expenditure basis, it seemslikely that take up is no higher than about 50 per cent.
59

60 SUPPLEMENTING FAMILY INCOME
The second major difficulty is that increases in the FIS multiplier,which have improved the level of support for in-work incomes, have alsoacted as increases in the rate of benefit withdrawal. Thus, the rate oftax-cure-benefit withdrawal can still exceed 100 per cent for those affectedby the marginal relief provisions of the income tax code. For those on thestandard rate of tax, the marginal rate of tax-cum-benefit withdrawal canstill exceed 90 per cent.
In this paper, we have examined the scope for improvements in the FISscheme in these two critical respects. While take-up of FIS in Irelandappears to be particularly low, experience from elsewhere suggests that themaximum take-up rate that can be expected for such benefits is well below100 per cent. The complexities and uncertainties which tend to reducetake-up may also make the scheme less effective in boosting the financialincentive to move from unemployment to employment. If a greater degreeof take-up is required, a more t’undamental change in the system ofproviding in-work benefits may be needed. This could involve using thetax system to identify those eligible for a benefit, or even, in somecircumstances, to effect a payment in a more automatic fashion.
The highest rates of tax-cum-benefit withdrawal associated with theinteraction of F1S and the income tax system could be moderated bymaking FIS assessable on the basis of net income. This would reduce themaximum tax-cure-benefit withdrawal rates from over 100 per cent toabout 80 per cent. If the level of support provided to those on the lowestincomes was not to be reduced, this would involve gains to those higher upthe income scale, and a substantial rise in the number of families eligiblefor FIS. On the basis of a constant rate of take-up, a change of this typecould cost in the order of £10m to £20m per annum, depending on thedetails of the implementation and the possible response in terms ofincreased take-up of benefit.
While the elimination tax-cum-benefit rates above 100 per cent wouldrepresent an improvement, the restrictions imposed by a combination ofFIS with the existing income tax structure must be recognised. Even if FISis assessed on a net income basis, the interaction of FIS and the currentincome tax rates would lead to effective tax-cum-benefit withdrawal ratesof the order of 75 to 80 per cent. It is not just families currently facingextreme rates of over 100 per cent who would be affected by such highrates; the total numbers affected by rates of 70 per cent or more would beincreased by such a change.

CONCLUSIONS 61
At a broader level, the analysis points to the need for a strategic viewto be taken of the desired relationship between gross and disposableincomes for those in employrnent, and the relationship between disposableincome in employment and out of employment. Implementing a desiredrelationship between disposable and gross incomes, and in-work versusout-of-work incomes, may require changes not just to the structure ofin-work benefits, but to universal benefits (such as child benefit) and theincome tax system,t Closer links between the tax and welfare systems mayalso be required. We turn to some of these wider issues in the next twosections, starting with a consideration of the recent proposal for a ChildBenefit Supplement.
5.3 Child Benefit SupplementA Government of Renewal, the policy programme agreed as part of the
formation of a new government in December 1994, states that:
We-will work towards a basic income system for children bysystematic improvements in Child Benefit, and the creation of aChild Benefit Supplement payable to all social welfare recipientsand to low and middle income fan~ilies.
The Child Benefit Supplement will eliminate some of the worstpoverty and unemployment traps in the tax and social welfaresystems.
It will replace Child Dependant Allowances currently payable tosocial welfare recipients and Family Income Supplement which iscurrently payable to very low income families (A Government ofRenewal, December 1994, p. 3 I).
While this statement falls does not spell out the precise structure of arevised child income support system, it seems that a Child BenefitSupplement (CBS) replacing both FIS and CDAs is to have a key role.Such a supplement could take many forms. Here we identify some of thecritical decisions which will have to be made in designing such asupplement; and attempt to explore some of the trade-offs which arise in
~For example, increases in personal allowances could help to reduce, and eventually eliminate therole played by income tax exemption limits. The consequent abolition of marginnl relief wouldreduce the maximum marginal efl~ctive tax rate from 108 per cent to 95 per cent.

62 SUPPLEMENTING FAMILY INCOME
making such decisions. These trade-offs are closely linked to those facedby the FIS scheme, so that much of our analysis of the issues builds on whathas been learned from studying FIS.
It is stated that the CBS will be paid to "low and middle incomefamilies", implying that it will not be paid to high income families. TheCBS must, therefore, be withdrawn over some income range or at someincome level. We work on the assumption that the supplement will bewithdrawn smoothly over a range of income, rather than abruptlywithdrawn at a particular income level: if not, it would be creating a "trap"to substitute for those it seeks to eliminate.
The key decision variables for a scheme with this structure include thefollowing:
1. What is to be the amount of the supplement?2. At what income level will .withdrawal of the supplement
begin, and at what rate will it be withdrawn?3. Is FIS to be wholly abolished, or would it have a residual role?4. How will the supplement interact with the tax system?5. Who will be eligible for the supplement?
We examine each of these issues in turn.It is stated that a Child Benefit Supplement (CBS) is to replace CDAs.
We assume that this means it is intended to fully replace CDAs. It seemssafe, therefore, to assume that the amount of the supplement would be noless than the £13.20 per child per week currently paid as a CDA on mostsocial welfare schemes. In what follows, we consider a CBS set atapproximately the current rate of CDAs, £13.20 per child per week. Thissimplifying assumption allows us to derive some preliminarymicrosimulation results using SWITCH, the ESRI tax-benefit model.2 Indoing so, we assume that take-up of the new CBS will be complete: thequestion of the likely impact on take-up is considered later. A higher levelof CBS than that assumed here would represent a greater support for those
2The key assumption is that the amounts paid to social welfare recipients remain as at present -including the higher rate for lone parents. This allows us to focus on modelling the CBS as areplacement for the FIS scheme, possibly extended to self-employed and farmers. While thisapproximation will not capture all of the features of a revised structure, it does offer some usefulinsights into the elements involved.
CONCLUSIONS 63
on low incomes, whether on welfare or in employmentl but its impact onthe absolute gap between incomes in work and incomes when unemployedwould be the same as that examined here.3
Given the level of resources to be devoted to the CBS, there will be atrade off between a low rate of withdrawal and the income level at whichwithdrawal begins. A low rate of withdrawal would depend on a relativelymodest income level for the start of benefit withdrawal.~ For example, wefind that if income withdrawal started at £9,000 per annum5, a withdrawalrate of 20 per cent could imply a cost of the order of £60m per annum, ~fthe CBS were restricted to employees and welfare recipients.6 A higherwithdrawal rate of 25 per cent could reduce this figure by about £10m perannum; a higher starting point for withdrawal, of about £ 10,000 per annum,would add about £10m to the budgetary cost. Under a 20 per cent rate ofwithdrawal, a 4-child family with an annual income of up to £23,000 wouldreceive some payment; a 25 per cent rate of withdrawal would reduce thisfigure to about £20,000.
FIS currently provides very large payments to families on very lowincomes, which help to create a gain from income when employed over andabove the income level received when unemployed. A CBS structurecannot, of itself, achieve this objective. This is illustrated in Figure 5.1,which shows, for a married couple with 4 children, the gain from incomein employment relative to the income package received when unemployed.Under the current (1994/95) income tax and welfare system the familywould receive about £171 from a combination of Long-TermUnemployment Assistance (or Unemployment Benefit) and Child Benefit:the gain in income from employment is measured relative to that level.
~An increase in CBS would, other things being equal, tend to increase the replacement rate (the ratiobetween income when unemployed and income when in employment). This is because it wouldincrease both numeralor and denominator by the same absolute amount.
alf withdrawal were not to start until a very high income level, then no matter how fasl the benefitwas withdrawn, the scheme would approximate a universal child benefit.
~r’his is the cut-off for exemption from the Health Contribution and the Employment and TrainingLevies at present.
nThis figure gives some idea of the cosl of CBS as a replacement and extension of the FIS schemefor employees; tbe possible extension to self-employed and farmers is dealt with below.

64 SUPPLEMENTING FAMILY INCOME
Figure 5. I: Gab1 or Loss in Disposable Income from Employment Earnings: 1994Structure and CbiM Benefit Sltpplernent(Married couple, I earner, 4 children)
Gain/Loss in Disposable Income from Employment"100
50
-50
-1000 50 100 150 200 250 300
Gross Income (£ per week)
Notes: Child Benefit Supplement can be set at any level, but withdrawal is assumed tobegin at £173 per week, at a rate of 20p per £ I of earnings.*The gain or loss in disposable income is measured relative to a baseline incomecomposed of Long-Term Unemployment Assistance (or UnenlploymentBenefit), including CDAs. and Child Benefit. In 1994195 this was just over£171 per week.
Under a CBS structure, the amount of income received whenunemployed will depend on the precise amount of the CBS payment; butthe gap between income when employed and when unemployed is notaffected by the size of the CBS payment, since the payment is the same forthose on welfare and at low income levels. Thus, the unemployment trapcannot be tackled by increasing the supplement to amounts higher than

CONCLUSIONS 65
what is currently paid as CDAs. The graph shows that a simple CBSscheme would not maintain the incentive to take up employment at incomelevels below about £160 per week; for smaller families, this figure wouldbe closer to £165 per week. In other words, a simple CBS scheme wouldworsen the "unemployment trap" for families where potential earningswere below this level, while improving the balance between incomesin-work and out-of-work for families with higher potential earnings, andeNminating the poverty trap at all income levels.
It is possible, however, for a modified CBS, with a residual role forFIS, to overcome the difficulties at low income levels. The CBSautomatically offers higher support than the current FIS structure tofamilies with earnings over £165 per week. A residual FIS scheme7 couldensure that the relatively small number of families below that income leveldid not suffer an income loss from the revised structure, and ensure that theincentive to take up employment at such income levels was not reduced. Itwould guarantee families earning less than this amount a payment equal to60 per cent of the gap between their income and £165, in the form of a"top-up" to their CBS payment. Since the information required to ensureassess payments of CBS would be identical to that required for residualFIS, it should be possible to administer both CBS and a residual FISscheme on the basis of a single application.
A number of interesting issues arise concerning the relationship of aCBS to the tcL~" code. First, would the CBS be taxable or non-taxable? TheCDA payments which it would replace are, at present, mostly taxable; theFIS payments which it would replace are not taxable. But the CBS isdesigned itself to be explicitly withdrawn as income increases: this wouldseem to sit more naturally with a non-taxable payment. It would not,therefore, provide a route to the integrated, taxable child benefitrecommended by NESC (1990), but represents a distinct alternative to thatstructure. There would be some loss in tax revenue associated with themovement from taxable CDAs to a non-taxable CBS.s A second issuewhich arises is whether withdrawal of the benefit would be on the basis ofgross income, or of income net of tax and PRSI deductions. Our analysisof the FIS scheme suggested some advantages in that context for a netincome basis of assessment, in ensuring that marginal effective
7A similar residual FIS scheme was considered in Callan. O’Donoghue and O’Neill (1994).
~’Fhis effect is not included in our preliminary microsimulation analysis, and would add to theexchequer cost of the CBS scheme.

66 SUPPLEMENTING FAMILY INCOME
tax-cure-benefit withdrawal rates were not excessive. If the withdrawalrate for CBS were high - say, over 40 per cent - a similar argument mightapply. But it is also possible to envisage a CBS scheme which has a lowrate of withdrawal operating on a gross income basis, without highmarginal effective tax rates: an example will be given below¯
A further issue is that families benefiting from a residual FIS schemecould find income increases subject both to FIS withdrawal at 60 per cent,and to marginal relief at 40 per cent. Given the current values of the incometax exemption limits, and a residual FIS limit of£165 per week, the number
¯ of families likely to be affected by this is small. But the possibility of suchpoverty traps could be eliminated completely by a simple restructuring ofthe child additions to income tax exemption limits. This would make theincome tax exemption limits for all families with children equal to £165 perweek.9 This would mean that the marginal tax-cure-benefit withdrawal ratecould not exceed 60 per cent plus the rate of PRSI. The highest rates wouldbe made up of a combination of residual FIS withdrawal at 60 per cent andPRSI; or of marginal relief at 40 per cent, CBS withdrawal at 20 per cent,and PRSI; but no combination with a higher effective tax rate would bepossible¯
At present, only employees working over 20 hours per week (orcouples with combined working hours above this limit) are eligible for FIS.Thus far, we have considered a CBS scheme which covers this group andsocial welfare recipients, but does not include the self-employed orfarmers. The issues involved in including self-employed and farmers in aCBS scheme are similar to those considered in relation to FIS in Section4.4. Here we may simply note that the cost implications are potentiallyimportant. We noted that a CBS of £13.20 per child, payable at incomesup to £9,000 per year and withdrawn at 20 pence in the pound thereaftercould cost about £60m if restricted to employees in the same way as FIS.If, instead, all were eligible for the CBS scheme, including self-employedand farmers, the total cost could exceed £100m per annum,m
9At present, the exemption limit for a l-child family is about £147 per week. rising to about £168for a 3-child family, and [~y about £12¯50 per child per week thereafter.
teq’he data on which the microsimulation model is based are not well-suited to estimating these costs,particularly since farm incomes were al a low point th 1986, the relevant year for the ESRI survey¯It seems likely that the indicative figures quoted in the text are somewhat conservative.
CONCLUSIONS 67
In our analysis of CBS, we have assumed that take-up is complete.Tile actual take-up of CBS could depend crucially on how the scheme isadministered. Automatic payment of the benefit through the tax system, iffeasible, might guarantee the highest rate of take-up: the issues involved aresimilar to those discussed in Section 3.5, in the context of naaking FISpayable through the tax system. Transitions from unemployment intoemployment might also be facilitated in other ways. Social welfarerecipients might retain the Child Benefit Supplement for a short periodwhen in work, until the work income could be assessed to calculate a newentitlement. This might help to improve take-up of the benefit and ensurethat it had the maximum impact on the incentive to take up employment.
What would be the likely impact ofa CBS scheme, along the lines setout here, on the balance between in-work inconles and unemploymentcompensation? If there was a residual FIS element in the scheme, therewould be little or no impact on replacement rates at earnings levels below£160: the residual FIS would ensure that the balance between in-workincomes and unemployment compensation did not become moreunfavourable to employment, but it would not be improved. Replacementrates at higher income levels would be reduced, as in-work incomes wouldbe boosted by the new CBS scheme, while incomes out of work wouldremain the same. Without the residual FIS element there would be anegative impact on the balance between employment at very low wages andunemployment compensation.
The virtual elimination of FIS would reduce the marginaltax-cure-benefit-withdrawal rates facing those currently receiving FIS. Butwithdrawal of CBS would affect a much greater number of people - ifwithdrawal began at an income of £9,000 per annum, at a rate of 20 pencein the pound, more than 60,000 families could be affected. Most of thesewould currently be facing marginal effective tax rates of between 30 and40 per cent, and would see them rise by 20 percentage points.
5.4 Child Income Support: Strategic IssuesThere appears to be a consensus that the current system of child
income support is in need of restructuring. There are, however,substantially different views of the extent of the changes needed, and thebroad shape which a reformed system might take. To a large extent thesedifferent views reflect differing weights placed on fundamental objectivessuch as the appropriate share for the community in the costs of rearing

68 SUPPLEMENTING FAMILY INCOME
children at differing income levels; the alleviation of family povertythrough direct income support; and increasing employment by improvingthe incentive to work.
Our analysis in this report, coupled with that in Callan, O’Donoghueand O’Neill (1994), has identified a menu of options from which those withwidely differing views on the balance between fundamental objectives canchoose. Some may see the current system as striking a broadly appropriatebalance between the objectives, but wish to tidy up defects relating to thelow-take up of FIS, and the "poverty trap" created by the interaction of FISand the income tax system. The most extreme forms of poverty trap relatedto FIS could certainly be cleared up by making FIS assessable on a netincome basis. This would cost in the region of £10m to £20m per annum,depending on the details of the implementation. The take-up problem ismore difficult to solve, but might be tackled by using the tax system toensure the payment of an in-work benefit. If full take-up were achieved,and FIS put on a net income basis, the total cost could be closer to £60mper annum. This figure is more relevant for comparison with other reforms,such as an integrated child benefit, which include full take-up of benefitsby the target group as a major element of a restructured system.
A "basic income for children" at about £80 per child per month - thetotal level of income support for children of welfare recipients at present -would indeed be sure to reach the intended beneficiaries. This benefitwould not be withdrawn with income, so the current difficulties of highmarginal tax rates at low earnings would also be resolved. The majordifficulty with this scheme is that it would involve a net increase inexchequer cost, allowing for savings from the abolition of CDAs, of over£400m per annum. This would require a much greater redistribution ofresources towards families with children, including those at higher levelsof income. An integrated child benefit would reduce this cost substantially,by clawing back some - though not all- of the gains from higher incomefamilies through taxation of the now substantially increased child benefit.The integrated child benefit would retain many of the advantages of a basicincome for children at a substantially lower cost - something in the orderof £220m per annum.
A Child Benefit Supplement can achieve similar improvements in thesupport for families with children at low or moderate income levels atlower budgetary cost, but with the disadvantage of a higher marginaleffective tax rate affecting substantial numbers of families. Over time, sucha structure could develop in quite distinct ways. One would lead to a "basicincome for children", either by increasing Child Benefit and reducing the
CONCLUSIONS 69
Supplement, or by extending the payment of the supplement gradually upthe income scale until it reached all families with children. This approachwould give priority to the elimination of high marginal tax rates, and to theprovision of support for families at all income levels. An alternativeapproach would give greater priority to increase the amount of thesupplement, leaving the withdrawal provisions unchanged. This wouldimprove income support at the lowest income levels, without reducing theabsolute gap between in-work and out-of work incomes, though the ratioof income replaced by total unemployment compensation package wouldrise. A middle path would involve increases in Child Benefit payments,which would increase support for families with children at all incomelevels.
Changes in the child income support system in the near future arelikely to have a long-lasting impact on the structure of the system. Ourassessment is that either an integrated child benefit, or a child benefitsupplement, could provide a system of support which represents aconsiderable improvement on what is currently in place. The choicebetween these two approaches depends, of course, on a long-term view ofthe desired balance between different objectives. But it also requires along-term view of what can be achieved under these two broad alternativestructures, and the advantages and disadvantages which they involve. Ourpresent study contributes towards an understanding of the trade-offsinvolved; and also points to fruitful areas for further consideration.

BIBLIOGRAPHY
ATKINSON, A.B., 1984. "Take-up of Social Security Benefits", ESRCProgramme on Taxation, Incentives and the Distribution of Income,Discussion Paper No. 65.
ATKINSON, A.B., and J. MICKLEWRIGHT, 1989. "Turning the Screw:Benefits for the Unemployed 1979-88" in A. Dilnot and l.Walker(eds.) The Economics of Social Security, Oxford: OUP.
ATKINSON, A.B., and H. SUTHERLAND, 1990. "Scaling the ’PovertyMountain’: Methods to Extend Incentives to All Workers", in A.Bowen and K. Mayhew (eds.) Improving Incentives for the Low-Paid,London: Macmillan.
BLACKWELL, J., 1985. "Work Incentives and the Impact of SocialWelfare Policies", Dublin Economic Workshop: Policy Conference,October.
BLACKWELL, J., 1986. Unemployment Compensation and WorkIncentives, Report to the Department of Social Welfare.
BLACKWELL, J., 1989. Family Income Supplement, Report to theDepartment of Social Welfare.
BLUNDELL, R., V. FRY and 1. WALKER, 1988. "Modelling the Take-upof Means-Tested Benefits: The Case of Housing Benefits in the UK",Economic Journal, Conference Supplement.
BOSTON, J., 1993. "Reshaping Social Policy in New Zealand", FiscalStudies, Vol. 14, pp 64-85.
CALLAN, T., 1991. Income Tax" and Welfare Reform: MicrosimulationModelling and Analysis, Dublin: The Economic and Social ResearchInstitute General Research Series Paper No. 154.
CALLAN, T., B. NOLAN and B.J. WHELAN, D.F. HANNAN with S.CREIGHTON, 1989. Poverly, Income and Welfare in Ireland, Dublin:The Economic and Social Research Institute General Research SeriesPaper No. 146.
CALLAN, T., B. NOLAN and C. WHELAN, 1993. "Resources,Deprivation and the Measurement of Poverty", Journal of SocialPolicy, Vol. 22, No. 2, pp. 141-172.
CALLAN, T., B. NOLAN and C. WHELAN, 1994. "Who are the Poor?"in B. Nolan and T. Callan (eds.) Poverty and Policy in Ireland, Dublin:Gill and Macmillan.
CALLAN, T., C. O’DONOGHUE and C. O’NEILL, 1994. Analysis ofBasic Income Schemes for Ireland, Dublin: The Economic and SocialResearch Institute Policy Research Series Paper No. 21.
7O

BIBLIOGRAPHY 7 ]
CARROLL, D., 1994. "Recent Developments in Child Income Support",Conference on Family Income Support in Ireland - 50 Years On,Department of Social Welfare/European Institute of Social Security,Dublin Castle, September.
COMPREHENSIVE PUBLIC EXPENDITURE PROGRAMMES, 1984.Dublin: Stationery Office
CORDEN, A., 1983. Taking Up a Means Tested Benefit: The Process ofClaiming Family Income Supplement, London: HMSO.
CORDEN, A., and P. CRAIG, 1991. Perceptions of Family Credit,London: HMSO.
CRAIG, P., 1991. "Costs and Benefits: A Review of Research on Take-upof Income Related Benefits", Journal of Social Policy, Vol. 20, pp.537-565.
DAVIES, C., and J. RITCHIE, 1988. Tipping the Balance: A Study ofNon-Take-Up of Benefits in an Inner City Area, London: HMSO.
DEPARTMENT OF SOCIAL SECURITY, 1991. Family IncomeSupplement Take-Up 1986-87, London: DSS Technical Note.
DILNOT, A. and S. WEBB, 1988. " The 1988 Social Security Reforms",Fiscal Studies, Vol. 9, No. I, pp. 26-53.
DORSETT, R., and C. HEADY, 1991. "The Take-Up of Means-TestedBenefits by Working Families with Children", Fiscal Studies, Vol. 12,pp. 22-32.
FEENEY, B., 1990. Social Welfare Policy and Low Pay, in B. Harvey andM. Daly (eds.) Low Pay - The Irish Experience, Dublin: CombatPoverty Agency.
FRY, V., and G. STARK, 1992. "The Takeup of Means-Tested Benefits inthe UK: The Transition to Income Support and Family Credit", paperread to conference on Social Secur#y 50 Years After Beveridge, York,27-30 September.
GRAHAM, J., 1984. Take-Up of FIS. Knowledge Attitudes and Experience- Claimants and Non-Claimants, Stormont: PPRU, Occasional PaperNo. 2.
IRELAND, 1984. Building on Reality, Dublin: Stationery Office.JOHNSON, P., G. STARK and S. WEBB, 1990. "TAXBEN2: The New
IFS Tax-Benefit Model", IFS Working Paper No. W90/5.KERR, S., 1983. Making Ends Meet: An Investigation into the
Non-Claiming of Supplementary Pensions, London: Bedford SquarePress.

72 SUPPLEMENTING FAMILY INCOME
MARSH, A., and S. McKAY, 1992. "Supplementing Low Wages", paperto conference on Social Security: 50 Years After Beveridge, York,September.
McCASHIN, T., 1988. "Family Income Support in Ireland: Trends andIssues", in B. Reynolds and S. Healy (eds.) Poverty and FumilyIncome Policy, Dublin: Conference of Major Religious Superiors.
NATIONAL ECONOMIC AND SOCIAL COUNCIL, 1979. AlternativeStrategies for Family Income Support, Dublin: Stationery Office.
NATIONAL ECONOMIC AND SOCIAL COUNCIL, 1990. A Strategyfor the Nineties, Dublin: Stationery Office.
NATIONAL ECONOMIC AND SOCIAL COUNCIL, 1993. Econo’micand Social Policy, Dublin: Stationery Office.
NOLAN, B., 1987. "More on Actual Versus Hypothetical ReplacementRatios in Ireland", The Economic and Social Review, Vol. 18, No. 3,pp. 159-172.
NOLAN, B., 1993a. Low Pay in Ireland, Dublin: The Economic and SocialResearch Institute, General Research Series Paper No. 159.
NOLAN, B., 1993b. Reforming Child Income Support, Dublin: CombatPoverty Agency
SCHOLZ, J., 1994. "The Earned Income Tax Credit: Participation,Compliance and Antipoverty Effectiveness", National Ta~r Journal,Vol. 47, No. 1, pp. 63-85.
O’MAHONY, D., 1983. "A Study of Replacement Ratios Among a Sampleof Unemployed Workers", The Economic and Social Review, Vol. 14,No. 2, pp. 77-91.
ORGANISATION FOR ECONOMIC CO-OPERATION ANDDEVELOPMENT, 1985. Economic Surveys: Ireland 1984/1985,Paris: OECD Publications.
WALKER, R. and K. ASHWORTH, 1994. Poverty Dynamics: Issues andExamples, Aldershot: Avebury.
WHELAN, B., R. BREEN, T. CALLAN and B. NOLAN, 1991. "A Studyof the Employment Possibilities of the Long-term Unemployed",Report to the Department of Labour.

THE ECONOMIC AND SOCIAL RESEARCH INSTITUTE
RECENT PUBLICATIONS BY STAFF MEMBERS(All reports are published by the Institute except where otherwise stated)
General Research Series
Lo~ Pa3, in Ireland (1993, Brian Nolan, Paper No. 159, IR£I2.O0).Alcohol Use in Ireland: Some Economic and Social Implications (1993, Denis Cormiffc arid
Daniel McCoy, Paper No. 160, IR£12.00).
Pathways to Adulthood in Ireland: Causes and Consequences of Success and Failure in TransitionsAmongst Irish Youth (1993, D. F. Hannah, S. 0 Rfain, Paper No. 161, IR£15.00).
The Financial Assets of Households in Ireland (1993, Patrick Honohan and Brian Nolan, Paper
No. 162, £12.00)., -’~Male-Female Wage Differentials: Analysis and Policy Issues (1994, Tim Callan arid Anne Wren,
Paper No. 163, IR£12.C0).Drinking Among Post-primary School Pupils (1994, Mark Morgan and Joel W. Grube, Paper No. 164,
117"£12"00)" , "Irish Interest ~ate Fluctuations in the European Monetary S)stem (1994, Patrick Honohan and Charles
Cortroy, Paper No. 165, IR£12.00).
Poverty and Time: Perspectives on the Dynamics of Poverty [1,994. Brian Nolan, Tim Callan,
Christopher T. Whelan and James Williams, Paper NO. 166, .l;R£12.00).
Broadsheet Series
An Overview of Civil Service Computerisation, 1960-1990 (1992, Robert Pye, Paper No. 26,IR£]O.O0).
The Pilot Progrararae for Integrated Rural Deveiopmenl 1988-90 (1992, Eoin O’Malley, Paper No.27. IR£10.00).
Family Problems - Substitute Care: Children in Care and Their Families (1993, Kathleen O’Higgins,Paper No. 28, IR£10.00).
Lone Parents in the Republic of Ireland: Enumeration, Description and Implications for SocialSecurity (1993, A. McCaxhin, Paper No. 29, IR£10.00).
Policy Research Series
The Economic Effects of Carban Taxes (1992, John Fllz Gerald and Daniel McCoy (eds.); Paper No.]4, IR£8.00).
European Community Lending and the Structural Funds (1992, Patrick Honohan, Paper NO. 15,
IR£7.00).Integration, Federalism and Cohesion in the European Community: Lessons from Canada (1993,
I. Frank Strain, Paper No. 16, IR£8.00).Ireland and Europe: Challenges for a New Century (1993, Rory 0’Donnell, Paper No. 17. IR£8.00).
An Examination of Irish Currency Policy (1993. Patrick Honohan, Paper No. 18, IR£8.00).Charging for Public Health Services in Ireland: Why and How? (1993, Brian Nolan, Paper No. 19,
IR£8.00).Issues in Irish Energy Policy (1993, Johl3 ~tT.. G~ra]d arid Daniel McCoy (eds.), Paper No. 20,
IR£8.00).Analysis of Basic Income Scheraesfor Ireland (1994, Tim Callan, Cathal O’Donoghue and Ciar~n
O’Neill, Paper No. 21, IR£8.00).
Waste Water Services: Charging Industry the Capital Cost (1994, S. Scott and J. Lawlor, Paper 22,IR£8.00).
Supplementing Family Income (1995, Tim Callan, Ciar’an O’Neill and Cathal O’Donoghue, Paper No.
23, LR£8.00).
Medium-Term Review
Medium-Term Review: If04-2000 (1994, S. Cantillon, J. Curtis, J. Fitz Gerald, No. 5, IR£27.50).Economic Perspectives for the Mcdiura Term (1994, S. Cantillon, J. Curds, J. Fitz Gerald (eds.),
IR£27.50).
A COMPLETE LIST OF PUBLICATIONS IS AVAILABLE FROM THE INSTITUTE
Prklled by A~JJs Pte~ Lid. 08.
Related Documents