Queensland Family & Child Commission SUPPLEMENTARY CHAPTER Australian and New Zealand child death statistics 2014 ANNUAL REPORT Deaths of children and young people Queensland 2015 — 16 Copyright © The State of Queensland (Queensland Family and Child Commission) 2017 Licence This copyright work is licensed under a Creative Commons Attribution (CC BY) 4.0 International licence. To view a copy of this licence, visit http://creativecommons.org/licenses/by/4.0/ You are free to copy, publicly communicate, reuse and adapt the work, as long as you attribute the Queensland Family and Child Commission and abide by the licence terms. Content from this report should be attributed as: The State of Queensland (Queensland Family and Child Commission): Australian and New Zealand child death statistics, 2014. For permissions beyond the scope of this licence, please contact the Commission’s Operations Program, PO Box 15217, Brisbane City East QLD 4002 or by email to [email protected]

Welcome message from author
This document is posted to help you gain knowledge. Please leave a comment to let me know what you think about it! Share it to your friends and learn new things together.
Transcript

Queensland
Family & Child
Commission
SUPPLEMENTARY CHAPTER
Australian and New Zealand
child death statistics
2014
ANNUAL REPORT
Deaths of children and young people Queensland 2015 — 16
Copyright © The State of Queensland (Queensland Family and Child Commission) 2017
Licence
This copyright work is licensed under a Creative Commons Attribution (CC BY) 4.0 International licence.
To view a copy of this licence, visit http://creativecommons.org/licenses/by/4.0/
You are free to copy, publicly communicate, reuse and adapt the work, as long as you attribute the Queensland Family and Child
Commission and abide by the licence terms. Content from this report should be attributed as: The State of Queensland (Queensland Family
and Child Commission): Australian and New Zealand child death statistics, 2014.
For permissions beyond the scope of this licence, please contact the Commission’s Operations Program, PO Box 15217, Brisbane City East
QLD 4002 or by email to [email protected]
2 Queensland Family and Child Commission
Key findings
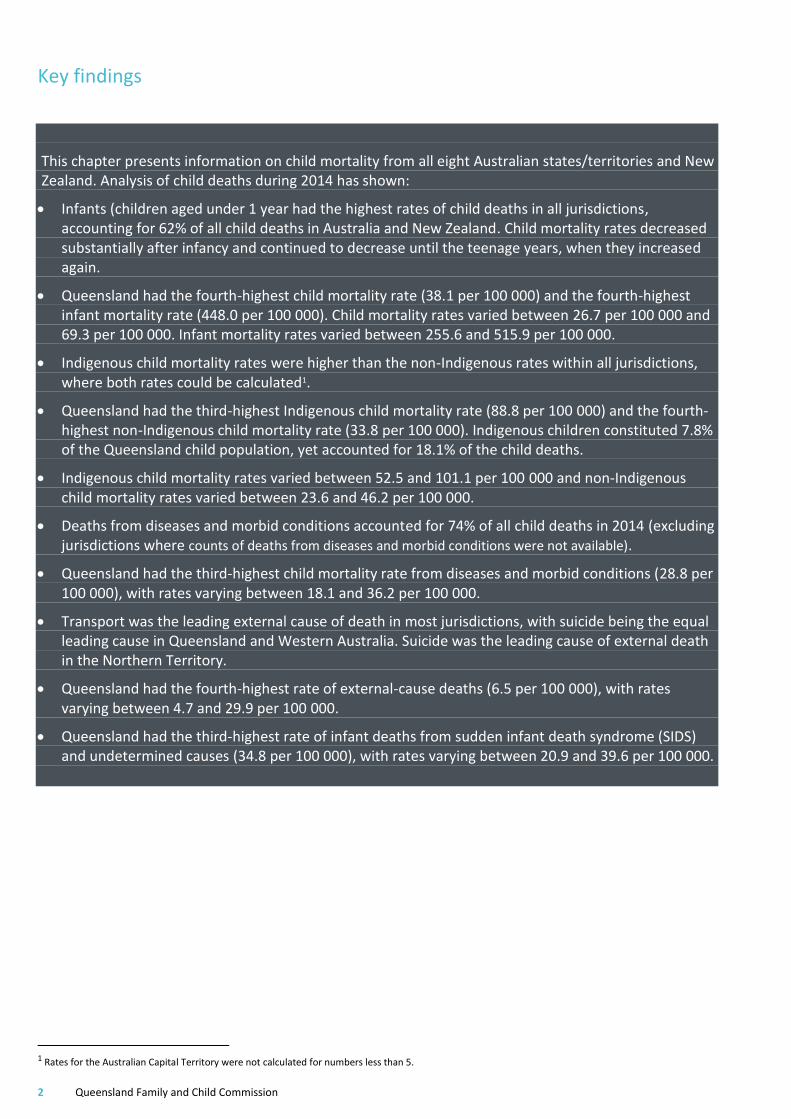
This chapter presents information on child mortality from all eight Australian states/territories and New Zealand. Analysis of child deaths during 2014 has shown:
Infants (children aged under 1 year had the highest rates of child deaths in all jurisdictions, accounting for 62% of all child deaths in Australia and New Zealand. Child mortality rates decreased substantially after infancy and continued to decrease until the teenage years, when they increased again.
Queensland had the fourth-highest child mortality rate (38.1 per 100 000) and the fourth-highest infant mortality rate (448.0 per 100 000). Child mortality rates varied between 26.7 per 100 000 and 69.3 per 100 000. Infant mortality rates varied between 255.6 and 515.9 per 100 000.
Indigenous child mortality rates were higher than the non-Indigenous rates within all jurisdictions, where both rates could be calculated1.
Queensland had the third-highest Indigenous child mortality rate (88.8 per 100 000) and the fourth-highest non-Indigenous child mortality rate (33.8 per 100 000). Indigenous children constituted 7.8% of the Queensland child population, yet accounted for 18.1% of the child deaths.
Indigenous child mortality rates varied between 52.5 and 101.1 per 100 000 and non-Indigenous child mortality rates varied between 23.6 and 46.2 per 100 000.
Deaths from diseases and morbid conditions accounted for 74% of all child deaths in 2014 (excluding jurisdictions where counts of deaths from diseases and morbid conditions were not available).
Queensland had the third-highest child mortality rate from diseases and morbid conditions (28.8 per 100 000), with rates varying between 18.1 and 36.2 per 100 000.
Transport was the leading external cause of death in most jurisdictions, with suicide being the equal leading cause in Queensland and Western Australia. Suicide was the leading cause of external death in the Northern Territory.
Queensland had the fourth-highest rate of external-cause deaths (6.5 per 100 000), with rates varying between 4.7 and 29.9 per 100 000.
Queensland had the third-highest rate of infant deaths from sudden infant death syndrome (SIDS) and undetermined causes (34.8 per 100 000), with rates varying between 20.9 and 39.6 per 100 000.
1 Rates for the Australian Capital Territory were not calculated for numbers less than 5.

Annual Report Supplementary Chapter: Australian and New Zealand child death statistics 2014
3
Australian and New Zealand child death statistics
This supplementary chapter presents information on child mortality from all eight Australian states/territories
and New Zealand. The data has been provided by members of the ANZCDR&PG who conduct child death review
and reporting within their own jurisdictions and the Department of Health, Western Australia. It should be noted
the child death review functions throughout Australia and New Zealand have individual legislative bases,
functions, roles and reporting requirements. The data prepared by these agencies currently differs in some
respects and these differences are noted in the methodology section of this chapter.
The stated aim of the ANZCDR&PG is to identify, address and potentially decrease the numbers of infant, child
and youth deaths by sharing information on issues in the review and reporting of child deaths, and to work
collaboratively towards national and international reporting. The Queensland Family and Child Commission
(QFCC) greatly appreciates the efforts of all agencies who contribute to this chapter and looks forward to
continued collaboration.
Child death data
The analysis covers deaths that occurred during the period 1 January 2014 to 31 December 2014. For Australian
jurisdictions, deaths were counted based on the jurisdiction in which they occurred, not the residency of the
deceased child. For New Zealand, the data only includes deaths of New Zealand residents within New Zealand.
All jurisdictions provided raw numbers of the deaths of all children from birth up to, but not including, 18 years of
age occurring in 2014, independent of when these deaths were registered with the Registry of Births, Deaths and
Marriages.
It is important to note that caution must be exercised when comparing rates between jurisdictions. Although the
rates are based on a population rather than a sample, common practice is to consider death a random event; and
hence, have an associated sampling error. The rates in this chapter should not be used to infer the general
probability of death for specific cohorts. This is particularly important when comparing rates from low numbers.
Current methodology calculates the crude rates for 2014, and should not be used to infer the general probability
of death for specific cohorts.
There is considerable variation between jurisdictions in the proportion of the population identified as Indigenous
(Aboriginal and Torres Strait Islander in Australia or Māori in New Zealand). As there is considerable disparity
between Indigenous and non-Indigenous child mortality rates, this affects the comparability of overall child
mortality rates. This highlights the value of presenting child death data, disaggregated by Indigenous status.
Child mortality rates in this chapter may differ from those previously published in the reports of individual
agencies, as this chapter used the most recent population estimates from the Australian Bureau of Statistics (ABS)
and Statistics New Zealand.
The methodology used in compiling the data in this chapter is outlined towards the end of this chapter.
4 Queensland Family and Child Commission
All child deaths
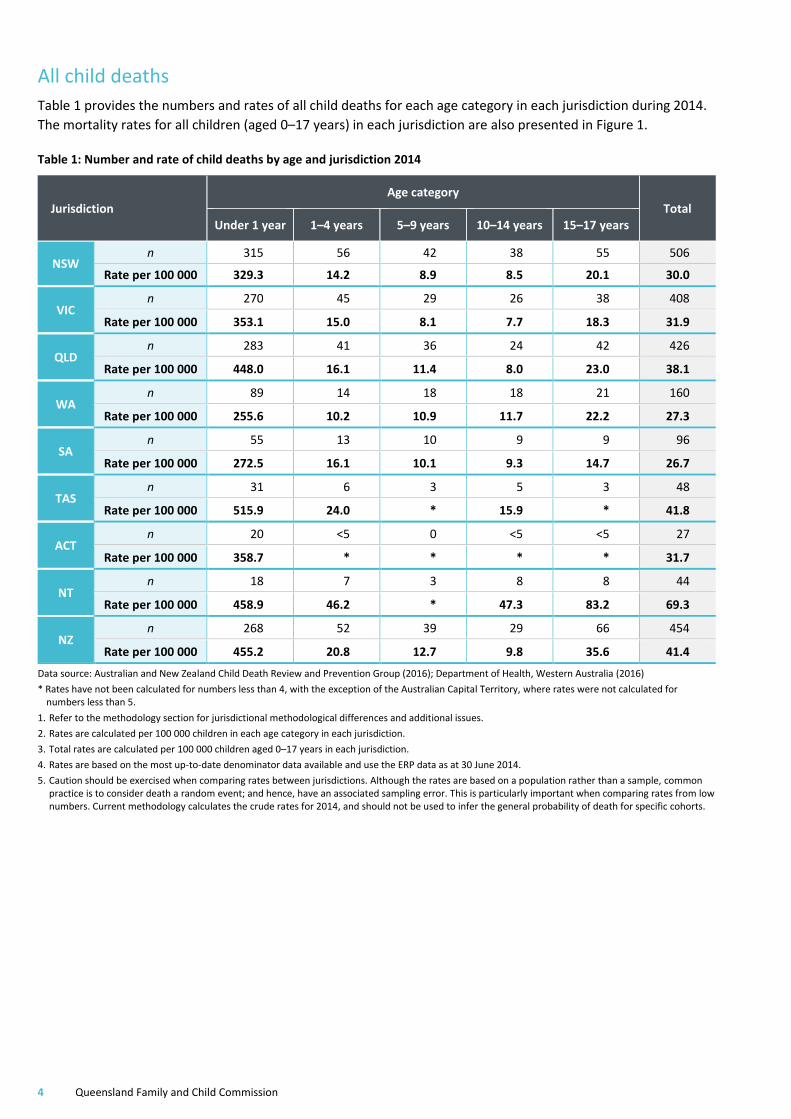
Table 1 provides the numbers and rates of all child deaths for each age category in each jurisdiction during 2014.
The mortality rates for all children (aged 0–17 years) in each jurisdiction are also presented in Figure 1.
Table 1: Number and rate of child deaths by age and jurisdiction 2014
Jurisdiction Age category
Total Under 1 year 1–4 years 5–9 years 10–14 years 15–17 years
NSW n 315 56 42 38 55 506
Rate per 100 000 329.3 14.2 8.9 8.5 20.1 30.0
VIC n 270 45 29 26 38 408
Rate per 100 000 353.1 15.0 8.1 7.7 18.3 31.9
QLD n 283 41 36 24 42 426
Rate per 100 000 448.0 16.1 11.4 8.0 23.0 38.1
WA n 89 14 18 18 21 160
Rate per 100 000 255.6 10.2 10.9 11.7 22.2 27.3
SA n 55 13 10 9 9 96
Rate per 100 000 272.5 16.1 10.1 9.3 14.7 26.7
TAS n 31 6 3 5 3 48
Rate per 100 000 515.9 24.0 * 15.9 * 41.8
ACT n 20 <5 0 <5 <5 27
Rate per 100 000 358.7 * * * * 31.7
NT n 18 7 3 8 8 44
Rate per 100 000 458.9 46.2 * 47.3 83.2 69.3
NZ n 268 52 39 29 66 454
Rate per 100 000 455.2 20.8 12.7 9.8 35.6 41.4
Data source: Australian and New Zealand Child Death Review and Prevention Group (2016); Department of Health, Western Australia (2016)
* Rates have not been calculated for numbers less than 4, with the exception of the Australian Capital Territory, where rates were not calculated for numbers less than 5.
1. Refer to the methodology section for jurisdictional methodological differences and additional issues.
2. Rates are calculated per 100 000 children in each age category in each jurisdiction.
3. Total rates are calculated per 100 000 children aged 0–17 years in each jurisdiction.
4. Rates are based on the most up-to-date denominator data available and use the ERP data as at 30 June 2014.
5. Caution should be exercised when comparing rates between jurisdictions. Although the rates are based on a population rather than a sample, common practice is to consider death a random event; and hence, have an associated sampling error. This is particularly important when comparing rates from low numbers. Current methodology calculates the crude rates for 2014, and should not be used to infer the general probability of death for specific cohorts.
Annual Report Supplementary Chapter: Australian and New Zealand child death statistics 2014
5
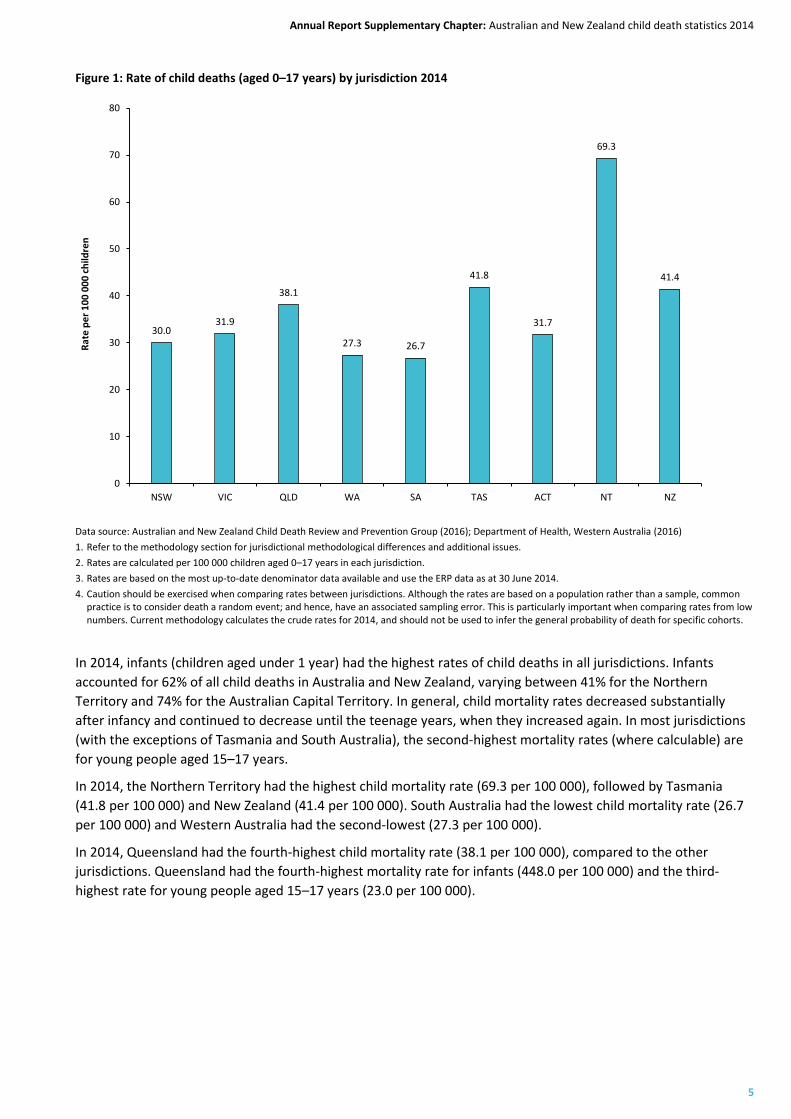
Figure 1: Rate of child deaths (aged 0–17 years) by jurisdiction 2014
Data source: Australian and New Zealand Child Death Review and Prevention Group (2016); Department of Health, Western Australia (2016)
1. Refer to the methodology section for jurisdictional methodological differences and additional issues.
2. Rates are calculated per 100 000 children aged 0–17 years in each jurisdiction.
3. Rates are based on the most up-to-date denominator data available and use the ERP data as at 30 June 2014.
4. Caution should be exercised when comparing rates between jurisdictions. Although the rates are based on a population rather than a sample, common practice is to consider death a random event; and hence, have an associated sampling error. This is particularly important when comparing rates from low numbers. Current methodology calculates the crude rates for 2014, and should not be used to infer the general probability of death for specific cohorts.
In 2014, infants (children aged under 1 year) had the highest rates of child deaths in all jurisdictions. Infants
accounted for 62% of all child deaths in Australia and New Zealand, varying between 41% for the Northern
Territory and 74% for the Australian Capital Territory. In general, child mortality rates decreased substantially
after infancy and continued to decrease until the teenage years, when they increased again. In most jurisdictions
(with the exceptions of Tasmania and South Australia), the second-highest mortality rates (where calculable) are
for young people aged 15–17 years.
In 2014, the Northern Territory had the highest child mortality rate (69.3 per 100 000), followed by Tasmania
(41.8 per 100 000) and New Zealand (41.4 per 100 000). South Australia had the lowest child mortality rate (26.7
per 100 000) and Western Australia had the second-lowest (27.3 per 100 000).
In 2014, Queensland had the fourth-highest child mortality rate (38.1 per 100 000), compared to the other
jurisdictions. Queensland had the fourth-highest mortality rate for infants (448.0 per 100 000) and the third-
highest rate for young people aged 15–17 years (23.0 per 100 000).
30.031.9
38.1
27.3 26.7
41.8
31.7
69.3
41.4
0
10
20
30
40
50
60
70
80
NSW VIC QLD WA SA TAS ACT NT NZ
Rat
e p
er
10
0 0
00
ch
ildre
n

6 Queensland Family and Child Commission
Indigenous status
There is considerable variation between jurisdictions in the proportion of the population identified as Indigenous
(Aboriginal and Torres Strait Islander in Australia or Māori in New Zealand), from 2.8% in the Australian Capital
Territory to 42.0% in the Northern Territory. Table 9 in the Methodology section provides the proportions for
each jurisdiction.
Table 2 provides the numbers and rates of child death for Indigenous and non-Indigenous children in each
jurisdiction during 2014. The mortality rates for Indigenous and non-Indigenous children in each jurisdiction are
also presented in Figure 2. This graph includes the total child mortality rates, as a reference point (initially
presented in Figure 1).
It is noted that some jurisdictions experience difficulty with the collection of child death data regarding
Indigenous status. Problems in collecting Indigenous status data for death registrations may result in an
undercount in the Indigenous death rates, limiting the comparability of the data on this aspect. Therefore, the
rates presented in Table 2 should be interpreted with caution.
Table 2: Number and rate of child deaths (aged 0–17 years) by Indigenous status and jurisdiction 2014
Jurisdiction Indigenous status
Indigenous Non-Indigenous
NSW n 48 458
Rate per 100 000 52.5 28.7
VIC n 11 397
Rate per 100 000 52.7 31.6
QLD n 77 349
Rate per 100 000 88.8 33.8
WA n 26 134
Rate per 100 000 70.2 24.5
SA n 15 81
Rate per 100 000 93.7 23.6
TAS n 7 41
Rate per 100 000 65.8 39.4
ACT n 0 27
Rate per 100 000 * 32.7
NT n 27 17
Rate per 100 000 101.1 46.2
NZ n 174 280
Rate per 100 000 62.9 34.2
Data source: Australian and New Zealand Child Death Review and Prevention Group (2016); Department of Health, Western Australia (2016)
* Rates have not been calculated for the Australian Capital Territory for numbers less than 5.
1. Refer to the methodology section for jurisdictional methodological differences and additional issues.
2. Rates are calculated per 100 000 Indigenous children aged 0–17 years and per 100 000 non-Indigenous children aged 0–17 years in each jurisdiction.
3. Rates are based on the most up-to-date denominator data available and use the ERP data as at 30 June 2014.
4. Caution should be exercised when comparing rates between jurisdictions. Although the rates are based on a population rather than a sample, common practice is to consider death a random event; and hence, have an associated sampling error. This is particularly important when comparing rates from low numbers. Current methodology calculates the crude rates for 2014, and should not be used to infer the general probability of death for specific cohorts.

Annual Report Supplementary Chapter: Australian and New Zealand child death statistics 2014
7
Figure 2: Rate of child deaths (aged 0–17 years) by Indigenous status and jurisdiction 2014
Data source: Australian and New Zealand Child Death Review and Prevention Group (2016); Department of Health, Western Australia (2016)
* Rates have not been calculated for the Australian Capital Territory for numbers less than 5.
1. Refer to the methodology section for jurisdictional methodological differences and additional issues.
2. Rates are calculated per 100 000 Indigenous children aged 0–17 years and per 100 000 non-Indigenous children aged 0–17 years in each jurisdiction.
3. Rates are based on the most up-to-date denominator data available and use the ERP data as at 30 June 2014.
4. Caution should be exercised when comparing rates between jurisdictions. Although the rates are based on a population rather than a sample, common practice is to consider death a random event, and hence have an associated sampling error. This is particularly important when comparing rates from low numbers. Current methodology calculates the crude rates for 2013, and should not be used to infer the general probability of death for specific cohorts.
In 2014, Indigenous child mortality rates were higher than the non-Indigenous rates, within all jurisdictions where
both rates could be calculated. Within Australia, Aboriginal and Torres Strait Islander children constituted 5.5% of
the child population, yet accounted for 12.3% of the child deaths (211 of 1 715 deaths). Within New Zealand,
Māori children constituted 25.2% of the child population, yet accounted for 38.3% of the child deaths (174 of 454
deaths).
In 2014, the Northern Territory had the highest Indigenous child mortality rate (101.1 per 100 000), followed by
South Australia (93.7 per 100 000). New South Wales had the lowest Indigenous child mortality rate (52.5 per
100 000) and Victoria had the second-lowest (52.7 per 100 000).
The Northern Territory had the highest non-Indigenous child mortality rate (46.2 per 100 000), followed by
Tasmania (39.4 per 100 000). South Australia had the lowest non-Indigenous child mortality rate (23.6 per
100 000) and Western Australia had the second-lowest (24.5 per 100 000).
In 2014, Queensland had the third-highest Indigenous child mortality rate (88.8 per 100 000) and the fourth-
highest non-Indigenous child mortality rate (33.8 per 100 000), compared to the other jurisdictions. Aboriginal
and Torres Strait Islander children constituted 7.8% of the child population, yet accounted for 18.1% of the child
deaths (77 of 426 deaths).
30
.0
52
.5
28
.731
.9
52
.7
31
.6
38
.1
88
.8
33
.8
27
.3
70
.2
24
.526
.7
93
.7
23
.6
41
.8
65
.8
39
.4
31
.7
32
.7
69
.3
10
1.1
46
.2
41
.4
62
.9
34
.2
0
20
40
60
80
100
120
All children Indigenous children Non-Indigenous children
Rat
e p
er
10
0 0
00
ch
ildre
n
NSW VIC QLD WA SA
TAS ACT NT NZ
8 Queensland Family and Child Commission
Sex
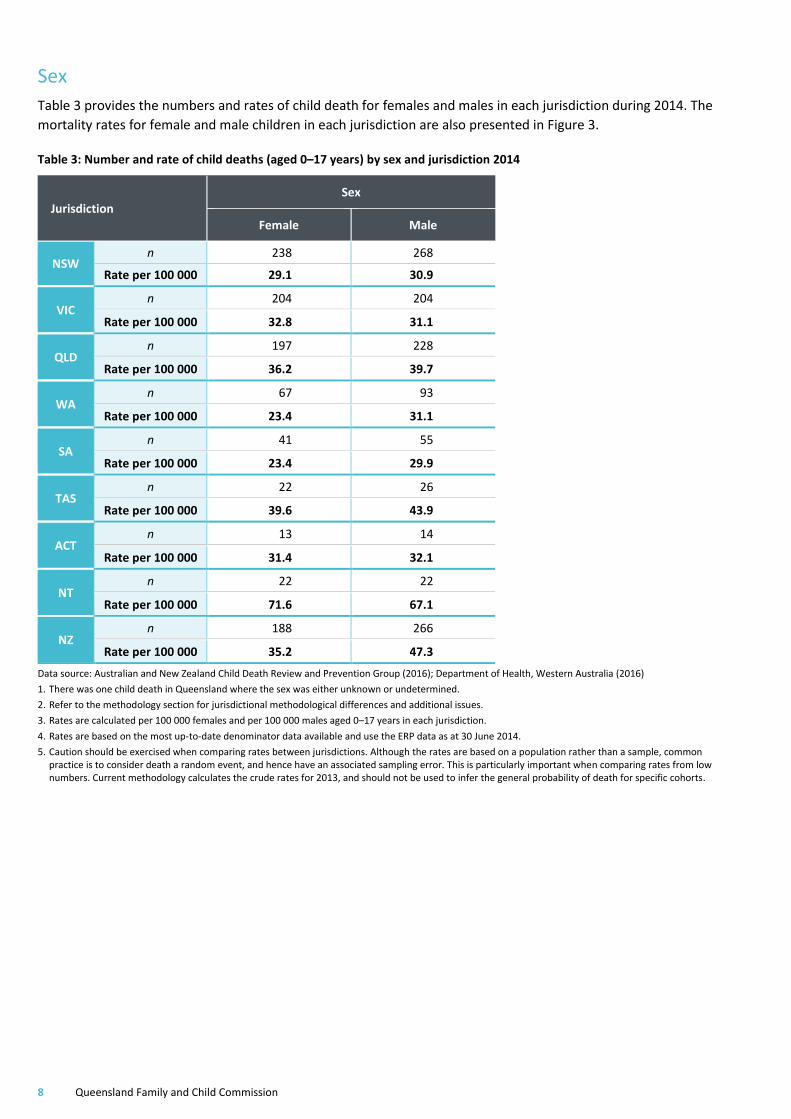
Table 3 provides the numbers and rates of child death for females and males in each jurisdiction during 2014. The
mortality rates for female and male children in each jurisdiction are also presented in Figure 3.
Table 3: Number and rate of child deaths (aged 0–17 years) by sex and jurisdiction 2014
Jurisdiction Sex
Female Male
NSW n 238 268
Rate per 100 000 29.1 30.9
VIC n 204 204
Rate per 100 000 32.8 31.1
QLD n 197 228
Rate per 100 000 36.2 39.7
WA n 67 93
Rate per 100 000 23.4 31.1
SA n 41 55
Rate per 100 000 23.4 29.9
TAS n 22 26
Rate per 100 000 39.6 43.9
ACT n 13 14
Rate per 100 000 31.4 32.1
NT n 22 22
Rate per 100 000 71.6 67.1
NZ n 188 266
Rate per 100 000 35.2 47.3
Data source: Australian and New Zealand Child Death Review and Prevention Group (2016); Department of Health, Western Australia (2016)
1. There was one child death in Queensland where the sex was either unknown or undetermined.
2. Refer to the methodology section for jurisdictional methodological differences and additional issues.
3. Rates are calculated per 100 000 females and per 100 000 males aged 0–17 years in each jurisdiction.
4. Rates are based on the most up-to-date denominator data available and use the ERP data as at 30 June 2014.
5. Caution should be exercised when comparing rates between jurisdictions. Although the rates are based on a population rather than a sample, common practice is to consider death a random event, and hence have an associated sampling error. This is particularly important when comparing rates from low numbers. Current methodology calculates the crude rates for 2013, and should not be used to infer the general probability of death for specific cohorts.
Annual Report Supplementary Chapter: Australian and New Zealand child death statistics 2014
9
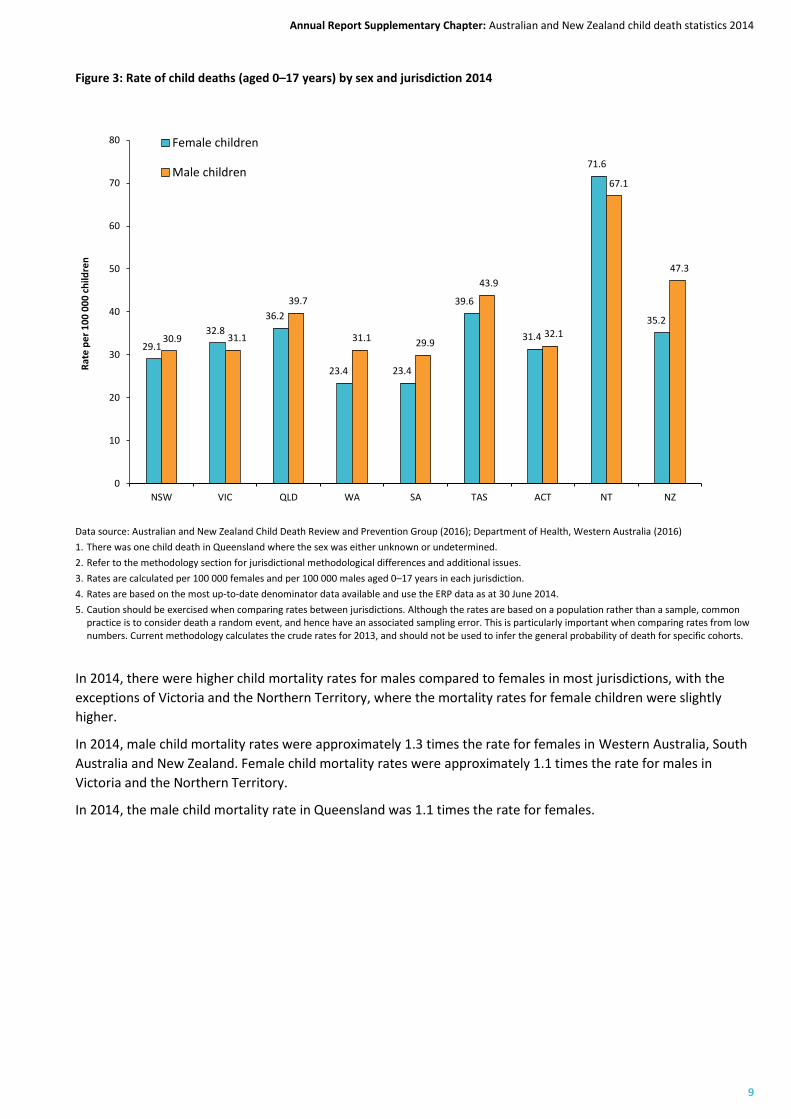
Figure 3: Rate of child deaths (aged 0–17 years) by sex and jurisdiction 2014
Data source: Australian and New Zealand Child Death Review and Prevention Group (2016); Department of Health, Western Australia (2016)
1. There was one child death in Queensland where the sex was either unknown or undetermined.
2. Refer to the methodology section for jurisdictional methodological differences and additional issues.
3. Rates are calculated per 100 000 females and per 100 000 males aged 0–17 years in each jurisdiction.
4. Rates are based on the most up-to-date denominator data available and use the ERP data as at 30 June 2014.
5. Caution should be exercised when comparing rates between jurisdictions. Although the rates are based on a population rather than a sample, common practice is to consider death a random event, and hence have an associated sampling error. This is particularly important when comparing rates from low numbers. Current methodology calculates the crude rates for 2013, and should not be used to infer the general probability of death for specific cohorts.
In 2014, there were higher child mortality rates for males compared to females in most jurisdictions, with the
exceptions of Victoria and the Northern Territory, where the mortality rates for female children were slightly
higher.
In 2014, male child mortality rates were approximately 1.3 times the rate for females in Western Australia, South
Australia and New Zealand. Female child mortality rates were approximately 1.1 times the rate for males in
Victoria and the Northern Territory.
In 2014, the male child mortality rate in Queensland was 1.1 times the rate for females.
29.1
32.8
36.2
23.4 23.4
39.6
31.4
71.6
35.2
30.9 31.1
39.7
31.1 29.9
43.9
32.1
67.1
47.3
0
10
20
30
40
50
60
70
80
NSW VIC QLD WA SA TAS ACT NT NZ
Rat
e p
er
10
0 0
00
ch
ildre
n
Female children
Male children

10 Queensland Family and Child Commission
Deaths from diseases and morbid conditions
Deaths from diseases and morbid conditions are those deaths whose underlying cause is an infection, disease,
congenital anomaly or other naturally-occurring condition. This category excludes deaths from SIDS and
undetermined causes (within this supplementary chapter only).2
Table 4 provides the numbers and rates of child deaths from diseases and morbid conditions for each age
category in each jurisdiction during 2014. The mortality rates from diseases and morbid conditions for all children
(aged 0–17 years) in each jurisdiction are also presented in Figure 4.
Table 4: Number and rate of child deaths from diseases and morbid conditions by age and jurisdiction 2014
Jurisdiction Age category
Total Under 1 year 1–4 years 5–9 years 10–14 years 15–17 years
NSW n 265 39 31 25 24 384
Rate per 100 000 277.0 9.9 6.5 5.6 8.8 22.8
VIC n 249 28 20 15 14 326
Rate per 100 000 325.7 9.3 5.6 4.5 6.7 25.5
QLD n 248 25 24 10 15 322
Rate per 100 000 392.6 9.8 7.6 3.3 8.2 28.8
WA n - - - - - -
Rate per 100 000 - - - - - -
SA n 47 4 7 5 2 65
Rate per 100 000 232.8 4.9 7.0 5.1 * 18.1
TAS n 27 2 3 3 0 35
Rate per 100 000 449.3 * * * * 30.5
ACT n 20 0 0 <5 <5 24
Rate per 100 000 358.7 * * * * 28.2
NT n 17 4 0 2 0 23
Rate per 100 000 433.5 26.4 * * * 36.2
NZ n 218 32 24 11 20 305
Rate per 100 000 370.2 12.8 7.8 3.7 10.8 27.8
Data source: Australian and New Zealand Child Death Review and Prevention Group (2016)
* Rates have not been calculated for numbers less than 4, with the exception of the Australian Capital Territory, where rates were not calculated for numbers less than 5.
1. Data for deaths from diseases and morbid conditions was not available for Western Australia.
2. In some jurisdictions, the Coroner is yet to determine the official cause of death for some cases and these deaths are not included in Tables 4, 5 or 6. In some instances these deaths have been included, but the data is based on general information regarding the circumstances of death. Hence, the overall numbers and rates are subject to change.
3. Refer to the methodology section for jurisdictional methodological differences and additional issues.
4. Rates are calculated per 100 000 children in each age category in each jurisdiction.
5. Total rates are calculated per 100 000 children aged 0–17 years in each jurisdiction.
6. Rates are based on the most up-to-date denominator data available and use the ERP data as at 30 June 2014.
7. Caution should be exercised when comparing rates between jurisdictions. Although the rates are based on a population rather than a sample, common practice is to consider death a random event; and hence, have an associated sampling error. This is particularly important when comparing rates from low numbers. Current methodology calculates the crude rates for 2014, and should not be used to infer the general probability of death for specific cohorts.
2 The QFCC normally include SIDS and undetermined causes within diseases and morbid conditions (classified as unexplained diseases and morbid
conditions). For inter-jurisdictional comparability of data in this supplementary chapter, deaths from SIDS and undetermined causes have been excluded from deaths due to diseases and morbid conditions.

Annual Report Supplementary Chapter: Australian and New Zealand child death statistics 2014
11
Figure 4: Rate of child deaths (aged 0–17 years) from diseases and morbid conditions by jurisdiction 2014
Data source: Australian and New Zealand Child Death Review and Prevention Group (2016)
1. Data for deaths from diseases and morbid conditions was not available for Western Australia.
2. In some jurisdictions, the Coroner is yet to determine the official cause of death for some cases and these deaths are not included in Tables 4, 5 or 6. In some instances these deaths have been included, but the data is based on general information regarding the circumstances of death. Hence, the overall numbers and rates are subject to change.
3. Refer to the methodology section for jurisdictional methodological differences and additional issues.
4. Rates are calculated per 100 000 children aged 0–17 years in each jurisdiction.
5. Rates are based on the most up-to-date denominator data available and use the ERP data as at 30 June 2014.
6. Caution should be exercised when comparing rates between jurisdictions. Although the rates are based on a population rather than a sample, common practice is to consider death a random event, and hence have an associated sampling error. This is particularly important when comparing rates from low numbers. Current methodology calculates the crude rates for 2013, and should not be used to infer the general probability of death for specific cohorts.
In 2014, infants (children aged under 1 year) exhibited the highest mortality rate from diseases and morbid
conditions in all jurisdictions. Infants accounted for 74% of all child deaths from diseases and morbid conditions in
Australia and New Zealand (Western Australia excluded), varying between 69% for New South Wales and 84% for
the Australian Capital Territory.
In 2014, the Northern Territory had the highest child mortality rate from diseases and morbid conditions (36.2 per
100 000), followed by Tasmania (30.5 per 100 000). South Australia had the lowest child mortality rate from
diseases and morbid conditions (18.1 per 100 000) and New South Wales had the second-lowest (22.8 per
100 000).
In 2014, Queensland had the third-highest infant and child mortality rates from diseases and morbid conditions
(392.6 per 100 000 and 28.8 per 100 000, respectively).
Deaths from diseases and morbid conditions accounted for 74% of all child deaths in 2014 (excluding Western
Australia, where counts of deaths from diseases and morbid conditions were not available). Hence the inter-
jurisdictional differences for deaths from diseases and morbid conditions are similar to those observed for all
child deaths.
22.8
25.5
28.8
18.1
30.5
28.2
36.2
27.8
0
5
10
15
20
25
30
35
40
NSW VIC QLD WA SA TAS ACT NT NZ
Rat
e p
er
10
0 0
00
ch
ildre
n
12 Queensland Family and Child Commission
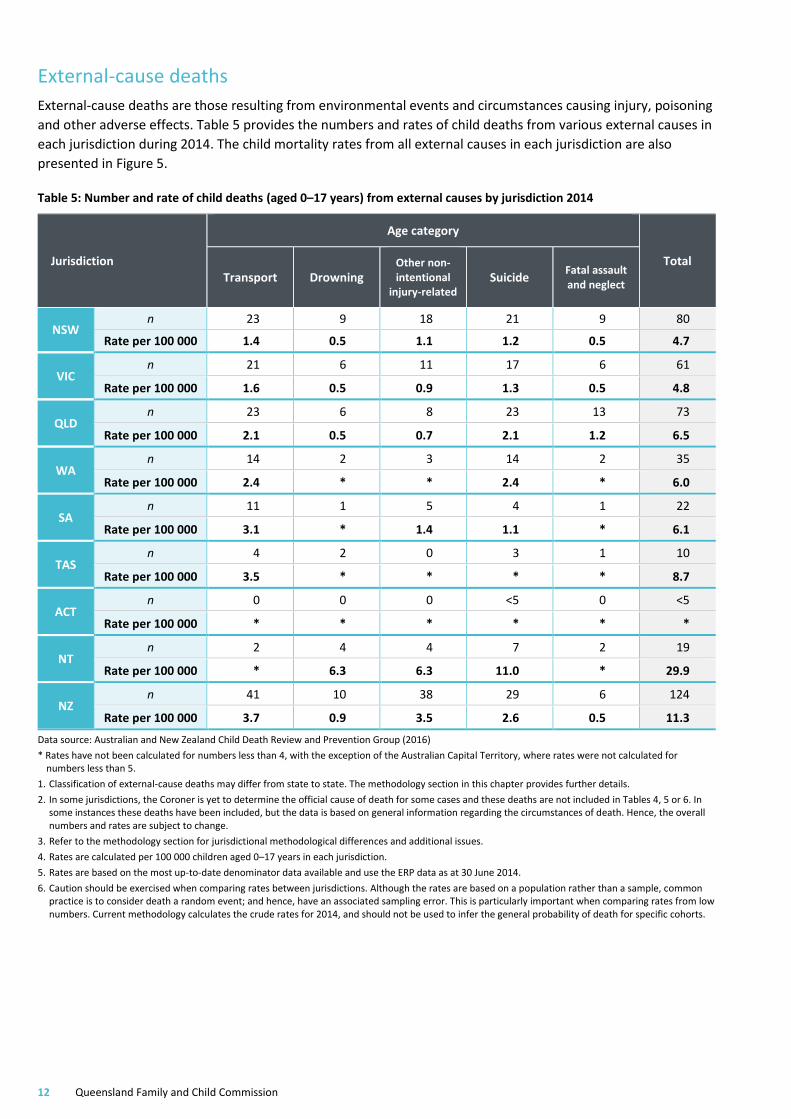
External-cause deaths
External-cause deaths are those resulting from environmental events and circumstances causing injury, poisoning
and other adverse effects. Table 5 provides the numbers and rates of child deaths from various external causes in
each jurisdiction during 2014. The child mortality rates from all external causes in each jurisdiction are also
presented in Figure 5.
Table 5: Number and rate of child deaths (aged 0–17 years) from external causes by jurisdiction 2014
Jurisdiction
Age category
Total Transport Drowning
Other non-intentional
injury-related Suicide
Fatal assault and neglect
NSW n 23 9 18 21 9 80
Rate per 100 000 1.4 0.5 1.1 1.2 0.5 4.7
VIC n 21 6 11 17 6 61
Rate per 100 000 1.6 0.5 0.9 1.3 0.5 4.8
QLD n 23 6 8 23 13 73
Rate per 100 000 2.1 0.5 0.7 2.1 1.2 6.5
WA n 14 2 3 14 2 35
Rate per 100 000 2.4 * * 2.4 * 6.0
SA n 11 1 5 4 1 22
Rate per 100 000 3.1 * 1.4 1.1 * 6.1
TAS n 4 2 0 3 1 10
Rate per 100 000 3.5 * * * * 8.7
ACT n 0 0 0 <5 0 <5
Rate per 100 000 * * * * * *
NT n 2 4 4 7 2 19
Rate per 100 000 * 6.3 6.3 11.0 * 29.9
NZ n 41 10 38 29 6 124
Rate per 100 000 3.7 0.9 3.5 2.6 0.5 11.3
Data source: Australian and New Zealand Child Death Review and Prevention Group (2016)
* Rates have not been calculated for numbers less than 4, with the exception of the Australian Capital Territory, where rates were not calculated for numbers less than 5.
1. Classification of external-cause deaths may differ from state to state. The methodology section in this chapter provides further details.
2. In some jurisdictions, the Coroner is yet to determine the official cause of death for some cases and these deaths are not included in Tables 4, 5 or 6. In some instances these deaths have been included, but the data is based on general information regarding the circumstances of death. Hence, the overall numbers and rates are subject to change.
3. Refer to the methodology section for jurisdictional methodological differences and additional issues.
4. Rates are calculated per 100 000 children aged 0–17 years in each jurisdiction.
5. Rates are based on the most up-to-date denominator data available and use the ERP data as at 30 June 2014.
6. Caution should be exercised when comparing rates between jurisdictions. Although the rates are based on a population rather than a sample, common practice is to consider death a random event; and hence, have an associated sampling error. This is particularly important when comparing rates from low numbers. Current methodology calculates the crude rates for 2014, and should not be used to infer the general probability of death for specific cohorts.

Annual Report Supplementary Chapter: Australian and New Zealand child death statistics 2014
13
Figure 5: Rate of child deaths (aged 0–17 years) from external causes by jurisdiction 2014
Data source: Australian and New Zealand Child Death Review and Prevention Group (2016)
* Rates have not been calculated for the Australian Capital Territory, for numbers less than 5.
1. Classification of external-cause deaths may differ from state to state. The methodology section in Appendix 10.1 provides further details.
2. In some jurisdictions, the Coroner is yet to determine the official cause of death for some cases and these deaths are not included in Tables 4, 5 or 6. In some instances these deaths have been included, but the data is based on general information regarding the circumstances of death. Hence, the overall numbers and rates are subject to change.
3. Refer to the methodology section for jurisdictional methodological differences and additional issues.
4. Rates are calculated per 100 000 children aged 0–17 years in each jurisdiction.
5. Rates are based on the most up-to-date denominator data available and use the ERP data as at 30 June 2014.
6. Caution should be exercised when comparing rates between jurisdictions. Although the rates are based on a population rather than a sample, common practice is to consider death a random event, and hence have an associated sampling error. This is particularly important when comparing rates from low numbers. Current methodology calculates the crude rates for 2013, and should not be used to infer the general probability of death for specific cohorts.
In 2014, transport was the leading external cause of death in most jurisdictions, with suicide being the equal
leading cause in Queensland and Western Australia. Suicide was the leading external cause of death in the
Northern Territory.
In 2014, the Northern Territory had the highest rate of external-cause deaths (29.9 per 100 000), followed by New
Zealand (11.3 per 100 000). New South Wales had the lowest rate of external-cause deaths (4.7 per 100 000) and
Victoria had the second-lowest (4.8 per 100 000).
In 2014, Queensland had the fourth-highest rate of external-cause deaths (6.5 per 100 000), compared to the
other jurisdictions. Queensland exhibited the highest mortality rate from fatal assault and neglect (1.2 per
100 000) and the third-highest suicide mortality rate (2.1 per 100 000). For transport, drowning and other non-
intentional injury-related deaths, Queensland exhibited mid-range child mortality rates, in terms of rank and
value.
4.7 4.8
6.56.0 6.1
8.7
29.9
11.3
0
5
10
15
20
25
30
35
NSW VIC QLD WA SA TAS ACT NT NZ
Rat
e p
er
10
0 0
00
ch
ildre
n

14 Queensland Family and Child Commission
Deaths from SIDS and undetermined causes
Table 6 provides the numbers and rates of child deaths from sudden infant death syndrome (SIDS) and
undetermined causes for each age category in each jurisdiction during 2014. The rates of death for infants
(children aged under 1 year) from SIDS and undetermined causes in each jurisdiction are also presented in Figure
6.
Table 6: Number and rate of child deaths from SIDS and undetermined causes by age and jurisdiction 2014
Jurisdiction
Age category
Total Under 1
year 1–4
years 5–9
years 10–14 years
15–17 years
1–17 years
NSW n 33 1 0 1 0 2 35
Rate per 100 000 34.5 * * * * * 2.1
VIC n 16 ≤5 ≤5 ≤5 0 ≤5 20
Rate per 100 000 20.9 * * * * - 1.6
QLD n 22 1 0 0 1 2 24
Rate per 100 000 34.8 * * * * * 2.1
WA n 13 0 0 0 1 1 14
Rate per 100 000 37.3 * * * * * 2.4
SA n 8 1 0 0 0 1 9
Rate per 100 000 39.6 * * * * * 2.5
TAS n 3 0 0 0 0 0 3
Rate per 100 000 * * * * * * *
ACT n 0 <5 0 0 0 0 <5
Rate per 100 000 * * * * * * *
NT n 2 0 0 0 0 0 2
Rate per 100 000 * * * * * * *
NZ n 18 2 0 2 1 5 23
Rate per 100 000 30.6 * * * * 0.5 2.1
Data source: Australian and New Zealand Child Death Review and Prevention Group (2016)
* Rates have not been calculated for numbers less than 4, with the exception of Victoria, where rates were not calculated for numbers less than or equal to 5 and the Australian Capital Territory, where rates were not calculated for numbers less than 5.
1. Classification of external-cause deaths may differ from state to state. The methodology section in this chapter provides further details.
2. In some jurisdictions, the Coroner is yet to determine the official cause of death for some cases and these deaths are not included in Tables 4, 5 or 6. In some instances these deaths have been included, but the data is based on general information regarding the circumstances of death. Hence, the overall numbers and rates are subject to change.
3. Refer to the methodology section for jurisdictional methodological differences and additional issues.
4. Rates are calculated per 100 000 children in each age category in each jurisdiction.
5. Total rates are calculated per 100 000 children aged 0–17 years in each jurisdiction.
6. Rates are based on the most up-to-date denominator data available and use the ERP data as at 30 June 2014.
7. Caution should be exercised when comparing rates between jurisdictions. Although the rates are based on a population rather than a sample, common practice is to consider death a random event; and hence, have an associated sampling error. This is particularly important when comparing rates from low numbers. Current methodology calculates the crude rates for 2014, and should not be used to infer the general probability of death for specific cohorts.
Annual Report Supplementary Chapter: Australian and New Zealand child death statistics 2014
15
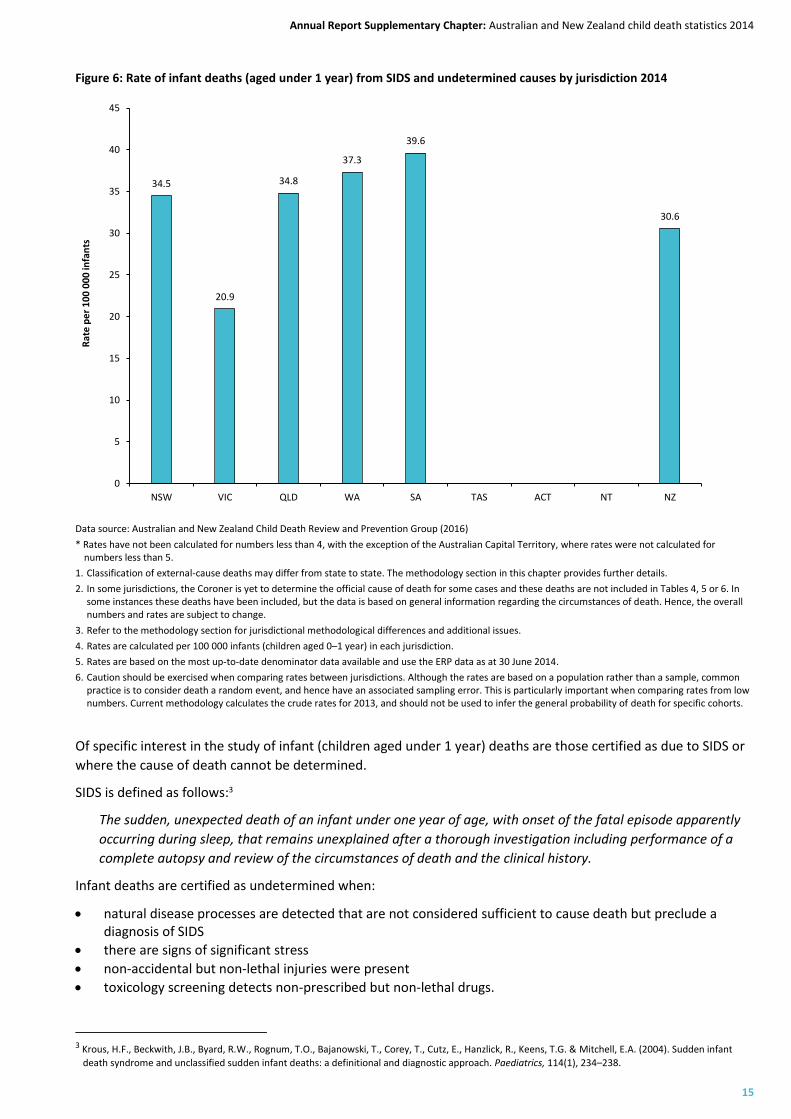
Figure 6: Rate of infant deaths (aged under 1 year) from SIDS and undetermined causes by jurisdiction 2014
Data source: Australian and New Zealand Child Death Review and Prevention Group (2016)
* Rates have not been calculated for numbers less than 4, with the exception of the Australian Capital Territory, where rates were not calculated for numbers less than 5.
1. Classification of external-cause deaths may differ from state to state. The methodology section in this chapter provides further details.
2. In some jurisdictions, the Coroner is yet to determine the official cause of death for some cases and these deaths are not included in Tables 4, 5 or 6. In some instances these deaths have been included, but the data is based on general information regarding the circumstances of death. Hence, the overall numbers and rates are subject to change.
3. Refer to the methodology section for jurisdictional methodological differences and additional issues.
4. Rates are calculated per 100 000 infants (children aged 0–1 year) in each jurisdiction.
5. Rates are based on the most up-to-date denominator data available and use the ERP data as at 30 June 2014.
6. Caution should be exercised when comparing rates between jurisdictions. Although the rates are based on a population rather than a sample, common practice is to consider death a random event, and hence have an associated sampling error. This is particularly important when comparing rates from low numbers. Current methodology calculates the crude rates for 2013, and should not be used to infer the general probability of death for specific cohorts.
Of specific interest in the study of infant (children aged under 1 year) deaths are those certified as due to SIDS or
where the cause of death cannot be determined.
SIDS is defined as follows:3
The sudden, unexpected death of an infant under one year of age, with onset of the fatal episode apparently
occurring during sleep, that remains unexplained after a thorough investigation including performance of a
complete autopsy and review of the circumstances of death and the clinical history.
Infant deaths are certified as undetermined when:
natural disease processes are detected that are not considered sufficient to cause death but preclude a diagnosis of SIDS
there are signs of significant stress
non-accidental but non-lethal injuries were present
toxicology screening detects non-prescribed but non-lethal drugs.
3 Krous, H.F., Beckwith, J.B., Byard, R.W., Rognum, T.O., Bajanowski, T., Corey, T., Cutz, E., Hanzlick, R., Keens, T.G. & Mitchell, E.A. (2004). Sudden infant
death syndrome and unclassified sudden infant deaths: a definitional and diagnostic approach. Paediatrics, 114(1), 234–238.
34.5
20.9
34.8
37.3
39.6
30.6
0
5
10
15
20
25
30
35
40
45
NSW VIC QLD WA SA TAS ACT NT NZ
Rat
e p
er
10
0 0
00
infa
nts
16 Queensland Family and Child Commission
In 2014, South Australia had the highest rate of infant deaths from SIDS and undetermined causes (39.6 per
100 000), followed by Western Australia (37.3 per 100 000). Victoria had the lowest rate of infant deaths from
SIDS and undetermined causes (20.9 per 100 000) and New Zealand had the second-lowest (30.6 per 100 000).
Annual Report Supplementary Chapter: Australian and New Zealand child death statistics 2014
17
Methodology
Data sources
Jurisdictional mortality statistics have been provided by the following member teams and committees of the
ANZCDR&PG:
New South Wales Child Death Review Team, NSW Ombudsman
Victorian Consultative Council on Obstetric and Paediatric Mortality and Morbidity
QFCC
Ombudsman Western Australia
South Australian Child Death and Serious Injury Review Committee
Tasmanian Council of Obstetric and Paediatric Mortality and Morbidity
Australian Capital Territory Children and Young People Death Review Committee
Northern Territory Child Deaths Review and Prevention Committee
New Zealand Child and Youth Mortality Review Committee.
The Department of Health, Western Australia also provided data.
Analysis period
The analysis covers deaths that occurred during the period 1 January 2014 to 31 December 2014.
Date of death and place of residence
All jurisdictions provided raw numbers of the deaths of all children from birth up to, but not including, 18 years of
age occurring in 2014, independent of when these deaths were registered with the Registry of Births, Deaths and
Marriages.
Recording deaths based on the jurisdiction in which they occurred can have an impact on rates of deaths. Rates of
death in South Australia, for example, may be artificially inflated by the number of deaths of residents from
surrounding areas of the Northern Territory occurring within South Australian boundaries. A similar situation is
also known to occur between the Australian Capital Territory and New South Wales.
New Zealand data relates to the deaths of New Zealand residents (identified by usual place of residence, rather
than legal status as a New Zealand resident) that occur within New Zealand.
Population data
The population figures used in the analysis are estimated resident populations (ERP) for each jurisdiction, as at
June 2014. To ensure comparability of child death rates between jurisdictions, all rates have been calculated on
this population data, and therefore may differ from those previously published in the reports of individual
agencies.
It is important to note that caution should be exercised when comparing rates between jurisdictions. Although
the rates are based on a population rather than a sample, common practice is to consider death a random event;
and hence, have an associated sampling error. This is particularly important when comparing rates from low
numbers. Current methodology calculates the crude rates for 2014, and should not be used to infer the general
probability of death for specific cohorts.4
4 Rates presented here are crude rates rather than adjusted rates as used in some jurisdictions, and may also account for some differences between the
rates published here and those published in other reports.
18 Queensland Family and Child Commission
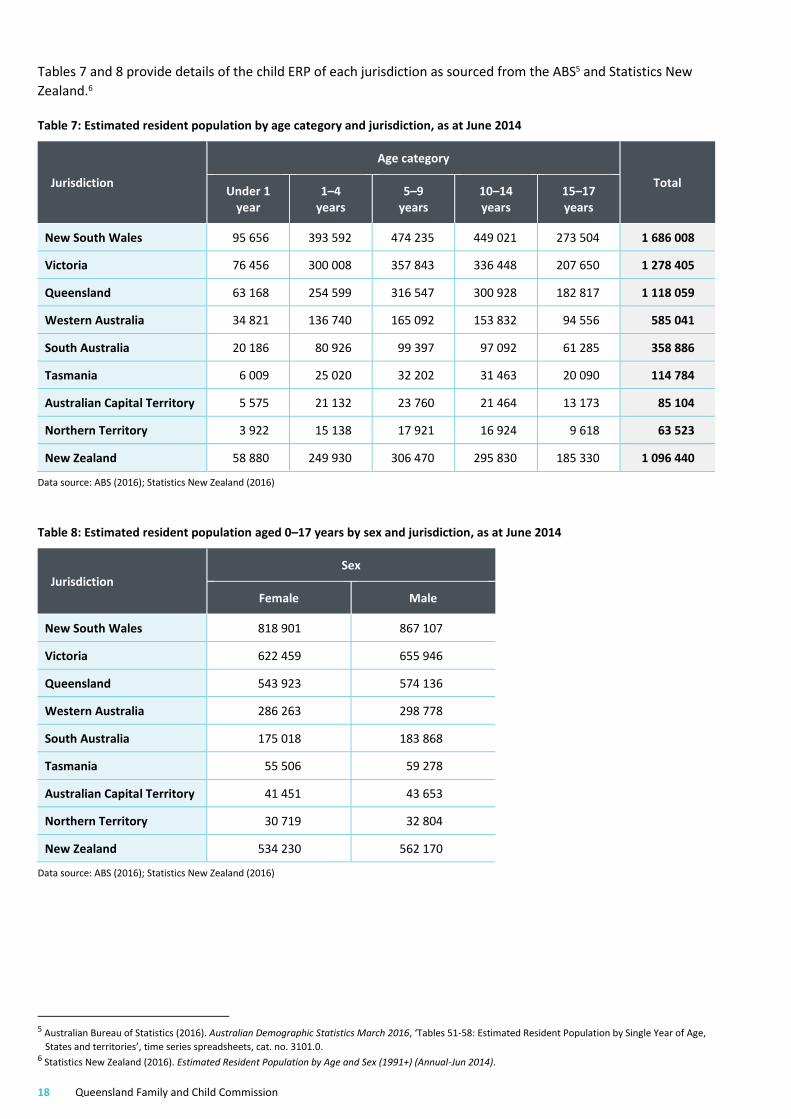
Tables 7 and 8 provide details of the child ERP of each jurisdiction as sourced from the ABS5 and Statistics New
Zealand.6
Table 7: Estimated resident population by age category and jurisdiction, as at June 2014
Jurisdiction
Age category
Total Under 1
year 1–4
years 5–9
years 10–14 years
15–17 years
New South Wales 95 656 393 592 474 235 449 021 273 504 1 686 008
Victoria 76 456 300 008 357 843 336 448 207 650 1 278 405
Queensland 63 168 254 599 316 547 300 928 182 817 1 118 059
Western Australia 34 821 136 740 165 092 153 832 94 556 585 041
South Australia 20 186 80 926 99 397 97 092 61 285 358 886
Tasmania 6 009 25 020 32 202 31 463 20 090 114 784
Australian Capital Territory 5 575 21 132 23 760 21 464 13 173 85 104
Northern Territory 3 922 15 138 17 921 16 924 9 618 63 523
New Zealand 58 880 249 930 306 470 295 830 185 330 1 096 440
Data source: ABS (2016); Statistics New Zealand (2016)
Table 8: Estimated resident population aged 0–17 years by sex and jurisdiction, as at June 2014
Jurisdiction Sex
Female Male
New South Wales 818 901 867 107
Victoria 622 459 655 946
Queensland 543 923 574 136
Western Australia 286 263 298 778
South Australia 175 018 183 868
Tasmania 55 506 59 278
Australian Capital Territory 41 451 43 653
Northern Territory 30 719 32 804
New Zealand 534 230 562 170
Data source: ABS (2016); Statistics New Zealand (2016)
5 Australian Bureau of Statistics (2016). Australian Demographic Statistics March 2016, ‘Tables 51-58: Estimated Resident Population by Single Year of Age,
States and territories’, time series spreadsheets, cat. no. 3101.0. 6 Statistics New Zealand (2016). Estimated Resident Population by Age and Sex (1991+) (Annual-Jun 2014).
Annual Report Supplementary Chapter: Australian and New Zealand child death statistics 2014
19
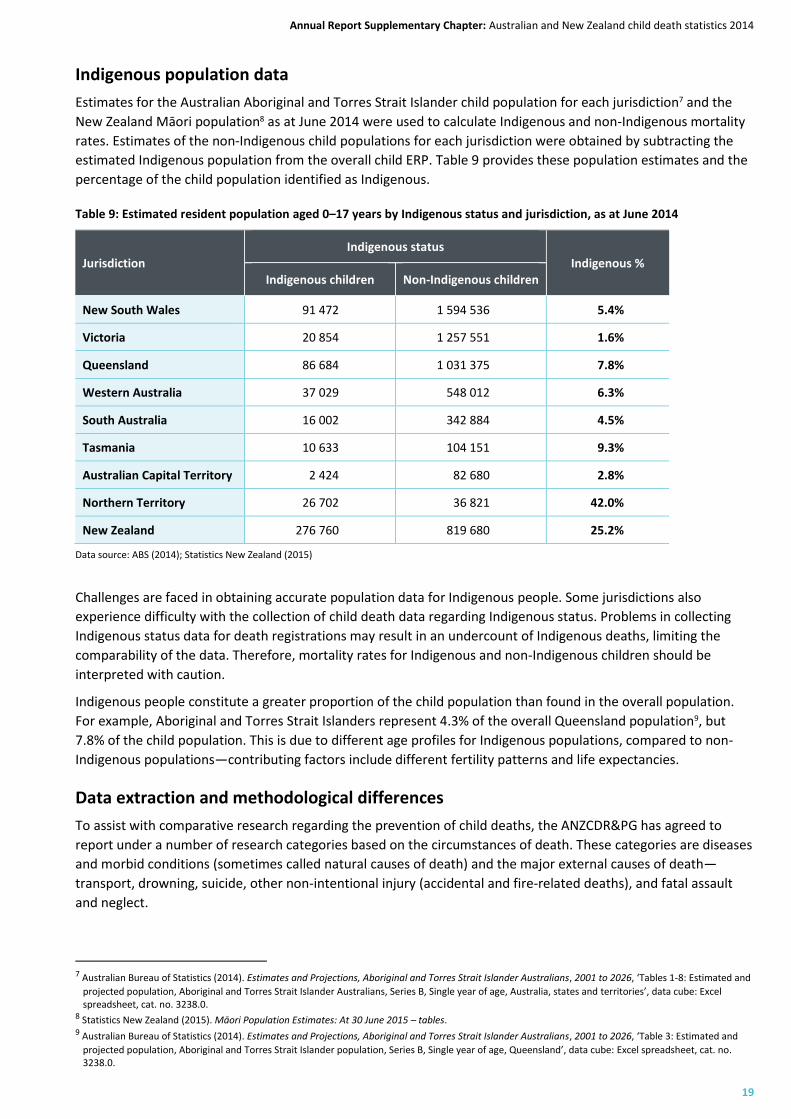
Indigenous population data
Estimates for the Australian Aboriginal and Torres Strait Islander child population for each jurisdiction7 and the
New Zealand Māori population8 as at June 2014 were used to calculate Indigenous and non-Indigenous mortality
rates. Estimates of the non-Indigenous child populations for each jurisdiction were obtained by subtracting the
estimated Indigenous population from the overall child ERP. Table 9 provides these population estimates and the
percentage of the child population identified as Indigenous.
Table 9: Estimated resident population aged 0–17 years by Indigenous status and jurisdiction, as at June 2014
Jurisdiction Indigenous status
Indigenous % Indigenous children Non-Indigenous children
New South Wales 91 472 1 594 536 5.4%
Victoria 20 854 1 257 551 1.6%
Queensland 86 684 1 031 375 7.8%
Western Australia 37 029 548 012 6.3%
South Australia 16 002 342 884 4.5%
Tasmania 10 633 104 151 9.3%
Australian Capital Territory 2 424 82 680 2.8%
Northern Territory 26 702 36 821 42.0%
New Zealand 276 760 819 680 25.2%
Data source: ABS (2014); Statistics New Zealand (2015)
Challenges are faced in obtaining accurate population data for Indigenous people. Some jurisdictions also
experience difficulty with the collection of child death data regarding Indigenous status. Problems in collecting
Indigenous status data for death registrations may result in an undercount of Indigenous deaths, limiting the
comparability of the data. Therefore, mortality rates for Indigenous and non-Indigenous children should be
interpreted with caution.
Indigenous people constitute a greater proportion of the child population than found in the overall population.
For example, Aboriginal and Torres Strait Islanders represent 4.3% of the overall Queensland population9, but
7.8% of the child population. This is due to different age profiles for Indigenous populations, compared to non-
Indigenous populations—contributing factors include different fertility patterns and life expectancies.
Data extraction and methodological differences
To assist with comparative research regarding the prevention of child deaths, the ANZCDR&PG has agreed to
report under a number of research categories based on the circumstances of death. These categories are diseases
and morbid conditions (sometimes called natural causes of death) and the major external causes of death—
transport, drowning, suicide, other non-intentional injury (accidental and fire-related deaths), and fatal assault
and neglect.
7 Australian Bureau of Statistics (2014). Estimates and Projections, Aboriginal and Torres Strait Islander Australians, 2001 to 2026, ‘Tables 1-8: Estimated and
projected population, Aboriginal and Torres Strait Islander Australians, Series B, Single year of age, Australia, states and territories’, data cube: Excel spreadsheet, cat. no. 3238.0.
8 Statistics New Zealand (2015). Māori Population Estimates: At 30 June 2015 – tables. 9 Australian Bureau of Statistics (2014). Estimates and Projections, Aboriginal and Torres Strait Islander Australians, 2001 to 2026, ‘Table 3: Estimated and
projected population, Aboriginal and Torres Strait Islander population, Series B, Single year of age, Queensland’, data cube: Excel spreadsheet, cat. no. 3238.0.
20 Queensland Family and Child Commission
However, it is important to recognise deaths are categorised by each particular agency as per their individual
classification rules. In many cases, agencies have multiple sources of information available concerning children
(including health, welfare and education records) and are not limited to the causes of death recorded in post-
mortem reports or death certificates. Accordingly, a team or committee’s classification for a particular death may
vary from classifications within the World Health Organization’s (WHO) International statistical classification of
diseases and related health problems, tenth revision (ICD-10).
Notable differences include:
The QFCC normally include SIDS and undetermined causes within diseases and morbid conditions (classified
as unexplained diseases and morbid conditions). For inter-jurisdictional comparability of data in this
supplementary chapter, deaths from SIDS and undetermined causes have been excluded from deaths due to
diseases and morbid conditions.
The Victorian Consultative Council on Obstetric and Paediatric Mortality and Morbidity (CCOPMM) apply
coding of neonatal (0–27 days) deaths according to PSANZ-PDC10 and PSANZ-NDC11 rather than ICD-10.
However, Victorian data provided by the council for this chapter has been recoded into the ICD-10.
Victorian figures exclude neonatal deaths as a result of terminations of pregnancy (for congenital anomaly or
other maternal reason) and those born less than 20 weeks gestation, or, if the gestation is unknown, less
than 400 grams birth weight.
South Australian figures do not include deaths of infants who were born spontaneously before 20 weeks
gestation, or deaths of infants as a result of planned termination of pregnancy, irrespective of whether they
showed signs of life after birth and irrespective of whether they were registered at Births, Deaths and
Marriages as a live birth.
The methodology for classification of external cause deaths by the South Australian Child Death and Serious
Injury Review Committee is available in the Committee’s Annual report at www.cdsirc.sa.gov.au, including a
revision of the classification of fatal assault.
A number of additional issues affecting data for particular jurisdictions should also be noted:
The Victorian CCOPMM notes that the data provided is provisional only. Final data will be available in the
yet-to-be-published Annual Report for the 2014 and 2015, at https://www2.health.vic.gov.au/hospitals-and-
health-services/quality-safety-service/consultative-councils/council-obstetric-paediatric-mortality/mothers-
babies-children-report-2012-13.
The Victorian CCOPMM does not specify raw figures where these are less than, or equal to 5. Aboriginal and
Torres Strait Islander figures are not specified for counts less than 10. These are represented by the figures
≤5 and <10 throughout this chapter.
The data for Western Australia for all child deaths, deaths by Indigenous status and by gender are obtained
from the Department of Health, while the data for external-cause deaths and deaths from SIDS and
undetermined causes is provided by the Ombudsman Western Australia. Therefore these two data sets
should not be compared.
The data provided by the Ombudsman Western Australia is based on the child death notification received by
the Ombudsman which includes general information on the circumstances of death. This is an initial
indication of how the child may have died but is not the cause of death, which can only be determined by the
Western Australian Coroner.
Australian Capital Territory Children and Young People Death Review Committee does not specify raw figures
where counts are less than 5. These are represented by the figure <5 throughout this chapter.
The Australian Capital Territory data does not include deaths of children and young people awaiting the
Coroner’s findings.
10 Perinatal Society of Australia and New Zealand—Perinatal Death Classification. 11 Perinatal Society of Australia and New Zealand—Neonatal Death Classification.

Annual Report Supplementary Chapter: Australian and New Zealand child death statistics 2014
21
The New Zealand Child and Youth Mortality Committee notes that:
Data are from the NZ Mortality Review Database, which collects and stores data for the Child and Youth, and
Perinatal and Maternal Mortality Review Committees. The 2014 data are provisional.
Data relates to deaths occurring in the age range of 20 weeks gestation (or birth weight 400 grams) up to but
not including the 18th birthday, and excludes stillbirths and terminations.
Only deaths of New Zealand residents are included in these analyses (deaths of non-residents within New
Zealand are excluded).
Infant mortality is usually calculated using live births in New Zealand, so the infant mortality rates in this
chapter will differ from official New Zealand statistics.
22 Queensland Family and Child Commission
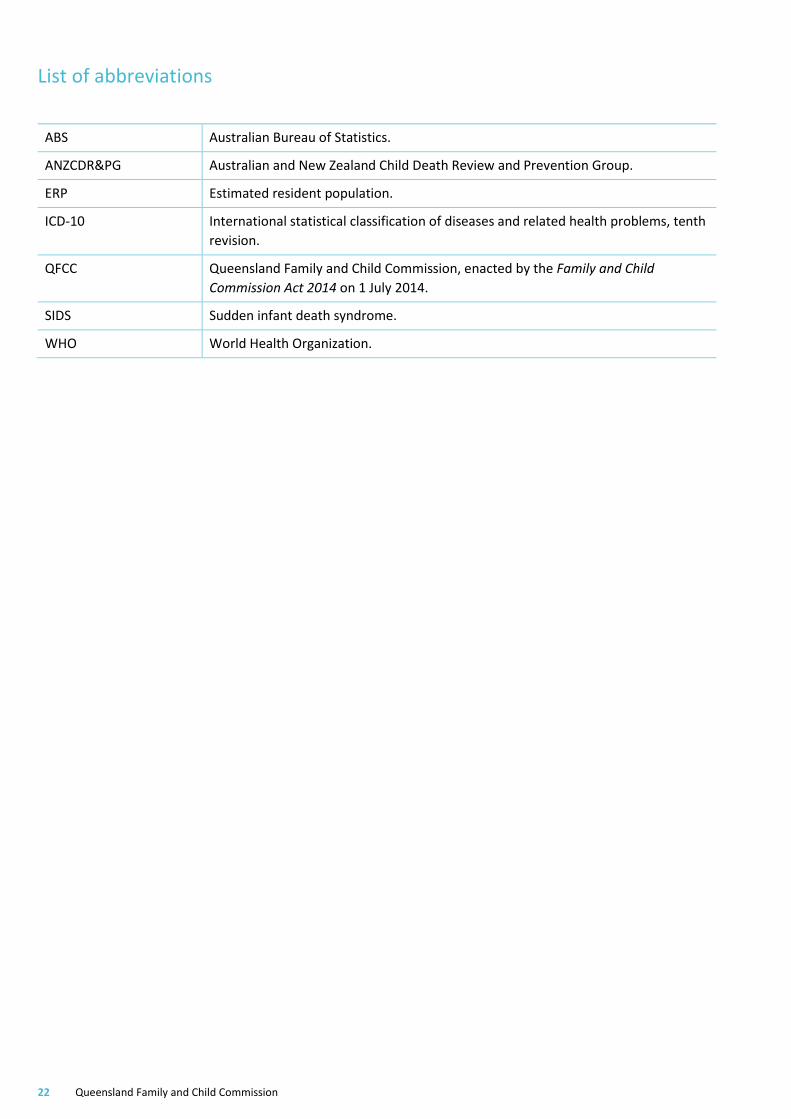
List of abbreviations
ABS Australian Bureau of Statistics.
ANZCDR&PG Australian and New Zealand Child Death Review and Prevention Group.
ERP Estimated resident population.
ICD-10 International statistical classification of diseases and related health problems, tenth
revision.
QFCC Queensland Family and Child Commission, enacted by the Family and Child
Commission Act 2014 on 1 July 2014.
SIDS Sudden infant death syndrome.
WHO World Health Organization.
Related Documents