Journal of Ecology 2005 93, 1071–1084 © 2005 British Ecological Society Successional dynamics of woody seedling communities in wet tropical secondary forests ROBERT S. CAPERS*, ROBIN L. CHAZDON, ALVARO REDONDO BRENES† and BRAULIO VILCHEZ ALVARADO‡ Department of Ecology and Evolutionary Biology, University of Connecticut, Storrs, Connecticut, USA, †School of Forestry and Environmental Studies, Yale University, New Haven, Connecticut, USA, and ‡Escuela de Ingeniería Forestal, Instituto Tecnológico de Costa Rica, Cártago, Costa Rica Summary 1 Chronosequence studies have found that shrubs and lianas are generally more abund- ant in early stages of tropical forest succession, whereas canopy trees and palms become more abundant and species-rich in older stages and mature forests. 2 We analysed changes in woody seedling communities over 5 years in four second- growth forests (initially 13–26 years after pasture abandonment) in Costa Rica. We recorded community-level changes in woody seedling density, species density, species richness and composition in six woody life-forms: canopy trees, subcanopy trees, canopy palms, understorey palms, shrubs and lianas. We evaluated these changes in relation to annualized recruitment and mortality rates for each life-form. 3 Seedling density declined in all four sites over the 5 years, whereas Shannon diversity and the proportion of rare species increased. Species richness and evenness increased in all but the oldest site. 4 Canopy palm, understorey palm and canopy tree seedlings increased in species richness and relative abundance, whereas shrub and liana relative abundance declined. Canopy trees accounted for 34–42% of all new recruits. Detrended correspondence analysis showed that species composition was initially highly distinct within each forest site and remained distinct over the 5-year period. 5 Shifts in life-form were correlated with declining light availability during succession. Across sites, median light availability at the end of the study period in 2003 was posi- tively correlated with recruitment rates of understorey palms, shrubs and lianas, and was negatively correlated with mortality rates of canopy trees and palms. 6 Observed changes among seedling communities mirrored those described in chron- osequence studies on plants in larger size classes, lending support to the assumptions of chronosequence studies in Neotropical forests. 7 The results demonstrate the importance of seedling recruitment and mortality in determining the course of succession. Convergence occurs in some community pro- perties, such as relative abundance within life-forms, but not in others, such as species composition. Finally, the results illustrate the value of studying plant community dynamics at the level of woody life-forms, especially in hyperdiverse systems such as tropical forests. Key-words: canopy trees, chronosequence, forest understorey, lianas, life-form, mor- tality, palms, recruitment, shrubs, succession. Journal of Ecology (2005) 93, 1071–1084 doi: 10.1111/j.1365-2745.2005.01050.x *Present address and correspondence: Robert S. Capers, Connecticut Agricultural Experiment Station, New Haven, CT 06504, USA (e-mail: [email protected]).

Welcome message from author
This document is posted to help you gain knowledge. Please leave a comment to let me know what you think about it! Share it to your friends and learn new things together.
Transcript
Journal of Ecology
2005
93
, 1071–1084
© 2005 British Ecological Society
Successional dynamics of woody seedling communities in wet tropical secondary forests
ROBERT S. CAPERS*, ROBIN L. CHAZDON, ALVARO REDONDO BRENES† and BRAULIO VILCHEZ ALVARADO‡
Department of Ecology and Evolutionary Biology, University of Connecticut, Storrs, Connecticut, USA,
†
School of Forestry and Environmental Studies, Yale University, New Haven, Connecticut, USA, and
‡
Escuela de Ingeniería Forestal, Instituto Tecnológico de Costa Rica, Cártago, Costa Rica
Summary
1
Chronosequence studies have found that shrubs and lianas are generally more abund-ant in early stages of tropical forest succession, whereas canopy trees and palms becomemore abundant and species-rich in older stages and mature forests.
2
We analysed changes in woody seedling communities over 5 years in four second-growth forests (initially 13–26 years after pasture abandonment) in Costa Rica. Werecorded community-level changes in woody seedling density, species density, speciesrichness and composition in six woody life-forms: canopy trees, subcanopy trees, canopypalms, understorey palms, shrubs and lianas. We evaluated these changes in relationto annualized recruitment and mortality rates for each life-form.
3
Seedling density declined in all four sites over the 5 years, whereas Shannon diversityand the proportion of rare species increased. Species richness and evenness increased inall but the oldest site.
4
Canopy palm, understorey palm and canopy tree seedlings increased in speciesrichness and relative abundance, whereas shrub and liana relative abundance declined.Canopy trees accounted for 34–42% of all new recruits. Detrended correspondenceanalysis showed that species composition was initially highly distinct within each forestsite and remained distinct over the 5-year period.
5
Shifts in life-form were correlated with declining light availability during succession.Across sites, median light availability at the end of the study period in 2003 was posi-tively correlated with recruitment rates of understorey palms, shrubs and lianas, andwas negatively correlated with mortality rates of canopy trees and palms.
6
Observed changes among seedling communities mirrored those described in chron-osequence studies on plants in larger size classes, lending support to the assumptions ofchronosequence studies in Neotropical forests.
7
The results demonstrate the importance of seedling recruitment and mortality indetermining the course of succession. Convergence occurs in some community pro-perties, such as relative abundance within life-forms, but not in others, such as speciescomposition. Finally, the results illustrate the value of studying plant communitydynamics at the level of woody life-forms, especially in hyperdiverse systems such astropical forests.
Key-words
: canopy trees, chronosequence, forest understorey, lianas, life-form, mor-tality, palms, recruitment, shrubs, succession.
Journal of Ecology
(2005)
93
, 1071–1084doi: 10.1111/j.1365-2745.2005.01050.x
*Present address and correspondence: Robert S. Capers, Connecticut Agricultural Experiment Station, New Haven, CT 06504,USA (e-mail: [email protected]).
1072
R. S. Capers
et al.
© 2005 British Ecological Society,
Journal of Ecology
93
, 1071–1084
Introduction
Life-form composition, abundance and species rich-ness of woody vegetation undergo major shifts duringsecondary forest succession. In Neotropical forests,lianas (Hegarty & Caballé 1991; DeWalt
et al
. 2000;Peña-Claros & de Boo 2002) and shrubs (Guariguata
et al
. 1997; Laska 1997) reach higher abundance inearly successional forests than in old-growth forests,whereas palms (Guariguata
et al
. 1997; Svenning 1998;Farris Lopez 2001), canopy trees (Guariguata
et al
. 1997)and understorey treelets (Martin
et al.
2004) showincreasing abundance during later phases of successionand in mature forests. Successional shifts also occurwithin individual life-forms; tree species that dominateearly successional forests decline in abundance inmature forests, and species abundant in mature forestsmay be absent or less abundant in early successionalforests (Saldarriaga
et al
. 1988; Guariguata & Ostertag2001; DeWalt
et al
. 2003). The net effect of thesechanges is an increase in woody species richness, even-ness and species diversity (Shannon index) during thefirst 40–50 years of succession (Saldarriaga
et al
. 1988;Peña-Claros 2003; Ruiz
et al
. in press).In secondary tropical forests, seedling dynamics can link
communities of early successional shrubs, shade-intoleranttrees and lianas with later successional communities ofshade-tolerant canopy trees, palms and understoreytrees, revealing how these transitions occur and, potentially,permitting inferences to be drawn about the processesinvolved. Community-level studies of seedlings in second-ary tropical forests are lacking (but see Chazdon inpress), however, and even studies that include all woodyseedlings are very rare (e.g. Harms
et al
. 2000).To date, most of our knowledge on successional
dynamics of tropical forests is based on chrono-sequence studies, in which sites of different ages are usedto represent the general condition of all sites at thoseages (Pickett 1989; Chazdon in press). Although thisapproach is expedient, allowing work to be done in ayear or two that would otherwise take decades orlonger, chronosequence studies assume similar sitehistory, environmental conditions and seed availability,assumptions that rarely are tested (Chazdon in press).Long-term studies are needed to determine whetherchanges that actually occur over time within individualsites conform to successional patterns described inchronosequence studies (Sheil 1999), as well as toelucidate the processes associated with these patterns.
Here we examine woody seedling dynamics over5 years in four wet, secondary forest sites in north-eastCosta Rica. Study area forests ranged in age from13 years to 26 years in 1998 when the seedling dynamicsstudy began. We focus on changes in density andspecies composition of woody seedlings in six life-forms: canopy trees, subcanopy trees, canopy palms,understorey palms, shrubs and lianas. Based ondetrended correspondence analysis and an abundance-based estimator of community similarity (Chao
et al
.
2005), we also examine patterns of floristic similarityamong woody seedling communities and addresschanges in these patterns over time.
If chronosequence assumptions are valid, we wouldexpect to find changes in forest composition during the5-year period of our study that mirror those observedin chronosequence studies. These would include decreasesin abundance of shrub and liana seedlings and increasesin abundance of palm and canopy tree seedlings. Wefurther predict an overall decline in woody seedlingdensity, modest or no change in species richness, increas-ing evenness and increasing species diversity. Previousstudies in north-east Costa Rica have found higher woodyseedling density and species richness in old-growththan in secondary forests (Nicotra
et al
. 1999). Similarly,in a chronosequence study of Panamanian forests,Denslow & Guzman (2000) found that seedling densitieswere highest in 20-year-old second-growth sites (theyoungest age class studied), decreasing to a minimumin 100-year-old sites; species diversity did not differamong forests after accounting for seedling density.
Chronosequence studies in a river-bank successionin Peru (Terborgh
et al
. 1996) and secondary successionfollowing human land use in Uganda (Sheil 1999) suggestthat species composition of tree communities followsan orderly progression from successional to mature sites.However, studies of species composition within theseplots over time do not support the convergence model(Sheil 1999), and long-term studies of forest successionaldynamics following hurricane damage in south-eastNicaragua (Vandermeer
et al
. 2004) concluded thatsuccessional pathways were diverging over time, perhapsowing to differences in initial conditions or to later suc-cessional dynamics. Thus, whereas some communityproperties, such as species density, appear to convergeover time in tropical forests, convergence of other pro-perties, including species composition, may depend onthe characteristics of individual sites, including proximityto mature forests and the degree of disturbance. Here wetest whether the composition of woody seedling com-munities becomes more similar over time during second-ary succession in a fragmented landscape in Costa Rica.
Our study is the first to report on the successionaldynamics of woody seedling communities in tropicalforests. Our focus on life-forms reveals patterns not pre-viously evident among seedling communities but whichexplain changes previously observed in larger size classes.Although the lack of replication within forest age classeslimits the statistical power of our analysis, the clear trendsthat emerge from our results provide novel insights intothe role of seedling recruitment and mortality in shap-ing successional trajectories in Neotropical forests.
Methods and materials
Four 1-ha monitoring plots were established in 1997 in theCaribbean lowlands of north-east Costa Rica, Sarapiquí
1073
Seedling dynamics in tropical secondary forests
© 2005 British Ecological Society,
Journal of Ecology
93
, 1071–1084
County, Heredia Province. The natural vegetation inthe area is classified as Tropical Wet Forest (
sensu
Holdridge
et al
. 1975). Annual temperature and rain-fall average 26
°
C and 3800 mm, respectively, at LaSelva Biological Station (Sanford
et al
. 1994). Soils inour study areas are derived from weathered granite(Fisher 1995) and are primarily classified as ultisols(Sollins
et al
. 1994). Much forest in the area was clearedfor agriculture during the 1960s and 1970s, althoughsome was abandoned later (Butterfield 1994; Table 1).The area is now a mosaic of primary forest, secondaryforest, agricultural land and active pastures. The siteswhere the four monitoring plots were established hadbeen cleared and grazed lightly for several years beforebeing abandoned (Chazdon
et al
. in press). Land-usehistory was determined based on aerial photographs,satellite images and interviews with residents and land-owners. Two sites (LSUR, 13 years since agriculturalpasture, and LEP, 21 years old) were within La SelvaBiological Station (10
°
26
′
N, 84
°
00
′
W), approximately3 km from each other. Two others (TIR, 16 years sinceabandonment, and CR, 26 years old) were on privatelyowned farms about 12 km south-west of La Selva and5 km from each other and are more isolated frommature forest areas. LEP and TIR plots were 50
×
200 min size. Because of roads (CR) and uneven topography(LSUR), two adjacent 0.5-ha plots, of 50
×
100 m, werecreated at LSUR and CR. All had closed canopies,although canopy height varied with age (Table 1).
Light levels were measured in 2002–03 at 5-m intervals,at one corner of each seedling plot (see below), usinga red : far-red (R : FR) light meter (Skye SKR 110sensor, Skye Instruments, Llandrindod Wells, UK)mounted on a tripod, then converting the R : FR ratioto percentage diffuse transmittance (%T) using thetechnique of Capers & Chazdon (2004). All light read-ings were made in diffuse light conditions and at a
height of 50 cm (Table 1). Differences among %T wereanalysed with analysis of variance and a post-hoc leastsignificant difference (LSD) test.
At each site, 144 seedling plots were created, each of1
×
5 m, with a total area of 0.072 ha. Initial seedlingcensuses were conducted in 1998 (1–28 April at LEP, 27April–20 May at LSUR, 21 May – 3 June at CR and12 June–3 July at TIR). All woody stems > 20 cmin height and < 1 cm d.b.h. were identified to specieslevel, assigned a number and tagged. Seedlings wereidentified by experienced field assistants (MarcosMolina and Orlando Vargas), and vouchers were col-lected to compare with specimens identified at the LaSelva Herbarium and the Costa Rican Institute forBiodiversity. Each species was assigned to a life-form(canopy tree, subcanopy tree, canopy palm, under-storey palm, shrub or liana). Life-form categorieswere determined by Orlando Vargas, an experiencednaturalist, and were also used in previous studies byChazdon
et al
. (2003). Two species in LSUR, one in LEPand one in CR were unidentified and could not beassigned to life-form; these were excluded from the life-form analysis but treated as separate species otherwise.Every 4 months, censuses were conducted to identifynewly recruiting seedlings and seedlings that had died.Stem height of all seedlings was measured at 8-monthintervals. When the stem at 20 cm above the groundreached a diameter of 1 cm, a seedling was advanced tothe sapling size class. The final census (the 17th) wascompleted in August 2003.
From the complete data set, we extracted seedlingabundance data for all species at the 1st, 5th, 9th, 13thand 17th census in each of the four sites. These data
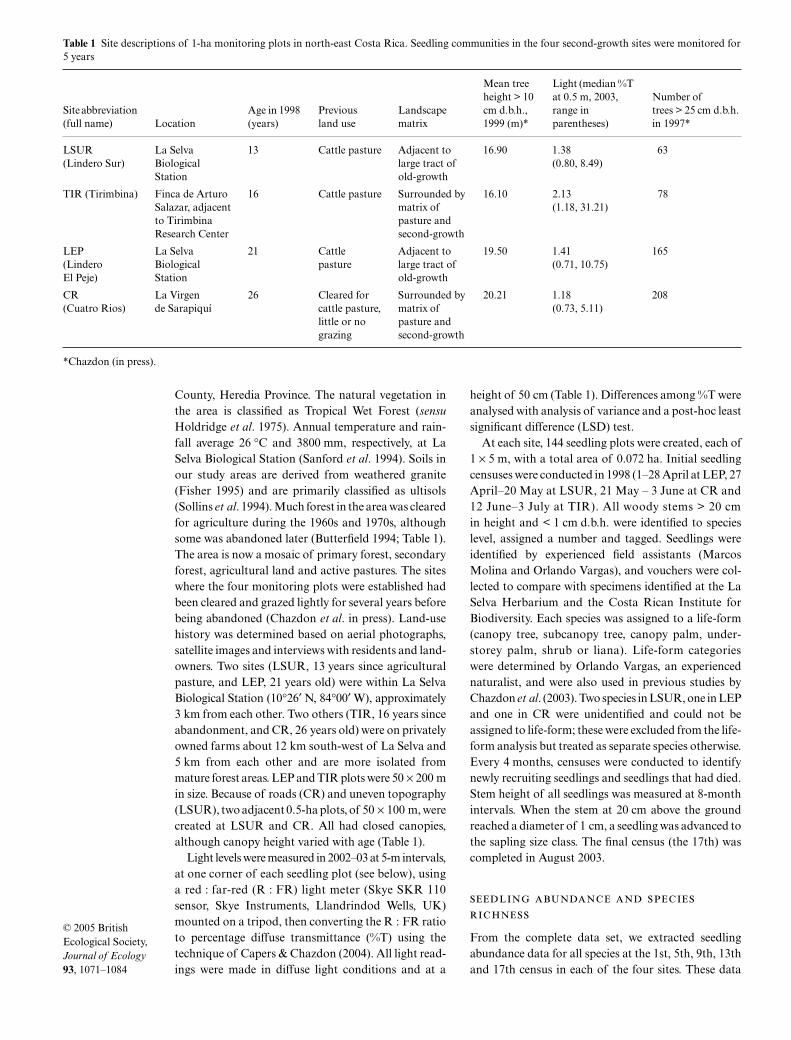
Table 1
Site descriptions of 1-ha monitoring plots in north-east Costa Rica. Seedling communities in the four second-growth sites were monitored for5 years
Site abbreviation (full name) Location
Age in 1998 (years)
Previous land use
Landscape matrix
Mean tree height > 10 cm d.b.h., 1999 (m)*
Light (median %T at 0.5 m, 2003, range in parentheses)
Number of trees > 25 cm d.b.h. in 1997*
LSUR La Selva 13 Cattle pasture Adjacent to 16.90 1.38 63(Lindero Sur) Biological large tract of (0.80, 8.49)
Station old-growth
TIR (Tirimbina) Finca de ArturoSalazar, adjacentto Tirimbina Research Center
16 Cattle pasture Surrounded bymatrix of pasture and second-growth
16.10 2.13 (1.18, 31.21)
78
LEP La Selva 21 Cattle Adjacent to 19.50 1.41 165(Lindero Biological pasture large tract of (0.71, 10.75)El Peje) Station old-growth
CR La Virgen 26 Cleared for Surrounded by 20.21 1.18 208(Cuatro Rios) de Sarapiquí cattle pasture,
little or no grazing
matrix of pasture and second-growth
(0.73, 5.11)
*Chazdon (in press).
1074
R. S. Capers
et al.
© 2005 British Ecological Society,
Journal of Ecology
93
, 1071–1084
were used to evaluate change in species richness andseedling abundance by life-form. Shannon diversitywas calculated, and evenness was measured as
J
, theobserved value of the Shannon index as a proportion ofits maximum value, which equals the natural logarithmof the number of observed species with perfect evenness.Rareness was measured as the percentage of speciesrepresented in a community by only one stem (singletons).We used sample-based rarefaction (Gotelli & Colwell2001) to adjust for unequal numbers of seedlings insites and to compare species richness and tree speciesrichness at the beginning and the end of the studyperiod. This was done using EstimateS software(Version 7.5, Colwell 2005), computing the meannumber of species in a randomized sample of 1375seedlings (340 tree seedlings), based on 200 random-izations. We used analysis of variance to determine ifmean species density in 5-m
2
quadrats differed amongsites at the first census or the final census.
Analysis of variance also was used to determine ifmean seedling density in 5-m
2
quadrats differed amongsites and whether it changed within sites.
G
-tests wereused (incorporating Williams’ correction, Sokal &Rohlf 1995) to determine if the distribution of seedlingsamong life-forms changed within sites over the 5-yearstudy period and if the life-form distribution differedamong sites, for both seedling density and speciesdensity. We used paired
t
-tests with the four sites asreplicates to assess whether mean seedling density andmean species density changed during the study period,overall or among life-forms.
We used detrended correspondence analysis (DCA)to determine whether the four seedling communitiesdiverged or became more similar over time. All specieswith a minimum of eight seedlings at some point duringthe 5-year period were included (
n
= 120). Abundanceof seedlings in five censuses for each site were enteredin the DCA, which was executed in PC-ORD forWindows (McCune & Mefford 1997). We also evaluatedsimilarity in woody species composition (including allspecies) between all pairs of sites at the beginning andthe end of the study period using a new, abundance-based Jaccard index that corrects for rare species miss-ing from samples but likely to be present and shared(Chao
et al
. 2005).
To establish the importance of mortality in explainingchange over time in the relative abundance of each life-form, we determined the proportion of the originalcohort of seedlings that survived the 5-year period ateach site. Seedlings that graduated to the sapling sizeclass were considered to have survived for the entire 5-year period. Mortality rates for each life-form wereannualized by using the equation
m
= 1
−
(
N
t
/
N
0
)
1/
t
where
N
t
is the number of seedlings alive at the end ofthe period,
N
0
is the number in the original cohort and
t
is the time period, 5 years in this case (Sheil
et al
.
1995). Mortality rates among seedlings that recruitedto the sites during the study period were calculated inthe same way; a rate was calculated separately for eachcohort – those newly recorded at each census – and amean mortality rate was then calculated, weighted bythe number of seedlings in each cohort. The recruit-ment rates,
r
, for each life-form were calculated in asimilar way (Sheil
et al
. 2000) as
r
= 1
−
(1
−
n
r
/
N
t
)
1/
t
where
n
r
is the number of recruits during the period,and
N
t
and
t
are as above.To explore the effect of mortality and recruitment on
species richness, we determined the number of speciespresent in the original census but not in the final census,calculating a 5-year species persistence rate (the pro-portion of species surviving the entire 5-year period)for each life-form. We also determined the number of newspecies recruiting to the sites during the 5-year periodand the number of species in each life-form with increasingabundance and decreasing abundance. We analysedPearson correlation coefficients to determine whetherthe degree of change in absolute abundance of seedlings(the difference between abundance in the first and finalcensuses in each of the four sites) in each life-form wasaffected most by annualized recruitment or mortality ratesand to explore the effects of site age and light availabilityon these rates. Results of correlation analysis usingrelative abundance instead of absolute abundance werequalitatively the same and are not reported.
Results
Light availability was significantly higher in TIR thanin the other sites (
F
3,480
= 19.035,
P
< 0.0001; Table 1).Median %T was similar to the values (0.98–2.0%)recorded in three secondary (15–20 years old) andthree old-growth forest sites in the region by Nicotra
et al
. (1999), who found that mean %T did not differbetween old-growth and second-growth sites. In oursites, light was most variable in TIR, with high light lev-els in several areas that remain quite open. LEP andCR had no canopy openings and had more uniformlylow light availability.
,
Seedling density in 5-m
2
quadrats differed among sitesat the beginning and the end of the study period (
F
3,572
=24.024 and 32.240, respectively,
P
< 0.0001 in bothcases) and declined significantly over time (
F =
40.039,d.f. = 1,
P
< 0.0001) from (mean
±
SE) 15.9
±
1.35 to11.7
±
1.00 seedlings in LSUR, 23.3
±
1.46 to 20.5
±
1.10 seedlings in TIR, 11.0
±
0.65 to 9.3
±
0.43 seedlingsin LEP, and 13.2
±
0.59 to 12.8
±
0.70 seedlings in CR.The greatest decline (26%) was seen in the youngest siteand the least (3%) in the oldest. Of the species presentin the first census, 10–12% were lost during the 5-yearperiod, but younger sites gained twice as many newspecies as they lost, whereas the two older sites had
1075
Seedling dynamics in tropical secondary forests
© 2005 British Ecological Society,
Journal of Ecology
93
, 1071–1084
similar numbers of gains and losses (Table 2). As a result,species density rose more than 10% in the two youngersites and changed little in the older two.
Mean species density in 5-m
2
quadrats differed amongsites in the first census and the final census (
F
3,572
= 11.165 and 26.412, respectively,
P
< 0.0001 in bothcases), because species density at TIR was significantly
higher than at the other three sites (LSD,
P
< 0.0001for both first and final censuses; means
±
SE for LSUR,TIR, LEP and CR of 6.82
±
0.251, 8.40
±
0.334, 6.76
±
0.234 and 6.41
±
0.231, respectively, for the firstcensus and 6.41
±
0.247, 9.17
±
0.385, 6.41
±
0.215 and6.22
±
0.222, respectively, for the final census). Arepeated-measures
indicated that mean species
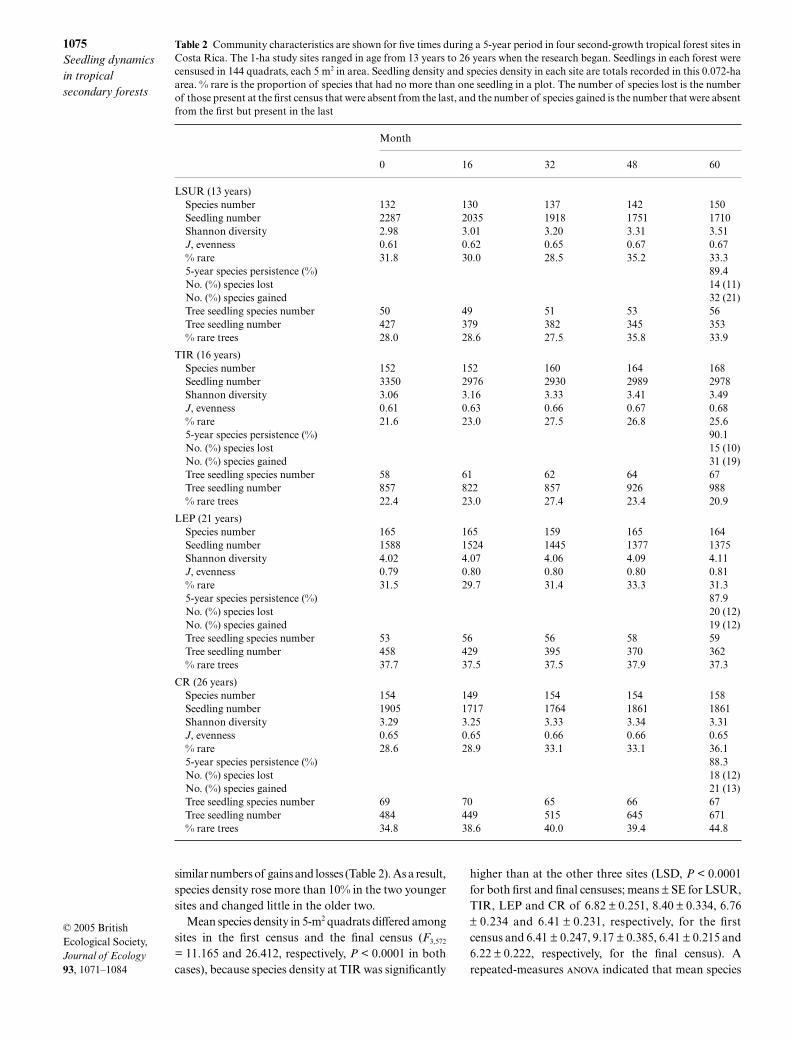
Table 2 Community characteristics are shown for five times during a 5-year period in four second-growth tropical forest sites inCosta Rica. The 1-ha study sites ranged in age from 13 years to 26 years when the research began. Seedlings in each forest werecensused in 144 quadrats, each 5 m2 in area. Seedling density and species density in each site are totals recorded in this 0.072-haarea. % rare is the proportion of species that had no more than one seedling in a plot. The number of species lost is the numberof those present at the first census that were absent from the last, and the number of species gained is the number that were absentfrom the first but present in the last
Month
0 16 32 48 60
LSUR (13 years)Species number 132 130 137 142 150Seedling number 2287 2035 1918 1751 1710Shannon diversity 2.98 3.01 3.20 3.31 3.51J, evenness 0.61 0.62 0.65 0.67 0.67% rare 31.8 30.0 28.5 35.2 33.35-year species persistence (%) 89.4No. (%) species lost 14 (11)No. (%) species gained 32 (21)Tree seedling species number 50 49 51 53 56Tree seedling number 427 379 382 345 353% rare trees 28.0 28.6 27.5 35.8 33.9
TIR (16 years)Species number 152 152 160 164 168Seedling number 3350 2976 2930 2989 2978Shannon diversity 3.06 3.16 3.33 3.41 3.49J, evenness 0.61 0.63 0.66 0.67 0.68% rare 21.6 23.0 27.5 26.8 25.65-year species persistence (%) 90.1No. (%) species lost 15 (10)No. (%) species gained 31 (19)Tree seedling species number 58 61 62 64 67Tree seedling number 857 822 857 926 988% rare trees 22.4 23.0 27.4 23.4 20.9
LEP (21 years)Species number 165 165 159 165 164Seedling number 1588 1524 1445 1377 1375Shannon diversity 4.02 4.07 4.06 4.09 4.11J, evenness 0.79 0.80 0.80 0.80 0.81% rare 31.5 29.7 31.4 33.3 31.35-year species persistence (%) 87.9No. (%) species lost 20 (12)No. (%) species gained 19 (12)Tree seedling species number 53 56 56 58 59Tree seedling number 458 429 395 370 362% rare trees 37.7 37.5 37.5 37.9 37.3
CR (26 years)Species number 154 149 154 154 158Seedling number 1905 1717 1764 1861 1861Shannon diversity 3.29 3.25 3.33 3.34 3.31J, evenness 0.65 0.65 0.66 0.66 0.65% rare 28.6 28.9 33.1 33.1 36.15-year species persistence (%) 88.3No. (%) species lost 18 (12)No. (%) species gained 21 (13)Tree seedling species number 69 70 65 66 67Tree seedling number 484 449 515 645 671% rare trees 34.8 38.6 40.0 39.4 44.8
1076R. S. Capers et al.
© 2005 British Ecological Society, Journal of Ecology93, 1071–1084
density did not change within sites during the 5-yearperiod (F = 0.0011, d.f. = 1, P = 0.97).
Evenness increased in the three youngest sites andwas unchanged in the oldest (Table 2). The proportionof rare species (singletons) also increased in three of thefour sites. After adjusting for differences in seedlingabundance, species richness increased most in theyoungest site (26%), rose less in sites of intermediateage (11% and 4%) and rose slightly in the oldest site(< 1%). After correcting for differences in density, spe-cies richness in the youngest site equalled that of theoldest by the end of the study period (Table 3), and can-opy tree species richness in the youngest exceeded thatin the oldest. Shannon diversity increased in all foursites (Table 2), rising most in the two younger sitesbecause of substantial increases in both richness(Table 3) and evenness (Table 2).
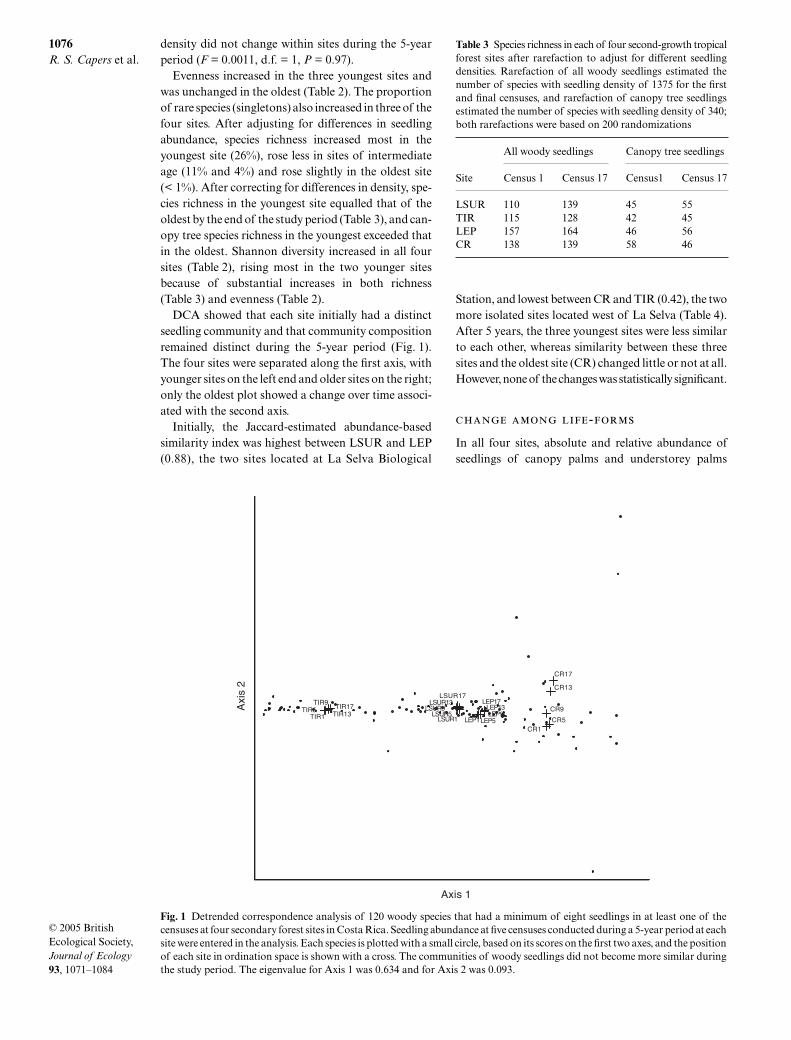
DCA showed that each site initially had a distinctseedling community and that community compositionremained distinct during the 5-year period (Fig. 1).The four sites were separated along the first axis, withyounger sites on the left end and older sites on the right;only the oldest plot showed a change over time associ-ated with the second axis.
Initially, the Jaccard-estimated abundance-basedsimilarity index was highest between LSUR and LEP(0.88), the two sites located at La Selva Biological
Station, and lowest between CR and TIR (0.42), the twomore isolated sites located west of La Selva (Table 4).After 5 years, the three youngest sites were less similarto each other, whereas similarity between these threesites and the oldest site (CR) changed little or not at all.However, none of the changes was statistically significant.
-
In all four sites, absolute and relative abundance ofseedlings of canopy palms and understorey palms
Fig. 1 Detrended correspondence analysis of 120 woody species that had a minimum of eight seedlings in at least one of thecensuses at four secondary forest sites in Costa Rica. Seedling abundance at five censuses conducted during a 5-year period at eachsite were entered in the analysis. Each species is plotted with a small circle, based on its scores on the first two axes, and the positionof each site in ordination space is shown with a cross. The communities of woody seedlings did not become more similar duringthe study period. The eigenvalue for Axis 1 was 0.634 and for Axis 2 was 0.093.
Table 3 Species richness in each of four second-growth tropicalforest sites after rarefaction to adjust for different seedlingdensities. Rarefaction of all woody seedlings estimated thenumber of species with seedling density of 1375 for the firstand final censuses, and rarefaction of canopy tree seedlingsestimated the number of species with seedling density of 340;both rarefactions were based on 200 randomizations
Site
All woody seedlings Canopy tree seedlings
Census 1 Census 17 Census1 Census 17
LSUR 110 139 45 55TIR 115 128 42 45LEP 157 164 46 56CR 138 139 58 46
1077Seedling dynamics in tropical secondary forests
© 2005 British Ecological Society, Journal of Ecology93, 1071–1084
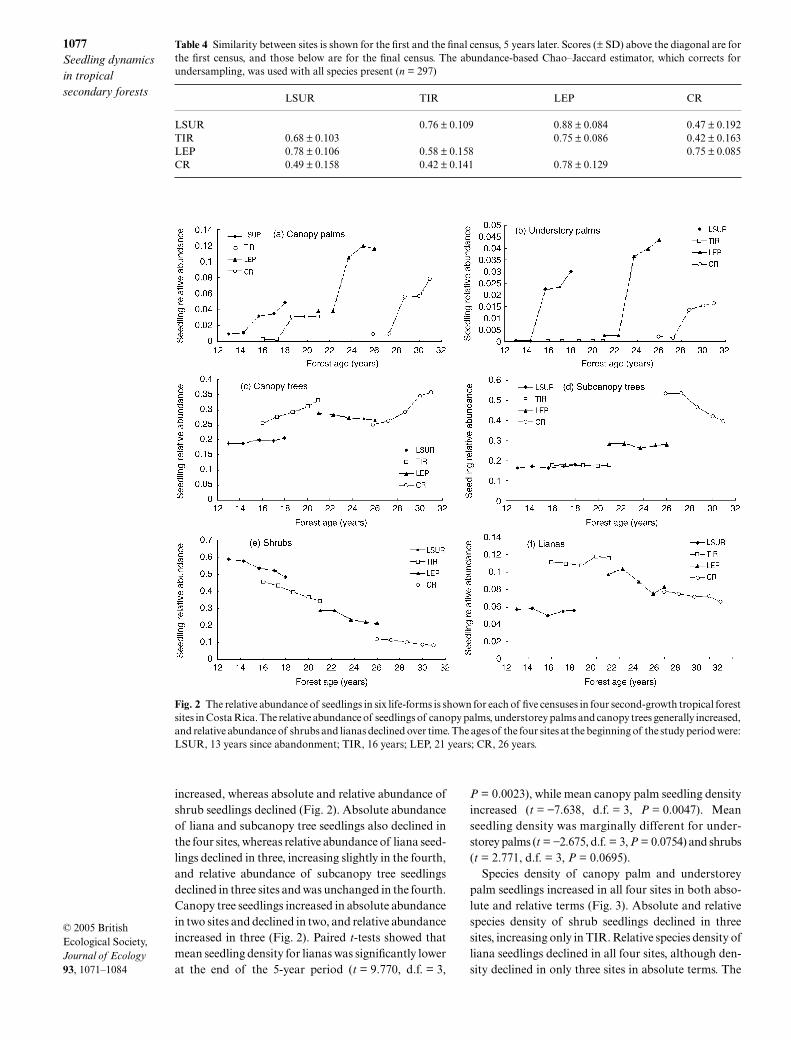
increased, whereas absolute and relative abundance ofshrub seedlings declined (Fig. 2). Absolute abundanceof liana and subcanopy tree seedlings also declined inthe four sites, whereas relative abundance of liana seed-lings declined in three, increasing slightly in the fourth,and relative abundance of subcanopy tree seedlingsdeclined in three sites and was unchanged in the fourth.Canopy tree seedlings increased in absolute abundancein two sites and declined in two, and relative abundanceincreased in three (Fig. 2). Paired t-tests showed thatmean seedling density for lianas was significantly lowerat the end of the 5-year period (t = 9.770, d.f. = 3,
P = 0.0023), while mean canopy palm seedling densityincreased (t = −7.638, d.f. = 3, P = 0.0047). Meanseedling density was marginally different for under-storey palms (t = −2.675, d.f. = 3, P = 0.0754) and shrubs(t = 2.771, d.f. = 3, P = 0.0695).
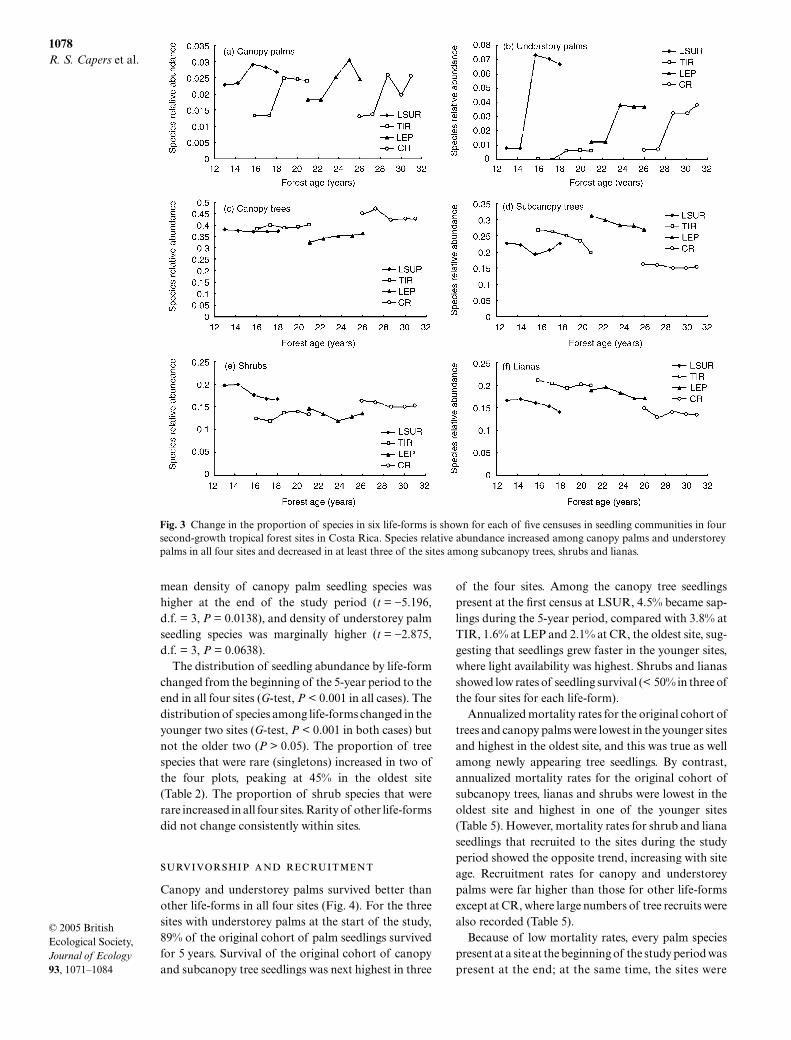
Species density of canopy palm and understoreypalm seedlings increased in all four sites in both abso-lute and relative terms (Fig. 3). Absolute and relativespecies density of shrub seedlings declined in threesites, increasing only in TIR. Relative species density ofliana seedlings declined in all four sites, although den-sity declined in only three sites in absolute terms. The
Table 4 Similarity between sites is shown for the first and the final census, 5 years later. Scores (± SD) above the diagonal are forthe first census, and those below are for the final census. The abundance-based Chao–Jaccard estimator, which corrects forundersampling, was used with all species present (n = 297)
LSUR TIR LEP CR
LSUR 0.76 ± 0.109 0.88 ± 0.084 0.47 ± 0.192TIR 0.68 ± 0.103 0.75 ± 0.086 0.42 ± 0.163LEP 0.78 ± 0.106 0.58 ± 0.158 0.75 ± 0.085CR 0.49 ± 0.158 0.42 ± 0.141 0.78 ± 0.129
Fig. 2 The relative abundance of seedlings in six life-forms is shown for each of five censuses in four second-growth tropical forestsites in Costa Rica. The relative abundance of seedlings of canopy palms, understorey palms and canopy trees generally increased,and relative abundance of shrubs and lianas declined over time. The ages of the four sites at the beginning of the study period were:LSUR, 13 years since abandonment; TIR, 16 years; LEP, 21 years; CR, 26 years.
1078R. S. Capers et al.
© 2005 British Ecological Society, Journal of Ecology93, 1071–1084
mean density of canopy palm seedling species washigher at the end of the study period (t = −5.196,d.f. = 3, P = 0.0138), and density of understorey palmseedling species was marginally higher (t = −2.875,d.f. = 3, P = 0.0638).
The distribution of seedling abundance by life-formchanged from the beginning of the 5-year period to theend in all four sites (G-test, P < 0.001 in all cases). Thedistribution of species among life-forms changed in theyounger two sites (G-test, P < 0.001 in both cases) butnot the older two (P > 0.05). The proportion of treespecies that were rare (singletons) increased in two ofthe four plots, peaking at 45% in the oldest site(Table 2). The proportion of shrub species that wererare increased in all four sites. Rarity of other life-formsdid not change consistently within sites.
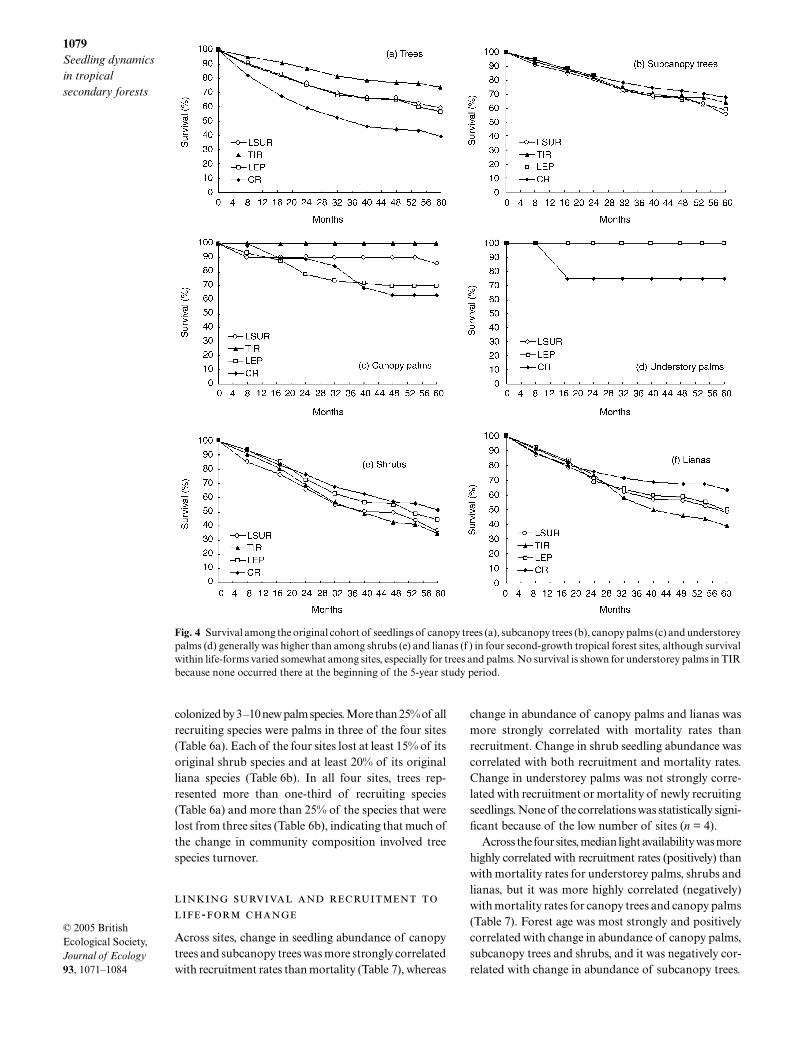
Canopy and understorey palms survived better thanother life-forms in all four sites (Fig. 4). For the threesites with understorey palms at the start of the study,89% of the original cohort of palm seedlings survivedfor 5 years. Survival of the original cohort of canopyand subcanopy tree seedlings was next highest in three
of the four sites. Among the canopy tree seedlingspresent at the first census at LSUR, 4.5% became sap-lings during the 5-year period, compared with 3.8% atTIR, 1.6% at LEP and 2.1% at CR, the oldest site, sug-gesting that seedlings grew faster in the younger sites,where light availability was highest. Shrubs and lianasshowed low rates of seedling survival (< 50% in three ofthe four sites for each life-form).
Annualized mortality rates for the original cohort oftrees and canopy palms were lowest in the younger sitesand highest in the oldest site, and this was true as wellamong newly appearing tree seedlings. By contrast,annualized mortality rates for the original cohort ofsubcanopy trees, lianas and shrubs were lowest in theoldest site and highest in one of the younger sites(Table 5). However, mortality rates for shrub and lianaseedlings that recruited to the sites during the studyperiod showed the opposite trend, increasing with siteage. Recruitment rates for canopy and understoreypalms were far higher than those for other life-formsexcept at CR, where large numbers of tree recruits werealso recorded (Table 5).
Because of low mortality rates, every palm speciespresent at a site at the beginning of the study period waspresent at the end; at the same time, the sites were
Fig. 3 Change in the proportion of species in six life-forms is shown for each of five censuses in seedling communities in foursecond-growth tropical forest sites in Costa Rica. Species relative abundance increased among canopy palms and understoreypalms in all four sites and decreased in at least three of the sites among subcanopy trees, shrubs and lianas.
1079Seedling dynamics in tropical secondary forests
© 2005 British Ecological Society, Journal of Ecology93, 1071–1084
colonized by 3–10 new palm species. More than 25% of allrecruiting species were palms in three of the four sites(Table 6a). Each of the four sites lost at least 15% of itsoriginal shrub species and at least 20% of its originalliana species (Table 6b). In all four sites, trees rep-resented more than one-third of recruiting species(Table 6a) and more than 25% of the species that werelost from three sites (Table 6b), indicating that much ofthe change in community composition involved treespecies turnover.
-
Across sites, change in seedling abundance of canopytrees and subcanopy trees was more strongly correlatedwith recruitment rates than mortality (Table 7), whereas
change in abundance of canopy palms and lianas wasmore strongly correlated with mortality rates thanrecruitment. Change in shrub seedling abundance wascorrelated with both recruitment and mortality rates.Change in understorey palms was not strongly corre-lated with recruitment or mortality of newly recruitingseedlings. None of the correlations was statistically signi-ficant because of the low number of sites (n = 4).
Across the four sites, median light availability was morehighly correlated with recruitment rates (positively) thanwith mortality rates for understorey palms, shrubs andlianas, but it was more highly correlated (negatively)with mortality rates for canopy trees and canopy palms(Table 7). Forest age was most strongly and positivelycorrelated with change in abundance of canopy palms,subcanopy trees and shrubs, and it was negatively cor-related with change in abundance of subcanopy trees.
Fig. 4 Survival among the original cohort of seedlings of canopy trees (a), subcanopy trees (b), canopy palms (c) and understoreypalms (d) generally was higher than among shrubs (e) and lianas (f ) in four second-growth tropical forest sites, although survivalwithin life-forms varied somewhat among sites, especially for trees and palms. No survival is shown for understorey palms in TIRbecause none occurred there at the beginning of the 5-year study period.
1080R. S. Capers et al.
© 2005 British Ecological Society, Journal of Ecology93, 1071–1084
Discussion
Predicted trends in life-form composition and seedlingdensity from chronosequence studies were supportedby our observations over time in the four secondaryforests. Woody seedling density declined during the 5-year study period in all four sites and declined with siteage, whereas species density, evenness and the propor-tion of rare species generally increased within sites. Thegreatest changes in the seedling communities were rel-ative increases in the abundance and species richness oftrees and palms and corresponding declines amongshrubs and lianas. Evenness and the proportion of rarespecies appear to increase for at least 30 years after pas-ture abandonment, although at declining rates.
In species-rich tropical forests, many species are rare(Gentry 1988; Dallmeier et al. 1996). The increasingproportion of rare species in our four sites resulted inpart from the increasing representation of canopy treespecies that recruited from outside the study plots. Inthree of the four sites, more than 85% of the canopy tree
species that occur as singletons among the seedlingshad no potential parent (trees > 25 cm d.b.h.) withinthe same monitoring plot (R.L.C., unpublished data).The proportion of rare species is likely to continue torise as trees that have large, animal-dispersed seedsrecruit to the sites. This view is supported by theincrease of animal-dispersed palms. The abundance oftree species (including palms) with animal-dispersedseeds is higher and the abundance of those with ballis-tically dispersed seeds is lower in old-growth thansecondary-growth forests in the Sarapiquí region of CostaRica (Chazdon et al. 2003).
Mean seedling density declined with age in our sites, aspreviously found in Panama (Denslow & Guzman 2000).It is likely that decreasing seedling density results atleast in part from declining light levels in secondaryforests and that density rises again late in succession asstructural complexity and light heterogeneity increasewith the occurrence of large gaps (Nicotra et al. 1999;Chazdon in press). Density values in Panama (1.0–2.25seedlings m−2) were lower than those in our Costa
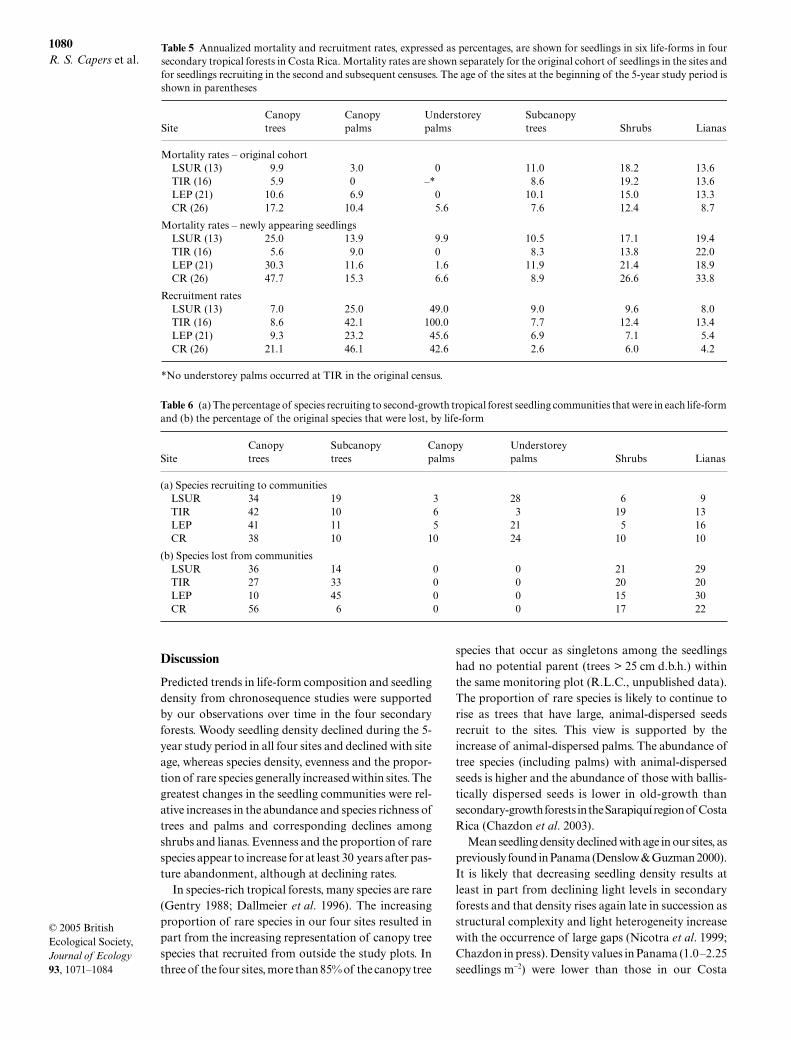
Table 5 Annualized mortality and recruitment rates, expressed as percentages, are shown for seedlings in six life-forms in foursecondary tropical forests in Costa Rica. Mortality rates are shown separately for the original cohort of seedlings in the sites andfor seedlings recruiting in the second and subsequent censuses. The age of the sites at the beginning of the 5-year study period isshown in parentheses
SiteCanopy trees
Canopy palms
Understorey palms
Subcanopy trees Shrubs Lianas
Mortality rates – original cohortLSUR (13) 9.9 3.0 0 11.0 18.2 13.6TIR (16) 5.9 0 –* 8.6 19.2 13.6LEP (21) 10.6 6.9 0 10.1 15.0 13.3CR (26) 17.2 10.4 5.6 7.6 12.4 8.7
Mortality rates – newly appearing seedlingsLSUR (13) 25.0 13.9 9.9 10.5 17.1 19.4TIR (16) 5.6 9.0 0 8.3 13.8 22.0LEP (21) 30.3 11.6 1.6 11.9 21.4 18.9CR (26) 47.7 15.3 6.6 8.9 26.6 33.8
Recruitment ratesLSUR (13) 7.0 25.0 49.0 9.0 9.6 8.0TIR (16) 8.6 42.1 100.0 7.7 12.4 13.4LEP (21) 9.3 23.2 45.6 6.9 7.1 5.4CR (26) 21.1 46.1 42.6 2.6 6.0 4.2
*No understorey palms occurred at TIR in the original census.
Table 6 (a) The percentage of species recruiting to second-growth tropical forest seedling communities that were in each life-formand (b) the percentage of the original species that were lost, by life-form
SiteCanopy trees
Subcanopy trees
Canopy palms
Understorey palms Shrubs Lianas
(a) Species recruiting to communitiesLSUR 34 19 3 28 6 9TIR 42 10 6 3 19 13LEP 41 11 5 21 5 16CR 38 10 10 24 10 10
(b) Species lost from communitiesLSUR 36 14 0 0 21 29TIR 27 33 0 0 20 20LEP 10 45 0 0 15 30CR 56 6 0 0 17 22
1081Seedling dynamics in tropical secondary forests
© 2005 British Ecological Society, Journal of Ecology93, 1071–1084
Rican sites (mean values of 9–23 seedlings per 5-m2
quadrat), possibly because Denslow & Guzman (2000)defined seedlings as 20–100 cm tall, whereas many ofours exceeded that height without reaching the 1-cm d.b.h. limit for our seedling size class. On the otherhand, a number of differences have been identifiedbetween the forests of north-east Costa Rica and otherNeotropical sites. Sites at the La Selva Biological Sta-tion have lower liana density (Mascaro et al. 2004),higher palm density (DeWalt & Chave 2004) and amore dense understorey herb layer (Harms et al. 2004)than several other Neotropical forests. Sites in north-east Costa Rica also have higher soil fertility (Harmset al. 2004) than many Neotropical sites and may havebeen less intensively used than former agricultural landin some areas (Guariguata et al. 1997).
The rate of change in the seedling communitiesdeclined with site age. Abundance declined and speciesdensity rose dramatically in sites 13–16 years old at thebeginning of our study but changed less in 21- and 26-
year-old sites. A similar decline in the rate of changewith site age was observed for trees of > 10 cm d.b.h. inthe four sites (Chazdon et al. in press). Together, theseresults suggest that change in at least some communityproperties – species richness and evenness amongthem – occurs primarily within the first 30 years afteragricultural abandonment and that values of theseproperties in successional forests quickly converge onthose in old-growth forests. In support of this sugges-tion, species richness in our secondary forest seedlingcommunities appears to be similar to that of matureforests in the region (Chazdon et al. 1998). Li et al.(1996) recorded 194 species in a total of 6281 identifiedseedlings in old-growth sites during a 6-year study. Oursite with the highest seedling abundance (TIR) includeda total of 5076 seedlings over the course of 5 years, andthese seedlings were of 185 species. Denslow & Guzman(2000) reported that seedling species richness wasrelatively constant in 20- to 100-year-old secondary forestsand in old-growth forest, after adjusting for differences
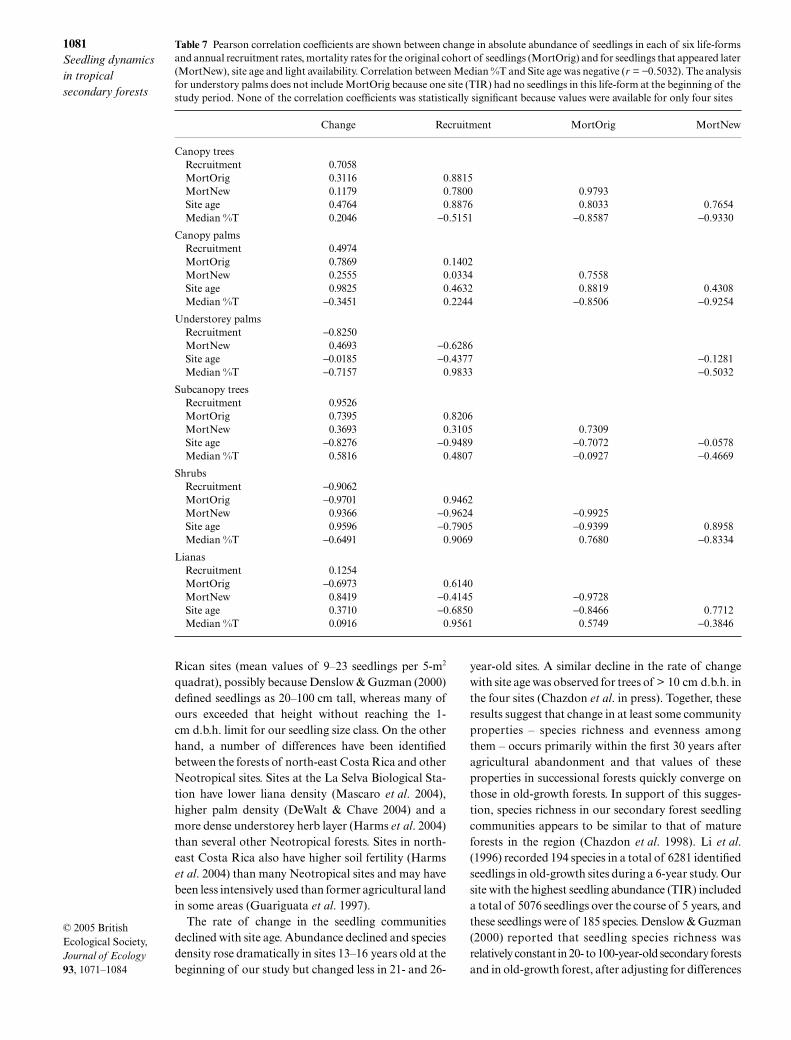
Table 7 Pearson correlation coefficients are shown between change in absolute abundance of seedlings in each of six life-formsand annual recruitment rates, mortality rates for the original cohort of seedlings (MortOrig) and for seedlings that appeared later(MortNew), site age and light availability. Correlation between Median %T and Site age was negative (r = −0.5032). The analysisfor understory palms does not include MortOrig because one site (TIR) had no seedlings in this life-form at the beginning of thestudy period. None of the correlation coefficients was statistically significant because values were available for only four sites
Change Recruitment MortOrig MortNew
Canopy treesRecruitment 0.7058MortOrig 0.3116 0.8815MortNew 0.1179 0.7800 0.9793Site age 0.4764 0.8876 0.8033 0.7654Median %T 0.2046 −0.5151 −0.8587 −0.9330
Canopy palmsRecruitment 0.4974MortOrig 0.7869 0.1402MortNew 0.2555 0.0334 0.7558Site age 0.9825 0.4632 0.8819 0.4308Median %T −0.3451 0.2244 −0.8506 −0.9254
Understorey palmsRecruitment −0.8250MortNew 0.4693 −0.6286Site age −0.0185 −0.4377 −0.1281Median %T −0.7157 0.9833 −0.5032
Subcanopy treesRecruitment 0.9526MortOrig 0.7395 0.8206MortNew 0.3693 0.3105 0.7309Site age −0.8276 −0.9489 −0.7072 −0.0578Median %T 0.5816 0.4807 −0.0927 −0.4669
ShrubsRecruitment −0.9062MortOrig −0.9701 0.9462MortNew 0.9366 −0.9624 −0.9925Site age 0.9596 −0.7905 −0.9399 0.8958Median %T −0.6491 0.9069 0.7680 −0.8334
LianasRecruitment 0.1254MortOrig −0.6973 0.6140MortNew 0.8419 −0.4145 −0.9728Site age 0.3710 −0.6850 −0.8466 0.7712Median %T 0.0916 0.9561 0.5749 −0.3846
1082R. S. Capers et al.
© 2005 British Ecological Society, Journal of Ecology93, 1071–1084
in density, and similar findings were reported by DeWaltet al. (2003) for trees of > 5 cm d.b.h. in a chronose-quence of Panamanian sites that included old-growthforests.
Although species richness in secondary forestsapproaches or equals that in mature forests within 40–70 years, community composition remains differentfor much longer, possibly for centuries (Finegan 1996;DeWalt et al. 2003; Chazdon in press). Similarity ana-lysis and the DCA provided no evidence that composi-tion of our seedling communities became more similarover time. Compositional differences among thecommunities, particularly those outside of La SelvaBiological Station, indicate that seedling communitiesare drawn from different source communities and/orthat colonization is highly stochastic. Thus, secondaryforests that are young and rapidly accumulating newspecies are more likely to diverge in composition over timeif they exist in a fragmented landscape, as do our studysites. Convergence may occur later in succession in oursites, with the arrival of late-successional species andtheir recruitment as mature individuals. Convergence isalso possible in early successional sites if they are sur-rounded by continuous areas of intact forest, althoughthe effects of soil fertility and disturbance remain to betested. Evidence of community convergence in chron-osequence studies has been equivocal. DeWalt et al.(2003) found that secondary forest tree communitiesbecame more similar to old-growth forest during suc-cession. Guariguata et al. (1997) found that similarityamong canopy trees of > 10 cm d.b.h. was neitherhigher nor lower but was more variable in secondarythan old-growth forests, and Chazdon (in press) showedthat community similarity in our four sites was un-related to site age for both canopy trees of > 10 cm d.b.h.and saplings.
Although the total number of species changed littlein our communities during the 5-year period, life-formrepresentation changed dramatically. Palm seedlingabundance and species richness increased sharply in allfour sites at approximately the same time, betweenJanuary and May 2000, possibly in response to unusuallywet conditions. January and February are relatively drymonths at La Selva, although still averaging a combined430 mm (unpublished data available from La Selva athttp://www.ots.ac.cr/en/ laselva/metereological.shtml),but rainfall during January–February in 2000 (1027 mm)was the highest recorded since 1958. These unusuallywet conditions may have favoured palm germinationand rapid growth.
Declining light availability in older sites appeared tobe particularly important in reducing shrub and lianarecruitment and increasing mortality among canopytrees and palms, although these losses were overcomeamong palms by even higher recruitment rates. Unlikethe other sites, substantial numbers of new liana andshrub species continued to recruit at TIR, the site withthe highest light levels (Table 1). The low numbers ofpalm species and palm seedlings at TIR could be due to
low abundance of mature palms there (R.L.C., unpub-lished data) and its isolation from old-growth forestfragments that could serve as seed sources. This isola-tion probably contributes as well to the low tree speciesrichness of the site, after rarefaction (Table 3).
Mortality rates among canopy tree seedlings weresimilar to those in other studies of Neotropical seedlings,varying from 6% to 17% on an annual basis among theoriginal cohort of seedlings and from 6% to 48%among newly recruiting seedlings. De Steven (1994)found first-year mortality of 31–50% in three tree spe-cies, declining to 10% or lower in the second year forseedlings that were > 50 cm in height. Mortality ratesin our sites were strongly influenced by performance ofindividual species. High canopy tree seedling mortalityin CR, for instance, was greatly influenced by the veryhigh abundance at that site of Pentaclethra macroloba,which had very high 5-year mortality there (95.3%).
Although we focused on within-site changes, thegeneral trends observed within sites were strongly sup-ported by comparison across the sites: species richnessand evenness were higher in the oldest site than theyoungest. Tree species increased as a proportion of allspecies with successional age (Table 2), and the propor-tion of rare tree species was higher in the oldest sitethan the youngest. Canopy palm abundance increasedwith successional age, and shrub seedling abundancedeclined until 31 years after agricultural abandonment(Fig. 2), while lianas represented a declining pro-portion of all seedling species with successional age(Fig. 3). Overall, the changes we observed among seed-ling communities mirror those seen in chronosequencestudies on plants in larger size classes, lending supportto the assumptions of chronosequence studies inNeotropical forests.
Secondary succession in Neotropical plant com-munities is influenced by many factors, including theavailability of seed sources and the declining availabilityof light. Although much further research is needed on theinteraction of factors that drive change in seedlingcommunities, it is clear that the distinctive life-formcomposition of secondary tropical forests is producedin the seedling communities and can be fruitfullystudied among seedlings. It also appears that, althoughcommunity composition does not converge quickly,life-form composition does show consistent trendswithin and across sites. Studies focusing on abundanceand composition of different woody life-forms may beparticularly useful in understanding and predictingsuccessional dynamics in tropical forests and otherhyperdiverse systems.
Acknowledgements
We thank Marcos Molina, Jeanette Paniagua and JuanRomero for maintaining the seedling plots and con-ducting seedling censuses. We also thank Pablo Sánchezfor permitting us to use his sapling data and Robert K.Colwell for making available an unreleased version of
1083Seedling dynamics in tropical secondary forests
© 2005 British Ecological Society, Journal of Ecology93, 1071–1084
the EstimateS software. Two anonymous refereesgreatly improved the clarity with which the material ispresented. We acknowledge the technical and logisticalsupport of the Organization for Tropical Studies, andthe financial support of the Andrew Mellon Founda-tion, the Environmental Protection Agency’s ScienceTo Achieve Results fellowship programme and theUniversity of Connecticut Research Foundation.
References
Butterfield, R.P. (1994) The regional context: land colonizationand conservation in Sarapiquí. La Selva: Ecology and nat-ural history of a Neotropical rain forest (eds L.A. McDade,K.S. Bawa, H.A. Hespenheide & G.S. Hartshorn), pp. 299–306. University of Chicago Press, Chicago.
Capers, R.S. & Chazdon, R.L. (2004) Rapid assessmentof understorey light availability in a wet tropical forest.Agricultural and Forest Meteorology, 123, 177–185.
Chao, A., Chazdon, R.L., Colwell, R.K. & Shen, T.-J. (2005)A new statistical approach for assessing similarity of speciescomposition with incidence and abundance data. EcologyLetters, 8, 148–159.
Chazdon, R.L. (in press) Dynamics of tropical secondary for-ests. Tropical Plant Community Ecology (eds S. Schnitzer &W. Carson). Blackwell Publishing, Oxford.
Chazdon, R.L., Careaga, S., Webb, C. & Vargas, O. (2003)Community and phylogenetic structure of reproductivetraits in woody species in wet tropical forests. EcologicalMonographs, 73, 331–348.
Chazdon, R.L., Colwell, R.K., Denslow, J.S. & Guariguata,M.R. (1998) Statistical methods for estimating species rich-ness of woody regeneration in primary and secondary rainforests of NE Costa Rica. Forest Biodiversity Research,Monitoring and Modeling: Conceptual Background and OldWorld Case Studies (eds F. Dallmeier & J. Comiskey),pp. 285–309. Parthenon Publishing, Paris.
Chazdon, R.L., Redondo B.A. & Vilchez, A.B. (2005) Effectsof climate and stand age on annual tree dynamics in tropicalsecond-growth rain forests. Ecology, 86, 1808–1815.
Colwell, R.K. (2005) EstimateS: statistical estimation ofspecies richness and shared species from samples, Version7.5. URL http://viceroy.eeb.uconn.edu/estimates. Persist-ent URL http://purl.oclc.org/estimates.
Dallmeier, F., Kabel,M. & Foster, R.B. (1996) Floristic com-position, diversity, mortality and recruitment on differentsubstrates: lwland tropical forest, Pakitza, Río Manu, Peru.Manu: The Biodiversity of Southeastern Peru (eds D.E. Wilson& A. Sandoval), pp. 61–88. Smithsonian Institution,Washington, DC.
De Steven, D. (1994) Tropical tree seedling dynamics: recruitmentpatterns and their population consequences for three canopyspecies in Panama. Journal of Tropical Ecology, 19, 369–383.
Denslow, J.S., Guzman, G. & S. (2000) Variation in standstructure, light and seedling abundance across a tropicalmoist forest chronosequence, Panama. Journal of Vegeta-tion Science, 11, 201–212.
DeWalt, S.J. & Chave, J. (2004) Structure and biomass of fourlowland Neotropical forests. Biotropica, 36, 7–19.
DeWalt, S.J., Maliakal, S.K. & Denslow, J.S. (2003) Changesin vegetation structure and composition along a tropicalforest chronosequence: implications for wildlife. ForestEcology and Management, 182, 139–151.
DeWalt, S.J., Schnitzer, S.A. & Denslow, J.S. (2000) Densityand diversity of lianas along a chronosequence in a centralPanamanian lowland forest. Journal of Tropical Ecology,16, 1–19.
Farris Lopez, K. (2001) Palm community development andinfluence on seedling establishment in a tropical moist forest,
Panama. MS thesis. Louisiana State University, BatonRouge, Louisiana.
Finegan, B. (1996) Pattern and process in Neotropical second-ary rain forests: the first 100 years of succession. Trends inEcology and Evolution, 11, 119–124.
Fisher, R.F. (1995) Amelioration of degraded rain forest soilsby plantation of native trees. Soil Science Society of Amer-ica Journal, 59, 544–549.
Gentry, A.H. (1988) Changes in plant community diversityand floristic composition on environmental and geographicalgradients. Annals of the Missouri Botanical Garden, 75, 1–34.
Gotelli, N. & Colwell, R.K. (2001) Quantifying biodiversity:procedures and pitfalls in the measurement and comparisonof species richness. Ecology Letters, 4, 379–391.
Guariguata, M.R., Chazdon, R.L., Denslow, J.S., Dupuy, J.M.& Anderson, L. (1997) Structure and floristics of secondaryand old-growth forest stands in lowland Costa Rica. PlantEcology, 132, 107–120.
Guariguata, M. & Ostertag, R. (2001) Neotropical secondaryforest succession: changes in structural and functional charac-teristics. Forest Ecology and Management, 148, 185–206.
Harms, K.E., Powers, J.S. & Montgomery, R.A. (2004)Variation in small sapling density, understorey cover, andresource availability in four Neotropical forests. Biotropica,36, 40–51.
Harms, K.E., Wright, S.J., Calderón, O., Hernández, A. &Herre, E.A. (2000) Pervasive density-dependent recruitmentenhances seedling diversity in a tropical forest. Nature, 404,493–495.
Hegarty, E.E. & Caballé, G. (1991) Distribution and abund-ance of vines in forest communities. The Biology of Vines(eds F.E. Putz & H.A. Mooney), pp. 313–336. CambridgeUniversity Press, Cambridge.
Holdridge, L.R., Grenke, W.G., Hatheway, W.H., Liang, T. &Tosi, J.A. (1975) Forest Environments in Tropical Life Zones.Pergamon Press, New York.
Laska, M.S. (1997) Structure of understorey shrub assemblagesin adjacent secondary and old-growth tropical forests,Costa Rica. Biotropica, 29, 29–37.
Li, M., Lieberman, M. & Lieberman, D. (1996) Seedlingdemography in understory tropical wet forest in CostaRica. The Ecology of Tropical Forest Tree Seedlings (ed.M.D. Swaine), pp. 285–314. Unesco, Paris.
Martin, P.H., Sherman, R.E & Fahey, T.J. (2004) Forty yearsof tropical forest recovery from agriculture: structure andfloristics of secondary and old-growth riparian forests inthe Dominican Republic. Biotropica, 36, 297–317.
Mascaro, J., Schnitzer, S.A. & Carson, W.P. (2004) Lianadiversity, abundance, and mortality in a tropical wet forestin Costa Rica. Forest Ecology and Management, 190, 3–14.
McCune, B. & Mefford, M.J. (1997) PC-ORD for Windows:Multivariate Analysis of Ecological Data, Version 3.20.MjM Software, Gleneden Beach, Oregon.
Nicotra, A.B., Chazdon, R.L. & Iriarte, S.V.B. (1999) Spatialheterogeneity of light and woody seedling regeneration intropical wet forests. Ecology, 80, 1908–1926.
Peña-Claros, M. (2003) Changes in forest structure and spe-cies composition during secondary forest succession in theBolivian Amazon. Biotropica, 35, 450–461.
Peña-Claros, M. & de Boo, H. (2002) The effect of forestsuccessional stage on seed removal of tropical rain foresttree species. Journal of Tropical Ecology, 18, 261–274.
Pickett, S.T.A. (1989) Space-for-time substitution as an alternativeto long-term studies. Plant Succession: Theory and Prediction(ed. G.E. Likens), pp. 110–135. Springer-Verlag, New York.
Ruiz, J., Fandiño, M.C. & Chazdon, R.L. (in press) Vegetationstructure, composition, and species richness across a 56-yearchronosequence of dry tropical forest in Providencia Island,Colombia. Biotropica.
Saldarriaga, J.G., West, D.C., Tharp, M.L. & Uhl, C. (1988)Long-term chronosequence of forest succession in the
1084R. S. Capers et al.
© 2005 British Ecological Society, Journal of Ecology93, 1071–1084
Upper Rio Negro of Colombia and Venezuela. Journal ofEcology, 76, 938–958.
Sanford, R.I. Jr, Paaby, P., Luvall, J.C. & Phillips, E. (1994)Climate, geomorphology and aquatic systems. La Selva:Ecology and Natural History of a Neotropical Rainforest(eds L.A. McDade, K.S. Bawa, H.A. Hespenheide & G.S.Hartshorn), pp. 19–33. University of Chicago Press, Chicago.
Sheil, D. (1999) Developing tests of successional hypotheseswith size-structured populations, and an assessment usinglong-term data from a Ugandan rain forest. Plant Ecology,140, 117–127.
Sheil, D., Burslem, D.F.R.P. & Alder, D. (1995) The inter-pretation and misinterpretation of mortality rate measures.Journal of Ecology, 83, 331–333.
Sheil, D., Jennings, S. & Savill, P. (2000) Long-term permanentplot observations of vegetation dynamics in Budongo, aUgandan rain forest. Journal of Tropical Ecology, 16, 765–800.
Sokal, R.R. & Rohlf, F.J. (1995) Biometry: the Principles andPractice of Statistics in Biological Research, 3rd edn. W.H.Freeman, New York.
Sollins, P., Sancho, M.F., Mata, Ch, R. & Sanford, R.L.J.(1994) Soils and soil process research. La Selva: Ecology andNatural History of a Neotropical Rain Forest (eds L.A.McDade, K.S. Bawa, H.A. Hespenheide & G.S. Hartshorn),pp. 34–53. University of Chicago Press, Chicago.
Svenning, J.-C. (1998) The effect of land-use on the local dis-tribution of palm species in an Andean rain forest fragmentin northwestern Ecuador. Biodiversity and Conservation, 7,1529–1537.
Terborgh, J., Foster, R.B. & Nuñez, V. P. (1996) Tropical treecommunities: a test of the nonequilibrium hypothesis. Ecology,77, 561–567.
Vandermeer, J., de la Cerda, I.G., Perfecto, I., Boucher, D.,Ruiz, J. & Kaufmann, A. (2004) Multiple basins of attractionin a tropical forest: evidence for nonequilibrium communitystructure. Ecology, 85, 575–579.
Received 13 April 2005 revision accepted 7 June 2005 Handling Editor: Kyle Harms
Related Documents