Khorshid and Kadhm Iraqi Journal of Science, 2015, Vol.56, No.4C, pp: 3441-3451 __________ _______________________ *Email: dr.salmankhorshid @yahoo.com 3441 Subsurface Investigation of Oligocene Geologic Formations Age, East Baghdad Oil Field Salman Z. Khorshid*, Ayat D. Kadhm Department of Geology, College of Science, University of Baghdad, Baghdad, Iraq Abstract An investigate of the subsurface of East Baghdad Oil field South-1 and South-2, by using the interactive workstation Geoframe. The study is interested with Oligocene Formations which is an extension of Kirkuk group. Synthetic seismogram is generated from data of EB-15 well. Base of Lowe-Fars reflector is picked and identified because it is close to Jeribe Formation that was deposited in the same depositional environment of Kirkuk group. The seismic sections and time slice maps confirmed that the Oligocene age was not affected by faults and the signs or indicators of faults started from Hartha Formation and continue to the deeper formations with increasing intensity, where the variance attribute section was applied on time slice and shows that the area was affected by listric growth normal fault parallel to the structure of the field trends (NW-SE) and affected by number of transverse faults trend (E-W) and (NE-SW). Time map, velocity map and depth map of base Lower-Fars reflector depending on data from (EB-2, EB-4, EB-5, EB-6, EB- 15, EB-24), the maps was showed the structural picture of East Baghdad that formed structural nose opened toward NW and trending (NW-SE) that confirmed by 3D volume which prepared for the studied area. By studying the seismic sections and applying seismic attributes(instantaneous phase, reflection magnitude, and variance attributes) discovered the presence of Direct Hydrocarbon Indicator at shallow depth in Oligocene age represented by flat spot at Bajwan/Baba Formation and dim spot below Dhiban/ Euphrates Formations in locations inlines 49235, 49225, 49190, and 49095, cross line 11700. Further confirmation on the presence of Direct Hydrocarbon Indicator is outlined from the application of flattening technique on seismic and attributes sections. Finally the surface area of the spreading of spot has been calculated in MESA expert 11.02 program that reaches approximately 13.47 km 2 . Keywords: Structural and Direct Hydrocarbon Indicator study-Oligocene age-East Baghdad oil field. سطحي لتكحتستقصاء ت ا شرق بغداد النفطين في حقلوليكوسيوين عمر ا العابدين خورشيدن زين اما سم* , يات دفاع كاظم ارضم ا عم قسم, وم كمية العم, معة بغداد جا اق , بغداد, العرصة الخ تم استقصاء اء ا جرل شرق بغداد بجزئيوحت سطحي لحق تsouth-1 وsouth-2 محطة بأستخداملتفاعميةعمل ا الGeoframe وين عمر اسة ميتمة بتكا انت الدر . و كا ون التي ىي امتداد ليكوسي لمجموعةوك. كركت البئر بياناع منثر المصن عمل ا تمEB-15 نو سفلرس الفاعدة ااط عاكس قا حيث تم التقبي قريب من تكوين الجري البيئة الترسيبيةي نفس الذي ترسب ف الطع الزلزلمقا. اكدت اوك لمجموعة كرك ية وى الفوالق بدأت منئل عملفوالق و ان الدوليكوسين غير متأثرة باوين عمر ان تكا ائح الزمنية ا ائط الشر خر الي الزبع الزلتادة شدة التفمق و عند تطبيق اميقة مع زياوين العلتكامرت الى ارثة و استلياوين ا تكاvariance ISSN: 0067-2904 GIF: 0.851

Welcome message from author
This document is posted to help you gain knowledge. Please leave a comment to let me know what you think about it! Share it to your friends and learn new things together.
Transcript
Khorshid and Kadhm Iraqi Journal of Science, 2015, Vol.56, No.4C, pp: 3441-3451
_________________________________
*Email: dr.salmankhorshid @yahoo.com
3441
Subsurface Investigation of Oligocene Geologic Formations Age, East
Baghdad Oil Field
Salman Z. Khorshid*, Ayat D. Kadhm Department of Geology, College of Science, University of Baghdad, Baghdad, Iraq
Abstract
An investigate of the subsurface of East Baghdad Oil field South-1 and South-2,
by using the interactive workstation Geoframe. The study is interested with
Oligocene Formations which is an extension of Kirkuk group. Synthetic seismogram
is generated from data of EB-15 well. Base of Lowe-Fars reflector is picked and
identified because it is close to Jeribe Formation that was deposited in the same
depositional environment of Kirkuk group. The seismic sections and time slice maps
confirmed that the Oligocene age was not affected by faults and the signs or
indicators of faults started from Hartha Formation and continue to the deeper
formations with increasing intensity, where the variance attribute section was
applied on time slice and shows that the area was affected by listric growth normal
fault parallel to the structure of the field trends (NW-SE) and affected by number of
transverse faults trend (E-W) and (NE-SW). Time map, velocity map and depth map
of base Lower-Fars reflector depending on data from (EB-2, EB-4, EB-5, EB-6, EB-
15, EB-24), the maps was showed the structural picture of East Baghdad that formed
structural nose opened toward NW and trending (NW-SE) that confirmed by 3D
volume which prepared for the studied area. By studying the seismic sections and
applying seismic attributes(instantaneous phase, reflection magnitude, and variance
attributes) discovered the presence of Direct Hydrocarbon Indicator at shallow depth
in Oligocene age represented by flat spot at Bajwan/Baba Formation and dim spot
below Dhiban/ Euphrates Formations in locations inlines 49235, 49225, 49190, and
49095, cross line 11700. Further confirmation on the presence of Direct
Hydrocarbon Indicator is outlined from the application of flattening technique on
seismic and attributes sections. Finally the surface area of the spreading of spot has
been calculated in MESA expert 11.02 program that reaches approximately 13.47
km2.
Keywords: Structural and Direct Hydrocarbon Indicator study-Oligocene age-East
Baghdad oil field.
اوين عمر االوليكوسين في حقل شرق بغداد النفطياستقصاء تحت سطحي لتك
ايات دفاع كاظم, *سممان زين العابدين خورشيد
, بغداد, العراقجامعة بغداد, كمية العموم, قسم عمم االرض الخالصةبأستخدام محطة south-2و south-1تحت سطحي لحقل شرق بغداد بجزئيو جراء استقصاءتم ا
لمجموعة ليكوسين التي ىي امتدادو . و كانت الدراسة ميتمة بتكاوين عمر اال Geoframeالعمل التفاعمية حيث تم التقاط عاكس قاعدة الفارس االسفل النو EB-15تم عمل االثر المصنع من بيانات البئر كركوك.
ية و لمجموعة كركوك. اكدت المقاطع الزلزال الذي ترسب في نفس البيئة الترسيبيةقريب من تكوين الجريبي خرائط الشرائح الزمنية ان تكاوين عمر االوليكوسين غير متأثرة بالفوالق و ان الدالئل عمى الفوالق بدأت من
varianceتكاوين اليارثة و استمرت الى التكاوين العميقة مع زيادة شدة التفمق و عند تطبيق التابع الزالزالي
ISSN: 0067-2904 GIF: 0.851
Khorshid and Kadhm Iraqi Journal of Science, 2015, Vol.56, No.4C, pp: 3441-3451
3442
attribute بين ان المنطقة متأثرة بفالقlistric أتجاه موازي لمحور تركيب شرق بغداد ب(NW-SE) و متأثرالفارس )لسرعة و الزمن لعاكس ا. خرائط (NE-SW)و(E-W)باتجاىات بعدد من الفوالق المستعرضة
. (EB-2,-EB-4,EB-5,EB-6, EB-15,EB-24)التي استخدمت بيانات من ابار (الفتحة األسفلو تم تأكيد (NW-SE)و انحدار NWشم تركيبي مفتوح بأتجاهوضحت ان الصورة التركيبية لمحقل عبارة عن خ
ذلك من خالل عمل مكعب زلزالي ثالثي اإلبعاد. و من خالل تطبيق و دراسة التوابع تم التوصل (instantaneous phase, reflection magnitude, and variance attributes)الزلزالية
بقعة مستوية في تكوين في تكاوين االوليكوسين متمثمة ب DHIالى وجود دالئل مباشرة لميايدروكاربونات inline 49235, inline 49225, inlineبقعة معتمة اسفل تكوين ذبان/الفرات في المواقع و بجوان/بابا
49190, inline49095, crossline 11700. و تم تأكيد ذلك من خالل تطبيق تقنية الflattening وحيث بمغت تقريبًا MESA expert 11.02سطحية النتشار البقعة بأستخدام برنامج من ثم حساب المساحة ال
.2كم 74,31
Introduction The geophysical techniques most widely employed for exploration work are the seismic, gravity,
magnetic, electrical, and electromagnetic methods. Some of these are used almost entirely in the
search for oil and gas [1]. Seismic methods are the most effective, and the most expensive, of all the
geophysical techniques used to investigate layered media [2]. Seismic reflection surveying is the most
widely used and well-known geophysical technique [3]. , and gives more direct and detailed picture of
the subsurface geological structures. It is more suitable in areas where the oil is in structural traps, but
it is also useful for locating and detailing certain types of stratigraphic features [4]. This information
could be used to determine the internal stratigraphic geometry interpretation in terms of environmental
deposition paleogeography and analysis of sedimentary basin [5]. If amplitude anomalies at target
level are seen to be correlated with overlying or underlying changes (high or low amplitudes due to
lithology or gas effects, or overburden faulting, for example) then they should be treated with
suspicion. Such correlation might have a genuine geological cause, but careful thought was needed to
establish that the effect is not-an artifact. Following the amplitude anomaly through the seismic
processing sequence from the raw gathers may be helpful; this may reveal an artifact being introduce
in a particular processing step to recognize hydrocarbon effects ( Direct Hydrocarbon Indicators,
DHIs) for what they are [6].
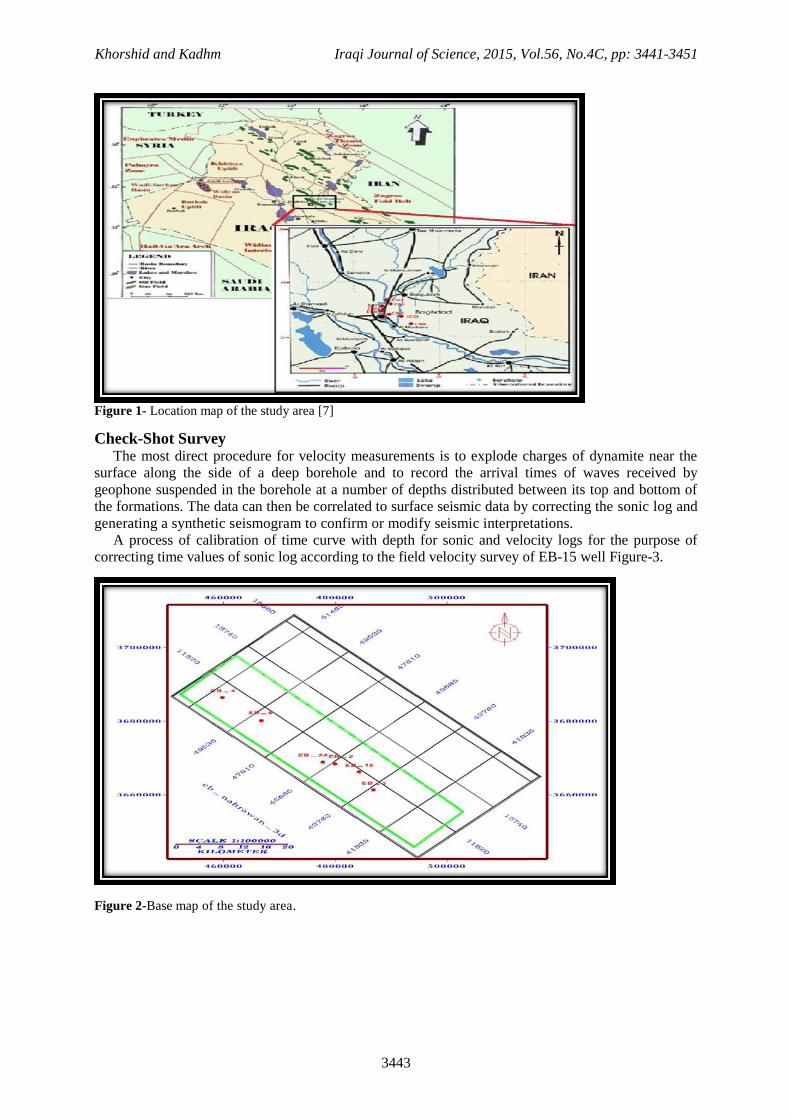
Location of the Study Area The studied area (East Baghdad oil field south-1 and south-2) is located in the middle parts of Iraq
to the south of Diyala river within the boundaries of Al-Madaen province that belong to Baghdad
governorate on the eastern side of Mesopotamian basin and within the administrative border of the
province of Bahdad/Diyala.Lies within the tectonically stable Mesopotamian basin between the Zagros
fold belt and the Arabian shield Figure-1.
Loading of 3D Seismic Data Processed seismic data are loaded in the interactive workstation Geoframe of interpretation in
SEG-Y format and before starting; special subprograms must be operated to define the required data
for loading. This process is called (project creation) for achieving the interpretation process on an
interactive workstation, loading of 3D seismic data in pre stacks and post stack time migrated format.
After that, the base map of the study area is constructed with global coordinate's browser WG 1984
UTM system. This process includes entering the first and last inline number, the first and last cross
line number, the separated distance between bin size along inline direction and cross line direction
Figure-2.
Khorshid and Kadhm Iraqi Journal of Science, 2015, Vol.56, No.4C, pp: 3441-3451
3443
Figure 1- Location map of the study area [7]
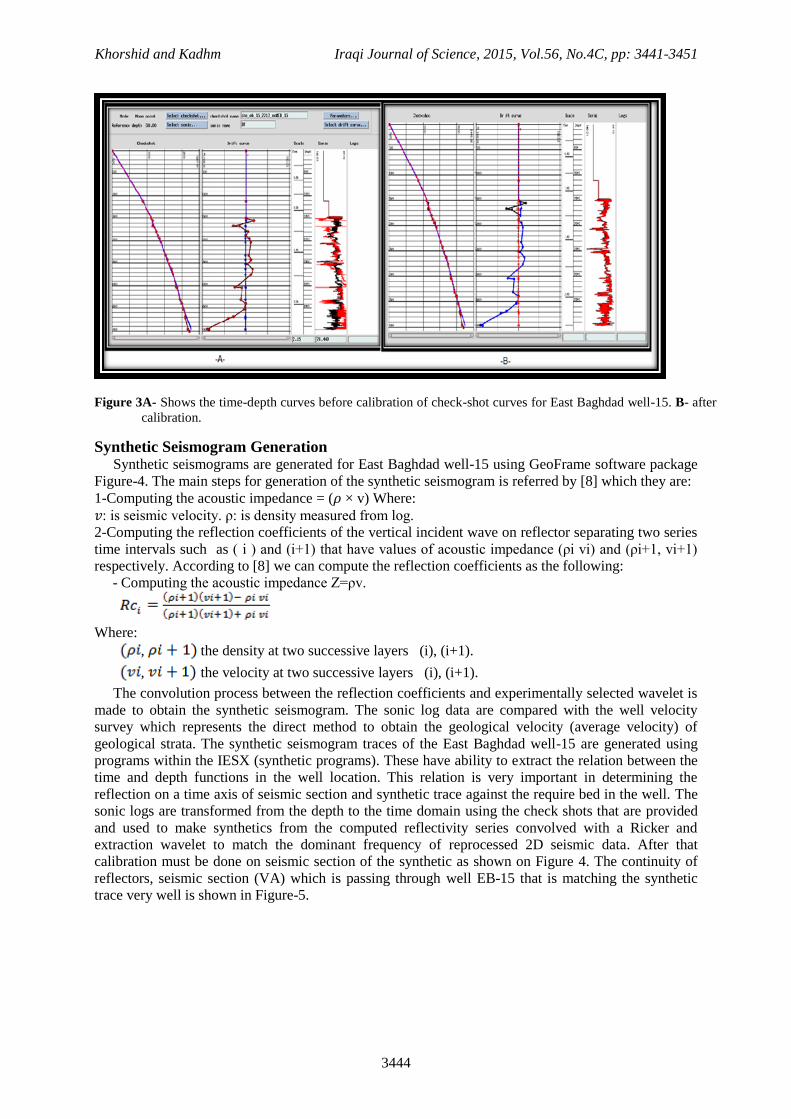
Check-Shot Survey The most direct procedure for velocity measurements is to explode charges of dynamite near the
surface along the side of a deep borehole and to record the arrival times of waves received by
geophone suspended in the borehole at a number of depths distributed between its top and bottom of
the formations. The data can then be correlated to surface seismic data by correcting the sonic log and
generating a synthetic seismogram to confirm or modify seismic interpretations.
A process of calibration of time curve with depth for sonic and velocity logs for the purpose of correcting time values of sonic log according to the field velocity survey of EB-15 well Figure-3.
Figure 2-Base map of the study area.
Khorshid and Kadhm Iraqi Journal of Science, 2015, Vol.56, No.4C, pp: 3441-3451
3444
Figure 3A- Shows the time-depth curves before calibration of check-shot curves for East Baghdad well-15. B- after
calibration.
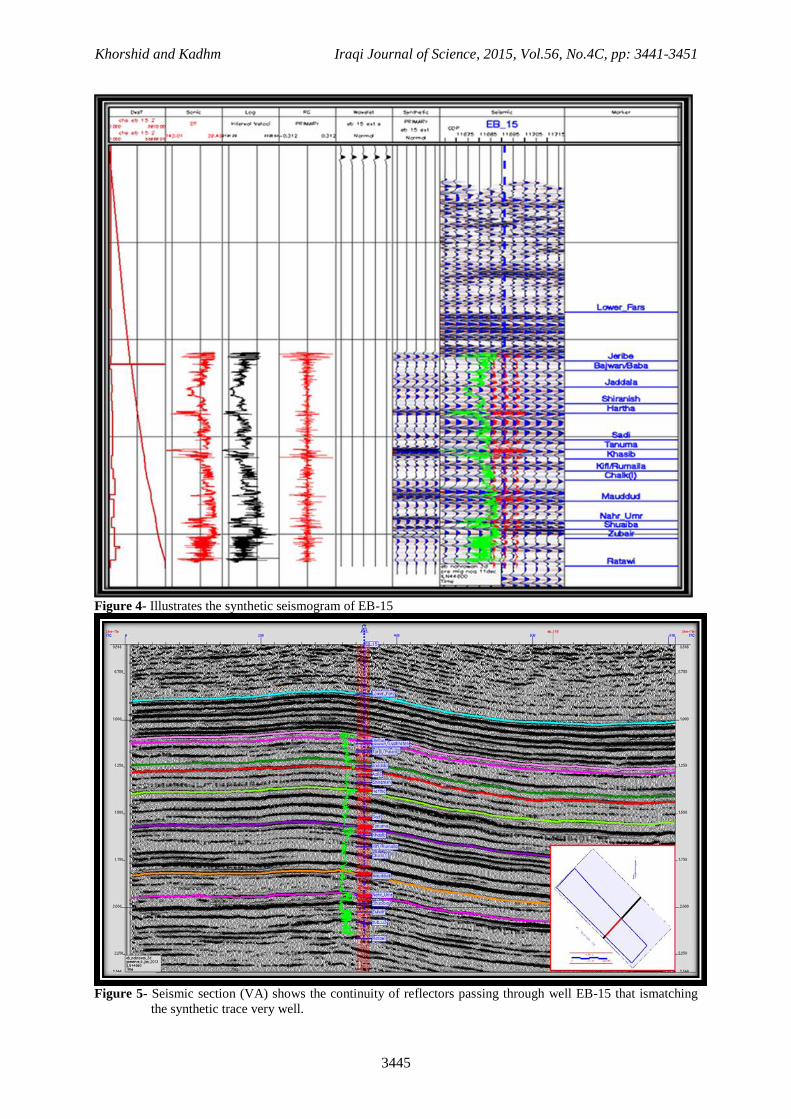
Synthetic Seismogram Generation Synthetic seismograms are generated for East Baghdad well-15 using GeoFrame software package
Figure-4. The main steps for generation of the synthetic seismogram is referred by [8] which they are: 1-Computing the acoustic impedance = (𝜌 × v) Where:
𝑣: is seismic velocity. ρ: is density measured from log.
2-Computing the reflection coefficients of the vertical incident wave on reflector separating two series
time intervals such as ( i ) and (i+1) that have values of acoustic impedance (ρi vi) and (ρi+1, vi+1)
respectively. According to [8] we can compute the reflection coefficients as the following:
- Computing the acoustic impedance Z=ρv.
Where:
, the density at two successive layers (i), (i+1).
, the velocity at two successive layers (i), (i+1).
The convolution process between the reflection coefficients and experimentally selected wavelet is
made to obtain the synthetic seismogram. The sonic log data are compared with the well velocity
survey which represents the direct method to obtain the geological velocity (average velocity) of
geological strata. The synthetic seismogram traces of the East Baghdad well-15 are generated using
programs within the IESX (synthetic programs). These have ability to extract the relation between the
time and depth functions in the well location. This relation is very important in determining the
reflection on a time axis of seismic section and synthetic trace against the require bed in the well. The
sonic logs are transformed from the depth to the time domain using the check shots that are provided
and used to make synthetics from the computed reflectivity series convolved with a Ricker and
extraction wavelet to match the dominant frequency of reprocessed 2D seismic data. After that
calibration must be done on seismic section of the synthetic as shown on Figure 4. The continuity of
reflectors, seismic section (VA) which is passing through well EB-15 that is matching the synthetic
trace very well is shown in Figure-5.
Khorshid and Kadhm Iraqi Journal of Science, 2015, Vol.56, No.4C, pp: 3441-3451
3445
Figure 4- Illustrates the synthetic seismogram of EB-15
Figure 5- Seismic section (VA) shows the continuity of reflectors passing through well EB-15 that ismatching
the synthetic trace very well.
Khorshid and Kadhm Iraqi Journal of Science, 2015, Vol.56, No.4C, pp: 3441-3451
3446
The match between seismic traces and synthetic traces is good. The picked reflectors wavelets
appeared as peaks on synthetic trace (positive reflection) but in different intensity.
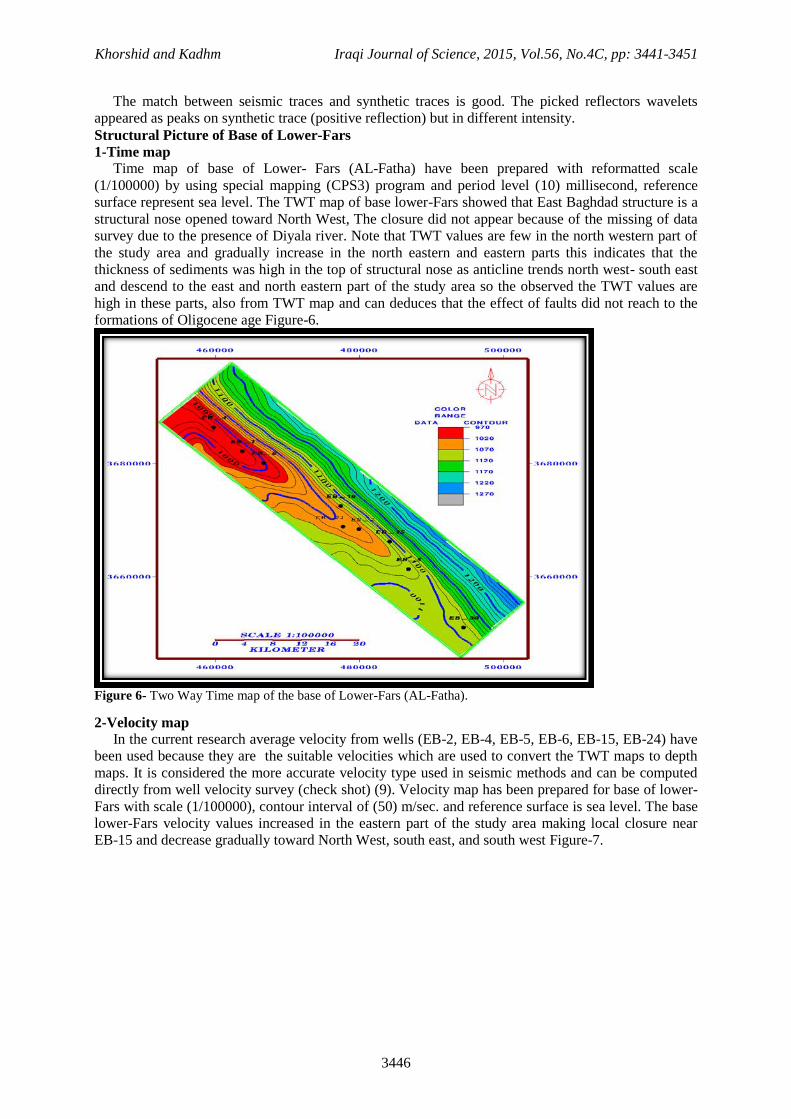
Structural Picture of Base of Lower-Fars
1-Time map
Time map of base of Lower- Fars (AL-Fatha) have been prepared with reformatted scale
(1/100000) by using special mapping (CPS3) program and period level (10) millisecond, reference
surface represent sea level. The TWT map of base lower-Fars showed that East Baghdad structure is a
structural nose opened toward North West, The closure did not appear because of the missing of data
survey due to the presence of Diyala river. Note that TWT values are few in the north western part of
the study area and gradually increase in the north eastern and eastern parts this indicates that the
thickness of sediments was high in the top of structural nose as anticline trends north west- south east
and descend to the east and north eastern part of the study area so the observed the TWT values are
high in these parts, also from TWT map and can deduces that the effect of faults did not reach to the
formations of Oligocene age Figure-6.
Figure 6- Two Way Time map of the base of Lower-Fars (AL-Fatha).
2-Velocity map
In the current research average velocity from wells (EB-2, EB-4, EB-5, EB-6, EB-15, EB-24) have
been used because they are the suitable velocities which are used to convert the TWT maps to depth
maps. It is considered the more accurate velocity type used in seismic methods and can be computed
directly from well velocity survey (check shot) (9). Velocity map has been prepared for base of lower-
Fars with scale (1/100000), contour interval of (50) m/sec. and reference surface is sea level. The base
lower-Fars velocity values increased in the eastern part of the study area making local closure near
EB-15 and decrease gradually toward North West, south east, and south west Figure-7.
Khorshid and Kadhm Iraqi Journal of Science, 2015, Vol.56, No.4C, pp: 3441-3451
3447
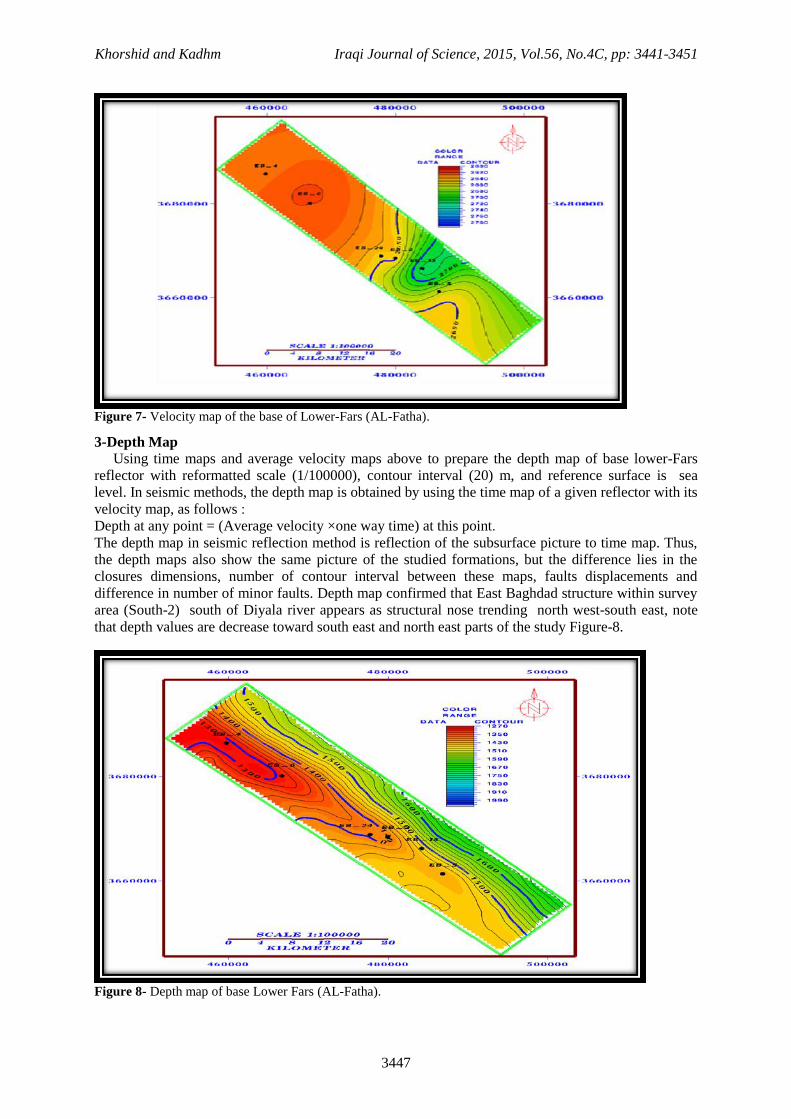
Figure 7- Velocity map of the base of Lower-Fars (AL-Fatha).
3-Depth Map
Using time maps and average velocity maps above to prepare the depth map of base lower-Fars
reflector with reformatted scale (1/100000), contour interval (20) m, and reference surface is sea
level. In seismic methods, the depth map is obtained by using the time map of a given reflector with its
velocity map, as follows :
Depth at any point = (Average velocity ×one way time) at this point.
The depth map in seismic reflection method is reflection of the subsurface picture to time map. Thus,
the depth maps also show the same picture of the studied formations, but the difference lies in the
closures dimensions, number of contour interval between these maps, faults displacements and
difference in number of minor faults. Depth map confirmed that East Baghdad structure within survey
area (South-2) south of Diyala river appears as structural nose trending north west-south east, note
that depth values are decrease toward south east and north east parts of the study Figure-8.
Figure 8- Depth map of base Lower Fars (AL-Fatha).
Khorshid and Kadhm Iraqi Journal of Science, 2015, Vol.56, No.4C, pp: 3441-3451
3448
The Used Seismic Attributes
1-Instantaneous Phase
The information of instantaneous phase is very important in showing and distinguishing the ends of
the continuity of reflective surfaces. The instantaneous phase does not depend on reflection strength,
therefore, it is used for the purpose of discrimination and showing the cases of layers termination.
From studying the instantaneous phase in Figure-9 showed the presence of phase reversal on
Bajwan/Baba Formation represented by flat spot this is clearly points to the presence of gaseous
Hydrocarbons.
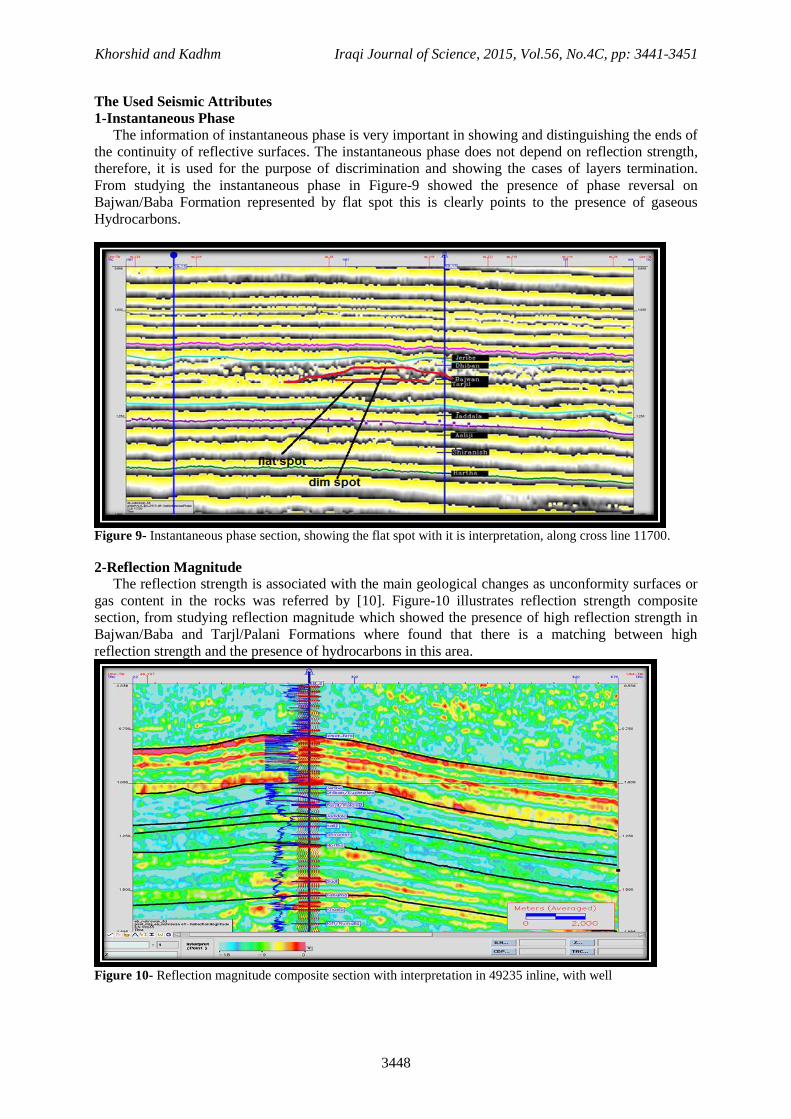
Figure 9- Instantaneous phase section, showing the flat spot with it is interpretation, along cross line 11700.
2-Reflection Magnitude
The reflection strength is associated with the main geological changes as unconformity surfaces or
gas content in the rocks was referred by [10]. Figure-10 illustrates reflection strength composite
section, from studying reflection magnitude which showed the presence of high reflection strength in
Bajwan/Baba and Tarjl/Palani Formations where found that there is a matching between high
reflection strength and the presence of hydrocarbons in this area.
Figure 10- Reflection magnitude composite section with interpretation in 49235 inline, with well
Khorshid and Kadhm Iraqi Journal of Science, 2015, Vol.56, No.4C, pp: 3441-3451
3449
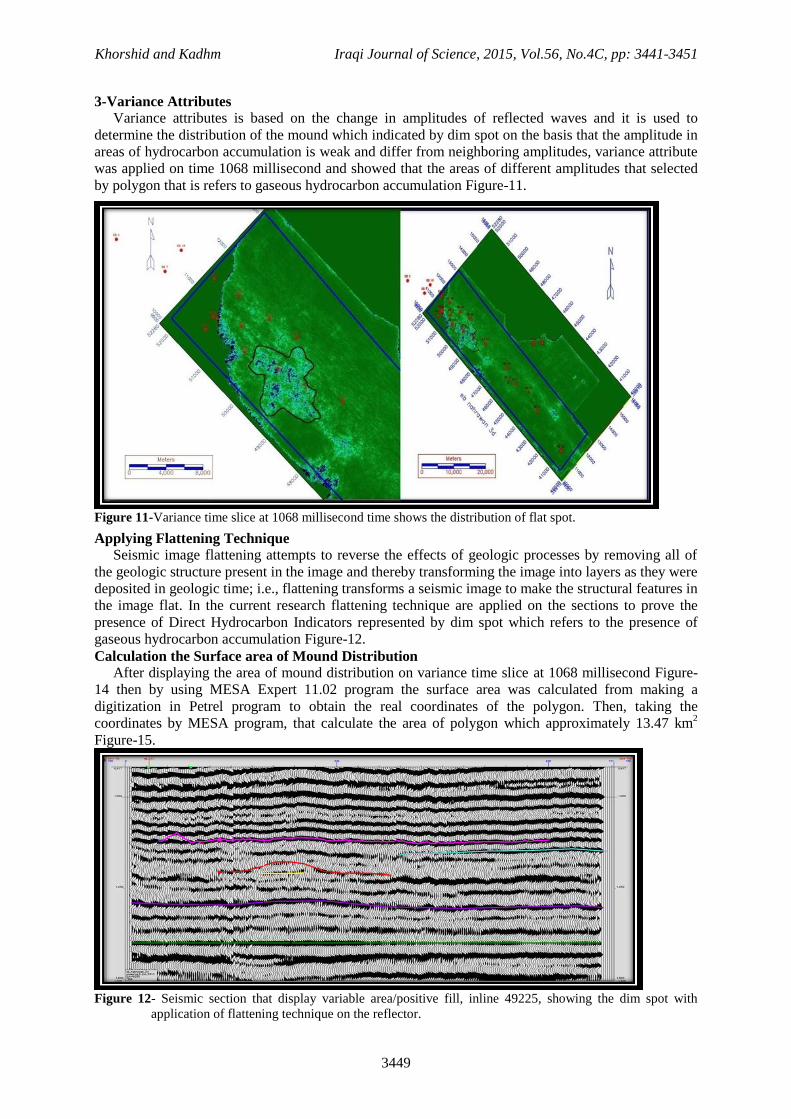
3-Variance Attributes
Variance attributes is based on the change in amplitudes of reflected waves and it is used to
determine the distribution of the mound which indicated by dim spot on the basis that the amplitude in
areas of hydrocarbon accumulation is weak and differ from neighboring amplitudes, variance attribute
was applied on time 1068 millisecond and showed that the areas of different amplitudes that selected
by polygon that is refers to gaseous hydrocarbon accumulation Figure-11.
Figure 11-Variance time slice at 1068 millisecond time shows the distribution of flat spot.
Applying Flattening Technique
Seismic image flattening attempts to reverse the effects of geologic processes by removing all of
the geologic structure present in the image and thereby transforming the image into layers as they were
deposited in geologic time; i.e., flattening transforms a seismic image to make the structural features in
the image flat. In the current research flattening technique are applied on the sections to prove the
presence of Direct Hydrocarbon Indicators represented by dim spot which refers to the presence of
gaseous hydrocarbon accumulation Figure-12.
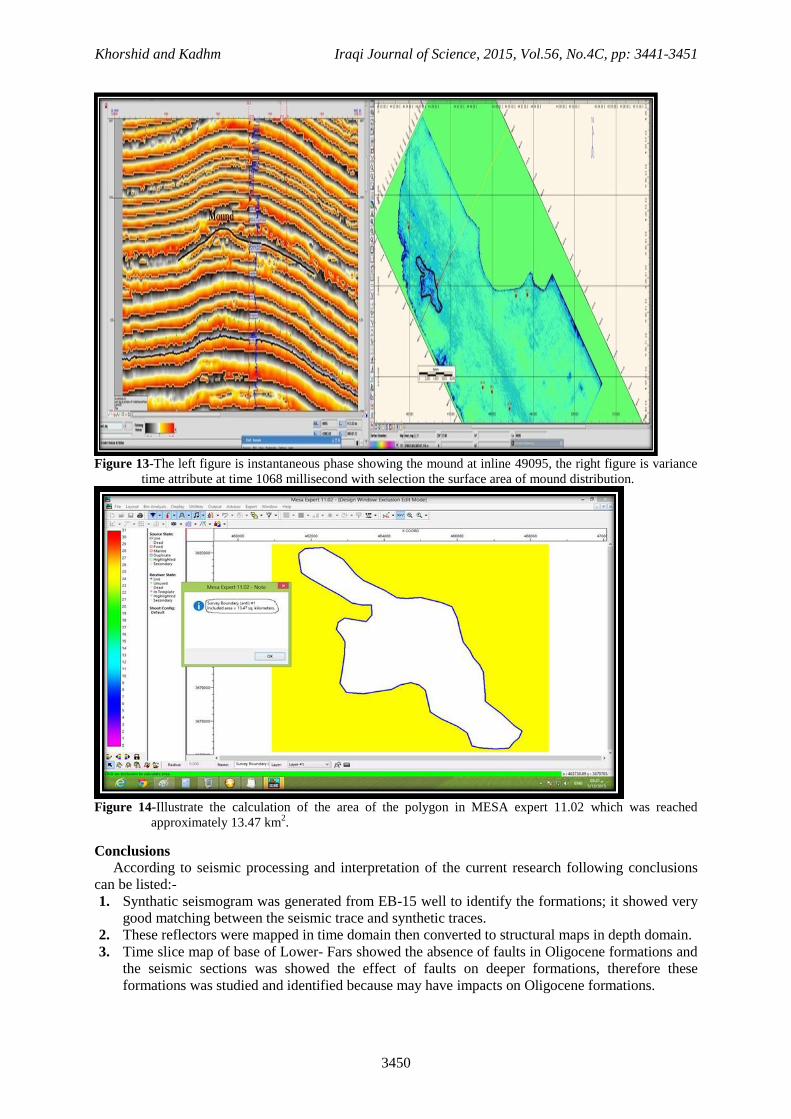
Calculation the Surface area of Mound Distribution
After displaying the area of mound distribution on variance time slice at 1068 millisecond Figure-
14 then by using MESA Expert 11.02 program the surface area was calculated from making a
digitization in Petrel program to obtain the real coordinates of the polygon. Then, taking the
coordinates by MESA program, that calculate the area of polygon which approximately 13.47 km2
Figure-15.
Figure 12- Seismic section that display variable area/positive fill, inline 49225, showing the dim spot with
application of flattening technique on the reflector.
Khorshid and Kadhm Iraqi Journal of Science, 2015, Vol.56, No.4C, pp: 3441-3451
3450
Figure 13-The left figure is instantaneous phase showing the mound at inline 49095, the right figure is variance
time attribute at time 1068 millisecond with selection the surface area of mound distribution.
Figure 14-Illustrate the calculation of the area of the polygon in MESA expert 11.02 which was reached
approximately 13.47 km2.
Conclusions
According to seismic processing and interpretation of the current research following conclusions
can be listed:-
1. Synthatic seismogram was generated from EB-15 well to identify the formations; it showed very
good matching between the seismic trace and synthetic traces.
2. These reflectors were mapped in time domain then converted to structural maps in depth domain.
3. Time slice map of base of Lower- Fars showed the absence of faults in Oligocene formations and
the seismic sections was showed the effect of faults on deeper formations, therefore these
formations was studied and identified because may have impacts on Oligocene formations.
Khorshid and Kadhm Iraqi Journal of Science, 2015, Vol.56, No.4C, pp: 3441-3451
3451
4. The TWT and depth maps of base Lower Fars reflector showed that the structural picture of East
Baghdad field was a structural nose opened toward NW and Oligocene formations was not
affected by faults, the values of TWT was small at the NW parts of the study area this indicates
that the thickness of sediments was high at the top, if the structural nose and descend toward the
east and south eastern part therefore observed high TWT values in this parts, that was confirmed
by depth map.
5. Average velocity has been used from wells (EB-2, EB-4, EB-5, EB-6, EB-15, EB-24) to prepare
velocity map of base of Lower Fars that showed the values of velocity was increases in the
eastern part of the study area making local closure near EB-15 well.
6. From studying the seismic sections and applying the seismic attributes represented by
instantaneous phase, reflection magnitude, and variance attribute it was discovered locations
considered Direct Hydrocarbon Indicator, type dim spot and flat spot which refers to gaseous
hydrocarbon accumulation, the locations are as follows:-
Inline 49235, 49225, 49190, 49095, Cross line 11700.
7. Flatening technique has been applied on the seismic and attribute sections to confirm the presence
of dim spot and flat spot as hydrocarbon water contact.
8. The surface area of spreading of the spot was 13.47 Km2. That was calculated by MESA expert
11.02 program.
References:
1. Dobrin, M. 1976. Introduction to Geophysical Prospecting, 3rd
Edn., McGraw Hill. Int. co.,
International Student Edition, p: 386.
2. Milsom, J.2003. Field Geophysics. 3rd
Edn. University College London, p:232.
3. Kearey, P., Brooks, M., and Lan Hill. 2002. An Introduction to Geophysical Exploration. 3rd
Edn.
Blackwell Science Ltd., 256p.
4. Al-Sinawi. 1981. Introduction to Applied Geophysics, 1st Edn., Printed at Mosul University.
p:142.
5. Berg, O. 1982. Seismic Detection and evaluation of detta and turbidite sequences: Their
application to exploration for The Subtle trap, AAPG, 66(9), pp:1271-1288.
6. Bacon, R. S., Redshaw T.2003. 3-DSeismic Interpretation, Printed in United Kingdom at the
University press, Cambridge, p:212.
7. Al-Ameri, T.K., Pitman, J., Naser, M.E., Zumberge, J., and Al-Haydari, H.A. 2010. Programed
oil generation of the Zubair Formation, Southern Iraq oil fields. Arab J.Geosc.p:4.
8. Lindseth, R. 1979. Synthetic sonic logs – a process for stratigraphic interpretation: Geophysics,
44, 3-26.
9. McQuillin, r., Bacon, M, and Barclay, W. 1984. An Introduction to Seismic Interpretation,
Graham and Trotman, p:287.
10. Taner, M. T., Koehler, F. and Sherrif, R. E. 1979. Complex seismic trace analysis. Geophysics,
44, 1041-36.
Related Documents