SUMMARY REPORT STATUS OF WHITE STURGEON IN THE LOWER FRASER RIVER REPORT ON THE FINDINGS OF THE LOWER FRASER RIVER WHITE STURGEON MONITORING AND ASSESSMENT PROGRAM 2011 BY TROY C. NELSON 1 WILLIAM J. GAZEY 2 DAVID ROBICHAUD 3 KARL K. ENGLISH 3 TONY MOCHIZUKI 3 VANCOUVER, BC MARCH 2012 1 T. C. Nelson Consulting, Sheldon, Queensland 4157 Australia ([email protected]) 2 W. J. Gazey Research, 1214 Camas Court, Victoria, BC V8X 4R1 3 LGL Limited environmental research associates, 9768 Second Street, Sidney, BC V8L 3Y8

Welcome message from author
This document is posted to help you gain knowledge. Please leave a comment to let me know what you think about it! Share it to your friends and learn new things together.
Transcript
SUMMARY REPORT
STATUS OF WHITE STURGEON IN THE LOWER FRASER RIVER
REPORT ON THE FINDINGS OF THE LOWER FRASER RIVER WHITE STURGEON MONITORING AND ASSESSMENT PROGRAM
2011
BY
TROY C. NELSON1 WILLIAM J. GAZEY2 DAVID ROBICHAUD3 KARL K. ENGLISH3 TONY MOCHIZUKI3
VANCOUVER, BC
MARCH 2012
1 T. C. Nelson Consulting, Sheldon, Queensland 4157 Australia ([email protected]) 2 W. J. Gazey Research, 1214 Camas Court, Victoria, BC V8X 4R1 3 LGL Limited environmental research associates, 9768 Second Street, Sidney, BC V8L 3Y8
STATUS OF WHITE STURGEON IN THE LOWER FRASER RIVER 2011 SUMMARY REPORT - MARCH 2012
FRASER RIVER STURGEON CONSERVATION SOCIETY PAGE II
TABLE OF CONTENTS
Page LIST OF TABLES ............................................................................................................................. iii LIST OF FIGURES ........................................................................................................................... iii LIST OF APPENDICES .................................................................................................................... iv SUMMARY ........................................................................................................................................ v ACKNOWLEDGMENTS ................................................................................................................... vi TABLES FIGURES APPENICES
STATUS OF WHITE STURGEON IN THE LOWER FRASER RIVER 2011 SUMMARY REPORT - MARCH 2012
FRASER RIVER STURGEON CONSERVATION SOCIETY PAGE III
LIST OF TABLES Table 1. Sampling zones used for population estimation of white sturgeon, 2010-2011. Table 2. Sampling regions used for population estimates of white sturgeon, 2010-2011. Table 3. Parameter estimates for linear and non-linear sturgeon growth models, 2008-
2009. Table 4. Population estimates for white sturgeon in the Lower Fraser River, by sampling
region, 2011. Table 5. Population estimates for white sturgeon in the Lower Fraser River, by 20-cm size
class, 2011. Table 6. Summary of mean annual population estimates, proportional (percent) changes
in estimates between years, and 95% confidence limits for annual estimates (numeric and percent of respective mean estimates) of white sturgeon in the lower Fraser River from 2001-2011.
LIST OF FIGURES Figure 1. Illustration of the general study area and the location of the four main sampling
regions used for data summaries presented in this report. Figure 2. Mean population estimates of white sturgeon in the lower Fraser River, by
sampling region, 2011. Figure 3. Mean population estimates of white sturgeon in the lower Fraser River, by 20-cm
size category, 2011. Figure 4. Comparison of mean annual population estimates of lower Fraser River white
sturgeon, 2001-2011. Figure 5. Comparison of mean population estimates of white sturgeon in the lower Fraser
River, by 20-cm size category, for assessment years 2004 through 2011. Figure 6. Comparison of the number of juvenile sturgeon (40-99 cm), sub-mature sturgeon
(100-159 cm), and mature adult sturgeon (>160 cm fork length) in the lower Fraser River, 2004-2011.
Figure 7. Illustration of the comparative percentages of sampled sturgeon less than 130 cm
FL, by 10-cm size groups, captured by angling in 2000-01 and 2010-11. Figure 8. Illustration of the comparative percentages of sampled sturgeon less than 130 cm
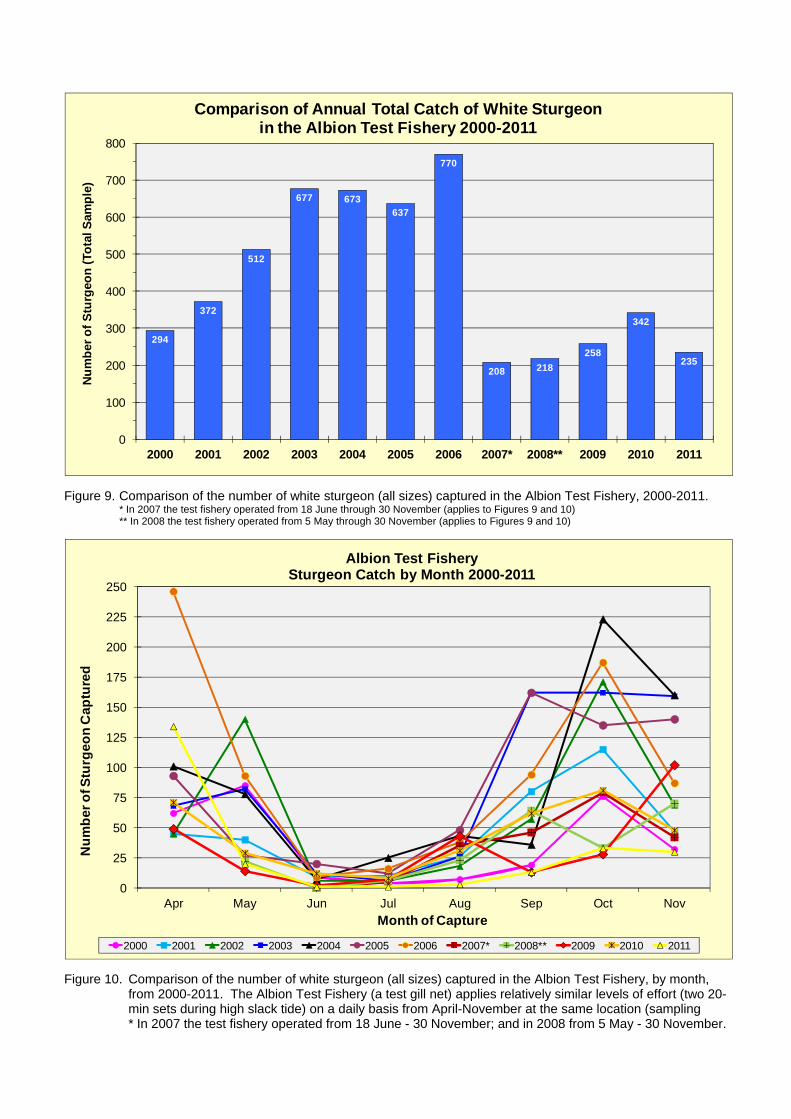
FL, by 10-cm size groups, captured in the Albion Test Fishery in 2000 and 2011. Figure 9. Comparison of the number of white sturgeon (all sizes) captured in the Albion
Test Fishery, in 2000-2011.
STATUS OF WHITE STURGEON IN THE LOWER FRASER RIVER 2011 SUMMARY REPORT - MARCH 2012
FRASER RIVER STURGEON CONSERVATION SOCIETY PAGE IV
Figure 10. Comparison of the number of white sturgeon (all sizes) captured in the Albion Test Fishery, by month, in 2000-2011.
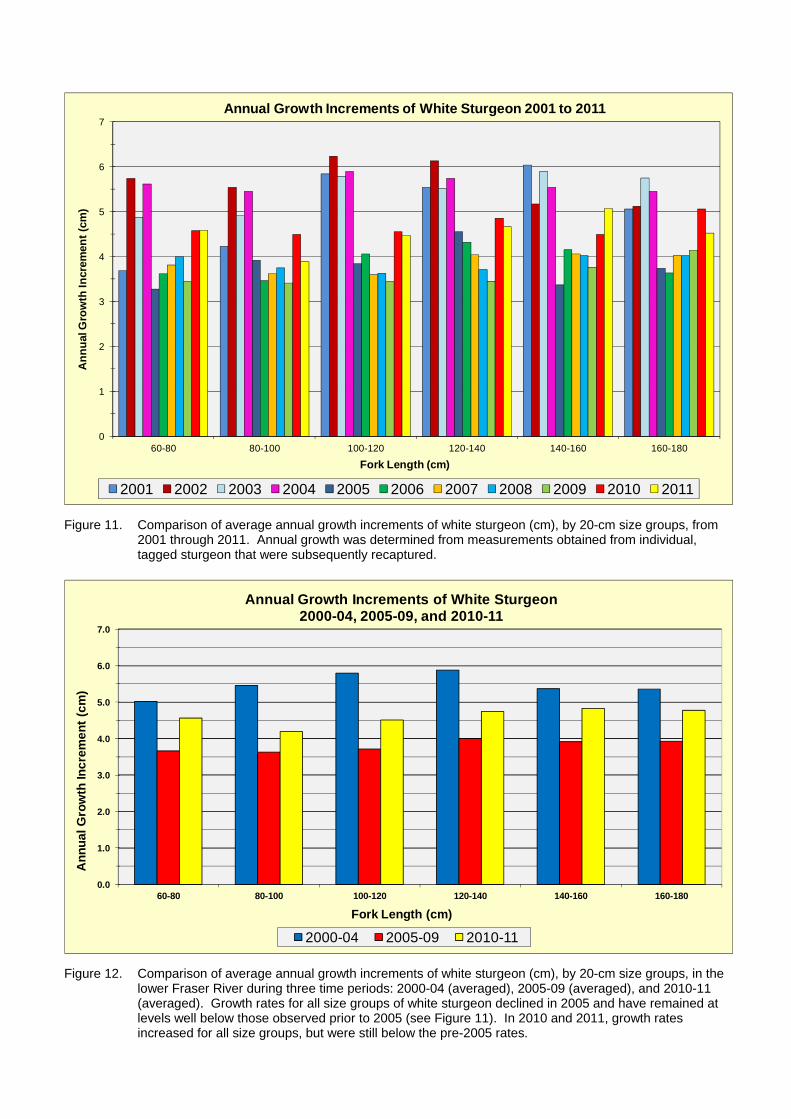
Figure 11. Comparison of average annual growth increments of white sturgeon (cm), by 20-
cm size groups, from 2001 through 2011. Figure 12. Comparison of average annual growth increments of white sturgeon (cm), by 20-
cm size groups, in the lower Fraser River during three time periods: 2000-04 (averaged), 2005-09 (averaged), and 2010-11 (averaged).
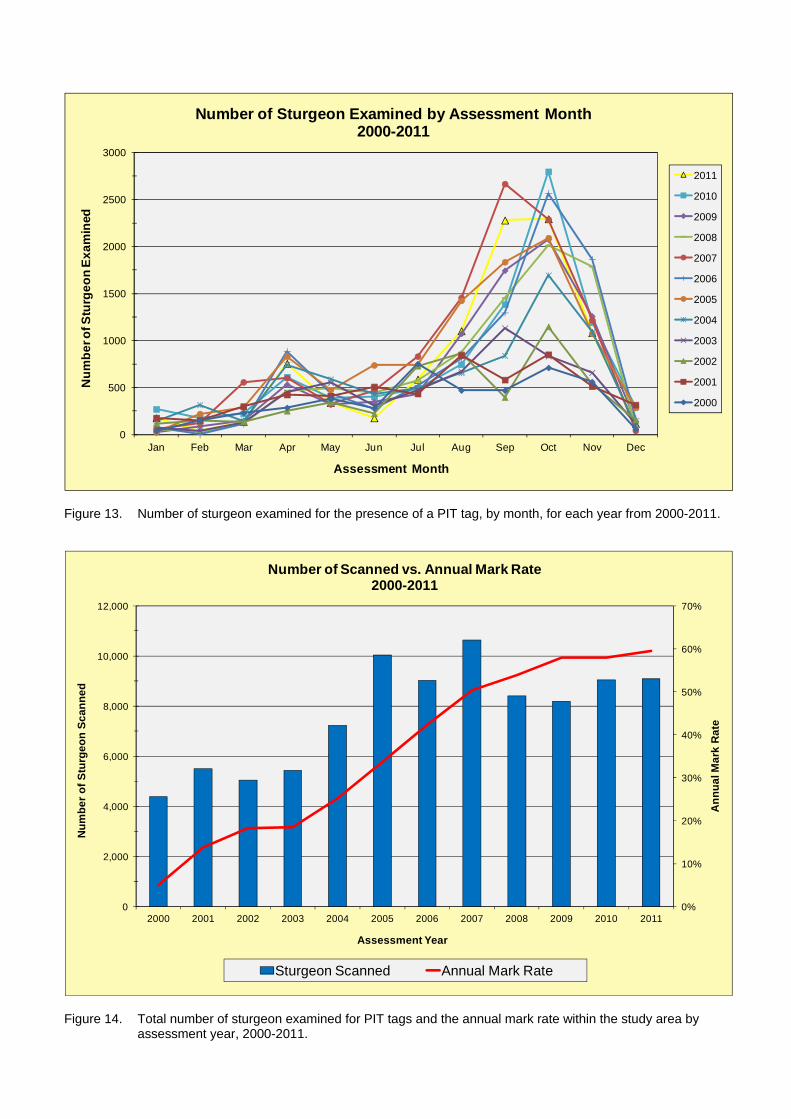
Figure 13. Number of sturgeon examined for the presence of a PIT tag, by month, for each
year from 2000-2011. Figure 14. Total number of sturgeon examined for PIT tags and the annual mark rate within
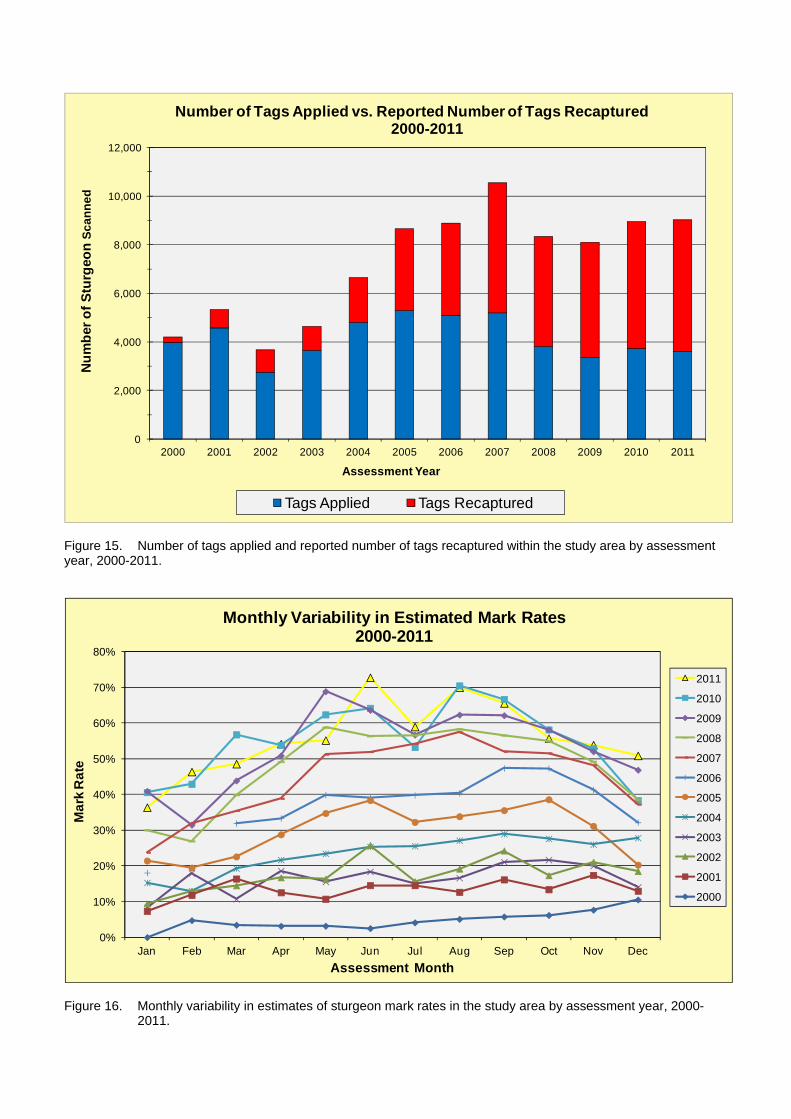
the study area by assessment year, 2000-2011. Figure 15. Number of tags applied and reported number of tags recaptured within the study
area by assessment year, 2000-2011. Figure 16. Monthly variability in estimates of sturgeon mark rates in the study area by
assessment year, 2000-2011.
LIST OF APPENDICES Appendix A. Sturgeon biosampling, tagging, and recapture data entry form. Appendix B. Lower Fraser River sturgeon sampling, tagging, and recapture summary, by
month and year, 1999-2011. Appendix C. Numbers of sturgeon examined for marks, and numbers of recaptures, by month
and sampling zone, 2010-2011. Appendix D. Number of sturgeon recaptured and examined for a mark, by sampling zone of
release and recapture, 2010-2011. Appendix E. Proportion (corrected) of sturgeon recaptured, by sampling zone of release,
2010-2011. Appendix F. Numbers of marked sturgeon releases available for recapture by sampling zone
and month, 2010-2011.
STATUS OF WHITE STURGEON IN THE LOWER FRASER RIVER 2011 SUMMARY REPORT - MARCH 2012
FRASER RIVER STURGEON CONSERVATION SOCIETY PAGE V
SUMMARY The Fraser River Sturgeon Conservation Society (FRSCS), a not-for-profit charitable organization founded in 1997, has a mandate to conserve and restore Fraser River white sturgeon, raise public awareness of Fraser River sturgeon and their ecosystem, and produce reliable information regarding Fraser River white sturgeon and their habitat. This summary report provides population and stock status assessments (as of December 2011) from the FRSCS’ Lower Fraser River White Sturgeon Monitoring and Assessment Program. For detailed information regarding program background, methodologies, and population modeling, please refer to the 2007 manuscript report (Nelson et al. 2008) available on the FRSCS web site: (http://www.frasersturgeon.com/research.html). Since April 2000, this program has relied on the volunteer efforts and contributions of angling guides, recreational, commercial, and Aboriginal fishermen, test fishery and enforcement personnel, and various fishery monitors. Volunteers from each of these sectors were trained to sample and tag white sturgeon, and record and transfer data. By December 2011, volunteers had tagged and released 50,154 sturgeon, sampled 92,501 sturgeon for the presence of a tag, and documented 37,179 recapture events of tags applied by the FRSCS program. A mathematical model using mark-recapture data has been developed to provide reliable estimates of the abundance of white sturgeon in the lower Fraser River, by size/age group and location. The model includes information of tag distribution and seasonal mixing, and is sensitive to estimates of mortality, emigration, and observer error. As of January 2011, the mean abundance estimate for white sturgeon from 40-279 cm fork length (FL) in the lower Fraser River was 44,713 (95% CLs 42,634-46,792; +/- 4.6% of the mean). This estimate is similar to that estimated for 2010 and represents a statistically significant decrease of 23% from the peak abundance estimated in 2003. Comparable abundance estimates by size category indicate that the greatest decline has been for sturgeon less than 100 cm FL. No significant differences in abundance were detected between 2010 and 2011 for any size group. Comparisons of the proportion of juvenile sturgeon captured by angling only and by the Albion Test Fishery (an independent program that utilizes drift gill net gear) over time also suggests that the abundance of juvenile white sturgeon has been decreasing since 2003. However, small juvenile sturgeon (less than 80 cm) are not likely sampled by angling gear as effectively as larger fish (i.e., they are not well-represented in the angled sample). Either these smaller fish are not as susceptible to angling (i.e., hook size or bait preference), or they are simply in low abundance within the population, or both; population estimates provide no information on the mechanism. Regardless of the reason, the low numbers of small sturgeon seen in the samples means that our ability to detect change in the population of small sturgeon is much less than for larger sturgeon. Any bias or uncertainty generated by assumption failures will be magnified for small fish. The abundance estimates presented in this paper are estimates of the mean number of sturgeon in the 40-279 cm size range that resided within the study area over each two-year period centered on the beginning of the given assessment year. Although our study samples and applies tags to several sturgeon smaller than 40 cm and larger than 279 cm FL each year, the numbers of recaptured tags within these size ranges (within a 24-month assessment period) is typically too low to include these size categories in our analyses. In addition, some of the 40-279 cm lower Fraser River origin white sturgeon will always be located in marine and freshwater areas outside our core study area; thus, our estimates do not represent the entire population of Lower Fraser River white sturgeon. Other methods, such as Stock Reduction Analysis, attempt to estimate both the trends and annual abundance for the entire population of the Lower Fraser white sturgeon (Whitlock and McAllister, in prep.) and thus those estimates tend to be larger than our annual estimates.
STATUS OF WHITE STURGEON IN THE LOWER FRASER RIVER 2011 SUMMARY REPORT - MARCH 2012
FRASER RIVER STURGEON CONSERVATION SOCIETY PAGE VI
Freshwater areas accessible to lower Fraser River white sturgeon that are outside our study area include: the entire North Arm and adjacent Middle Arm south of Lulu Island, the Pitt River and Pitt Lake, and Harrison Lake. All marine waters westward of the entrance points of the Fraser River at Garry Point and Canoe Pass (Figure 1) are outside our study area, and substantial numbers of white sturgeon have been observed and captured in the bays and mouths of rivers in northern Puget Sound, with additional sightings and captures in the southern Strait of Georgia and inlets/estuarine habitats on southern and western Vancouver Island. Acoustic telemetry data have shown that a portion of lower Fraser River white sturgeon may migrate to marine areas beyond the Fraser estuary, particularly during summer months (David Robichaud, LGL Limited, pers. comm.). Water and sturgeon fin ray/tissue samples from Puget Sound, the lower Fraser River, and major tributaries are being collected for microchemistry and genetic analyses that could help determine the origin and life history for white sturgeon present in Puget Sound and other marine waters near the Fraser River. Recaptures of tagged sturgeon during this study have confirmed that movements and migrations occur throughout the entire lower Fraser River study area. Many of the sturgeon tagged during this program have been recaptured and sampled multiple times by program volunteers. Approximately, 9.6% (4,791 individual fish) of all sturgeon tagged through December 2011 have been sampled three times each since the beginning of the study; 110 have been sampled eight times, and two have been sampled 17 times. Multiple capture/sampling events (by FRSCS volunteers) of individual tagged sturgeon can occur on an annual basis, with some fish sampled up to five times in a single year. Since the commencement of the program in 1999, angling has accounted for 88.5% of all sturgeon samples, followed by samples from First Nations net fisheries (5.3%) and the Albion Test Fishery (5.0%). A comparison of average annual growth rates, determined from measurements obtained from individual tagged sturgeon that were subsequently recaptured and re-measured, suggests that annual growth rates for most size groups of white sturgeon were greater before 2005. Average annual growth for all size groups (up to 180 cm) from 2005-2009 (3.85 cm/year) represented a 23.3% decrease from respective previous growth rates from 2000-2004 (5.02 cm/year). In 2011, the average annual growth rate for all size groups (4.36 cm/year) was slightly lower than that in 2010 (4.82), and represented a 13.2% increase over the 2005-2009 average rate.
ACKNOWLEDGEMENTS The novel and reliable information that has been produced by this program is a direct result of the energy, commitment, and dedication of program volunteers and sponsors. The level of in-kind contributions to the program from program volunteers, however measured (in hours, equipment, dollars, or numbers of individuals), is second-to-none for recent BC-based fisheries research programs. Program volunteers are the true stewards of the resource that is Fraser River white sturgeon. The level of program involvement by volunteers and the significant support and interest shown by both program sponsors and the public at large is a testimony to the broad community commitment toward stock recovery of lower Fraser River white sturgeon. Much of the success of this program has been the result of strong leadership and scientific oversight provided by the FRSCS, a not-for-profit, registered society with a volunteer-based board of directors. The FRSCS has organized a science and technical committee, composed mostly of fishery science professionals, that provides key input regarding program design and direction and conducts critical reviews of program results.
STATUS OF WHITE STURGEON IN THE LOWER FRASER RIVER 2011 SUMMARY REPORT - MARCH 2012
FRASER RIVER STURGEON CONSERVATION SOCIETY PAGE VII
Program support and sponsorship has been provided through partnership arrangements with provincial, federal, and non-government foundations and organizations, plus private donations. The authors would especially like to thank:
Albion Test Fishery Staff and Crew British Columbia Institute of Technology Daryl Waddell Fisheries and Oceans Canada Fraser Valley Angling Guides Association Habitat Conservation Trust Fund LGL Limited environmental research associates Lower Fraser River First Nations Ministry of Environment North Growth Foundation Pacific Salmon Commission Test Fishery and Crew Pacific Salmon Foundation Rick Hansen Foundation Sara Ghilarducci Memorial Fund Simon Fraser University University of British Columbia Willow Grove Foundation
Volunteer training and general field program coordination was provided by Jim Rissling. In 2011, core financial support for the program was provided by the Habitat Conservation Trust Fund.

STATUS OF WHITE STURGEON IN THE LOWER FRASER RIVER 2011 SUMMARY REPORT - MARCH 2012
FRASER RIVER STURGEON CONSERVATION SOCIETY
TABLES
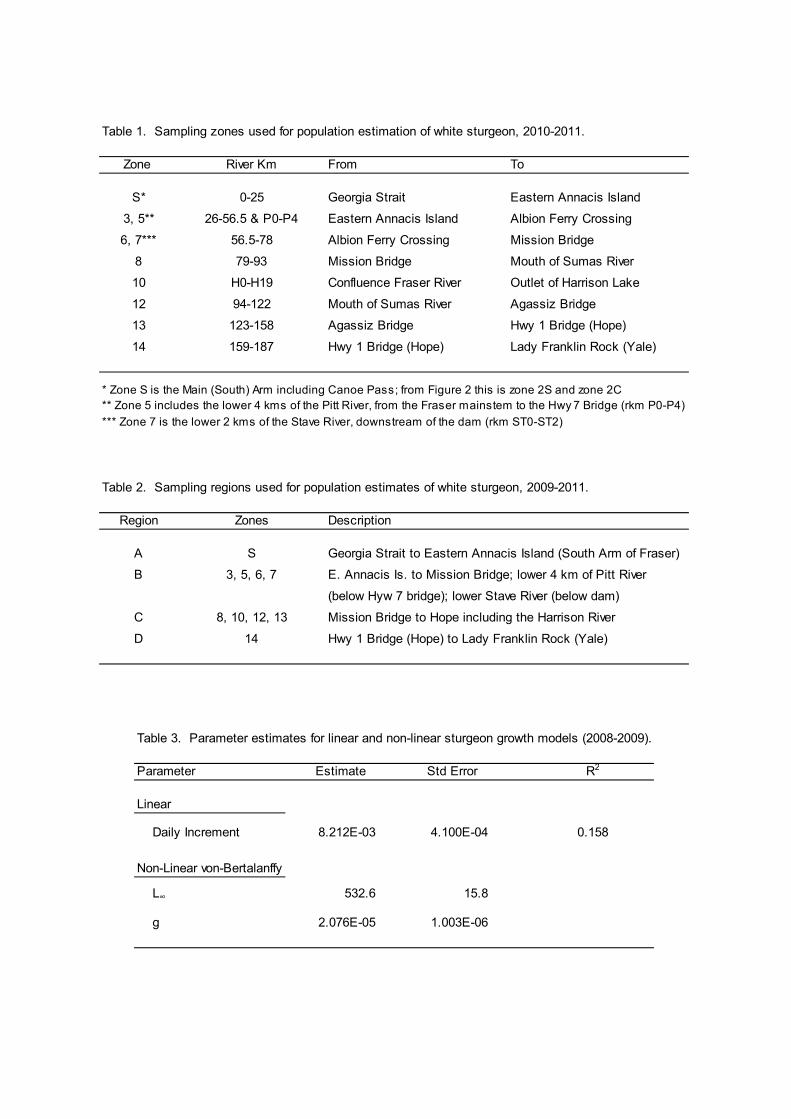
Table 1. Sampling zones used for population estimation of white sturgeon, 2010-2011.
Zone River Km From To
S* 0-25 Georgia Strait Eastern Annacis Island
3, 5** 26-56.5 & P0-P4 Eastern Annacis Island Albion Ferry Crossing
6, 7*** 56.5-78 Albion Ferry Crossing Mission Bridge
8 79-93 Mission Bridge Mouth of Sumas River
10 H0-H19 Confluence Fraser River Outlet of Harrison Lake
12 94-122 Mouth of Sumas River Agassiz Bridge
13 123-158 Agassiz Bridge Hwy 1 Bridge (Hope)
14 159-187 Hwy 1 Bridge (Hope) Lady Franklin Rock (Yale)
* Zone S is the Main (South) Arm including Canoe Pass; from Figure 2 this is zone 2S and zone 2C** Zone 5 includes the lower 4 kms of the Pitt River, from the Fraser mainstem to the Hwy 7 Bridge (rkm P0-P4)*** Zone 7 is the lower 2 kms of the Stave River, downstream of the dam (rkm ST0-ST2)
Table 2. Sampling regions used for population estimates of white sturgeon, 2009-2011.
Region Zones Description
A S Georgia Strait to Eastern Annacis Island (South Arm of Fraser)
B 3, 5, 6, 7 E. Annacis Is. to Mission Bridge; lower 4 km of Pitt River
(below Hyw 7 bridge); lower Stave River (below dam)
C 8, 10, 12, 13 Mission Bridge to Hope including the Harrison River
D 14 Hwy 1 Bridge (Hope) to Lady Franklin Rock (Yale)
Table 3. Parameter estimates for linear and non-linear sturgeon growth models (2008-2009). Parameter Estimate Std Error R2
Linear
Daily Increment 8.212E-03 4.100E-04 0.158 Non-Linear von-Bertalanffy
L∞ 532.6 15.8
g 2.076E-05 1.003E-06
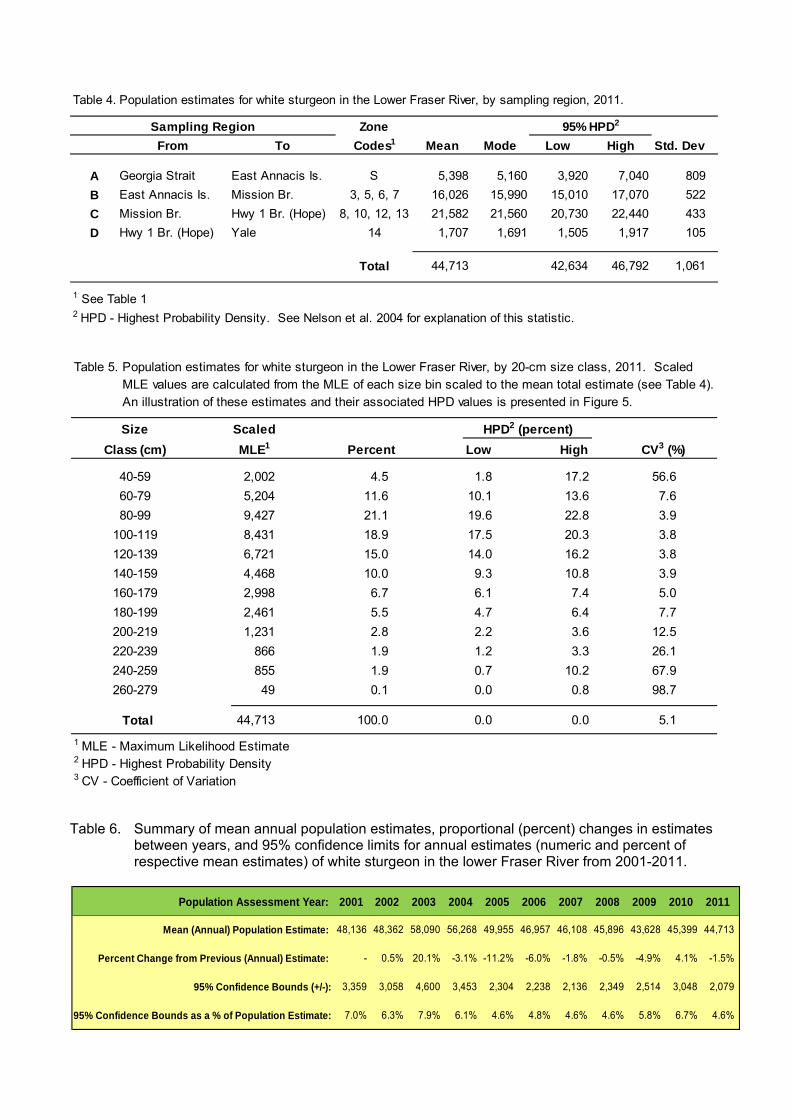
Table 4. Population estimates for white sturgeon in the Lower Fraser River, by sampling region, 2011.
ZoneFrom To Codes1 Mean Mode Low High Std. Dev
A Georgia Strait East Annacis Is. S 5,398 5,160 3,920 7,040 809B East Annacis Is. Mission Br. 3, 5, 6, 7 16,026 15,990 15,010 17,070 522C Mission Br. Hwy 1 Br. (Hope) 8, 10, 12, 13 21,582 21,560 20,730 22,440 433D Hwy 1 Br. (Hope) Yale 14 1,707 1,691 1,505 1,917 105
Total 44,713 42,634 46,792 1,061
1 See Table 12 HPD - Highest Probability Density. See Nelson et al. 2004 for explanation of this statistic.
Sampling Region 95% HPD2
Table 5. Population estimates for white sturgeon in the Lower Fraser River, by 20-cm size class, 2011. Scaled
MLE values are calculated from the MLE of each size bin scaled to the mean total estimate (see Table 4).An illustration of these estimates and their associated HPD values is presented in Figure 5.
Size ScaledClass (cm) MLE1 Percent Low High CV3 (%)
40-59 2,002 4.5 1.8 17.2 56.660-79 5,204 11.6 10.1 13.6 7.680-99 9,427 21.1 19.6 22.8 3.9
100-119 8,431 18.9 17.5 20.3 3.8120-139 6,721 15.0 14.0 16.2 3.8140-159 4,468 10.0 9.3 10.8 3.9160-179 2,998 6.7 6.1 7.4 5.0180-199 2,461 5.5 4.7 6.4 7.7200-219 1,231 2.8 2.2 3.6 12.5220-239 866 1.9 1.2 3.3 26.1240-259 855 1.9 0.7 10.2 67.9260-279 49 0.1 0.0 0.8 98.7
Total 44,713 100.0 0.0 0.0 5.11 MLE - Maximum Likelihood Estimate2 HPD - Highest Probability Density 3 CV - Coefficient of Variation
HPD2 (percent)
Table 6. Summary of mean annual population estimates, proportional (percent) changes in estimates
between years, and 95% confidence limits for annual estimates (numeric and percent of respective mean estimates) of white sturgeon in the lower Fraser River from 2001-2011.
Population Assessment Year: 2001 2002 2003 2004 2005 2006 2007 2008 2009 2010 2011
Mean (Annual) Population Estimate: 48,136 48,362 58,090 56,268 49,955 46,957 46,108 45,896 43,628 45,399 44,713
Percent Change from Previous (Annual) Estimate: - 0.5% 20.1% -3.1% -11.2% -6.0% -1.8% -0.5% -4.9% 4.1% -1.5%
95% Confidence Bounds (+/-): 3,359 3,058 4,600 3,453 2,304 2,238 2,136 2,349 2,514 3,048 2,079
95% Confidence Bounds as a % of Population Estimate: 7.0% 6.3% 7.9% 6.1% 4.6% 4.8% 4.6% 4.6% 5.8% 6.7% 4.6%
STATUS OF WHITE STURGEON IN THE LOWER FRASER RIVER 2011 SUMMARY REPORT - MARCH 2012
FRASER RIVER STURGEON CONSERVATION SOCIETY
FIGURES
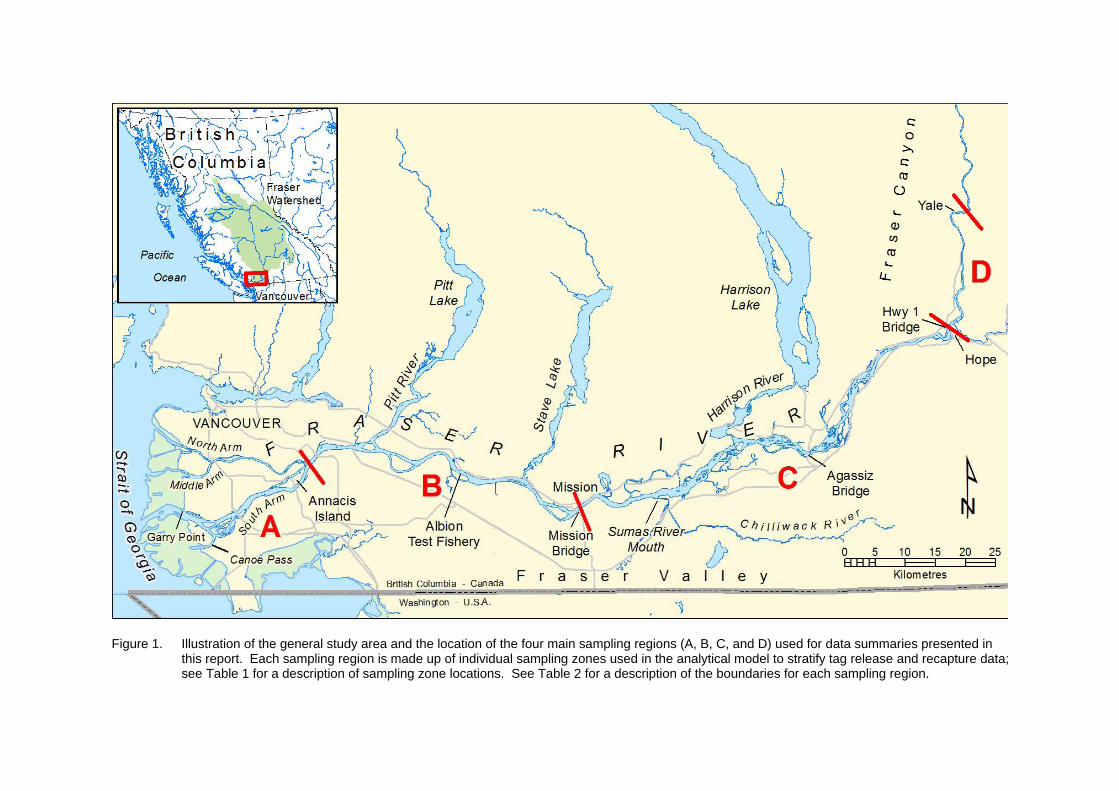
Figure 1. Illustration of the general study area and the location of the four main sampling regions (A, B, C, and D) used for data summaries presented in
this report. Each sampling region is made up of individual sampling zones used in the analytical model to stratify tag release and recapture data; see Table 1 for a description of sampling zone locations. See Table 2 for a description of the boundaries for each sampling region.
0
5,000
10,000
15,000
20,000
25,000
A rkm 0-25
B rkm 26-78
C rkm 79-158
D rkm 159-187
Num
ber o
f Stu
rgeo
n
Sampling Region
Lower Fraser River White SturgeonMean Population Estimates by Sampling Region 2011
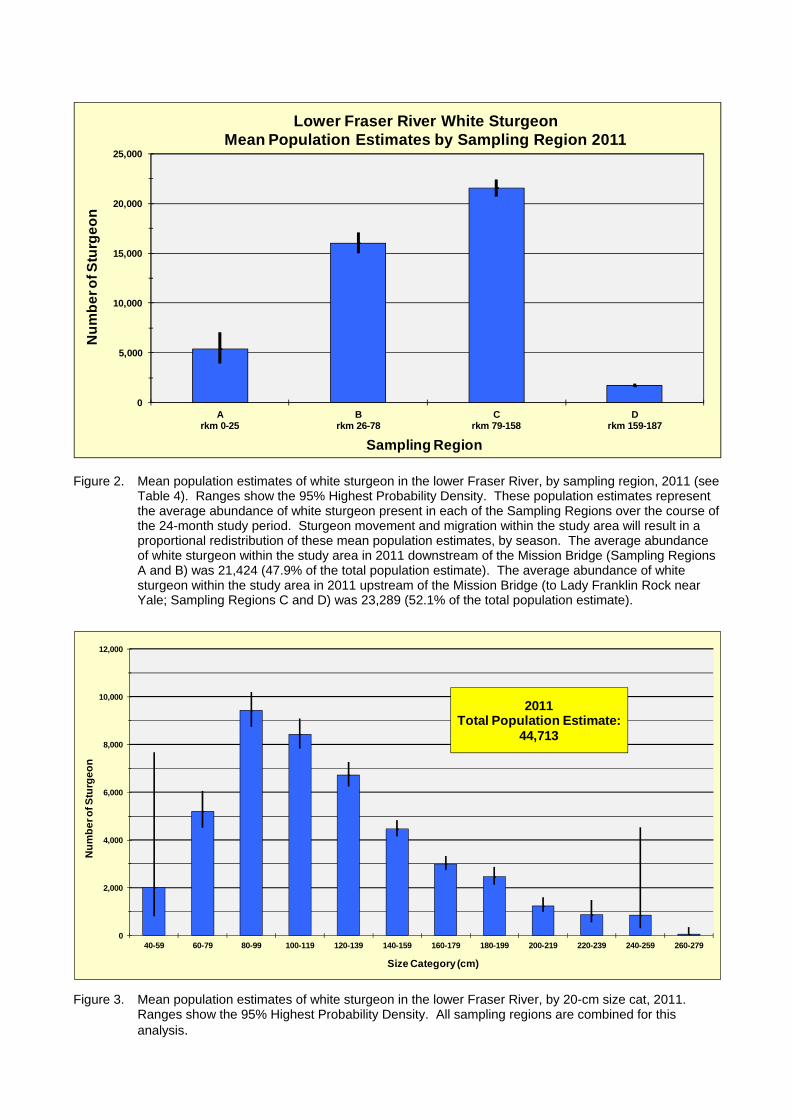
Figure 2. Mean population estimates of white sturgeon in the lower Fraser River, by sampling region, 2011 (see
Table 4). Ranges show the 95% Highest Probability Density. These population estimates represent the average abundance of white sturgeon present in each of the Sampling Regions over the course of the 24-month study period. Sturgeon movement and migration within the study area will result in a proportional redistribution of these mean population estimates, by season. The average abundance of white sturgeon within the study area in 2011 downstream of the Mission Bridge (Sampling Regions A and B) was 21,424 (47.9% of the total population estimate). The average abundance of white sturgeon within the study area in 2011 upstream of the Mission Bridge (to Lady Franklin Rock near Yale; Sampling Regions C and D) was 23,289 (52.1% of the total population estimate).
0
2,000
4,000
6,000
8,000
10,000
12,000
40-59 60-79 80-99 100-119 120-139 140-159 160-179 180-199 200-219 220-239 240-259 260-279
Num
ber o
f Stu
rgeo
n
Size Category (cm)
2011Total Population Estimate:
44,713
Figure 3. Mean population estimates of white sturgeon in the lower Fraser River, by 20-cm size cat, 2011.
Ranges show the 95% Highest Probability Density. All sampling regions are combined for this analysis.
48,136 48,362
58,090 56,26849,955
46,957 46,108 45,896 43,628 45,399 44,713
0
10,000
20,000
30,000
40,000
50,000
60,000
70,000
2001 2002 2003 2004 2005 2006 2007 2008 2009 2010 2011
Num
ber
of S
turg
eon
Lower Fraser River White SturgeonPopulation Estimates (40-279* cm Fork Length)
2001 - 2011
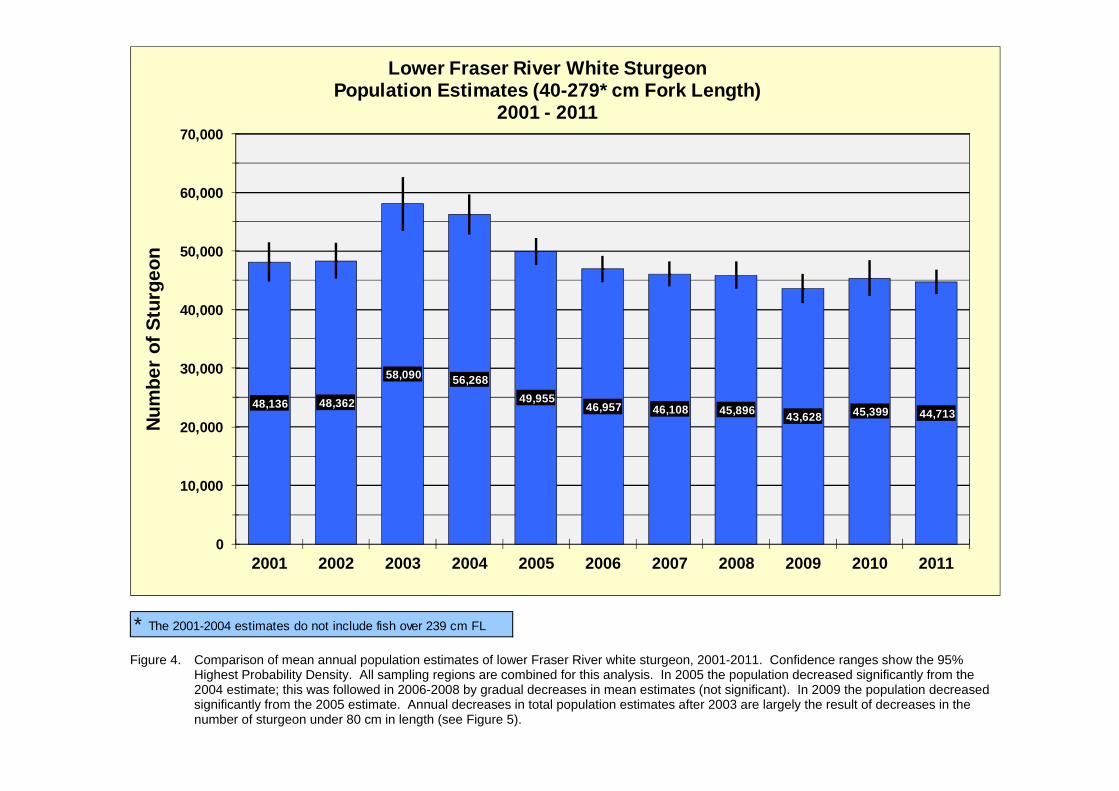
* The 2001-2004 estimates do not include fish over 239 cm FL Figure 4. Comparison of mean annual population estimates of lower Fraser River white sturgeon, 2001-2011. Confidence ranges show the 95%
Highest Probability Density. All sampling regions are combined for this analysis. In 2005 the population decreased significantly from the 2004 estimate; this was followed in 2006-2008 by gradual decreases in mean estimates (not significant). In 2009 the population decreased significantly from the 2005 estimate. Annual decreases in total population estimates after 2003 are largely the result of decreases in the number of sturgeon under 80 cm in length (see Figure 5).
0
2,000
4,000
6,000
8,000
10,000
12,000
14,000
16,000
18,000
20,000
40-59 60-79 80-99 100-119 120-139 140-159 160-179 180-199 200-219 220-239 240-259 260-279
Num
ber o
f Stu
rgeo
n
Size Interval (cm)
2004 2005 2006 2007 2008 2009 2010 2011
-77.8%
-64.4%
-16.6%
-77.8%
-64.4%
-16.6%
-77.8%
-64.4%
-16.6%
-77.8%
-64.4%
-16.6%
-77.8%
-64.4%
-16.6%
Population Decrease40-99 cm Sturgeon
2004 - 201152.4%
TotalPopulation Estimates
2004: 56,2682005: 49,9552006: 46,9572007: 46,1082008: 45,8962009: 43,6282010: 45,3992011: 44,713
-77.8%
-64.4%
-16.6%
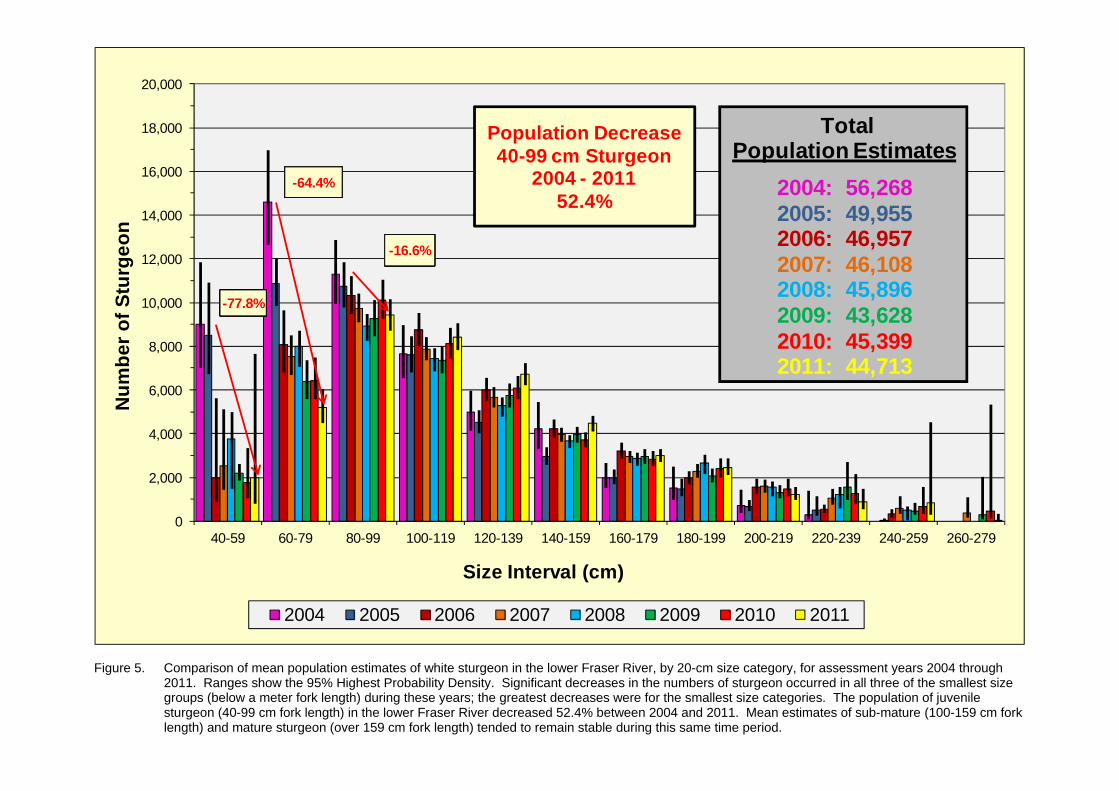
Figure 5. Comparison of mean population estimates of white sturgeon in the lower Fraser River, by 20-cm size category, for assessment years 2004 through
2011. Ranges show the 95% Highest Probability Density. Significant decreases in the numbers of sturgeon occurred in all three of the smallest size groups (below a meter fork length) during these years; the greatest decreases were for the smallest size categories. The population of juvenile sturgeon (40-99 cm fork length) in the lower Fraser River decreased 52.4% between 2004 and 2011. Mean estimates of sub-mature (100-159 cm fork length) and mature sturgeon (over 159 cm fork length) tended to remain stable during this same time period.
0
10,000
20,000
30,000
40,000
2004 2005 2006 2007 2008 2009 2010 2011
Num
ber o
f Stu
rgeo
nNumber of Juvenile (<100 cm), Sub-Mature (100-159 cm), and
Mature Adult (>160 cm) White Sturgeon in the Lower Fraser River, 2004-2011
40-99 cm juveniles
100-159 cm sub-mature adults
160+ cm mature adults
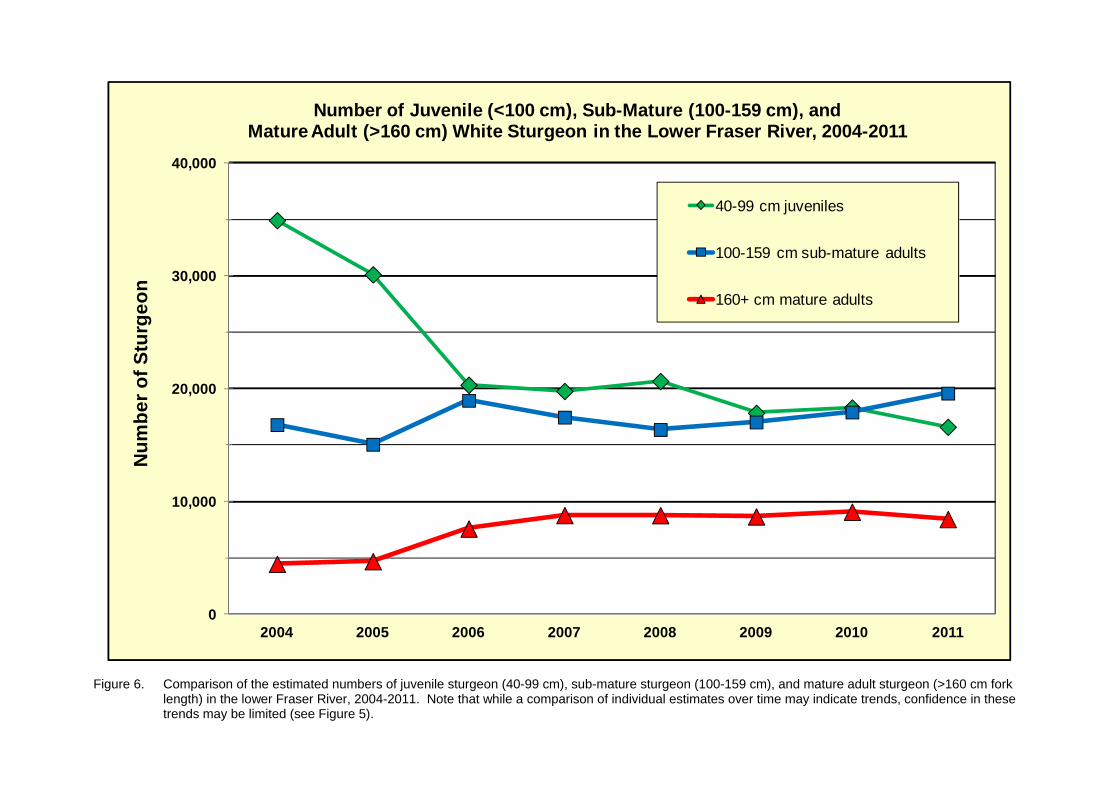
Figure 6. Comparison of the estimated numbers of juvenile sturgeon (40-99 cm), sub-mature sturgeon (100-159 cm), and mature adult sturgeon (>160 cm fork
length) in the lower Fraser River, 2004-2011. Note that while a comparison of individual estimates over time may indicate trends, confidence in these trends may be limited (see Figure 5).
0.0%
4.0%
8.0%
12.0%
16.0%
20.0%
40-50 50-60 60-70 70-80 80-90 90-100 100-110 110-120 120-130
Perc
ent o
f Tot
al S
ampl
e <1
30 c
m F
L
Fork Length (cm)
Percent of Angled Sturgeon Sample <130 cm Fork Length2000-01 (n = 5462) vs 2010-11 (n = 10,705)
2000-01 2010-11
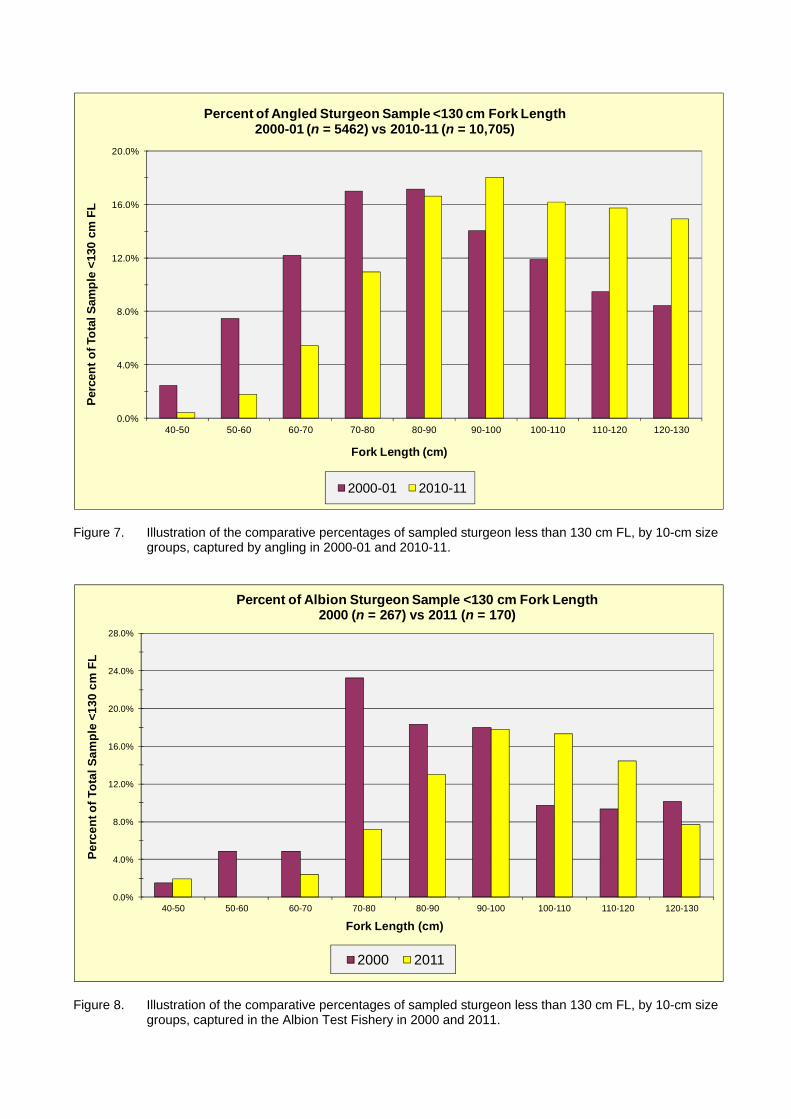
Figure 7. Illustration of the comparative percentages of sampled sturgeon less than 130 cm FL, by 10-cm size
groups, captured by angling in 2000-01 and 2010-11.
0.0%
4.0%
8.0%
12.0%
16.0%
20.0%
24.0%
28.0%
40-50 50-60 60-70 70-80 80-90 90-100 100-110 110-120 120-130
Perc
ent o
f Tot
al S
ampl
e <1
30 c
m F
L
Fork Length (cm)
Percent of Albion Sturgeon Sample <130 cm Fork Length2000 (n = 267) vs 2011 (n = 170)
2000 2011
Figure 8. Illustration of the comparative percentages of sampled sturgeon less than 130 cm FL, by 10-cm size
groups, captured in the Albion Test Fishery in 2000 and 2011.
294
372
512
677 673637
770
208 218258
342
235
0
100
200
300
400
500
600
700
800
2000 2001 2002 2003 2004 2005 2006 2007* 2008** 2009 2010 2011
Num
ber o
f Stu
rgeo
n (T
otal
Sam
ple)
Comparison of Annual Total Catch of White Sturgeonin the Albion Test Fishery 2000-2011
Figure 9. Comparison of the number of white sturgeon (all sizes) captured in the Albion Test Fishery, 2000-2011. * In 2007 the test fishery operated from 18 June through 30 November (applies to Figures 9 and 10) ** In 2008 the test fishery operated from 5 May through 30 November (applies to Figures 9 and 10)
0
25
50
75
100
125
150
175
200
225
250
Apr May Jun Jul Aug Sep Oct Nov
Num
ber o
f Stu
rgeo
n C
aptu
red
Month of Capture
Albion Test FisherySturgeon Catch by Month 2000-2011
2000 2001 2002 2003 2004 2005 2006 2007* 2008** 2009 2010 2011
Figure 10. Comparison of the number of white sturgeon (all sizes) captured in the Albion Test Fishery, by month,
from 2000-2011. The Albion Test Fishery (a test gill net) applies relatively similar levels of effort (two 20-min sets during high slack tide) on a daily basis from April-November at the same location (sampling * In 2007 the test fishery operated from 18 June - 30 November; and in 2008 from 5 May - 30 November.
0
1
2
3
4
5
6
7
60-80 80-100 100-120 120-140 140-160 160-180
Ann
ual G
row
th In
crem
ent (
cm)
Fork Length (cm)
Annual Growth Increments of White Sturgeon 2001 to 2011
2001 2002 2003 2004 2005 2006 2007 2008 2009 2010 2011
Figure 11. Comparison of average annual growth increments of white sturgeon (cm), by 20-cm size groups, from
2001 through 2011. Annual growth was determined from measurements obtained from individual, tagged sturgeon that were subsequently recaptured.
0.0
1.0
2.0
3.0
4.0
5.0
6.0
7.0
60-80 80-100 100-120 120-140 140-160 160-180
Ann
ual G
row
th In
crem
ent (
cm)
Fork Length (cm)
Annual Growth Increments of White Sturgeon2000-04, 2005-09, and 2010-11
2000-04 2005-09 2010-11
Figure 12. Comparison of average annual growth increments of white sturgeon (cm), by 20-cm size groups, in the
lower Fraser River during three time periods: 2000-04 (averaged), 2005-09 (averaged), and 2010-11 (averaged). Growth rates for all size groups of white sturgeon declined in 2005 and have remained at levels well below those observed prior to 2005 (see Figure 11). In 2010 and 2011, growth rates increased for all size groups, but were still below the pre-2005 rates.
0
500
1000
1500
2000
2500
3000
Jan Feb Mar Apr May Jun Jul Aug Sep Oct Nov Dec
Num
ber o
f Stu
rgeo
n Ex
amin
ed
Assessment Month
2011
2010
2009
2008
2007
2006
2005
2004
2003
2002
2001
2000
Number of Sturgeon Examined by Assessment Month2000-2011
Figure 13. Number of sturgeon examined for the presence of a PIT tag, by month, for each year from 2000-2011.
0%
10%
20%
30%
40%
50%
60%
70%
0
2,000
4,000
6,000
8,000
10,000
12,000
2000 2001 2002 2003 2004 2005 2006 2007 2008 2009 2010 2011
Ann
ual M
ark
Rat
e
Num
ber o
f Stu
rgeo
n Sc
anne
d
Assessment Year
Sturgeon Scanned Annual Mark Rate
Number of Scanned vs. Annual Mark Rate2000-2011
Figure 14. Total number of sturgeon examined for PIT tags and the annual mark rate within the study area by
assessment year, 2000-2011.
0
2,000
4,000
6,000
8,000
10,000
12,000
2000 2001 2002 2003 2004 2005 2006 2007 2008 2009 2010 2011
Num
ber o
f Stu
rgeo
n Sc
anne
d
Assessment Year
Tags Applied Tags Recaptured
Number of Tags Applied vs. Reported Number of Tags Recaptured2000-2011
Figure 15. Number of tags applied and reported number of tags recaptured within the study area by assessment year, 2000-2011.
0%
10%
20%
30%
40%
50%
60%
70%
80%
Jan Feb Mar Apr May Jun Jul Aug Sep Oct Nov Dec
Mar
k R
ate
Assessment Month
2011
2010
2009
2008
2007
2006
2005
2004
2003
2002
2001
2000
Monthly Variability in Estimated Mark Rates2000-2011
Figure 16. Monthly variability in estimates of sturgeon mark rates in the study area by assessment year, 2000-
2011.

STATUS OF WHITE STURGEON IN THE LOWER FRASER RIVER 2011 SUMMARY REPORT - MARCH 2012
FRASER RIVER STURGEON CONSERVATION SOCIETY
APPENDIX A
Sturgeon biosampling, tagging, and recapture data entry form
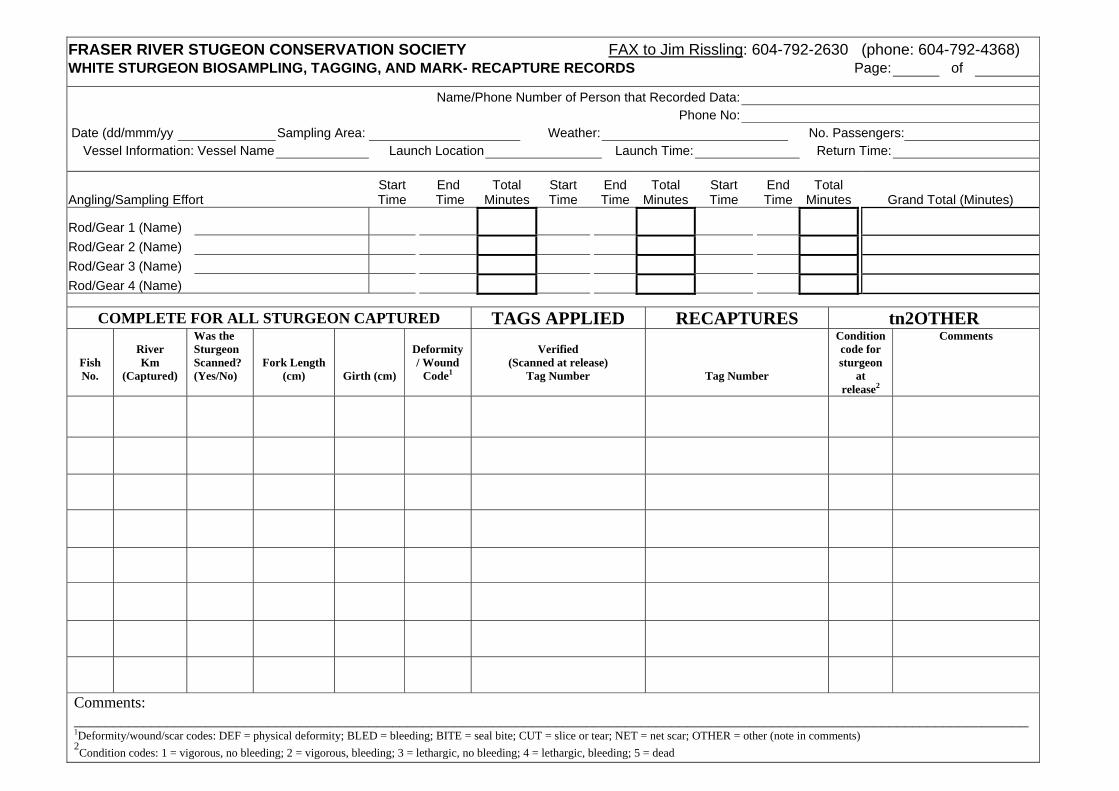
FRASER RIVER STUGEON CONSERVATION SOCIETY FAX to Jim Rissling: 604-792-2630 (phone: 604-792-4368) WHITE STURGEON BIOSAMPLING, TAGGING, AND MARK- RECAPTURE RECORDS Page: of
Name/Phone Number of Person that Recorded Data: Phone No: Date (dd/mmm/yy Sampling Area: Weather: No. Passengers:
Vessel Information: Vessel Name Launch Location Launch Time: Return Time:
Angling/Sampling Effort Start Time
End Time
Total Minutes
Start Time
End Time
Total Minutes
Start Time
End Time
Total Minutes Grand Total (Minutes)
Rod/Gear 1 (Name) Rod/Gear 2 (Name) Rod/Gear 3 (Name) Rod/Gear 4 (Name)
COMPLETE FOR ALL STURGEON CAPTURED TAGS APPLIED RECAPTURES tn2OTHER
Fish No.
River Km
(Captured)
Was the Sturgeon Scanned? (Yes/No)
Fork Length (cm)
Girth (cm)
Deformity / Wound
Code1
Verified
(Scanned at release) Tag Number
Tag Number
Condition code for sturgeon
at release2
Comments
Comments: ___________________________________________________________________________________________________________________________ 1Deformity/wound/scar codes: DEF = physical deformity; BLED = bleeding; BITE = seal bite; CUT = slice or tear; NET = net scar; OTHER = other (note in comments) 2Condition codes: 1 = vigorous, no bleeding; 2 = vigorous, bleeding; 3 = lethargic, no bleeding; 4 = lethargic, bleeding; 5 = dead
STATUS OF WHITE STURGEON IN THE LOWER FRASER RIVER 2011 SUMMARY REPORT - MARCH 2012
FRASER RIVER STURGEON CONSERVATION SOCIETY
APPENDIX B
Lower Fraser River sturgeon sampling, tagging, and recapture summary, by month and year, 1999-2011
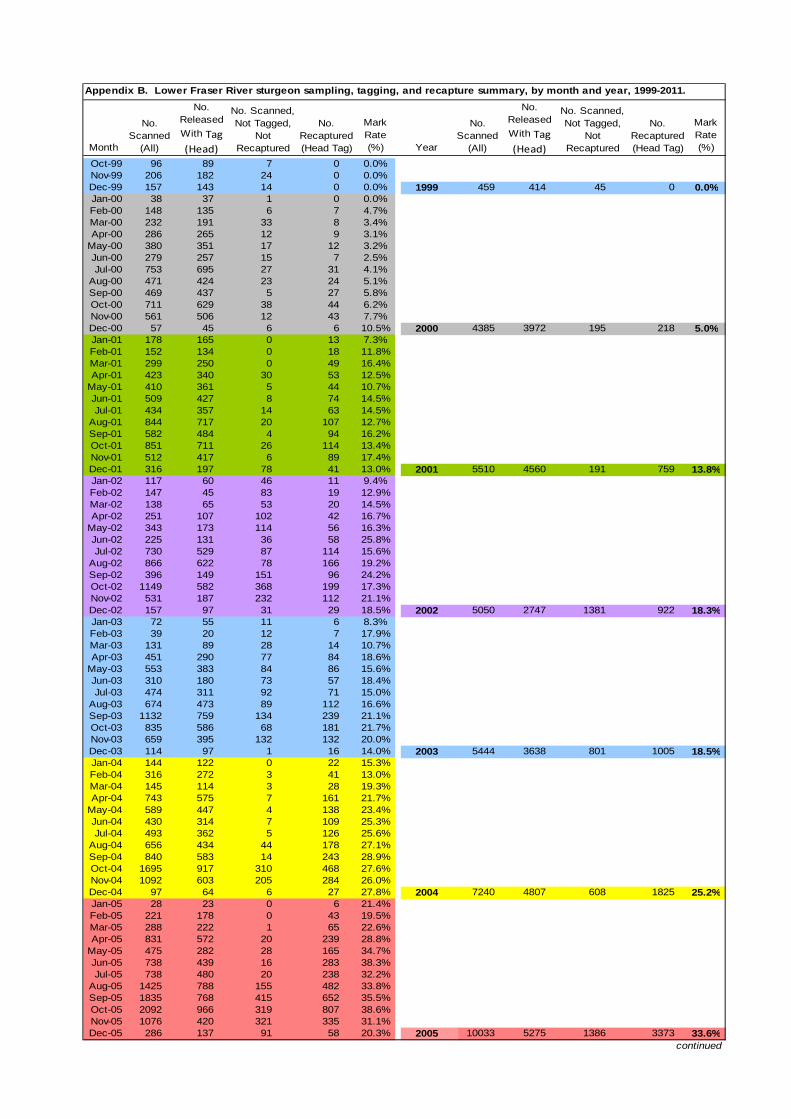
Appendix B. Lower Fraser River sturgeon sampling, tagging, and recapture summary, by month and year, 1999-2011.
Month
Mark Rate (%) Year
Mark Rate (%)
Oct-99 96 89 7 0 0.0%Nov-99 206 182 24 0 0.0%Dec-99 157 143 14 0 0.0% 1999 459 414 45 0 0.0%Jan-00 38 37 1 0 0.0%Feb-00 148 135 6 7 4.7%Mar-00 232 191 33 8 3.4%Apr-00 286 265 12 9 3.1%
May-00 380 351 17 12 3.2%Jun-00 279 257 15 7 2.5%Jul-00 753 695 27 31 4.1%
Aug-00 471 424 23 24 5.1%Sep-00 469 437 5 27 5.8%Oct-00 711 629 38 44 6.2%Nov-00 561 506 12 43 7.7%Dec-00 57 45 6 6 10.5% 2000 4385 3972 195 218 5.0%Jan-01 178 165 0 13 7.3%Feb-01 152 134 0 18 11.8%Mar-01 299 250 0 49 16.4%Apr-01 423 340 30 53 12.5%
May-01 410 361 5 44 10.7%Jun-01 509 427 8 74 14.5%Jul-01 434 357 14 63 14.5%
Aug-01 844 717 20 107 12.7%Sep-01 582 484 4 94 16.2%Oct-01 851 711 26 114 13.4%Nov-01 512 417 6 89 17.4%Dec-01 316 197 78 41 13.0% 2001 5510 4560 191 759 13.8%Jan-02 117 60 46 11 9.4%Feb-02 147 45 83 19 12.9%Mar-02 138 65 53 20 14.5%Apr-02 251 107 102 42 16.7%
May-02 343 173 114 56 16.3%Jun-02 225 131 36 58 25.8%Jul-02 730 529 87 114 15.6%
Aug-02 866 622 78 166 19.2%Sep-02 396 149 151 96 24.2%Oct-02 1149 582 368 199 17.3%Nov-02 531 187 232 112 21.1%Dec-02 157 97 31 29 18.5% 2002 5050 2747 1381 922 18.3%Jan-03 72 55 11 6 8.3%Feb-03 39 20 12 7 17.9%Mar-03 131 89 28 14 10.7%Apr-03 451 290 77 84 18.6%
May-03 553 383 84 86 15.6%Jun-03 310 180 73 57 18.4%Jul-03 474 311 92 71 15.0%
Aug-03 674 473 89 112 16.6%Sep-03 1132 759 134 239 21.1%Oct-03 835 586 68 181 21.7%Nov-03 659 395 132 132 20.0%Dec-03 114 97 1 16 14.0% 2003 5444 3638 801 1005 18.5%Jan-04 144 122 0 22 15.3%Feb-04 316 272 3 41 13.0%Mar-04 145 114 3 28 19.3%Apr-04 743 575 7 161 21.7%
May-04 589 447 4 138 23.4%Jun-04 430 314 7 109 25.3%Jul-04 493 362 5 126 25.6%
Aug-04 656 434 44 178 27.1%Sep-04 840 583 14 243 28.9%Oct-04 1695 917 310 468 27.6%Nov-04 1092 603 205 284 26.0%Dec-04 97 64 6 27 27.8% 2004 7240 4807 608 1825 25.2%Jan-05 28 23 0 6 21.4%Feb-05 221 178 0 43 19.5%Mar-05 288 222 1 65 22.6%Apr-05 831 572 20 239 28.8%
May-05 475 282 28 165 34.7%Jun-05 738 439 16 283 38.3%Jul-05 738 480 20 238 32.2%
Aug-05 1425 788 155 482 33.8%Sep-05 1835 768 415 652 35.5%Oct-05 2092 966 319 807 38.6%Nov-05 1076 420 321 335 31.1%Dec-05 286 137 91 58 20.3% 2005 10033 5275 1386 3373 33.6%
continued
No. Scanned, Not Tagged,
Not Recaptured
No. Recaptured (Head Tag)
No. Scanned
(All)
No. Released With Tag (Head)
No. Scanned, Not Tagged,
Not Recaptured
No. Recaptured (Head Tag)
No. Scanned
(All)
No. Released With Tag (Head)
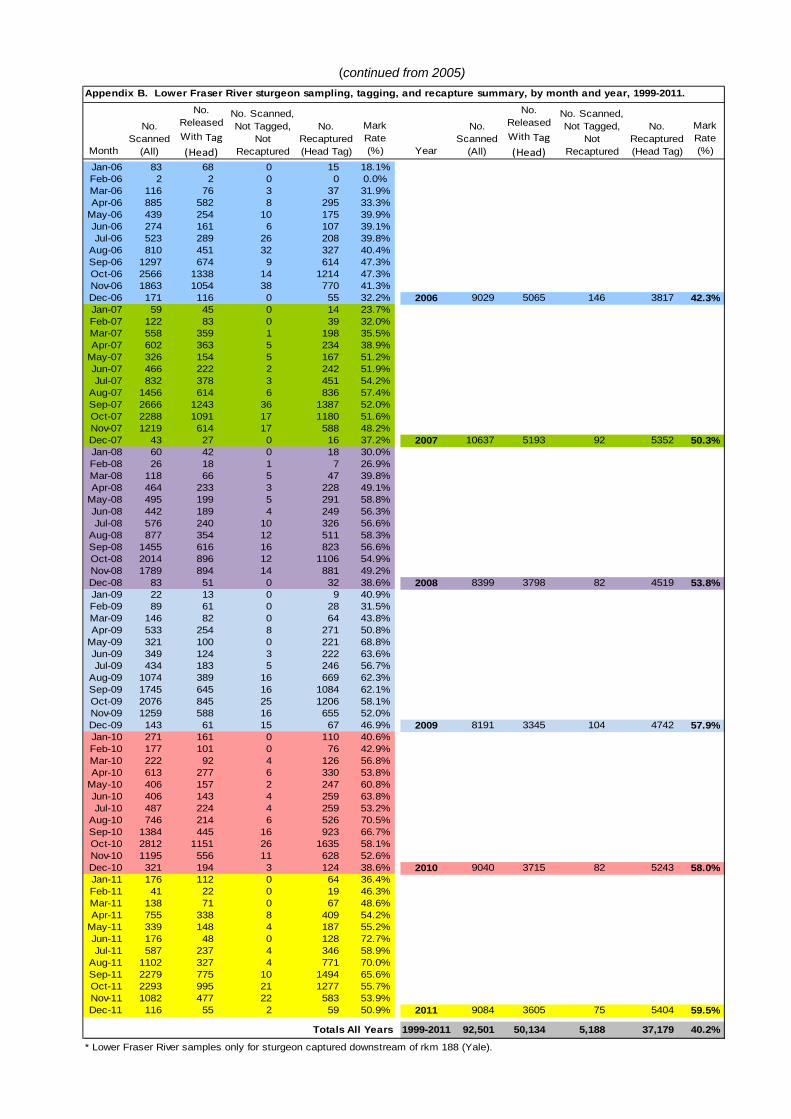
(continued from 2005)
Appendix B. Lower Fraser River sturgeon sampling, tagging, and recapture summary, by month and year, 1999-2011.
Month
Mark Rate (%) Year
Mark Rate (%)
Jan-06 83 68 0 15 18.1%Feb-06 2 2 0 0 0.0%Mar-06 116 76 3 37 31.9%Apr-06 885 582 8 295 33.3%
May-06 439 254 10 175 39.9%Jun-06 274 161 6 107 39.1%Jul-06 523 289 26 208 39.8%
Aug-06 810 451 32 327 40.4%Sep-06 1297 674 9 614 47.3%Oct-06 2566 1338 14 1214 47.3%Nov-06 1863 1054 38 770 41.3%Dec-06 171 116 0 55 32.2% 2006 9029 5065 146 3817 42.3%Jan-07 59 45 0 14 23.7%Feb-07 122 83 0 39 32.0%Mar-07 558 359 1 198 35.5%Apr-07 602 363 5 234 38.9%
May-07 326 154 5 167 51.2%Jun-07 466 222 2 242 51.9%Jul-07 832 378 3 451 54.2%
Aug-07 1456 614 6 836 57.4%Sep-07 2666 1243 36 1387 52.0%Oct-07 2288 1091 17 1180 51.6%Nov-07 1219 614 17 588 48.2%Dec-07 43 27 0 16 37.2% 2007 10637 5193 92 5352 50.3%Jan-08 60 42 0 18 30.0%Feb-08 26 18 1 7 26.9%Mar-08 118 66 5 47 39.8%Apr-08 464 233 3 228 49.1%
May-08 495 199 5 291 58.8%Jun-08 442 189 4 249 56.3%Jul-08 576 240 10 326 56.6%
Aug-08 877 354 12 511 58.3%Sep-08 1455 616 16 823 56.6%Oct-08 2014 896 12 1106 54.9%Nov-08 1789 894 14 881 49.2%Dec-08 83 51 0 32 38.6% 2008 8399 3798 82 4519 53.8%Jan-09 22 13 0 9 40.9%Feb-09 89 61 0 28 31.5%Mar-09 146 82 0 64 43.8%Apr-09 533 254 8 271 50.8%
May-09 321 100 0 221 68.8%Jun-09 349 124 3 222 63.6%Jul-09 434 183 5 246 56.7%
Aug-09 1074 389 16 669 62.3%Sep-09 1745 645 16 1084 62.1%Oct-09 2076 845 25 1206 58.1%Nov-09 1259 588 16 655 52.0%Dec-09 143 61 15 67 46.9% 2009 8191 3345 104 4742 57.9%Jan-10 271 161 0 110 40.6%Feb-10 177 101 0 76 42.9%Mar-10 222 92 4 126 56.8%Apr-10 613 277 6 330 53.8%
May-10 406 157 2 247 60.8%Jun-10 406 143 4 259 63.8%Jul-10 487 224 4 259 53.2%
Aug-10 746 214 6 526 70.5%Sep-10 1384 445 16 923 66.7%Oct-10 2812 1151 26 1635 58.1%Nov-10 1195 556 11 628 52.6%Dec-10 321 194 3 124 38.6% 2010 9040 3715 82 5243 58.0%Jan-11 176 112 0 64 36.4%Feb-11 41 22 0 19 46.3%Mar-11 138 71 0 67 48.6%Apr-11 755 338 8 409 54.2%
May-11 339 148 4 187 55.2%Jun-11 176 48 0 128 72.7%Jul-11 587 237 4 346 58.9%
Aug-11 1102 327 4 771 70.0%Sep-11 2279 775 10 1494 65.6%Oct-11 2293 995 21 1277 55.7%Nov-11 1082 477 22 583 53.9%Dec-11 116 55 2 59 50.9% 2011 9084 3605 75 5404 59.5%
Totals All Years 1999-2011 92,501 50,134 5,188 37,179 40.2%
* Lower Fraser River samples only for sturgeon captured downstream of rkm 188 (Yale).
No. Scanned, Not Tagged,
Not Recaptured
No. Recaptured (Head Tag)
No. Scanned
(All)
No. Released With Tag (Head)
No. Scanned, Not Tagged,
Not Recaptured
No. Recaptured (Head Tag)
No. Scanned
(All)
No. Released With Tag (Head)
STATUS OF WHITE STURGEON IN THE LOWER FRASER RIVER 2011 SUMMARY REPORT - MARCH 2012
FRASER RIVER STURGEON CONSERVATION SOCIETY
APPENDICES C, D, E, and F Appendix C. Numbers of sturgeon examined for marks, and numbers of
recaptures, by month and sampling zone, 2010-2011. Appendix D. Number of sturgeon recaptured and examined for a mark, by
sampling zone of release and recapture, 2010-2011. Appendix E. Proportion (corrected) of sturgeon recaptured, by sampling
zone of release, 2010-2011. Appendix F. Numbers of marked sturgeon releases available for recapture
by sampling zone and month, 2010-2011.
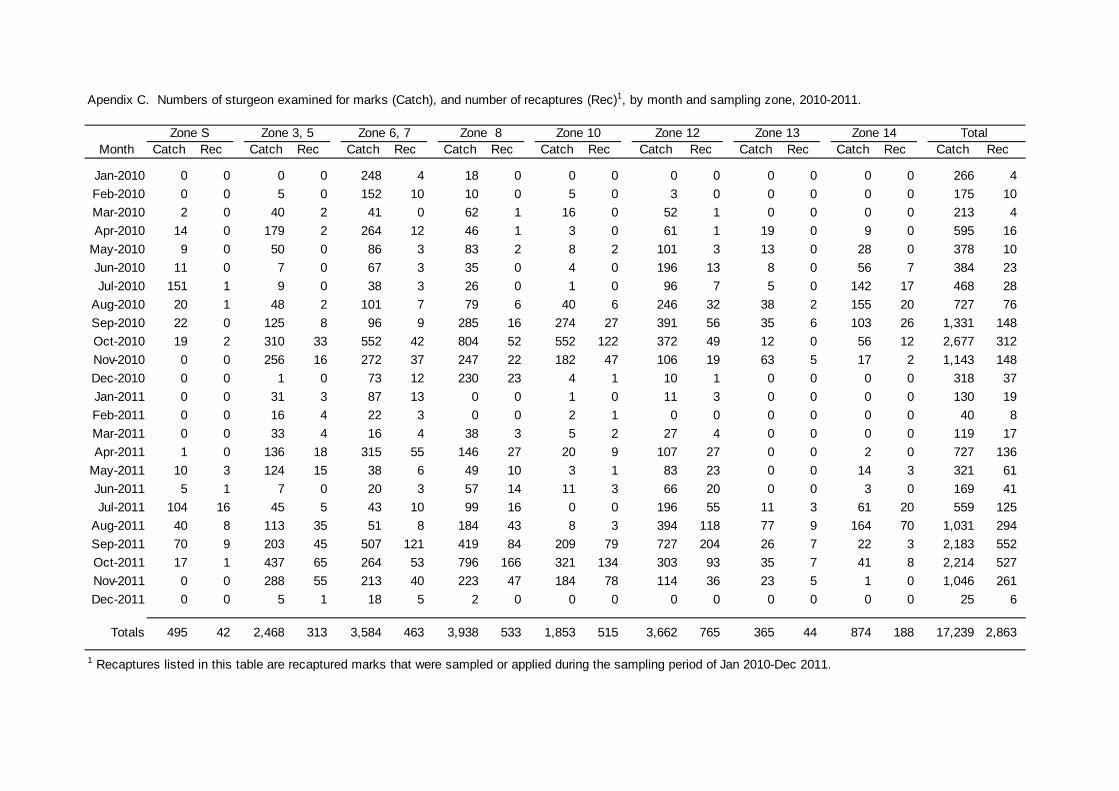
Apendix C. Numbers of sturgeon examined for marks (Catch), and number of recaptures (Rec)1, by month and sampling zone, 2010-2011.
Month Catch Rec Catch Rec Catch Rec Catch Rec Catch Rec Catch Rec Catch Rec Catch Rec Catch Rec
Jan-2010 0 0 0 0 248 4 18 0 0 0 0 0 0 0 0 0 266 4Feb-2010 0 0 5 0 152 10 10 0 5 0 3 0 0 0 0 0 175 10Mar-2010 2 0 40 2 41 0 62 1 16 0 52 1 0 0 0 0 213 4Apr-2010 14 0 179 2 264 12 46 1 3 0 61 1 19 0 9 0 595 16
May-2010 9 0 50 0 86 3 83 2 8 2 101 3 13 0 28 0 378 10Jun-2010 11 0 7 0 67 3 35 0 4 0 196 13 8 0 56 7 384 23Jul-2010 151 1 9 0 38 3 26 0 1 0 96 7 5 0 142 17 468 28
Aug-2010 20 1 48 2 101 7 79 6 40 6 246 32 38 2 155 20 727 76Sep-2010 22 0 125 8 96 9 285 16 274 27 391 56 35 6 103 26 1,331 148Oct-2010 19 2 310 33 552 42 804 52 552 122 372 49 12 0 56 12 2,677 312Nov-2010 0 0 256 16 272 37 247 22 182 47 106 19 63 5 17 2 1,143 148Dec-2010 0 0 1 0 73 12 230 23 4 1 10 1 0 0 0 0 318 37Jan-2011 0 0 31 3 87 13 0 0 1 0 11 3 0 0 0 0 130 19Feb-2011 0 0 16 4 22 3 0 0 2 1 0 0 0 0 0 0 40 8Mar-2011 0 0 33 4 16 4 38 3 5 2 27 4 0 0 0 0 119 17Apr-2011 1 0 136 18 315 55 146 27 20 9 107 27 0 0 2 0 727 136
May-2011 10 3 124 15 38 6 49 10 3 1 83 23 0 0 14 3 321 61Jun-2011 5 1 7 0 20 3 57 14 11 3 66 20 0 0 3 0 169 41Jul-2011 104 16 45 5 43 10 99 16 0 0 196 55 11 3 61 20 559 125
Aug-2011 40 8 113 35 51 8 184 43 8 3 394 118 77 9 164 70 1,031 294Sep-2011 70 9 203 45 507 121 419 84 209 79 727 204 26 7 22 3 2,183 552Oct-2011 17 1 437 65 264 53 796 166 321 134 303 93 35 7 41 8 2,214 527Nov-2011 0 0 288 55 213 40 223 47 184 78 114 36 23 5 1 0 1,046 261Dec-2011 0 0 5 1 18 5 2 0 0 0 0 0 0 0 0 0 25 6
Totals 495 42 2,468 313 3,584 463 3,938 533 1,853 515 3,662 765 365 44 874 188 17,239 2,863
1 Recaptures listed in this table are recaptured marks that were sampled or applied during the sampling period of Jan 2010-Dec 2011.
Zone 13 Zone 14 TotalZone S Zone 3, 5 Zone 6, 7 Zone 8 Zone 10 Zone 12
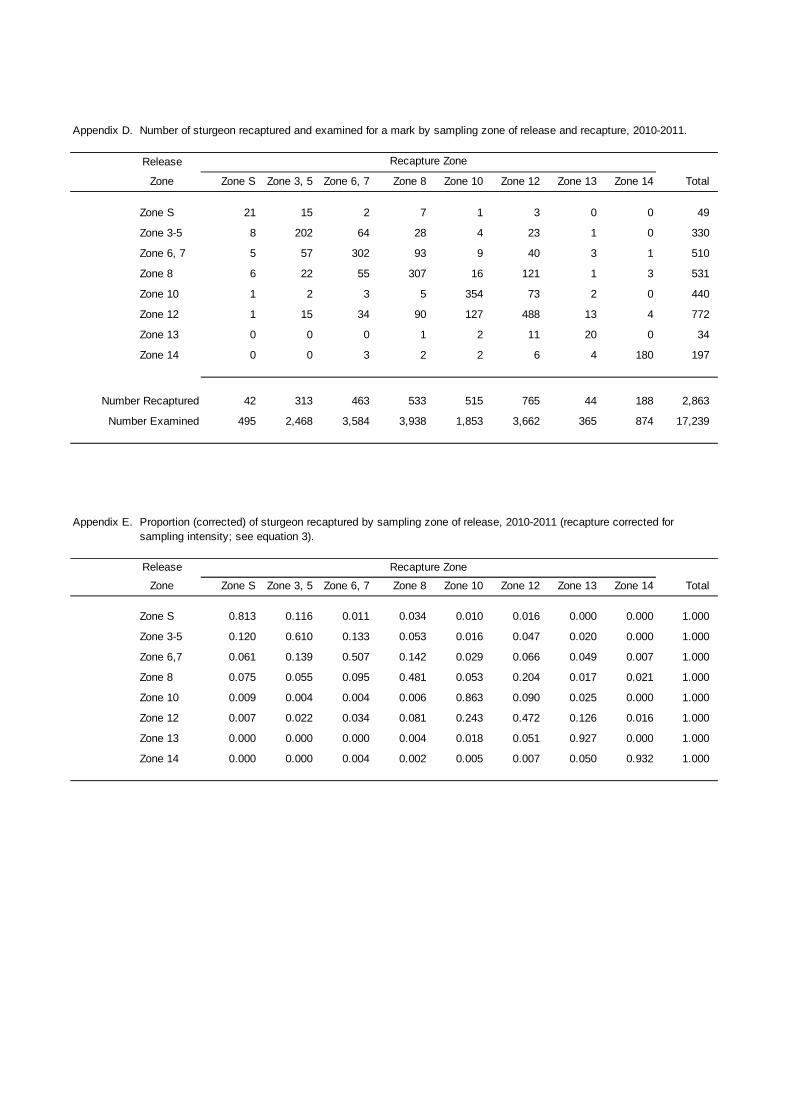
Appendix D. Number of sturgeon recaptured and examined for a mark by sampling zone of release and recapture, 2010-2011.
Release
Zone Zone S Zone 3, 5 Zone 6, 7 Zone 8 Zone 10 Zone 12 Zone 13 Zone 14 Total
Zone S 21 15 2 7 1 3 0 0 49
Zone 3-5 8 202 64 28 4 23 1 0 330
Zone 6, 7 5 57 302 93 9 40 3 1 510
Zone 8 6 22 55 307 16 121 1 3 531
Zone 10 1 2 3 5 354 73 2 0 440
Zone 12 1 15 34 90 127 488 13 4 772
Zone 13 0 0 0 1 2 11 20 0 34
Zone 14 0 0 3 2 2 6 4 180 197
Number Recaptured 42 313 463 533 515 765 44 188 2,863
Number Examined 495 2,468 3,584 3,938 1,853 3,662 365 874 17,239
Appendix E. Proportion (corrected) of sturgeon recaptured by sampling zone of release, 2010-2011 (recapture corrected forsampling intensity; see equation 3).
Release
Zone Zone S Zone 3, 5 Zone 6, 7 Zone 8 Zone 10 Zone 12 Zone 13 Zone 14 Total
Zone S 0.813 0.116 0.011 0.034 0.010 0.016 0.000 0.000 1.000
Zone 3-5 0.120 0.610 0.133 0.053 0.016 0.047 0.020 0.000 1.000
Zone 6,7 0.061 0.139 0.507 0.142 0.029 0.066 0.049 0.007 1.000
Zone 8 0.075 0.055 0.095 0.481 0.053 0.204 0.017 0.021 1.000
Zone 10 0.009 0.004 0.004 0.006 0.863 0.090 0.025 0.000 1.000
Zone 12 0.007 0.022 0.034 0.081 0.243 0.472 0.126 0.016 1.000
Zone 13 0.000 0.000 0.000 0.004 0.018 0.051 0.927 0.000 1.000
Zone 14 0.000 0.000 0.004 0.002 0.005 0.007 0.050 0.932 1.000
Recapture Zone
Recapture Zone
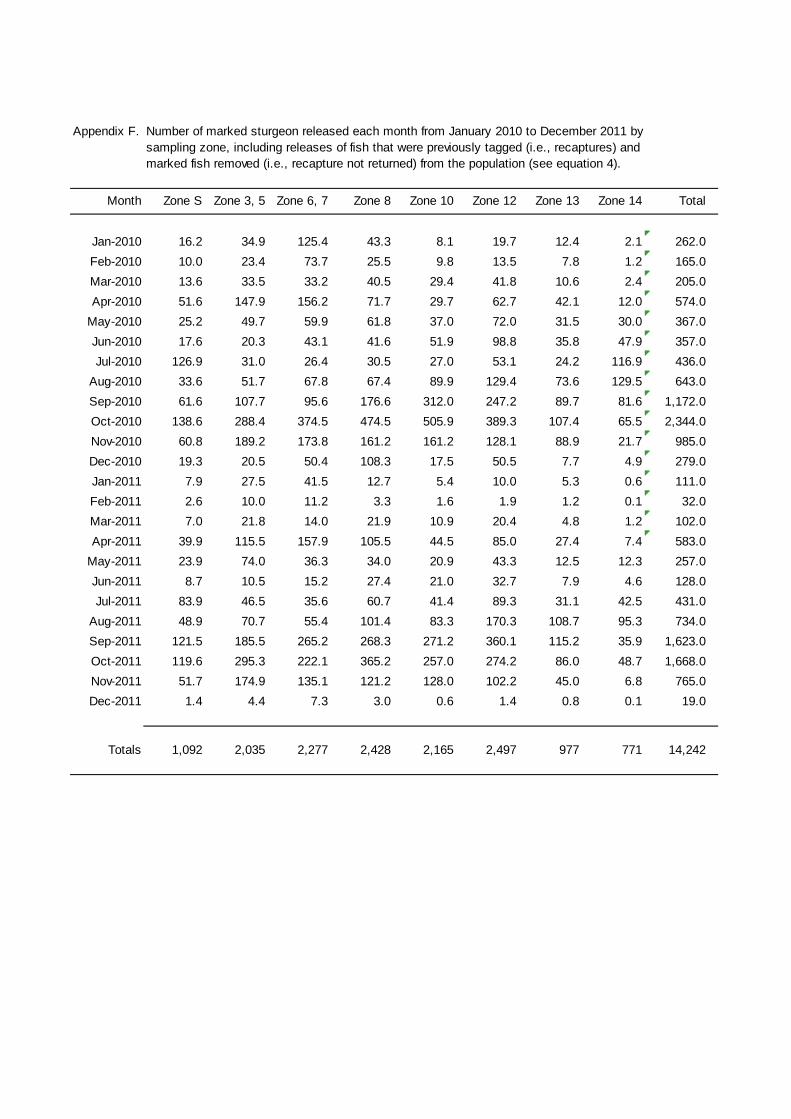
Appendix F. Number of marked sturgeon released each month from January 2010 to December 2011 by
sampling zone, including releases of fish that were previously tagged (i.e., recaptures) andmarked fish removed (i.e., recapture not returned) from the population (see equation 4).
Month Zone S Zone 3, 5 Zone 6, 7 Zone 8 Zone 10 Zone 12 Zone 13 Zone 14 Total
Jan-2010 16.2 34.9 125.4 43.3 8.1 19.7 12.4 2.1 262.0Feb-2010 10.0 23.4 73.7 25.5 9.8 13.5 7.8 1.2 165.0Mar-2010 13.6 33.5 33.2 40.5 29.4 41.8 10.6 2.4 205.0Apr-2010 51.6 147.9 156.2 71.7 29.7 62.7 42.1 12.0 574.0
May-2010 25.2 49.7 59.9 61.8 37.0 72.0 31.5 30.0 367.0Jun-2010 17.6 20.3 43.1 41.6 51.9 98.8 35.8 47.9 357.0Jul-2010 126.9 31.0 26.4 30.5 27.0 53.1 24.2 116.9 436.0
Aug-2010 33.6 51.7 67.8 67.4 89.9 129.4 73.6 129.5 643.0Sep-2010 61.6 107.7 95.6 176.6 312.0 247.2 89.7 81.6 1,172.0Oct-2010 138.6 288.4 374.5 474.5 505.9 389.3 107.4 65.5 2,344.0Nov-2010 60.8 189.2 173.8 161.2 161.2 128.1 88.9 21.7 985.0Dec-2010 19.3 20.5 50.4 108.3 17.5 50.5 7.7 4.9 279.0Jan-2011 7.9 27.5 41.5 12.7 5.4 10.0 5.3 0.6 111.0Feb-2011 2.6 10.0 11.2 3.3 1.6 1.9 1.2 0.1 32.0Mar-2011 7.0 21.8 14.0 21.9 10.9 20.4 4.8 1.2 102.0Apr-2011 39.9 115.5 157.9 105.5 44.5 85.0 27.4 7.4 583.0
May-2011 23.9 74.0 36.3 34.0 20.9 43.3 12.5 12.3 257.0Jun-2011 8.7 10.5 15.2 27.4 21.0 32.7 7.9 4.6 128.0Jul-2011 83.9 46.5 35.6 60.7 41.4 89.3 31.1 42.5 431.0
Aug-2011 48.9 70.7 55.4 101.4 83.3 170.3 108.7 95.3 734.0Sep-2011 121.5 185.5 265.2 268.3 271.2 360.1 115.2 35.9 1,623.0Oct-2011 119.6 295.3 222.1 365.2 257.0 274.2 86.0 48.7 1,668.0Nov-2011 51.7 174.9 135.1 121.2 128.0 102.2 45.0 6.8 765.0Dec-2011 1.4 4.4 7.3 3.0 0.6 1.4 0.8 0.1 19.0
Totals 1,092 2,035 2,277 2,428 2,165 2,497 977 771 14,242
Related Documents