INTERNATIONAL JOURNAL OF ENVIRONMENTAL SCIENCES Volume 3, No 1, 2012 © Copyright by the authors - Licensee IPA- Under Creative Commons license 3.0 Research article ISSN 0976 – 4402 Received on June 2012 Published on July 2012 659 Status of Riparian Buffer Zone and floodplain areas of River Narmada, India Vipin Vyas, Ankit Kumar, Shahnawaz Gani Wani, Vivek Parashar Department of Environmental Sciences and Limnology, Barkatullah University, Bhopal, India [email protected] doi:10.6088/ijes.2012030131064 ABSTRACT Riparian buffer zone is an area of trees, usually accompanied by shrubs and other vegetations along a river, stream or shoreline that is managed to maintain the integrity of the waterway to reduce pollution and to provide food, habitat and thermal protection for fish and other aquatic life. They provide an extensive list of benefits to both man and the environment because of their unique position between land and water. To assess the status of Riparian Buffer Zone (RBZ) along flood plain areas of a selected reach of river Narmada, an extensive survey was carried out on left and right banks. The observations made during the survey reveal that RBZs and floodplain areas were dominated by agricultural practices on both banks. The results depicted that agricultural practices and human habitation contribute 57.5% and 16.5% respectively, different types of vegetation like shrubs covers 1.5%, bushes 9.5%, pasture land 7%, barren land 6% and erosion approx 2% which shows that ecological conditions of river is directly disturbed due to excessive human interventions. Keywords: River Narmada, Riparian Buffer Zone, Floodplain areas. 1. Introduction River catchment or drainage basin is the natural unit of landscape, combining the link between terrestrial and aquatic ecosystems and it encompasses the entire area of land drained by various tributaries to the main river. The drainage area bordering the stream is called the riparian zone and is of critical importance to the function, as well as the protection and management of a river (Naiman et al., 1993). Riparian zone has dynamic environments characterised by strong energy regimes, substantial habitat heterogeneity, a diversity of ecological processes and multidimensional gradients. Riparian buffer zone (RBZ) is an area of trees, usually accompanied by shrubs and other vegetations along a river, stream or shoreline that is managed to maintain the integrity of the waterway to reduce pollution and to provide food, habitat and thermal protection for fish and wild life. The unique ecological functions of riparian zones are linked to dynamic biophysical processes and interactions across multiple spatial and temporal scales. Riparian buffer zones help in controlling soil or sediment erosion, maintaining water quality, provide habitats for different aquatic organisms, flooding & temperature control and construct a stable river bank. Floodplain areas are permanently wet area and can be distinguished from land subject to temporary, albeit sometimes prolonged, inundation resulting directly or indirectly from a rise in river level and tend to be highly productive ecosystems and have long been utilized for production of food and fiber and harvest of wild plants and animals. The floodplain is often desirable for farming and livestock production.

Welcome message from author
This document is posted to help you gain knowledge. Please leave a comment to let me know what you think about it! Share it to your friends and learn new things together.
Transcript
INTERNATIONAL JOURNAL OF ENVIRONMENTAL SCIENCES Volume 3, No 1, 2012
© Copyright by the authors - Licensee IPA- Under Creative Commons license 3.0
Research article ISSN 0976 – 4402
Received on June 2012 Published on July 2012 659
Status of Riparian Buffer Zone and floodplain areas of River Narmada,
India Vipin Vyas, Ankit Kumar, Shahnawaz Gani Wani, Vivek Parashar
Department of Environmental Sciences and Limnology, Barkatullah University,
Bhopal, India
doi:10.6088/ijes.2012030131064
ABSTRACT
Riparian buffer zone is an area of trees, usually accompanied by shrubs and other vegetations
along a river, stream or shoreline that is managed to maintain the integrity of the waterway to
reduce pollution and to provide food, habitat and thermal protection for fish and other aquatic
life. They provide an extensive list of benefits to both man and the environment because of
their unique position between land and water. To assess the status of Riparian Buffer Zone
(RBZ) along flood plain areas of a selected reach of river Narmada, an extensive survey was
carried out on left and right banks. The observations made during the survey reveal that RBZs
and floodplain areas were dominated by agricultural practices on both banks. The results
depicted that agricultural practices and human habitation contribute 57.5% and 16.5%
respectively, different types of vegetation like shrubs covers 1.5%, bushes 9.5%, pasture land
7%, barren land 6% and erosion approx 2% which shows that ecological conditions of river is
directly disturbed due to excessive human interventions.
Keywords: River Narmada, Riparian Buffer Zone, Floodplain areas.
1. Introduction
River catchment or drainage basin is the natural unit of landscape, combining the link
between terrestrial and aquatic ecosystems and it encompasses the entire area of land drained
by various tributaries to the main river. The drainage area bordering the stream is called the
riparian zone and is of critical importance to the function, as well as the protection and
management of a river (Naiman et al., 1993). Riparian zone has dynamic environments
characterised by strong energy regimes, substantial habitat heterogeneity, a diversity of
ecological processes and multidimensional gradients. Riparian buffer zone (RBZ) is an area
of trees, usually accompanied by shrubs and other vegetations along a river, stream or
shoreline that is managed to maintain the integrity of the waterway to reduce pollution and to
provide food, habitat and thermal protection for fish and wild life. The unique ecological
functions of riparian zones are linked to dynamic biophysical processes and interactions
across multiple spatial and temporal scales. Riparian buffer zones help in controlling soil or
sediment erosion, maintaining water quality, provide habitats for different aquatic organisms,
flooding & temperature control and construct a stable river bank. Floodplain areas are
permanently wet area and can be distinguished from land subject to temporary, albeit
sometimes prolonged, inundation resulting directly or indirectly from a rise in river level and
tend to be highly productive ecosystems and have long been utilized for production of food
and fiber and harvest of wild plants and animals. The floodplain is often desirable for farming
and livestock production.
Status of Riparian Buffer Zone and floodplain areas of River Narmada, India
Vipin Vyas et al International Journal of Environmental Sciences Volume 3 No.1, 2012
660
Geographical Information System (GIS) is the computer based systems that can deal with
virtually any type of information about features that can be referenced by geographical
location. These systems are capable of handling both locational and attribute data. Present
study was carried out on the riparian buffer zone including floodplain areas of river Narmada
in a reach stretching from Shahganj to Barandur (Bandua) with an objective to assess the
status of RBZs and floodplain areas with human interventions which affect the riverine
ecosystem.
2. Material and methods
2.1 Study area
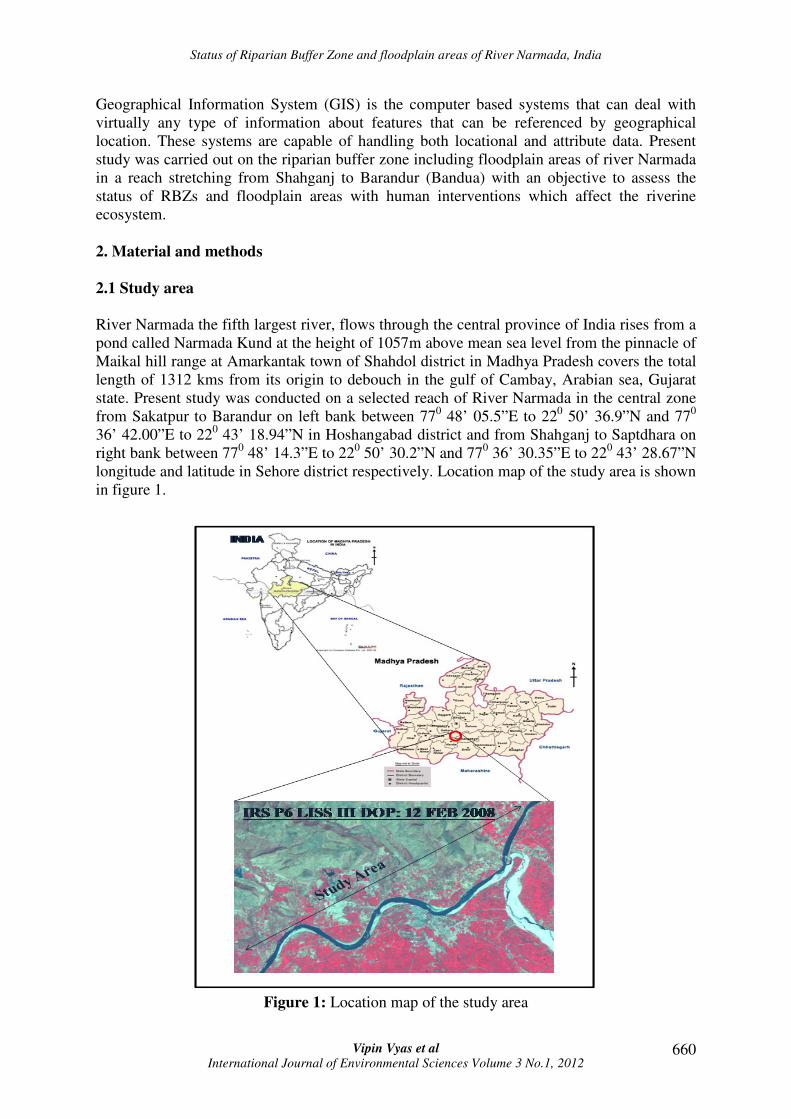
River Narmada the fifth largest river, flows through the central province of India rises from a
pond called Narmada Kund at the height of 1057m above mean sea level from the pinnacle of
Maikal hill range at Amarkantak town of Shahdol district in Madhya Pradesh covers the total
length of 1312 kms from its origin to debouch in the gulf of Cambay, Arabian sea, Gujarat
state. Present study was conducted on a selected reach of River Narmada in the central zone
from Sakatpur to Barandur on left bank between 770 48’ 05.5”E to 22
0 50’ 36.9”N and 77
0
36’ 42.00”E to 220 43’ 18.94”N in Hoshangabad district and from Shahganj to Saptdhara on
right bank between 770 48’ 14.3”E to 22
0 50’ 30.2”N and 77
0 36’ 30.35”E to 22
0 43’ 28.67”N
longitude and latitude in Sehore district respectively. Location map of the study area is shown
in figure 1.
Figure 1: Location map of the study area
Status of Riparian Buffer Zone and floodplain areas of River Narmada, India
Vipin Vyas et al International Journal of Environmental Sciences Volume 3 No.1, 2012
661
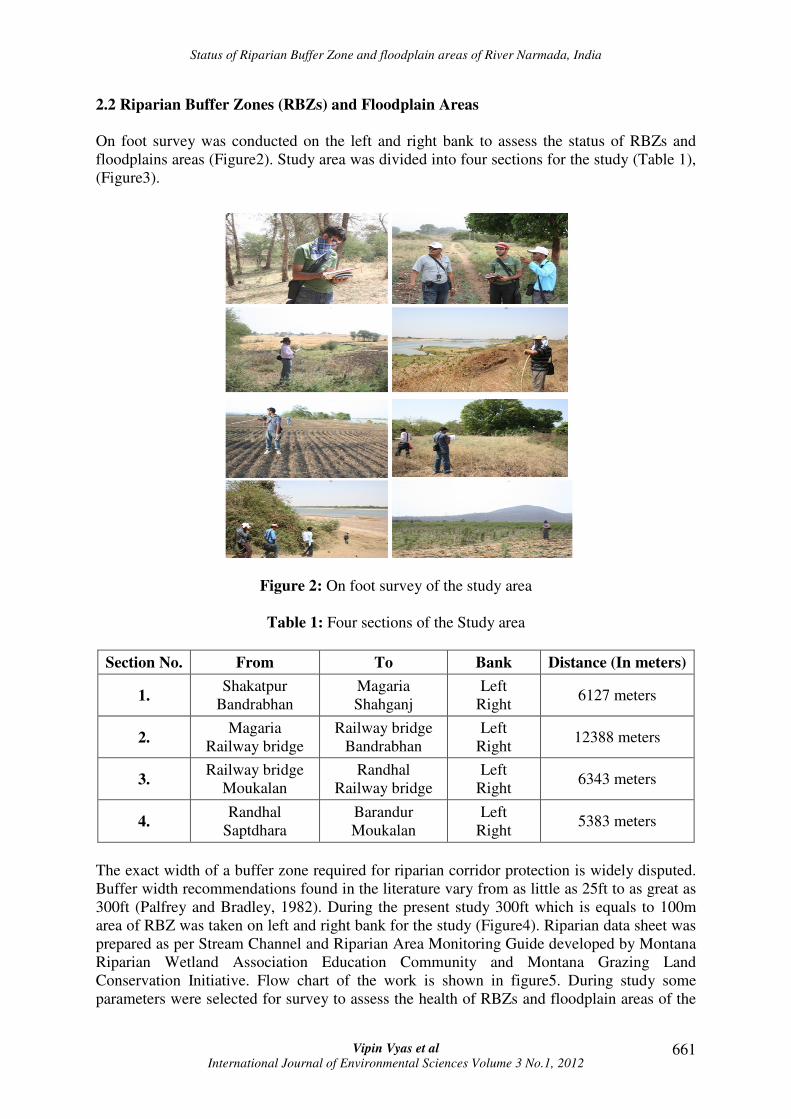
2.2 Riparian Buffer Zones (RBZs) and Floodplain Areas
On foot survey was conducted on the left and right bank to assess the status of RBZs and
floodplains areas (Figure2). Study area was divided into four sections for the study (Table 1),
(Figure3).
Figure 2: On foot survey of the study area
Table 1: Four sections of the Study area
Section No. From To Bank Distance (In meters)
1. Shakatpur
Bandrabhan
Magaria
Shahganj
Left
Right 6127 meters
2. Magaria
Railway bridge
Railway bridge
Bandrabhan
Left
Right 12388 meters
3. Railway bridge
Moukalan
Randhal
Railway bridge
Left
Right 6343 meters
4. Randhal
Saptdhara
Barandur
Moukalan
Left
Right 5383 meters
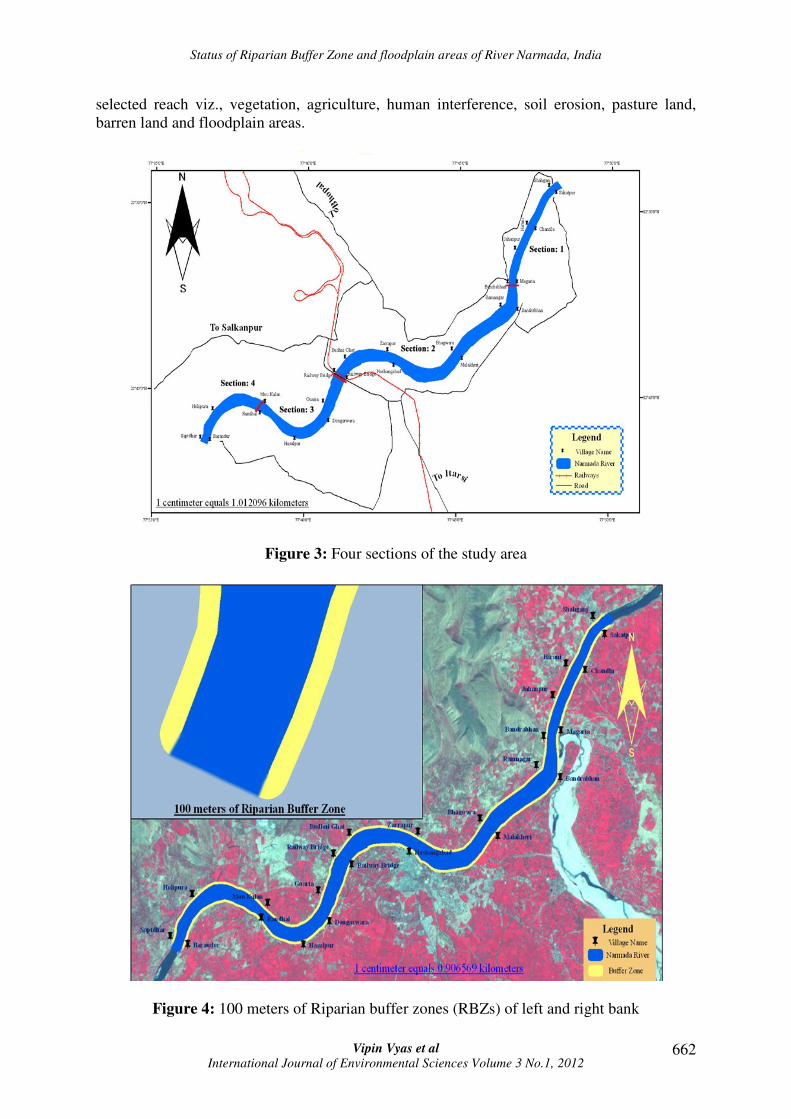
The exact width of a buffer zone required for riparian corridor protection is widely disputed.
Buffer width recommendations found in the literature vary from as little as 25ft to as great as
300ft (Palfrey and Bradley, 1982). During the present study 300ft which is equals to 100m
area of RBZ was taken on left and right bank for the study (Figure4). Riparian data sheet was
prepared as per Stream Channel and Riparian Area Monitoring Guide developed by Montana
Riparian Wetland Association Education Community and Montana Grazing Land
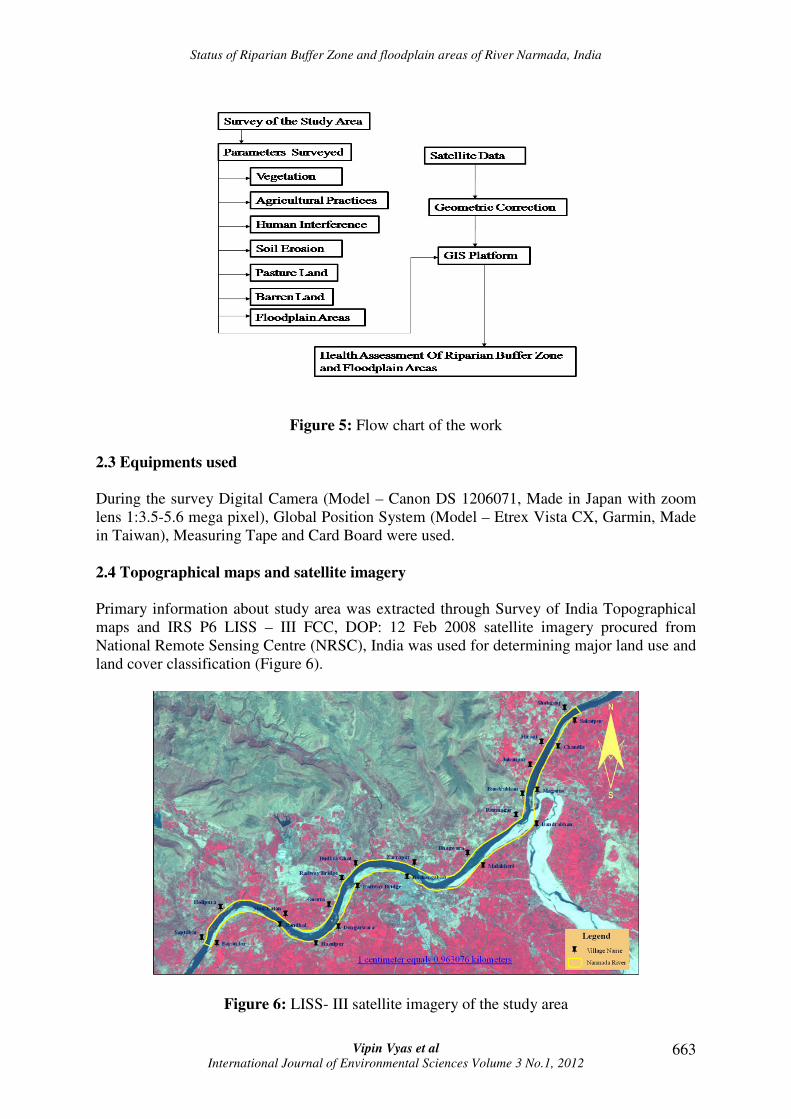
Conservation Initiative. Flow chart of the work is shown in figure5. During study some
parameters were selected for survey to assess the health of RBZs and floodplain areas of the
Status of Riparian Buffer Zone and floodplain areas of River Narmada, India
Vipin Vyas et al International Journal of Environmental Sciences Volume 3 No.1, 2012
662
selected reach viz., vegetation, agriculture, human interference, soil erosion, pasture land,
barren land and floodplain areas.
Figure 3: Four sections of the study area
Figure 4: 100 meters of Riparian buffer zones (RBZs) of left and right bank
Status of Riparian Buffer Zone and floodplain areas of River Narmada, India
Vipin Vyas et al International Journal of Environmental Sciences Volume 3 No.1, 2012
663
Figure 5: Flow chart of the work
2.3 Equipments used
During the survey Digital Camera (Model – Canon DS 1206071, Made in Japan with zoom
lens 1:3.5-5.6 mega pixel), Global Position System (Model – Etrex Vista CX, Garmin, Made
in Taiwan), Measuring Tape and Card Board were used.
2.4 Topographical maps and satellite imagery
Primary information about study area was extracted through Survey of India Topographical
maps and IRS P6 LISS – III FCC, DOP: 12 Feb 2008 satellite imagery procured from
National Remote Sensing Centre (NRSC), India was used for determining major land use and
land cover classification (Figure 6).
Figure 6: LISS- III satellite imagery of the study area
Status of Riparian Buffer Zone and floodplain areas of River Narmada, India
Vipin Vyas et al International Journal of Environmental Sciences Volume 3 No.1, 2012
664
2.5 Software used
ERDAS Imagine version 8.7 image analysis software was used for geometric correction of
satellite imagery and topographical maps. Arc GIS / Arc Map version 9.0 vector based
software was used for vector creations. Microsoft Excel 2007 graph based software is used to
create graphs during study.
2.6 Percent calculation
The data was recorded in the form of square meter and was converted into percentage form.
In mathematics, percent is a way of expressing a number as a fraction of 100 (percent
meaning “per hundred” in French). It is often denoted using the percent sign “%” or the
abbreviation “pct”. To find the percentage that a single unit represents out of a whole of N
units, divide 100% by N. The percent is shown by popular diagrams like pie and bar.
2.7 Physico-chemical analysis
The quality of water may be described in terms of concentration and state of some or all of
the organic and inorganic material present in water, together with certain physical
characteristics. Natural influences such as climatic conditions, geological conditions and
hydrological conditions also affect the quantity and quality of water. Human intervention like
agricultural practices, settlements and factories also has significant effects on water quality.
Water samples were collected from some villages located on the bank and confluence points
of some tributaries. Three water quality parameters were analysed during the study i.e.
Chloride (Cl-), Nitrate (NO3
-) and Orthophosphate (PO4
-) using analytical methods as per
Adoni et al., 1985.
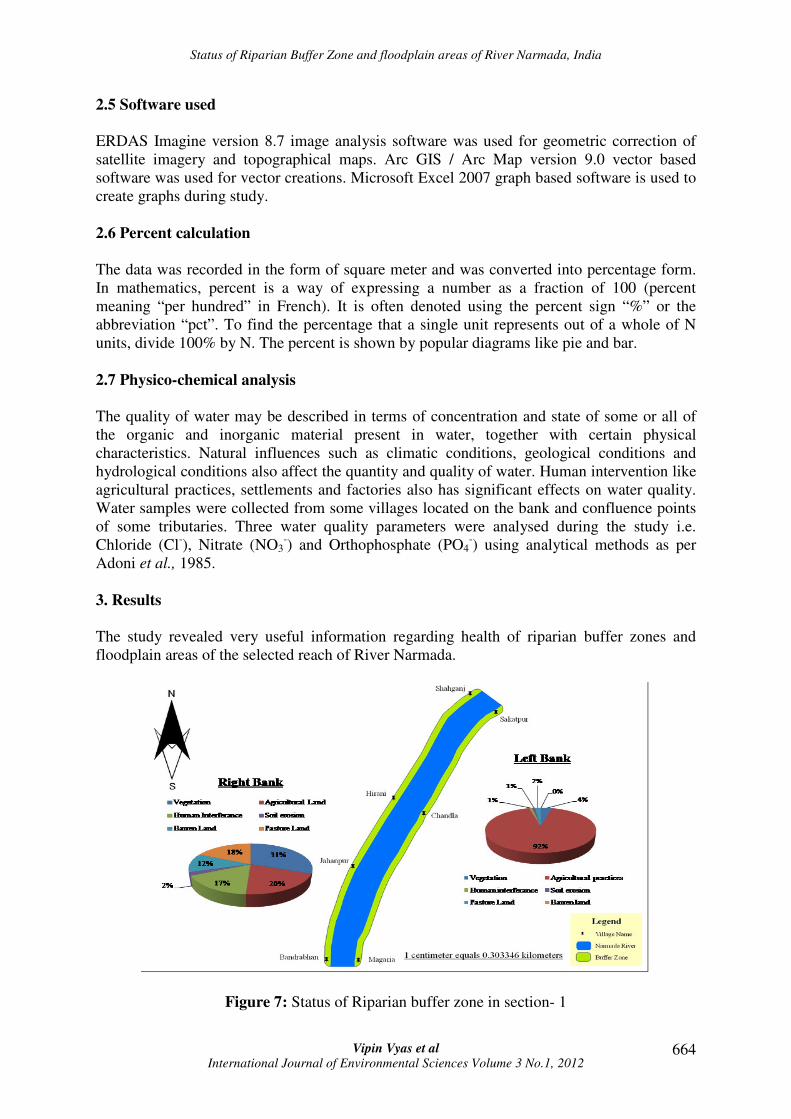
3. Results
The study revealed very useful information regarding health of riparian buffer zones and
floodplain areas of the selected reach of River Narmada.
Figure 7: Status of Riparian buffer zone in section- 1
Status of Riparian Buffer Zone and floodplain areas of River Narmada, India
Vipin Vyas et al International Journal of Environmental Sciences Volume 3 No.1, 2012
665
3.1 Riparian Buffer Zones (RBZs)
Survey of RBZ was done in four sections and all survey parameters were evaluated
accordingly.
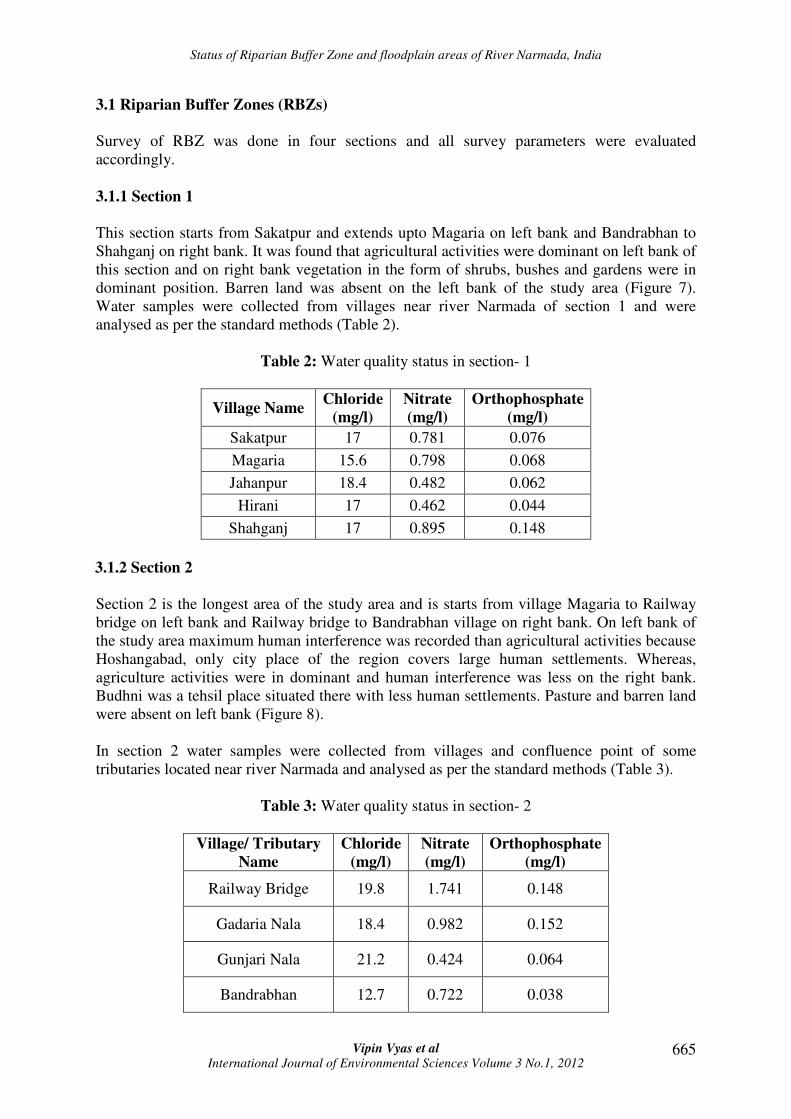
3.1.1 Section 1
This section starts from Sakatpur and extends upto Magaria on left bank and Bandrabhan to
Shahganj on right bank. It was found that agricultural activities were dominant on left bank of
this section and on right bank vegetation in the form of shrubs, bushes and gardens were in
dominant position. Barren land was absent on the left bank of the study area (Figure 7).
Water samples were collected from villages near river Narmada of section 1 and were
analysed as per the standard methods (Table 2).
Table 2: Water quality status in section- 1
Village Name Chloride
(mg/l)
Nitrate
(mg/l)
Orthophosphate
(mg/l)
Sakatpur 17 0.781 0.076
Magaria 15.6 0.798 0.068
Jahanpur 18.4 0.482 0.062
Hirani 17 0.462 0.044
Shahganj 17 0.895 0.148
3.1.2 Section 2
Section 2 is the longest area of the study area and is starts from village Magaria to Railway
bridge on left bank and Railway bridge to Bandrabhan village on right bank. On left bank of
the study area maximum human interference was recorded than agricultural activities because
Hoshangabad, only city place of the region covers large human settlements. Whereas,
agriculture activities were in dominant and human interference was less on the right bank.
Budhni was a tehsil place situated there with less human settlements. Pasture and barren land
were absent on left bank (Figure 8).
In section 2 water samples were collected from villages and confluence point of some
tributaries located near river Narmada and analysed as per the standard methods (Table 3).
Table 3: Water quality status in section- 2
Village/ Tributary
Name
Chloride
(mg/l)
Nitrate
(mg/l)
Orthophosphate
(mg/l)
Railway Bridge 19.8 1.741 0.148
Gadaria Nala 18.4 0.982 0.152
Gunjari Nala 21.2 0.424 0.064
Bandrabhan 12.7 0.722 0.038
Status of Riparian Buffer Zone and floodplain areas of River Narmada, India
Vipin Vyas et al International Journal of Environmental Sciences Volume 3 No.1, 2012
666
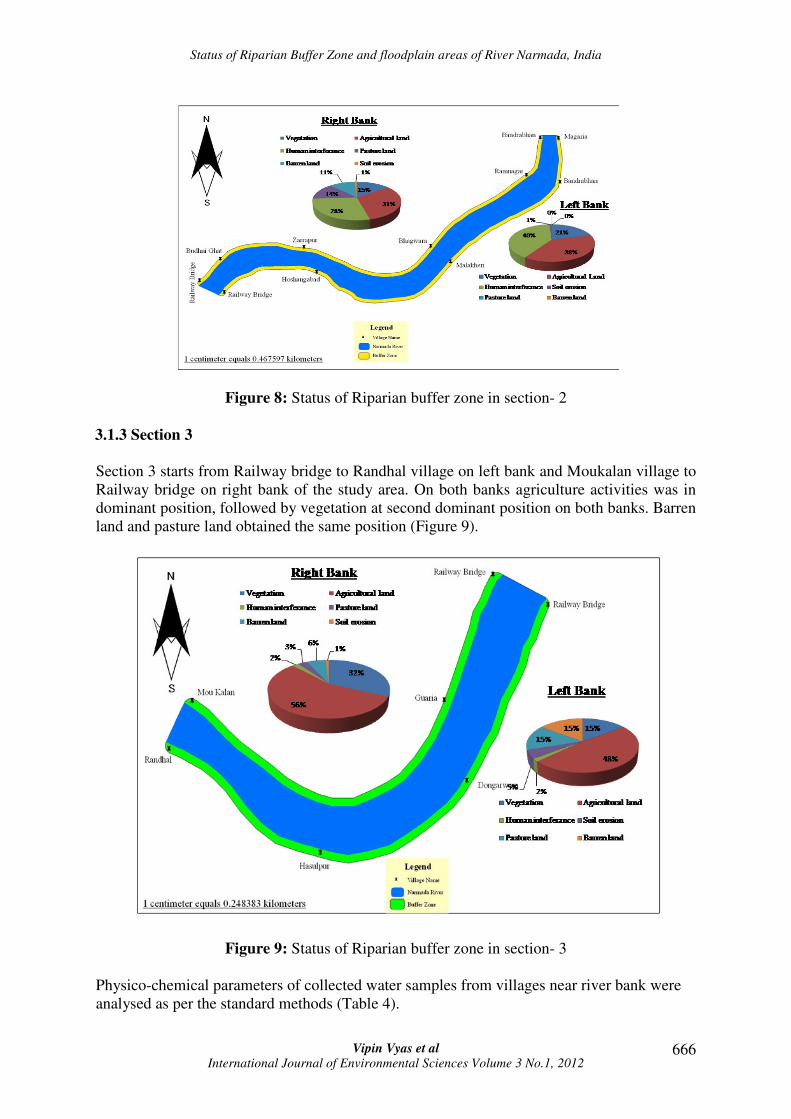
Figure 8: Status of Riparian buffer zone in section- 2
3.1.3 Section 3
Section 3 starts from Railway bridge to Randhal village on left bank and Moukalan village to
Railway bridge on right bank of the study area. On both banks agriculture activities was in
dominant position, followed by vegetation at second dominant position on both banks. Barren
land and pasture land obtained the same position (Figure 9).
Figure 9: Status of Riparian buffer zone in section- 3
Physico-chemical parameters of collected water samples from villages near river bank were
analysed as per the standard methods (Table 4).
Status of Riparian Buffer Zone and floodplain areas of River Narmada, India
Vipin Vyas et al International Journal of Environmental Sciences Volume 3 No.1, 2012
667
Table 4: Water quality status in section- 3
Village Name Chloride
(mg/l)
Nitrate
(mg/l)
Orthophosphate
(mg/l)
Dongarwara 25.5 1.246 0.268
Hasalpur 19.8 0.896 0.152
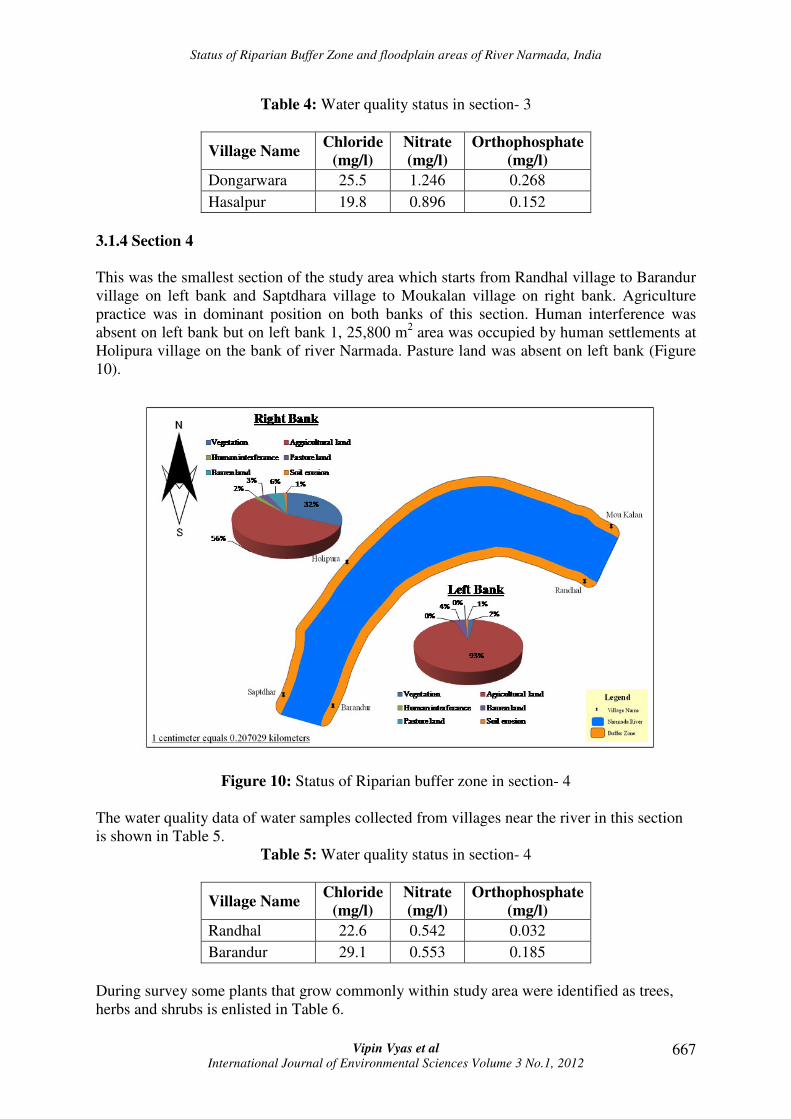
3.1.4 Section 4
This was the smallest section of the study area which starts from Randhal village to Barandur
village on left bank and Saptdhara village to Moukalan village on right bank. Agriculture
practice was in dominant position on both banks of this section. Human interference was
absent on left bank but on left bank 1, 25,800 m2 area was occupied by human settlements at
Holipura village on the bank of river Narmada. Pasture land was absent on left bank (Figure
10).
Figure 10: Status of Riparian buffer zone in section- 4
The water quality data of water samples collected from villages near the river in this section
is shown in Table 5.
Table 5: Water quality status in section- 4
Village Name Chloride
(mg/l)
Nitrate
(mg/l)
Orthophosphate
(mg/l)
Randhal 22.6 0.542 0.032
Barandur 29.1 0.553 0.185
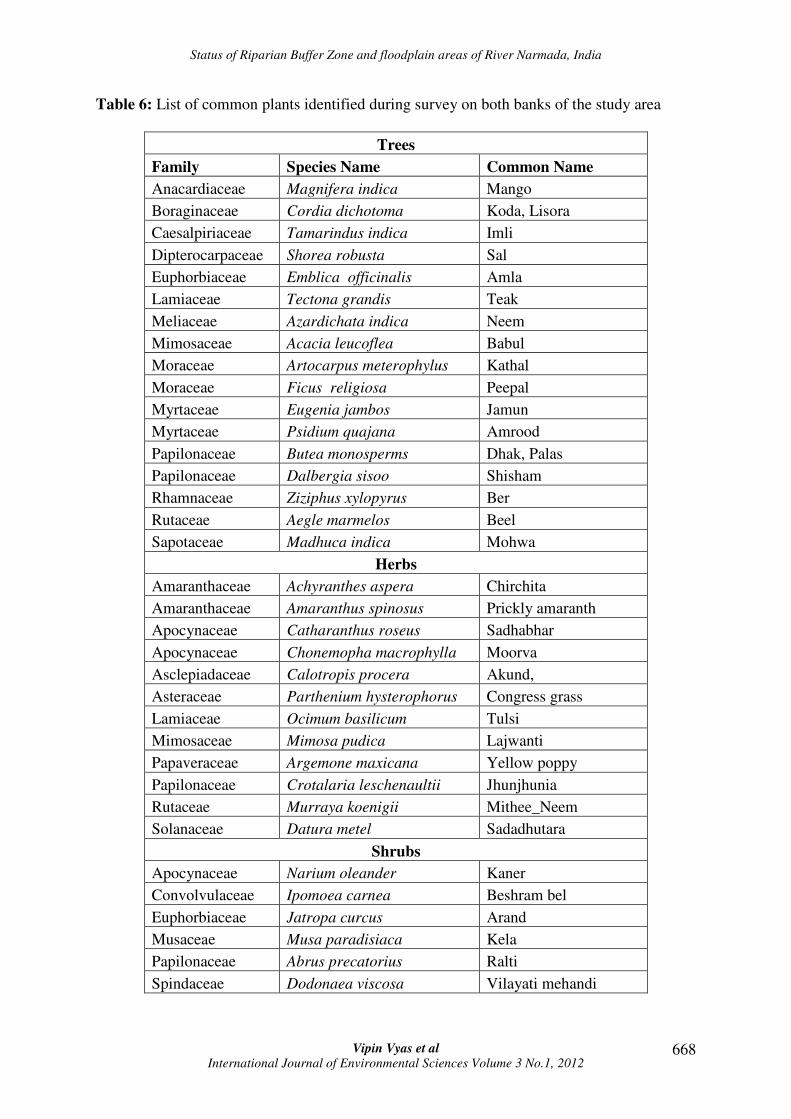
During survey some plants that grow commonly within study area were identified as trees,
herbs and shrubs is enlisted in Table 6.
Status of Riparian Buffer Zone and floodplain areas of River Narmada, India
Vipin Vyas et al International Journal of Environmental Sciences Volume 3 No.1, 2012
668
Table 6: List of common plants identified during survey on both banks of the study area
Trees
Family Species Name Common Name
Anacardiaceae Magnifera indica Mango
Boraginaceae Cordia dichotoma Koda, Lisora
Caesalpiriaceae Tamarindus indica Imli
Dipterocarpaceae Shorea robusta Sal
Euphorbiaceae Emblica officinalis Amla
Lamiaceae Tectona grandis Teak
Meliaceae Azardichata indica Neem
Mimosaceae Acacia leucoflea Babul
Moraceae Artocarpus meterophylus Kathal
Moraceae Ficus religiosa Peepal
Myrtaceae Eugenia jambos Jamun
Myrtaceae Psidium quajana Amrood
Papilonaceae Butea monosperms Dhak, Palas
Papilonaceae Dalbergia sisoo Shisham
Rhamnaceae Ziziphus xylopyrus Ber
Rutaceae Aegle marmelos Beel
Sapotaceae Madhuca indica Mohwa
Herbs
Amaranthaceae Achyranthes aspera Chirchita
Amaranthaceae Amaranthus spinosus Prickly amaranth
Apocynaceae Catharanthus roseus Sadhabhar
Apocynaceae Chonemopha macrophylla Moorva
Asclepiadaceae Calotropis procera Akund,
Asteraceae Parthenium hysterophorus Congress grass
Lamiaceae Ocimum basilicum Tulsi
Mimosaceae Mimosa pudica Lajwanti
Papaveraceae Argemone maxicana Yellow poppy
Papilonaceae Crotalaria leschenaultii Jhunjhunia
Rutaceae Murraya koenigii Mithee_Neem
Solanaceae Datura metel Sadadhutara
Shrubs
Apocynaceae Narium oleander Kaner
Convolvulaceae Ipomoea carnea Beshram bel
Euphorbiaceae Jatropa curcus Arand
Musaceae Musa paradisiaca Kela
Papilonaceae Abrus precatorius Ralti
Spindaceae Dodonaea viscosa Vilayati mehandi
Status of Riparian Buffer Zone and floodplain areas of River Narmada, India
Vipin Vyas et al International Journal of Environmental Sciences Volume 3 No.1, 2012
669
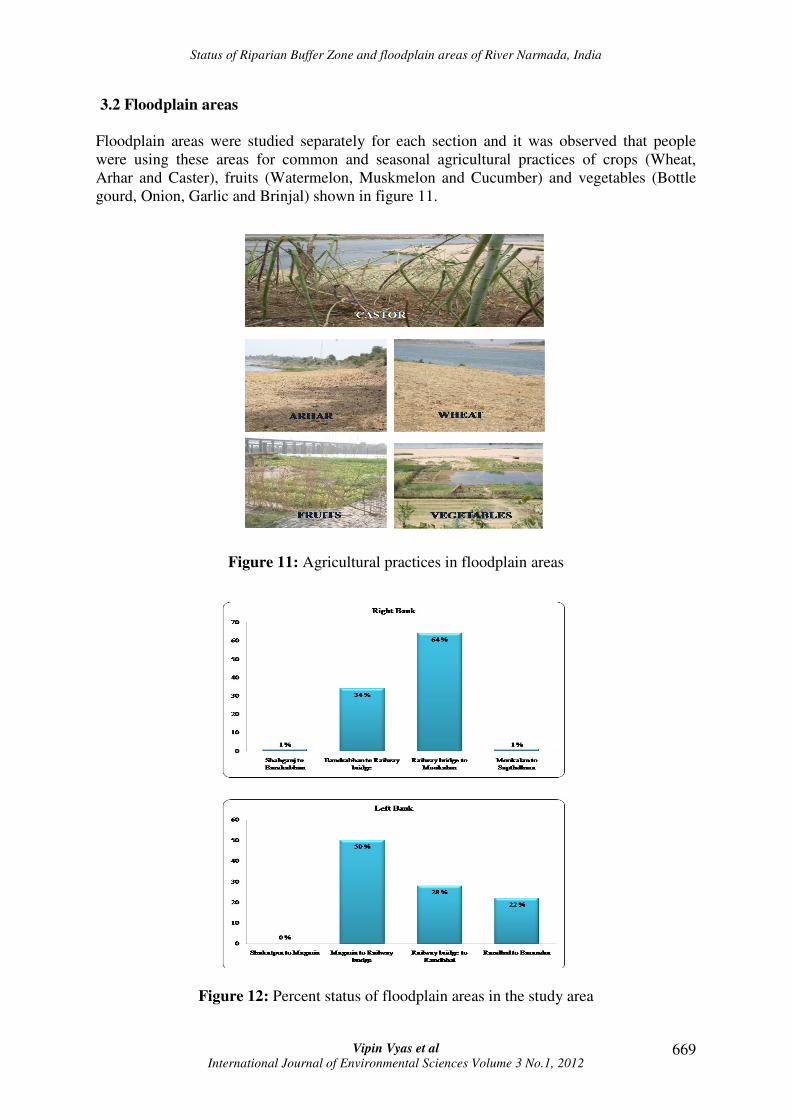
3.2 Floodplain areas
Floodplain areas were studied separately for each section and it was observed that people
were using these areas for common and seasonal agricultural practices of crops (Wheat,
Arhar and Caster), fruits (Watermelon, Muskmelon and Cucumber) and vegetables (Bottle
gourd, Onion, Garlic and Brinjal) shown in figure 11.
Figure 11: Agricultural practices in floodplain areas
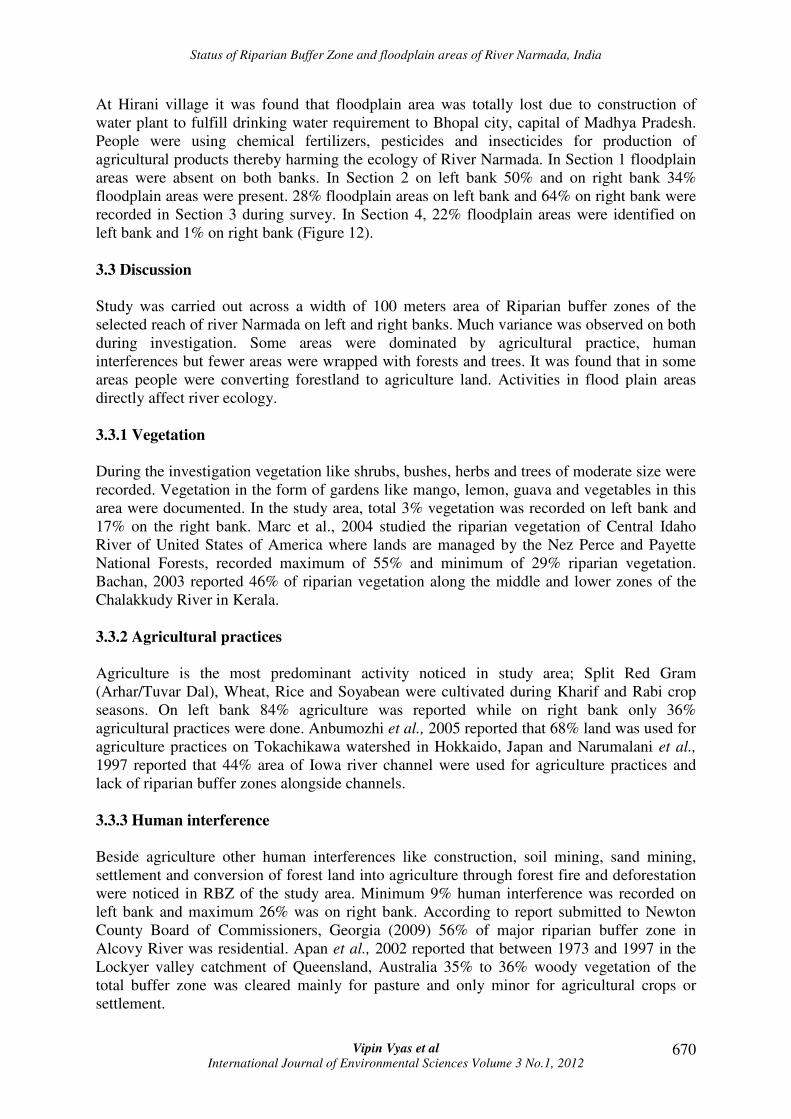
Figure 12: Percent status of floodplain areas in the study area
Status of Riparian Buffer Zone and floodplain areas of River Narmada, India
Vipin Vyas et al International Journal of Environmental Sciences Volume 3 No.1, 2012
670
At Hirani village it was found that floodplain area was totally lost due to construction of
water plant to fulfill drinking water requirement to Bhopal city, capital of Madhya Pradesh.
People were using chemical fertilizers, pesticides and insecticides for production of
agricultural products thereby harming the ecology of River Narmada. In Section 1 floodplain
areas were absent on both banks. In Section 2 on left bank 50% and on right bank 34%
floodplain areas were present. 28% floodplain areas on left bank and 64% on right bank were
recorded in Section 3 during survey. In Section 4, 22% floodplain areas were identified on
left bank and 1% on right bank (Figure 12).
3.3 Discussion
Study was carried out across a width of 100 meters area of Riparian buffer zones of the
selected reach of river Narmada on left and right banks. Much variance was observed on both
during investigation. Some areas were dominated by agricultural practice, human
interferences but fewer areas were wrapped with forests and trees. It was found that in some
areas people were converting forestland to agriculture land. Activities in flood plain areas
directly affect river ecology.
3.3.1 Vegetation
During the investigation vegetation like shrubs, bushes, herbs and trees of moderate size were
recorded. Vegetation in the form of gardens like mango, lemon, guava and vegetables in this
area were documented. In the study area, total 3% vegetation was recorded on left bank and
17% on the right bank. Marc et al., 2004 studied the riparian vegetation of Central Idaho
River of United States of America where lands are managed by the Nez Perce and Payette
National Forests, recorded maximum of 55% and minimum of 29% riparian vegetation.
Bachan, 2003 reported 46% of riparian vegetation along the middle and lower zones of the
Chalakkudy River in Kerala.
3.3.2 Agricultural practices
Agriculture is the most predominant activity noticed in study area; Split Red Gram
(Arhar/Tuvar Dal), Wheat, Rice and Soyabean were cultivated during Kharif and Rabi crop
seasons. On left bank 84% agriculture was reported while on right bank only 36%
agricultural practices were done. Anbumozhi et al., 2005 reported that 68% land was used for
agriculture practices on Tokachikawa watershed in Hokkaido, Japan and Narumalani et al.,
1997 reported that 44% area of Iowa river channel were used for agriculture practices and
lack of riparian buffer zones alongside channels.
3.3.3 Human interference
Beside agriculture other human interferences like construction, soil mining, sand mining,
settlement and conversion of forest land into agriculture through forest fire and deforestation
were noticed in RBZ of the study area. Minimum 9% human interference was recorded on
left bank and maximum 26% was on right bank. According to report submitted to Newton
County Board of Commissioners, Georgia (2009) 56% of major riparian buffer zone in
Alcovy River was residential. Apan et al., 2002 reported that between 1973 and 1997 in the
Lockyer valley catchment of Queensland, Australia 35% to 36% woody vegetation of the
total buffer zone was cleared mainly for pasture and only minor for agricultural crops or
settlement.
Status of Riparian Buffer Zone and floodplain areas of River Narmada, India
Vipin Vyas et al International Journal of Environmental Sciences Volume 3 No.1, 2012
671
3.3.4 Soil erosion
It is a natural process but it has been increased dramatically by human land use, especially
industrial, agriculture, deforestation and urban sprawl. The area under study however is
relatively safe in terms of soil erosion, only 1% of the area is prone to soil erosion on both
banks. Naiman et al., 1993 found 30% annual soil erosion on agricultural croplands of North
and South Platte rivers.
3.3.5 Pasture land
Riparian zones are always rich in herbs, grasses and seedlings which attract cattle. Grazing is
noticed throughout the study area in identified pasture land. In some places cattle were freely
allowed to graze in the river banks and agricultural land after harvesting. These activities are
a part of livelihood activities of local people. In the study area 2% pasture land was found on
left bank and 11% on right bank. Meynendonckx et al., 2006 reported 29% pasture land in
Scheldt river basin.
3.3.6 Barren land
The land which covers less than one third area of vegetation or other cover is known as
barren land. During the present investigation, minimum 1% of barren land was recorded on
left bank, while maximum 9% was recorded on right bank. Reed and Carpenter 2002 reported
barren land in six south Wisconsin streams viz. Garfoot Creek 0.5%, Brewery Creek 0.7%,
Pheasant Branch 2.3, Yahara River 3.8%, Otter Creek 0.4% and Silver Creek 2.4%
respectively.
3.3.7 Floodplain area
Floodplain areas are flat or nearly flat land adjacent to a stream or river that experiences
occasional or periodic flooding. Flood plain areas were found in the study area and during
investigation it was observed that flood plain areas were disturbed due to agricultural
activities. On both banks 50% of flood plain areas were recorded. Tockner and Stanford
(2002) observed that in Europe and North America up to 90% of floodplains are already
cultivated and therefore functionally extinct. In the developing world remaining natural flood
plains are disappearing at an accelerating rate, primarily as a result of changing hydrology.
3.3.8 Physico-chemical analysis
In the present study, three physico-chemical parameters viz., Chloride, Nitrate and
Orthophosphate nutrients closely related to the riparian buffer zones were analysed. The
concentration of Chloride ranges from 15.6 mg/l to 22.6 mg/l during the study. Anbumozhi et
al., 2005 recorded range of chloride from 15 mg/l to 28 mg/l in Tokachikawa watershed of
Hokkaido, Japan and sub watersheds of Indonesia. Nitrate ranges from 0.424 mg/l to 1.74
mg/l and orthophosphate ranges from 0.032 mg/l to 0.268 mg/l during the investigation. Day
Jr. et al., 2006 found range of Nitrate from 0.007 mg/l to 0.15 mg/l and range of
Orthophosphate from 0.1 mg/l to 0.9 mg/l at riparian zone of Ramos Swamp, Amelia,
Louisiana.
Status of Riparian Buffer Zone and floodplain areas of River Narmada, India
Vipin Vyas et al International Journal of Environmental Sciences Volume 3 No.1, 2012
672
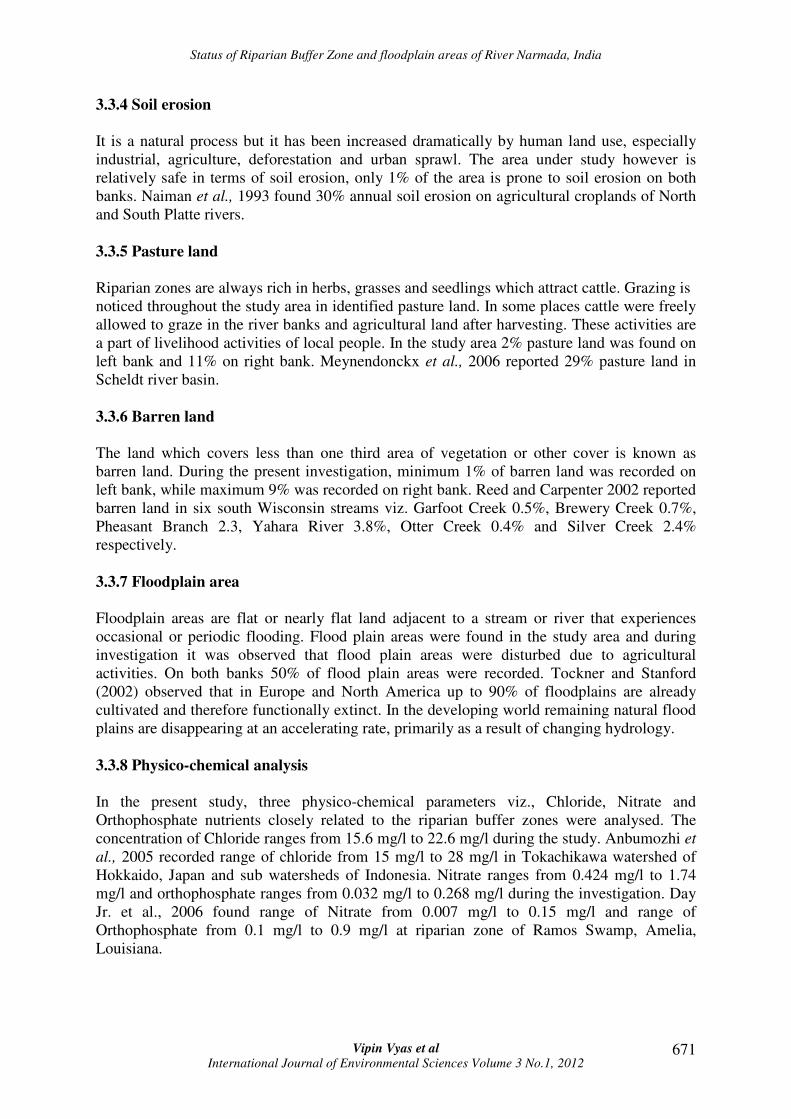
3.3.9 Overall Status of Riparian Buffer Zone (RBZ)
During the present investigation, it was found that riparian buffer zone is dominated with
agricultural practices and human habitation i.e. 57.5% and 16.5% while different types of
vegetation like shrubs cover 1.5% and bushes 9.5%. Pasture land covers 7%; barren land
covers 6% soil erosion prone area approx 2% in the study area. Major classes of riparian
buffer zone have been categorised through remotely sensed data using GIS software and it
was observed that RBZ of selected reach of river Narmada was totally disturbed (Figure13).
Agriculture runoff from RBZ and flood plain areas directly affects the riverine ecosystem on
large scale. Harmful chemicals, insecticides and pesticides load is harmful and hazardous for
human being and aquatic organisms those are dependent directly or indirectly on the river.
Figure 13: Overall status of Riparian Buffer Zone (RBZ) in the study area
4. Conclusion
No other species than humans has a greater impact on the stability, dynamics, diversity,
composition, structure and functioning on the earth’s communities and ecosystem. No
ecosystem of the earth’s surface is free of pervasive human interventions. Rapidly expanding
investigations of rivers in the context of their catchments and landscapes clearly indicate that
the river ecosystems are strongly affected by human actions across spatial scales. The
influence of surrounding landscape on a river is manifest across multiple scales and is
complicated by legacies from prior human activities. These findings indicate that condition of
RBZ and floodplain areas are alarming and needs some sustainable conservation efforts if the
riverine ecosystem is to be conserved for the future generations.
5. Recommendations
Riparian buffer zone is an area around a stream or another watercourse which has distinctive
vegetation and other characteristics which separate it from the land beyond the riparian zone.
Riparian buffer zones contribute a number of important things to natural environment and
many global agencies are promoting conservation, maintenance and restoration of riparian
zones for benefit of the environment in their regions (Wisegeek.com, 2012). The following
Status of Riparian Buffer Zone and floodplain areas of River Narmada, India
Vipin Vyas et al International Journal of Environmental Sciences Volume 3 No.1, 2012
673
recommendations for the restoration of Riparian buffer zone in selected reach of River
Narmada are as under:
1. Riparian forest can be planted by humans for a specific purpose because it provides
habitat for animals as well as an environment which may be more hospitable to some
plant species and help to trap and control non-point pollution, stabilize river banks, to
keep overall temperatures within a comfortable range, to reduce water loss through
evaporation and reducing the risk of flood damage in low-lying areas which may be
located in close proximity to the water..
2. River side forests will be useful for sound land management system that includes nutrient
management, filter sediment from surface runoff and erosion control.
3. Homeowners who live along riverbanks are also encouraged to establish healthy riparian
zones, which will look attractive in addition to raising property values and benefiting the
environment.
4. Government must integrate buffer restoration into state basin plans and watershed plans.
Establishment of intergovernmental funding mechanism that link buffer acquisition to
water quality benefits, coordinates land acquisition efforts with private and nonprofit
organization.
5. Plantation in the barren and eroded land should be done on large scale by collaboration
of government and local people. Dirty pathways along or within buffer zones should be
replaced with grasses way to revitalize riparian zone.
6. NGO’s must take part in the restoration of riparian buffer zones of river Narmada with
the assistance of villagers.
7. Floodplain areas activity should be noted and monitored.
Acknowledgements
Thanks to Department of Science and Technology (DST), New Delhi, India for providing
financial assistance as INSPIRE Fellowship. Authors are thankful to Prof. Pradeep
Shrivastava, Head, Department of Zoology and Applied Aquaculture, Barkatullah University,
Bhopal for permission to use remote sensing and GIS software for preparation of maps.
Valuable suggestions given by Mr. Amit Dubey are deeply acknowledged. Thanks to Mr.
Gajanand Dholiya, Mr. Hilal Ahmed Bhat and villagers of the study area who helped us
during field visit.
6. References
1. Adoni A.D, Joshi G, Ghosh K, Chourasia S.K, Vaishya A.K, Yadav M, Verma H.G,
(1985), Workbook on Limnology. Pratibha publishers, Sagar, India, pp 1-127.
2. Anbumozhi V, Radhakrishnan J, Yamaji E, (2005), Impact of riparian buffer zones on
water quality and associated management considerations, Ecological Engineering 24,
pp 517-523.
3. Apan A.A, Raine S.R, Paterson M.S, (2002), Mapping and analysis of changes in
the riparian landscape structure of the lockyer valley catchment, Queensland,
Australia. Landscape and Urban Planning, 59(1), pp 43-57.
4. Bachan A.K.H, (2003), Riparian vegetation along the middle and lower zones of the
Chalakkudy River. Kerala, India (Survey, mapping, community studies and

Status of Riparian Buffer Zone and floodplain areas of River Narmada, India
Vipin Vyas et al International Journal of Environmental Sciences Volume 3 No.1, 2012
674
identification of the residual pockets for conservation), Limnological Association of
Kerala, Iringalakkuda, Project report.
5. Day Jr J.W, Westphal A, Pratt R, Hyfield E, Rybczyk J, Kemp G.P, Day J.N, Marx B,
(2006), Effects of long-term municipal effluent discharge on the nutrient dynamics,
productivity, and benthic community structure of a tidal freshwater forested wetland
in Louisiana, Ecological Engineering, 27, pp 242-257.
6. Healthy Buffers- healthy Communities Alcovy River Riparian Buffer, Phase- 1,
Contact Reference no. 751-70085, (2009), Report to Newton County Board of
Commissioners, Georgia, 97.67.50.31/programs/riverbufferfinalreport.pdf.
7. Marc C.C-R, Richard C.H, Eric K.A, Caroline K, Jeffrey L.K, (2004), Repeatability
of riparian vegetation sampling methods: how useful are these techniques for broad-
scale, long-term monitoring? General Technical Report RMRS-GTR, pp 138.
8. Meynendonckx J, Heuvelmans G, Muys B, Feyen J, (2006), Effects of watershed and
riparian zone characteristics on nutrient concentrations in the River Scheldt Basin,
Hydrology and Earth System Sciences Discussions, 3, pp 653-679.
9. Naiman R.J, Décamps H, Pollock M, (1993), The role of riparian corridors in
maintaining regional biodiversity, Ecological Applications, 3(2), pp 209-212.
10. Narumalani S, Zhou Y, Jensenb J.R, (1997), Application of remote sensing and
geographic information systems to the delineation and analysis of riparian buffer
zones. Aquatic Botany, 58, pp 393-409.
11. Palfrey R, Bradley E, (1982), The buffer area study. Maryland Department of Natural
Resources. Tidewater Adminstration. Annpolis, MD, pp 31-32.
12. Reed T, Carpenter S.R, (2002), Comparisons of P-Yield, riparian buffer strips and
land cover in six agricultural watersheds, Ecosystems, 5, pp 568–577.
13. Stream Channel and Riparian Area Monitoring Guide of Montana State University,
Bozeman, Animal and Range Sciences Extension Services, Linfield, Montana,
available at http://animalrangeextension.montana.edu/articles/NatResourc/stream
channel.pdf.
14. Tockner K, Stanford J.A, (2002), Riverine floodplains: Present state and future
trends. Environmental Conservation, 29 (3), pp 308-330.
15. What is a water course, (2012), available at http://www.wisegeek.com/what-is-a-
watercourse.htm, accessed during May 2012.
Related Documents