Mississippi Emergency Management Agency Executive Summary On behalf of the State of Mississippi, the Governor’s Office and the Mississippi Hazard Mitigation Council, the Mississippi Emergency Management Agency is submitting this “State of Mississippi Standard Mitigation Plan” for review by the Federal Emergency Management Agency. This Plan is the result of a monumental effort from stakeholders, staff and technical advisors to complete a document that updates the 2013 Standard Mitigation Plan. The updated Plan addresses natural hazards throughout the state with the expressed purpose of “saving lives and reducing future losses” in anticipation of future events. Mississippi’s Standard Mitigation Plan has been completed with a high degree of public participation. By developing new partnerships and strengthening existing ties with local, state and federal agencies, the Plan reflects the needs of the entire State. Most importantly, the Plan mirrors the mindset of the people of Mississippi, which was learned by carefully listening to ideas and initiatives for hazard mitigation. “Mitigation Actions” that can be implemented to complete projects that are technically feasible, cost effective and environmentally sound are included within the Plan. It is a “living document” that will be constantly reviewed and updated thus reflecting current strategies and providing opportunities for evaluating the effectiveness of the projects and programs. While this Plan is being reviewed by the Federal Emergency Management Agency, the State of Mississippi will prepare for full adoption of the plan. This will be accomplished with the following actions: • The Mississippi Emergency Management Agency will review and respond to comments provided by the Federal Emergency Management Agency. • The Mississippi Hazard Mitigation Council will review the record of the process and, at the appropriate time, will recommend the adoption of the Plan. • The Office of the Governor, upon receipt of the Plan with addressed comments and recommendations, and by Executive Order, will adopt the plan for the State of Mississippi. This Standard Plan, submitted to the Federal Emergency Management Agency in August 2013 in compliance with local, state and federal requirements, is for the benefit of the people of the State of Mississippi. It is evidence of a great effort by all participants, and the contribution of those involved is greatly appreciated. The State of Mississippi is continuing to work towards an upgrade from the Standard Plan to “Enhanced Status.” This upgrade is an indication of the State’s desire to continually improve efforts to mitigate hazards through projects and programs that benefit the people of our State. The Mississippi Emergency Management Agency hereby submits this Standard Mitigation Plan for consideration by the Federal Emergency Management Agency.

Welcome message from author
This document is posted to help you gain knowledge. Please leave a comment to let me know what you think about it! Share it to your friends and learn new things together.
Transcript
Mississippi Emergency Management Agency
Executive Summary
On behalf of the State of Mississippi, the Governor’s Office and the Mississippi Hazard Mitigation Council, the Mississippi Emergency Management Agency is submitting this “State of Mississippi Standard Mitigation Plan” for review by the Federal Emergency Management Agency. This Plan is the result of a monumental effort from stakeholders, staff and technical advisors to complete a document that updates the 2013 Standard Mitigation Plan. The updated Plan addresses natural hazards throughout the state with the expressed purpose of “saving lives and reducing future losses” in anticipation of future events.
Mississippi’s Standard Mitigation Plan has been completed with a high degree of public participation. By developing new partnerships and strengthening existing ties with local, state and federal agencies, the Plan reflects the needs of the entire State. Most importantly, the Plan mirrors the mindset of the people of Mississippi, which was learned by carefully listening to ideas and initiatives for hazard mitigation.
“Mitigation Actions” that can be implemented to complete projects that are technically feasible, cost effective and environmentally sound are included within the Plan. It is a “living document” that will be constantly reviewed and updated thus reflecting current strategies and providing opportunities for evaluating the effectiveness of the projects and programs.
While this Plan is being reviewed by the Federal Emergency Management Agency, the State of Mississippi will prepare for full adoption of the plan. This will be accomplished with the following actions:
• The Mississippi Emergency Management Agency will review and respond to comments provided by the Federal Emergency Management Agency.
• The Mississippi Hazard Mitigation Council will review the record of the process and, at the appropriate time, will recommend the adoption of the Plan.
• The Office of the Governor, upon receipt of the Plan with addressed comments and recommendations, and by Executive Order, will adopt the plan for the State of Mississippi.
This Standard Plan, submitted to the Federal Emergency Management Agency in August 2013 in compliance with local, state and federal requirements, is for the benefit of the people of the State of Mississippi. It is evidence of a great effort by all participants, and the contribution of those involved is greatly appreciated.
The State of Mississippi is continuing to work towards an upgrade from the Standard Plan to “Enhanced Status.” This upgrade is an indication of the State’s desire to continually improve efforts to mitigate hazards through projects and programs that benefit the people of our State.
The Mississippi Emergency Management Agency hereby submits this Standard Mitigation Plan for consideration by the Federal Emergency Management Agency.

i
Mississippi Emergency Management Agency
Table of Contents1. Introduction
1.0 Introduction ....................................................................................................................................1.1
1.1 State Characteristics ...................................................................................................................... 1.3
1.2 Plan Adoption ............................................................................................................................... 1:15
1.3 Compliance with Federal Laws and Regulations ......................................................................... 1:17
2. The Planning Process
2.0 The Planning Process .................................................................................................................. 2:19
2.1 Documenting the Planning Process ............................................................................................. 2:20
2.2 Coordination with Federal and State Agencies and Interested Groups in the Planning Process .................................................................................. 2:22
2.3 Integration with Other Planning Efforts, Programs and Initiatives ................................................ 2:36
3. Risk Assessment
3.0 Risk Assessment .......................................................................................................................... 3:49
3.1 Identifying Hazards ...................................................................................................................... 3:53
3.2 ProfilngHazards ........................................................................................................................... 3:62
3.3 Tornado Risk Assessment ............................................................................................................ 3:70
3.4 Dam/Levee Failure Risk Assessment ......................................................................................... 3:103
3.5 Tropical Cyclone Risk Assessment ............................................................................................ 3:124
3.6 Flood Risk Assessment ..............................................................................................................3:177
3.7WildfireRiskAssessment ............................................................................................................ 3:230
3.8 Drought Risk Assessment .......................................................................................................... 3:246
3.9 Extreme Winter Weather Risk Assessment................................................................................3:254
3.10 Earthquake Risk Assessment ..................................................................................................... 3:271
3.11Non-ProfiledHazards.................................................................................................................3:295
3.12 Growth and Development Trends...............................................................................................3:311
3.13 Infrastructure Interdependencies ...............................................................................................3:330

ii
Mississippi Emergency Management Agency
4. Comprehensive State Mitigation Program
4.0 Comprehensive State Mitigation Program .................................................................................. 4:339
4.1 Goals and Objectives ................................................................................................................. 4:341
4.2 State Capabilities ....................................................................................................................... 4:348
4.3 Local Capability Assessment ....................................................................................................4:364
4.4 Mitigation Measures ................................................................................................................... 4:373
4.5 Funding Sources ........................................................................................................................ 4:386
5. Local Mitigation Planning
5.0 Local Mitigation Planning .......................................................................................................... 5:417
5.1 Local Mitigation Planning Coordination ...................................................................................... 5:418
5.2 Local Plan Integration ................................................................................................................. 5:422
5.3 Prioritizing Local Technical Assistance ....................................................................................... 5:425
6. Plan Maintenance Process
6.0 Plan Maintenance Process ......................................................................................................... 6:429
6.1 Monitoring, Evaluating and Updating the Plan ........................................................................... 6:430
6.2 Monitoring Progress of Mitigation Actions and Assessment of Mitigation Actions ............................................................................................... 6:433
7. Appendices
7.2 The Planning Process A - “RoadMap” 2010 to 2013 Update B - Hazard Mitigation Council Agendas and Sign-in Sheets C - The Survey D - State Agencies Database E - Stakeholders Database F - Proof of Publication G - Public Meeting Sign-in Sheets H - FEMA Reports: Summary of Community Activity Report Summary of Community Assistance Contacts (CAC) Summary of Community Assistance Visits (CAV) Historical CAC/CAV

iii
Mississippi Emergency Management Agency
7.3 HazardIdentificationandRiskAssessment
7.3.1 Identifying Hazards A - Hazard Ranking Work Sheet
7.3.2ProfilingHazards ADefinitionofCriticalFacility
BDefinitionofCriticalInfrastructure
CDefinitionofKeyAsset
D Critical Facility Location Maps
D-1 Desoto Area
D-2 Golden Triangle Area
D-3 Northwest Area
D-4 Northeast Area
D-5 Northwest Central Area
D-6 Northeast Central Area
D-7 Vicksburg Area
D-8 Metro Jackson Area
D-9 Southeast Central Area
D-10 Meridian Area
D-11 Southwest Central Area
D-12 Hattiesburg Area
D-13 Southwest Area
D-14 Gulf Cities Area
E State Facilities Replacement Values
F HAZUS State Facilities Summary
iv
Mississippi Emergency Management Agency
7.3.3 Tornado A - Tornado Vulnerability Assessment by County
7.3.4 Dam/Levee A - State of Mississippi Dam Inventory
7.3.5 Tropical Cyclone A-HurricaneEvacuationandContraflowRoutes
B - HAZUS Probabalistic Scenario
C-HAZUSKatrinaScenario
7.3.6 Flood A - Federal Emergency Management Agency Community Status Book Report
B - NFIP Loss Statistics
C - Mississippi HAZUS Flood Results
7.5.3 Prioritizing Local Technical Assessment A - STAPLE/E Review and Selection Criteria
B-ProjectProfileSheets
Sect. 1: 1
Mississippi Emergency Management Agency
1.0: IntroductionIn the 2013 Mississippi State Hazard Mitigation Plan, the State identified the following hazards to be widely significant when carrying out its mission and commitment to saving lives and reducing future losses:
• Flooding
• Extreme Winter Weather
• Earthquakes
• Wildfires
• Hurricanes
• Tornadoes
• Dam and Levee Failures
In accordance with the Code of Federal Regulations 44 (CFR 44),the Disaster Mitigation Act of 2000, and Section 322 of the Robert Stafford Disaster Relief and Emergency Assistance Act, the State of Mississippi has completed this 2013 State of Mississippi Standard Mitigation Plan Update. The update continues to establish an effective framework in which state mitigation initiatives can be implemented in order to protect lives and property.
The 2007 Standard Mississippi Hazard Mitigation Plan cited the completion of a State of Mississippi En-hanced Hazard Mitigation Plan at the year’s end. It was later determined that the State would be unable to complete the requirements of maintaining an enhanced plan due to its limited resources. The State is con-tinuing to enhance it’s capibilites to make the goal of becoming an enhanced state. The State will continue to be efficient with its resources and use them to approach the mitigation strategies, goals, and actions that are pertinent to Mississippi’s safety.
The completion of the “2013 State of Mississippi Standard Mitigation Plan Update” is a pre-requisite for re-ceiving some Federal disaster assistance. This disaster assistance includes Hazard Mitigation Assistance that is available to the State of Mississippi, as well as local Tribes, Cities and Counties. Participants of the 2013 Plan Update may be able to receive funds and use them to save lives and reduce future losses by planning for mitigation and implementation strategies.
In 2007, Governor Haley Barbour established a State of Mississippi Hazard Council by executive order. The Council is comprised of selected State Agency Officers and Directors and the Executive Directors of the organizations representing Counties and Cities throughout the State. Since 2007, it has inducted 2 new members. Vibrant, strong, and rich with ideals, the Council meets quarterly to track completed mitigation strategies and actions, to brainstorm new mitigation strategies, and to review current goals and initiatives. A listing of agencies represented by the council is available later in this document.
The Hazard Mitigation Council provides guidance in the development of the Plan. Nevertheless, the Coun-cil has not minimized the importance of sustaining an integrated and comprehensive approach to mitiga-tion. Therefore, this work is an effort coordinated with State and Local agencies, departments, and focus

Sect. 1: 2
Mississippi Emergency Management Agency
groups, as well as technical committees and representatives from Federal, State and Local agencies in the development of the Plan. This has been accomplished by first reviewing and incorporating all Local Hazard Mitigation Plans and planning efforts of State and Federal agencies. Then the efforts of others were care-fully incorporated to ensure that an effective coordination of all initiatives is central to the implementation of the plan.
The “2013 State of Mississippi Standard Mitigation Plan Update” has been completed with a high degree of public participation by stakeholders, agencies and the general public. This was accomplished by develop-ing a public participation process at the beginning of the planning process and effectively communicating the process as the project was developed. The result is that the concerns and ideas of the public are reflected in the Plan and mitigation action items have been developed to address the issues identified.
The “State of Mississippi Standard Mitigation Plan” is a “living document”. The Plan serves as a guide for hazard mitigation activities and provides a tool for implementing the most effective strategies. The Plan will be reviewed constantly as it is used and continuous improvement of the Plan will be reflected in updates and upgrades as needed, with a scheduled plan update to be completed at least every three years. Each section of the 2013 Mississippi Standard Hazard Mitigation Plan has been reviewed and/or updated to reflect changes from 2007, until now.
This plan, through its strategy of saving lives and reducing future losses, will contribute to the sustainability of the State of Mississippi. This sustainability will provide a balance in the economic, social and natural as-sets of the State resulting in a place that people want to be as they live, work and play.
Mississippi’s Standard Hazard Mitigation Plan – “Saving Lives and Reducing Future Losses.
Summary of Changes
• Statistical information has been changed to reflect Mississippi at its current status.
• The narrative has been updated to reflect purposes set forth by the State of Mississippi.
• All of Section 1 has been reviewed, all figures, tables and graphics have been updated to reflect any changes that have occurred since the 2010 plan update.
Sect. 1: 3
Mississippi Emergency Management Agency
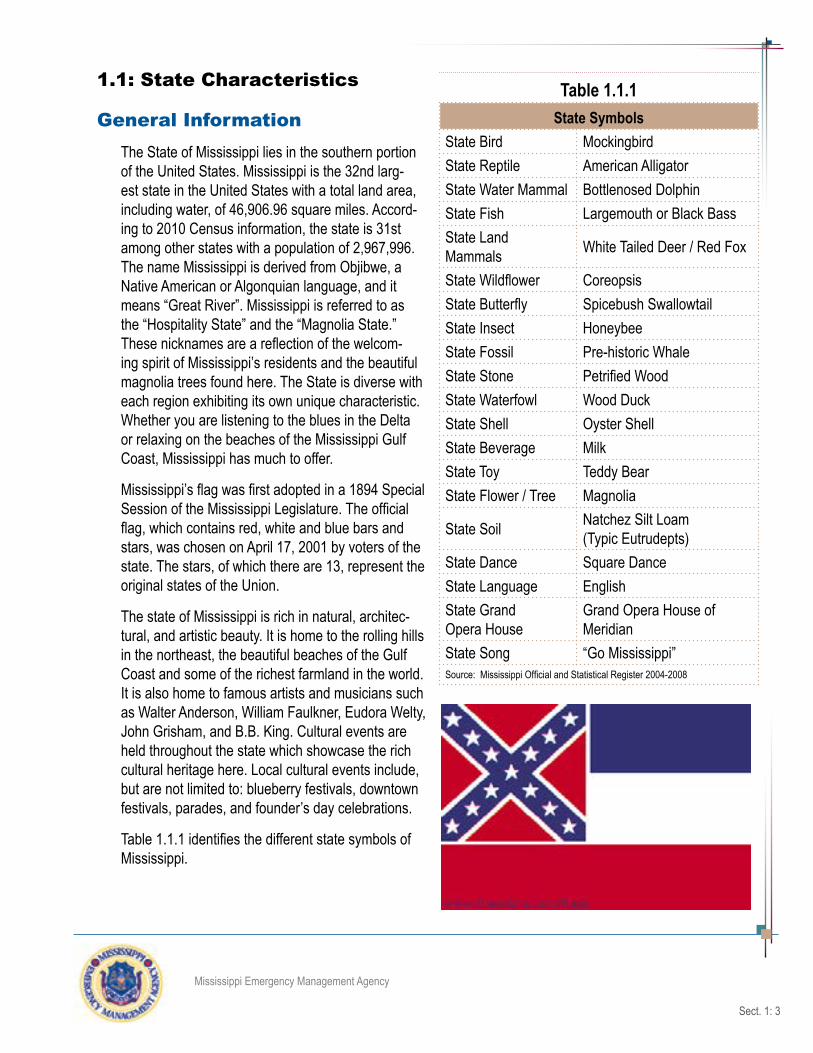
1.1: State Characteristics
General InformationThe State of Mississippi lies in the southern portion of the United States. Mississippi is the 32nd larg-est state in the United States with a total land area, including water, of 46,906.96 square miles. Accord-ing to 2010 Census information, the state is 31st among other states with a population of 2,967,996. The name Mississippi is derived from Objibwe, a Native American or Algonquian language, and it means “Great River”. Mississippi is referred to as the “Hospitality State” and the “Magnolia State.” These nicknames are a reflection of the welcom-ing spirit of Mississippi’s residents and the beautiful magnolia trees found here. The State is diverse with each region exhibiting its own unique characteristic. Whether you are listening to the blues in the Delta or relaxing on the beaches of the Mississippi Gulf Coast, Mississippi has much to offer.
Mississippi’s flag was first adopted in a 1894 Special Session of the Mississippi Legislature. The official flag, which contains red, white and blue bars and stars, was chosen on April 17, 2001 by voters of the state. The stars, of which there are 13, represent the original states of the Union.
The state of Mississippi is rich in natural, architec-tural, and artistic beauty. It is home to the rolling hills in the northeast, the beautiful beaches of the Gulf Coast and some of the richest farmland in the world. It is also home to famous artists and musicians such as Walter Anderson, William Faulkner, Eudora Welty, John Grisham, and B.B. King. Cultural events are held throughout the state which showcase the rich cultural heritage here. Local cultural events include, but are not limited to: blueberry festivals, downtown festivals, parades, and founder’s day celebrations.
Table 1.1.1 identifies the different state symbols of Mississippi.
Table 1.1.1State Symbols
State Bird MockingbirdState Reptile American AlligatorState Water Mammal Bottlenosed DolphinState Fish Largemouth or Black BassState Land Mammals White Tailed Deer / Red Fox
State Wildflower CoreopsisState Butterfly Spicebush SwallowtailState Insect HoneybeeState Fossil Pre-historic WhaleState Stone Petrified WoodState Waterfowl Wood DuckState Shell Oyster ShellState Beverage MilkState Toy Teddy BearState Flower / Tree Magnolia
State Soil Natchez Silt Loam (Typic Eutrudepts)
State Dance Square DanceState Language EnglishState Grand Opera House
Grand Opera House of Meridian
State Song “Go Mississippi”Source: Mississippi Official and Statistical Register 2004-2008

Sect. 1: 4
Mississippi Emergency Management Agency
State CapitolThe Mississippi State Capitol is located in Jackson, Mississippi. Jackson, the capitol city, is home to the Governor, Lt. Governor, House of Representatives and the State Senate. The existing capitol building, one of three capitol facilities built, was completed in 1903. The first building was completed in 1822 and the second one in 1833. The Old Capitol building of 1833 served three roles. Those roles were state capitol from 1839 to 1903, state office building from 1917 to 1959, and state historical museum from 1961 to pres-ent day. The first building, completed in 1850, was constructed to help ensure that Jackson would indeed be the capital city. The present day capitol building was designed by architect Theodore Link of St. Louis, Missouri. The architectural style is Beaux Arts. The focal point of the building is the 750 lights that illumi-nate four painted scenes and the rendition of a blind-folded lady which represents “Blind Justice.” The four painted scenes represent two Native American Indians, a Spanish explorer and a Confederate general. An eagle perched atop the capitol dome is made of solid copper overlain with gold leaf. The Mississippi capitol is a designated landmark building and is listed on the National Register of Historic Places.
Source: Mississippi Department of Archives and History. http://www.mdah.state.ms.us/new_museum/history.html 2007; Mississippi Legislature. http://billstatus.ls.state.ms.us/htms/cap_info.htm
Figure 1.1.1State of Mississippi Physlographic Regions
GeographyMississippi is bordered by the states of Alabama, Tennessee, Louisiana, and Arkansas. A por-tion of the state boundary is delineated by the Mississippi River. This river is one of the largest water bodies in the continental United States. Other major water bodies within the state include the Pearl River, Big Black River, Yazoo River, Pascagoula River, and the Tombigbee River. An important fact about the State’s geography is that lakes makes up 3 percent of the total area. The major lakes in Mississippi are Sardis Lake, Grenada Lake, Arkabutla Lake, and the Ross Barnett Reservoir.
The highest point in the state is Woodall Moun-tain in Tishomingo County. This landform has a total elevation of 806 feet. On the other hand, the lowest point in the sate is the Gulf of Mexico, which is at sea level. The mean elevation for Mississippi is 300 feet. The state can be divided into nine physiographic regions—Black Prairie, Coastal Zone, Delta, Jackson Prairie, Loess Hills, North Central Hills, Pine Belt, South Central Hills, and Tombigbee Hills.

Sect. 1: 5
Mississippi Emergency Management Agency
Black Prairies: this region extends from the northeastern corner of Noxubee County northward to Alcorn County and a small portion of Tishomingo County. The predominant soil type found in this region is clay. The topography in the Black Prairie region is flat.
Coastal Zone: this region covers portions of Pearl River, George, Hancock, Harrison, and Jackson coun-ties. The predominant soil type in this region is acidic and sand with has areas of boggy soil high in organic content. Flat plains are the general topography.
Delta: this region covers the area of the state that borders the Mississippi River from a portion of DeSoto County down to the northeast corner of Wilkinson County. Flat plain is the general topography of the region. The Delta soil is characterized as mildly acidic to mildly alkaline.
Jackson Prairie: this region extends from portions of Wayne County to northern Rankin County. The pre-dominant soil types in this region are both acidic and non-acidic. The topography is somewhat rolling with areas of ridges and valleys.
Loess Hills: this region extends from DeSoto County southward to Wilkinson County. The predominant soil type in this region is both acidic and non-acidic. This part of the state is also considered the brown loam region. The topography of this physiographic region is characterized by narrow ridges and steep-sided ravines.
North Central Hills: covering a large portion of Mississippi, this region extends from the northern portion of the state from Marshall County southward to northern Madison County then southwestward to Wayne County. The soils in this region are mostly acidic. The topography is characterized by both ridges and val-leys.
Pine Belt: this region covers either all or portions of Walthall, Jefferson Davis, Jones, Covington, Lamar, Forrest, Perry, Greene, Pearl River, Stone, Wayne, and Harrison counties. The soil is acidic. The topogra-phy includes rolling hills as well as areas of steep-sided ridges and valleys. This region is also known for its abundance of hardwood trees.
South Central Hills: extending from southern Madison County to Wayne County and then southward to Wilkinson, Walthall, Amite, and Pike counties, the soil found here is primarily sandy loam. The topography includes rolling hills with broad valleys.
Tombigbee Hills: this region extends from Lowndes County northward to Tishomingo County. The soil is acidic and highly weathered. Topography in the Tombigbee Hills region is characterized by numerous streams, ravines and ridges, and contains the highest point in the state which is Woodall Mountain. The total height of this mountain is 806 feet.
Data Sources: Mississippi State University Department of Geosciences – http://www.msstate.edu/dept/geosciences/faculty/brown/NWA_Journal/fig3.html Delta State University Department of Biology and Environmental Sciences – http://www.marshdoc.com/physiography/physiograph

Sect. 1: 6
Mississippi Emergency Management Agency
ClimateThe State of Mississippi is located in the humid subtropical climate region of the United States, which is characterized by long, hot summers, temperate winters and rainfall that is evenly dis-tributed throughout the year. The State is divided into 10 different climate zones: 1-Upper Delta; 2-North Central; 3-Northeast; 4-Lower Delta; 5-Central; 6-East Central; 7-Southwest; 8-South Central; 9-Southeast; and 10-Coastal. The normal mean annual temperatures range from 68 degrees along the coast to 62 degrees in the north. There have been occurrences where the temperature has dropped below 16 degrees and close to zero degrees in some areas. Mississippi-ans have also routinely witnessed temperatures reaching 100 degrees in many areas. The record for the highest temperature was in Holly Springs, Miss., on July 29, 1930, when the temperature reached 115 degrees. The lowest temperature on record to date, minus 19 degrees, was set on January 30, 1966, in Corinth, Miss.
Normal precipitation ranges from 50 to 65 inches throughout the state. Traceable amounts of snow and sleet are typical in the northernmost coun-ties. These northern counties have also experi-enced moderate and severe ice storms. A more detailed description of these occurrences can be found in Section 3.5.
Figure 1.1.2Climate Divisions of Mississippi

Sect. 1: 7
Mississippi Emergency Management Agency
RecreationThe State of Mississippi is home to over 22 state parks (Figure 1.1.3), which are easily accessible to the public. Each park offers a variety of recreational activities such as boating, wildlife watching, fishing, hiking, and swim-ming. It was estimated by a 2011 U.S. Fish and Wildlife Service Survey that approximately 1.4 million Mississippi residents and nonresidents participated in a wildlife-associated recreation with the State of Mississippi. Accordingly, the Bureau of Economic Analysis estimates that $611 million were spent on forestry, fishing, and related activities within Mississippi in 2007.
In a 2011 study by the U.S. Departmment of Commerce, almost $1 billion were contributed to the state economy as a result of recreational activities. The Mississippi Department of Wild-life, Fisheries and Parks oversees the state’s parks and fisheries and operates 24 fishing lakes that span 6,044 acres. This agency is also responsible for 38 Wildlife Management Areas reserved for public hunting. In addition to the substantial amount of parks and wildlife related activities, many municipalities across the state provide and maintain parks for resi-dents and visitors. Golf serves as the recreation of choice for residents as well as tourists and business travelers.
The state has more than 140 public and private golf courses located statewide. The location and climate of Mississippi make golf one of the more popular forms of recreation. Many PGA sponsored events have been held in the state and have attracted top-ranked professionals. There are many other forms of recreational opportunities that exist other than the traditional forms. Among these are: disc golf, paintball, skateboarding, and bicycling.
Figure 1.1.3Mississippi State Parks and Destinations
Data sources: Mississippi Department of Wildlife, Fisheries and Parks – http://www.mdwfp.com 2013; Mississippi State University Extension Service – http://naturalresources.msstate.edu/stats/index.html 2013; Mississippi Development Authority/Tourism Division – Golf, www. mapsofworld.com 2013, Mississippi – http://visitmississippi.org 2013
Sect. 1: 8
Mississippi Emergency Management Agency
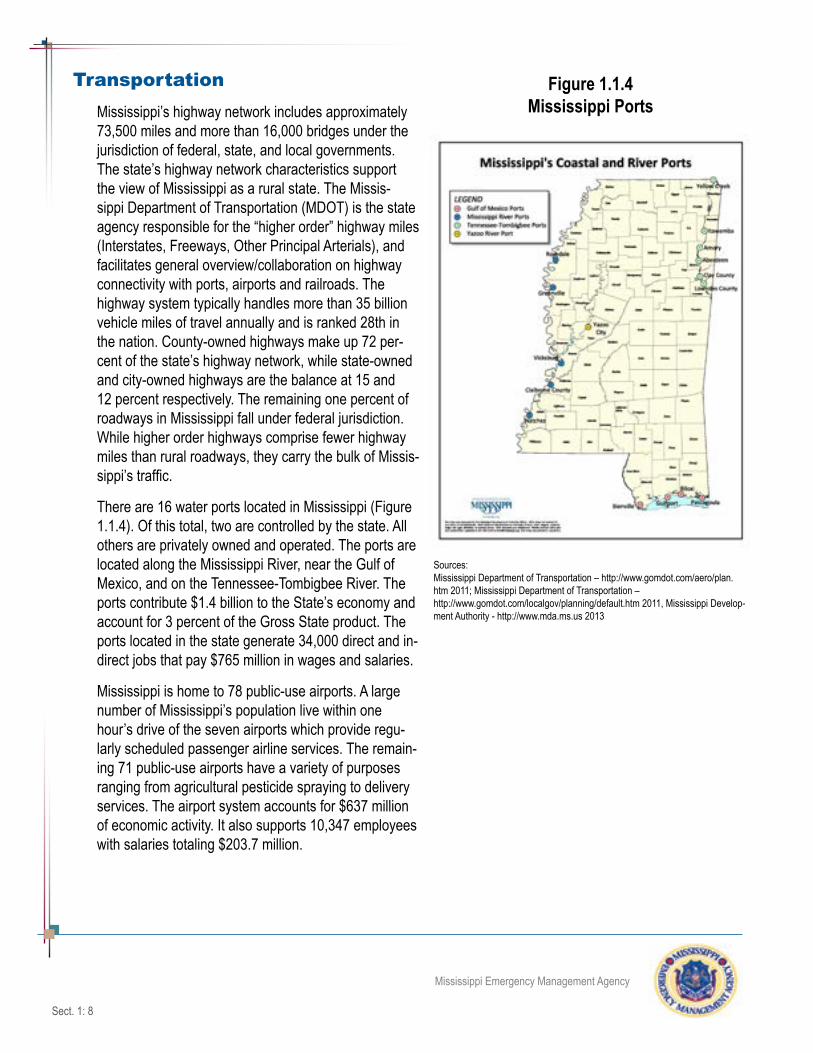
TransportationMississippi’s highway network includes approximately 73,500 miles and more than 16,000 bridges under the jurisdiction of federal, state, and local governments. The state’s highway network characteristics support the view of Mississippi as a rural state. The Missis-sippi Department of Transportation (MDOT) is the state agency responsible for the “higher order” highway miles (Interstates, Freeways, Other Principal Arterials), and facilitates general overview/collaboration on highway connectivity with ports, airports and railroads. The highway system typically handles more than 35 billion vehicle miles of travel annually and is ranked 28th in the nation. County-owned highways make up 72 per-cent of the state’s highway network, while state-owned and city-owned highways are the balance at 15 and 12 percent respectively. The remaining one percent of roadways in Mississippi fall under federal jurisdiction. While higher order highways comprise fewer highway miles than rural roadways, they carry the bulk of Missis-sippi’s traffic.
There are 16 water ports located in Mississippi (Figure 1.1.4). Of this total, two are controlled by the state. All others are privately owned and operated. The ports are located along the Mississippi River, near the Gulf of Mexico, and on the Tennessee-Tombigbee River. The ports contribute $1.4 billion to the State’s economy and account for 3 percent of the Gross State product. The ports located in the state generate 34,000 direct and in-direct jobs that pay $765 million in wages and salaries.
Mississippi is home to 78 public-use airports. A large number of Mississippi’s population live within one hour’s drive of the seven airports which provide regu-larly scheduled passenger airline services. The remain-ing 71 public-use airports have a variety of purposes ranging from agricultural pesticide spraying to delivery services. The airport system accounts for $637 million of economic activity. It also supports 10,347 employees with salaries totaling $203.7 million.
Figure 1.1.4Mississippi Ports
Sources: Mississippi Department of Transportation – http://www.gomdot.com/aero/plan.htm 2011; Mississippi Department of Transportation – http://www.gomdot.com/localgov/planning/default.htm 2011, Mississippi Develop-ment Authority - http://www.mda.ms.us 2013

Sect. 1: 9
Mississippi Emergency Management Agency
PopulationThe 2012 estimated population of Mississippi is 2,984,926. This number indicates a .95 percent increase from the 2000 figure of 2,848,666. The State of Mississippi is composed of 82 counties ranging in popula-tion from Issaquena, the smallest, with a total of 1,406 individuals to Hinds County, with 245,285. Based on the 2010 Census, the state averages 63.2 persons per square mile as compared to the United States with 87.4 persons per square mile. The counties that are most densely populated are DeSoto (224.3), Harrison (326.3) and Hinds (288.6).
The following is a breakdown of other population characteristics for the state:
• 37 cities have populations of 10,000 and above.
• 13 counties have populations of 50,000 and above.
• Four Metropolitan Areas, with the largest being the Memphis, Tenn., and DeSoto County Miss., that has a population of 1,135,614 and a population density of 377.7. This Metropolitan Statistical Area (MSA) ranked 43rd, which places it above Jacksonville, Fla., USA, and Tucson, Arz., USA. The next largest is Biloxi-Gulfport-Pascagoula USA with a population of 363,988 and a population density of 203.9.
• The median age is 35.5 years.
• 49.6 percent of the population is male.
• 51.4 percent of the population is female.
• 74.8 percent of the population is 18 years old or older. Of this total, 67.6 percent is 21 and over.
• The largest race class is White/Caucasian at 60.0 percent followed by African American/Black at 37.3.
• Per capita income for 2010 was $20,521.
• The poverty rate in 2010 was 17.6 percent. This is slightly higher than the national average of 14.3 percent.
• Average household size is 2.58 persons.
Mississippi is classified as a mostly rural state. Sixty-three percent of the state is classified rural as com-pared to 36.9 percent for urban. The definition of urban is those areas that are densely populated in and around large cities having a population over 50,000. It is also defined as those residential areas outside of the cities with a population of 2,500 or greater. As stated previously, the majority of the state is classified as rural. Rural is defined as those areas outside of the city with a population under 2,500. There are a total of 258 Census Designated Places (CDP) in the State of Mississippi. Of this total, 223 (86.4 percent) are considered rural. A CDP is a community or city that meets criteria set by Census.
Sect. 1: 10
Mississippi Emergency Management Agency
In order of size and based on 2010 estimates by the U.S. Census, the populations of the top seven cities in Mississippi are:
• Jackson 173,514• Gulfport* 67,793• Biloxi* 44,054• Hattiesburg 45,989• Tupelo 34,546• Meridian 41,148• Southaven 48,482
In late August 2005, the worst natural disaster in United States history struck Mississippi. This disaster was Hurricane Katrina. It affected (and to date is still negatively affecting) the lives of many along the Gulf Coast region. At landfall, this Category 3 storm wiped out entire towns and communities. The densely populated cities of the Coast were turned into “ghost towns.” The aforementioned figures show that two of the larger cities were located on the Mississippi Gulf Coast. According to a population report completed by CLARITAS in January 2006, the counties of Harrison, Hancock and Jackson lost a total population of 47,666. Since that initial impact, 27,295 or 57.26 percent has returned. While those three counties lost population due to the initial stages of Katrina, the counties of Pearl River, Stone, and George gained population. The total number of initial population impact for all three combined was 19,140.
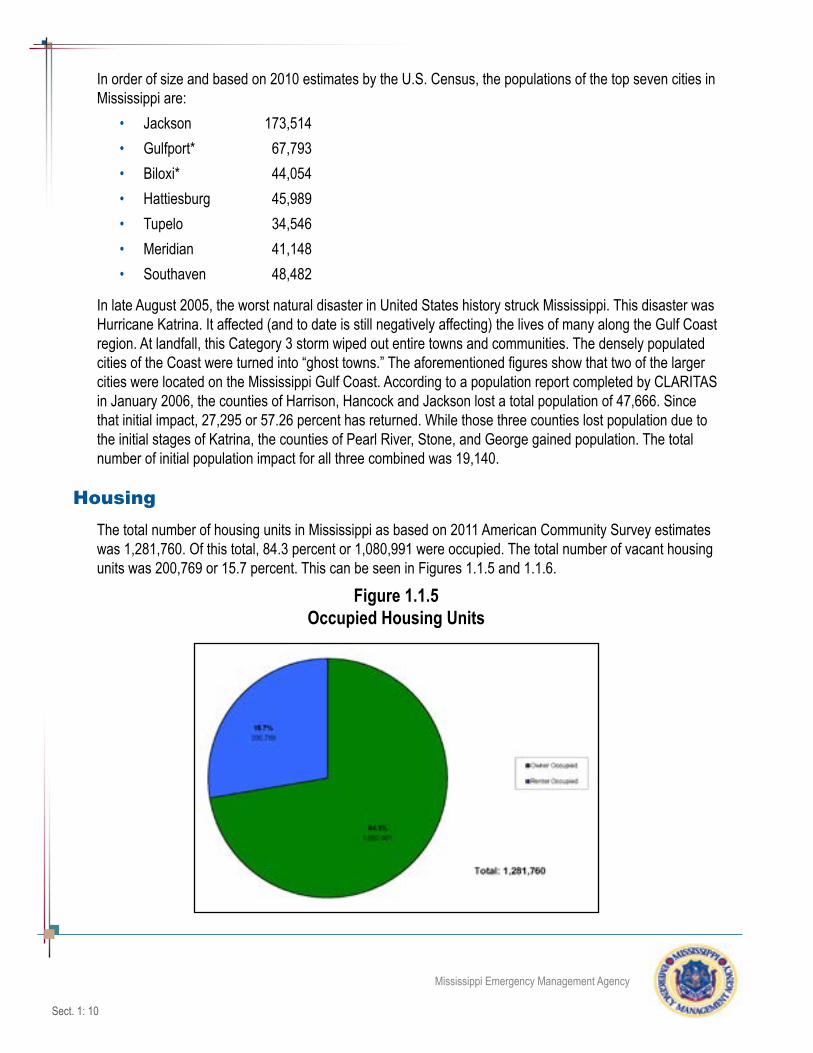
HousingThe total number of housing units in Mississippi as based on 2011 American Community Survey estimates was 1,281,760. Of this total, 84.3 percent or 1,080,991 were occupied. The total number of vacant housing units was 200,769 or 15.7 percent. This can be seen in Figures 1.1.5 and 1.1.6.
Figure 1.1.5Occupied Housing Units

Sect. 1: 11
Mississippi Emergency Management Agency
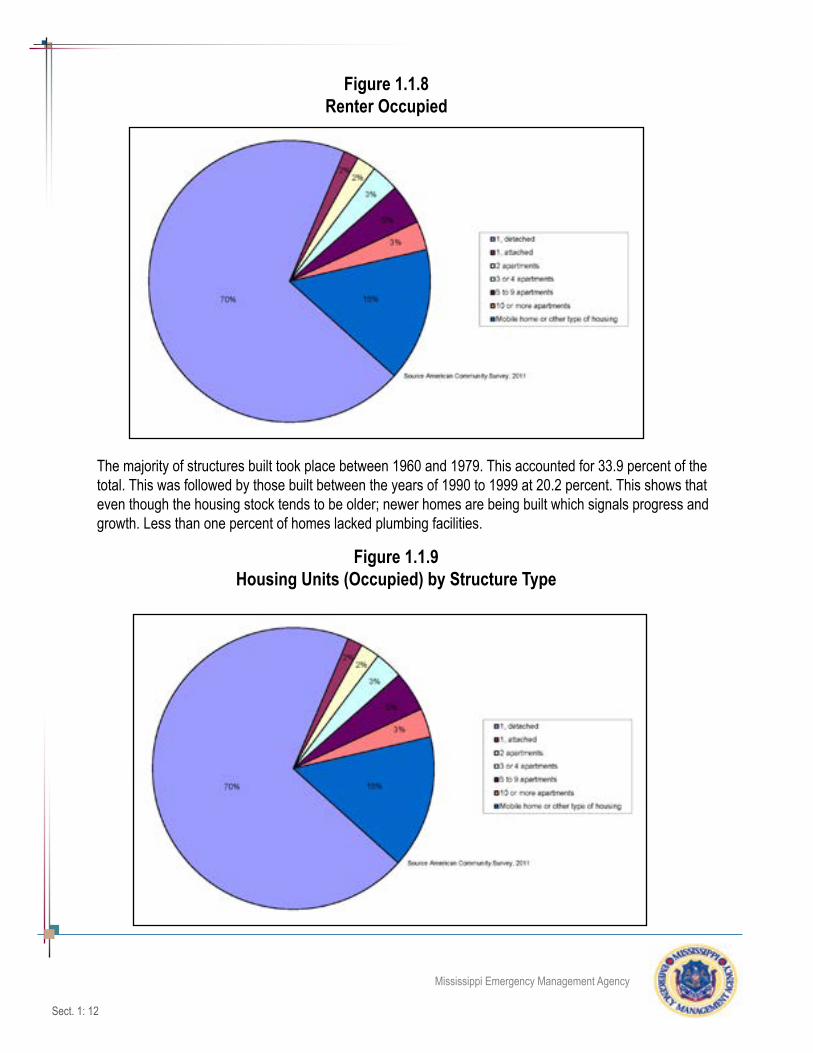
According to the 2010 American Community Survey, the total number of occupied housing increased from 1,084,034 to 1,274,719. Of this total, 69.7 percent was classified as one unit detached while the second most common type was mobile home/other housing at 15.3 percent. It can be deduced from these numbers that most Mississippians live in single-family housing or in mobile home/other forms of housing. However, 3.3 percent live in those structures that are classified as having 10 or more apartments.
Figure 1.1.7Housing Units (Occupied) by Year Built Type
Figure 1.1.6Vacant Housing by Type
Sect. 1: 12
Mississippi Emergency Management Agency
The majority of structures built took place between 1960 and 1979. This accounted for 33.9 percent of the total. This was followed by those built between the years of 1990 to 1999 at 20.2 percent. This shows that even though the housing stock tends to be older; newer homes are being built which signals progress and growth. Less than one percent of homes lacked plumbing facilities.
Figure 1.1.9Housing Units (Occupied) by Structure Type
Figure 1.1.8Renter Occupied

Sect. 1: 13
Mississippi Emergency Management Agency
EconomyThe State of Mississippi is home to many different industries. The industries range from agricultural based in the Delta to casino management on the Gulf Coast. The following is a list of the leading industries in the state:
Table 1.1.2Industry Type % Industry Type %
Accommodation and food services 6.5 Manufacturing 14.0Agriculture, forestry fishing and hunting 2.0 Other services (except public
administration)4.8
Arts, entertainment and recreation 2.7 Professional, scientific and technical services
3.5
Construction 8.2 Public administration 5.2Educational services 9.7 Retail trade 12.0Finance, insurance, real estate and rental and leasing
4.9 Transportation and warehousing and utilities
5.6
Health care and social assistance 13.0 Waste Management Services 2.8
Information 1.4 Wholesale Trade 3.1Management of companies and enterprises
0.5
Source: Mississippi Development Authority. http://www.mississippi.org 2007
Table 1.1.2 above indicates that 14 percent of Mississippi’s employment is through the manufacturing in-dustry. Mississippi has large manufacturing plants such as Nissan North America, Northrop Grumman Ship Systems, Howard Industries and Cooper Tire and Rubber. These companies are also the leading employ-ers in the state. Northrop Grumman has the largest number of employees at 11,300. It is followed closely by Nissan North America in Canton, MS which employs 4,100.
Toyota Motor Manufacturing, Mississippi, Inc. copleted its new facility in Blue Springs, MS (located in the northeast section of the state). Production at the $1.3 billion plant began in 2010 with 2,000 team members that produces the Toyota Highlander SUV and the Toyota Corolla; annual vehicle capacity will be 150,000 units.
Companies do not choose to locate in areas lacking skilled workforce. Mississippi offers industries a population of workers willing to be trained through various programs. According to the State Department of Education, the state of Mississippi in 2010 had a total of 24,739 high school graduates. In addition to that total, there were 25,179 graduates from both four year and community colleges. These students are equipped to meet the needs of manufacturing companies through adequate public education at the high school and college level.

Sect. 1: 14
Mississippi Emergency Management Agency
SummaryThe State of Mississippi is divided into many different regions, as determined by climate and physiography. These regions face different threat levels of hazards related to these criteria. The topography ranges from the low-lying areas of the Mississippi Delta to the coastline of the Mississippi Gulf Coast. The Gulf Coast (Coastal Zone) is threatened annually by hurricanes. One of the worst disasters in U.S. history occurred along the State’s coastline in August 2005: Hurricane Katrina, which destroyed homes as well as entire communities. Many areas of the Delta lie near the Mississippi River, which creates ideal conditions for flooding after large amounts of rain. The state’s climate is characterized by long, hot summers and tem-perate winters. While the amount of rainfall is typically evenly distributed, the long hot, summers have led to the occurrence of droughts in the past while during the winter season, ice storms have occurred in the northeast region of the state.
The threat of any major hazard could greatly affect many of the state’s industries. Among these are, but not limited to: tourism (both gaming and culturally based), transportation (state’s ports contribute $1.4 billion annually to economy) and manufacturing (14% of state’s industries). In addition, the state’s recreation in-dustry would suffer due to a major hazard. There are over 20 state parks in the state and almost $1.1 billion dollars are contributed to the economy by these type activities. In the aftermath of Katrina, the tourism and transportation industries were greatly affected by road and bridge closures, extensive damage to casinos, the permanent closure of some state parks and other devastating impacts. The population of the state increased from 2,951,996 to 2,984,926. This marked an increase of 1.0 percent. As the population contin-ues to grow, the threat to loss of life and property damage rises as well. It is for this and the aforementioned reasons, that this plan takes into account the efforts of local government and addresses all hazard-related issues and their lasting impacts to lives and the landscape.

Sect. 1: 15
Mississippi Emergency Management Agency
1.2: Plan Adoption
44 CFR §201.4(c)(6): The State mitigation strategy shall include the following elements:
A Plan Adoption Process. The plan must be formally adopted by the State prior to submittal to FEMA for final review and approval.
The State of Mississippi Standard Mitigation Plan meets the requirements of Section 409 of the Robert T. Stafford Disaster Relief and Emergency Assistance Act of 1988 (commonly referred to as the Stafford Act - Public Law 93-288 as amended). Additionally, this plan meets the minimum planning requirements under 44 Code of Federal Regulations (CFR), Part 78 (Flood Mitigation Assistance).
It is intended that this plan also meet the requirements of the Disaster Mitigation Act of 2000 (DMA2K), Section 322. Section 322 of the Act requires that states, as a condition of receiving federal disaster re-covery funds, have a mitigation plan in place that describes the planning process for identifying hazards, risks and vulnerabilities; identifying and prioritizes mitigation actions; encouraging the development of local mitigation; and providing technical support for these efforts. In addition, the Act also requires local and tribal governments to have mitigation plans.
The development and implementation of this strategy is authorized and/or required by the following state statutes:
Mississippi Emergency Management Law, Mississippi Code of 1972, Title 33-15, as amended.
Executive Order(s) by the Governor
The final draft of the State of Mississippi Standard Mitigation Plan was submitted to the Governor’s Autho-rized Representative (GAR) for review and recommendation. From here it was sent to Governor Phil Bryant for adoption by the State of Mississippi under the executive powers of the Governor on August 8, 2013. The Promulgation Statement issued by Governor Bryant is presented on the subsequent page.

Sect. 1: 16
Mississippi Emergency Management Agency
Sect. 1: 17
Mississippi Emergency Management Agency
1.3: Compliance with Federal Laws and Regulations
44 CFR 201.4(c)(7): The State mitigation strategy shall include the following elements:
Assurances. The plan must include assurances that the State will comply with all applicable Federal statutes and regulations in effect with respect to the periods for which it receives grant funding, in compliance with CFR 13.11(c). The State will amend its plan whenever necessary to reflect changes in State or Federal laws and statutes as required in CFR 13.11(d).
44 CFRThrough the development and enforcement of this plan, the State of Mississippi will comply with all provi-sions in 44 Code of Federal Regulations:
I. Part 7, Nondiscrimination in Federally Assisted Programs.II. Part 9, Floodplain Management and Protection of Wetlands.III. Part 10, Environmental Considerations.IV. Part 13, Uniform Administrative Requirements for Grants and Cooperative Agreements to States
and Local Governments.V. Part 14, Administration of Grants: Audits of State and local governments.VI. Part 17, Government-Wide Debarment and Suspension and Government-Wide Requirements of
Drug-Free Workplace.VII. Part 18, New restrictions on lobbying.VIII. Part 201, Mitigation PlanningIX. Part 206, Federal Disaster Assistance.X. Subchapter B - Insurance and Mitigation.XI. Subchapter D - Disaster Assistance.XII. Subchapter F - Preparedness.
Additionally, the laws listed below are provided as documentation that the State or any subsequent sub-grantee (recipients) that receive federal grant funds will comply with all applicable State and Federal statutes and regulations. The State will amend the plan whenever necessary to reflect changes in federal statutes and regulations or material changes in state law, organization, policy, or state agency operations.
The following provisions apply to the award of assistance:
Federal LawI. Public Law 93-288, Disaster Relief Act of 1974, as amended by the Robert T. Stafford Disaster
Relief and Emergency Assistance At of 1988, Public Law 100-707 and further amended by Disas-ter Mitigation Act of 2000, Public Law 106-390.
II. Public Law 93-234, Flood Disaster Protection Act of 1973.

Sect. 1: 18
Mississippi Emergency Management Agency
III. Public Law 103-181, Hazard Mitigation and Relocation Assistance Act of 1993.IV. Public Law 98-502, Single Audit Act.V. Public Law 81-920, Federal Civil Defense Act.VI. Title 31 CFR Part 205.6, Funding Techniques.
Executive OrdersI. Executive Order 11988, Floodplain Management.II. Executive Order 11990, Protection of Wetlands.III. Executive Order 12612, Federalism.IV. Executive Order 12699, Seismic Safety.V. Executive Order 12898, Federal Actions to Address Environmental Justice in Minority Popula-
tions and Low-Income Populations.
Office of Management and BudgetI. OMB Circular A-21, Cost Principles for Educational Institutions.II. OMB Circular A-87, Cost Principles for State and Local Governments.III. OMB Circular A-94, Guidelines and Discount Rates for Benefit-Cost Analysis of Federal Pro-
grams.IV. OMB Circular A-102, Uniform Administrative Requirements for Grants and Cooperative Agree-
ments with State and Local Governments.V. OMB Circular A-110, Uniform Administrative Requirements for Grants and Agreements with
Institutions of Higher Education, Hospitals, and other Non-Profit Organizations.VI. OMB Circular A-122, Cost Principles for Non-Profit Organizations.VII. OMB Circular A-133, Audits of Local Governments, and Non-Profit Organizations.
State AuthoritiesI. Mississippi Emergency Management Law, Mississippi Code of 1972, Title 33-15, as amended.II. Other Applicable Mississippi laws, refer to “Compendium of Legislation” Mississippi Administrative
Plan, Volume I to Mississippi Emergency Management Plan.III. Executive Order(s) of the Governor:
◊ E. O. 252, August 11, 1977; Relocation of State Government.
◊ E. O. 573, March 3, 1987; Mississippi Emergency Response Commission.
◊ E. O. 653, 1990, et. Seq.; Emergency Management Responsibilities.
◊ E. O. 985, 2007; Mississippi State Hazard Mitigation Council.

Mississippi Emergency Management Agency
Sect. 2 : 19
Mississippi Emergency Management Agency
2.0 The Planning ProcessSection 201.4 (a) of the CFR reads as follows, “The mitigation plan is the demonstration of the State’s commitment to reduce risks from natural hazards and serves as a guide for State decision makers as they commit resources to reducing the effect of natural hazards.” Therefore, an effective planning process is the key to a strong mitigation strategy plan.
Mitigation planning can:
• help communities become more sustainable and disaster resistant,
• be incorporated as an integral component of daily government business,
• help focus efforts on particular hazards by determining and setting priorities for mitigation planning, and
• save money by providing a forum for engaging in partnerships.
The Mississippi Emergency Management Agency has taken great care in developing and executing a miti-gation plan that fully serves the citizens of the State of Mississippi. The following is documentation of the State’s effort to save lives and property.
Summary of Changes - Documentation of the Planning Process
This entire section has been reviewed and updated, all tables and figures have been updated to reflect changes since the plan was updated in 2010.

Mississippi Emergency Management Agency
Sect. 2 : 20
Mississippi Emergency Management Agency
2.1: Documentation of the Planning Process
44 CFR 201.4(c): Plan Content. To be effective, the plan must include the following ele-ments:
Description of the planning process used to develop the plan, including how it was pre-pared, who was involved in the process, and how other agencies participated.
Mitigation Planning is...Mitigation is any sustained action taken to reduce or eliminate long-term risk to life and property from a hazard event. Mitigation planning is a process for states and communities to identify policies, activities, and tools for implementing mitigation actions. The Mississippi Emergecy Management Agency decided to continue with the following four basic steps or phases in updating its plan:
• organization of resources;
• assessment of risks;
• development of a mitigation plan; and
• implementation of the plan and monitoring progress.
Phase I: Organization of Resources
In 2007, the State of Mississippi made a firm commitment to identify and organize its resources through the Mississippi Hazard Mitigation Council. Established by Governor Haley Barbour under Executive Order 985, the Council has played a very major part in steering the State’s mitigation strat-egy. The Council has served the people of Mississippi by providing a platform from which an inte-grated statewide plan could be developed to complete mitigation goals. The State continues to use this organization in the 2013 Hazard Mitigation Plan Update. The Council has in fact identified 2 more members since its conception. The members of the Council are further discussed in a later section of this document.
The Council is comprised of citizens who were jointly selected by MEMA’s executive staff and Governor Barbour based upon the skills, knowledge, and abilities necessary for
◊ forging partnerships from among a broad range of groups,
◊ integrating existing plans and planning efforts,
◊ identifying and articulating needs to state and federal officials, and
◊ providing continuity in statewide planning that seeks to achieve a common goal.
Phase II: Assessment of Risks
The State of Mississippi is diverse by nature and climate. From severe weather to wildfires and flooding to unstable dams, Mississippians have faced their share of disasters throughout the years. The plan developers began an assessment of risks by researching historical records and learning from past haz-

Mississippi Emergency Management Agency
Sect. 2 : 21
Mississippi Emergency Management Agency
ardous events. This history has been used to assist in the assessing of today’s risks by using a Hazard Ranking Worksheet. From this process, the past documented events were profiled and vulnerabilities identified. The plan developers then projected estimated potential future losses.
The Hazard Ranking Worksheet operates like this: The probability of each hazard is determined by assigning a level, from one to four, based on the likelihood of occurrence from historical data. The total impact value includes the affected area, primary impact and secondary impact levels of each hazard. These levels are then multiplied by an importance factor to obtain a score for each category. The prob-ability score is multiplied by the sum of the three impact categories to determine the total score for the hazard. Based on this total score, the hazards were then separated into four categories based on the hazard level they pose to the communities. Those four categories are:
◊ unlikely,
◊ possible,
◊ critical and
◊ highly likely.
This backbone of information forms the bases for MEMA’s mitigation plan and helps to shape it in an economically feasible and environmentally sound manner.
Phase III: Development of a Mitigation Plan
Each phase of MEMA’s planning process in developing Mississippi’s Mitigation Plan is documented within this report. Statewide hazard mitigation goals and objectives have been developed by the Haz-ard Mitigation Council and presented to stakeholders, partnering agencies, and the general public for review and comment. Details of this process are included within the next section.
In addition, state capabilities have been identified and assessments have been made concerning current effectiveness. Alterations to existing plans based on the state’s capabilities have been identi-fied and analyzed and, if found deserving, have been included within the 2013 Hazard Mitigation Plan update. Finally, funding sources have been considered and where applicable, factored into the final document’s operational procedures.
Phase IV: Implementation of the Plan and Monitoring Progress
Upon adoption of this plan, Mississippi’s mitigation actions statewide will take on a more cohesive, stronger, and more easily recognized existence. Existing local and regional hazard mitigation plans will continue to move closer to statewide goals and objectives due to increased communications and understanding. Built in milestones for reviewing and tweaking the plan will help to ensure that stake-holders and the general public are afforded the opportunity for input. As the plan continually evolves, it will be altered to meet our ever changing environment. And while this plan is a good start, it is in fact the beginning of a more unified and thus more effective and economically feasible strategy for saving lives and reducing future losses.
In an effort to organize changes made from the 2010 to 2013 plan, a Table of Contents “Roadmap” for the 2010 to 2013 Update is provided in Appendix 7.2-A.

Mississippi Emergency Management Agency
Sect. 2 : 22
Mississippi Emergency Management Agency
2.2: Coordination with Federal and State Agencies and Interested Groups in the Planning Process
44 CFR 201.4(b): Planning Process. An effective planning process is essential in developing and maintaining a good plan. The mitigation planning process should include coordination with other state agencies, appropriate federal agencies, and interested groups.
The State Hazard Mitigation Plan (the Plan) was prepared by the Mississippi Emergency Management Agency’s (MEMA) Bureau of Mitigation with assistance from numerous state agencies, organizations, and concerned citizens.
Early in the update process, multi-level involvement was achieved by engaging mitigation specialists from all areas of the state. MEMA chose this approach in order to achieve the most effective mitigation plan pos-sible - one that works in tandem with municipal, local, state, and federal entities.
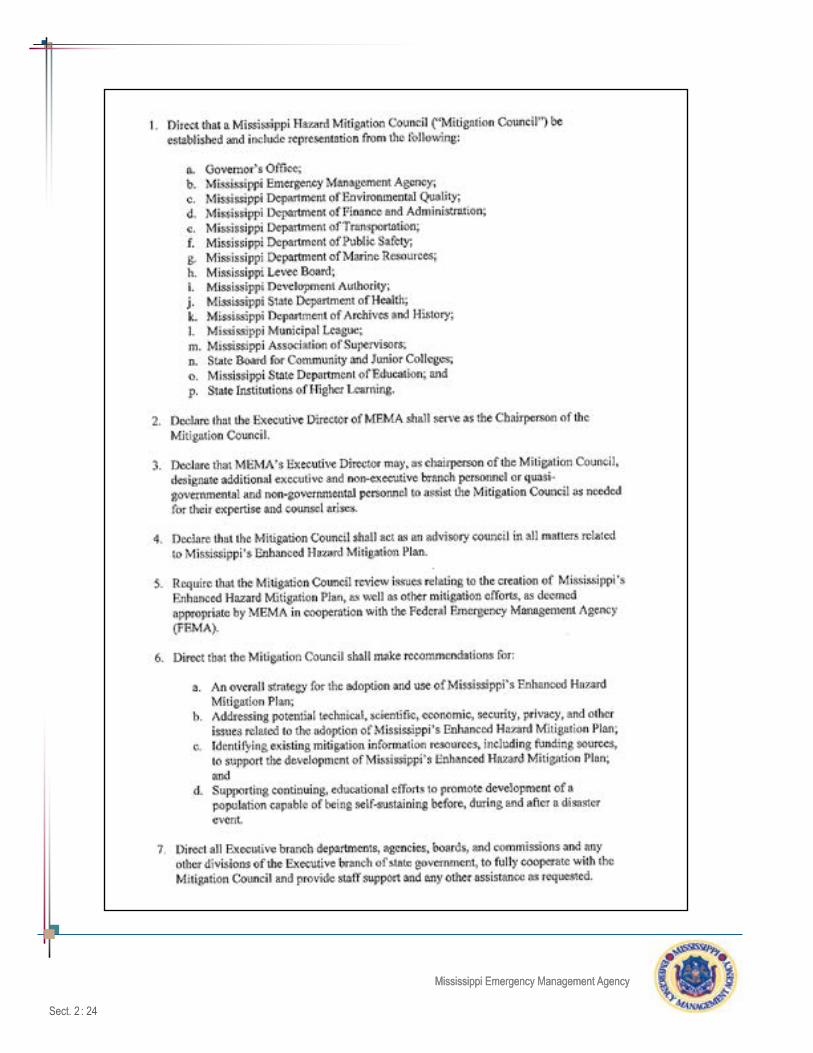
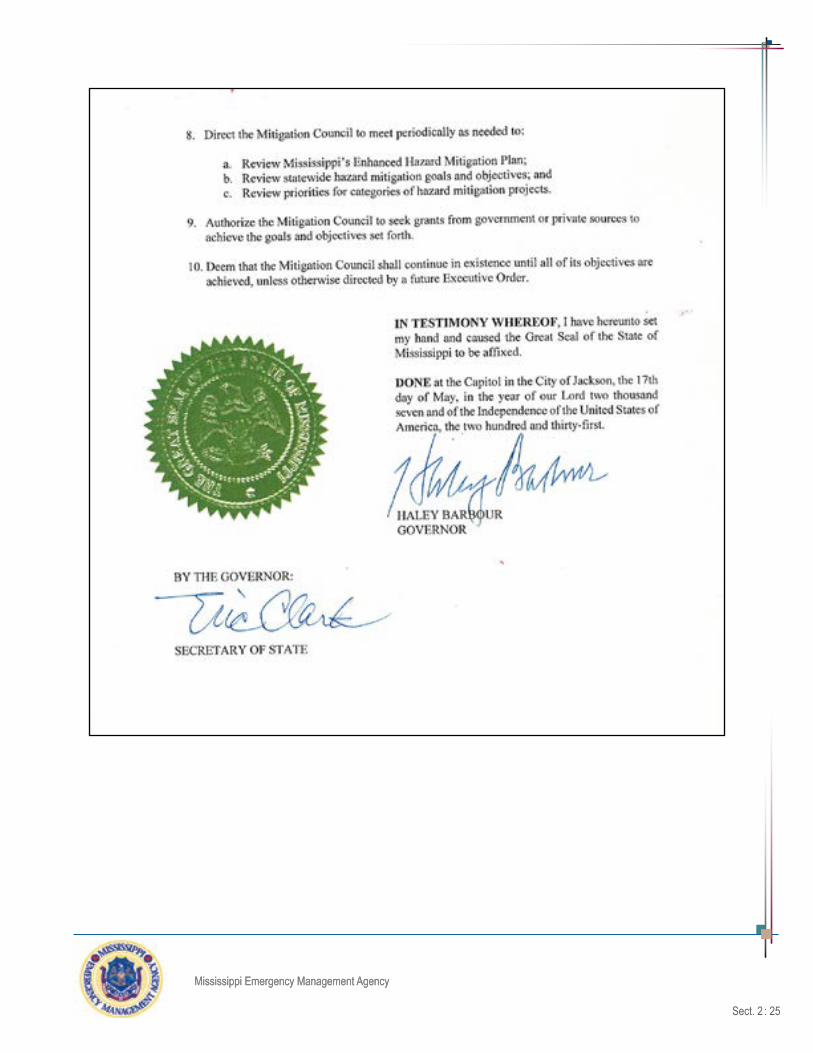
Hazard Mitigation CouncilGovernor Haley Barbour, being highly supportive of the State’s mtitigation strategies, executed Executive Order # 985, creating the Mississippi Hazard Mitigation Council. Mississippi’s Hazard Mitigation Plan is a living dorcument, and has been reviewed and updated in quarterly meetings held by the Hazard Mitigation Council since January 2007.
The Council is effective in guiding mitigation goals and objectives for the State of Mississippi. Appointees to the council were carefully selected in order to provide representation from key state and local agencies capable of contributing resources, implementing mitigation actions, and integrating mitigation planning efforts. It is anticipated that the Hazard Mitigation Council will remain intact and continue to strengthen com-munications and working relationships by coordinating mitigation efforts between all levels of governmental agencies, private non-profit organizations, and the private sector for years to come. This in turn bolsters de-velopment, supports on-going maintenance, and improves planning efforts. It is expected that the Council will remain intact indefinitely and that it will continue to assist in
• creating a vision for addressing future needs,• accurately and quickly responding to economic and environmental changes,• regularly evaluating the success of the state hazard mitigation plan, and • providing necessary resources whenever possible for updating or changing goals and addressing
new laws and regulations.
MEMA also established a well-rounded team of plan developers for the 2013 plan. Following the same format of the 2010 team, plan developers included state employees, a consulting agency, and a state university to serve as plan developers for the 2013 Hazard Mitigation Plan. Through a series of workshops and meetings, many public entities have been involved in the planning process, and the mitigation actions of many stakeholders, emergency response organizations, and agencies have also been included in this plan. The State of Mississippi is therefore transitioning from many individualzed mitigation strategies to a statewide planning effort.
Governor Barbour’s executive order is presented on the next page.

Mississippi Emergency Management Agency
Sect. 2 : 23
Mississippi Emergency Management Agency
Mississippi Emergency Management Agency
Sect. 2 : 24
Mississippi Emergency Management Agency
Mississippi Emergency Management Agency
Sect. 2 : 25
Mississippi Emergency Management Agency

Mississippi Emergency Management Agency
Sect. 2 : 26
Mississippi Emergency Management Agency
Members of the Hazard Mitigation Council and the agencies and/or associations they represent are indi-cated in table 2.2.1.
Table 2.2.1Mississippi’s Hazard Mitigation Council
Agency Representative
Office of the Governor GovernorMississippi Emergency Management Agency (MEMA) Executive DirectorMississippi Department of Environmental Quality (MDEQ) Executive DirectorMississippi Department of Finance and Administration (DFA) Executive DirectorMississippi Department of Transportation (MDOT) Executive DirectorMississippi Department of Public Safety CommissionerMississippi Department of Marine Resources (DMR) Executive DirectorMississippi Levee Board Executive DirectorMississippi Development Authority (MDA) Executive DirectorMississippi State Department of Health State Health OfficerMississippi Department of Archives and History Executive DirectorState Board for Community and Junior Colleges Executive DirectorMississippi State Department of Education Executive DirectorState Institutions of Higher Learning (IHL) Executive DirectorMississippi Municipal League (MML) Executive Director
Mississippi Association of Supervisors (MAS) Executive Director
Mississippi Department of Human Services Executive DirectorMississippi Forestry Commission Executive Director
To enhance the expertise and diversity of the Council, Governor Barbour added the Mississiippi Depart-ment of Human Services and the Mississippi Forestry Commission in 2008.
Team ApproachAlongside the Council, the planning team for the Mississippi 2013 Update consisted of Neel -Schaffer, Delta State University, MEMA Executive staff, mitigation planners, and the MS Hazard Mitigation Council.
In this 2013 State Plan update, mitigation planners compiled the 104 FEMA approved local plans that cover the entire State of Mississippi, up from 92 plans in the previous update and posted them on the contractor’s site. Results from 104 local mitigation plans (12 new mitigation plans, in addition to 92 plans included in the 2010 plan) were compiled to reflect natural hazard occurrences and risks.

Mississippi Emergency Management Agency
Sect. 2 : 27
Mississippi Emergency Management Agency
On January 23, 2013, the Hazard Mitigation Council convened at 9 a.m. to again discuss the process of updating the State plan. First, the Council defined the roles of MEMA, Neel-Schafer, Delta State and the Council itself. Next, the mission statement, goals, objectives, and state capabilitites were presented by Billy Patrick, Director for Mitigation Plans. The Council decided that these elements properly reflected the planning needs for the State as a whole, and voted to continue them for the 2013 Mitigation Plan Update.
Council members meet to review and discuss its strategy for developing the 2013 Mississippi Hazard Mitigation Plan Update.
Additionally, completed reports of any changes in state capabilities were reported . These reports are included in Section 4.2 of this document. From 2007 until now, members of the Council have continually updated profile and project information for their agencies over the 3 year period between plan updates, using a project profile report.
Rebecca Boone, Neel-Schaffer, clarified the definitions for critical facilities and infrastructure for the state plan so that all agencies would be on the same page. Rebecca then covered the compilation of data from all 104 local hazard mitigation plans. Next Rebecca reviewed the hazards from the 2010 plan to make sure they are still relevent.The Council was then asked to identify hazards for the 2013 State Hazard Mitigation Plan.
The State is adding a man-made/health related hazards to the State Hazard Mitigation Plan.The State is moving toward having an all hazards plan. The man-made hazards will include terrorism, chemical, hazardous spills, transportation, and infrastructure.
During this meeting, the council deliberated on two methods to evaluate the Hazard Identification and Risk Assessment. The first method was used in the 2010 update, used values to calculate probability. The second method, which uses a priority ranking methodology. The council decided to table the matter of the two methods, and vote during a subsequent meeting.

Mississippi Emergency Management Agency
Sect. 2 : 28
Mississippi Emergency Management Agency
The Hazard Mitigation Council and plan developers convened for a second meeting on February 13, 2013. A recap of the previous meeting was presented by Rebecca Boone, Neel-Schafer. The Council determined that using the priority ranking methodology to rank the state hazards was the best method. Also, we are encouraging local governments to use the same methodology in updating their local plans. Therefore the methodology used to evaluate hazards will be the same at local and state levels. Using historical data gathered from the USGS, local mitigation plans, and the risk assessment, a quorum of the Council evalu-ated significant natural hazards. Hazards were ranked based on the following factors: the probability of occurrence, the area affected by the hazard, primary impact or damage, and secondary impact to the com-munity at large.
Talbot Brooks, Delta State University, presented data for all roadways, gas transmission pipelines, electric transit pipelines, named waterways of the state and started looking for places where those things inter-sected with 250 meters of each other. Brooks presented the council with a worst case scenario of a major transportation incident involving truck lines, pipelines, and railways with oil and gas pipelines included. Brooks explained the serious devastation of this scenario and the devastation it could bring to the state of Mississippi. The purpose of the presentation is awareness and being prepared for any worst case event and identify the areas that are most vulnerable.
Plan developers worked diligently as a team throughout the Hazard Mitigation Plan update process. The group consisted of members of MEMA’s executive
staff, the MEMA Hazard Mitigation Bureau, Neel-Schaffer Consulting Firm and Delta State University.

Mississippi Emergency Management Agency
Sect. 2 : 29
Mississippi Emergency Management Agency
The Mississippi Hazard Mitigation Council members met on December 13, 2011.
The Hazard Mitigation Council and plan developers convened for a third meeting on July 18, 2013. The Council Members were given copies of the Table of Mitigation Actions and the Table of Funding Sources for review and update. The State’s Mitigation Actions and Strategies were voted on and approved by the Hazard Mitigation Council.
Rebecca Boone, Neel Shaffer, did a final walk through of each of the hazards identified in the Hazard Identification and Risk Assessment to identify all potential threats and the needs of the agencies. Rebecca presented the Hazard Ranking Summary including vulnerability, future occurrence, risk total, and risk level. Talbot Brooks, Delta State University, discussed data limitations with the State Asset Inventory. He also stated that not all events are reported to NCDC/National Weather Service, and damages reported are only estimates. HAZUS is still running on 2000 census data and cannot easily integrate new LIDAR elevation data.
During plan development, experts from various private, state and local entities statewide, as well as representatives from the Federal Emergency Management Agency (FEMA), were given the opportunity to participate in the planning process for the purpose of increasing integration with ongoing state hazard mitigation planning efforts.
MEMA solicited participation from industry associations and volunteer agencies, as well as mitigation plan-ners and specialists representing all levels of governments and numerous specialized areas. Table 2.3.2.1 lists these organization representatives. A status report of 2010 mitigation actions and local mitigation ac-tion analysis was provided along with educational materials. The purpose was to stimulate open discussion for updating existing mitigation actions, identifying lead agencies that might take ownership of particular actions, prioritizing the actions, and then developing a draft strategy for maintaining identified actions.

Mississippi Emergency Management Agency
Sect. 2 : 30
Mississippi Emergency Management Agency
Communication – the Key to a Cohesive PlanAn intranet site was created on MEMA’s mitigation management site, MitigationMS.org for managing and updating information concerning mitigation planning activities. Participants (including the Hazard Mitigation Council, individuals with technical expertise, and the plan developers)that have mitigation projects can ac-cess and update their project profiles on this site. This has been a tremendous asset to the project manag-ers and has continued throughout the 2013 Mississippi Hazard Mitigation Plan Update.
With the quarterly meetings and a Summary of the Hazard Mitigation Council Meetings going out to all members, Council Members, Project Managers and stakeholders were kept informed on State Plan Devel-opments.

Mississippi Emergency Management Agency
Sect. 2 : 31
Mississippi Emergency Management Agency
Public Participation Outreach Efforts
Associations
Plan developers involved various hazard mitigation stakeholders in the planning process by attending various Mississippi based conferences and providing information and accepting comments for use in the development of the 2013 Hazard Mitigation Plan. Conferences attended and objectives of each are listed in Table 2.2.2.
Table 2.2.2Public Outreach
Conference/Activity Date/Location 2013 Purpose
MS Preparedness Summit, “Partners in Preparedness”
April 17-19Biloxi, MS
Present purpose and need for updating MS’s Haz-ard Mitigation Plan and invite participation through MEMA booth
MS Civil Defense Emergency Manage-ment Assoc.
April 17-19Biloxi, MS
Present purpose and need for updating MS’s Haz-ard Mitigation Plan and invite participation through MEMA booth
Association of Flood-plain Managers of MS
April 29-May 1 Natchez, MS
Present purpose and need for updating MS’s Haz-ard Mitigation Plan and invite participation through MEMA booth
Building Association of MS
June 10-14 Gulfport, MS
Present purpose and need for updating MS’s Haz-ard Mitigation Plan and invite participation through MEMA booth
MS Association of Supervisors
June 14 - PresentJackson, MS
MEMA’s Mitigation Survey is placed on the MAS website for outreach and feedback.
Mississippi Municipal League
June 14 – PresentJackson, MS
MEMA’s Mitigation Survey is placed on the MML website for outreach and feedback.
Mississippi Emer-gency Management Agency
July 29 – PresentPearl, MS
Hazard Mitigation Plan placed on the MEMA Web-site for reveiw and comment.

Mississippi Emergency Management Agency
Sect. 2 : 32
Mississippi Emergency Management Agency
A survey designed to provide plan developers with information concerning hazard mitigation issues from the local perspective was made available at each conference. A copy of the survey is located in Appendix 7.2-C and the survey results are tabulated in section 4.3 of this report.
Another measurable result of open communication and outreach efforts with the above mentioned as-sociations was realization of written support of MEMA’s efforts to develop a comprehensive statewide plan. The Public Works Association - Mississippi Chapter, the Mississippi Municipal League, and the Association of Floodplain Managers of Mississippi all adopted resolutions supporting the planning ef-fort.
Business, Non-Profit and Professional Organizations
As a result of the successes noted from reaching out to governmental associations, plan developers used the same strategy in 2013 to engage businesses, as well as non-profit and professional associa-tions. Emails explaining the purpose and need of the mitigation plan and inviting participation in the process were sent to every business association listed for the State of Mississippi, as well as the 2013 president of Mississippi Voluntary Organizations Active in Disasters (VOAD), who in turn forwarded it statewide to his constituency.
The email list was also used to provide information concerning public meeting dates, times, and loca-tion. By capitalizing on the name recognition and trust generated by business leaders who partnered with MEMA, the agency’s message was received much more readily by the business community. Thus readership and response to emailed information tended to be higher and educational benefits, as well as increased participation in plan development, were higher than participation realized during the 2004 planning process. Over 100 individuals within the business community participated by submitting com-ments to MEMA concerning the goals of the statewide comprehensive mitigation plan.
In addition to an increase in participation from the business community, MEMA also saw participation from the VOAD leaders of the state. Members of the Red Cross, the United Way and the Salvation Army attended the public meeting, then reviewed and commented on the proposed mitigation plan.
Local, State, and Federal Agencies Engaged
While many of Mississippi’s state agencies were invited to join the Mississippi Hazard Mitigation Council, others that typically had never been personally invited to develop mitigation planning strate-gies were sent letters from MEMA Executive Director Robert Latham urging participation. For example, agencies such as the Mississippi Automated Resource Information System and the Board of Animal Health were two of the agencies contacted. It is hoped that this contact will strengthen understanding and future partnership opportunities.
In addition to open invitations to participate in the planning process, plan developers met with the fol-lowing statewide agencies and or organizations to review their mitigation plans and coordinate state-wide activities. These outreach efforts included meetings with the following:
◊ Mississippi’s Planning and Development Districts
◊ The Mississippi Department of Environmental Quality
Mississippi Emergency Management Agency
Sect. 2 : 33
Mississippi Emergency Management Agency
◊ The United States Army Corps of Engineers and
◊ The Center for Community Earthquake Preparedness
◊ United States Geological Survey
◊ National Weather Service
Continuing the practice began in 2007, plan developers for the 2013 update sought to work more closely with federal agencies in the planning process. Input and guidance was particularly sought from the Federal Emergency Management Agency (FEMA) – Region IV employees. FEMA responded by directing plan developers to various written materials available through the internet and provided input through one-on-one conversations, e-mails and letters. A complete list of federal agencies that plan developers consulted is found in section 2.3, in Table 2.3.2.1.
Meeting with the Mississippi Band of Choctaw Indians
MEMA Planning Staff have met with representatives of the Mississippi Band of Choctaw Indians (the Tribe) in Choctaw, Miss., and in Pearl Ms on several occassions to discuss mitigation projects. The Tribe now has its own FEMA approved hazard mitigation plan.
Currently, the Tribe has a statutory framework (known as Ordinance 50) that
◊ establishes the emergency management team of the Directors of the Fire Department, the Police Department, the Health Department, and Facilities;
◊ provides equipment for facility buildings in each community designated as emergency shelters (includes generators);
◊ significantly improves communications; and
◊ provides for a draft risk analysis.
Tribal mitigation activities resulting from review and evaluation of events during and after Hurricane Katrina are either in the works or completed. They include:
◊ increased training opportunities;
◊ increased purchases of emergency related equipment;
◊ improved ‘on the ground’ communications for effective contact of first responders;
◊ recent acquisition of communication equipment that has been installed in all faculty build-ings (radios); and
◊ evaluation of policies for addressing staff burnout, which will likely be implemented.
A personal invitation was extended to the Tribe to attend the Hazard Mitigation Planning public meeting on August 1, 2013 in Jackson, and printed materials indicating the time, location, purpose, and need for the meetings were provided.

Mississippi Emergency Management Agency
Sect. 2 : 34
Mississippi Emergency Management Agency
Public Meetings
The general public (with emphasis placed on notification by e-mail of business and industry association representatives) was invited to partici-pate in two open forum public meetings. MEMA’s first meeting was held Thursday, August 1, 2013 from 5 p.m. until 7 p.m. at the Hinds County Emergency Operations Center, which is centrally located in Jackson, Miss.
The first meeting was designed to be both educational and a means by which comments on the work in progress could be received. Over light refreshments, participants were invited to view work that had been completed to date. MEMA representatives were available to provide as-sistance. Through face-to-face communication, several misconceptions were corrected as detailed explanations of how mitigation can save lives and reduce future losses were openly discussed. Although attendance at this meeting was very low with only eight individuals actually attending, participants were highly committed to the process and worked with plan developers to discussed mitigation issues in depth.In addition to feedback received during the meeting, over 100 individuals participated in the public involvement process via the internet. Information provided at the public meeting was sent electroni-cally for further dissemination statewide to the Mississippi Manufacturers Association, the Mississippi Department of Environmental Quality, the Mississippi Department of Transportation, and the Mississippi Association of Supervisors, thus providing easy access for large segments of the population. Individu-als that responded proved to be very interested and expressed a desire to participate in the current process as well as future planning efforts.
Other than educational information about hazard mitigation planning, the mitigation strategy mission statement developed jointly by the Hazard Mitigation Council and specialists statewide was made available. The mission statement listed proposed goals and action steps for hazard mitigation and was available for review and comment. The public was invited to rank the proposed goals to provide sug-gestions for new or amended action steps. Information received from approximately 110 completed forms is tallied on the subsequent page.
The second public meeting, will be scheduled prior to plan adoption as per FEMA requirement. The meeting location has not been determined at this time. Participants will be given the opportunity to com-ment and give feedback on the plan. Visitors will be invited to make suggestions and write questions on provided comment sheets or directly on the pages of the draft plan. This type of public participation allowed visitors to physically take part in the development process.
For both meetings, information concerning the times, dates, and locations will be sent by e-mail and made available in Mississippi’s statewide newspaper - the Clarion Ledger, as well as the Sun Herald, and the Northeast Mississippi Business Journal and various state maintained web sites, e-newsletters, e-mails, meetings, and personal invitations. Sign-in sheets documenting the attendance of each meet-ing will be included in Appendix 7.2-F. Also included in the appendix will be a list of volunteer organiza-tions and individuals who participated in the 2013 plan update.
MEMA held the first of two open house public meetings in Jackson, Miss.
Attendees were invited to review and provide comments on the state’s draft
2013 Hazard Mitigation Plan.

Mississippi Emergency Management Agency
Sect. 2 : 35
Mississippi Emergency Management Agency

Mississippi Emergency Management Agency
Sect. 2 : 36
Mississippi Emergency Management Agency
2.3: Integration with Other Planning Efforts, Programs and Initiatives
44 CFR 201.4(b): The Plan must discuss how the planning process was integrated to the extent possible with other ongoing state planning efforts, as well as other FEMA mitigation programs and initiatives.
As jurisdictions have realized a limited amount of resources, integration of programs, goals, and resources have become ever more necessary. From the initial 2004 Hazard Mitigation Plan to the 2007 Mitigation Plan until now, integration of programs and resources have significantly increased among local, state, and federal entities in the State of Mississippi. In addition to oversight of Hazard Mitigation Assistance, flood-plain management, the Earthquake Program, and mitigation planning programs, MEMA follows and in-cludes Mississippi Statutes in the hazard risk plans of the state departments of Public Safety, Development Authority, Transportation, Insurance, Corrections, Environmental Quality, Health, Human Services, Wildlife, Fisheries and Parks, the Office of Administration, Education, and the Public Service Commission. MEMA accomplishes many mitigation projects through collaboration. The Mississippi Development Authority part-ners with MEMA in joint funding of flood acquisition and drainage projects, and in storm shelter/saferoom projects. The Office of Geology in the Department of Environmental Quality and MEMA also partner in the NFIP Map Modernization Program, while the Department of Transportation and MEMA partner in highway and bridge development to ensure the floodplain management component is addressed.
Multi-jurisdictional and Local Mitigation Plans comprise another part of the program. As such, the devel-opment process for the state plan takes into consideration the mitigation goals and objectives identified therein. MEMA routinely works with numerous state and federal agencies on various issues, to include partnering with the Mississippi Development Authority; the American Red Cross for emergency sheltering; Department of Environmental Quality, Dam Safety Division on issues of high hazard dams; Mississippi Department’s of Transportation and Public Safety on emergency evacuation issues; and the Mississippi Department of Homeland Security on all threats to the citizens of this state. MEMA extends an open-door policy to federal and state agencies, regional planning and development districts, and local governments to build stronger, more cohesive mitigation efforts whenever possible.
2.3.1 Integration of Local PlansMEMA is the primary state coordinating agency for all local emergency operation plans and hazard mitiga-tion plans. The Mitigation Bureau has the primary responsibility of working with regional and local govern-ments in developing, reviewing, and updating multi-jurisdictional and local hazard mitigation plans. The Preparedness Training and Exercise Bureau has the primary responsibility of working with local govern-ments in developing, reviewing, and updating local emergency operation plans.
As part of the state mitigation planning initiative, multi-jurisdictional and local mitigation plans are being developed in conjunction with counties and regions. These multi-jurisdictional plans address the mitigation issues and initiatives for unincorporated and incorporated jurisdictions. This helps ensure as many jurisdic-tions as possible remain involved in the mitigation planning process. The Local Hazard Mitigation Plan is normally a separate, stand-alone plan that represents a county or region. Any jurisdiction within a county may prepare a mitigation plan specific to that jurisdiction and separate from the county mitigation plan.
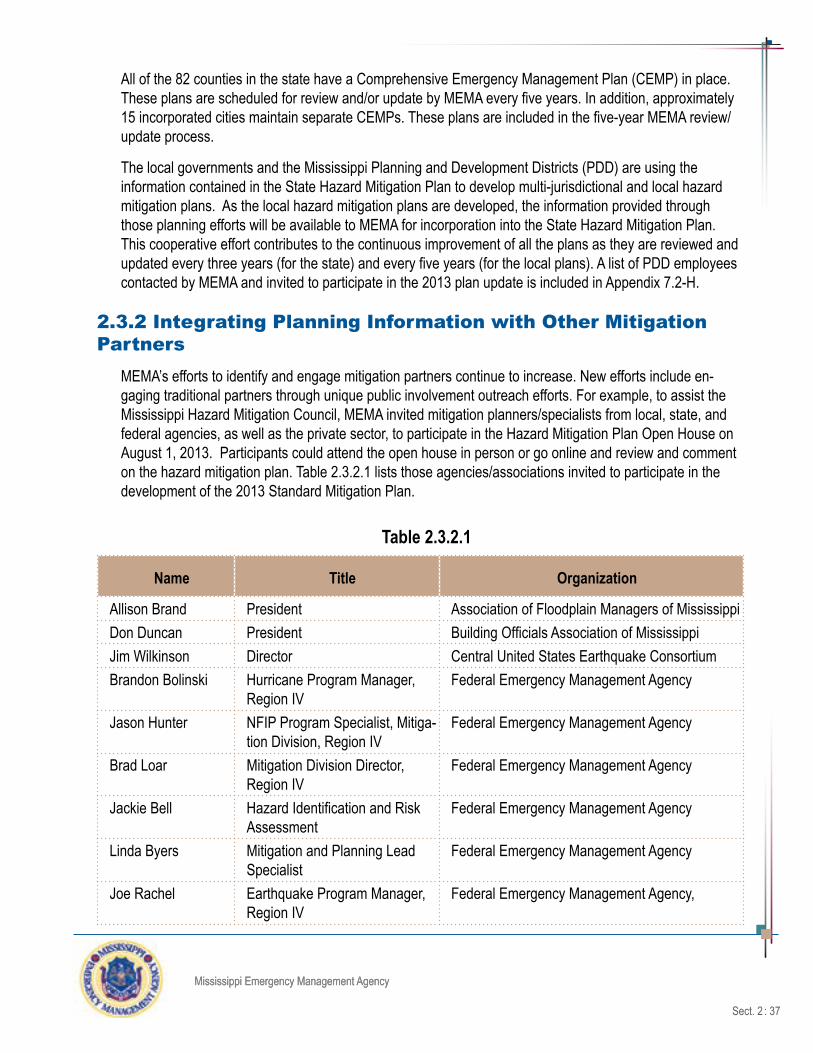
Mississippi Emergency Management Agency
Sect. 2 : 37
Mississippi Emergency Management Agency
All of the 82 counties in the state have a Comprehensive Emergency Management Plan (CEMP) in place. These plans are scheduled for review and/or update by MEMA every five years. In addition, approximately 15 incorporated cities maintain separate CEMPs. These plans are included in the five-year MEMA review/update process.
The local governments and the Mississippi Planning and Development Districts (PDD) are using the information contained in the State Hazard Mitigation Plan to develop multi-jurisdictional and local hazard mitigation plans. As the local hazard mitigation plans are developed, the information provided through those planning efforts will be available to MEMA for incorporation into the State Hazard Mitigation Plan. This cooperative effort contributes to the continuous improvement of all the plans as they are reviewed and updated every three years (for the state) and every five years (for the local plans). A list of PDD employees contacted by MEMA and invited to participate in the 2013 plan update is included in Appendix 7.2-H.
2.3.2 Integrating Planning Information with Other Mitigation Partners
MEMA’s efforts to identify and engage mitigation partners continue to increase. New efforts include en-gaging traditional partners through unique public involvement outreach efforts. For example, to assist the Mississippi Hazard Mitigation Council, MEMA invited mitigation planners/specialists from local, state, and federal agencies, as well as the private sector, to participate in the Hazard Mitigation Plan Open House on August 1, 2013. Participants could attend the open house in person or go online and review and comment on the hazard mitigation plan. Table 2.3.2.1 lists those agencies/associations invited to participate in the development of the 2013 Standard Mitigation Plan.
Table 2.3.2.1
Name Title Organization
Allison Brand President Association of Floodplain Managers of Mississippi Don Duncan President Building Officials Association of Mississippi Jim Wilkinson Director Central United States Earthquake ConsortiumBrandon Bolinski Hurricane Program Manager,
Region IVFederal Emergency Management Agency
Jason Hunter NFIP Program Specialist, Mitiga-tion Division, Region IV
Federal Emergency Management Agency
Brad Loar Mitigation Division Director, Region IV
Federal Emergency Management Agency
Jackie Bell Hazard Identification and Risk Assessment
Federal Emergency Management Agency
Linda Byers Mitigation and Planning Lead Specialist
Federal Emergency Management Agency
Joe Rachel Earthquake Program Manager, Region IV
Federal Emergency Management Agency,
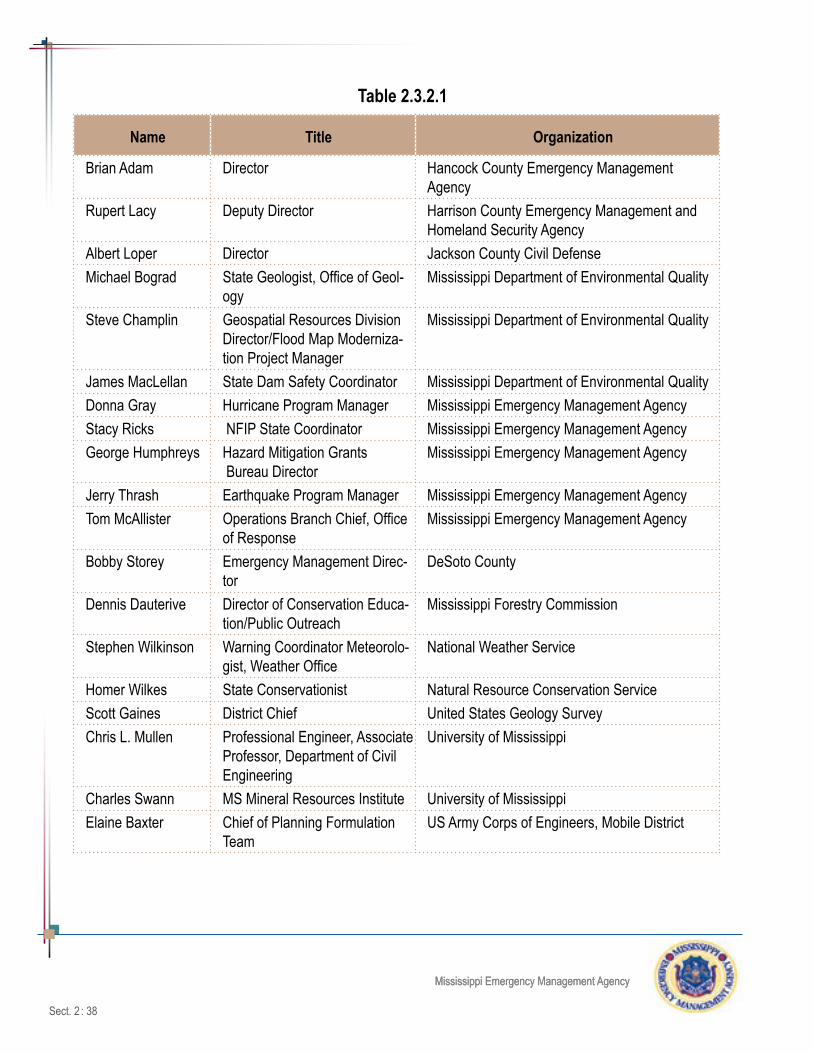
Mississippi Emergency Management Agency
Sect. 2 : 38
Mississippi Emergency Management Agency
Table 2.3.2.1
Name Title Organization
Brian Adam Director Hancock County Emergency Management Agency
Rupert Lacy Deputy Director Harrison County Emergency Management and Homeland Security Agency
Albert Loper Director Jackson County Civil Defense Michael Bograd State Geologist, Office of Geol-
ogyMississippi Department of Environmental Quality
Steve Champlin Geospatial Resources Division Director/Flood Map Moderniza-tion Project Manager
Mississippi Department of Environmental Quality
James MacLellan State Dam Safety Coordinator Mississippi Department of Environmental QualityDonna Gray Hurricane Program Manager Mississippi Emergency Management AgencyStacy Ricks NFIP State Coordinator Mississippi Emergency Management AgencyGeorge Humphreys Hazard Mitigation Grants
Bureau DirectorMississippi Emergency Management Agency
Jerry Thrash Earthquake Program Manager Mississippi Emergency Management AgencyTom McAllister Operations Branch Chief, Office
of ResponseMississippi Emergency Management Agency
Bobby Storey Emergency Management Direc-tor
DeSoto County
Dennis Dauterive Director of Conservation Educa-tion/Public Outreach
Mississippi Forestry Commission
Stephen Wilkinson Warning Coordinator Meteorolo-gist, Weather Office
National Weather Service
Homer Wilkes State Conservationist Natural Resource Conservation ServiceScott Gaines District Chief United States Geology SurveyChris L. Mullen Professional Engineer, Associate
Professor, Department of Civil Engineering
University of Mississippi
Charles Swann MS Mineral Resources Institute University of Mississippi Elaine Baxter Chief of Planning Formulation
TeamUS Army Corps of Engineers, Mobile District

Mississippi Emergency Management Agency
Sect. 2 : 39
Mississippi Emergency Management Agency
MEMA’s participation in the Mississippi Civil Defense/Emergency Management Association (MCDEMA) is another strong indication of the state’s commitment to integrate statewide planning initiatives with local ef-forts. MCDEMA was originally organized by local Civil Defense Directors on May 21, 1961, for the purpose of seeking legislation and additional funding for local programs. Over the years, MCDEMA has continued to grow. A new initiative, which began in 2006, is a partnership between MEMA and MCDEMA to engage emergency management professionals in Alabama in the first Bi-State Hurricane Conference. The MS-AL Bi-State Hurricane Conference proved to be highly successful and had its second meeting in Mobile, Ala., in May 2008. Another meeting followed on April 27-29, 2009 at the MS Coast Civic Center (Coliseum) in Biloxi, MS. In 2010, the meeting was held in the River Room Conference Center in Flowood, MS on June 10-11. In 2012, the Hurricane Conference involved three states, MS, AL and Louisiana and was held on the MS Gulf Coast.
Today, MEMA and MCDEMA enjoy close working relationships which expand educational, communica-tion, and partnership opportunities with concerned organizations at all levels of government. The associa-tion also actively promotes the sharing of information through training activities and meetings. This year, MCDEMA along with the State Department of Health, MS Emergency Management Agency, MS Hospital Association, and the Research and Education Foundation presented the ‘Partners in Preparedness Sum-mit” 2013 at the MS Gulf Coast Coliseum and Convention Center in Biloxi, MS. This summit gave profes-sionals involved with all aspects of emergency preparedness and response the opportunity to network with vendors and peers throughout the state. Attendance at this summit represents all areas of the emergency management and healthcare professions, state and local emergency management directors, public health officials, EMS, hospital, fire and law enforcement representatives, volunteer organizations,and local govern-mental agencies. Approximately 500+ participants attended.
Participants in the “Partners in Preparedness Sum-mit” listen to Robert Latham, Executive Director of the
Mississippi Emergency Management Agency during the opening ceremony of the summit.

Mississippi Emergency Management Agency
Sect. 2 : 40
Mississippi Emergency Management Agency
Educational opportunities included (but were not limited to) sessions on the following:
• Unified Command - Hurricane Isaac Success
• Engaging the Private Sector in Emergency Management
• Medical Emergency Management during a Radiation Event
• All Hazard Emergency Planning
• CAPSTONE 14 Exercise
• EMAC - Hurricane Sandy
The MCDEMA has proven to be very effective in reaching stated goals, and it is anticipated, the annual conferences will continue into the foreseeable future.
In addition to working with FEMA in all aspects of hazard mitigation projects and plans, MEMA has worked with many planners to integrate mitigation steps into projects and plans. The Corp of Engineers, Natu-ral Resource Conservation Service, and Economic Development Administration partnered with LeFlore County, MEMA, FEMA, the Mississippi Development Authority, Central Mississippi Planning and Develop-ment District and the Greenwood/LeFlore Economic Development Association to develop a stormwater drainage plan and project that saved the major industry in this region. This achievement is significant in that it employs over 700 citizens within a 12-county area.
Some 330 Mississippi communities participate in the National Flood Insurance Program (NFIP) and 29 participate in the Community Rating System (CRS). All of these floodplain management activities are sup-ported by the Association of State Floodplain Managers, the Building Officials Association of Mississippi, and the AFMM. The USCOE assists the state and local communities in establishing base flood elevations in areas that have not been studied.
The Mississippi Development Authority’s (MDA) Community Development Block Grant Program (CDBG) has complemented the MEMA buyout program by removing homes and businesses from flood hazard areas throughout the state. Many local communities are unable to provide the non-Federal cost share. By working together, MEMA and MDA are assisting local communities in addressing flood risk areas and improving housing stock. The Mississippi Department of Environmental Quality has worked with MEMA on endangered species and fish and wildlife management issues associated with flood buyouts and water management and conservation questions. The Mississippi Department of Archives and History works with MEMA concerning the National Environmental Policy Act as it relates to historic issues.
The Mississippi Department of Insurance supports MEMA in promoting flood and earthquake insurance, preparedness, response, and mitigation issues and plans. The Mississippi Department of Environmental Quality (MDEQ) has worked with MEMA on flood buyouts, hazardous material planning, earthquake mitiga-tion, and dam safety plans and issues. The Mississippi Department of Transportation, the US Department of Transportation, and the Federal Highway Administration have worked with MEMA on flood buyouts, open space restriction issues, and earthquake planning and bridge retrofits. In addition to the state and federal transportation agencies, the US Geological Survey, the Central US Earthquake Consortium (CUSEC), MDEQ, the Mississippi Department of Insurance, the American Society of Civil Engineers (ASCE), the Mis-sissippi Society of Professional Engineers, the University of Mississippi Center for Community Earthquake

Mississippi Emergency Management Agency
Sect. 2 : 41
Mississippi Emergency Management Agency
Preparedness, the University of Memphis Center for Earthquake Research and Information (CERI), and the Earthquake Engineering Research Institute, New Madrid Chapter, work with MEMA on earthquake mitiga-tion, including retrofits, public education, soil mapping, and seismic studies.
Figure 2.3.2.1 Stormready Communities
Stormready Communities
The National Weather Service (NWS), Mississippi Civil Defense and Emergency Management Association (MCDEMA), and MEMA support the NWS StormReady program in Mississippi with 26 counties, 17 communities, and 4 universities, as well as the many mitigation measures included in that program and its plans (Figure 2.3.2.1). MEMA has also funded 10,918 storm shelters and safe rooms and 183 community shelters throught the Hazard Mitigation Grant Program (HMGP). MEMA has supported efforts to reduce injuries, fatalities and damages from severe weather events by funding weather radios to local schools and call-down systems to local governments for distribution to areas of high population con-centrations such as schools, industries, and hospitals. MEMA’s Statewide Coordinator has worked for years to educate local, state, and national voluntary organizations through the Disaster Recovery Partnership and Volunteer Organizations Active in Disaster (VOAD), concerning the importance of mitigation.
Gold Shading: Storm Ready County Blue Dot: StormReady Community• Adams • Lowndes • Brandon • Madison• Mendenhall • Waveland • Claiborne • Richland• Clay • Marion • Clarksdale • Oxford• Attala • Grenada • Lamar • Neshoba• Bolivar • Hinds • Pearl River • Smith• Clay • Stone • Yazoo • Louisville• De Soto • Warren • Jackson • Magee• Copiah • Newton • Clinton • Pelahatchie• Forrest • Oktibbeha • Columbia • Pontotoc• Jones • Rankin • Ecru • Prentiss• Lauderdale • Tippah • Hattiesburg • Senatobia• Leake • Tunica • Louisville
Purple Dot: StormReady University• Uni. of Miss. • Jackson State Uni. • Uni. of Miss Med Cntr • Uni. of Southern Miss.
Brown Dot: StormReady Government Site• Columbus Air Force
Base• Jackson Air National
Guard Base• Naval Air Station
Meridian • Keesler Air Force Base
• John C Stennis Space Center

Mississippi Emergency Management Agency
Sect. 2 : 42
Mississippi Emergency Management Agency
2.3.3 Mitigation Programs and Measures The following is a synopsis of the State, FEMA, and other program initiatives that are integrated into the Standard Mitigation Plan and will be utilized in the accomplishment of the strategies developed in this plan and local mitigation plans. New programs and initiatives will be added to this ongoing list in subsequent updates in compliance with 44 CFR 13.11(d).
44 CFR 13.11(d): State Plans.
Amendments. A state will amend a plan whenever necessary to reflect: (1) New or revised federal statutes or regulations or (2) a material change in any state law, organization, policy, or state agency operations. The state will obtain approval for the amendment and its effective date but need submit for approval only the amended portions of the plan.
Center for Community Earthquake Preparedness
During February of 1994, MEMA partnered with the Center for Community Earthquake Preparedness (CCEP) at the University of Mississippi in an effort to gain a more solid understanding of earthquake effects on structures. The final report, titled Evaluation of Earthquake Effects on Selected Structures and Utilities at the University of Mississippi: A Mitigation Model for Universities, was produced in October of 1999. This project was designed to determine responses of selected buildings and facilities to regional seismic activity at or near moment-magnitudes of four, six, and eight; identify potential mitigation that would minimize loss of lives during a regional seismic event; identify sites of potentially severe property damage resulting from a regional seismic event; increase the pool of technical experts capable of performing earthquake evalua-tions; establish general recommendations for earthquake hazards mitigation; and keep the issue of poten-tial consequences of seismic activity before the public and the University of Mississippi administration. As a result of the partnership developed during this time, MEMA continues to work closely with CCEP to develop a profile on earthquakes in Mississippi, identifying the risk from regional earthquakes, assessing the vulner-ability of regional earthquakes using HAZUS-MH, and identifying potential mitigation actions that could be implemented to mitigate the effects of earthquakes on the state. The partnership between MEMA and the CCEP will continue, and information from both entities will be mutually integrated to benefit the state’s ef-forts to mitigate potential risks posed by the seismic hazards in Mississippi.
MEMA is also a participant in the New Madrid Seismic Zone Catastrophic Response Planning Project. Partners in this effort include the following:
• DHS/FEMA Headquarters (Response, Recovery, Mitigation, Private Sector, Critical Infrastructure, etc.)
• FEMA Regions IV, V, VI, VII
• Other federal agencies including USDOT, USGS, DHHS, DoD, and others
• CUSEC member states: AL, AR, IL, IN, KY, MS, MO, TN
• NORTHCOM
• Local governments

Mississippi Emergency Management Agency
Sect. 2 : 43
Mississippi Emergency Management Agency
• Business, industry, and voluntary organizations
• Catastrophic planning personnel assigned to support each participating FEMA region and state
• MAE Center, Sandia National Lab, George Washington University (ICDRM)
The mission of the Project is to increase national readiness for a catastrophic earthquake in the New Madrid Seismic Zone (NMSZ). Specifically, this will be accomplished by developing a series of annexes or supplements to existing base plans for response and recovery to a series of major earthquakes in the NMSZ and integrating them into a single document with federal, regional, tribal, state, and local compo-nents. Additionally, the mission is to identify any issues that can not be resolved based on current capabili-ties and to propose recommended courses of action for decision makers involved in the Project.
Community Development Block Grants (CDBG)
Authorized to provide local match for the Hazard Mitigation Grant Program (HMGP), the Mississippi De-velopment Authority is the grant recipient of the Community Development Block Grant (CDBG) funds on behalf of the State of Mississippi. The United States Congress allocated some $2 billion of CDBG funding for water, wastewater, electrical, homeowner grants, planning, and downtown revitalization. In some cases CDBG funds can be used as part of the local share for HMGP, as long as law does not preclude them.
The CDBG funds for homeowner grants were used to elevate homes that are now in new flood zones, as well as to upgrade homes to the new International Building Codes. Also, the funds will be used to buy-out property and thus hopefully change the use of the property from residential to green space and commercial uses.
Comprehensive Emergency Management Plans (CEMP)
The state and each county within the state (82 in all) to include the MS Band of Choctaw Indians have a Comprehensive Emergency Management Plan (CEMP). The plan serves as the operations and administra-tive guide for disaster preparedness, response, and recovery efforts. Select mitigation strategies such as employment of saferoom/stormshelters, evaluation and retrofitting of critical facilities, and public alert warn-ing systems are a part of the CEMP.
The state plan and all county plans have been or are in the process of being updated by utilizing post-Katrina lessons learned, as well as incorporation of the guidelines contained in the National Response Framework.
Consolidated Plan for Housing and Community Development (CPHCD)
The Consolidated Plan for Housing and Community Development (CPHCD) is a requirement of the US De-partment of Housing and Urban Development (HUD) that consolidates the planning and application aspects of the Community Development Block Grant, Emergency Shelter Program, Home Investment Partnerships, and Housing Opportunities for Persons with AIDS formula programs. The CPHCD is a comprehensive planning document that identifies the state’s overall needs for affordable and supportive housing and com-munity development. In addition, the plan outlines a strategy to address those needs. The CPHCD develop-ment process represents an opportunity to involve citizens and community groups in the process of as-

Mississippi Emergency Management Agency
Sect. 2 : 44
Mississippi Emergency Management Agency
sessing the state’s overall housing and community development needs, establishing strategic priorities, and developing a plan to meet the state’s identified housing and community development goals. The CPHCD is updated on a five-year cycle with action plans being developed annually. Identified hazard areas and infor-mation on vulnerable populations and structures identified within the mitigation plan will be integrated into the CPHCD in an effort to ensure that action plans developed to meet housing and community development needs are reflective of the mitigation goals identified within the mitigation plan.
Emergency Management Preparedness Grant (EMPG)
The EMPG provides funding for state and local emergency management programs to include the Natural Hazards Program and the State Hazard Mitigation Program. The EMPG is the backbone for funding local emergency management capability. As a result of increased EMPG funding, all 82 counties now have ac-tive emergency management programs.
Forestry-Disaster Hazard Mitigation and Preparedness Plan (DHMPP)
The State of Mississippi Forestry Commission (MFC) has responsibilities for fire fighting (ESF4) duties during and following a disaster. MFC completed its initial Disaster Hazard Mitigation and Preparedness Plan (DHMPP), and is in the process of updating it. This plan will continue to provide specific information on preparedness resources and activities as ESF4 relates to hurricanes and wildfires. Additionally, the plan will provide detailed information on mitigation activities MFC will undertake to reduce the level of vulnerability to wildfire for the State of Mississippi.
Federal Dam Safety Program
This FEMA program is administered/enforced by the Mississippi Department of Environmental Quality. Strategies for expanding dam safety are discussed in Section 4.4. Additional information on dam safety and relevant issues will be discussed in subsequent updates of the State of Mississippi’s Standard Mitigation Plan.
Hazard Mitigation Assistance (HMA)
In 2008, the Federal Emergency Management Agency grouped together the its grant programs and their requirements in order to form the Hazard Mitigation Assistance Program. HMA consist of the following programs:
• Hazard Mitigation Grant Program (HMPG)
• Pre-Disaster Mitigation (PDM)
• Flood Mitigation Assistance (FMA)
• Repetitive Flood Claims (RFC)
• Severe Repetitive Loss (SRL)
This FEMA funded program serves as the main post-disaster mitigation utilized by the State of Missis-sippi. Over the past 10 years, over $150 million in mitigation projects have been funded in part through the

Mississippi Emergency Management Agency
Sect. 2 : 45
Mississippi Emergency Management Agency
HMGP. The following initiatives have been selected as high priority projects for current and future funding.
Retrofit of Critical Facilities – It is the intent of the Mitigation Bureau to assign a high priority to the retrofit-ting of critical facilities identified in state and local mitigation plans. Wind and flood events have proven to have the highest history of damage, although earthquake vulnerability analysis has identified cost-effective measures for both structural and non-structural mitigation.
Planning – It has long been the policy of the Mitigation Bureau to assign funding priority to those communi-ties that have identified eligible mitigation projects through a planning process. Therefore, the funding of mitigation plans is the top funding priority.
Saferooms – Extreme windstorms, such as tornados and hurricanes, pose a serious threat to buildings and their occupants in many areas of Mississippi. Even a structure built “to code,” may not withstand extreme wind events. A shelter can be built in one of several places – beneath a concrete slab-on-grade founda-tion, or in an interior room on the first floor. To protect its occupants, an in-house shelter must be able to withstand the forces exerted by high winds and remain standing, even if the rest of the house is severely damaged. A saferoom or storm shelter is key to this plan’s mitigation strategy to save lives.
Funds are available to the qualified homeowner from the HMGP administered by the Mitigation Bureau, through private lenders, and the Federal Housing Administration (FHA). Homeowners are requested to contact their local Emergency Management Agency for further information.
Repetitive Flood Loss Structures – These structures represent less than 4 percent of the insured structures in the state but have incurred over 25 percent of the total dollars paid on claims. A priority of the HMGP has been to identify these structures and fund cost-effective acquisition, elevation, localized drainage or reloca-tion of the structures.
Public Alert and Warning System – A special initiative funded through a five percent set aside and the torna-do mitigation initiative allows the state to fund warning systems on college and university campuses where large numbers of student and faculty reside. This program is coordinated with local emergency managers.
Expanded Mitigation Strategies Planning Grant Pilot Guidance - The HMGP Expanded Mitigation Strategies Planning Grant Pilot will provide funds for eligible HMGP Applicants for identifying and planning feasible mitigation projects, and incorporating those projects into their Local Mitigation Plans (LMPs). The mitigation planning process assists eligible Applicants in setting short and long-range mitigation goals and objectives. Mitigation planning is a collaborative process whereby hazards affecting the community are identified, hazard vulnerability is assessed and analyzed, and consensus is reached on how to minimize or eliminate the effects of those hazards. Because LMPs are the foundation of a strong mitigation strategy, the Pilot will bridge the gap between mitigation planning strategies and the implementation of actual mitigation projects as part of the overall disaster recovery effort.
Pre-Disaster Mitigation-Competitive (PDM-C)
This FEMA program was authorized by the Disaster Mitigation Act of 2000, which amended the Stafford Act. PDM-C is a nationally competitive hazard mitigation program that is funded on an annual basis. States sub-mit state level and community applications for funding of natural hazard mitigation measures. State and local governments are required to have an approved mitigation plan in order to receive funding under PDM-C.

Mississippi Emergency Management Agency
Sect. 2 : 46
Mississippi Emergency Management Agency
Hazard Mitigation Technical Assistance Program (HMTAP)
The state has utilized Technical Assistance Task Orders to develop local and county plans, conduct regional workshops on Pre-Disaster Mitigation, publish a Mitigation Success Stories book, conduct community mitigation capability assessments to include community assistance visits and contacts, and to evaluate criti-cal facilities in the wake of Tropical Storm Isidore and Hurricane Lili in September 2002. Significant to the development of this plan have been workshops at 10 Planning and Development Districts facilitated by an HMTAP Task Order, which is integral to the overall mitigation strategy for outreach and public involvement in the planning process.
National Flood Insurance Program (NFIP)
The US Congress established the National Flood Insurance Program (NFIP) with the passage of the Na-tional Flood Insurance Act of 1968. The NFIP is a federal program that enables property owners in partici-pating communities to purchase insurance as a protection against flood losses in exchange for community floodplain management regulations that reduce future flood damages. Participation in the NFIP is based on an agreement between communities and the federal government. If a community adopts and enforces a floodplain management ordinance to reduce future flood risk to new and substantially improved construc-tion in floodplains, the federal government will make flood insurance available within the community as a financial protection against flood losses. This insurance is designed to provide an insurance alternative to disaster assistance in order to reduce the escalating costs of repairing damage to buildings and their contents caused by floods.
The NFIP authorizes the Community Assistance Program (CAP), the Community Rating System (CRS), the Increased Cost of Compliance Insurance Program (ICC), and the Flood Map Modernization Initiative, all of which serve as mitigation incentives for reducing the cost of flood losses.
Community Assistance Program--State Support Services Element (CAP-SSSE)
The state’s formal participation in the NFIP is through the FEMA funded Community Assistance Program (CAP). The CAP annual agreement provides partial funding for the state to establish and maintain an office responsible for providing NFIP technical assistance to state and local jurisdictions, for conducting NFIP compliance audits referred to as “Community Assistance Visits”, and conduct training and public outreach/education. The Governor has designated MEMA as the state coordinating agency for the CAP program. The MEMA Floodplain Management Bureau Director serves as the state NFIP Coordinator.
In Mississippi, the CAP is implemented through a five-year, long-term plan and a one-year action plan. These plans address NFIP compliance, public outreach/education, and mitigation of flood risk structures.
As of 8/11/13, there were 330 local communities participating in the NFIP. Of those 330 communities, 29 also participate in the Community rating System (CRS) program. The flood insurance policies found within these CRS communities equate to 61% of the policies within the state of Mississippi. Mitigation capabil-ity assessments have been conducted in all of these communities to ensure that local administrators are trained to become Certified Floodplain Managers (CFM).
Mississippi Emergency Management Agency
Sect. 2 : 47
Mississippi Emergency Management Agency
Participating NFIP communities (with low to moderate flood risk) receive compliance visits every five years. Over 193 of the state’s NFIP communities have been evaluated within the past three years. The majority of these communities have adopted the state model ordinance and community leaders/administrators have attended regional workshops.
The NFIP State Coordinator has developed a Local Flood Protection Ordinance Handbook, a Quick Guide, for local administrators and a model Flood Damage Prevention Ordinance that exceeds the FEMA stan-dards for riverine and coastal communities. All of these tools are available in hardcopy and on the MEMA website. Statewide and regional NFIP workshops are conducted annually.
The Association of Floodplain Managers of Mississippi (AFMM) was established in 1999 and became a state chapter of the Association of State Floodplain Managers in 2001. The association currently has over 100 members and in 2004 hosted the annual national conference of the Association of State Floodplain Managers. Members of the AFMM attaining their certification are now assisting the state with training and “peer to peer” assistance to other communities.
Increased Cost of Compliance (ICC)
ICC coverage provides for the payment of an additional claim to help pay for the increased costs to comply with state or community floodplain management laws or ordinances after a flood in which a building has been declared substantially damaged or repetitively damaged. When an insured building is damaged by a flood and the community declares the building to be substantially or repetitively damaged, this triggers the requirement to comply with its community floodplain management ordinance, ICC will help pay for the cost to floodproof (non-residential buildings only), relocate, elevate or demolish a structure up to a maximum of $30,000. This coverage is in addition to the building coverage for the repair of actual physical damages from flood under the policy, but the total paid cannot exceed the maximum limit set by Congress for that type of building.
The maximum limit of $30,000 helps property owners insured under the NFIP to pay for a portion, or in some cases, all of the costs of undertaking actions to protect homes and businesses from flood losses. In addition, an ICC claim payment can be used to complement and supplement funds under other mitigation programs such as the FMA and FEMA’s HMGP, which assist communities in implementing measures to reduce or eliminate the long-term risk of flood damage to buildings insured under the NFIP.
Flood Map Modernization Initiative
With the funding and implementation of the modernization plan, beginning in 2003, the flood hazard information provided to communities has become more accurate and extensive, resullting in safer com-munities. The plan established a five-year upgrade to the flood map inventory and an enhancement of products and services. The State of Mississippi serves as a Cooperating Technical Partner (CTP) with FEMA in the Flood Map Modernization Intiative. MEMA and the Mississippi Department of Environmental Quality (MDEQ) are the coordinating agencies. The digital flood insurance rate maps developed through this partnership serve as a layer in the Mississippi Digital Earth Model (MDEM). The MDEM will serve as a statewide GIS system that will serve as an efficient and effective source for planning, risk management, and mitigation.

Mississippi Emergency Management Agency
Sect. 2 : 48
Mississippi Emergency Management Agency
The state has submitted its initial Risk MAP Scope of Work and has identified communities for funding for Fiscal Year 2009--Fiscal Year 2010, which includes those communities that require map maintenance work.
Homeland Security Plan
Findings from this plan were integrated with the Mississippi Emergency Operations Plan, with particular emphasis on human-caused hazards. The Homeland Security Plan development was closely coordinated with this Hazard Mitigation Plan.
Natural Hazards Program
Located in the Preparedness, Training, and Exercise Bureau of MEMA, the Natural Hazards Program Manager develops and coordinates the State Hurricane Program and the State Earthquake Program, and coordinates the update of the Hurricane and Earthquake component of the plan.
Pre-Disaster Mitigation Planning Program (PDM-PL)
This FEMA program is being utilized to fund localities and Planning and Development Districts throughout the state to develop local and regional plans. Localities that have applied to bring their existing hazard miti-gation plans into compliance with Sec. 322 standards may be funded based upon availability. These plans, when judged compliant, will be linked to Mississippi’s Standard Hazard Mitigation Plan.
Pre-Disaster Mitigation Loans for Small Businesses
The Small Business Administration published a Final Rule on its Pre-Disaster Mitigation Loan Program in the Federal Register on October 7, 2002. After November 1, 2003, a business must be located in a commu-nity with a FEMA-approved mitigation plan in order to be eligible for this program. Eligible small businesses may borrow up to $50,000 each fiscal year at a fixed interest rate of four percent per year or less for mitiga-tion measures approved in the loan request. Businesses proposing mitigation measures must be locate in a Special Flood Hazard Area. A written certification from a local emergency management official is required as part of the loan application to satisfy this requirement. This program will coordinate with the State of Mis-sissippi Standard Mitigation Plan to provide capital necessary to fund hazard mitigation projects.
State Emergency Response Commission
Mississippi Emergency Management Agency is designated by executive order to implement the Super-fund Amendments and Reauthorization Act, Title III (Public Law 99-499). Personnel involved in this on-going planning effort coordinate Local Emergency Planning Commissions (LEPC) statewide. There is a particular emphasis on human-caused hazards as a result of the use or misuse of hazardous materials.

Sect. 3 : 49
Mississippi Emergency Management Agency
3.0: Risk Assessment
Overview of the Risk Assessment ProcessRisk Assessment requires the collection and analysis of hazard-related data enabling state and local jurisdictions to identify and prioritize appropriate mitigation actions to reduce losses from potential hazards. Based on best available data, this section profiles natural and man-made hazards that could possibly affect the state, determines which jurisdictions and populations are most vulnerable, and estimates potential loss of state facilities.
This section of the plan was originally developed in 2004 with updates developed in 2007, 2010 and 2013. MEMA is the lead agency for the state in developing this plan and subsequent plan updates plus coordi-nates involvement from applicable state agency representatives through appointment to the State Hazard Mitigation Council (HMC).
The HMC thoroughly reviewed the identified hazards and their respective profiles. An appropriate amount of research conducted for each hazard and incorporated with the findings in the 2013 plan. Primary sources and methodologies used for this plan update are listed below:
• Declared Events: state and federal declared events obtained from www.fema.gov/disasters.
• National Climatic Data Center (NCDC): database maintained by the National Weather Service tracks natural hazard events with information about dates, locations and estimated damages. This database was improved since the 2010 plan and includes more categories of natural hazards. Data can be extracted statewide by county or zone - depending on the type of event at www.ncdc.noaa.gov/stormevents.
• SHIELDUSTM: The Spatial Hazard Events and Losses Database for the United States (SHELDUS) provides county-level hazard data. http://webra.cas.sc.edu/hvri/products/sheldus.
• HAZUS-MH: FEMA’s loss estimation software utilizes a statistical approach and mathematical modeling of risk to predict a hazard’s frequency of occurrence and estimated impacts based on recorded or historic damage information.
• National Flood Insurance Program (NFIP): The NFIP eliminated many of the reports used in previ-ous plans. For this plan update the NFIP Loss Statistics Report and the state of Mississippi repeti-tive flood claim and severe repetitive loss properties report dated February 2011 were used.
• Internet Research: The Internet and other online research tools used throughout this plan update.
• HMC: Various members from the HMC provided valuable information for this plan update.
• Local Mitigation Plans: Applicable data, including hazards identified as potential risks and rankings were summarized and tabulated throughout this section of the plan.

Sect. 3 : 50
Mississippi Emergency Management Agency
Identification of Critical Facilities and Infrastructure
The state of Mississippi is nearing completion of their effort to geocode all state-owned property. It is esti-mated this project will be completed in 2014. For this plan update, the estimated losses for state facilities and infrastructure will be based on the data presented in the 2010 plan.
Local Mitigation Strategy Integration
As of this plan update, a total of 104 local mitigation plans are approved. These plans were developed for single jurisdictions, counties, university/community colleges, and regional plans (multi-county). Each ap-proved plan was considered and integrated as appropriate into this plan update.
MEMA will coordinate the update of local mitigation plans into regional plans based on MEMA’s established regions. This change is to unify mitigation planning throughout the state to improve integration and utilize resources (financial and assets) more efficiently.

Sect. 3 : 51
Mississippi Emergency Management Agency
2013 Summary of ChangesHazard data is presented, where appropriate, by MEMA Region. The state intends to make this information more usable to local jurisdictions as they update their plans to a level based on the nine MEMA Regions. HAZUS runs for tropical cyclones are provided in the appendix of this plan and can be requested by juris-dictions to review and develop their tables and references within their plans as they deem appropriate. A brief summary of the changes/updates made to each hazard within this section is provided below.
3.1 Identifying Hazards - Introduced new ranking methodology adopted by the HMC and the results of the hazard ranking process, added presidential declarations with individual assistance paid to date, updated the hazards identified in the approved local plans and introduced infrastructure interdependency vulnerabili-ties as requested by the HMC.
3.2 Profiling Hazards and Estimating Losses - Updated estimated losses and added explanation for HAZUS and flood mapping capabilities.
3.3 Tornado - Updated previous event history, incorporated property values and loss estimates from SHIELDUS plus and Mississippi Tax Commission, plus expanded narratives and damage impacts for recent events. Identified vulnerability to lapse in radar coverage for northwestern Mississippi and added informa-tion regarding mobile/manufactured housing and community/individual safe room programs.
3.4 Dam/Levee Failure - Updated event history, inventory of dams, status of EAPs and changes in classifi-cations. Integrated Mississippi River Levee study.
3.5 Tropical Cyclone - The name of this hazard was updated from its previous reference of Hurricane to more accurately reflect the components of coastal systems that produce varying degrees of tropical weath-er events. Updated previous event history and state probabilistic and Katrina planning scenarios.
3.6 Flood - Updated event history and NFIP data. Reoganized information from river basin to MEMA Re-gions.
3.7 Wild/Urban Fire - Updated information received from MFC with best available data.
3.8 Drought - Updated event history and added information on Keetch Byram Drought Index.
3.9 Winter Weather - Updated event history and expanded cold-weather related events and vulnerabilities.
3.10 Earthquake - Updated event history, effects on dams and incorporated findings from Impact of Earth-quakes on the Central USA - 2008 into vulnerability section.
3.11 Non-Profiled Hazards - Expanded and updated information for severe weather and coastal erosion.
3.12 Growth and Development Trends - To identify potential outreach strategies, updated demographic information and added charts depicting from which states people are migrating.
3.13 Interdependency of Infrastructure - This new section was added to raise awareness of the conse-quences that could impact the state’s built systems.
Sect. 3 : 52
Mississippi Emergency Management Agency
Mitigation RecommendationsAs this section was updated, several recommendations for future mitigation actions surfaced that the state might want to further explore.
Tornado
The National Weather Service informally recognizes the need for improved radar coverage in the northwest region of the state and is working with Dr. Jerald Brotzge to find a solution. A partnership-based funding effort to secure the requisite $300,000 is underway, but a lead state-based sponsor is needed and the resulting unit should be located in either Greenville, Mississippi or Monroe, Louisiana.
Constructing safe rooms in mobile/manufactured housing complexes should be further explored. Encourag-ing developers to include a community safe room could reduce injury or loss of life to residents.
Dam/Levee
Provide funding to complete a study of the potential impacts from a breach on the Pearl River levee system. This system protects the greatest number of people and assets in the state which could cause significant economic implications.
Explore impacts to failures in states that border Mississippi. As the state realized in 2010 with the ice/snow runoff from the northern states into the Mississippi River, what happens upstream can and will create sig-nificant damages to the levee systems in Mississippi. Furthermore, flooding caused by dam/levee failures in Mississippi and their potential impacts across state borders is also necessary - which was the case when the dam at Percy Quin overflowed into Louisiana.
Suitable data showing the location of all levees and their potential interaction of related river systems does not exist, largely due to regulatory oversight differences between certified and non-certified levee struc-tures. This lack of data prohibits Mississippi from understanding the true potential of levee failures.
While HAZUS provides estimates for dam/levee failure, configuration of the model is challenging and the supporting input data required to correctly initialize and run the model are limited. A recommendation to use HEC-RAS (utilized by the USACE) for future modeling would provide a systematic approach for future modeling initiatives.
Sect. 3 : 53
Mississippi Emergency Management Agency
3.1: Identifying Hazards
44 CFR 201.4(c)(2)(i) – The State risk assessment shall include the following elements:
An overview of the type and location of all natural hazards that can affect the State, including in-formation on previous occurrences of hazard events, as well as the probability of future hazard events, using maps where appropriate.
IntroductionHazards identification is recognizing events threatening a particular planning area. An event becomes a hazard when it harms people property or interferes with commerce and human activity. Such events would include, but are not be limited to, hurricanes, floods, earthquakes, tornadoes and other hazards affecting populated areas. Natural hazards harming the state in the past are likely to happen in the future. Conse-quently, the process of identifying hazards includes determining whether or not the hazard occurred previ-ously. Approaches to collecting historical hazard data include researching newspapers and other records, conducting a review of planning documents and reports in all relevant hazards subject areas, gathering hazard-related GIS data, and engaging in discussions with relevant experts throughout the state.
A variety of sources were used to determine the full range of potential hazards within the state of Missis-sippi, including internet research and a careful evaluation of approved local mitigation plans. Even though a particular hazard may not have occurred in recent history in the state, it is important to consider all hazards potentially affecting the planning area during the hazard identification stage.
Mississippi is vulnerable to a wide variety of natural and man-made hazards threatening life and property and is typically in the top ten of most vulnerable states in the nation due to risks from hurricanes, tornadoes and other hazards.
Table 3.1.1 outlines each major disaster declaration that Mississippi has received over the last decade. This establishes the vulnerability and historic occurrences of hazards with which Mississippi regularly deals with. This table also includes Individual Assistance (IA) statistics, accurate as of June 20, 2013; however, they will change following completion of this plan as assistance continues to be provided.

Sect. 3 : 54
Mississippi Emergency Management Agency
Table 3.1.1FEMA Major Disaster Declarations and Individual Assistance (IA) Funded
Mississippi 2002 - 2013Date Disaster Type Disaster Number Amount of IA
February 13, 2013 Severe Storms, Tornadoes, and Flooding DR-4101 $3,241,0008
August 29, 2012 Hurricane Isaac DR-4081 $17,667,440
May 11, 2011 Flooding DR-1983 $13,724,525
April 29, 2011 Severe Storms, Tornadoes, Straight-line Winds and Associated Flooding DR-1972 $10,730,970
May 14, 2010 Severe Storms, Tornadoes, and Flooding DR-1916 $1,320,029
April 29, 2010 Severe Storms, Tornadoes, and Flooding DR-1906 $4,302,971
May 12, 2009 Severe Storms, Flooding, and Tornadoes DR-1837 None
September 22, 2008 Hurricane Gustav DR-1794 $7,176,481
May 28, 2008 Severe Storms and Tornadoes DR-1764 $549,481
May 8, 2008 Severe Storms and Flooding DR-1753 $1,598,082
August 29, 2005 Hurricane Katrina DR-1604 $1,296,454,555
July 10, 2005 Hurricane Dennis DR-1594 None
September 15, 2004 Hurricane Ivan DR-1550 $8,514,433
May 23, 2003 Severe Storms, Tornadoes, and High Winds DR-1470 $740,552
April 24, 2003 Severe Storms, Tornadoes and Flooding DR-1459 $18,270,790
November 14, 2002 Severe Storms and Tornadoes DR-1443 $2,028,549
October 1, 2002 Tropical Storm Isidore DR-1436 NoneSource: FEMA Disaster Declarations-Mississippi (6-20-13)

Sect. 3 : 55
Mississippi Emergency Management Agency
Hazard Identification ProcessThis section profiles the potential hazards posing the greatest threat to Mississippi. As part of the 2013 revi-sion, a comprehensive list of hazards was compiled from the following sources:
• Review of the 2010 State of Mississippi Standard Mitigation Plan
• Review and assessment of historical data from the NCDC, FEMA Disaster Declarations, USGS, NFIP and various Internet resources
• Review of the local hazard mitigation plans
In addition to the sources above, hazard data and input were collected from direct communication with vari-ous agencies, discussions with consultant team in-house experts, historical records and Internet searches.
The HMC worked with the consultant team to narrow the all-inclusive list of hazards to those most threaten-ing to Mississippi. During the screening process, the HMC considered which hazards could realistically be addressed at the state level in terms of mitigation. Many hazards are best addressed by the local mitigation plans. It should be noted the lack of a specific hazard profiled in this plan does not mean the state will not provide adequate support to local jurisdictions in mitigating the effects of that hazard.
Many of the hazards selected are related (e.g. flooding and tornadoes can develop during a coastal storm) because other hazards may result from a disaster event. In such instances, these hazards are not listed separately but concurrently.
Table 3.1.2 shows a summary of the hazard identification results for Mississippi, followed by the results of the hazards not included in this plan update. This table includes the hazard ranking and subsection where the hazard is addressed. Details of the hazard ranking and profiling process are provided following the identification tables.
Table 3.1.2 Summary of Hazards Selected
Hazard Type Reasons for Inclusion Section Reference
Flood Much of the state of Mississippi is located within the 100-year floodplain. Flash floods and other flood events occur regularly during rainstorms due to terrain and hydrology of the state of Mississippi. There have been numerous Di-saster Declarations as a result of flooding in Mississippi, including both coastal and riverine.
Section 3.6
Tropical Cyclone Hurricanes/tropical storms are common and devastating in Mississippi.
Section 3.5
Wildfire The state of Mississippi experiences wildfires on a regular basis, as historically presented in the plan.
Section 3.7

Sect. 3 : 56
Mississippi Emergency Management Agency
Table 3.1.2 Summary of Hazards Selected
Hazard Type Reasons for Inclusion Section Reference
Tornado Tornadoes are common disasters in Mississippi. Section 3.3
Earthquake Significant research points to the possibility of damaging earthquake along the New Madrid Fault.
Section 3.10
Extreme Winter Weather There have been more than 47 damaging events be-tween 1993 and 2009, with a reported $25 million in property damages and $5 billion in crop damages.
Section 3.9
Drought Research indicates the possibility of inadequate water supply as a result of prolonged drought conditions could impact the health of the population and jeopardize eco-nomic resources such as timber, livestock, and crops.
Section 3.8
Dam/Levee Failure High hazard dams require Emergency Action Plans which include Inundation mapping. There is a presence of some downstream development that could be impacted by a dam breach.
Section 3.4
Severe Weather (heavy rain, thunderstorm, strong wind, hail and lightning)
Not typically a state-wide occurrence and best addressed in local plans.
Section 3.11
Coastal Erosion Coastal erosion is primarily caused by hurricanes and coastal flooding, which are addressed in their respective sections.
Section 3.11
Excluded Hazards
During the review of hazards included in the 2010 plan the HMC determined a number of hazards would not be included in the 2013 plan update. This decision was based on the belief they were not prevalent haz-ards within the state, and would pose little or no threat to the state as compared to the other hazards. Table 3.1.3 gives a brief description of those hazards and the reason for their exclusion.
Avalanche, landslide and volcano are recognized by FEMA as hazards prone to the U.S. but were not considered because they pose no threat to Mississippi.

Sect. 3 : 57
Mississippi Emergency Management Agency
Table 3.1.3Summary of Hazards Excluded from Hazard Profiling
Hazard Type Description Reason for ExclusionExpansive soils Expansive soils shrink when dry and swell when
wet. This movement can exert enough pressure to crack sidewalks, driveways, basement floors, pipelines and even foundations.
Only 36% of local mitigation plans identified expansive soils as a hazard to be profiled. The state has concluded that it does not pose a significant state-level threat. The de-cision was also partially based on the fact that the impacts to state-owned or critical facilities would be little or none.
Extreme heat Temperatures that hover 10 degrees or more above the average high temperature for the region and last for several weeks.
Only 24% of local mitigation plans identified extreme heat as a hazard to be profiled. While extreme heat can create emergen-cies in Mississippi, the state has concluded it does not pose a significant state-level threat. The decision was partially based on the impacts to state-owned or critical facili-ties would be little or none.
Land subsidence Occurs when large amounts of ground water are withdrawn from certain types of rocks, such as fine-grained sediments. The rock compacts be-cause the water is partly responsible for holding the ground up. When the water is withdrawn, the rocks fall in on themselves.
Soils in the state are mostly compact. Pres-ents a minor threat. No significant historical record of this hazard in the region.
Liquefaction Liquefaction occurs in saturated soils, that is, soils in which the space between individual particles is completely filled with water. This water exerts a pressure on the soil particles that influences how tightly the particles themselves are pressed together. Prior to an earthquake, the water pressure is relatively low. However, earth-quake shaking can cause the water pressure to increase to the point where the soil particles can readily move with respect to each other.
Addressed in earthquake section.
Tsunamis A tsunami is a series of ocean waves generated by sudden displacements in the sea floor, land-slides, or volcanic activity. In the deep ocean, the tsunami wave may only be a few inches high. The tsunami wave may come gently ashore or may increase in height to become a fast moving wall of turbulent water several meters high.
MEMA participates on the National Tsunami Hazard Mitigation Program (NTHMP). There is no identified history of tsunamis in the Gulf. Mitigation would be similar to that for large hurricanes which are addressed.

Sect. 3 : 58
Mississippi Emergency Management Agency
Assessment of Local Mitigation Plans The 2013 plan considers risks identified outside this process in order to be more aware of the hazards facing local jurisdictions. Chapter 5: Coordination of Local Mitigation Planning, covers in detail, hazards identified and addressed in over 104 local plans. Generally, the hazards selected and profiled in this plan coincide well with the highest ranked local hazards.
A review of the 104 local hazard mitigation plans was made to determine which hazards are of concern to local communities. This review concluded the nine hazards of concern - flood, hurricane, wildfire, tornado, extreme winter weather, earthquake, drought, severe weather and dam/levee failure - are included in over 59% of the local plans. All counties are concerned about tornado and flood.; and for other hazards identified in local plans but not in the HMC ranking, a threshold was established. If 45% or fewer of the local plans identified the hazard it was deemed to pose no significant threat to the state. The results of the local hazard identification review are summarized in the table below.
Natural Hazards
Percent of Plans Included Natural Hazards
Percent of Plans Included
Flood 100 Expansive Soils 36Tornado 100 Extreme Heat 24Hurricane 90 Storm Surge 14Thunderstorm/High wind/Hail/Lightning 89 Coastal Erosion 9Wildfire 83 Coastal Storm 7Severe Winter Storm/Extreme Cold/Ice Storms 70 Land Subsidence 6Earthquake 68 Tsunami 2Drought 66 Sea Level Rise 1Dam/Levee Failure 59
A review of local plans revealed severe weather (thunderstorm, hail, lightning and high wind) was identified and addressed by 89% of the local plans. This hazard is best addressed at the local level and is addressed under Section 3.10 Non-Profiled Hazards. In addition, components of these hazards are addressed in the tropical cyclone and tornado sections of this plan as applicable.
Drought was addressed in 66% of the local plans and included as a limited profiled hazard as it can have statewide impacts, but is best mitigated by local practices. Coastal erosion is included as a non-profiled hazard and determined to pose no significant statewide threat to Mississippi and little or no threat to state-owned or critical facilities.
Hazards identified and addressed in local plans, but not included in this plan, will receive the support of the state mitigation program. These hazards include but not limited to, sea level rise, salt water intrusion, tsunami and expanding soils. Many of the coastal communities are in the process of conducting studies to further understand globally and should continue to be explored by the state.
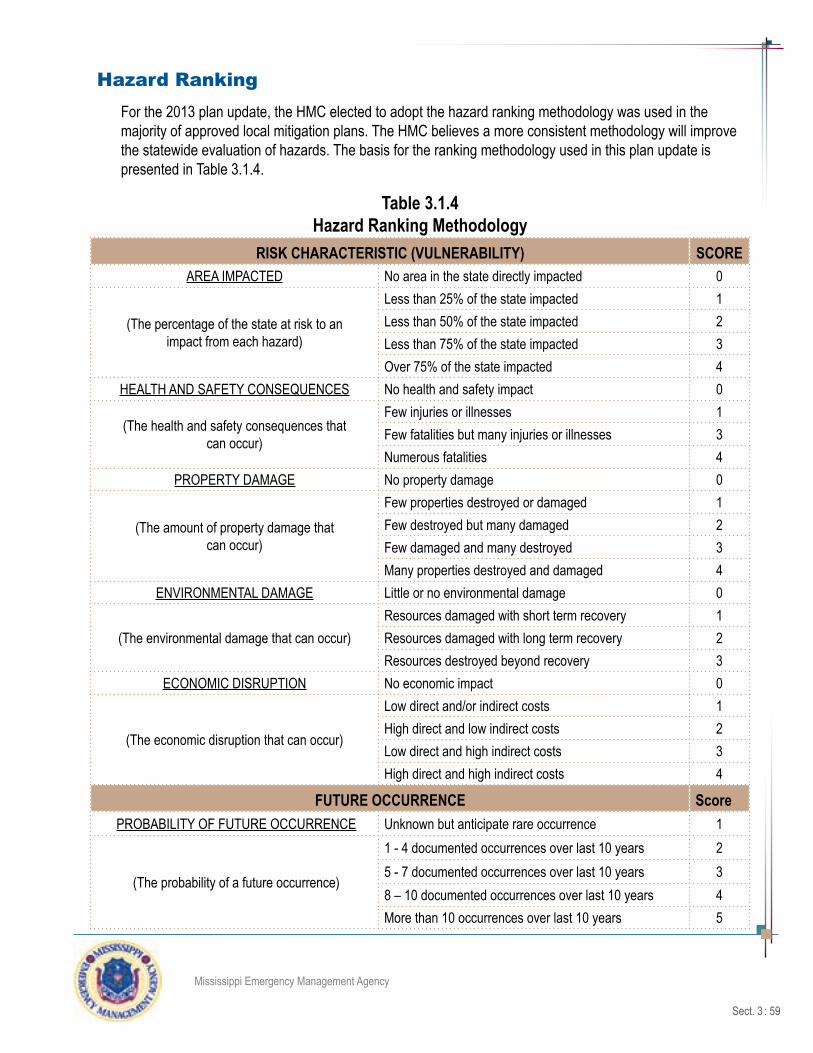
Sect. 3 : 59
Mississippi Emergency Management Agency
Hazard RankingFor the 2013 plan update, the HMC elected to adopt the hazard ranking methodology was used in the majority of approved local mitigation plans. The HMC believes a more consistent methodology will improve the statewide evaluation of hazards. The basis for the ranking methodology used in this plan update is presented in Table 3.1.4.
Table 3.1.4Hazard Ranking Methodology
RISK CHARACTERISTIC (VULNERABILITY) SCOREAREA IMPACTED No area in the state directly impacted 0
(The percentage of the state at risk to an impact from each hazard)
Less than 25% of the state impacted 1Less than 50% of the state impacted 2Less than 75% of the state impacted 3Over 75% of the state impacted 4
HEALTH AND SAFETY CONSEQUENCES No health and safety impact 0
(The health and safety consequences that can occur)
Few injuries or illnesses 1Few fatalities but many injuries or illnesses 3Numerous fatalities 4
PROPERTY DAMAGE No property damage 0
(The amount of property damage that can occur)
Few properties destroyed or damaged 1Few destroyed but many damaged 2Few damaged and many destroyed 3Many properties destroyed and damaged 4
ENVIRONMENTAL DAMAGE Little or no environmental damage 0
(The environmental damage that can occur)Resources damaged with short term recovery 1Resources damaged with long term recovery 2Resources destroyed beyond recovery 3
ECONOMIC DISRUPTION No economic impact 0
(The economic disruption that can occur)
Low direct and/or indirect costs 1High direct and low indirect costs 2Low direct and high indirect costs 3High direct and high indirect costs 4
FUTURE OCCURRENCE Score PROBABILITY OF FUTURE OCCURRENCE Unknown but anticipate rare occurrence 1
(The probability of a future occurrence)
1 - 4 documented occurrences over last 10 years 25 - 7 documented occurrences over last 10 years 38 – 10 documented occurrences over last 10 years 4More than 10 occurrences over last 10 years 5

Sect. 3 : 60
Mississippi Emergency Management Agency
The HMC studied each state-prone hazard and, based on historical data and information provided by the council members and planning team, considered the statewide implications each would present. Each risk characteristic – area impacted, health and safety consequences, property damage, environmental damage, and economic disruption – was assigned a scoring value of 0-4, multiplied by a future occurrence value of 1-5 determining the overall risk level. The sum of each risk characteristic value was added together and multiplied by the probability of future occurrence to determine each hazard’s total risk rating score. The formula is as follows: vulnerability x probability of occurrence = risk. Below is the definition of each risk level and their total rating score value.
Risk Level Total Rating ScoreLow 0-15A hazard with a LOW RISK RATING is expected to have little to no impact upon the state. The hazard poses minimal health and safety consequences to the state’s residences, and is expected to cause little to no prop-erty damage. The occurrence of a hazard with a LOW RISK RATING is rare; however, due to other factors such as geographical location it is still possible for such a hazard to occur and even cause significant damage based upon the magnitude of the event.Moderate 16-30A hazard with a MODERATE RISK RATING is expected to have a moderate impact upon the state. The haz-ard poses minor health and safety consequences with minor injuries expected and few to no fatalities. The hazard may cause some property injuries and few to no fatalities. The hazard may cause some property to be damaged or destroyed. The occurrence of a hazard with a MODERATE RISK RATING is likely at least once within the next 25 years.High 31 or MoreA hazard with a HIGH RISK RATING is expected to have a significant impact upon the state. The hazard poses high health and safety consequences with numerous injuries and fatalities possible. The hazard may even cause some property to be damaged or destroyed. A hazard with a HIGH RISK RATING is expected to occur at least once within a 12 month period, but can occur multiple times within a year.
Table 3.1.5 indicates the overall ranking established by the HMC using the method described above and fol-lowed by the definition of profiled, limited and non-profiled hazards. The completed worksheet is provided in Appendix 7.3.1-A.

Sect. 3 : 61
Mississippi Emergency Management Agency
Table 3.1.5 Hazard Ranking
2013 Hazards SelectedTotal
VulnerabilityFuture
OccurrenceTotal Risk
Value Risk LevelTornado 13 5 65 HighDam/Levee Failure 10 5 50 HighTropical Cyclone (Hurricane/Tropical Storm) 16 3 48 HighFlood 9 5 45 HighWildfire 8 5 40 HighSevere Weather (thunderstorm / hail / lightning / high wind) 5 5 25 Moderate
Drought 9 2 18 ModerateExtreme Winter Weather 8 2 16 ModerateEarthquake 15 1 15 LowCoastal Erosion 5 1 5 Low
Non-Profiled HazardsThe HMC chose not to select and rank severe storms, because they do not typically cause a statewide impact, require a state response, and would be mitigated at the local level. During a review of the plan and with 89% of local jurisdictions indicating severe storms (thunderstorms, high wind, lightening and hail) were of significant concern, the state opted to expand the profile of this hazard under Section 3.11. In this sec-tion, a general discussion of vulnerability was added along with a history of events. Property damage, loss of life and injuries that can be expected statewide are addressed generally. It is not possible to specifically address expected losses to critical or state-owned facilities with the limited data available.
Beach/Coastal erosion is also included as a non-profiled hazard and determined to pose no significant statewide threat to Mississippi and little or no threat to state-owned or critical facilities
Infrastructure Interdependency Reliance upon built infrastructure in Mississippi is becoming increasingly important. Infrastructure elements such as roads, bridges, electrical grids, computer networks (the Internet), and similar components provide the economic and supply backbone upon which economic health and future growth rests. At best, failure of any one or all of these elements may result in substantial economic damage; and at worst, significant loss of life. Failure of one system (electrical) may cause cascading failures across multiple systems (water, wastewater, E911, etc.) with far reaching consequences (large fires raging out of control, disease). Com-plicating matters is the increasing fragility of infrastructure as components age, are threatened by severe weather and climate change, become terrorism targets, or simply fail due to an accident. Initial studies sug-gest failure of infrastructure in Mississippi due to aging is a significant concern. Collaborative data sharing across enterprises and exercises which investigate critical failure points and weaknesses in Mississippi’s infrastructure systems is required.
Sect. 3 : 62
Mississippi Emergency Management Agency
3.2: Profiling HazardsHazard profiling involves describing the physical characteristics of past hazards such as magnitude, dura-tion, frequency, and probability. This stage of the hazard mitigation planning process involves creating base maps of the state and collecting and mapping hazard event profile information obtained from vari-ous federal, state, and local government agencies. The extent to which hazards are profiled is dependent on the availability of data. Some hazard profiles provide significantly more information than others based on the amount of prior research and data production identified. It is standard practice to use the best and most current available information. The HMC and consultant team obtained statewide maps and data from a variety of sources. The hazard data were mapped to determine the geographic extent of the hazards in the State. The level of risk associated with each hazard was estimated and assigned a risk level of high, medium or low (or variations thereof) depending on several factors unique to a particular hazard.
3.2.1 Identifying Assets and Assessing Vulnerability
Requirement §201.4(c)(2)(ii): The State risk assessment shall include the following elements:
An overview and analysis of the State’s vulnerability to the hazards described in this paragraph (c)(2), based on estimates provided in local risk assessments as well as the State risk assess-ment. The State shall describe vulnerability in terms of the jurisdictions most threatened by the identified hazards, and most vulnerable to damage and loss associated with hazard events. State-owned critical or operated facilities located in the identified hazard areas shall also be addressed.
The third step of the risk assessment process is identifying assets throughout the state and projected to be affected by each hazard type. Assets include state-owned structures or critical facilities including hospitals, schools, and public infrastructure. An inventory of existing assets within the state was generated, mapped on a regional basis (Appendix 7.3.2-D-1 through D-14) to show their locations, and determination of vulner-ability to each hazard type, where practicable.
State-Owned Facilities - The Mississippi Department of Finance and Administration (MDFA) is tasked with compiling a comprehensive list of state-owned facilities as define as mitigation action Multi-Hazard-15 In-ventory of State-Owned Facilities in the 2007 and 2010 plan. As of this update, funding has been received and the project is moving forward and is expected to be completed by the end of 2013. Since the project is not yet completed, this plan update utilized the best available data provided by the MDFA and HAZUS results from the 2007 and 2010 plans. This data is provided in Appendix 7.3.2-E and 7.3.2-F and includes an estimated number of facilities and the estimated replacement values. In addition, the data provided did not include accurate physical locations for all properties and prevented the ability to map these facilities in this update.
The state of Mississippi developed the following definitions for Critical Facilities and Critical Infrastructure, with guidance from FEMA publication 386-2 and 42 U.S.C. 5195c. The intention of these definitions is to aid in the assessment of the vulnerability and operational necessity of facilities and systems within the state during the occurrence of a hazard event.
Sect. 3 : 63
Mississippi Emergency Management Agency
A Critical Facility is defined as any structure providing or houses critical services necessary to ensure the health and welfare of the population following a natural or man-made hazard event, including any facilities designated by local governments in their Hazard Mitigation Plan. Types of critical facilities are presented in detail in Appendix 7.3.2-A.
Critical Infrastructure is defined as systems so vital to the state of Mississippi the incapacity of those sys-tems would have a debilitating impact on security, economics, public health, safety, or any combination of those factors, including any infrastructure designated by local governments in their Hazard Mitigation Plan. Types of critical infrastructure are presented in detail in Appendix 7.3.2-B.
One component of assets, Key Assets, is not identified and included in this plan. A Key Asset is defined as any system (private or publically-owned), whether physical or virtual, that provides the state critical ser-vices and/or historic significance, whose destruction could cause large-scale injury, death or destruction of property and/or profoundly damage our state’s prestige and confidence. Some of the key assets are also identified as a critical facility. Since the state has moved towards an all-hazards approach and man-made hazards are being included, key assets are necessary as these facilities could be prone to a man-made event and cause adverse implications to the state and local communities. Appendix 7.3.2-C provides the types of key assets that were identified for planning purposes.
These definitions were utilized to determine data collection criteria. All information included in the assess-ments of this plan is based on best-available data. The critical facilities, which were documented for this report, included all facilities listed as critical in existing local Hazard Mitigation Plans within the state. In accordance with the definition, available data was also collected for facilities that, in the event of a disaster: provide shelter and/or resources for displaced individuals, provide safe and reliable production or treatment of essential services, provide essential communication between emergency personnel and the general public, provide crucial public safety, serve as a central facility that houses officials providing leadership and guidance for essential community operations, provide primary health care, accommodate inter-modal transportation providing evacuation and/or distribution of supplies.
Assessing Vulnerabilities - An asset is vulnerable if it is susceptible to damage from a hazard. Vulner-ability depends on an asset’s construction, contents, and the economic value of its functions. A vulner-ability analysis can also predict the extent of injury and damage resulting from a hazard event of a certain intensity in an area. The vulnerability assessment identifies the effects of hazards by estimating the relative exposure of population, land development, and infrastructure to hazardous conditions, giving significant attention to critical and state-owned facilities. This includes consideration of the indirect effects of hazards, which can be much more widespread and more damaging than the direct effects. For example, the loss of commerce due to road closures for an amount of time could significantly outweigh the cost of repairing the road. The assessment helps set mitigation priorities by allowing the state and its local jurisdictions to focus attention on areas most likely to be damaged or most likely to require early emergency response during a hazard event.

Sect. 3 : 64
Mississippi Emergency Management Agency
3.2.2 Estimating Losses
Requirement §201.4(c)(2)(iii): The State risk assessment shall include the following elements:
An overview and analysis of potential losses to the identified vulnerable structures, based on estimates provided in local risk assessments as well as the State risk assessment. The State shall estimate the potential dollar losses to State-owned or operated buildings, infrastructure, and critical facilities located in the identified hazard areas.
For the identified hazards ranked the highest priority for concern by the HMC, losses were estimated for various hazard scenarios. For other identified hazards, where less data was available, a more simple, overall exposure analysis was conducted. Exposure analysis looks at the overall value of assets in the hazard area or ranked county, whereas loss estimation calculates anticipated losses from specific hazard scenarios (e.g. 100-year flood or Magnitude 7.7 Earthquake).
Summary of Losses
Each hazard identified for inclusion in this plan is presented in separate sections with full details regarding estimated damages sustained and future losses that might be realized based on various scenario ap-proaches.
As a summary, provided below is a comparison of damages sustained to property and crops for hazards tracked through the National Climatic Data Center (NCDC). Since the 2010 plan the NCDC has improved their data collection efforts and are capturing more categories of storms to better understand the varying impacts based on the type of event. The tables below have been updated to reflect the general category of hazards prone to Mississippi and include the totals presented in the last plan to compare to the current totals.
Property Damage
Hazard TypeTotal
2007-2009* 2010 2011 2012Total
2010-2012Coastal Storms $11,069,000 None Reported $85,000 $12,175,000 $12,260,000
Drought N/A $500,000 None Reported None Reported $500,000Extreme Winter Weather $1,320,000 $7,595,000 $25,845,000 None Reported $43,440,000
Flood/Heavy Rain $31,718,000 $15,885,000 $1,026,940,000 $6,874,000 $1,049,699,000
Severe Weather N/A $9,228,000 $22,618,000 $10,145,050 $41,991,050
Tornado $124,717,000 $365,713,000 $572,937,000 $9,804,000 $948,454,000 Source: NCDC and *2010 Plan totals

Sect. 3 : 65
Mississippi Emergency Management Agency
Crop Damage
Hazard TypeTotal
2007-2009* 2010 2011 2012Total
2010-2012Extreme Winter Weather $1,320,000 None Reported $240,000 None Reported $240,000
Coastal Storms None Reported
Flood/Heavy Rain $6,805,000 $50,000 $2,702,000 None Reported $2,752,000
Severe Weather N/A $156,000 $841,000 $16,500 $1,013,500
Tornado $6,897,000 $24,380,000 $14,315,000 None Reported $38,695,000
Drought N/A $27,200,000 None Reported None Reported $27,200,000 Source: NCDC and *2010 Plan totals
HAZUS-MH
Computer models to examine effects and consequences of disaster and crisis because alternative mecha-nisms for understanding may prove impossible to safely replicate in the field. Simulation models typically ingest tremendous quantities of data about pre-event conditions and then alter the data according to a set of rules driven by empirical relationships (a Category 3 storm will cause a storm surge of 15’) or mechanis-tic components using detailed numeric solutions (winds of 120 mph will increase surface water speeds due to friction, wind friction water will pile up against a coast line as shoreline depth decreases, accumulation of water will cause a storm surge of 15’). Alterations in the data provide the user with results which may be misinterpreted. Thus, two basic factors affect the accuracy and value of modeling results: a) the quality of data used to initialize the model and b) the level of understanding and detail used to simulate processes affecting input data.
HAZUS-Multi Hazard (HAZUS-MH) is a suite of modeling software driven by geographic information systems software. HAZUS provides three levels of analysis based on the level of effort and expertise employed by the user (reference: http://www.fema.gov/HAZUS/HAZUS-multi-hazard-analysis-levels). Users can improve the accuracy of HAZUS loss estimates by furnishing more detailed data about their community or additional engineering expertise on the building inventory. The following describes the information and expertise needed for each level:
Level 1: A basic estimate of earthquake, flood and hurricane wind losses is produced based on national databases and expert-based analysis parameters included in the HAZUS software. This is commonly referred to as an “out-of-the-box” or “default” loss estimate. FEMA’s Basic HAZUS-MH course (E313) enables a user to run Level 1 loss estimation. There may be exceptions for what is considered Level 1 based on unique conditions for a specific study region. For example, if available in HAZUS-compatible format, soils maps can play a significant role in enhancing the quality of an earthquake loss estimate in a particular region.

Sect. 3 : 66
Mississippi Emergency Management Agency
Level 2: More accurate loss estimates are produced by including detailed information on local hazard conditions and/or by replacing the national default inventories with more accurate local inventories of buildings, essential facilities and other infrastructure. Although there is no standard way to perform a Level 2 study, priority should be given to information that better defines the hazard. Sensitivity studies guide the user in focusing time and resources on the type of information to improve the loss estimate for their study region. There are many professionals able to assist with a Level 2 analysis. These include geologists and hydrologists to improve hazard map data, GIS professionals to improve national default inventories, and engineers to improve the classifications of building types and vulnerabilities. Some background in loss estimation and experience in using HAZUS is normally required for a Level 2 analysis.
Level 3: These state-of-the-art loss estimates include all hazard and inventory improvements in a Level 2 study, plus expert adjustment of analysis parameters and use of advanced HAZUS capabilities, such as the Advanced Engineering Building Module (AEBM) and the Potable Water System Analysis Model (POWSAM). A Level 3 effort requires participation by earth scientists, structural engineers, land use planners and/or emergency managers to provide an accurate inventory and assessment of community vulnerability, as well as a high degree of expertise in HAZUS’ architecture and file structure.
HAZUS model runs for Mississippi’s State Hazard Mitigation Plan are typically conducted at Level 1, because each increasing level of modeling complexity requires substantial investments of time and effort. Basic Level 1 data input is derived from the 2000 Census and does not adequately reflect changes in popu-lation distribution, location of assets, and similar changes. Further, existing state-owned data sets, such as 2’ or better resolution coastal elevation data, do not exist in a format easily consumed by HAZUS and is not used. Instead, the “canned” 30-m resolution National Elevation Dataset data are used. Significant time and effort are needed to combine and format local data for use by HAZUS. Thus, while HAZUS is an excel-lent modeling tool, re-running it every three years without improving the input baseline data simply churns out inaccurate and little changed results. In computer modeling terms, garbage-in equals garbage-out.
This plan update strongly recommends an ongoing modeling effort with baseline data sets consistently up-dated throughout the hazard planning and mitigation process. Running of models such as HAZUS should be separated from the funding of the State Hazard Mitigation Plan and performed in-house on an ongoing basis. This would allow the most current and accurate modeling efforts to be updated to the plan without restricting efforts because of the relatively limited time period and funding levels associated with this plan.

Sect. 3 : 67
Mississippi Emergency Management Agency
Flood Mapping
HAZUS and similar models rely predominantly upon FEMA DFIRM and emerging RiskMap products for flood planning. As noted, Mississippi is heavily vested in updating and modernizing the flood mapping program. However, newer data sets which further improve flood estimates than those used to support the DFIRM program are available for many areas of the state and may be manipulated beyond the HAZUS modeling system.
The general process used is to create a regional digital elevation model from like resolution datasets. In this instance, the traditional 30-m National Elevation Dataset is replaced with a 2’ resolution LIDAR data set to indicate bare-earth elevations. This base elevation data set is loaded and viewed in a capable 3D application such as ESRI’s ArcScene.
Figure 3.2.1 shows a high resolution bare-earth digital elevation model providing base elevations for flood planning.
Potential flood elevations are based on the current sea state as measured above Mean Sea Level (MSL) and initially depicted by constructing a flat plane representative of the area of interest as shown in the il-lustration below. The plane is assigned an elevation equal to that of mean sea level.
The blue area in Figure 3.2.2 depicts the area of interest for potential storm surge modeling along coastal Mississippi.
Figure 3.2.1Bare-Earth Digital Elevation Model
Figure 3.2.2Storm Surge Modeling

Sect. 3 : 68
Mississippi Emergency Management Agency
The plane is initially intersected in 3D space with the baseline elevation model. The intersection is com-pared with accepted shoreline locations thereby validating the basic modeling approach. The plane is then elevated in 1’ increments and the resulting intersection recorded for each potential flood elevation. This is illustrated in Figure 3.2.3 using Katrina’s maximum inundation depth plus 20’ to simulate extreme circum-stances. The net result is a series of lines and polygons depicting locations likely to flood.
While more sophisticated modeling tools are available, they are not typically suitable for use with large areas, require extensive technical training and additional high-resolution data sets such as soil models and velocity of the flood waters. The approach described herein is lightweight, errs on the side of caution, and is a solid, alternative published methodology which provides easy to interpret results as shown in figure 3.2.4.
Figure 3.2.3Katrina’s Maximum Inundation

Sect. 3 : 69
Mississippi Emergency Management Agency
Figure 3.2.4Intersection of the base elevation data set with flood waters
A similar methodology may be used for riverine flooding, levee breach, and dam failure, however these results are overestimated for large geographic areas as a flat plane will not account for natural downstream slope.
As a final step, aerial photography may be draped over the base elevation and additional critical infrastruc-ture data added to the scene. This allows users to explore potential flooding from numerous perspectives or create fly-through videos exploring the potential flooding which may be readily shared. This methodol-ogy was most recently employed by MEMA during the Percy Quin State Park Dam failure which accompa-nied the flooding rains of Hurricane Isaac in 2012.

Sect. 3 : 70
Mississippi Emergency Management Agency
3.3: Tornado Risk Assessment
Hazard DescriptionTornadoes are nature’s most violent storms. Spawned from powerful thunderstorms, tornadoes can cause fatalities and devastate a neighborhood in seconds. A tornado appears as a rotating, funnel-shaped cloud extending from a thunderstorm to the ground with whirling winds that can reach 300 miles per hour. Dam-age paths can be in excess of one mile wide and 50 miles long. Every state is at some risk from this haz-ard. Some tornadoes are clearly visible, while rain or nearby low-hanging clouds obscure others. Occasion-ally, tornadoes develop so rapidly that little, if any, advance warning is possible. Before a tornado hits, the wind may die down and the air may become very still. A cloud of debris can mark the location of a tornado even if a funnel is not visible. Tornadoes generally occur near the trailing edge of a thunderstorm. It is not uncommon to see clear, sunlit skies behind a tornado.
Quick facts about tornadoes:• They may strike quickly, with little or no warning. • They may appear nearly transparent until dust and debris are picked up or a cloud forms in the
funnel. • The average tornado moves southwest to northeast, but tornadoes have been known to move in
any direction. • The average forward speed of a tornado is 30 mph, but may vary from stationary to 70 mph. • Tornadoes can accompany tropical storms and hurricanes as they move onto land. • Waterspouts are tornadoes formed over water. • Tornadoes are most frequently reported east of the Rocky Mountains during spring and summer
months. • Peak tornado season in the southern states is March through May; in the northern states, it is late
spring through early summer. • Tornadoes are most likely to occur between 3 pm and 9 pm, but can occur at any time.
Prior to February 2007, the Fujita Scale was used to measure tornado severity (Table 3.2.1).
Table 3.2.1Pre-2007 Fujita Scale
F-Scale Number Intensity Phrase Wind Speed F-Scale
Number Intensity Phrase Wind Speed
F0 Gale tornado 40-72 mph F3 Severe tornado 158-206 mph
F1 Moderate tornado 73-112 mph F4 Devastating tornado 207-260 mph
F2 Significant tornado 113-157 mph F5 Inconceivable tornado 261-318 mphSource: NOAA

Sect. 3 : 71
Mississippi Emergency Management Agency
The Enhanced Fujita Scale, or EF Scale (Table 3.2.2), is the current scale for rating the strength of torna-does in the United States; magnitude is estimated via the damage left behind by the tornado. Implemented in February 2007, it replaced the Fujita Scale. The scale has the same basic design as the original Fujita Scale, six categories from zero to five, representing increasing degrees of damage. The new scale takes into account how most structures are designed, and is thought to be a much more accurate representation of the surface wind speeds in the most violent tornadoes.
Table 3.2.2Enhanced Fujita Scale
Enhanced Fujita Category
Wind Speed (mph) Potential Damage
EF0 65-85Light damage. Peels surface off some roofs; some dam-age to gutters or siding; branches broken off trees; shallow-rooted trees pushed over.
EF1 86-110Moderate damage. Roofs severely stripped; mobile homes overturned or badly damaged; loss of exterior doors; win-dows and other glass broken.
EF2 111-135Considerable damage. Roofs torn off well-constructed houses; foundations of frame homes shifted; mobile homes completely destroyed; large trees snapped or uprooted; light-object missiles generated; cars lifted off ground.
EF3 136-165
Severe damage. Entire stories of well-constructed houses destroyed; severe damage to large buildings such as shopping malls; trains overturned; trees debarked; heavy cars lifted off the ground and thrown; structures with weak foundations blown away some distance.
EF4 166-200Devastating damage. Well-constructed houses and whole frame houses completely leveled; cars thrown and small missiles generated.
EF5 >200
Incredible damage. Strong frame houses leveled off foundations and swept away; automobile-sized missiles fly through the air in excess of 100 m (109 yd); high-rise buildings have significant structural deformation; incredible phenomena will occur.
Source: NOAA
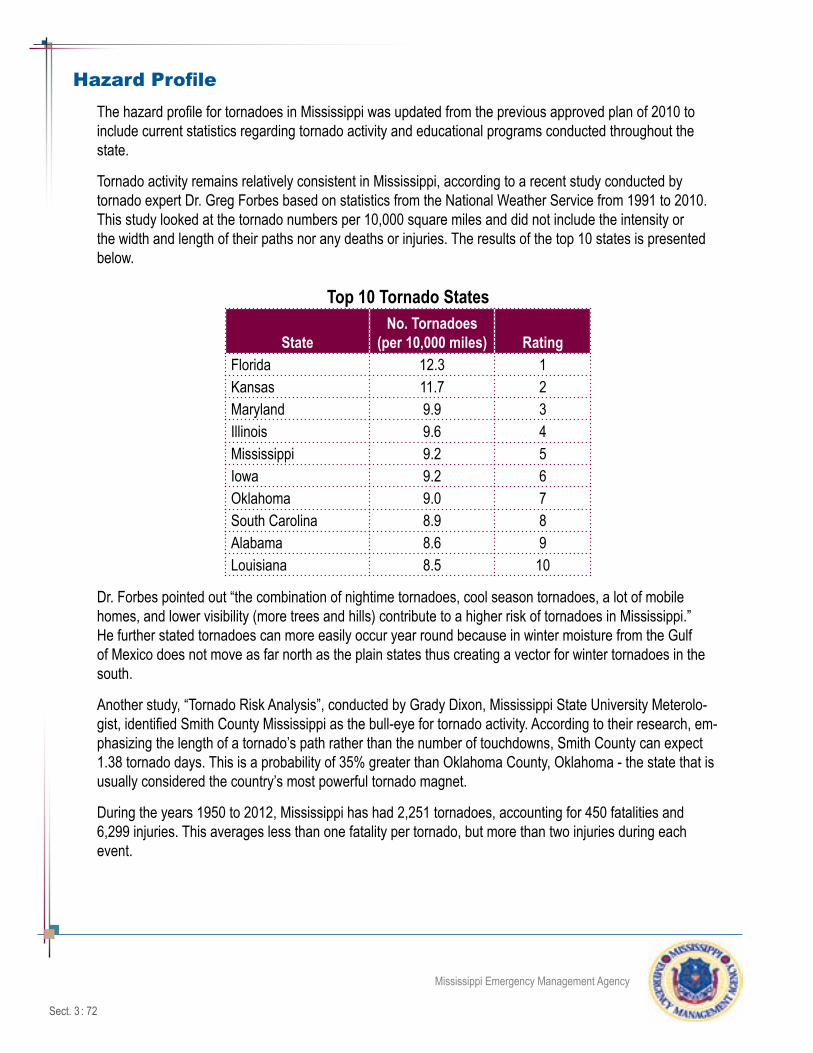
Sect. 3 : 72
Mississippi Emergency Management Agency
Hazard ProfileThe hazard profile for tornadoes in Mississippi was updated from the previous approved plan of 2010 to include current statistics regarding tornado activity and educational programs conducted throughout the state.
Tornado activity remains relatively consistent in Mississippi, according to a recent study conducted by tornado expert Dr. Greg Forbes based on statistics from the National Weather Service from 1991 to 2010. This study looked at the tornado numbers per 10,000 square miles and did not include the intensity or the width and length of their paths nor any deaths or injuries. The results of the top 10 states is presented below.
Top 10 Tornado States
StateNo. Tornadoes
(per 10,000 miles) RatingFlorida 12.3 1Kansas 11.7 2Maryland 9.9 3Illinois 9.6 4Mississippi 9.2 5Iowa 9.2 6Oklahoma 9.0 7South Carolina 8.9 8Alabama 8.6 9Louisiana 8.5 10
Dr. Forbes pointed out “the combination of nightime tornadoes, cool season tornadoes, a lot of mobile homes, and lower visibility (more trees and hills) contribute to a higher risk of tornadoes in Mississippi.” He further stated tornadoes can more easily occur year round because in winter moisture from the Gulf of Mexico does not move as far north as the plain states thus creating a vector for winter tornadoes in the south.
Another study, “Tornado Risk Analysis”, conducted by Grady Dixon, Mississippi State University Meterolo-gist, identified Smith County Mississippi as the bull-eye for tornado activity. According to their research, em-phasizing the length of a tornado’s path rather than the number of touchdowns, Smith County can expect 1.38 tornado days. This is a probability of 35% greater than Oklahoma County, Oklahoma - the state that is usually considered the country’s most powerful tornado magnet.
During the years 1950 to 2012, Mississippi has had 2,251 tornadoes, accounting for 450 fatalities and 6,299 injuries. This averages less than one fatality per tornado, but more than two injuries during each event.

Sect. 3 : 73
Mississippi Emergency Management Agency
The fewest tornadoes recorded during one year in Mississippi were five in 1964. The greatest number of tornadoes in Mississippi recorded by the National Weather Service was 136 in 2011.
Tornadoes are not as easily spotted in Mississippi as they are in the Midwest where flat land and few trees make tornadoes more visible. Densely populated counties and communities throughout Mississippi tend to record more sightings of tornadoes than rural and less populated areas. It should be noted tornadoes are often associated with severe weather events such as thunderstorms. Due to the climate conditions in Mis-sissippi, tornadoes can occur in every month of the year, but have a greater frequency during the period of February through May and November.
Education and Outreach
The state of Mississippi declared November Tornado Awareness Month as part of the state’s effort to edu-cate the public on tornado safety. In addition, a statewide test of the tornado warning system is conducted in February in conjunction with Severe Weather Awareness Week. The purpose is to encourage schools, government agencies and businesses throughout the state to test their tornado emergency procedures.
Maximum Tornado Threat
A review of past tornado occurrences reveals Hinds and Rankin Counties (68 events) had the most re-corded tornadoes from 1950 – 2012. Jackson, the state capitol, is located in Hinds County and is the seat of county and state government. Jackson is also the site of several hospitals and numerous public and private schools and universities. The number of fatalities could be more than 100 should a severe tornado strike during business hours in Hinds County.
Columbus Mississippi, November 2002
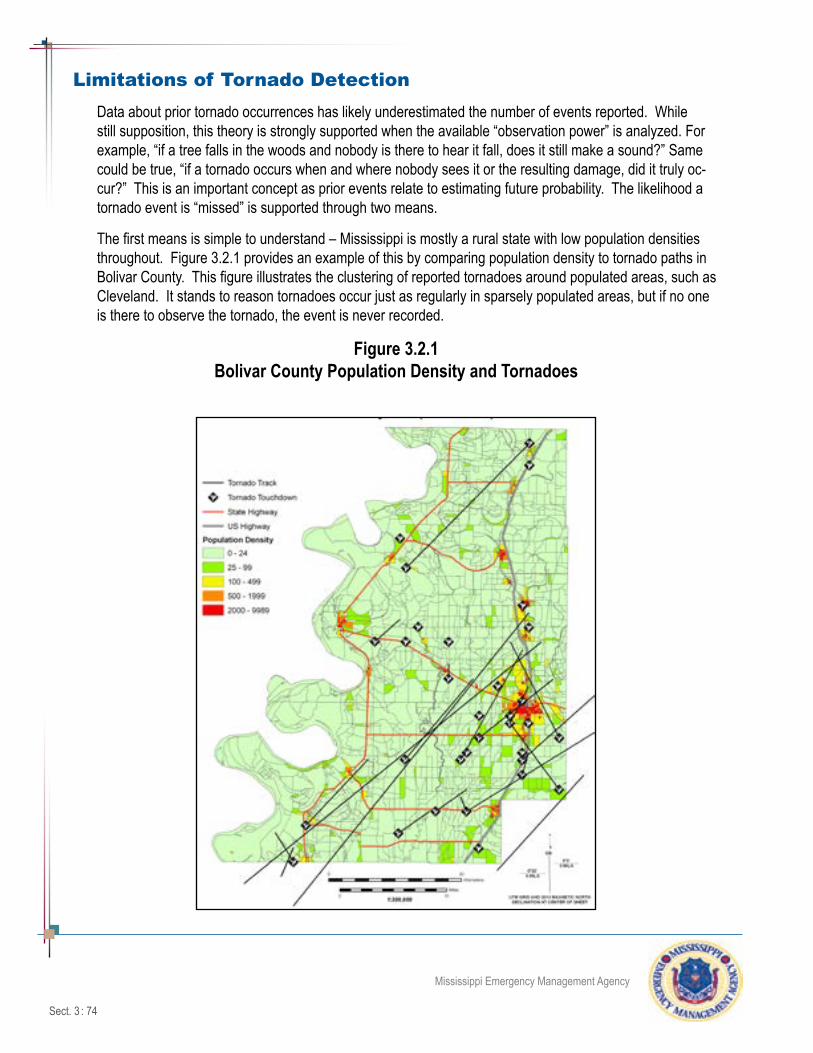
Sect. 3 : 74
Mississippi Emergency Management Agency
Limitations of Tornado DetectionData about prior tornado occurrences has likely underestimated the number of events reported. While still supposition, this theory is strongly supported when the available “observation power” is analyzed. For example, “if a tree falls in the woods and nobody is there to hear it fall, does it still make a sound?” Same could be true, “if a tornado occurs when and where nobody sees it or the resulting damage, did it truly oc-cur?” This is an important concept as prior events relate to estimating future probability. The likelihood a tornado event is “missed” is supported through two means.
The first means is simple to understand – Mississippi is mostly a rural state with low population densities throughout. Figure 3.2.1 provides an example of this by comparing population density to tornado paths in Bolivar County. This figure illustrates the clustering of reported tornadoes around populated areas, such as Cleveland. It stands to reason tornadoes occur just as regularly in sparsely populated areas, but if no one is there to observe the tornado, the event is never recorded.
Figure 3.2.1Bolivar County Population Density and Tornadoes

Sect. 3 : 75
Mississippi Emergency Management Agency
While the advent and use of advanced weather radar systems has greatly improved warning times for tornadoes, these systems are prone to blind spots and false positives. Weather radar projects a powerful beam of radiation upward at a very slight angle, typically 0.5 degrees from the horizontal. When this beam strikes objects in the atmosphere, such as water molecules and debris, it is reflected back toward the radar system and the intensity is measured as reflectivity in decibels as shown in Figure 3.2.2a. More advanced radar systems, such as the Wx88-D NEXRAD system, are capable of determining whether rain or debris suspended in the atmosphere is moving toward the radar or away from it and at what speed the object is moving (storm relative velocity). Concentrated areas of opposing winds, such as those presented in Figure 3.2.2b, suggest the presence of a tornado. This permits radar systems and their operators to detect rotat-ing updrafts, hook echos, and similar features associated with tornadic storms.
Figure 3.2.2a and b Weather Radar Imagery
As with population density, the density of Wx88-D NEXRAD systems is limited. Figure 3.2.3 shows the location of Wx88-D NEXRAD radar stations in the United States. As previously mentioned, radar beams from these sites travel upward at a minimum angle of 0.5 degrees. This renders the maximum range of these systems to approximately 124 miles (Figure 3.5.4). While Mississippi has consistently ranked at the top of the list for tornado events, there is only one National Weather Service weather radar system in the state. As suggested by Figure 3.5.5 for northwestern Mississippi, this leaves potentially significant gaps in coverage, especially when one considers the “surfaced-based” nature of convective storms producing tornadoes in Mississippi (the base altitude or ceiling for tornado-producing thunderstorms can be as low as 500-1,000 feet above ground level) – a tornado can, quite literally, “sneak under the radar”.

Sect. 3 : 76
Mississippi Emergency Management Agency
Figure 3.5.3National Dopplar Radar Sites
The consequences of poor radar coverage is illustrated by the January 23, 2012 tornado which struck the village of Alligator. The National Weather Service was unable to provide a warning about this storm due to the relatively low altitude of the tornadic circulation, the relatively weak nature of the tornado (EF-1), and its distance from dual-pole radar systems. Yet significant damage was done in this rural village which lacks building codes and adequate shelter. Figure 3.5.5 shows an example of the radar gaps in northwest Missis-sippi.
Figure 3.5.5Radar Gaps in the Mississippi

Sect. 3 : 77
Mississippi Emergency Management Agency
Location / Past Occurrences
As previously stated, Mississippi is no stranger to tornado/severe weather threats and has had 29 Presi-dentially declared events since 1953 as shown in Table 3.2.3. Brief descriptions of the events that occured over the past ten years and summaries from the NCDC and FEMA on the impacts to people and property, plus the public assistance dollars obligated is provided following the table.
Tornado damage in Alligator, Mississippi Courtesy of the Cleveland Current

Sect. 3 : 78
Mississippi Emergency Management Agency
Table 3.2.3Presidential Disaster Declarations - Tornado/Severe Weather
Declaration Number Incident Period
No. of Counties Affected
Date of Major Declaration
DR-4101 February 10 - 22, 2013 6 February 13, 2013DR-1972 April 15 - 28, 2011 37 April 29, 2011DR-1916 May 1 - 2, 2010 8 May 14, 2010DR-1906 April 23 - 24, 2010 7 April 29, 2010DR-1837 March 25 - 28, 2009 11 May 12, 2009DR-1764 April 4, 2008 1 May 28, 2008DR-1470 May 5 - 8, 2003 9 May 23, 2003DR-1459 April 6 - 25, 2003 14 April 24, 2003DR-1443 November 10 - 11, 2002 3 November 14, 2002DR-1398 November 24 - December 17, 2001 17 December 7, 2001DR-1360 February 16 - March 15, 2001 23 February 23, 2001DR-1051 May 8 - 17, 1995 4 May 12, 1995DR-968 November 21 - 22, 1992 9 November 25, 1992DR-967 October 10, 1992 1 October 17, 1992DR-939 March 9 - 10, 1992 4 March 20, 1992DR-906 April 26 - May 31, 1991 32 May 17, 1991DR-888 December 19, 1990 - January 14, 1991 12 January 3, 1991DR-859 January 24 - March 15, 1990 21 February 28, 1990DR-787 February 28, 1987 1 March 5, 1987DR-703 March 28 - 29, 1984 2 April 26, 1984DR-683 June 1, 1983 5 June 1, 1983DR-678 April 16, 1983 12 April 16, 1983DR-618 April 19, 1980 7 April 19, 1980DR-577 April 16, 1979 32 April 16, 1979DR-499 April 1, 1976 4 April 1, 1976DR-456 January 30, 1975 2 January 30, 1975DR-368 March 27, 1973 51 March 27, 1973DR-302 February 22, 1971 23 February 22, 1971DR-14 December 6, 1953 Not Available December 6, 1953
Source: FEMA Disaster Declarations-Mississippi

Sect. 3 : 79
Mississippi Emergency Management Agency
DR-4101 - February 10 - 22, 2013
During the morning hours of Sunday, February 10, 2013, a line of severe thunderstorms moved into southeast Arkansas, northeast Louisiana, and central Mississippi, downing trees and power lines and destroying a barn near Silver City in Humphreys County. An approaching cold front, an unusually high amount of wind shear, and sufficient instability resulted in the severe weather outbreak.
As the storms continued to push eastward through the early afternoon, the cold front began to stall, and the entire weather system slowed down. To the south and east of the line of storms, several supercell thunderstorms developed in the more unstable air mass over south Mississippi, with many of the storms exhibiting strong rotation on radar. Shortly after 4 pm, a tornado developed over southwest Marion County near the Pickwick community and tracked across the county into far western Lamar County before lifting.
The same storm that produced this tornado continued eastward across northern Lamar County, producing a large tornado that touched down west of Oak Grove, with EF-4 winds estimated at 170 mph, and tracked through the very populated West Hattiesburg area. Emergency management reported 51 homes destroyed and 170 with major damage in Lamar County.
The tornado continued into Forrest County, tracking through the cities of Hattiesburg and Petal before ending in northwestern Perry County. Considerable damage occurred along the path of this storm before impacting the southeast corner of the University of Southern Mississippi campus. Numerous buildings were damaged in this area including several campus buildings and a large church. In Forrest County, emergency management reported 133 homes destroyed, 207 sustained major damage, and 63 injuries suffered. Scat-tered severe storms continued to affect the Pine Belt area through the remainder of Sunday evening and into the early morning hours of Monday, February 11, before finally moving out of the area.
In addition to severe winds, flash flooding was a major issue in several areas. From the 10th through the early morning hours of the 11th, heavy rainfall occurred over parts of southeast Mississippi, with five to seven inches of rain fall and flash flooding reported in the area. Rainfall amounts of up to 3 1/2 inches oc-curred in the Jackson metro area, leading to considerable flash flooding. Quick rises occurred on several streams in the city of Jackson.
Impact Summary Public Assistance Dollars Obligated Declared Counties
• No. of Counties Affected: 8• Deaths: 0• Injuries: 74• Estimated Property Damage: $39.315,000
Total PA Grants Emergency Work (Categories A-B)
Permanent Work (Categories C-G)
$4,451,913.70 $3,014,539.56 $1,437,374.14Source: NCDC Source: FEMA June 20, 2013

Sect. 3 : 80
Mississippi Emergency Management Agency
DR-1972 – April 15-28, 2011
A historic outbreak of tornadoes across Arkan-sas, Louisiana, and Mississippi began late on Tuesday, April 26th continuing into the early morning hours of Wednesday, April 27th. The event ramped up again during the early af-ternoon of April 27th continuing into the early evening. The activity on April 26th began as supercell thunderstorms producing large hail and tornadoes across northeast Texas and portions of Arkansas before evolving into a squall line as it moved east.
This line of storms evolved through many stages as it moved across several states before dis-sipating. It produced wind damage as it pushed east and was responsible for 23 of the 32 tornadoes that occurred across the three-state area during this event. Of those 23, 12 were rated as strong (EF2, EF3) tornadoes and had fairly long tracks.
Wednesday morning the atmosphere once again became increasingly favorable for producing additional severe storms by early afternoon. The driving force for the activity Wednesday afternoon was a potent low-pressure area at the surface that intensified during the day. The winds in the mid level atmosphere increased to 80-100 mph, causing the low level winds to become stronger. The wind shear caused by the turning of the winds from southerly near the surface to westerly aloft was at rare levels for late April over the Deep South.
In addition, an abundance of low level moisture returned to the area. Sunny skies during the morning in-teracted with the high levels of moisture, eventually leading to a very unstable air mass by early afternoon. The result was an extremely rare mix of instability and wind shear. These ingredients, along with lift from a potent upper disturbance, ultimately led to the historic tornado outbreak of April 27, 2011.
By early afternoon, several supercell thunderstorms were developing across central and eastern Missis-sippi. These storms grew to supercell size and began producing tornadoes. The first tornado of the after-noon started in Neshoba County on the north side of Philadelphia. This tornado ended up producing EF-5 damage and tracked for 29 miles across Neshoba, Kemper, Winston and Noxubee Counties - decimating the Town of Smithville.
Through the rest of the afternoon multiple tornadoes developed, stemming from multiple supercell storms. Nearly all of the storms produced tornadoes, many of them significant with long tracks. Another violent tor-nado impacting the Jackson forecast area occurred across Smith, Jasper, and Clarke Counties continuing into Alabama with a total path length of 124 miles across both states.
Loss of life during this historic event was staggering. Unfortunately, 321 people lost their lives, making this the second deadliest tornado outbreak in U.S. history. The March 18, 1925 Tri-State tornado outbreak was the first with 747 fatalities. This system produced the first EF-5 tornado in Mississippi since the Candlestick

Sect. 3 : 81
Mississippi Emergency Management Agency
Park tornado on May 3, 1966, and marks the first time since statistics have been kept that two EF-5 torna-does have been recorded on the same day in Mississippi, with the tornado in Smithville also rated as EF-5. Four tornadoes had path lengths over 100 miles across the southern states during this event, and all four of these were rated either EF-4 or EF-5.
Impact Summary Public Assistance Dollars Obligated Declared Counties
• No. of Counties Affected: 47• Deaths: 32• Injuries: 170• Estimated Property Damage: $56,461,000
Total Public Assistance
Grants
Emergency Work (Categories A-B)
Permanent Work (Categories C-G)
$22,811,869.44 $11,648,398.71 $11,163,470.73Source: NCDC Source: FEMA June 20, 2013
DR-1916 – May 1-2, 2010
An upper level disturbance slowly approached the Midsouth during the evening of April 30, 2010 as a cold front became stationary to the west. This pattern remained in place throughout the next two days as south to southwest winds pumped warm moist air northward from the Gulf of Mexico and created a very unstable atmo-sphere.
Showers and thunderstorms developed with the front and moved east into Eastern Arkansas. Additional thunderstorms occurred in associa-tion with the upper level disturbance, and due to the unstable atmosphere quickly became severe, produc-ing large hail, damaging winds, and flash flooding.
The severe weather evolved into an outbreak over May 1st and 2nd. Historic rainfall, flash flooding, large hail, and damaging winds occurred during the early morning hours of May 1st with several tornadoes occur-ring during the afternoon hours of May 1st to the early morning hours of May 2nd. The following Mississippi counties were impacted: Alcorn, Benton, Marshall, Panola, Prentiss, Tippah, Tishomingo and Union.
Impact Summary Public Assistance Dollars Obligated Declared Counties
• No. of Counties Affected: 8• Deaths: 3• Injuries: 7• Estimated Property Damage: $1,945,000
Total Public Assistance
Grants
Emergency Work (Categories A-B)
Permanent Work (Categories C-G)
$8,490,951.98 $1,553,139.25 $6,833,558.53Source: NCDC Source: FEMA June 20, 2013

Sect. 3 : 82
Mississippi Emergency Management Agency
DR-1906 – April 23-24, 2010
During the midday hours of April 24, 2010, an intense supercell thunderstorm produced a violent, long-track tornado, which ripped a path across the center of the Nation Weather Service’s Jackson, MS forecast area. This tornado touched down just south of Interstate 20 west of Tallulah in Madison Parish, Louisiana. The tornado intensified quickly and became larger as it tracked at a fast pace to the northeast. The tornado, moving at about 55 mph, was on the ground for 149 miles. Actual time on the ground was 2 hours, 44 minutes.
The tornado touched a total of nine counties and parishes along its path, with the most significant dam-age occurring in Madison Parish, Louisiana and Warren, Yazoo, Holmes, Attala and Choctaw Counties in Mississippi. Much of the damage was in the EF2 and EF3 ranges, with some EF4 damage in Yazoo and Holmes Counties. Maximum winds were 170 mph. The storm caused 10 fatalities and 146 injuries. Five fatalities occurred in Choctaw County, four in Yazoo County, and one in Holmes County.
This tornado’s path ranks as the fourth-longest in Mississippi history. It is the widest known tornado, with a maximum width of 1.75 miles. It also ranks as the ninth deadliest Mississippi tornado with 10 fatalities, mak-ing it the most deadly since November 21, 1992. It was the first violent tornado (F4 or greater) in the month of April since April 18, 1978.
Impact Summary Public Assistance Dollars Obligated Declared Counties
• No. of Counties Affected: 17• Deaths: 10• Injuries: 131• Estimated Property Damage: $353,930,000
Total Public Assistance
Grants
Emergency Work (Categories A-B)
Permanent Work (Categories C-G)
$5,913,851.92 $1,731,223.26 $3,962,435.26Source: NCDC Source: FEMA June 6, 2013

Sect. 3 : 83
Mississippi Emergency Management Agency
DR-1837 - March 25-28, 2009
A round of severe thunderstorms containing tornadoes and damaging straight line winds occurred Wednes-day night, March 25th, lasting into early Thursday morning, March 26th. These storms developed as a strong upper level disturbance encountered an unstable environment over the lower Mississippi Valley. A squall line of showers and thunderstorms pushed rapidly eastward across the area. One supercell storm formed ahead of the main line and produced a strong tornado, hitting the town of Magee, Mississippi. Eight tornadoes were confirmed from this event. Of the eight tornadoes, one was rated EF3, one was rated EF2, four were rated EF1, and two were rated EF0. Numerous other locations experienced damaging straight-line winds in excess of 60-70 mph. The worst damage occurred from a tornado which laid a 17.5 mile track across Simpson and Smith counties. This storm was rated as EF3, with estimated 150 mph maxi-mum winds near Magee. A second tornado, rated EF2 with 125 mph winds, affected Jones County near Soso.
Impact Summary Public Assistance Dollars Obligated Declared Counties
• No. of Counties Affected: 12• Deaths: 0• Injuries: 27• Estimated Property Damage: $8,979,000
Total Public Assistance
Grants
Emergency Work (Categories A-B)
Permanent Work (Categories C-G)
$2,708,557.61 $345,746.27 $2,329,689.34Source: NCDC Source: FEMA June 6, 2013

Sect. 3 : 84
Mississippi Emergency Management Agency
DR 1764 April 4, 2008
A potent early-April storm slammed into the I-20 corridor from northeast Louisiana to east-central Mississippi, affecting the Jackson Met-ro area eastward to Meridian with widespread wind damage and several tornadoes. A line of thunderstorms produced the severe weather and damage. Several extensive swaths of significant wind damage occurred Winds were estimated at 80 mph or greater.
Several thousand trees were snapped or uprooted and several dozen homes were damaged by downed trees. The strongest tornado occurred in the Jackson Metro area as it moved across Northeast Jackson and into the Reservoir area of Northwest Rankin County. Additionally, significant wind damage occurred across portions of Vicksburg, Bolton, Jackson, the Reservoir area of Rankin County, the Hillsboro area in Scott County, northern Newton County and the northern half of Lauderdale County.
The storm contained one of the most significant straight-line wind events to impact the Jackson Metropoli-tan area and the city of Vicksburg, with central Mississippi damages exceeding those of Hurricane Katrina.
Impact Summary Public Assistance Dollars Obligated Declared Counties
• No. of Counties Affected: 4• Deaths: 0• Injuries: 21• Estimated Property Damage: $47,475,000
Total Public Assistance
Grants
Emergency Work (Categories A-B)
Permanent Work (Categories C-G)
$4,713,231.46 $4,478,955.17 $81,686.29Source: NCDC Source: FEMA June 6, 2013
To further demonstrate our state’s vulnerability to tornadoes, a map is provided on the subsequent page (Figures 3.2.1) that reflects the tornado touchdown points during the recorded period based on histori-cal information gathered by the NCDC. Densely populated counties such as Hinds, Rankin, and Harrison reported more tornadoes than less populated counties. This may be because visual confirmation is required by the National Weather Service for a tornado to be listed in their database.
In addition to the map, the number of tornadoes is also listed in graphs by county in each MEMA Region. Though tornado risk is statewide, the data clearly shows the counties in MEMA Region 5 with 426 torna-does is historically more at risk than MEMA Region 1 with 138 past occurrences. Together the map and the tables, based on historical records, clearly show Mississippi is frequently and extensively in the path of tornadoes.

Sect. 3 : 85
Mississippi Emergency Management Agency
Figure 3.2.1 Recorded Tornado Events 1950 to 2012

Sect. 3 : 86
Mississippi Emergency Management Agency
Probability of Future Tornado EventsAccording to the National Weather Service in Jackson, tornado occurrence is too random to scientifically establish the probability of future events in any one county. Tornadoes occurred and could reoccur in any of Mississippi’s 82 counties. The recorded period shows an average of 36 tornado events per year throughout the state of Mississippi.
Past occurrences indicate more densely populated counties, such as Harrison, Hinds, Jackson, Jones, Rankin and Smith have experienced a greater number of tornadoes. Based solely on historical data the counties with the greatest number of past occurrences are those with the greatest perceived risk of reoc-currence.
Tornado Watches
Figure 3.2.2. below further demonstrates Mississippi’s vulnerability to potential tornado outbreaks. This graphic shows from 1993 - 2012 the watches per county departure range from 6 to -5.
Figure 3.2.2Tornado Watches 1993 - 2012

Sect. 3 : 87
Mississippi Emergency Management Agency
27 23
18 14
9 18
9 10 10
0 5 10 15 20 25 30
CohomaDeSoto
GrenadaPanola
QuitmanTallahatchie
TateTunica
Yalobusha
Total Events for Region 138 1950 to 2012
Coun
ty
MEMA Region 1
No. of Events
19 7
11 19
22 18 18
21 15 15
19
0 5 10 15 20 25
AlcornBenton
ItawambaLafayette
LeeMarshallPontotoc
PrentissTippah
TishomingoUnion
Total Events for Region 184 1950 to 2012
Coun
ty
MEMA Region 2
No. of Events
34 44
17 34
29 43
17 32
27
0 5 10 15 20 25 30 35 40 45 50
AttalaBolivarCarroll
HolmesHumphreys
LefloreMontgomery
SunflowerWashington
Total Events for Region 277 1950 to 2012
Coun
ty
MEMA Region 3
No. of Events
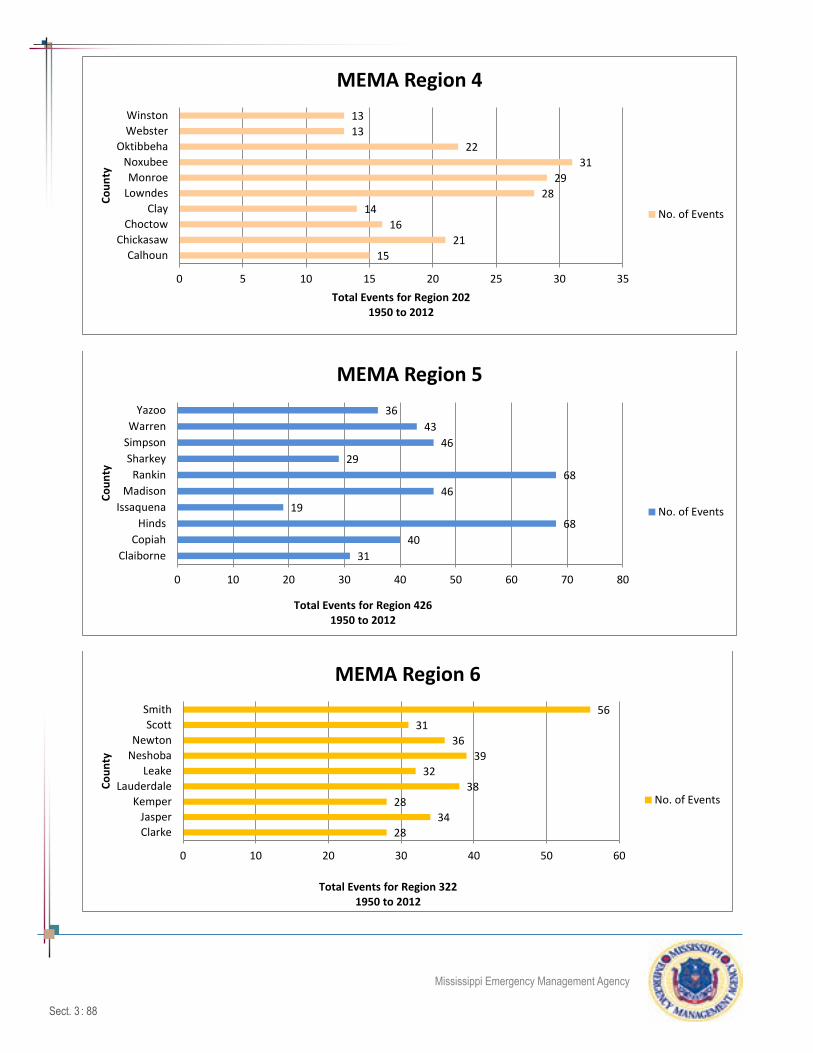
Sect. 3 : 88
Mississippi Emergency Management Agency
15 21
16 14
28 29
31 22
13 13
0 5 10 15 20 25 30 35
CalhounChickasaw
ChoctowClay
LowndesMonroe
NoxubeeOktibbeha
WebsterWinston
Total Events for Region 202 1950 to 2012
Coun
ty
MEMA Region 4
No. of Events
31 40
68 19
46 68
29 46
43 36
0 10 20 30 40 50 60 70 80
ClaiborneCopiah
HindsIssaquena
MadisonRankin
SharkeySimpsonWarren
Yazoo
Total Events for Region 426 1950 to 2012
Coun
ty
MEMA Region 5
No. of Events
28 34
28 38
32 39
36 31
56
0 10 20 30 40 50 60
ClarkeJasper
KemperLauderdale
LeakeNeshobaNewton
ScottSmith
Total Events for Region 322 1950 to 2012
Coun
ty
MEMA Region 6
No. of Events

Sect. 3 : 89
Mississippi Emergency Management Agency
14 20
10 23 23
37 21
20 9
0 5 10 15 20 25 30 35 40
AdamsAmite
FranklinJeffersonLawrence
LincolnPike
WalthallWilkinson
Total Events for Region 177 1950 to 2012
Coun
ty
MEMA Region 7
No. of Events
26 33
19 23
56 26
29 14
18
0 10 20 30 40 50 60
CovingtonForrestGreene
Jefferson DavisJones
LamarMarion
PerryWayne
Total Events for Region 244 1950 to 2012
Coun
ty
MEMA Region 8
No. of Events
13
43
67
47
41
19
0 10 20 30 40 50 60 70 80
George
Hancock
Harrison
Jackson
Pearl River
Stone
Total Events for Region 230 1950 to 2012
Coun
ty
MEMA Region 9
No. of Events

Sect. 3 : 90
Mississippi Emergency Management Agency
Assessing Vulnerability of People to TornadoesAs described above, virtually any person working in a building above ground or living in a dwelling above ground is vulnerable to the wrath of a tornado. Mobile/manufactured homes are particularly vulnerable and as shown in Table 3.2.4 these structures are a substantial percentage of housing throughout the state. Without appropriate warning or access to a tornado shelter, they can rapidly become involved in a life-threatening situation.
People who are outside of the siren warning area, have no link to conventional communications such as telephone, and do not have a NOAA weather radio are also at risk. People with special needs and/or home-bound due to medical problems are especially vulnerable. Those who are reliant on medical care such as insulin and oxygen are likely dependent on electricity and ventilation systems. This makes them especially vulnerable to tornadoes in the event they cause a disruption in electrical service. Patients in nursing homes and hospitals and patients in need of home health care are particularly vulnerable to loss of power and disruption in public services resulting from a tornado event.
Inadequate individual warning and inadequate shelter during an event contribute to the number of fatalities resulting from any given tornado. Often due to mobility problems or inability to hear or understand warn-ings, the very young, the elderly, and the handicapped are especially vulnerable to tornadoes. It is impera-tive institutions housing these individuals develop a severe weather action plan and conduct frequent drills.
Table 3.2.4 Mobile/Manufactured Housing
County
No. of Mobile/ Manufactured
Housing% of Total Housing County
No. of Mobile/ Manufactured
Housing% of Housing
TotalMEMA Region 1 - Total 16,388
Coahoma 953 8.8% Tallahatchie 1,221 22.0%Desoto 2,747 4.5% Tate 2,581 23.7%Grenada 1,641 16.1% Tunica 946 19.8%Panola 4,237 28.9% Yalobusha 1,493 23.5%Quitman 569 15.7%
MEMA Region 2 - Total 26,873Alcorn 2,718 16.8% Pontotoc 3,381 26.9%Benton 533 12.9% Prentiss 1,346 12.2%Itawamba 2,051 20.2% Tippah 1,997 20.7%Lafayette 2,180 9.8% Tishomingo 1,841 17.9%Lee 4,605 12.6% Union 2,087 18.2%Marshall 4,134 27.9%
MEMA Region 3 - Total 11,462Attala 1,838 20.2% Leflore 1,054 7.9%Bolivar 1,374 9.7% Montgomery 782 15.0%Carroll 1,680 33.2% Sunflower 383 39.0%

Sect. 3 : 91
Mississippi Emergency Management Agency
Holmes 2,185 25.9% Washington 1,672 76.0%Humphreys 494 12.7%
MEMA Region 4 - 18,572Calhoun 986 14.2% Monroe 3,294 20.0%Chickasaw 1,741 23.0% Noxubee 1,896 36.6%Choctaw 778 18.7% Oktibbeha 3,021 14.6%Clay 1,722 18.8% Webster 787 16.5%Lowndes 3,084 11.7% Winston 1,263 14.5%
MEMA Region 5 - Total 28,446Claiborne 1,245 29.4% Rankin 7,865 14.0%Copiah 2,689 22.2% Sharkey 369 17.9%Hinds 4,688 4.5% Simpson 3,123 26.3%Issaquena 234 36.3% Warren 3,610 16.5%Madison 2,340 6.1% Yazoo 2,283 22.6%
MEMA Region 6 - Total 21,796Clarke 2,175 27.5% Neshoba 1,675 21.6%Jasper 1,809 22.1% Newton 2,289 24.4%Kemper 1,148 24.4% Scott 3,109 27.1%Lauderdale 5,263 15.2% Smith 1,938 26.8%Leake 2,390 23.3%
MEMA Region 7 - Total 18,016Adams 1,979 13.5% Lincoln 3,999 26.3%Amite 1,460 22.0% Pike 3,835 21.6%Franklin 1,056 25.4% Walthall 1,910 26.9%Jefferson 1,206 32.6% Wilkinson 1,333 26.4%Lawrence 1,238 20.6%
MEMA Region 8 - Total 23,627Covington 2,038 24.1% Lamar 2,879 12.3%Forrest 2,843 9.7% Marion 2,580 22.0%Greene 1,386 27.0% Perry 1,578 28.7%Jefferson Davis 1,171 19.9% Wayne 3,254 35.3%Jones 5,898 20.8%
MEMA Region 9 - Total 27,626George 2,118 23.0% Jackson 6,918 12.8%Hancock 3,393 16.3% Pearl River 4,841 20.3%Harrison 8,600 10.2% Stone 1,756 24.9%Total Mobile/Manufactured Housing Mississippi 192,806Source: U. S. Census Bureau: 2000 Census and Selected Housing Characteristics 2007-2011 American Community Survey 5-Year Estimates

Sect. 3 : 92
Mississippi Emergency Management Agency
Two figures representing mobile homes in Mississippi are provided. The first (Figure 3.2.3) depicts the total number of mobile homes within each county, whereas the second (Figure 3.2.4) depicts the percentage of mobile homes in relation to total housing stock. In the first case, the total for potential loss may be derived in terms of the number of households which could be displaced. Coastal counties are among the areas with high numbers of mobile homes. Thus widespread vulnerability is present in these communities. In the second instance, percentage of total housing stock provides a measure of potential community impact. For example, while many mobile homes would be destroyed by a hurricane making landfall on the coast, a substantial portion of the population does not live in mobile homes and overall community impact would potentially be lower as a percentage of lost property.
Figure 3.2.3Number of Mobile/Manufactured Housing
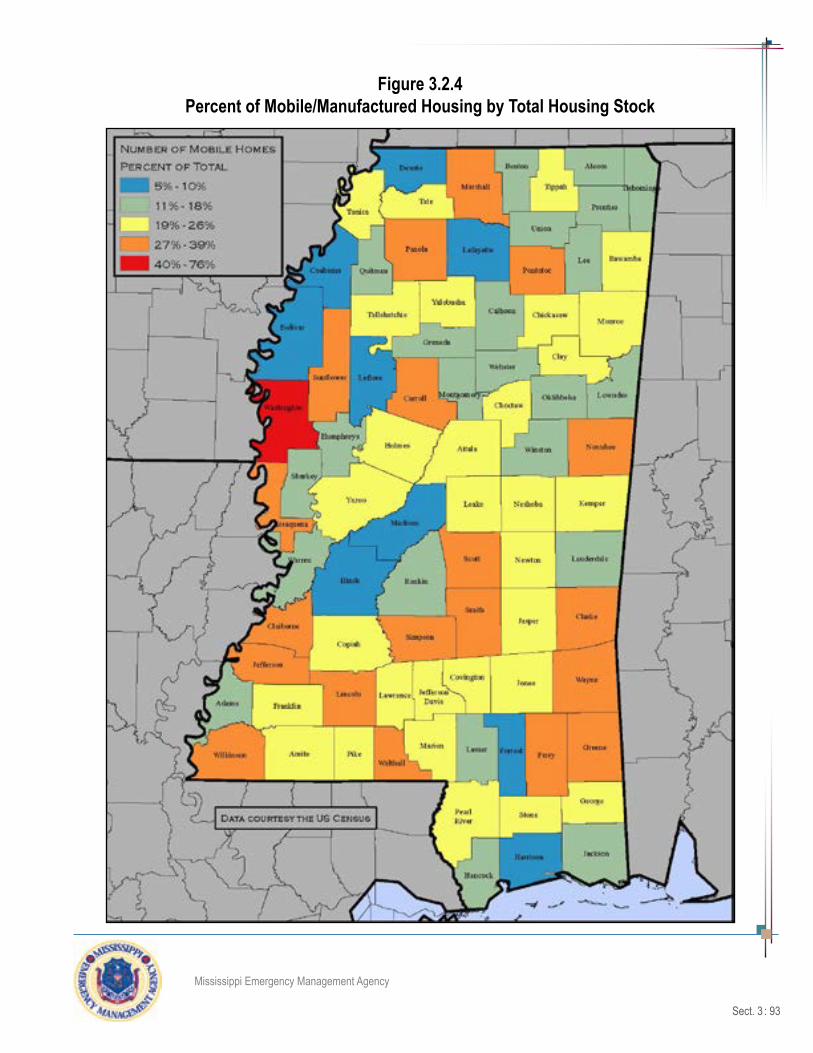
Sect. 3 : 93
Mississippi Emergency Management Agency
Figure 3.2.4Percent of Mobile/Manufactured Housing by Total Housing Stock

Sect. 3 : 94
Mississippi Emergency Management Agency
Loss of Life from Tornadoes
Windborne glass, debris, signs, and shrubs are major causes of injury and death during tornadoes. Virtually any object not tied down or tethered to the ground, including an automobile, can become a deadly airborne projectile.
The western part of the state seems to have suffered a larger number of “killer tornadoes” compared to the rest of the state. Some of the deadliest tornadoes to date occurred in Vicksburg on March 2, 1966, with 58 fatalities and in the Delta Region on February 21, 1971, with 118 fatalities (known as the Delta Outbreak). As mentioned previously, 2005 had the most recorded tornadoes when 120 hit the state of Mississippi.
Vulnerability of Natural Resources to TornadoesTrees and decorative vegetation are all subject to damage from tornadoes. The force of a tornado is power-ful enough to uproot trees and vegetation and deposit the debris in standing water, resulting in a polluted drinking water supply.
Wildlife and farm animals are not likely to survive the force of tornado winds and may be carried to distant ground or deposited in a body of water resulting in a polluted drinking water supply.
Streams can become clogged with wind-blown debris and downed trees, causing flooding and resulting in a slow recovery. Habitat for local wildlife may become destroyed, resulting in a reduction of species. If debris is not removed from the forest floor, it can become fuel for a wildfire.
Vulnerability of Private Improvements to Tornadoes Older houses and mobile/manufactured homes are particularly vulnerable to tornadoes. If houses are not built to high-wind standards, the likelihood of significant roof damage, if not devastation of the roof struc-ture, is bound to occur. Unless mobile/manufactured homes are built on an anchored foundation, the force of tornado winds is likely to lift the structure and turn it over. Damaged mobile/manufactured homes are not likely to be returned to habitable status.
Private improvements such as houses with roofs and mobile/manufactured homes, are vulnerable to torna-does and the straight-line winds that often accompany them. Homes built below grade or underground are likely to remain the safest retreat from tornadoes.
Local Plan IntegrationBelow is a summary of the risk classification identified in the individual local mitigation plans by MEMA Region.
MEMA Region Low Medium High MEMA Region Low Medium High1 - - 9 6 - 102 - - 13 7 - 2 93 - 4 8 8 1 3 54 - 1 9 9 - 8 105 - 1 30

Sect. 3 : 95
Mississippi Emergency Management Agency
Assessing Vulnerability by Jurisdiction Methodology and Potential Losses
The previous plans assessed each county’s vulnerability to tornado events by utilizing a rating system devised to establish four ratings based on the following factors: number of past tornado occurrences, total valuation of private property in each county, population density of each county, and past tornado damage values. Each of these ratings were summed up to determine an overall vulnerability rating for each county relative to the other counties.
For the 2013 plan update, the four factors are used however are not being classified into groupings to as-sess a value. Instead, the values for each category are presented in Table 3.2.5 by MEMA Region.
The four factors are described in detail below with a summary of the results.
1. Prior Events - As previously suggested, the total number of tornadoes reported is probably dependent upon population density and weather radar coverage. For the purposes of this plan, it is reasonable to assume the overall frequency of tornadoes does not vary significantly across the state by any means other than seasonality – southern portions of Mississippi appear to experience a higher number of tornadoes during the spring severe weather season whereas the northern portions experience their peak in the fall severe weather season.
Summary of Prior Events: The number of events by county is provided in graph form on pages 3:86 - 3:88 and in Table 3.5.5 by MEMA Region. All counties are considered at high risk.
2. Private Property Values - To relatively compare the amount of assets vulnerable to loss by tornado damage in each county, the state of Mississippi turned to assessment data from the Mississippi Tax Com-mission. The values were obtained from the “Mississippi State Tax Commission Annual Report Fiscal Year Ending June 30, 2012.”
The Annual Report provides private property assessments in two categories. These are “Real Property” and “Personal Property.” The “Real Property” assessment represents the true value of all taxable land and improvements thereto including residential, commercial and industrial property. The “Personal Property” assessment represents the value of the following: business inventories; furniture, fixtures, machinery and equipment for non-residential property; mobile homes and automobiles. To determine the Total Valuation of Property for each county, the “True Value” from the “Personal Property” assessment was added to the “True Value” from the “Real Property” assessment. This total private property valuation dollar value in itself is an indicator of the total value of each county’s property (tangible assets).
Summary of Private Property Values: The Total Property Valuation ranged from $17,360,892 in Is-saquena County to $13,106,564,295 in Harrison County.
3. Tornado Damage Values - Total damages of past tornadoes was determined to be an important factor in assessing vulnerability. The National Weather Service database listed past events plus provided damage estimates from those events. These damage estimates were presented in actual values for the given year of the tornado event. In order to more accurately compare the damage values, they were converted to 2011 dollar values using the inflation factor on SHELDUS.
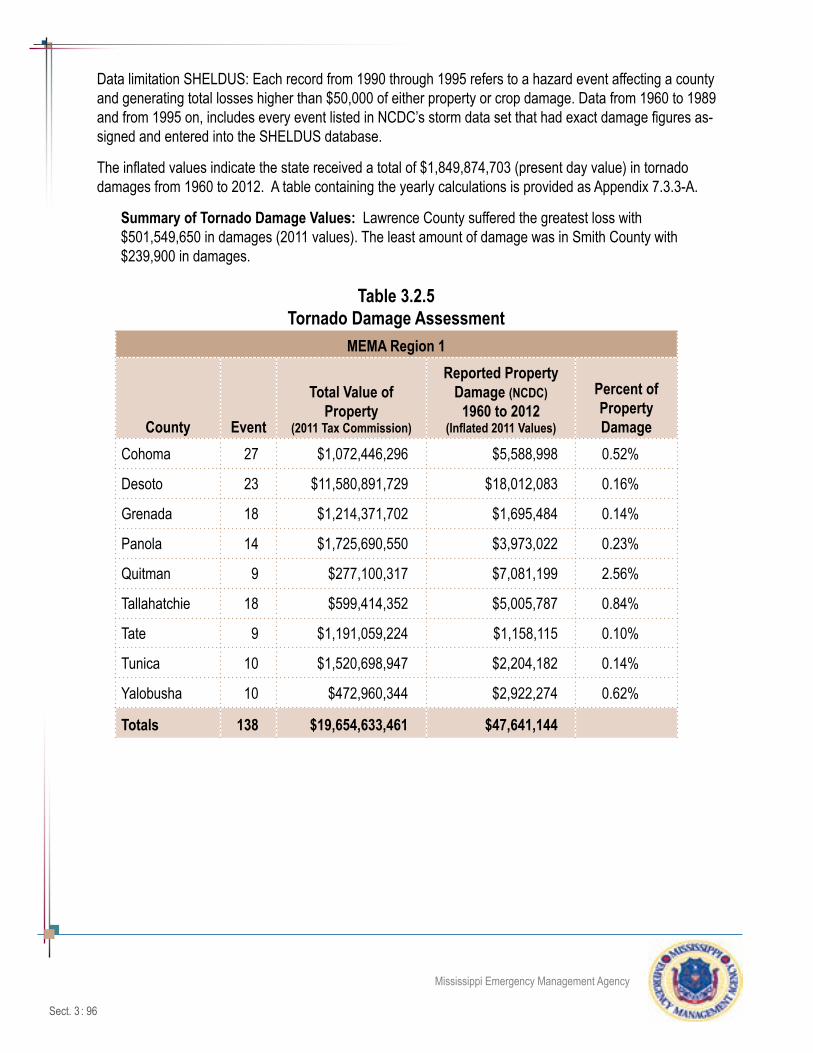
Sect. 3 : 96
Mississippi Emergency Management Agency
Data limitation SHELDUS: Each record from 1990 through 1995 refers to a hazard event affecting a county and generating total losses higher than $50,000 of either property or crop damage. Data from 1960 to 1989 and from 1995 on, includes every event listed in NCDC’s storm data set that had exact damage figures as-signed and entered into the SHELDUS database.
The inflated values indicate the state received a total of $1,849,874,703 (present day value) in tornado damages from 1960 to 2012. A table containing the yearly calculations is provided as Appendix 7.3.3-A.
Summary of Tornado Damage Values: Lawrence County suffered the greatest loss with $501,549,650 in damages (2011 values). The least amount of damage was in Smith County with $239,900 in damages.
Table 3.2.5Tornado Damage Assessment
MEMA Region 1
County Event
Total Value of Property
(2011 Tax Commission)
Reported Property Damage (NCDC)
1960 to 2012(Inflated 2011 Values)
Percent of Property Damage
Cohoma 27 $1,072,446,296 $5,588,998 0.52%
Desoto 23 $11,580,891,729 $18,012,083 0.16%
Grenada 18 $1,214,371,702 $1,695,484 0.14%
Panola 14 $1,725,690,550 $3,973,022 0.23%
Quitman 9 $277,100,317 $7,081,199 2.56%
Tallahatchie 18 $599,414,352 $5,005,787 0.84%
Tate 9 $1,191,059,224 $1,158,115 0.10%
Tunica 10 $1,520,698,947 $2,204,182 0.14%
Yalobusha 10 $472,960,344 $2,922,274 0.62%
Totals 138 $19,654,633,461 $47,641,144

Sect. 3 : 97
Mississippi Emergency Management Agency
MEMA Region 2
County Event
Total Value of Property
(2011 Tax Commission)
Reported Property Damage (NCDC)
1960 to 2012(Inflated 2011 Values)
Percent of Property Damage
Alcorn 19 $1,557,344,541 $3,242,538 0.21%Benton 7 $440,213,027 $1,689,913 0.38%Itawamba 11 $831,016,707 $1,341,223 0.16%Lafayette 19 $3,432,101,552 $4,568,616 0.13%Lee 22 $5,811,465,285 $14,405,611 0.25%Marshall 18 $1,564,932,419 $669,754 0.04%Pontotoc 18 $1,191,946,857 $46,384,645 3.89%Prentiss 21 $910,678,887 $3,683,870 0.40%Tippah 15 $813,204,529 $2,993,238 0.37%Tishomingo 15 $1,005,851,721 $2,176,413 0.22%Union 19 $1,412,595,711 $4,030,432 0.29%Totals 184 $18,971,351,236 $85,186,253
MEMA Region 3
County Event
Total Value of Property
(2011 Tax Commission)
Reported Property Damage (NCDC)
1960 to 2012(Inflated 2011 Values)
Percent of Property Damage
Attala 34 $834,040,572 $2,599,381 0.31%Bolivar 44 $1,875,092,443 $17,598,037 0.94%Carroll 17 $483,040,993 $1,419,557 0.29%Holmes 34 $557,920,260 $69,528,270 12.46%Humphreys 29 $328,622,478 $8,392,191 2.55%Leflore 43 $1,500,153,840 $9,441,665 0.63%Montgomery 17 $405,017,783 $1,770,400 0.44%Sunflower 32 $1,060,533,342 $5,764,046 0.54%Washington 27 $2,046,604,281 $7,345,999 0.36%Totals 277 $9,091,025,992 $123,859,546

Sect. 3 : 98
Mississippi Emergency Management Agency
MEMA Region 4
County Event
Total Value of Property
(2011 Tax Commission)
Reported Property Damage (NCDC)
1960 to 2012(Inflated 2011 Values)
Percent of Property Damage
Calhoun 15 $563,146,760 $1,142,896 0.20%Chickasaw 21 $614,504,631 $5,072,539 0.83%Choctaw 16 $1,484,280,703 $98,948,864 6.67%Clay 14 $948,070,309 $2,958,932 0.31%Lowndes 28 $6,159,437,369 $85,323,348 1.39%Monroe 29 $1,915,339,000 $10,785,230 0.56%Noxubee 31 $390,610,928 $4,828,691 1.24%Oktibbeha 22 $2,347,714,306 $7,798,130 0.33%Webster 13 $433,507,357 $7,474,751 1.72%Winston 13 $772,707,618 $4,386,119 0.57%Totals 202 $15,629,318,981 $228,719,500
MEMA Region 5
County Event
Total Value of Property
(2011 Tax Commission)
Reported Property Damage (NCDC)
1960 to 2012(Inflated 2011 Values)
Percent of Property Damage
Claiborne 31 $336,010,631 $18,251,656 5.43%Copiah 40 $1,074,757,392 $36,907,720 3.43%Hinds 68 $11,845,210,652 $30,079,715 0.25%Issaquena 19 $117,360,892 $1,057,979 0.90%Madison 46 $9,731,289,039 $40,274,053 0.41%Rankin 68 $9,973,310,259 $116,102,800 1.16%Sharkey 29 $217,566,013 $2,634,606 1.21%Simpson 46 $1,154,682,663 $59,431,366 5.15%Warren 43 $3,668,263,424 $5,008,952 0.14%Yazoo 36 $1,102,007,260 $148,994,759 13.52%Totals 426 $39,220,458,225 $458,743,606

Sect. 3 : 99
Mississippi Emergency Management Agency
MEMA Region 6
County Event
Total Value of Property
(2011 Tax Commission)
Reported Property Damage (NCDC)
1960 to 2012(Inflated 2011 Values)
Percent of Property Damage
Clarke 28 $661,213,875 $134,731,091 20.38%Jasper 34 $746,842,872 $36,514,328 4.89%Kemper 28 $296,697,697 $9,088,235 3.06%Lauderdale 38 $3,999,547,876 $7,543,327 0.19%Leake 32 $798,033,168 $4,412,779 0.55%Neshoba 39 $1,111,361,708 $15,914,734 1.43%Newton 36 $730,921,279 $1,398,557 0.19%Scott 31 $1,170,480,682 $495,112 0.04%Smith 56 $661,622,572 $239,900 0.04%Totals 322 $10,176,721,729 $210,338,063
MEMA Region 7
County Event
Total Value of Property
(2011 Tax Commission)
Reported Property Damage (NCDC)
1960 to 2012(Inflated 2011 Values)
Percent of Property Damage
Adams 14 $1,559,577,965 $4,012,263 0.26%Amite 20 $581,636,066 $2,902,705 0.50%Franklin 10 $316,862,954 $1,772,413 0.56%Jefferson 23 $421,377,748 $3,157,335 0.75%Lawrence 23 $749,737,661 $501,549,650 66.90%Lincoln 37 $1,646,767,813 $4,565,093 0.28%Pike 21 $1,835,347,229 $11,272,064 0.61%Walthall 20 $528,422,708 $1,908,344 0.36%Wilkinson 9 $371,392,354 $384,949 0.10%Totals 177 $8,011,122,498 $531,524,816

Sect. 3 : 100
Mississippi Emergency Management Agency
MEMA Region 8
County Event
Total Value of Property
(2011 Tax Commission)
Reported Property Damage (NCDC)
1960 to 2012(Inflated 2011 Values)
Percent of Property Damage
Covington 26 $905,565,883 $7,681,732 0.85%Forrest 33 $3,861,347,017 $11,582,246 0.30%Greene 19 $511,158,055 $14,144,889 2.77%Jefferson Davis 23 $241,093,420 $4,986,862 2.07%Jones 56 $3,195,250,710 $25,038,549 0.78%Lamar 26 $3,426,784,590 $10,431,327 0.30%Marion 29 $924,584,694 $3,139,469 0.34%Perry 14 $517,884,200 $457,048 0.09%Wayne 18 $931,098,239 $5,479,556 0.59%Totals 244 $14,514,766,808 $82,941,678
MEMA Region 9
County Event
Total Value of Property
(2011 Tax Commission)
Reported Property Damage (NCDC)
1960 to 2012(Inflated 2011 Values)
Percent of Property Damage
George 13 $838,198,964 $1,894,627 0.23%Hancock 43 $3,702,811,340 $14,892,485 0.40%Harrison 67 $13,106,564,295 $56,578,565 0.43%Jackson 47 $9,604,792,049 $2,155,827 0.02%Pearl River 41 $2,503,387,371 $5,027,706 0.20%Stone 19 $730,060,377 $370,890 0.05%Totals 230 $30,485,814,396 $80,920,100

Sect. 3 : 101
Mississippi Emergency Management Agency
Exposure Analyses
The following section consists of three exposure analyses using three different sets of data. Exposure analyses are different from loss estimates in that they present facilities and structures that may be exposed to tornadoes but do not attempt to estimate the amount of damages to be incurred during a tornado event.
Exposure Analysis of State-Owned Facilities
This analysis is not updated from the 2010 plan as the inventory of state-owned facilities is not completed (expected completion end of 2013). The data received from the Mississippi Department of Finance and Administration in 2007 contained building inventory information on 67 state institutions/agencies on which they had records. The number of state-owned facilities by county and their estimated replacement values is provided in Appendix 7.3.2-E.
For the puposes of this plan, all state-owned facilities in each county are vulnerable to exposure of a tor-nado event.
Exposure Analysis of Critical Facilities and Infrastructure
The state of Mississippi developed a definition for “critical facilities and infrastructure” as discussed in Section 3.0. Location data for these facilities was collected from various state agencies for the purpose of determining which facilities are at risk to various hazards. However, because this data came from multiple sources, the need to validate the location information and building replacement values is vital in producing accurate assessments for future planning.
For planning and assessment purposes, Appendix 7.3.2-D-1-14 provides regional maps with overlaid critical facilities and infrastructure to assist with identifying the proximity of their locations. As previously discussed in this section, all counties are considered at risk for tornadoes of any severity as they may strike anytime and anywhere in Mississippi. Thus for the pupose of this plan, all assets listed within each county are vulnerable to exposure of a tornado event.
Impacts of Mitigation
Warning Sirens
The Mississippi Emergency Management Agency partnered with the Federal Emergency Management Agency to improve tornado warning capabilities through participation in a storm siren grant program. This program required localities to provide minimum matching funds, document a proposed site and the effec-tive range and population to be warned should the project be funded, and assume responsibility for future maintenance of a funded system. To date 126 siren grants have been awarded statewide.
Safe Rooms
The state of Mississippi also offered a safe room program - “A Safe Place to Go” encouraging homeowners to construct individual safe rooms at their residence providing protection to their families. This program is no longer available as funding is depleted.

Sect. 3 : 102
Mississippi Emergency Management Agency
In addition to the individual safe rooms, the state provided funding for FEMA 361 and Community Safe Rooms. With advanced notice, these safe rooms could be opened for those persons who may be in harms way; including but not limited to those in mobile/manufactured housing.
Mississippi Safe Room ProgramSafe Room Type County No. of Facilities Est. Capacity
Individual Statewide 10,918 28,824
FEMA 361 Adams, Copiah, Desoto, Forrest, George, Hancock, Harrison, Jackson, Jones, Lafayette, Lamar, Lauderdale, Lincoln, Monroe, Neshoba, Pearl River, Pike, Rankin, Stone, Tate, Tunica and Wayne
72 52,337
Community Attala, Calhoun, Chickasaw, Holmes, Itawamba, Lafayette, Lamar, Lauderdale, Lee, Leflore, Lowndes, Madison, Monroe, Panola, Pontotoc, Prentiss, Smith, Tal-lahatchie, Tippah, Union, Wayne, Winston and Yalobusha
183 Undetermined
Source: MEMA
Pontotoc, Mississippi February 24, 2001

Sect. 3 : 103
Mississippi Emergency Management Agency
3.4: Dam/Levee Failure Risk Assessment
Hazard DescriptionA dam is any artificial barrier, including appurtenant works, constructed to impound or divert water, waste-water, liquid borne materials or solids that may flow if saturated. All structures necessary to maintain the water level in an impoundment or to divert a stream from its course will be considered one dam.
A levee is an artificial embankment alongside a river. The main purpose of an artificial levee is to prevent flooding of the adjoining countryside; however, they also confine the flow of the river resulting in higher and faster water flow.
Dam Categories
The Surface Water and Dam Safety Divisions of the Office of Land and Water Resources, Mississippi Department of Environmental Quality (MDEQ) develop regulations on Dam Safety for the state. Dams are categorized according to what lies downstream, as well as the expected impact of dam failure. The follow-ing is taken from regulations for dams in Mississippi that will describe the statutory dam categories:
Low Hazard (Category III, or Class A) - A class of dam in which failure would at the most, result in damage to agricultural land, farm buildings (excluding residences), or minor roads. Without exception, all low hazard dams in Mississippi are earthen dams; some are considered to be properly engineered structures.
High Hazard (Category I, or Class C) - Dam failure may cause loss of life, serious damage to homes, industrial or commercial buildings, important public utilities, main highways or railroads. Dams con-structed in residential, commercial, or industrial areas are classified as high hazard dams unless other-wise classified on a case-by-case business. For example, dams constructed where there is potential for development receive a high hazard classification. The term “High Hazard” does not speak to the quality of the structure, but rather the potential for a resultant death or exposure to property damage down-stream in case of a failure. A dam can be as small as six feet in height, but if a homeowner lives within a reasonable distance of the structure, he would be considered vulnerable.
A high hazard dam is a class of dam in which failure may cause loss of life, serious damage to resi-dential, industrial, or commercial buildings; or damage to, or disruption of, important public utilities or transportation facilities such as major highways or railroads. Dams proposed for construction in estab-lished or proposed residential, commercial, or industrial areas, and that meet the statutory thresholds for regulation, will be assigned this classification unless the applicant provides convincing evidence to the contrary.
Significant Hazard (Category II, or Class B) - A class of dam in which failure poses no threat to life, but which may cause significant damage to main roads, minor roads, or cause interruption of service of public utilities.

Sect. 3 : 104
Mississippi Emergency Management Agency
Hazard ProfileThe hazard profile for dam failure in Mississippi includes current statistics regarding dam/levee failures and safety regulations that have been adopted by the State. According to the Mississippi Department of Envi-ronmental Quality - Dam Safety Division, there are 3,833 dams in Mississippi, of which 328 are classified as either high or significant hazard class (Figure 3.4.1).
Dams have a design lifetime. Unlike U.S. Army Corps of Engineers dams, private dams are all too likely to go without periodic maintenance essential to minimize failure. In spite of a five-year inspection period for high hazard dams, problems such as trees growing in the structure resulting in piping, animals using the dam structure for burrowing, and the appearance of sand boils can contribute to dam failure.
Catastrophic dam failure is characterized by the sudden, rapid, and uncontrolled release of impounded water produced by either overtopping or a break in the dam due to natural causes or human intervention. Lesser degrees of failure tend to lead up to or increase the risk of catastrophic failure. Management of such lesser degrees of failure normally can be accomplished if action is taken early and quickly.
Mississippi’s dam safety program should ensure the safety of public and private dams arising from the ex-traordinary public safety risks posed by unsafe dams, the false sense of security that often arises from the presence of an upstream dam (no matter its function), and the tendency of localities and private landowners to want to develop areas that seem protected but in reality could be inundated if a dam fails or is breached.
Emergency Action Plans
Section 51-3-39 of the Mississippi Code of 1972 charges dam owners with responsibility for maintaining and operating their dams in a safe condition. Dam Safety Regulations adopted by the Mississippi Commis-sion on Environmental Quality in 2004 require all owners of High Hazard and Significant Hazard Dams to have their dams inspected by a registered professional engineer before March 2006. Additionally, the own-ers were required to prepare an Emergency Action Plan (EAP) for submission to MDEQ. Significant Hazard dams that may interrupt some roads or public utility services are also required to have EAPs in place.
The MDEQ Office of Land and Water Resources, Division of Dam Safety administers the state’s dam safety program. This office conducts comprehensive file reviews and current hazard evaluation of all dams on their inventory. The Division’s list of dams can be found in Appendix 7.3.4-A. This list includes dams con-sisting of at least 50 acres of surface drainage area. Any size dam can be determined to be “High Hazard.”
As of this plan update, there are 204 EAPs for high hazard and 13 for significant hazard dams approved and on file, an increase of 80 since the 2010 plan update. The Dam Safety Division’s goal is to have the owners of all high and significant hazard class dams submit EAPs for review and approval. The approval process includes review and approval at the county level by the local Emergency Management Agency and all first responders that would be required to implement the plan.

Sect. 3 : 105
Mississippi Emergency Management Agency
Figure 3.4.1 Mississippi Dams

Sect. 3 : 106
Mississippi Emergency Management Agency
Changes in Dam Classifications from 2010 PlanThe Dam Safety Division of MDEQ has been actively reviewing the hazard class ratings for dams through-out the state. Since the 2010 plan, 86 dams have been downgraded in classficiation and are identified in the dam inventory provided in Appendix 7.3.4-A.
Thirteen dams that were classified as high or low hazard in the 2010 plan and have been upgraded to a higher hazard class as provided in Table 3.4.1.
Table 3.4.12013 Dam Hazard Class Changes
State ID County Dam Name2010 Plan
Hazard Class 2013 Plan
Hazard ClassMS01053 Carroll Big Sand Watershed Structure Y-32-03 Dam H S
MS01593 Carroll Pelucia Watershed Structure Y-33A-01 Dam H S
MS02829 Jones Big Creek Watershed Structure 9 Dam L H
MS02778 Lafayette Murray Creek Ws Str Y-13A-5 Dam L H
MS03615 Lafayette Crown Pointe Dam L H
MS02260 Madison Arrington Lake Dam L S
MS03267 Madison Kristin Lake Dam L S
MS03299 Madison Deer Haven Dam L H
MS00529 Marion Holliday Creek Ws Str 4 Dam L H
MS00613 Tippah Muddy Creek Ws Str 14 Dam L H
MS01492 Warren Waterways Exper Dam H S
MS02757 Warren Leroy George Lake Number 2 Dam L H
MS00189 Winston Lake Tiak-O-Khata L H
Mississippi Floodplain Management
Mississippi has 5.2 million acres of high-risk flood zones, not counting the areas protected by certified levees. Mississippi has approximately 665 miles of major levees, which are generally located in the western border counties. All levees are constructed to provide a specific level of protection, such as the so called 100-year or 500-year flood. The 500-year flood level plus the additional freeboard height is considered a minimum protection standard for levees protecting urban areas. If a flood occurs that exceeds that design, the levee will be overtopped or otherwise fail from saturation, leakage, etc. When this happens, the results are catastrophic. The threat of earthquakes also increases the risk of areas protected by levees.

Sect. 3 : 107
Mississippi Emergency Management Agency
Maximum Dam Failure Threat
The maximum threat to citizens of Mississippi from dam failure will not originate from state or privately owned dams, but from federal flood control structures such as the United States Corps of Engineers’ Arka-butla, Sardis, Grenada, or Enid reservoirs. Simultaneous failure of these structures could occur due to an earthquake in the New Madrid Seismic Zone. A scenario a failure at Lake Arkabutla Dam is provided in the vulnerability assessment section.
Past Occurrences
Since 1982, MDEQ Dam Safety Division has recorded 57 breaches as shown in Table 3.4.2. It is important to note that some failures may not have been detected and reported. Provided below are brief narratives on recent failures for high and low hazard dams.
High Hazard Dam Failures
Lake Serene Southeast Dam
On August 29, 2012 the Lake Serene Southeast Dam in Lamar County suffered a large slide on the downstream face of the dam. Although the slide did not lead to uncontrolled release of the pool, the road across the top of the dam was closed and eight homes were evacuated. The slide was caused when the owner cut a bench near the center of the downstream slope, along the length of the dam, to support a side arm tractor/mower. This action was taken because the slope was too steep to mow. Subsequently, the unsupported upstream slope failed.
Percy Quinn Lake Dam
On August 30, 2012, large slides developed in the Percy Quinn Lake dam due to seepage. Although the slides did not lead to uncontrolled release of the pool, the road across the top of the dam was closed, and an estimated 40,000 people in Mississippi and Louisiana were evacuated. The pool was pumped down to a safe level while a breach was cut into natural ground to keep the pool drained while repairs were made.
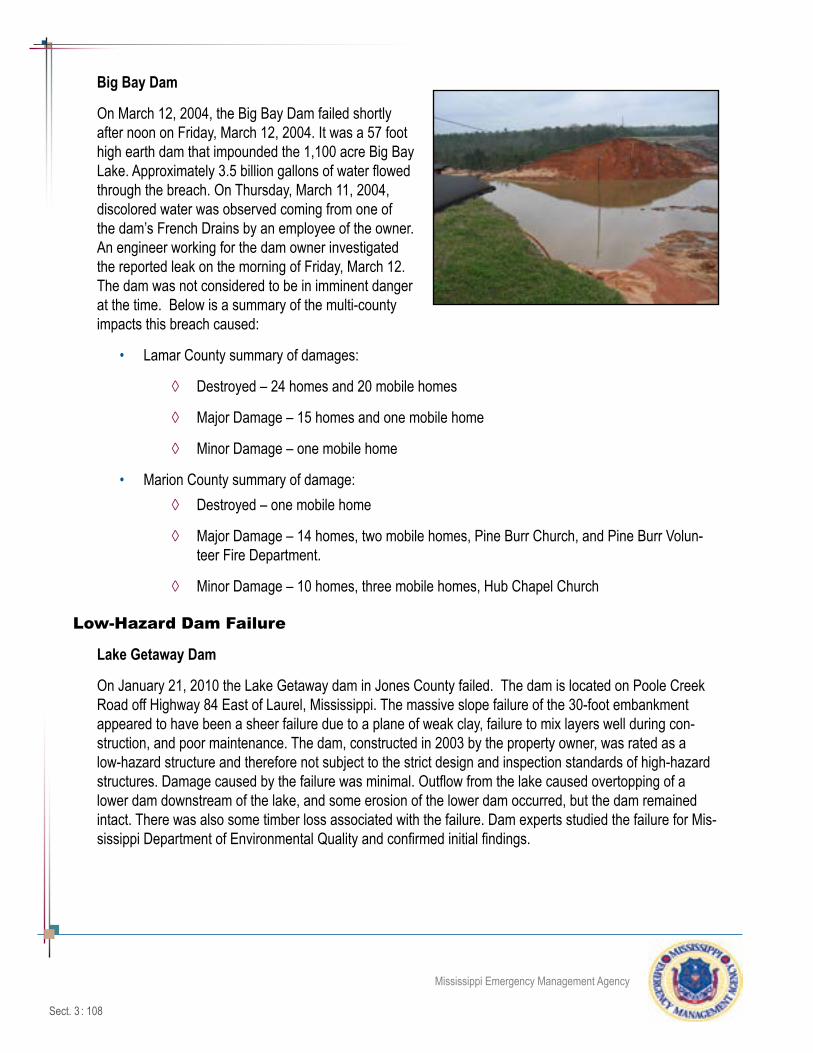
Sect. 3 : 108
Mississippi Emergency Management Agency
Big Bay Dam
On March 12, 2004, the Big Bay Dam failed shortly after noon on Friday, March 12, 2004. It was a 57 foot high earth dam that impounded the 1,100 acre Big Bay Lake. Approximately 3.5 billion gallons of water flowed through the breach. On Thursday, March 11, 2004, discolored water was observed coming from one of the dam’s French Drains by an employee of the owner. An engineer working for the dam owner investigated the reported leak on the morning of Friday, March 12. The dam was not considered to be in imminent danger at the time. Below is a summary of the multi-county impacts this breach caused:
• Lamar County summary of damages:
◊ Destroyed – 24 homes and 20 mobile homes
◊ Major Damage – 15 homes and one mobile home
◊ Minor Damage – one mobile home
• Marion County summary of damage:◊ Destroyed – one mobile home
◊ Major Damage – 14 homes, two mobile homes, Pine Burr Church, and Pine Burr Volun-teer Fire Department.
◊ Minor Damage – 10 homes, three mobile homes, Hub Chapel Church
Low-Hazard Dam Failure
Lake Getaway Dam
On January 21, 2010 the Lake Getaway dam in Jones County failed. The dam is located on Poole Creek Road off Highway 84 East of Laurel, Mississippi. The massive slope failure of the 30-foot embankment appeared to have been a sheer failure due to a plane of weak clay, failure to mix layers well during con-struction, and poor maintenance. The dam, constructed in 2003 by the property owner, was rated as a low-hazard structure and therefore not subject to the strict design and inspection standards of high-hazard structures. Damage caused by the failure was minimal. Outflow from the lake caused overtopping of a lower dam downstream of the lake, and some erosion of the lower dam occurred, but the dam remained intact. There was also some timber loss associated with the failure. Dam experts studied the failure for Mis-sissippi Department of Environmental Quality and confirmed initial findings.

Sect. 3 : 109
Mississippi Emergency Management Agency
Table 3.4.2Dam Failures 1982 - 2012
Date County Structure Name Cause of FailureAugust 2012 Pike Percy Quinn Large slides developed with seepage. Did
not lead to uncontrolled release of pool.August 2012 Lamar Lake Serene Southeast
DamLarge slide on downstream face of dam. Did not lead to uncontrolled release of pool.
January 2010 Jones Lake Getaway A plane of weak clay, failure to mix layers well during construction and poor mainte-nance
April 2005 Hinds Dennery Lake Seepage, piping, biological growth caused section near center of dam to erode away
2005 Desoto Allen Subdivision Lake Animal penetration, causing dam to breachJune 2004 Hinds Lake Dockery Animal penetration. Dam failed near center.
Controlled breach continued at the failed section
2004 Lamar Bennett York Dam owner attempted to lower water level by controlled breach but lost control
May / June 2004 Hinds Lake Dockery PipingApril 2004 Pearl River Dove Lake PipingMarch 2004 Lamar Big Bay Lake PipingFebruary 2004 Yazoo Dr. Freeman Lake PipingFebruary 2004 Simpson Peacock Lake OvertoppingSeptember 2003 Warren Lake Forrest PipingJuly 2003 Lamar Emmit Graves PipingMay 2003 Lauderdale Wild Duck Lake PipingApril 2003 Lauderdale Lake Evelyn PipingJanuary 2003 Madison Andover South PipingDecember 2002 Lafayette Royal Oaks PipingOctober 2002 Harrison Windy Hills Lake Piping along primary spillway conduitSeptember 2002 Madison Andover South PipingSeptember 2002 Pike Lake Dixie Springs OvertoppingAugust 2002 Lauderdale State Hospital Lake Poor overall conditionJuly 2002 Lafayette Horseshoe Lake Massive slides, erosion on downstream
slope, leading to dam breachApril 2002 Carroll Billups Dam PipingMarch 2002 Lauderdale Lake Tom Bailey Deterioration for primary concrete spillway

Sect. 3 : 110
Mississippi Emergency Management Agency
February 2002 Panola Unnamed Dam Piping along primary spillway leading to dam breached
January 2002 Lauderdale John Kasper Lake Excessive seepage leading to dam breachJuly 2001 Lamar Bridgefield Massive slides on downstream face leading
to dam breachMay 2001 Madison Francis Calloway Piping leading to dam being breachedMay 2001 Madison Robinson Springs OvertoppingMarch 2001 Lamar West Lake First Addition Piping leading to dam being breachedJanuary 2001 Hinds Turtle Lake Piping leading to dam being breachedSeptember 2000 Warren Lake Haven Animal penetrationApril 2000 Hinds Whites Lake Piping/BreachedMay 1995 Lauderdale Vise Lake Dam Sand boils - problem with longevity of damJanuary 1995 Panola Lake Village Dam Spillway FailureNovember 1994 Hinds Spring Lake Spillway FailureApril 1994 Desoto Strickland Lake Breached by RegulatorsJuly 1993 Jones Indian Springs Lake BreachedDecember 1991 Benton Porter Creek BreachedJune 1989 Leflore Abiaca Creek BreachedApril 1984 Hinds Lakeview Lake BreachedApril 1984 Hinds Lake Larue Breached by DesignMarch 1984 Lauderdale Dalewood Shores Minor BreachMarch 1984 Panola Pine Lake BreachedMarch 1984 Forrest Burketts Creek BreachedMarch 1984 Forrest West Lake OvertoppedMarch 1984 Rankin Ross Barnett Reservoir Sandbags on LeveeMay 1983 Hinds Jackson County Club BreachedMay 1983 Leake State Highway 35 OvertoppedApril 1983 Leflore Pelucia Bayou BreachedApril 1983 Pearl River Anchor Lake BreachedApril 1983 Adams Robins Lake BreachedApril 1983 Hancock Boy Scout Camp BreachedApril 1983 Lamar Lake Serene Spillway OutDecember 1982 Leflore Pelucia Bayou OvertoppedSource: MDEQ Dam Safety Division

Sect. 3 : 111
Mississippi Emergency Management Agency
Probability of Future Dam Failure Events
In the first five years of this decade (2000-2005), the probability of dam failure was considered high due to diminished inspection capabilities within state government, and a series of dam failures indicated a period of frequent failures could be expected. However, efforts within MDEQ to improve compliance with dam regulations and increase inspections seem to have paid off. The two events in 2012 were attributed to severe flooding caused by Hurricane Isaac.
While the structural weakness of a dam is apparent from outside observation, a sunny day event, without warning, can turn an earthen dam into a muddy whirlpool. There are ways to evaluate imminent failure of a structure, but these do not always provide the information needed to foretell future events. State policies that have been promulgated to provide for a periodic inspection period require five-year inspections for “high hazard” dams.
Levee Failures
The most significant and damaging flood in the United States took place on April 21, 1927 when the failure of a levee along the Mississippi River near Mound Landing occurred. This flood overflowed all of the land from Beulah to Vicksburg; this break and adjustment is visible in the aerial photography shown in Figures 3.4.2 and 3.4.3 on the subsequent pages. In fact, practically the entire alluvial valley was under water. This devastating 1927 flood caused the loss of more than 246 lives; drowned out hundreds of cities, towns, and villages; drove 700,000 people from their homes, rendering them objects of charity dependent upon the Red Cross and other agencies; inundated 1,800 square miles; destroyed 1.5 million farm animals; caused losses amounting to many hundreds of millions of dollars; suspended interstate freight and passenger traffic; prevented telegraph and telephone communication; delayed the United States postal service; and paralyzed industry and commerce. As a result of this disaster to the valley, the Federal Congress on May 15, 1928 passed a general flood control act, wherein the government assumed the cost of all construction and for the first time enunciated the policy of the Federal Government assuming the construction of levees necessary for the protection of the valley.
Some examples of levee failures along the Mississippi River prior to the General Flood Control Act of 1928 are recounted by Walter Sillers below:
• In 1882, the entire line of levee in Bolivar County, about 85 miles, seemed to snap in a hundred places in one night, during a terrible storm on the night of February 28th, and the whole county was under water.
• A section of the levee a mile long caved into the river just south of the town of Prentiss in 1865, and other levees, north and south, in Bolivar County, either caved in or broke; and as the stage of water was high for that day, a disastrous overflow swept over the country, drowning stock, sweeping away fences, destroying crops, and carrying destruction and disaster in its wake.
• A private levee along Lake Vermillion from Lake Beulah to Neblett’s Landing was adopted as a part of the main levee system, in lieu of the abandoned levee. In spite of all the work and care given to this levee proper, there were many breaks in it; 1867, 1882, 1884, 1874 and 1897. A break occurred in the Catfish Point Levee in 1890, causing this entire Point with its improved plantations

Sect. 3 : 112
Mississippi Emergency Management Agency
to be thrown outside the levee and abandoned. The most disastrous of all was in 1912 in which the water was the highest on record and caused a disastrous break in the levee four miles below Beulah.
• In 1922 the closure of the Cypress Creek levees on the Arkansas side of the Mississippi River raised the flood line to the extent that carried the water over the top of the Mississippi Levees from Kentucky Ridge to Mound Landing, causing a desperate struggle and a vast expenditure of money to top it off and hold it against the increased flood line of the river.
In 1926 Bolivar County was operating under the second Flood Control Act of 1923, under which act all the levee boards contributed one-third of the cost of construction of the levees and maintained the works after they were constructed.
Figure 3.4.2
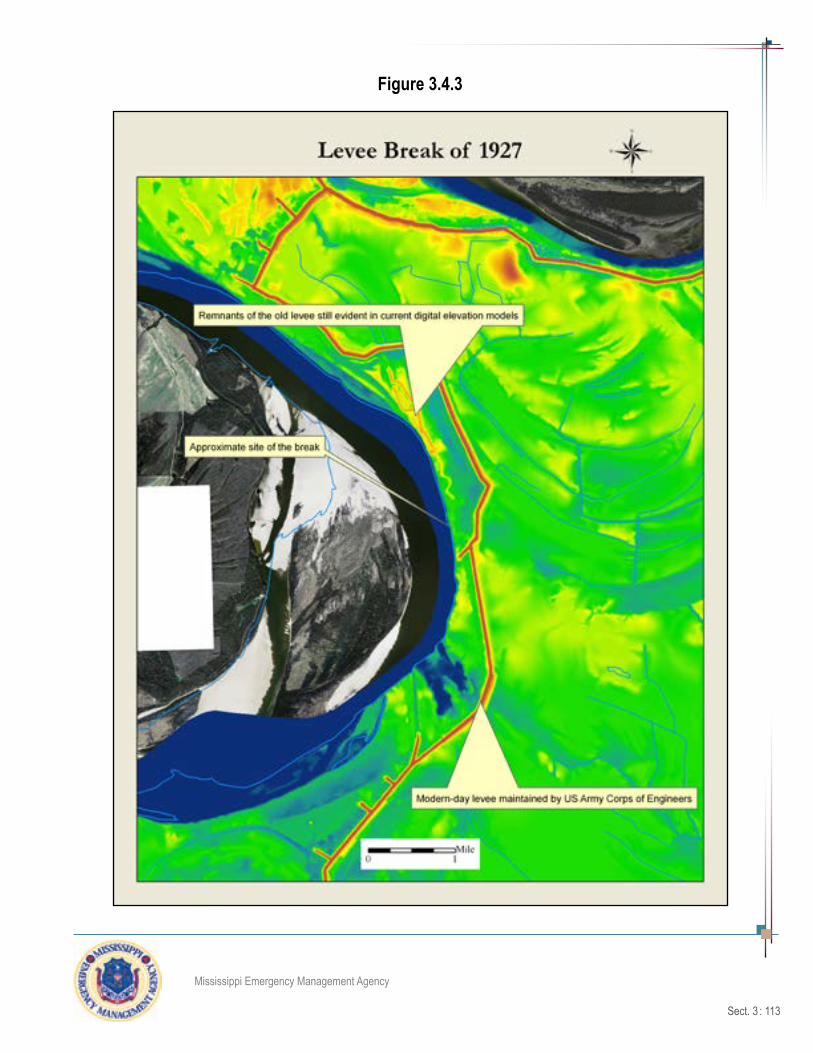
Sect. 3 : 113
Mississippi Emergency Management Agency
Figure 3.4.3
Sect. 3 : 114
Mississippi Emergency Management Agency
Assessing Vulnerability Dam FailureLife and property are vulnerable to dam and levee failures throughout Mississippi. Loss of life is the primary concern in assessing vulnerability to dam and levee failure. For this reason, a dam is considered high haz-ard if only one life is at-risk to inundation in the event of a failure. Residential homes as well as public build-ings and infrastructure are vulnerable to damage if formerly-impounded waters are released due to dam or levee failure. In many cases a dam or levee failure results in property damage that cannot be returned to pre-incident levels.
Damages from Flooding as a Result of Dam Failure
Damages due to flooding can have an effect on crops and trees. The destructive force of water can destroy homes and businesses otherwise able to withstand wind and weather.
Vulnerability of People
Homes built within the footprint of a “low hazard” dam suddenly may change the dam’s status to “high haz-ard” and unknowingly place homeowners and their families at risk. The design lifetime of an earthen dam is about 50 years. Often, the owner is not able to conduct routine site inspections of the dam and may not detect warning signs of an eminent failure that might impact downstream properties.
When water is released from a dam failure, its course and destination can become unpredictable. The National Weather Service will issue a Flash Flood Warning in the event of a dam failure. Drivers attempting to cross roads without benefit of a bridge or culvert may be caught in a flash flood with no hope of recovery. The MDEQ Dam Safety Division is not aware of any deaths directly attributable to dam failure. An indirect death occurred when a driver ignored a warning sign and drove into a ravine created by a dam failure from Tropical Storm Isidore a full six months earlier.
Vulnerability of Natural Resources
Water that is impounded loses its dissolved oxygen. When a dam empties into a watercourse, fish in the watercourse suffocate and die as a result of a lack of biologically dissolved oxygen. Silt is often at the bottom of a dam impoundment and will enable water-borne bacteria and microbes to grow in an environ-ment free of the cleansing action of sunlight. Mining operations utilize dams to impound tailings and may include processed water, process chemicals, and portions of un-recovered minerals, all of which are toxic to aquatic and human life. This does not imply that dams are a hazard to people and to the environment, but water-borne minerals and water without aeration need to remain impounded behind a dam.
Assessing Vulnerability by County
It is relevant to consider all dams regardless of hazard class because development of one residential struc-ture in the inundation area of a dam may provide justification to change the dam’s classification to signifi-cant or high hazard. Information obtained for the 2013 update reveals that 59 of Mississippi’s 82 counties contain high or significant hazard dams.
A county summary by MEMA Region is provided in Table 3.4.3 and Table 3.4.4. lists the top ten counties in total number of dams.

Sect. 3 : 115
Mississippi Emergency Management Agency
Scrapers at work on the levee near Beulah, 1913 Convicts sacking Big Boil at Beulah, 1913
Near Beulah Break, 1912 Benoit, 1912
Shaw and the Mississippi Vally Railroad , 1912 Cypress trees, monarchs of the Delta’s lakes and swamps, Lake Bolivar
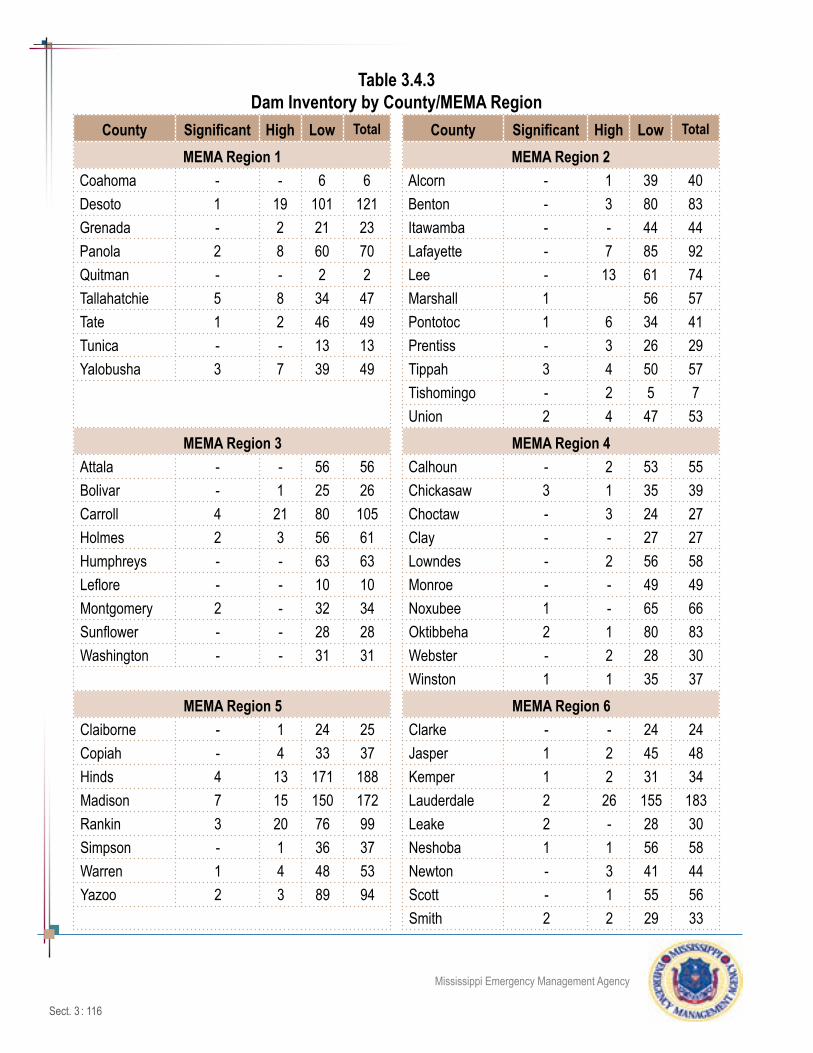
Sect. 3 : 116
Mississippi Emergency Management Agency
Table 3.4.3Dam Inventory by County/MEMA Region
County Significant High Low Total County Significant High Low Total
MEMA Region 1 MEMA Region 2Coahoma - - 6 6 Alcorn - 1 39 40Desoto 1 19 101 121 Benton - 3 80 83Grenada - 2 21 23 Itawamba - - 44 44Panola 2 8 60 70 Lafayette - 7 85 92Quitman - - 2 2 Lee - 13 61 74Tallahatchie 5 8 34 47 Marshall 1 56 57Tate 1 2 46 49 Pontotoc 1 6 34 41Tunica - - 13 13 Prentiss - 3 26 29Yalobusha 3 7 39 49 Tippah 3 4 50 57
Tishomingo - 2 5 7Union 2 4 47 53
MEMA Region 3 MEMA Region 4Attala - - 56 56 Calhoun - 2 53 55Bolivar - 1 25 26 Chickasaw 3 1 35 39Carroll 4 21 80 105 Choctaw - 3 24 27Holmes 2 3 56 61 Clay - - 27 27Humphreys - - 63 63 Lowndes - 2 56 58Leflore - - 10 10 Monroe - - 49 49Montgomery 2 - 32 34 Noxubee 1 - 65 66Sunflower - - 28 28 Oktibbeha 2 1 80 83Washington - - 31 31 Webster - 2 28 30
Winston 1 1 35 37MEMA Region 5 MEMA Region 6
Claiborne - 1 24 25 Clarke - - 24 24Copiah - 4 33 37 Jasper 1 2 45 48Hinds 4 13 171 188 Kemper 1 2 31 34Madison 7 15 150 172 Lauderdale 2 26 155 183Rankin 3 20 76 99 Leake 2 - 28 30Simpson - 1 36 37 Neshoba 1 1 56 58Warren 1 4 48 53 Newton - 3 41 44Yazoo 2 3 89 94 Scott - 1 55 56
Smith 2 2 29 33

Sect. 3 : 117
Mississippi Emergency Management Agency
County Significant High Low Total County Significant High Low TotalMEMA Region 7 MEMA Region 8
Adams - 7 40 47 Covington 1 - 23 24Amite - - 20 20 Forrest - 4 47 51Franklin - 1 20 21 Greene - - 26 26Jefferson - - 21 21 Jefferson Davis - 2 28 30Lawrence - - 14 14 Jones - 2 72 74Lincoln - 2 24 26 Lamar - 11 52 63Pike - 2 31 33 Marion - 2 24 26Walthall - - 10 10 Perry - - 21 21Wilkinson - - 23 23 Wayne - 1 31 32
MEMA Region 9George - - 21 21 Jackson - - 6 6Hancock - 1 25 26 Pearl River 3 2 57 62Harrison - 2 46 48 Stone - 1 50 51
Table 3.4.4Top Ten Counties in Number of Dams
County Significant High Low TotalHinds 4 13 171 188Lauderdale 2 26 155 183Madison 7 15 150 172Desoto 1 19 101 121Carroll 4 21 80 105Rankin 3 20 76 99Yazoo 2 3 89 94Lafayette - 7 85 92Benton - 3 80 83Oktibbeha 2 1 80 83
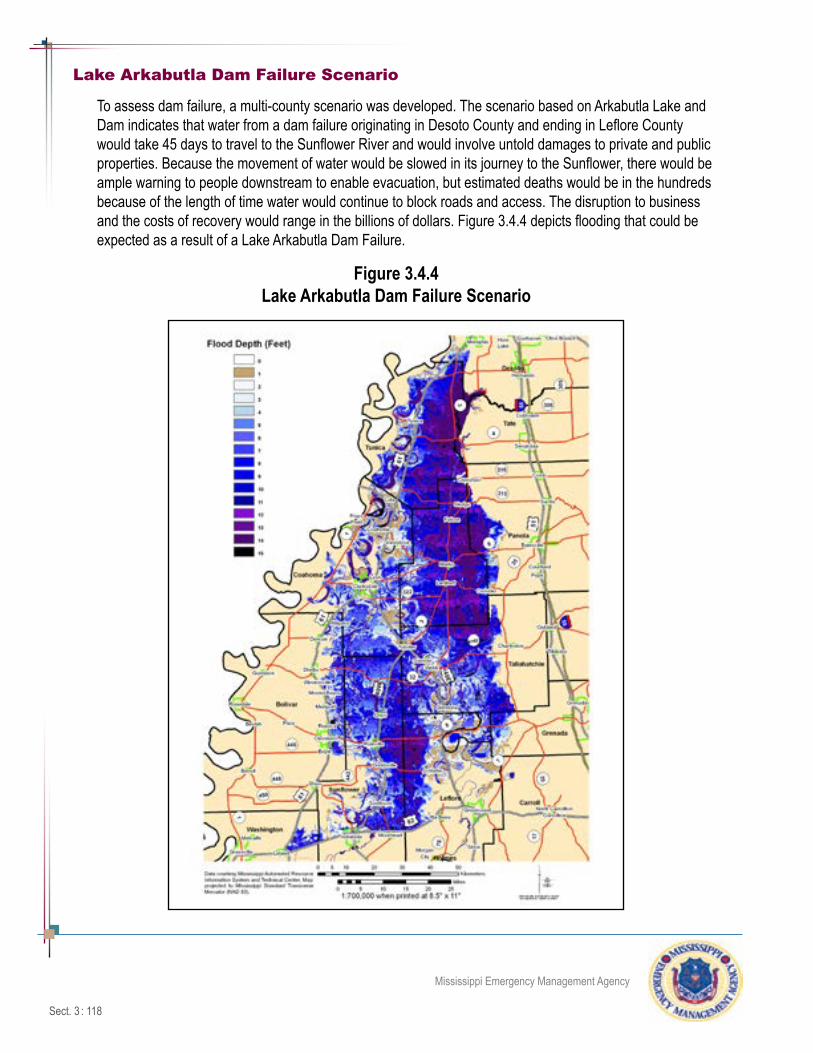
Sect. 3 : 118
Mississippi Emergency Management Agency
Lake Arkabutla Dam Failure Scenario
To assess dam failure, a multi-county scenario was developed. The scenario based on Arkabutla Lake and Dam indicates that water from a dam failure originating in Desoto County and ending in Leflore County would take 45 days to travel to the Sunflower River and would involve untold damages to private and public properties. Because the movement of water would be slowed in its journey to the Sunflower, there would be ample warning to people downstream to enable evacuation, but estimated deaths would be in the hundreds because of the length of time water would continue to block roads and access. The disruption to business and the costs of recovery would range in the billions of dollars. Figure 3.4.4 depicts flooding that could be expected as a result of a Lake Arkabutla Dam Failure.
Figure 3.4.4Lake Arkabutla Dam Failure Scenario
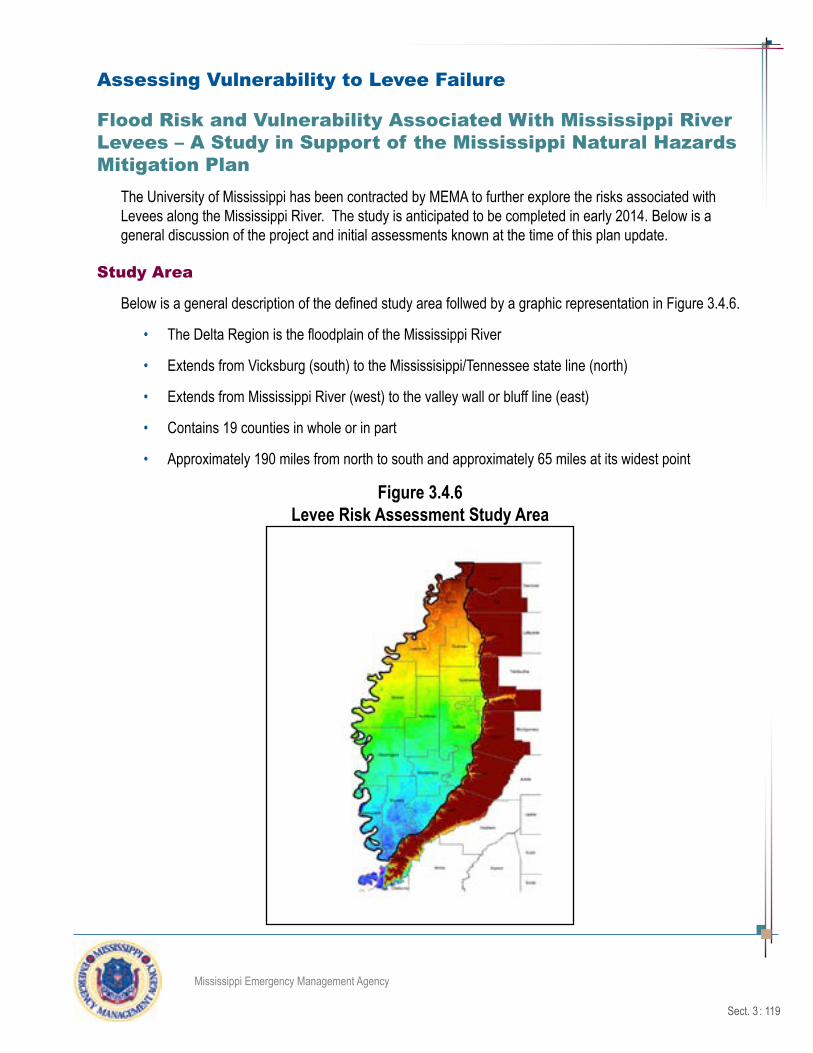
Sect. 3 : 119
Mississippi Emergency Management Agency
Assessing Vulnerability to Levee Failure
Flood Risk and Vulnerability Associated With Mississippi River Levees – A Study in Support of the Mississippi Natural Hazards Mitigation Plan
The University of Mississippi has been contracted by MEMA to further explore the risks associated with Levees along the Mississippi River. The study is anticipated to be completed in early 2014. Below is a general discussion of the project and initial assessments known at the time of this plan update.
Study Area
Below is a general description of the defined study area follwed by a graphic representation in Figure 3.4.6.
• The Delta Region is the floodplain of the Mississippi River
• Extends from Vicksburg (south) to the Mississisippi/Tennessee state line (north)
• Extends from Mississippi River (west) to the valley wall or bluff line (east)
• Contains 19 counties in whole or in part
• Approximately 190 miles from north to south and approximately 65 miles at its widest point
Figure 3.4.6Levee Risk Assessment Study Area

Sect. 3 : 120
Mississippi Emergency Management Agency
Agency Jurisdictions
Figures 3.4.7 and 3.4.7 show the jurisdictions for the Mississippi Levee Board and the U.S. Army Corp of Engineers (USACE).
Figure 3.4.7Mississippi Levee Board Jurisdiction
Figure 3.4.8USACE Jurisdiction
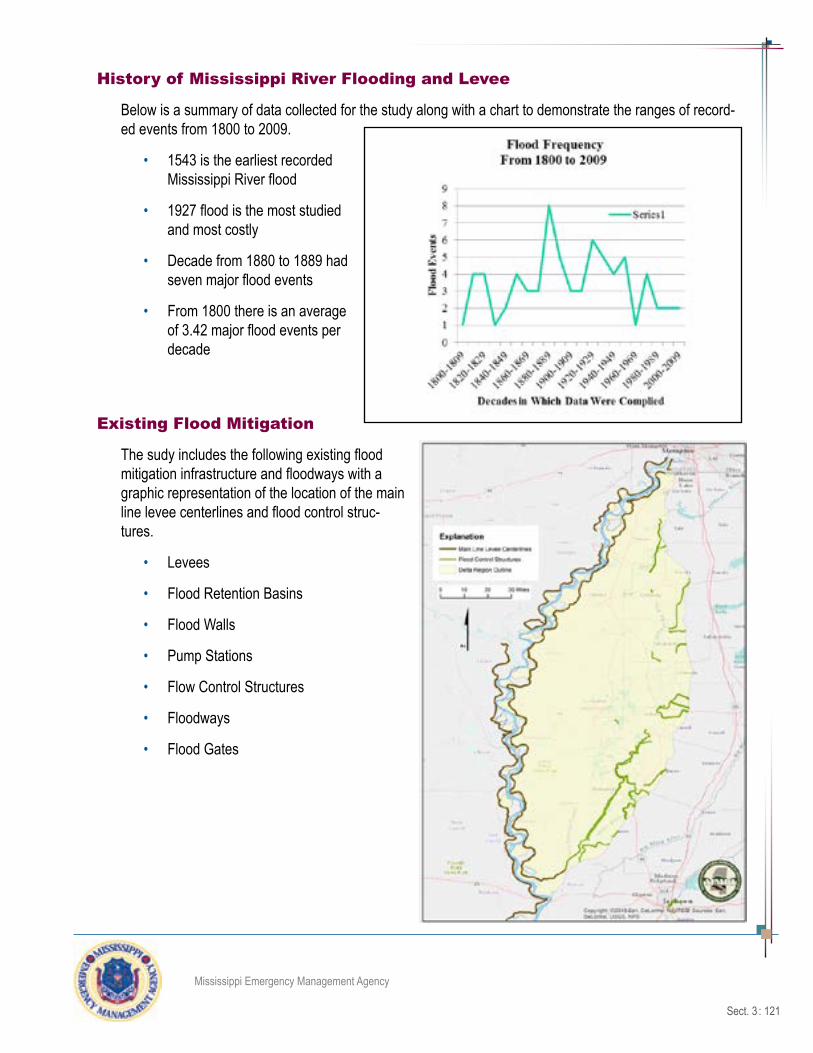
Sect. 3 : 121
Mississippi Emergency Management Agency
History of Mississippi River Flooding and Levee
Below is a summary of data collected for the study along with a chart to demonstrate the ranges of record-ed events from 1800 to 2009.
• 1543 is the earliest recorded Mississippi River flood
• 1927 flood is the most studied and most costly
• Decade from 1880 to 1889 had seven major flood events
• From 1800 there is an average of 3.42 major flood events per decade
Existing Flood Mitigation
The sudy includes the following existing flood mitigation infrastructure and floodways with a graphic representation of the location of the main line levee centerlines and flood control struc-tures.
• Levees
• Flood Retention Basins
• Flood Walls
• Pump Stations
• Flow Control Structures
• Floodways
• Flood Gates
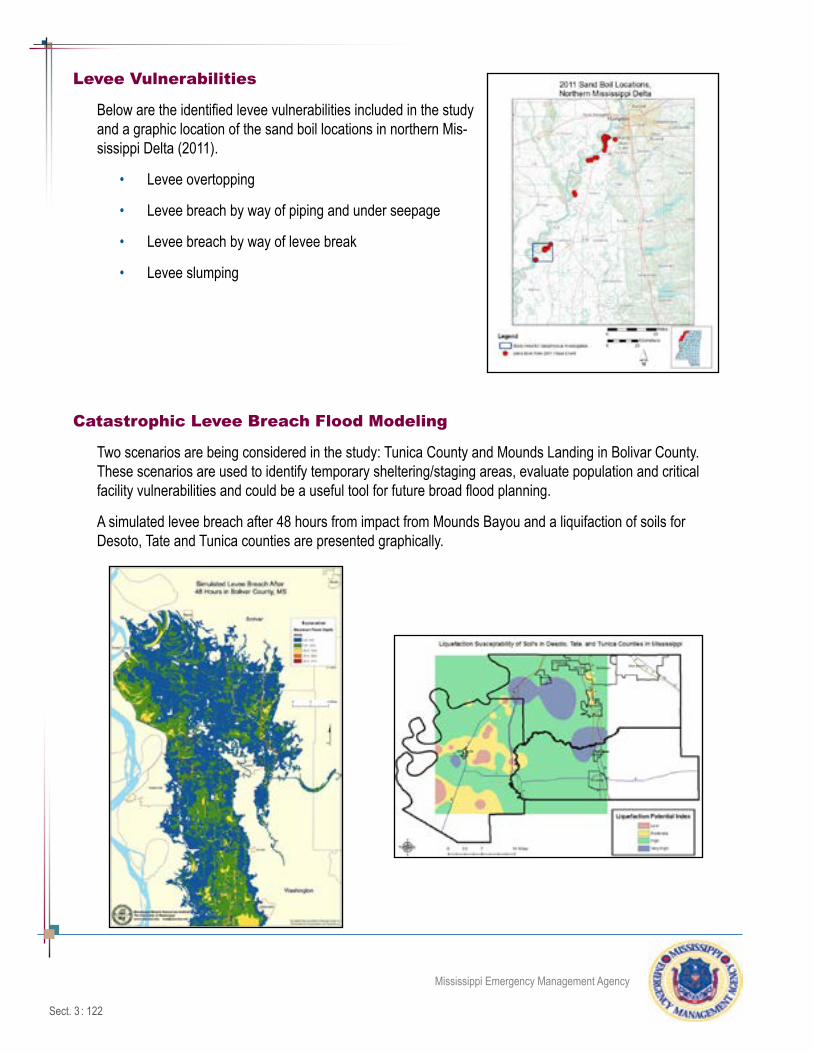
Sect. 3 : 122
Mississippi Emergency Management Agency
Levee Vulnerabilities
Below are the identified levee vulnerabilities included in the study and a graphic location of the sand boil locations in northern Mis-sissippi Delta (2011).
• Levee overtopping
• Levee breach by way of piping and under seepage
• Levee breach by way of levee break
• Levee slumping
Catastrophic Levee Breach Flood Modeling
Two scenarios are being considered in the study: Tunica County and Mounds Landing in Bolivar County. These scenarios are used to identify temporary sheltering/staging areas, evaluate population and critical facility vulnerabilities and could be a useful tool for future broad flood planning.
A simulated levee breach after 48 hours from impact from Mounds Bayou and a liquifaction of soils for Desoto, Tate and Tunica counties are presented graphically.
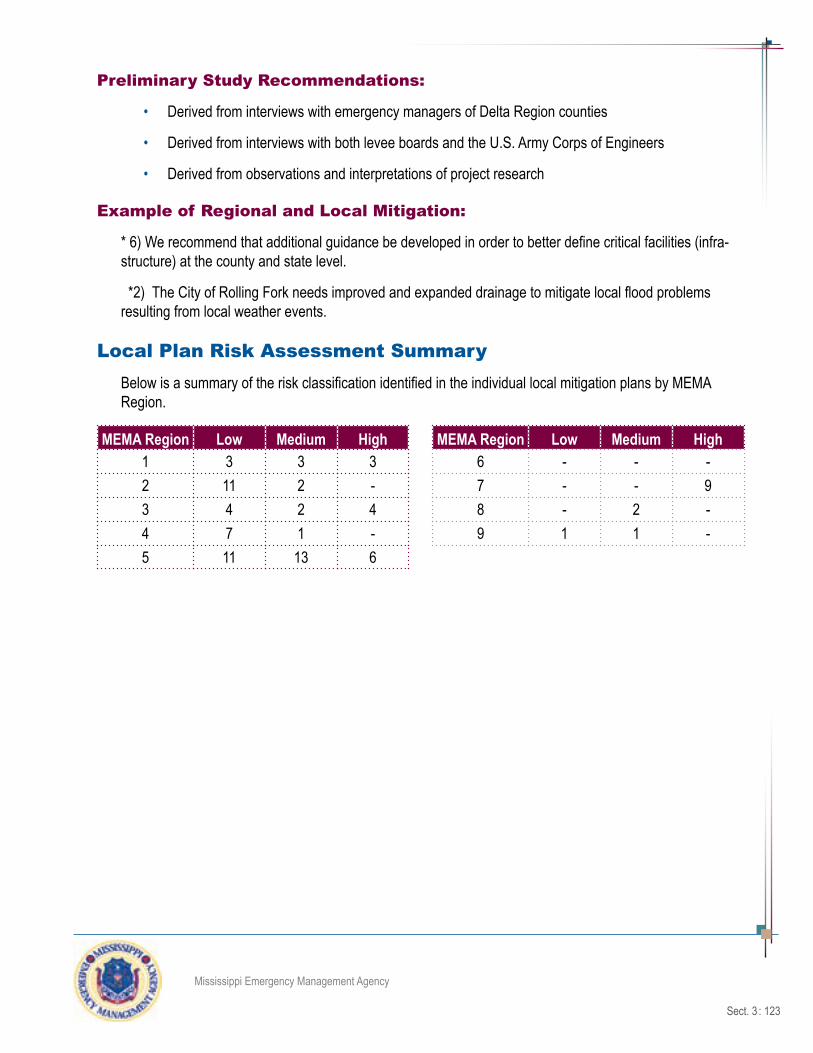
Sect. 3 : 123
Mississippi Emergency Management Agency
Preliminary Study Recommendations:
• Derived from interviews with emergency managers of Delta Region counties
• Derived from interviews with both levee boards and the U.S. Army Corps of Engineers
• Derived from observations and interpretations of project research
Example of Regional and Local Mitigation:
* 6) We recommend that additional guidance be developed in order to better define critical facilities (infra-structure) at the county and state level.
*2) The City of Rolling Fork needs improved and expanded drainage to mitigate local flood problems resulting from local weather events.
Local Plan Risk Assessment SummaryBelow is a summary of the risk classification identified in the individual local mitigation plans by MEMA Region.
MEMA Region Low Medium High MEMA Region Low Medium High1 3 3 3 6 - - -2 11 2 - 7 - - 93 4 2 4 8 - 2 -4 7 1 - 9 1 1 -5 11 13 6

Sect. 3 : 124
Mississippi Emergency Management Agency
3.5: Tropical Cyclone Risk Assessment
Hazard DescriptionTropical Cyclones are naturally occurring events that produce damaging high winds, generate dangerous storm surge flooding, cause pounding storm surf, spawn tornadoes, and produce torrential rainfall that can cause inland flooding.
The Atlantic hurricane season begins June 1 and ends on November 30, but hurricanes have developed outside of the designated season. Mississippi has been subject to winter and spring extra-tropical storms driving higher than normal tides from southerly and southeasterly winds. The Mississippi Coast has also experienced tropical depressions and tropical storms which have caused higher than normal tides, storm surge and gusting winds.
FEMA defines coastal storms as causing “increases in tidal elevations (called storm surge), wind speed and erosion, caused by both extra-tropical events and tropical cyclones.” FEMA defines hurricanes as “tropical cyclones characterized by thunderstorms and defined wind circulation.” These winds “blow in a large spiral around a calm center called the eye.”
The following terms are used to describe tropical storms / hurricanes:
Tropical Wave: A trough or cyclonic curvature maximum in the trade-wind easterlies. The wave may reach maximum amplitude in the lower middle troposphere.
Tropical Depression: A tropical cyclone in which the maximum sustained surface wind speed (using the U.S. 1-minute average) is 33 kt (38 mph or 62 km/hr) or less.
Tropical Storm: A tropical cyclone in which the maximum sustained surface wind speed (using the U.S. 1-minute average) ranges from 34 kt (39 mph or 63 km/hr) to 63 kt (73 mph or 118 km/hr).
Hurricane: A tropical cyclone in which the maximum sustained surface wind (using the U.S. 1-minute aver-age) is 64 kt (74 mph or 119 km/hr) or more.
Hurricane wind intensity is measured with the Saffir-Simpson Scale based on a 1-5 rating of a hurricane’s sustained wind speed at the time of measurement. This is used to give an estimate of the potential property damage expected along the coast from a hurricane landfall. Hurricanes reaching Category 3 and higher are considered major hurricanes because of their potential for significant loss of life and damage. Category 1 and 2 storms are still dangerous, however, and require preventative measures. Wind speed is the determin-ing factor in the scale. All winds are described using the U.S. 1-minute average. Previously, storm surge was described by the Saffir-Simpson Scale, but is no longer included.
The following excerpt from the National Hurricane Center explains revised definition of the Saffir-Simpson Hurricane Scale and the separation of storm surge from storm category followed by an explanation of the need to revise the new range of wind speeds:

Sect. 3 : 125
Mississippi Emergency Management Agency
Earlier versions of the Saffir-Simpson Hurricane Scale incorporated central pressure and storm surge as components of the categories. The central pressure was used during the 1970s and 1980s as a proxy for the winds as accurate wind speed intensity measurements from aircraft reconnaissance were not routinely available for hurricanes until 1990. Storm surge was also quantified by category in the ear-liest published versions of the scale dating back to 1972. However, hurricane size (extent of hurricane-force winds), local bathymetry (depth of near-shore waters), topography, the hurricane’s forward speed and angle to the coast also affect the surge that is produced. For example, the very large Hurricane Ike (with hurricane force winds extending as much as 125 mi from the center) in 2008 made landfall in Texas as a Category 2 hurricane and had peak storm surge values of about 20 ft. In contrast, tiny Hurricane Charley (with hurricane force winds extending at most 25 mi from the center) struck Florida in 2004 as a Category 4 hurricane and produced a peak storm surge of only about 7 ft. These storm surge values were substantially outside of the ranges suggested in the original scale. Thus to help reduce public confusion about the impacts associated with the various hurricane categories as well as to provide a more scientifically defensible scale, the storm surge ranges, flooding impact and central pressure statements are removed from the Saffir-Simpson Hurricane Scale and only peak winds are employed in this revised version.
The Saffir-Simpson Hurricane Wind Scale (SSHWS) has undergone a minor modification for 2012 in order to resolve awkwardness associated with conversions among the various units used for wind speed in advisory products. The change broadens the Category 4 wind speed range by one mile per hour (mph) at each end of the range, yielding a new range of 130-156 mph. This change does not alter the category assignments of any storms in the historical record, nor will it change the category assign-ments for future storms.
Table 3.5.1 depicts the revised Saffir-Simpson Scale by category, associated wind speeds and expected damages from a particular event.
Table 3.5.1Saffir-Simpson Hurricane Wind Scale
CategoryPrevious
Range New Range Effects on Land
One 74-95 mph No change
Very dangerous winds will produce some damage: Well-constructed frame homes could have damage to roof, shingles, vinyl siding and gutters. Large branches of trees will snap and shallowly rooted trees may be toppled. Extensive damage to power lines and poles likely will result in power outages that could last a few to several days
Two 96-110 mph No Change
Extremely dangerous winds will cause extensive damage: Well-constructed frame homes could sustain major roof and siding damage. Many shallowly rooted trees will be snapped or uprooted and block numerous roads. Near-total power loss is expected with outages that could last from several days to weeks.

Sect. 3 : 126
Mississippi Emergency Management Agency
Table 3.5.1Saffir-Simpson Hurricane Wind Scale
CategoryPrevious
Range New Range Effects on Land
Three 111-130 mph 111-129 mph
Devastating damage will occur: Well-built framed homes may incur major damage or removal of roof decking and gable ends. Many trees will be snapped or uprooted, blocking numerous roads. Electricity and water will be unavailable for several days to weeks after the storm passes
Four 131-155 mph 130-156 mph
Catastrophic damage will occur: Well-built framed homes can sustain severe damage with loss of most of the roof structure and/or some exterior walls. Most trees will be snapped or up-rooted and power poles downed. Fallen trees and power poles will isolate residential areas. Power outages will last weeks to possibly months. Most of the area will be uninhabitable for weeks or months.
Five Greater than 155 mph
Greater than 157 mph
Catastrophic damage will occur: A high percentage of framed homes will be destroyed, with total roof failure and wall col-lapse. Fallen trees and power poles will isolate residential ar-eas. Power outages will last for weeks to possibly months. Most of the area will be uninhabitable for weeks or months.
Source: National Hurricane Center - revised 2012
Storm Surge
Hazard Description
The National Hurricane Center defines storm surge as an abnormal rise of water generated by a storm over and above the predicted astronomical tides. Storm surge should not be confused with storm tide, which is defined as the water level rise due to the combination of storm surge and the astronomical tide. This rise in water level can cause extreme flooding in coastal areas particularly when storm surge coincides with normal high tide, resulting in storm tides reaching up to 20 feet or more in some cases (Figure 3.5.1).
Storm surge is produced by water being pushed toward the shore by the force of the winds moving cycloni-cally around the storm. The impact on surge of the low pressure associated with intense storms is minimal in comparison to the water being forced toward the shore by the wind
The maximum potential storm surge for a particular location depends on a number of different factors. Storm surge is a very complex phenomenon because it is sensitive to the slightest changes in storm inten-sity, forward speed, size (radius of maximum winds-RMW), angle of approach to the coast, central pressure (minimal contribution in comparison to the wind), and the shape and characteristics of coastal features, such as bays and estuaries (Figure 3.5.2).

Sect. 3 : 127
Mississippi Emergency Management Agency
Other factors impacting storm surge are the width and slope of the continental shelf. A shallow slope will potentially produce a greater storm surge than a steep shelf. For example, a Category 4 storm hitting the Louisiana coastline, which has a very wide and shallow continental shelf, may produce a 20-foot storm surge;, while the same hurricane in a place like Miami Beach, Florida, with the continental shelf dropping off very quickly, might see an 8 or 9-foot surge.
Figure 3.5.1Storm Surge vs. Storm Tide
(Source: NHC)
Figure 3.5.2Wind and Pressure Components of Hurricane Storm Surge
(Source: NHC)
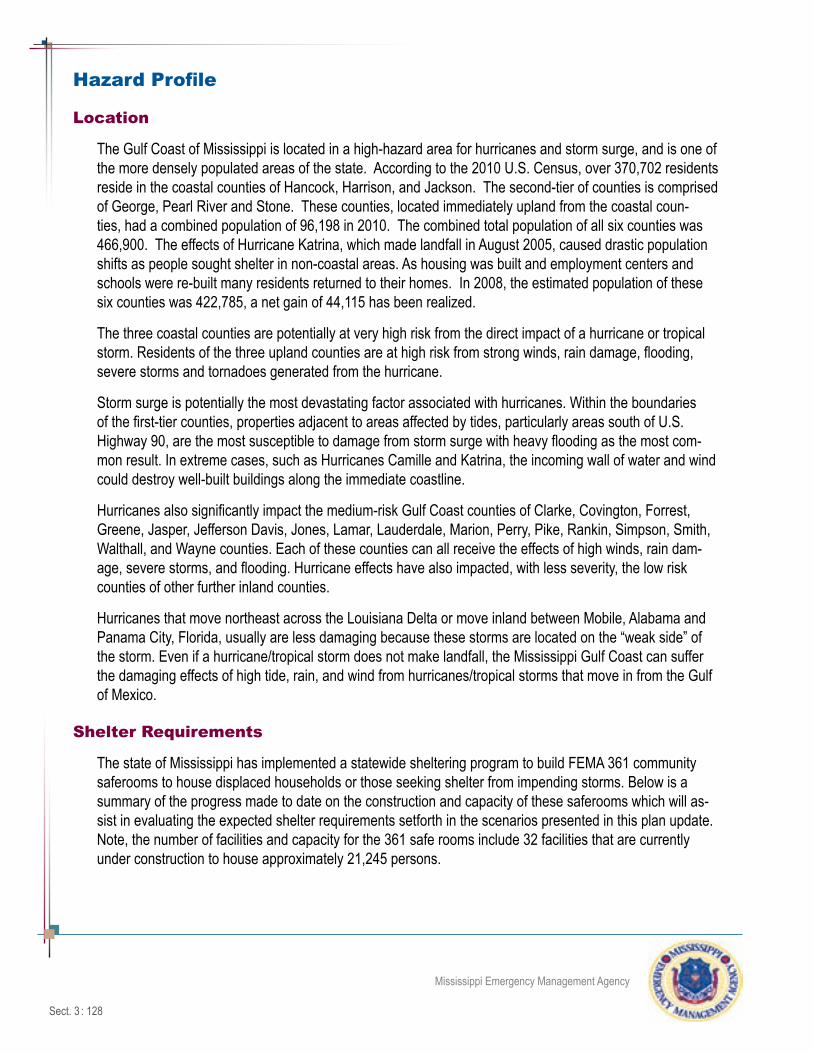
Sect. 3 : 128
Mississippi Emergency Management Agency
Hazard Profile
Location
The Gulf Coast of Mississippi is located in a high-hazard area for hurricanes and storm surge, and is one of the more densely populated areas of the state. According to the 2010 U.S. Census, over 370,702 residents reside in the coastal counties of Hancock, Harrison, and Jackson. The second-tier of counties is comprised of George, Pearl River and Stone. These counties, located immediately upland from the coastal coun-ties, had a combined population of 96,198 in 2010. The combined total population of all six counties was 466,900. The effects of Hurricane Katrina, which made landfall in August 2005, caused drastic population shifts as people sought shelter in non-coastal areas. As housing was built and employment centers and schools were re-built many residents returned to their homes. In 2008, the estimated population of these six counties was 422,785, a net gain of 44,115 has been realized.
The three coastal counties are potentially at very high risk from the direct impact of a hurricane or tropical storm. Residents of the three upland counties are at high risk from strong winds, rain damage, flooding, severe storms and tornadoes generated from the hurricane.
Storm surge is potentially the most devastating factor associated with hurricanes. Within the boundaries of the first-tier counties, properties adjacent to areas affected by tides, particularly areas south of U.S. Highway 90, are the most susceptible to damage from storm surge with heavy flooding as the most com-mon result. In extreme cases, such as Hurricanes Camille and Katrina, the incoming wall of water and wind could destroy well-built buildings along the immediate coastline.
Hurricanes also significantly impact the medium-risk Gulf Coast counties of Clarke, Covington, Forrest, Greene, Jasper, Jefferson Davis, Jones, Lamar, Lauderdale, Marion, Perry, Pike, Rankin, Simpson, Smith, Walthall, and Wayne counties. Each of these counties can all receive the effects of high winds, rain dam-age, severe storms, and flooding. Hurricane effects have also impacted, with less severity, the low risk counties of other further inland counties.
Hurricanes that move northeast across the Louisiana Delta or move inland between Mobile, Alabama and Panama City, Florida, usually are less damaging because these storms are located on the “weak side” of the storm. Even if a hurricane/tropical storm does not make landfall, the Mississippi Gulf Coast can suffer the damaging effects of high tide, rain, and wind from hurricanes/tropical storms that move in from the Gulf of Mexico.
Shelter Requirements
The state of Mississippi has implemented a statewide sheltering program to build FEMA 361 community saferooms to house displaced households or those seeking shelter from impending storms. Below is a summary of the progress made to date on the construction and capacity of these saferooms which will as-sist in evaluating the expected shelter requirements setforth in the scenarios presented in this plan update. Note, the number of facilities and capacity for the 361 safe rooms include 32 facilities that are currently under construction to house approximately 21,245 persons.

Sect. 3 : 129
Mississippi Emergency Management Agency
Mississippi Safe Room ProgramSafe Room Type County No. of Facilities Est. CapacityIndividual Statewide 10,918 28,824361 Adams, Copiah, Desoto, Forrest, George,
Hancock, Harrison, Jackson, Jones, Lafayette, Lamar, Lauderdale, Lincoln, Monroe, Neshoba, Pearl River, Pike, Rankin, Stone, Tate, Tunica and Wayne
72 52,337
Community Attala, Calhoun, Chickasaw, Holmes, Itawamba, Lafayette, Lamar, Lauderdale, Lee, Leflore, Lowndes, Madison, Monroe, Panola, Pontotoc, Prentiss, Smith, Tal-lahatchie, Tippah, Union, Wayne, Winston and Yalobusha
183 Undetermined
Source: MEMA
Education and Outreach
Hurricane Preparedness Week occurs the last week in May of each year. For more information on hur-ricane awareness call the MEMA Public Information number (866-519-6362) between 8 a.m. and 5 p.m. weekdays.
The state also participates in state, regional and national hurricane and all-preparedness conferences. Dur-ing these conferences, public and private agencies have an opportunity to receive educational and training to further their efforts in preparing for and responding to future events.
Past Occurrences
Since 1965 Mississippi has been struck by 16 hurricanes and 18 tropical storms/depressions. Tables 3.5.2 and 3.5.3 reflects the history of hurricanes and tropical storms/depressions from 1965 to 2012 in Mississippi followed by storm surge events in Table 3.5.4. Figures 3.5.3 to 3.5.5 are also provided by category to show the tracks of these storms as they entered the Gulf of Mexico.

Sect. 3 : 130
Mississippi Emergency Management Agency
Table 3.5.2Hurricane/Tropical Storm Events
Presidential Disaster Declarations - Mississippi
Event / Declaration Number Incident Period
No. of Counties Affected
Major Declaration
DeclaredHurricane Isaac DR-4081 Aug 26 - Sept 11, 2012 49 Aug 29, 2012Hurricane Gustav DR-1794 Aug 28 - Sept 8, 2008 22 Sept 22, 2008Hurricane Katrina DR-1604 Aug 29 - Oct 14, 2005 82 Aug 29, 2005Hurricane Dennis DR-1594 July 10-15, 2005 41 July 10, 2005Hurricane Ivan DR-1550 Sept 13-20, 2004 44 Sept 15, 2004Tropical Storm Isidore DR-1436 Sept 23 - Oct 6, 2002 10 Oct 1, 2002Tropical Storm Allison DR-1382 June 6-13, 2001 8 June 21, 2001Hurricane Georges DR-1251 Sept 25 - Oct 5, 1998 13 Oct 1, 1998Hurricane Elena DR-741 Aug 29 - Sept 4, 1985 4 Sept 4, 1985Hurricane Frederic DR-599 Sept 13, 1979 13 Sept 13, 1979Hurricane Camille DR-271 Aug 18, 1969 20 Aug 18, 1969Hurricane Betsy DR-210 Sept 25, 1965 No County Information Sept 25, 1965Source: FEMA Disaster Declarations-Mississippi
Table 3.5.3Mississippi Hurricane & Tropical Storm History
Non-Declared Events
Incident NameEvent Date County(s) Affected Deaths Injuries
Property Damage
Tropical Storm Isaac 8/28/2012 Adams, Amite, Claiborne, Copiah, Covington, Forrest, Franklin, Hancock, Harrison, Hinds, Issaquena, Jackson, Jefferson, Jefferson Davis, Jones, La-mar, Lawrence, Lincoln, Marion, Pearl River, Pike, Rankin, Simpson, Smith, Walthall, Wilkinson and Warren
1 2 $7,375,000
Tropical Storm Lee 9/2/2011 Amite, Hancock, Harrison, Jackson, Pearl River, Pike and Wilkinson
0 0 $55,000
Tropical Storm Ida 11/9/2009 Forrest, Hancock, Harrison and Pearl River
0 0 $0
Tropical Storm Ike 9/11/2008 Hancock, Harrison, and Jackson 0 0 $0

Sect. 3 : 131
Mississippi Emergency Management Agency
Incident NameEvent Date County(s) Affected Deaths Injuries
Property Damage
Tropical Storm Gustav
9/2/2008 Adams, Claiborne, Copiah, Forrest, Franklin, Jefferson, Jefferson Davis, Lamar, Lawrence, Lincoln and Marion
0 0 $5,850,000
Tropical Depression Rita
9/25/2005 Coahoma and Tunica 0 0 $10,000
Hurricane Rita 9/24/2005 Adams, Bolivar, Carroll, Claiborne, Copiah, Franklin, Hinds, Holmes, Humphreys, Issaquena, Jefferson, Jefferson Davis, Lawrence, Leflore, Lincoln, Madison, Marion, Rankin, Sharkey, Simpson, Sunflower, Warren, Washington and Yazoo
0 0 $485,000
Tropical DepressionDennis
7/11/2005 Calhoun, Chickasaw, Itawamba, Lee and Union
0 0 $35,000
Hurricane Cindy 7/5/2005 Hancock, Harrison, Jackson and Pearl River
0 0 $9,000,000
Tropical Storm Cindy 7/5/2005 Forrest, George, Greene, Lamar and Stone
0 0 $200,000
Tropical Storm Arlene 6/10/2005 Clarke, Clay, Hancock, Harrison, Jack-son, Kemper, Lauderdale, Lowndes, Noxubee and Oktibbhea
0 0 $445,000
Tropical Storm Matthew
10/9/2004 Hancock, Harrison and Jackson 0 0 $20,000
Tropical StormIvan
9/16/2004 Chickasaw, Itawamba, Lee and Monroe
1 0 $30,000
Tropical Storm Bill 6/30/2003 Clarke, Covington, Forrest, Hancock, Harrison, Jackson, Jasper, Jefferson Davis, Jones, Kemper, Lamar, Lauder-dale, Marion, Newton, Pearl River and Smith
0 0 $1,200,000
Hurricane Lili 10/3/2002 Adams, Amite, Attala, Carroll, Cov-ington, Hancock, Harrison, Hinds, Jackson, Jasper, Leake, Leflore, Madison, Pearl River, Pike, Scott, Smith, Walthall, Warren, Washington, Wilkinson and Yazoo
0 0 $13,900,000
Tropical Storm Hanna 9/14/2002 Hancock, Harrison and Jackson 0 0 $0Tropical Storm Bertha 8/4/2002 Hancock, Harrison and Jackson 0 0 $50,000

Sect. 3 : 132
Mississippi Emergency Management Agency
Incident NameEvent Date County(s) Affected Deaths Injuries
Property Damage
Tropical Storm Her-mine
9/19/1998 Hancock, Harrison, Jackson and Pearl River
0 0 $85,000
Tropical Storm Earl 9/2/1998 Hancock, Harrison and Jackson 0 0 $0Hurricane Danny 7/17/1997 Hancock, Harrison and Jackson 0 0 $0Hurricane Opal 10/4/1995 Hancock, Harrison and Jackson 0 1 $75,000Hurricane Erin 8/20/1995 Greene, Perry and Wayne 0 0 $100,000Source: NCDC
Table 3.6.4Storm Surge History
Date County Property Damage ($) Date County Property Damage ($)8/28/2012 Jackson $600,000 7/5/2005 Hancock $500,000
Harrison $2,100,000 Harrison $300,000Hancock $2,100,000 Jackson $200,000
9/2/2011 Jackson $10,000 10/9/2004 Hancock $15,000Hancock $10,000 Harrison $15,000Harrison $10,000 9/15/2004 Harrison $400,000
9/11/2008 Harrison $0 Jackson $1,200,000Jackson $0 Hancock $400,000Hancock $0 6/30/2003 Jackson $250,000
9/1/2008 Hancock $1,250,000 Hancock $500,000Harrison $750,000 Harrison $250,000Jackson $500,000 10/13/2001 Hancock $0
8/29/2005 Hancock $3,380,000 2/15/1998 Harrison $250,000Harrison $5,630,000 Hancock $500,000Jackson $2,250,000,000 Jackson $250,000
Total Estimated Property Damage $2,266,340,000Source: NCDC

Sect. 3 : 133
Mississippi Emergency Management Agency
Figure 3.5.3Category 1 and 2 Historical Hurricanes
1852-2012Source: www.csc.noaa.gov/hurricanes

Sect. 3 : 134
Mississippi Emergency Management Agency
Figure 3.5.4Category 3, 4 and 5 Historical Hurricanes
1852-2012Source: www.csc.noaa.gov/hurricanes
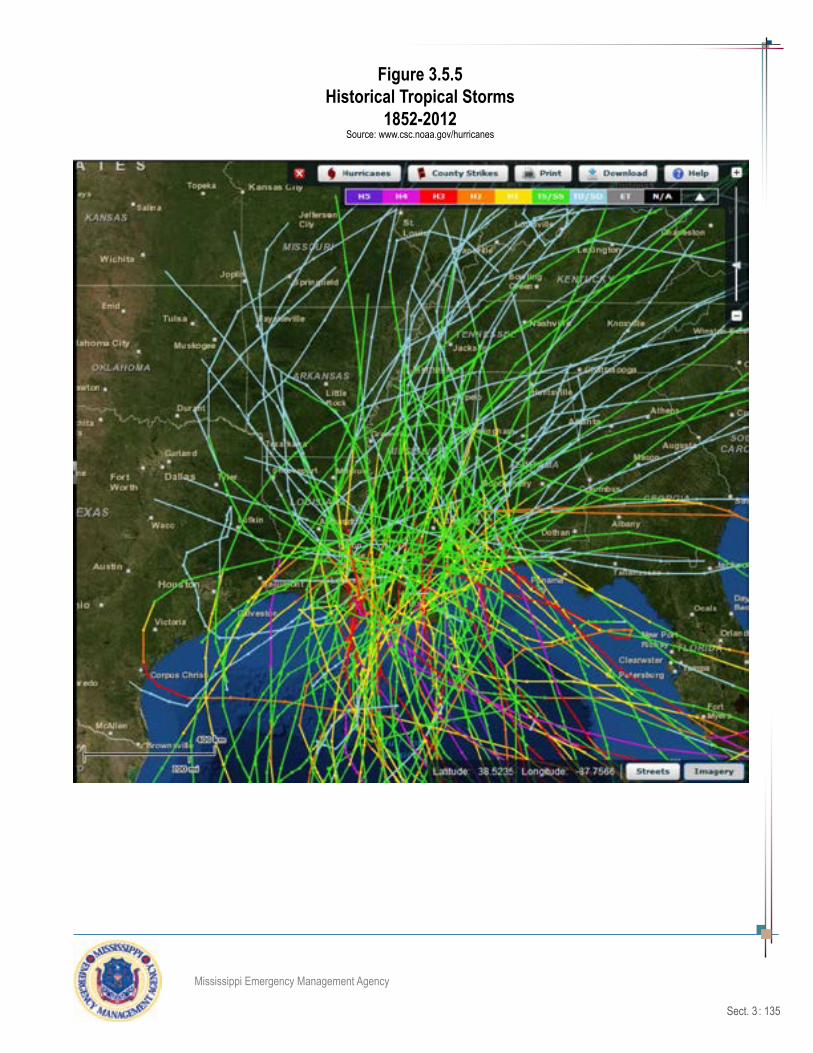
Sect. 3 : 135
Mississippi Emergency Management Agency
Figure 3.5.5Historical Tropical Storms
1852-2012 Source: www.csc.noaa.gov/hurricanes

Sect. 3 : 136
Mississippi Emergency Management Agency
Summaries of the Presidentially declared disaster events that have occurred over the past ten years is provided below. The summaries also include data from the NCDC and FEMA on the impacts to people and property and the public assistance dollars obligated.
August 28, 2012–Hurricane IsaacHurricane Isaac entered the Gulf of Mexico as a tropical storm on August 26, 2012 moving northwest after crossing Haiti, Cuba and the Florida Straits. Isaac moved slowly north northwest over the eastern Gulf Isaac strengthened into a hurricane on the morning of the 28th when it was 75 miles south southeast of the mouth of the Mississippi River. Isaac made landfall in Plaquemines Parish as a Category 1 Hurricane near Southwest Pass of the Mississippi River on the evening of the 28th. A second landfall occurred near Port Fourchon the following morning. The storm weakened to a tropical storm on the afternoon of the 29th about 50 miles west southwest of New Orleans, and weakened further to a tropical depression on the afternoon of the 30th near Monroe, Louisiana.
Even though Isaac was of hurricane status from near the mouth of the Mississippi River into southeast Lou-isiana, only tropical storm force winds were recorded on land areas of Mississippi. The maximum sustained wind in south Mississippi was 46 knots or 53 mph measured at the Gulfport- Biloxi-Airport during the early afternoon of August 29th. A portable weather station (Weatherflow Inc) near Gulfport measured a 48 knot gust, or 55 mph, late on the morning of August 29. Maximum wind gust of 58 knots or 67 mph was recorded at the NOAA NOS Bay Waveland station and also at Gulfport (Weatherflow Inc) late on the morning of Aug 29. The long duration of tropical storm force winds downed some trees and power lines across the region.
The minimum sea level pressure measured from a land station was 995.9 mb the NOAA-NOS station at Bay-Waveland station during the early morning of Aug 29th. A storm tide ranged from approximately 5 feet in Jackson County to nearly 10 feet in Hancock County closer to Isaac’s center. These values are ap-proximately 3 to 8 feet above normal astronomical values. Storm surge flooding impacts were greatest in Hancock County. Persistent rain bands affected south Mississippi, especially the coastal sections produced heavy rainfall over a three day period. 10 to 20 inches of rainfall was common across the region. A co-operative observer near Pascagoula recorded the maximum reading of 22.20 inches of rain. Heavy rainfall produced both flash flooding and later moderate-to-major river flooding. Record crests were observed on the Wolf River near Landon (August 31) and Gulfport (September 1), and the East Hobolochitto River near Cesear (Aug 31). Storm surge and high tides restricted outflow of the rivers near the coast and lakes exacerbating flooding of low lying areas along rivers and bayous near the coast as they emptied into the Gulf. There were two weak tornadoes documented that occurred along Mississippi coast which resulted in generally minor property damage
Overall, impacts from Isaac resulted in millions of dollars in damages in south Mississippi and one direct fa-tality. Much of the damage in the coastal counties of Hancock, Harrison, and Jackson, damage was related to storm surge on the coast, flash flooding, or river flooding. The chart below provides a summary of the reported impacts to people and property damage from NCDC and the dollars obligated to date for public assistance through FEMA.

Sect. 3 : 137
Mississippi Emergency Management Agency
Counties Affected 49
Deaths 1
Injuries 2
Estimated Property Damage $7,375,000Source: NCDC
Public Assistance Dollars Obligated Declared Counties
Total Public Assistance Grants
Emergency Work (Categories A-B)
Permanent Work (Categories C-G)
$37,002,798 $23,061,498 $13,941,300Source: FEMA May 30, 2013
Satellite image of Hurricane Isaac

Sect. 3 : 138
Mississippi Emergency Management Agency
September 1, 2008–Hurricane GustavHurricane Gustav made landfall as a Category 2 hurricane near Cocodrie, LA during the morning of Sep-tember 1, 2008. Gustav continued to move northwest and weakened to a Category 1 storm over south central Louisiana later that day. The highest wind gust recorded in south Mississippi was 74 mph at the Gulfport-Biloxi International Airport while the highest sustained wind of 54 mph was recorded at the Wave-land Yacht Club. No official wind observations were available in far southwest Mississippi; however hurri-cane force wind gusts may have occurred. Rainfall varied considerably ranging from around 4 to 10 inches. Gustav produced mainly light wind damage across coastal Mississippi, although more significant and con-centrated damage occurred in southwest Mississippi closer to the track of center of the storm. Widespread power outages occurred in southern Mississippi.
Counties Affected 22
Deaths 0
Injuries 0
Estimated Property Damage $19,370,000Source: NCDC
Public Assistance Dollars Obligated Declared Counties
Total Public Assistance Grants
Emergency Work (Categories A-B)
Permanent Work (Categories C-G)
$33,702,564 $19,932,178 $12,657,491Source: FEMA May 30, 2013
Satellite image of Hurricane Gustav

Sect. 3 : 139
Mississippi Emergency Management Agency
August 28, 2005 - Hurricane KatrinaHurricane Katrina was one of the most destructive hurricanes on record to impact the coast of the United States. It was one the worst natural disasters in the history of the U.S., resulting in catastrophic damage and numerous casualties along the Mississippi coast. Damage and casualties resulting from Hurricane Katrina extended as far east as Alabama and the panhandle of Florida. Post-event analysis by the National Hurricane Center indicates that Katrina weakened slightly before making landfall as a strong Category 3 storm in initial landfall in lower Plaquemines Parish. The storm continued on a north northeast track with the center passing about 40 miles southeast of New Orleans with a second landfall occurring near the Louisi-ana and Mississippi border as a Category 3 storm with maximum sustained winds estimated at 121 mph. Katrina continued to weaken as it moved north-northeast across Mississippi during the day, but remained at hurricane strength 100 miles inland.
Damage across coastal Mississippi was catastrophic. The storm surge associated with Hurricane Katrina approached or exceeded the surge associated with Hurricane Camille (1969) and impacted a much more extensive area. Almost total destruction was observed along the immediate coast in Hancock and Harrison Counties with storm surge damage extending north along bays and bayous to Interstate 10. Thousands of homes and businesses were destroyed by the storm surge. Hurricane-force winds also caused damage to roofs, power lines, signage, downed trees, and some windows were broken by wind and wind-driven debris in areas away from storm surge flooding, wind damage was widespread with fallen trees taking a heavy toll on houses and power lines. Excluding losses covered by the National Flood Insurance Program (NFIP), insured property losses in Mississippi were estimated at $9.8 billion dollars. Uninsured and insured losses combined were estimated to exceed $100 billion dollars across the Gulf Coast.
Satellite image of Hurricane Katrina

Sect. 3 : 140
Mississippi Emergency Management Agency
The NCDC reports that tide gauges were destroyed by Hurricane Katrina; therefore, storm surge was de-termined by post storm high water marks. It was estimated that the storm surge along Harrison County was between 19 and 25 feet, 23 feet was recorded at the Hancock County EOC operations area in Waveland, and the high water mark measured on the Jackson County EOC building in Pascagoula was 16.1 feet. Storm total rainfall amounts generally ranged from 10 to 16 inches across coastal and south Mississippi with much lower amounts observed over southwest Mississippi. The highest observed storm total rainfall was 11 inches at Stennis Space Center and near Picayune.
With all 82 counties eventually being included in the Presidential Disaster Declaration, the impacts of Hur-ricane Katrina, both direct and indirect, continue to be felt today, and have resulted in significant challenges facing our citizens, local governments and the state. Never before have we experienced the total destruc-tion of communities and cities. Virtually every element of society that makes a community - homes, busi-ness, schools, places of worship, healthcare and government were destroyed in Bay St. Louis, Waveland, Pass Christian and Long Beach.
The challenges of rebuilding these communities that experienced total loss of their tax base and sales tax revenues continue today. Affordable housing and total rebuilding of infrastructure continue to strain resourc-es available to many local governments. Cities and counties throughout the state wrestle with increased population as a result of evacuees who have decided not to return to areas of Louisiana and the Mississippi Gulf Coast, straining availability of affordable housing, inadequate infrastructure, and the ability of local governments to provide basic services.
To help understand the total effects of this catastrophic event, a storm surge and HAZUS final wind field figures are presented as Figures 3.5.6 and 3.5.7.
Counties Affected 82
Deaths 238
Injuries Undetermined
Estimated Property Damage $80,000,000,000Source: NCDC
Public Assistance Dollars Obligated Declared Counties
Total Public Assistance Grants
Emergency Work (Categories A-B)
Permanent Work (Categories C-G)
$3,237,615,391 $1,170,007,750 $1,885,105,865Source: FEMA May 30, 2013

Sect. 3 : 141
Mississippi Emergency Management Agency
Figure 3.5.6Hurricane Katrina Storm Surge Map
Figure 3.5.7Hurricane Katrina
Peak Gust by Census Track HAZUS and Wind Field
Peak Gust by Census TrackHAZUS Final Wind Field
Mississippi Counties
Storm Track
Peak Wind GustHAZUS/Census Tract
0 - 50
51 - 70
71 - 90
91 - 110
111 - 130
131 - 155
0 30 60 9015Miles
¯

Sect. 3 : 142
Mississippi Emergency Management Agency
July 10, 2005 – Hurricane DennisHurricane Dennis entered the Gulf of Mexico as a hurricane. After crossing over Cuba, the hurricane moved into the central Gulf of Mexico and strengthened to a Category 4 hurricane on July 10th. Hurricane Dennis weakened to a Category 3 hurricane prior to making landfall along the western Florida panhandle. The Mis-sissippi Gulf Coast felt some tropical weather from Hurricane Dennis. The highest wind gusts over land in Mississippi were reported at Keesler Air Force Base at 46 mph. The high-est wind gusts over water adjacent to Missis-sippi weas 52 mph from a buoy located 22 miles south-southeast of Biloxi. Rainfall on the Mississippi Gulf Coast was reported to be less than 2 inches. The lowest reported pressure on the Mississippi Gulf Coast was 994.2 mb, and the highest reported tide was 4 feet MMSL at Waveland (NCDC: Event Details). Harrison County received public assistance under a Presidential Disaster Declaration.
Satellite image of Hurricane Dennis
Counties Affected 41
Deaths 0
Injuries 0
Estimated Property Damage $2,550,000Source: NCDC
Public Assistance Dollars Obligated Declared Counties
Total Public Assistance Grants
Emergency Work (Categories A-B)
Permanent Work (Categories C-G)
$1,707,563 $1,735,639 $0Source: FEMA May 30, 2013
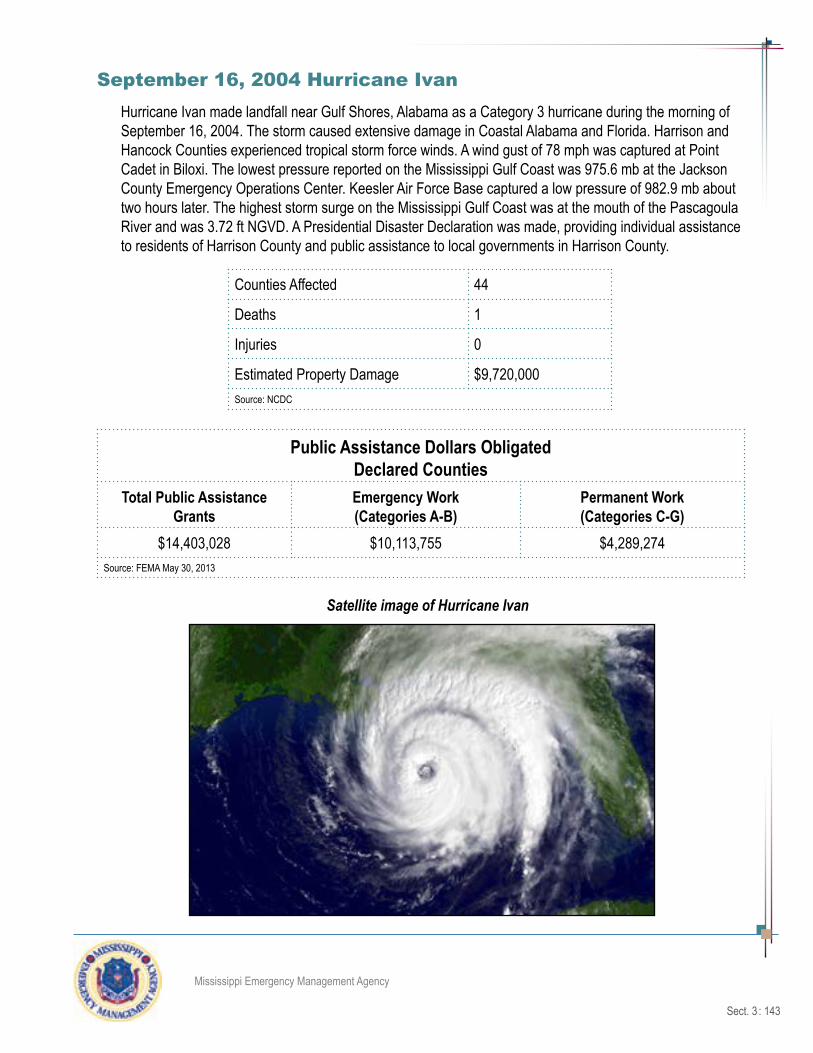
Sect. 3 : 143
Mississippi Emergency Management Agency
September 16, 2004 Hurricane IvanHurricane Ivan made landfall near Gulf Shores, Alabama as a Category 3 hurricane during the morning of September 16, 2004. The storm caused extensive damage in Coastal Alabama and Florida. Harrison and Hancock Counties experienced tropical storm force winds. A wind gust of 78 mph was captured at Point Cadet in Biloxi. The lowest pressure reported on the Mississippi Gulf Coast was 975.6 mb at the Jackson County Emergency Operations Center. Keesler Air Force Base captured a low pressure of 982.9 mb about two hours later. The highest storm surge on the Mississippi Gulf Coast was at the mouth of the Pascagoula River and was 3.72 ft NGVD. A Presidential Disaster Declaration was made, providing individual assistance to residents of Harrison County and public assistance to local governments in Harrison County.
Counties Affected 44
Deaths 1
Injuries 0
Estimated Property Damage $9,720,000Source: NCDC
Public Assistance Dollars Obligated Declared Counties
Total Public Assistance Grants
Emergency Work (Categories A-B)
Permanent Work (Categories C-G)
$14,403,028 $10,113,755 $4,289,274Source: FEMA May 30, 2013
Satellite image of Hurricane Ivan

Sect. 3 : 144
Mississippi Emergency Management Agency
September 26, 2002-Tropical Storm IsidoreTropical Storm Isidore made landfall near Grand Isle, LA during the early morning of September 26, 2002. The tropical storm moved north across southeast Louisiana and by the evening was located in central Mississippi, where it was downgraded to a tropi-cal depression. Tropical Storm Isidore had a large circulation with tropical storm force winds extend-ing several hundred miles from its center. Tide levels were generally 4 to 7 feet above normal, with locally higher levels, across much of coastal Mississippi. Significant beach erosion occurred along the coast and on the barrier islands. The maximum storm surge reading on the Mississippi Coast was 7.61 feet NGVD at the Corps of Engineers tide gage at Gulfport Harbor, and 6.86 feet NGVD in Biloxi Bay at Point Cadet. There were two fatalities on the Mississippi Coast related to the tropical storm; one direct and another indirect. Rainfall amounts associated with Isidore were generally 5 to 8 inches and resulted in some river flooding and flash flooding. Approximately 2,500 homes in Hancock County, 1,400 homes in Harrison Coun-ty were flooded, primarily as the result of storm surge, with river flooding and flash flooding causing some of the flood damage.
Counties Affected 10
Deaths 1
Injuries 0
Estimated Property Damage $25,500,000Source: NCDC
Public Assistance Dollars Obligated Declared Counties
Total Public Assistance Grants
Emergency Work (Categories A-B)
Permanent Work (Categories C-G)
$6,784,617 $999,661 $5,784,956Source: FEMA May 30, 2013
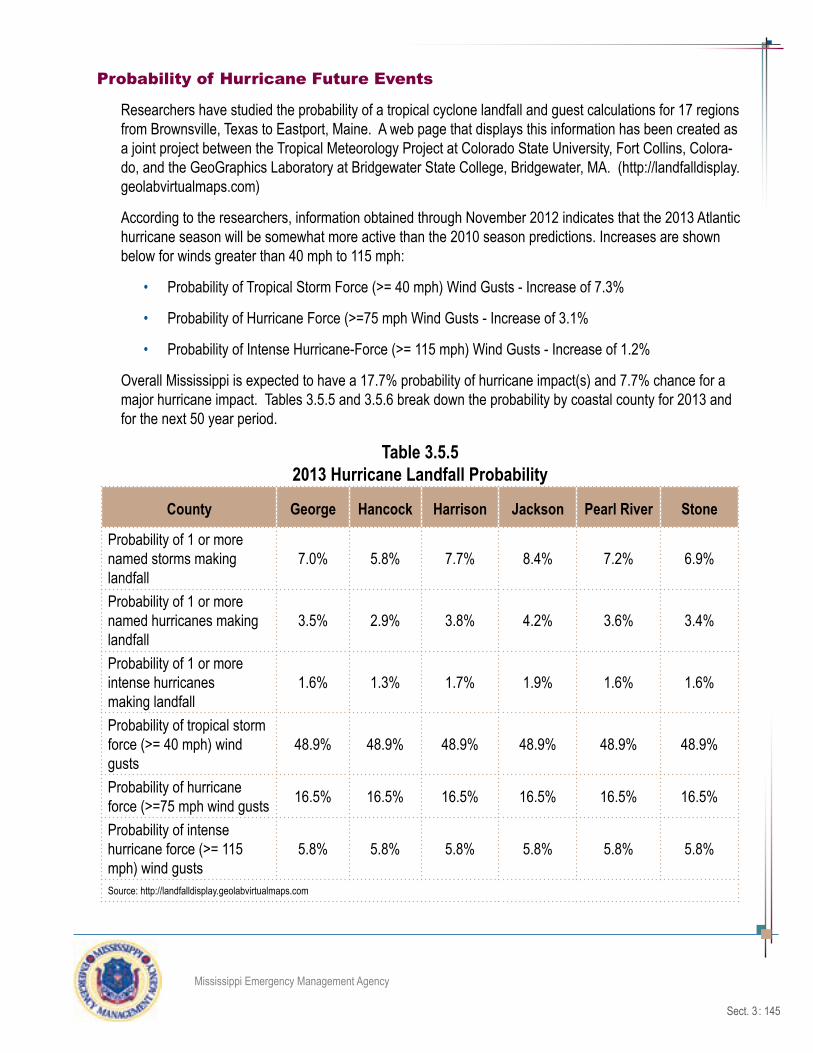
Sect. 3 : 145
Mississippi Emergency Management Agency
Probability of Hurricane Future Events
Researchers have studied the probability of a tropical cyclone landfall and guest calculations for 17 regions from Brownsville, Texas to Eastport, Maine. A web page that displays this information has been created as a joint project between the Tropical Meteorology Project at Colorado State University, Fort Collins, Colora-do, and the GeoGraphics Laboratory at Bridgewater State College, Bridgewater, MA. (http://landfalldisplay.geolabvirtualmaps.com)
According to the researchers, information obtained through November 2012 indicates that the 2013 Atlantic hurricane season will be somewhat more active than the 2010 season predictions. Increases are shown below for winds greater than 40 mph to 115 mph:
• Probability of Tropical Storm Force (>= 40 mph) Wind Gusts - Increase of 7.3%
• Probability of Hurricane Force (>=75 mph Wind Gusts - Increase of 3.1%
• Probability of Intense Hurricane-Force (>= 115 mph) Wind Gusts - Increase of 1.2%
Overall Mississippi is expected to have a 17.7% probability of hurricane impact(s) and 7.7% chance for a major hurricane impact. Tables 3.5.5 and 3.5.6 break down the probability by coastal county for 2013 and for the next 50 year period.
Table 3.5.52013 Hurricane Landfall Probability
County George Hancock Harrison Jackson Pearl River Stone
Probability of 1 or more named storms making landfall
7.0% 5.8% 7.7% 8.4% 7.2% 6.9%
Probability of 1 or more named hurricanes making landfall
3.5% 2.9% 3.8% 4.2% 3.6% 3.4%
Probability of 1 or more intense hurricanes making landfall
1.6% 1.3% 1.7% 1.9% 1.6% 1.6%
Probability of tropical storm force (>= 40 mph) wind gusts
48.9% 48.9% 48.9% 48.9% 48.9% 48.9%
Probability of hurricane force (>=75 mph wind gusts 16.5% 16.5% 16.5% 16.5% 16.5% 16.5%
Probability of intense hurricane force (>= 115 mph) wind gusts
5.8% 5.8% 5.8% 5.8% 5.8% 5.8%
Source: http://landfalldisplay.geolabvirtualmaps.com

Sect. 3 : 146
Mississippi Emergency Management Agency
Table 3.5.650 Year Hurricane Landfall Probability
County George Hancock Harrison Jackson Pearl River StoneProbability of 1 or more named storms making landfall
88.0% 82.7% 90.3% 92.5% 88.6% 87.4%
Probability of 1 or more named hurricanes making landfall
64.2% 57.3% 67.6% 71.4% 65.0% 63.4%
Probability of 1 or more intense hurricanes making landfall
36.9% 31.8% 39.7% 42.9% 37.6% 36.3
Probability of tropical storm force (>= 40 mph) wind gusts
>99.9% >99.9% >99.9% >99.9% >99.9% >99.9%
Probability of hurricane force (>=75 mph wind gusts 99.6% 99.6% 99.6% 99.6% 99.6% 99.6%
Probability of intense hurricane force (>= 115 mph) wind gusts
82.3% 82.3% 82.3% 82.3% 82.3% 82.3%
Source: http://landfalldisplay.geolabvirtualmaps.com
Assessing VulnerabilityIn assessing Mississippi’s vulnerability to damage and loss of life from hurricanes and tropical storms, at the top of the list is loss of life and property due to flooding. Mississippi’s citizens are vulnerable to hurri-canes. The very young, the elderly and the handicapped are especially vulnerable to harm from hurricanes. Not only are resident’s homes vulnerable to hurricanes, but also public buildings, infrastructure and natural resources are all subject to damage. In some cases, the damage to natural resources cannot be restored to pre-incident levels.
Damages from Flooding Due to HurricanesTorrential rains from hurricanes and tropical storms can produce extensive urban and riverine flooding. Winds from these storms located offshore can drive ocean water up the mouth of a river, compounding the severity of inland overbank flooding.
In addition to the combined destructive forces of wind, rain, and lightning, hurricanes can cause a “surge” in the ocean, which can raise the sea level as high as 25 feet or more in the strongest hurricanes. This “storm surge” also can have the opposite effect, in that the sea level can be lowered to below mean sea level at the backside of a hurricane. This phenomenon causes more destruction as storm surge waters are sucked back out to sea. For more information on flood-related losses from hurricanes see the flood section of the risk assessment.

Sect. 3 : 147
Mississippi Emergency Management Agency
Vulnerability of People to Hurricanes
For those who are unable to evacuate for medical reasons, there should be provision to take care of special-needs patients and those in hospitals and nursing homes. Many of these patients are either oxy-gen-dependent, insulin-dependent, or in need of intensive medical care. There is a need to provide ongoing treatment for these vulnerable citizens, either on the coast or by air evacuation to upland hospitals. The stress from disasters such as a hurricane can result in immediate and long-term physical and emotional health problems among victims.
According to U.S. Census Bureau 2008-2010 American Community Survey, there were 7,073 non-institu-tionalized persons in residing in Hancock County in 2010 with a certain disabilities. There were 27,210 in Harrison County and 21,398 in Jackson County. The types of disabilities include: hearing, vision, cognitive, ambulatory, self-care, and/or independent living difficulties. Together these counties accounted for a total of 55,681 persons with disabilities who could possibly be in need of help to survive the effects of a hurricane.
Total population vulnerability in the high-risk counties has decreased somewhat post for Jackson and Harri-son Counties and a slight increaese for Hancock County. Table 3.5.7 compares 2000 and 2010 populations. This area is still in a state of flux in terms of its population as the recovery from Katrina is ongoing. See the discussion in growth and development trends in Section 3.11 for more detail on the population shifts as a result of Katrina.
Table 3.5.7Vulnerable Populations in High Risk Counties Updated
County City 2000 Population 2010 Population
Jackson
Pascagoula 26,200 22,392Moss Point 15,851 13,704Gautier 11,681 18,572Ocean Springs 17,255 17,442Jackson County (unincorporated area) 60,433 58,584
Jackson County Totals 131,420 130,694
Harrison
Biloxi 50,644 44,054Gulfport 71,127 67,793
Pass Christian 6,579 4,613D’Iberville 7,608 9,486
Long Beach 17,320 14,792Harrison County
(unincorporated area) 36,320 46,367
Harrison County Totals 189,598 187,105
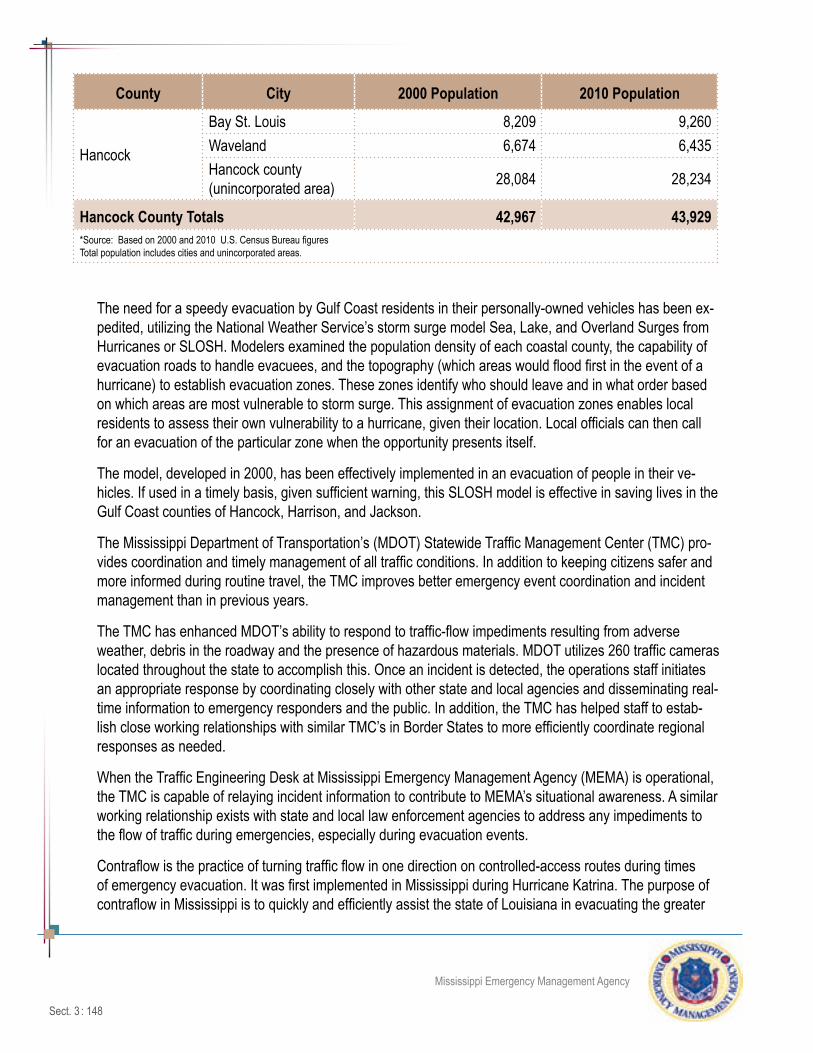
Sect. 3 : 148
Mississippi Emergency Management Agency
County City 2000 Population 2010 Population
Hancock
Bay St. Louis 8,209 9,260Waveland 6,674 6,435Hancock county (unincorporated area) 28,084 28,234
Hancock County Totals 42,967 43,929*Source: Based on 2000 and 2010 U.S. Census Bureau figures Total population includes cities and unincorporated areas.
The need for a speedy evacuation by Gulf Coast residents in their personally-owned vehicles has been ex-pedited, utilizing the National Weather Service’s storm surge model Sea, Lake, and Overland Surges from Hurricanes or SLOSH. Modelers examined the population density of each coastal county, the capability of evacuation roads to handle evacuees, and the topography (which areas would flood first in the event of a hurricane) to establish evacuation zones. These zones identify who should leave and in what order based on which areas are most vulnerable to storm surge. This assignment of evacuation zones enables local residents to assess their own vulnerability to a hurricane, given their location. Local officials can then call for an evacuation of the particular zone when the opportunity presents itself.
The model, developed in 2000, has been effectively implemented in an evacuation of people in their ve-hicles. If used in a timely basis, given sufficient warning, this SLOSH model is effective in saving lives in the Gulf Coast counties of Hancock, Harrison, and Jackson.
The Mississippi Department of Transportation’s (MDOT) Statewide Traffic Management Center (TMC) pro-vides coordination and timely management of all traffic conditions. In addition to keeping citizens safer and more informed during routine travel, the TMC improves better emergency event coordination and incident management than in previous years.
The TMC has enhanced MDOT’s ability to respond to traffic-flow impediments resulting from adverse weather, debris in the roadway and the presence of hazardous materials. MDOT utilizes 260 traffic cameras located throughout the state to accomplish this. Once an incident is detected, the operations staff initiates an appropriate response by coordinating closely with other state and local agencies and disseminating real-time information to emergency responders and the public. In addition, the TMC has helped staff to estab-lish close working relationships with similar TMC’s in Border States to more efficiently coordinate regional responses as needed.
When the Traffic Engineering Desk at Mississippi Emergency Management Agency (MEMA) is operational, the TMC is capable of relaying incident information to contribute to MEMA’s situational awareness. A similar working relationship exists with state and local law enforcement agencies to address any impediments to the flow of traffic during emergencies, especially during evacuation events.
Contraflow is the practice of turning traffic flow in one direction on controlled-access routes during times of emergency evacuation. It was first implemented in Mississippi during Hurricane Katrina. The purpose of contraflow in Mississippi is to quickly and efficiently assist the state of Louisiana in evacuating the greater
Sect. 3 : 149
Mississippi Emergency Management Agency
New Orleans area by reversing southbound lanes of I-55 and I-59 to northbound flow. Contraflow is only implemented when requested by Louisiana and approved by the Governor of Mississippi. After Hurricane Katrina, MDOT’s post-disaster evaluation results indicated that changes should be made to contraflow in to improve operations. The primary improvement included extending the termination point of I-59 contra-flow to just south of Hattiesburg. During Hurricane Katrina, I-59 contraflow in Mississippi extended from the Mississippi/Louisiana state line to just south of Poplarville. Contraflow for I-55 began in Louisiana and extended into Mississippi to just south of Brookhaven. An evacuation and contraflow maps with primary and alternate evacuation routes is provided in Appendix 7.3.5-A.
Loss of Life from Hurricanes
In general, loss of life and property due to high winds is confined to the coastal area. This loss of life is due to wind-borne glass, building materials, and limbs and shrubs. Upland losses can be attributed to rain dam-age and flooding as well as tornadoes. Flooded road crossings in upland and coastal areas seem to involve a greater loss of life to people in automobiles.
Most deaths due to hurricanes are flood-related. Both coastal and inland flooding is a common occurrence with hurricanes and tropical storms. The death toll from Mississippi hurricanes amounts to 391 persons. This includes 238 persons who died in Hurricane Katrina, 152 who died in Hurricane Camille and two who died upland in Hurricane Georges. Ninety percent of the deaths in hurricanes involve water-related or flood-ing deaths. The remaining deaths are due to the impacts of wind and wind-borne projectiles.
Effective warnings, and timely evacuation from coastal areas inundated by storm surge have shown a dra-matic reduction in deaths. Evacuation ensures that nobody remains present in the hazard area.
Vulnerability of Natural Resources to Hurricanes
Natural resources, particularly beaches, are devastated by hurricanes. The erosion of the coastline is con-siderable due to the impact of wind, waves, and debris in a hurricane event. Beaches need to be replen-ished with appropriate materials to reduce erosion. Storm surge and subsequent erosion of the shoreline leads to the loss of property. The Barrier Islands - Cat, Horn, Petit Bois, and Ship - protecting the Missis-sippi Gulf Coast have seen damage from earlier events and are projected to disappear within years.
Inland rivers and lakes can become clogged with wind-blown debris and trees, thus slowing recovery from a hurricane. Obstructions, if not removed, can become a cause for flooding.
Trees that are blown down to the forest floor quickly become a target for infestation from insects that may spread to healthy trees. Water quality may suffer due to unwanted debris and vegetation blown in from a hurricane. Potential debris from fallen trees affected by hurricanes and tornadoes that often accompany them, can create wildfires when the area dries sufficiently to allow for burning through lightning or interven-tion by mankind. The Mississippi State Forestry Commission is quick to ensure, through proactive cutting and prescribed burns, that fallen trees and debris will not become fuel for a wildfire. It is also important to note that 22 counties within Mississippi have developed County Wildfire Protection Plans that are further discussed in the Wildfire section of this plan. These plans address proactive measures to mitigate debris through the identification of vulnerable areas and recommendations for mitigation projects and structure ignitability.
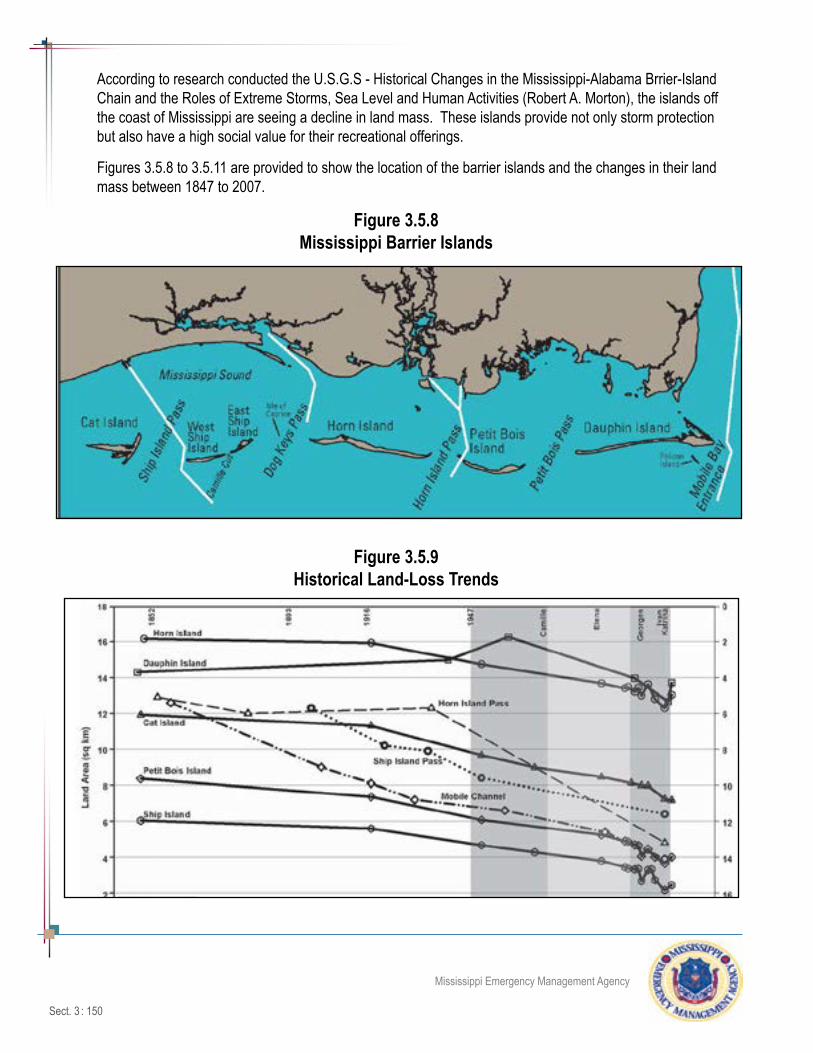
Sect. 3 : 150
Mississippi Emergency Management Agency
According to research conducted the U.S.G.S - Historical Changes in the Mississippi-Alabama Brrier-Island Chain and the Roles of Extreme Storms, Sea Level and Human Activities (Robert A. Morton), the islands off the coast of Mississippi are seeing a decline in land mass. These islands provide not only storm protection but also have a high social value for their recreational offerings.
Figures 3.5.8 to 3.5.11 are provided to show the location of the barrier islands and the changes in their land mass between 1847 to 2007.
Figure 3.5.8 Mississippi Barrier Islands
Figure 3.5.9 Historical Land-Loss Trends

Sect. 3 : 151
Mississippi Emergency Management Agency
Figures 3.5.10 Cat and Ship Islands

Sect. 3 : 152
Mississippi Emergency Management Agency
Figures 3.5.11 Petit Bois and Horn Islands

Sect. 3 : 153
Mississippi Emergency Management Agency
Vulnerability of Private Improvements to Hurricanes
Homes, businesses, and manufactured homes are especially vulnerable to the effects of a hurricane and the winds, rain, and tornadoes generated by a hurricane. The effects of storm surge can flatten a house.
Although hurricane winds can exert tremendous pressure against homes, a large fraction of hurricane damage is not from the wind itself, but from airborne missiles such as tree limbs and branches, signs and sign posts, roof tiles, metal siding and other pieces of buildings, including entire roofs in major storms. This wind-borne debris penetrates doors and windows, and allows the force of the wind to act against interior walls and ceilings not designed to withstand such forces, thus blowing the building apart.
Local Plan Risk Assessment SummaryBelow is a summary of the risk classification identified in the individual local mitigation plans by MEMA Region.
MEMA Region Low Medium High MEMA Region Low Medium High1 2 5 1 6 - - 102 - 1 - 7 - - 103 1 2 4 8 - 6 34 1 - 6 9 - 2 165 1 28 2
Assessing Vulnerability by JurisdictionMississippi has had 12 declared hurricane/tropical storm disaster declarations. Table 3.5.8 provides infor-mation on the coastal and inland counties that have been declared in previous hurricanes/tropical storm events in order to establish frequency and vulnerability to hurricane/tropical storm damage. In Camille and Katrina, for example, central Mississippi counties as well as coastal counties received damage. These inci-dents cover the period 1969 to 2012, a 43-year period. The counties are sorted with those with the greatest number of declarations listed first to the least.

Sect. 3 : 154
Mississippi Emergency Management Agency
Table 3.5.8Counties Declared in Hurricane/Tropical Storm Events
County Cam
ille D
R-27
1
Fred
eric
DR-5
99
Elen
a DR-
741
Geor
ges D
R-12
51
T.S. A
llison
DR-
1382
T.S. Is
idor
e DR-
1436
Ivan
DR-1
550
Denn
is DR
-159
4
Katri
na D
R-16
04
Gust
av D
R-17
94
Isaac
DR-
4081
Hancock X X X X X X X X X X XHarrison X X X X X X X X X X XJackson X X X X X X X X X X XPearl River X X X X X X X X X X XGeorge X X X X X X X X X XForrest X X X X X X X XGreene X X X X X X X XJones X X X X X X X XStone X X X X X X X XLamar X X X X X X XPerry X X X X X X XWayne X X X X X X XCovington X X X X X XJefferson Davis X X X X X XMarion X X X X X XPike X X X X X XAmite X X X X XClarke X X X X XCopiah X X X X XJasper X X X X XLauderdale X X X X XRankin X X X X XSimpson X X X X XSmith X X X X XWalthall X X X X XAdams X X X XClaiborne X X X XFranklin X X X X

Sect. 3 : 155
Mississippi Emergency Management Agency
County Cam
ille D
R-27
1
Fred
eric
DR-5
99
Elen
a DR-
741
Geor
ges D
R-12
51
T.S. A
llison
DR-
1382
T.S. Is
idor
e DR-
1436
Ivan
DR-1
550
Denn
is DR
-159
4
Katri
na D
R-16
04
Gust
av D
R-17
94
Isaac
DR-
4081
Hinds X X X XJefferson X X X XKemper X X X XLawrence X X X XLincoln X X X XNeshoba X X X XNewton X X X XNoxubee X X X XScott X X X XWilkinson X X X XWinston X X X XAttala X X XClay X X XLowndes X X XLeake X X XMadison X X XMonroe X X XOktibbeha X X XWarren X X XCalhoun X XCarroll X XChicksaw X XChoctaw X XGrenada X XHolmes X XIssaquena X XItawamba X XLee X XMontgomery X X
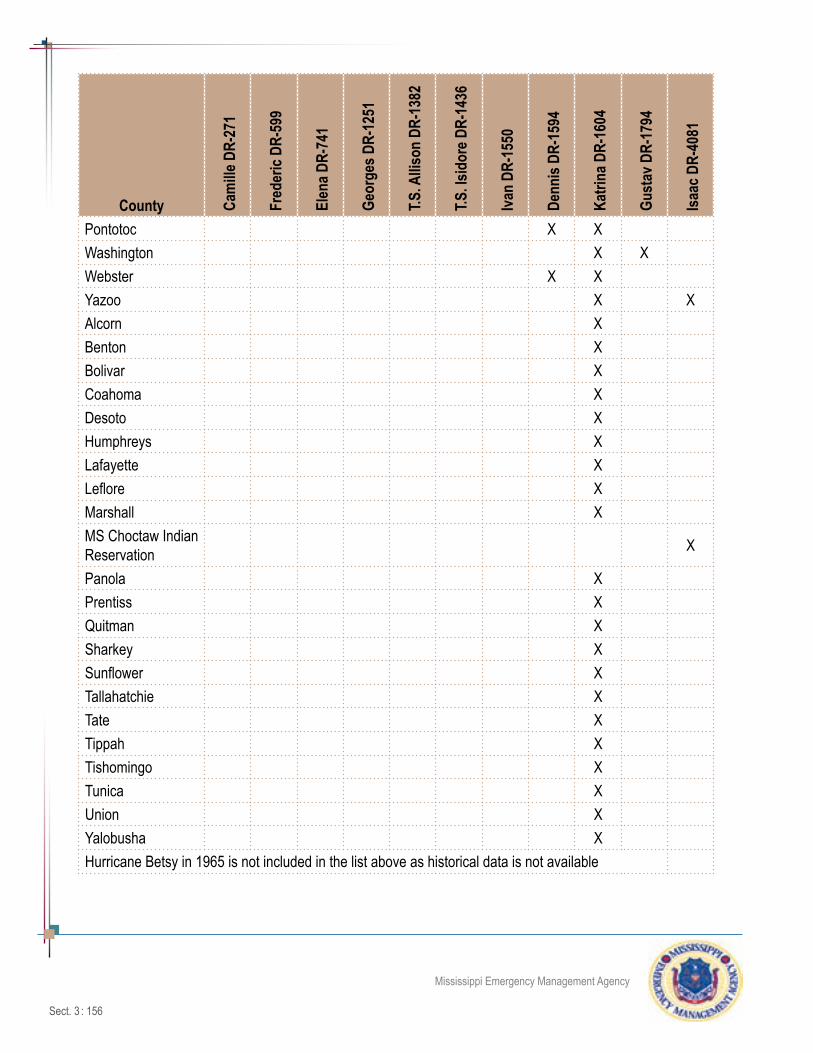
Sect. 3 : 156
Mississippi Emergency Management Agency
County Cam
ille D
R-27
1
Fred
eric
DR-5
99
Elen
a DR-
741
Geor
ges D
R-12
51
T.S. A
llison
DR-
1382
T.S. Is
idor
e DR-
1436
Ivan
DR-1
550
Denn
is DR
-159
4
Katri
na D
R-16
04
Gust
av D
R-17
94
Isaac
DR-
4081
Pontotoc X XWashington X XWebster X XYazoo X XAlcorn XBenton XBolivar XCoahoma XDesoto XHumphreys X Lafayette X Leflore X Marshall X MS Choctaw Indian Reservation X
Panola X Prentiss X Quitman X Sharkey X Sunflower X Tallahatchie X Tate X Tippah X Tishomingo X Tunica X Union X Yalobusha X Hurricane Betsy in 1965 is not included in the list above as historical data is not available
Sect. 3 : 157
Mississippi Emergency Management Agency
Assessing Vulnerability by Jurisdiction Methodology/HAZUS-MH 2.1 Modeling
HAZUS-MH 2.1 hurricane loss modeling capabilities were used to quantify expected losses to the state and differentiate vulnerability by county. HAZUS-MH 2.1 can model specific hypothetical or historical scenarios and probabilistic scenarios. Scenario results represent the expected damage from a single hurricane event, while probabilistic scenario results represent the range of probable losses estimated from a 1,000-year simulation of expected hurricane activity. The direct economic loss results for a probabilistic analysis in-clude annualized loss estimates. Annualized losses are the total losses summed over the entire simulation period divided by 1,000 years.
As noted in the previous information on location of past hurricanes and tropical storms, Mississippi’s high-est risk of impact is in the coastal counties of Jackson, Hancock, and Harrison. As demonstrated by past events, the impact diminishes as storms move inland, but as witnessed with Katrina, even inland counties can experience damage from hurricanes. Katrina’s storm track served as the pattern for the 2013 determin-istic scenario.
Two scenarios are provided and include summary tables for general building stock damages, essential facility damage, shelter requirements, debris generation and building-related economic losses. Counties included in MEMA Regions 6-9 will also be provided as applicable to each scenario to reflect specific loss detail to further explain the potential impacts.
State Probabilistic Scenario
To identify potential losses from a hurricane event, a probabilistic scenario was developed from HAZUS-MH 2.1. This analysis evaluates the statistical likelihood that a specific event will occur and what losses and consequences will result. Provided in tables below are the estimated average yearly losses (annual-ized losses) and the expected distribution of losses (return period). Appendix 7.3.5-B contains the detailed HAZUS reports for all 82 counties.
The total hurricane wind losses to Mississippi annualized over time equals approximately $226 million in any given year. The expected losses by hurricane return period are provided in Table 3.3.9 that follows. Note that HAZUS-MH 2.1 estimated total losses, even to a 1,000-year event ($23.6 million), are less than the losses that resulted from Hurricane Katrina ($80 billion). One explanation for this is that HAZUS-MH 21 models wind damage only and not flood damage. Another analysis limitation could be deficiencies in the default HAZUS-MH 2.1 inventory. This annualized HAZUS-MH 2.1 model, run in 2013, did not change the ranking of risk county by county but now estimates what the average annual hurricane losses could be statewide.

Sect. 3 : 158
Mississippi Emergency Management Agency
Table 3.5.9 Summary Impacts to State by Return PeriodNUMBER OF RESIDENTIAL BUILDINGS DAMAGED
Return Period Minor Moderate Severe Destruction Total10 2,932 190 4 0 3,12620 20,721 3,183 120 57 24,08250 51,510 20,930 3,598 1,799 77,837100 83,957 41,505 10,147 5,450 141,060200 27,980 24,729 19,622 18,382 90,712500 40,374 33,257 30,951 39,257 143,840
1,000 55,390 47,055 44,199 47,081 193,725NUMBER OF BUILDINGS DAMAGED
Return Period Minor Moderate Severe Destruction Total10 3,179 210 2 0 3,39420 22,134 3,563 159 59 25,91450 54,778 23,321 4,430 1,825 84,354100 89,119 45,893 12,246 5,521 152,779200 29,807 26,980 22,892 18,624 98,302500 42,915 36,240 36,563 39,847 155,565
1,000 58,832 51,241 51,989 47,768 209,829
SHELTER REQUIREMENTS
Return PeriodNo. of Displaced
HouseholdsNo. of People
Short-Term Shelter 10 18 520 546 14750 5,293 1,418100 14,283 3,823200 40,762 10,447500 70,497 18,622
1,000 93,355 24,894

Sect. 3 : 159
Mississippi Emergency Management Agency
ECONOMIC LOSS (X 1000)Return Period Residential Total Business Interruption
10 91,270 94,119 5,98520 424,825 459,397 58,12950 1,861,208 2,214,470 452,658100 4,033,451 4,919,044 1,070,745200 7,123,230 8,703,250 1,730,590500 11,676,483 14,642,517 2,822,987
1,000 15,315,157 19,825,101 3,839,412Annualized 157,470 191,055 35,388
Disclaimer: Totals only reflect data for those cennsus tracks/blocks included in the study region. The estimates of social and economic impacts contained in this table were produced using HAZUS loss estimation methodology software which is based on current scientific and engineering knowledge. There are uncertainties inherent in any loss estimation technique. Therefore, there may be significant differences between the modeled results contained in this report and the actual social and economic losses following a specific hurricane. These results can be improved by using enhanced inventory data.
MEMA Region 7, 8 and 9 Loss Summaries
Estimating economic building loss and their associated income loss is vital to the recovery process follow-ing an event. Getting businesses back up and running ensure the success of a communities vitality. This scenario estimated a statewide total of $23,664,513 in total losses for building and income. Table 3.5.10 provides a summary of the economic impact to building/income losses for MEMA Regions 7, 8 and 9.
Table 3.5.10Economic Building Loss Estimates
County/MEMA Region
Total Building Loss ($)
Loss Ratio*
Total Income
Loss ($)**County/MEMA
Region
Total Building Loss ($)
Loss Ratio*
Total Income
Loss ($)**
MEMA Region 7 MEMA Region 8Adams 351 0.01 358 Covington 372 0.03 51Amite 198 0.02 198 Forrest 4,411 0.07 849Franklin 91 0.02 91 Greene 939 0.14 160Jefferson 46 0.01 46 Jefferson Davis 189 0.03 24Lawrence 199 0.02 199 Jones 1,874 0.04 300Lincoln 396 0.02 396 Lamar 2,263 0.08 392Pike 718 0.03 718 Marion 724 0.05 125Walthall 327 0.04 327 Perry 716 0.11 108Wilkinson 125 0.02 125 Wayne 656 0.05 98

Sect. 3 : 160
Mississippi Emergency Management Agency
County/MEMA Region
Total Building Loss ($)
Loss Ratio*
Total Income
Loss ($)**
County/MEMA Region
Total Building Loss ($)
Loss Ratio*
Total Income
Loss ($)**
MEMA Region 9George 4,368 0.32 752 Jackson 57,244 0.53 10,456Hancock 12,768 0.33 2,314 Pearl River 6,800 0.19 1,192Harrison 84,068 0.44 16,872 Stone 2,316 0.24 458Note: *Loss ratio is the percent of the total building inventory value that could be damaged from hurricanes in any given year.
**Total income loss includes relocation loss, capital-related loss, wages loss, and rental income loss.
Source: HAZUS-MH MR2
Shelter Requirements
Table 3.5.11 provides a summary of the estimated shelter requirementsfor MEMA Regions 8 and 9.
Table 3.5.11Shelter Requirements MEMA Region 9 and 8
MEMA Region/County
50 Year 100 Year 500 Year
# Displaced Households
# of People Needing
Short Term Shelter
# Displaced Households
# of People Needing
Short Term Shelter
# Displaced Households
# of People Needing
Short Term Shelter
9 George 169 44 172 44 5,174 1,348
Hancock 14 4 861 224 23 6
Harrison 2,614 722 8,434 2,307 23,341 6,348
Jackson 2,427 627 3,602 899 39,857 10,324
Pearl River 0 0 350 95 1 0
Stone 35 10 324 90 301 83
8 Covington 0 0 1 0 0 0
Forrest 0 0 299 94 71 23
Greene 23 7 24 7 1,270 350
Jefferson Davis 0 0 0 0 0 0
Jones 0 0 38 12 30 9
Lamar 0 0 107 29 7 2
Marion 0 0 3 1 0 0
Perry 6 2 59 18 153 45
Wayne 5 2 9 3 229 73

Sect. 3 : 161
Mississippi Emergency Management Agency
Debris Generation
Hurricanes/tropical storms can generate varying amounts of debris dependent on the type of storm and impact. Planning for storm-related debis is a need statewide as our landfills become over burdened with not only the general household waste but when disasters strike, increased amounts in construction and demoli-tion materials, household hazardous waste, electronic waste etc.
To help plan for storm-related debris in the way of building materials and vegetative/tree debris, HAZUS produces estimated debris generation by county for 10, 20, 50, 100, 200, 500 and 1000 year events. Table 3.5.12 provides a summary for MEMA Regions 8 and 9 and an overall total statewide.
Table 3.5.12Summary of Debris Generation
10 Year 20 Year 50 Year 100 Year 200 Year 500 Year 1000 Year9 George 165,013 258,437 749,929 746,990 595,583 3,139,714 1,123,411
Hancock 1,555 66,473 50,981 819,720 1,567 135,733 664,691Harrison 57,541 392,580 943,485 1,723,062 2,058,300 2,481,795 5,344,220Jackson 249,931 424,880 1,444,342 1,587,827 3,353,209 6,749,047 5,039,878Pearl River 0 12,591 30,716 1,085,622 9,240 180,095 1,918,925Stone 14,667 215,861 502,906 975,665 445,634 973,013 2,649,047
8 Covington 0 0 0 133,175 9,546 22,903 284,340Forrest 12,497 42,387 98,401 624,074 86,257 332,611 1,125,739Greene 128,730 295,049 599,889 609,118 244,106 2,683,743 248,551Jefferson Davis 0 0 0 79,438 0 13,097 339,102Jones 9,328 22,540 57,746 384,422 100,336 343,185 245,619Lamar 0 4,781 20,925 487,218 20,927 113,211 1,158,458Marion 0 0 0 212,818 0 17,591 696,632Perry 32,506 248,653 374,088 992,049 355,611 1,298,707 1,233,566Wayne 44,354 250,765 373,462 434,869 125,688 1,468,269 54,819
Statewide Totals 736,702 2,622,668 5,621,314 11,745,365 7,612,266 21,293,118 23,873,950Debris totals include the following categories: brick, wood, other; reinforce concrete and steel; eligible tree, and other tree debris
Totals only reflect data for those census tracts/blocks included in the user's study region and will reflect the entire county/state only if all of the census blocks for that county/state were selected at the time of study region creation.

Sect. 3 : 162
Mississippi Emergency Management Agency
Peak Windspeed Forecast
Figure 3.5.12 illustrates the frequency of anticipated peak sustained wind speeds associated tropical cy-clones making landfall in Mississippi. These data were derived us HAZUS-MH probability estimates.
Figure 3.5.12Peak Windspeed Forecast
10-20-50-100-200 -500 Year Events

Sect. 3 : 163
Mississippi Emergency Management Agency
Hurricane Katrina Scenario (500 Year Event)
HAZUS General Description
This scenario is based on 47,705.34 square miles and contains 605 census tracts. There are over 1,046,000 households with a total population of 2,844,658 people (2000 Census Bureua data). An estimat-ed 1,282,000 buildings are included in this scenario with a total replacement value (excluding contents) of $159,417,000 (2006 dollars). Approximately 92% of the buildings (and 72% of the building value) are asso-ciated with residential housing. Appendix 7.3.5-C contains the detailed HAZUS reports for all 82 counties.
General Building Stock
HAZUS estimates that thre are 1,282,365 buildings included in this scenario which have an aggregate total replacement value of $159,417,000 (2006 dollars). Table 3.5.13 presents the relative distribution of the value with respect to the general occupancies for all 82 counties followed by the expected damages by oc-cupancy in Table 3.5.14.
Table 3.5.13 Building Exposure by Occupancy Type
Occupancy Exposure ($1000) Percent of TotalResidential $114,980,081 72.1%Commercial $27,348,654 17.2%Industrial $7,456,047 4.7%Agricultural $898,946 .06%Religious $4,652,775 2.9%Government $1,527,107 1.0%Education $2,553,782 1.6%Total $159,417,392 100.0%
HAZUS estimates that about 34,770 buildings will be at least moderately damaged. This is over 3% of the total number of buildings in the state. There are an estimated 1,792 buildings that will be completely destroyed.

Sect. 3 : 164
Mississippi Emergency Management Agency
Table 3.5.14 Expected Building Damage by Occupancy
OccupancyNone Minor Moderate Severe Destruction
Count % Count % Count % Count % Count %Agriculture 5,232 91.83 225 3.94 136 2.39 89 1.56 15 .27Commercial 55,971 89.68 3,720 5.96 2,169 3.47 545 0.87 9 0.01Education 2,030 91.58 111 4.99 59 2.64 17 0.79 0 0.00Govn’t 2,629 92.71 126 4.45 62 2.19 18 0.64 0 0.00Industrial 14,647 90.22 947 5.83 488 3.01 150 0.92 3 0.02Residential 1,069,831 90.28 84,384 7.12 25,535 2.15 3,491 0.29 1,764 0.15Total 1,157,666 89,929 28,621 4,356 1,792
Essential Facility Damage
In this scenario, the state had 111 hospitals with 17,989 hospital beds available for use. The day of the hurricane the number of beds was reduced to 3,064 beds (73%). After one week, 80% of the beds will be in service with 89% operational after 30 days. Table 3.5.15 presents the expected damage to essential facili-ties statewide.
Table 3.5.15 Expected Damage to Essential Facilities
Classification
Number of Facilities
Total
Probability of at least Moderate Damage >50%
Probability of Complete
Damage >50%Expected Loss of
Use < 1 DayEOCs 37 0 0 37Fire Stations 399 0 0 399Hospitals 111 38 8 85Police Stations 368 0 0 368Schools 1,288 38 0 1,014

Sect. 3 : 165
Mississippi Emergency Management Agency
Shelter Requirements
It is estimated that 5,486 households could be displaced due to the scenario of a Katrina-like event. Of these, 1,520 people (out of a total population of 2,844,658) will seek temporary shelter in public saferooms. Table 3.5.16 provides an individual county detail for MEMA Regions 9, and 8; county totals are given for Region 6 and 5 with no shelter requirements indicated for Regions 1-4.
Table 3.5.16 Shelter Requirements by MEMA Region
MEMA Region/County No. of Displaced Households No. of People Needing Shelter9 George 22 6
Hancock 510 135Harrison 3339 918Jackson 292 72Pearl River 263 71Stone 108 30
Total Region 9 4,534 1,232MEMA Region/County No. of Displaced Households No. of People Needing Shelter
8 Covington 17 6Forrest 500 163Greene 6 2Jefferson Davis 8 3Jones 76 23Lamar 228 58Marion 44 13Perry 34 10Wayne 3 0
Total Region 8 916 278County Total Region 7 8 3County Total Region 6 27 7County Total Region 5 1 0

Sect. 3 : 166
Mississippi Emergency Management Agency
Building-Related Losses
The following building-related losses are broken into two categories: direct property damage losses and business interruption losses. The direct property damage losses are the estimated costs to repair or replace the damage caused to the building and its contents. The business interruption losses are the losses associ-ated with the inability to operate a business because of the damage sustained during the hurricane. Busi-ness interruption losses also include the temporary living expenses for those people displaced from their homes because of the hurricane.
The total property damage losses were $3,139,000 with 3% of the estimated losses related to business interruption. By far, the largest loss was sustained by the residental occupancies which made up over 81% of the total loss. A summary of the statewide impact of the losses associated with the building damage is provided below followed by Table 3.5.17 which provides detail county data for MEMA Regions 6-9.
Statewide Building-Related Economic Loss Estimates(thousands of dollars)
Property DamageArea Residential Commercial Industrial Others Total
Building $1,646,525 $205,475 $25,778 $40,066 $1,917,844Content $573,726 $109,495 $15,960 $18,897 $718,077Inventory 0 $2,416 $3,655 $558 $6,630Subtotal $2,220,250 $317,387 $45,393 $59,521 $2,642,552
Business Interruption LossIncome $3,955 $26,365 $453 $2,724 $33,497Relocation $212,726 $55,033 $2,955 $11,588 $282,303Rental $99,385 $25,054 $429 $1,171 $126,039Wage $9,322 $30,528 $745 $13,861 $54,457Subtotal $325,388 $136,980 $4,583 $29,344 $496,295Total Losses $2,545,639 $454,367 $49,976 $88,865 $3,138,847

Sect. 3 : 167
Mississippi Emergency Management Agency
Table 3.5.17 MEMA Region/County Building-Related Economic Loss Estimates
MEMA Region/ County
Total Property Damage
Total Business Interruption
Total Losses
9 George 21,167 2,592 23,759Hancock 237,561 47,245 284,807Harrison 1,339,646 287,667 1,627,312Jackson 211,836 29,376 241,212Pearl River 140,822 25,456 166,277Stone 47,659 9,552 57,212
8 Covington 15,365 1,996 17,361Forrest 205,234 42,356 247,589Greene 6,751 611 7,363Jefferson Davis 6,597 544 7,143Jones 61,853 9,519 71,371Lamar 111,468 21,618 133,085Marion 28,969 5,267 34,236Perry 17,498 2,562 20,061Wayne 7,661 569 8,230
7 Adams 87 0 87Amite 1,048 0 1,050Franklin 361 0 361Jefferson 67 0 68Lawrence 5,233 250 5,482Lincoln 4,475 86 4,561Pike 10,220 913 11,132Walthall 7,448 1,000 8,448Wilkinson 91 0 92
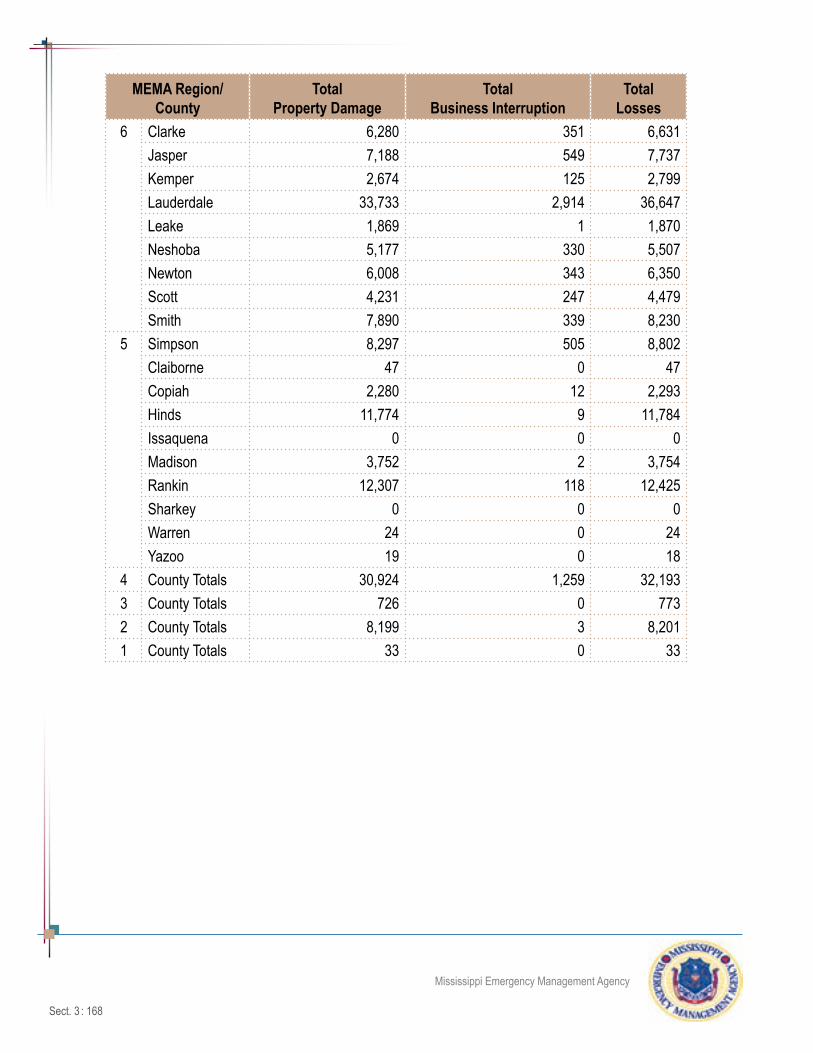
Sect. 3 : 168
Mississippi Emergency Management Agency
MEMA Region/ County
Total Property Damage
Total Business Interruption
Total Losses
6 Clarke 6,280 351 6,631Jasper 7,188 549 7,737Kemper 2,674 125 2,799Lauderdale 33,733 2,914 36,647Leake 1,869 1 1,870Neshoba 5,177 330 5,507Newton 6,008 343 6,350Scott 4,231 247 4,479Smith 7,890 339 8,230
5 Simpson 8,297 505 8,802Claiborne 47 0 47Copiah 2,280 12 2,293Hinds 11,774 9 11,784Issaquena 0 0 0Madison 3,752 2 3,754Rankin 12,307 118 12,425Sharkey 0 0 0Warren 24 0 24Yazoo 19 0 18
4 County Totals 30,924 1,259 32,1933 County Totals 726 0 7732 County Totals 8,199 3 8,2011 County Totals 33 0 33

Sect. 3 : 169
Mississippi Emergency Management Agency
Debris Generation
HAZUS estimates that 12,098,123 tons of debris will be generated from this Katrina scenario. Of the total amount, 10,979,123 tons (91%) is other tree debris. The remaining 1,119,000 tons includes 33% of brick/wood and the remainder being eligible tree debris. A summary of the statewide impact of debris being generated by this scenario is provided below followed by Table 3.5.18 with county-specific data for MEMA Regions 6-9 with county totals for Regions 2-5 (Region 1 did not report any debris generation).
Statewide Summary of Debris Generation(in tons)
Brick, Wood and Other
Reinf. Concrete and Steel
Eligibile Tree Debris
Other Tree Debris Total
369,224 1,963 747,813 10,979,123 12,098,123
Table 3.5.18MEMA Region/County Debris Generation
MEMA Region/ CountyBrick, Wood and Other
Reinf. Concrete and Steel
Eligible Tree
DebrisOther Tree
Debris Total9 George 3,022 3 14,894 340,564 358,483
Hancock 34,941 268 57,758 584,794 677,761Harrison 177,734 1,236 146,861 800,204 1,126,035Jackson 30,571 84 58,385 494,667 583,707Pearl River 20,936 127 56,891 889,281 967,235Stone 7,337 52 31,254 685,186 723,829
County Totals Region 9 274,541 1,770 366,043 3,794,696 4,437,0508 Covington 2,589 2 14,311 257,730 274,632
Forrest 34,778 100 54,230 569,558 658,666Greene 1,046 0 12,453 350,928 364,427Jefferson Davis 1,102 0 8,408 201,782 211,292Jones 10,191 5 32,042 451,469 493,708Lamar 17,378 77 44,388 608,394 670,237Marion 5,210 5 21,052 430,211 456,478Perry 2,872 3 25,330 727,625 755,830Wayne 945 0 11,637 340,081 352,663
County Totals Region 8 76,111 192 223,851 3,937,778 4,237,933

Sect. 3 : 170
Mississippi Emergency Management Agency
MEMA Region/ CountyBrick, Wood and Other
Reinf. Concrete and Steel
Eligible Tree
DebrisOther Tree
Debris Total7 Adams 0 0 0 0 0
Amite 37 0 1,450 46,894 48,381Franklin 5 0 544 17,599 18,148Jefferson 0 0 0 0 0Lawrence 535 0 5,795 155,733 162,063Lincoln 400 0 3,566 72,680 76,646Pike 1,354 0 7,534 111,876 120,764Walthall 1,415 1 8,590 192,624 202,630Wilkinson 0 0 285 9,219 9,504
County Totals Region 7 3,746 1 27,764 606,625 638,1366 Clarke 694 0 10,009 255,369 266,072
Jasper 950 0 11,260 292,087 304,297Kemper 251 0 6,707 216,857 223,815Lauderdale 4,476 0 20,645 268,414 293,535Leake 92 0 1,478 38,999 40,569Neshoba 455 0 4,330 91,059 95,844Newton 687 0 5,888 144,566 151,141Scott 379 0 3,765 94,916 99,060Smith 825 0 9,490 255,305 265,620
County Totals Region 6 8,809 0 73,572 1,657,572 1,739,953County Totals Region 5 2,479 0 21,802 311,702 335,983County Totals Region 4 3,135 0 25,385 524,149 552,669County Totals Region 3 19 0 978 28,025 29,022County Totals Region 2 384 0 8,415 118,578 127,377
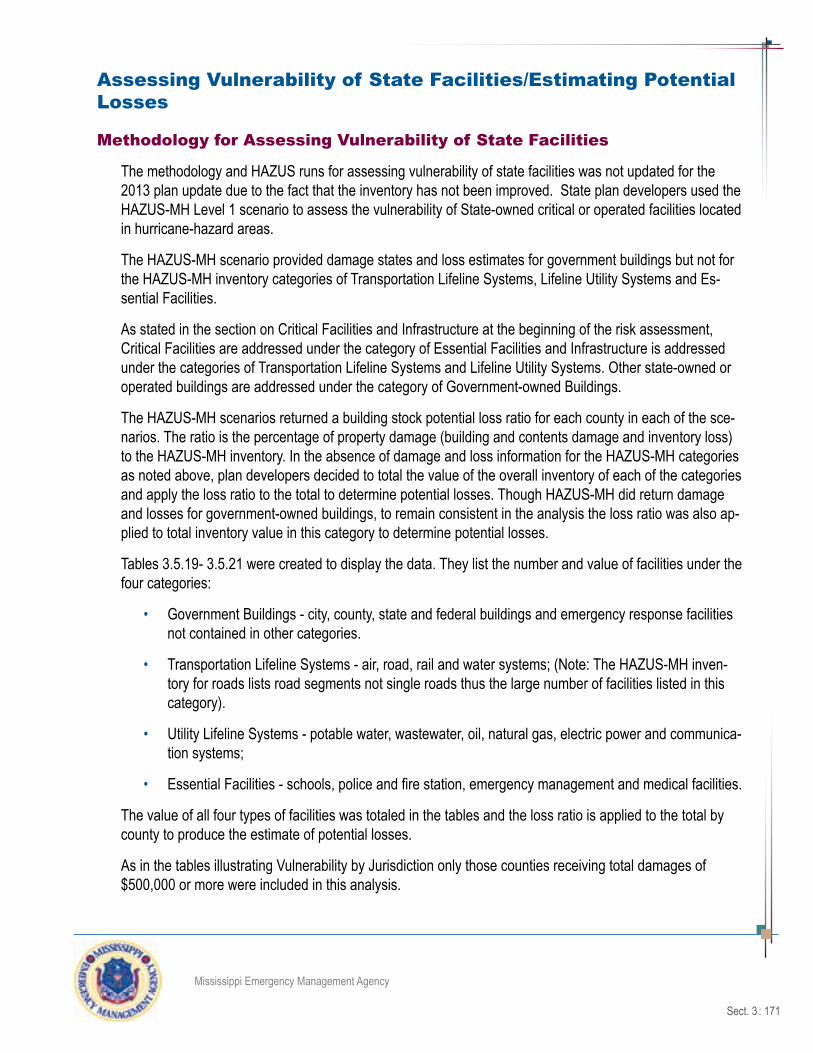
Sect. 3 : 171
Mississippi Emergency Management Agency
Assessing Vulnerability of State Facilities/Estimating Potential Losses
Methodology for Assessing Vulnerability of State Facilities
The methodology and HAZUS runs for assessing vulnerability of state facilities was not updated for the 2013 plan update due to the fact that the inventory has not been improved. State plan developers used the HAZUS-MH Level 1 scenario to assess the vulnerability of State-owned critical or operated facilities located in hurricane-hazard areas.
The HAZUS-MH scenario provided damage states and loss estimates for government buildings but not for the HAZUS-MH inventory categories of Transportation Lifeline Systems, Lifeline Utility Systems and Es-sential Facilities.
As stated in the section on Critical Facilities and Infrastructure at the beginning of the risk assessment, Critical Facilities are addressed under the category of Essential Facilities and Infrastructure is addressed under the categories of Transportation Lifeline Systems and Lifeline Utility Systems. Other state-owned or operated buildings are addressed under the category of Government-owned Buildings.
The HAZUS-MH scenarios returned a building stock potential loss ratio for each county in each of the sce-narios. The ratio is the percentage of property damage (building and contents damage and inventory loss) to the HAZUS-MH inventory. In the absence of damage and loss information for the HAZUS-MH categories as noted above, plan developers decided to total the value of the overall inventory of each of the categories and apply the loss ratio to the total to determine potential losses. Though HAZUS-MH did return damage and losses for government-owned buildings, to remain consistent in the analysis the loss ratio was also ap-plied to total inventory value in this category to determine potential losses.
Tables 3.5.19- 3.5.21 were created to display the data. They list the number and value of facilities under the four categories:
• Government Buildings - city, county, state and federal buildings and emergency response facilities not contained in other categories.
• Transportation Lifeline Systems - air, road, rail and water systems; (Note: The HAZUS-MH inven-tory for roads lists road segments not single roads thus the large number of facilities listed in this category).
• Utility Lifeline Systems - potable water, wastewater, oil, natural gas, electric power and communica-tion systems;
• Essential Facilities - schools, police and fire station, emergency management and medical facilities.
The value of all four types of facilities was totaled in the tables and the loss ratio is applied to the total by county to produce the estimate of potential losses.
As in the tables illustrating Vulnerability by Jurisdiction only those counties receiving total damages of $500,000 or more were included in this analysis.

Sect. 3 : 172
Mississippi Emergency Management Agency
With the limitations noted below, the tables provide a clear picture of the losses that could be sustained from each of the three scenarios for the three categories of event. Apparent in the data is the very high vulnerability of state-owned or operated facilities in the three coastal counties and diminishing vulnerability of such as the storms moved northward.
Data Limitations:
For the category of government buildings HAZUS-MH does not distinguish between federal, state or local ownership or building operation. Nor does it distinguish between federal, state, local or private ownership in the three other categories of facilities addressed the assessment. Therefore all facilities regardless of ownership are included in the assessment.
The state of Mississippi does not have a comprehensive list of state-owned or operated buildings, criti-cal facilities and infrastructure sorted by county that could be input into HAZUS-MH to conduct a Level 2 analysis. During the 2010 update state facilities data was available in tabular form from the Department of Finance and Administration, but did not include XY coordinates, and thus could not be incorporated into HAZUS-MH. Given those limitations, plan developers determined that the HAZUS-MH default inventory data was the “best available data,” even though all facilities are represented in the data, not just state-owned or operated buildings, critical facilities and infrastructure.
Transportation Lifeline Systems/Roads: Data in the HAZUS-MH inventories is listed by census tracts for all facilities with the exception of road segments in the Transportation Lifeline Systems. The road segment inventory is listed by Federal Information Processing Standards (FIPS) Codes. Due to time constraints dur-ing plan development the state was unable to cross reference highways segments listed by FIPS codes to Mississippi Counties. Therefore the number and value of road segments are not included in the data tables under Transportation Lifeline Systems.
It was also apparent that HAZUS-MH does not have a complete listing of state-owned or operated facilities in its default database. The state has a continuing strategy to address these data limitations for future plan updates. That strategy is included in the mitigation strategy section of the plan.
A tabular-based analysis of the 2007 state facilities inventory was conducted in lieu of GIS-based facilities data to analyze potential losses to the state (Table 3.5.22). The inventory of facilities and replacement value by county was analyzed using the average building loss ratios from the Category 5 Hurricane HAZUS-MH scenario to model worst case losses. This loss ratio was multiplied by the total replacement value to estimate potential loss. Based on this methodology the state could incur $1 billion in losses to state facili-ties. The details by county, ranked in order of potential loss, are presented below for the counties analyzed in the Category 5 Hurricane scenario. Also included in this table are the estimated number of state facilities that were destroyed by Hurricane Katrina. Note that some of the higher risk areas for state facility losses are not coastal counties.

Sect. 3 : 173
Mississippi Emergency Management Agency
Table 3.5.19Point of Impact Hancock County
Category 5 Storm - Peak Gust Wind Speed (MPH) 175Though there was damage in other counties, 42 counties received more than $500,000 in total damage in this sce-nario. Those counties were Attala, Carroll, Choctaw, Clarke, Copiah, Covington, Forrest, George, Grenada, Hancock, Harrison, Hinds, Holmes, Humphreys, Jackson, Jasper, Jefferson Davis, Jones, Lamar, Lauderdale, Lawrence, Leake, Leflore, Lincoln, Lowndes, Madison, Marion, Montgomery, Neshoba, Newton, Pearl River, Perry, Pike, Rankin, Scott, Simpson, Smith, Stone, Sunflower, Walthall, Wayne, Washington, Winston and Yazoo Counties.
Total Potential Damage To State-Owned Or Operated Buildings, Critical Facilities And Infrastructure
(Values In Thousands Of Dollars)
Government Buildings
Transportation Lifeline Systems
Lifeline Utility Systems
Essential Facilities
Total Value
Total Estimated
LossNo. of
Facilities ValueNo. of
Facilities ValueNo. of
Facilities ValueNo. of
Facilities Value
All Counties 332 381,608 9,662 14,062,314 521 15,160,614 1,451 1,426,130 31,030,666 1,953,370
Table 3.5.20Point of Impact Harrison County
Category 5 Storm - Peak Gust Wind Speed (MPH) 177Though there was damage in other counties, 43 counties received more than $500,000 in damage in this scenario. Those counties were Attala, Carroll, Choctaw, Clarke, Copiah, Covington, Forrest, George, Greene, Hancock, Harri-son, Hinds, Holmes, Jackson, Jasper, Jefferson Davis, Jones, Kemper, Lamar, Lauderdale, Lawrence, Leake, Leflore, Lowndes, Madison, Marion, Montgomery, Neshoba, Newton, Noxubee, Oktibbeha, Pearl River, Perry, Rankin, Scott, Simpson, Smith, Stone, Walthall, Wayne, Webster, Winston and Yazoo Counties.
Total Potential Damage To State-Owned Or Operated Buildings, Critical Facilities And Infrastructure
(Values In Thousands Of Dollars)
Government Buildings
Transportation Lifeline Systems
Lifeline Utility Systems
Essential Facilities
Total Value
Total Estimated
LossNo. of
Facilities ValueNo. of
Facilities ValueNo. of
Facilities ValueNo. of
Facilities Value
All Counties 338 380,307 9,492 13,887,347 489 14,209,788 1,419 1,394,425 29,690,158 4,745,059
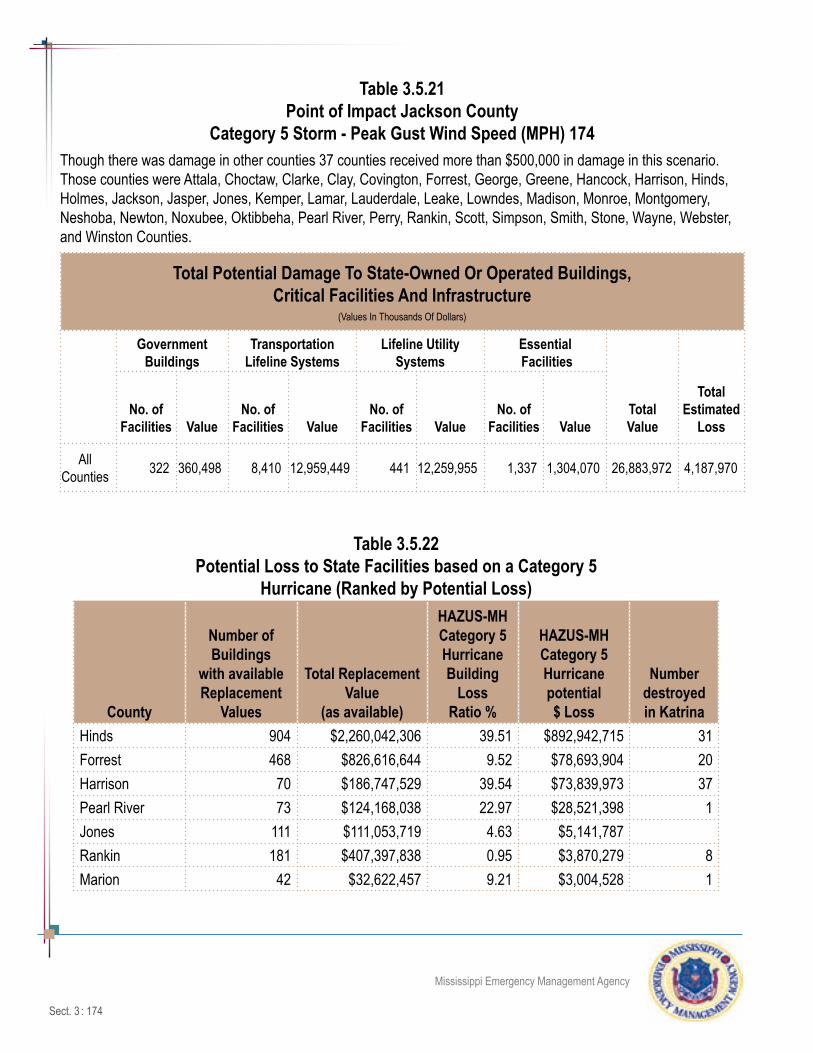
Sect. 3 : 174
Mississippi Emergency Management Agency
Table 3.5.21Point of Impact Jackson County
Category 5 Storm - Peak Gust Wind Speed (MPH) 174Though there was damage in other counties 37 counties received more than $500,000 in damage in this scenario. Those counties were Attala, Choctaw, Clarke, Clay, Covington, Forrest, George, Greene, Hancock, Harrison, Hinds, Holmes, Jackson, Jasper, Jones, Kemper, Lamar, Lauderdale, Leake, Lowndes, Madison, Monroe, Montgomery, Neshoba, Newton, Noxubee, Oktibbeha, Pearl River, Perry, Rankin, Scott, Simpson, Smith, Stone, Wayne, Webster, and Winston Counties.
Total Potential Damage To State-Owned Or Operated Buildings, Critical Facilities And Infrastructure
(Values In Thousands Of Dollars)
Government Buildings
Transportation Lifeline Systems
Lifeline Utility Systems
Essential Facilities
Total Value
Total Estimated
LossNo. of
Facilities ValueNo. of
Facilities ValueNo. of
Facilities ValueNo. of
Facilities Value
All Counties 322 360,498 8,410 12,959,449 441 12,259,955 1,337 1,304,070 26,883,972 4,187,970
Table 3.5.22Potential Loss to State Facilities based on a Category 5
Hurricane (Ranked by Potential Loss)
County
Number of Buildings
with available Replacement
Values
Total Replacement Value
(as available)
HAZUS-MH Category 5 Hurricane Building
Loss Ratio %
HAZUS-MH Category 5 Hurricane potential $ Loss
Number destroyed in Katrina
Hinds 904 $2,260,042,306 39.51 $892,942,715 31Forrest 468 $826,616,644 9.52 $78,693,904 20Harrison 70 $186,747,529 39.54 $73,839,973 37Pearl River 73 $124,168,038 22.97 $28,521,398 1Jones 111 $111,053,719 4.63 $5,141,787 Rankin 181 $407,397,838 0.95 $3,870,279 8Marion 42 $32,622,457 9.21 $3,004,528 1

Sect. 3 : 175
Mississippi Emergency Management Agency
Table 3.5.22Potential Loss to State Facilities based on a Category 5
Hurricane (Ranked by Potential Loss)
County
Number of Buildings
with available Replacement
Values
Total Replacement Value
(as available)
HAZUS-MH Category 5 Hurricane Building
Loss Ratio %
HAZUS-MH Category 5 Hurricane potential $ Loss
Number destroyed in Katrina
Lamar 7 $12,002,573 12.04 $1,445,110 Simpson 64 $54,879,521 2.53 $1,388,452 12Hancock 7 $2,642,640 44.4 $1,173,332 Newton 119 $121,425,667 0.96 $1,165,686 5Covington 4 $16,994,408 6.1 $1,036,659 Oktibbeha 492 $1,564,880,015 0.06 $938,928 10Holmes 84 $130,428,429 0.53 $691,271 Jackson 8 $2,052,890 32.35 $664,110 Lauderdale 72 $139,658,554 0.29 $405,010 6Copiah 89 $117,138,686 0.25 $292,847 George 4 $1,449,000 16.04 $232,420 Kemper 50 $95,680,386 0.24 $229,633 1Leflore 91 $233,472,584 0.08 $186,778 1Madison 13 $21,106,017 0.87 $183,622 Lowndes 57 $313,749,777 0.03 $94,125 6Perry 6 $751,484 10.58 $79,507 1Attala 3 $16,569,000 0.41 $67,933 Stone 2 $277,200 19.87 $55,080 Greene 2 $783,720 6.61 $51,804 Pike 49 $103,333,019 0.05 $51,667 1Jefferson Davis 1 $766,080 5.78 $44,279 Yazoo 18 $11,604,369 0.25 $29,011 Wayne 4 $1,552,530 1.75 $27,169 2Smith 2 $840,000 2.09 $17,556 Walthall 3 $1,305,570 1.05 $13,708 Scott 5 $955,468 1.15 $10,988 Lincoln 15 $11,571,284 0.08 $9,257

Sect. 3 : 176
Mississippi Emergency Management Agency
Table 3.5.22Potential Loss to State Facilities based on a Category 5
Hurricane (Ranked by Potential Loss)
County
Number of Buildings
with available Replacement
Values
Total Replacement Value
(as available)
HAZUS-MH Category 5 Hurricane Building
Loss Ratio %
HAZUS-MH Category 5 Hurricane potential $ Loss
Number destroyed in Katrina
Warren 14 $27,137,459 0.03% $8,141 1Jasper 3 $414,540 1.68% $6,964 Lawrence 2 $387,660 1.42% $5,505 1Neshoba 6 $1,097,460 0.45% $4,939 Washington 78 $45,673,795 0.01% $4,567 Clarke 3 $663,264 0.52% $3,449 Leake 4 $1,326,192 0.25% $3,315 Noxubee 11 $2,323,460 0.14% $3,253 1Grenada 8 $2,787,960 0.1% $2,788 Carroll 5 $791,742 0.18% $1,425 Winston 3 $372,771 0.32% $1,193 Choctaw 3 $516,600 0.23% $1,188 Humphreys 3 $786,660 0.15% $1,180 3Webster 3 $766,500 0.1% $767 Montgomery 4 $1,212,412 0.06% $727 Sunflower 4 $973,140 0.04% $389 Clay 3 $549,675 0.04% $220 Monroe 25 $17,188,366 0% $0 Sharkey 3 $1,002,120 0% $0 Bolivar 79 $302,700,858 0% $0 3
TOTAL $1,096,650,537

Sect. 3 : 177
Mississippi Emergency Management Agency
3.6: Flood Risk Assessment
Hazard DescriptionFlooding causes ninety percent of all natural disaster damages. The effects of a flood can be devastat-ing. Between the inundation and the force of the current, both lives and property can be lost. People and animals can be drowned or injured by the floodwaters and current-borne debris. This same debris causes structural damage to buildings, roads, bridges, and railroads. Sanitary and storm sewers, water and utility installations can be damaged from flooding debris and their systems interrupted for extended periods of time. Crops can be carried away by the current or destroyed by prolonged submergence. Farmlands may be deeply eroded by new channels, resulting in the loss of valuable topsoil.
A flood is any general or temporary condition of partial or complete inundation of normally dry land areas from the overflow of inland or tidal waters or the unusual and rapid accumulation or run-off of surface wa-ters from any source.
Flooding is a natural and inevitable occurrence. Floods occur seasonally with general or torrential rains associated with tropical storms that later drain into river basins and fill them with an abundance of water. Rivers, lakes and other water bodies have always overflowed their normal beds to inundate nearby land. The land adjacent to these bodies of water is called the floodplain. There are generally four leading causes/types of flooding. Mississippi is vulnerable to each as will be explained in the following section.
River (Riverine or Stream) Flooding:
Riverine floods occur along rivers, streams, or channels primarily when there is heavy or prolonged rainfall. Other contributing factors include: (1) the elimination of ground cover on drainage slopes as a result of tree cutting or wildfires, land development, or overgrazing; (2) the simultaneous arrival of flood crests from major tributaries; and (3) blocked drainage by items such as debris; dams or inadequately sized drainage structures. Floods from these sources can be “flash” or rapid, but are usually more gradual and have longer duration than flash floods. Riverine floods occur in all nine river basins in Mississippi.
Flash Flooding (Rapid):
Flash floods are a result of heavy, localized rainfall, possibly from slow-moving intense thundestorms that cause small creeks, streams, branches and rivers to overflow. They are most common when rain falls on areas with steep slopes or built-up areas where impervious surfaces, gutters, and storm sewers speed up the flow of run-off. The torrential nature of flash floods makes this hazard particularly lethal, especially in or near river- and streambeds, city streets, coastal areas and narrow valleys which contribute to the develop-ment of rapid water movement. Rapid or flash flooding occurs in all nine river basins in Mississippi.
Coastal (Tidal) Flooding:
All lands bordering the Mississippi Sound, such as various bays, estuaries or lakes are prone to tidal ef-fects/flooding. Coastal lands, such as sand bars, barrier islands, and deltas provide a buffer zone to help protect human life and real property relative to the sea, much as floodplains provide a buffer zone along riv-ers or other bodies of water. Coastal floods usually occur as a result of abnormally high tides or tidal waves, storm surge and heavy rains in combination with high winds, tropical storms or hurricanes.
Sect. 3 : 178
Mississippi Emergency Management Agency
Storm surge is caused by high water from wind and the low air pressure differences that acompany a storm. Storm surge is not a tidal wave or sudden rush of water; rather it is more of a gradual increase in water surface elevation. A surge can be as high as 20 feet above normal water levels, flooding normally dry areas far inland. A storm surge is associated with a tropical storm or hurricane. Most of the fatalities and damage caused by a tropical storm or hurricane are the result of surge and its associated flooding, not high winds. The effects of coastal flooding can be worsened due to erosion. Coastal dunes and beaches provide natural protection by causing waves to break close to the shore, but these features can be worn down, exposing areas farther inland to storm damage. Tidal flooding occurs within three basins in Mississippi: the Pearl River, the Coast River and the Pascagoula River Basins.
Drainage
Drainage flooding occurs primarily in urban or developed areas when the volume of run-off exceeds the capacity of drainage systems. Flooding of this nature can be the result of increased development, inad-equate drainage, riverine flooding, flash flooding or a combination of these. Drainage flooding occurs in all nine river basins.
Hazard Profile Mississippi is situated in a region where water is a bountiful natural resource, coming in third behind Loui-siana as the “wettest” state in the union considering the average amount of precipitation over the State’s area. The statewide average of above 59 inches over nearly 31 million acres produces a volume in excess of 144 million acre-feet of water delivered to the state by the atmosphere annually, providing both surface and groundwater in abundance. Though Mississippi has no natural large inland lakes, flood control dams in the Yazoo-Tallahatchie basin and water supply reservoirs at Jackson and Meridian have formed large lakes in the north, and these have added to the fishing and recreational resources of the State. All the larger streams flow year-round.
Flood season in Mississippi is considered to primarily occur between the months of November through June (the period of greatest rainfall), while the months of March and April are considered to be the months of greatest flood frequency. The first six months of the year is the season of high flows in the Mississippi River. In other rivers and streams, flooding sometimes occurs during the summer from persistent thunder-storms, or in the late summer and early fall from the heavy rains associated with tropical storms originating in the Gulf of Mexico.
Local overflows occur on many streams three or four times a year in association with extended rainy spells and saturated soil conditions. Severe general flooding occurs about once in two years from upstream runoff. The only important contribution to the Mississippi River within the state is from the Yazoo Basin. A system of levees prevents major damage from Mississippi River floods.
Flash flooding and heavy rain events have posed significant threats to many communities throughout the state. The aging drainage infrastructure and urban sprawl have increased the amount of runoff into area drainage systems and creeks. Creeks that were once narrow enough to jump over are now wider creating exit points for water to drain out of its banks and into developed areas. As road/bridge improvements are made and larger culverts and catch basins are engineered, a more thorough look downstream to assure that the improvements made will not create a “bottleneck” in undeveloped areas behind neighborhoods that could create an increase in flooding events through the washed out creek systems.

Sect. 3 : 179
Mississippi Emergency Management Agency
Education and Outreach
Flood Awareness Week occurs in the month of March. For more information on flood awareness call the MEMA Public Information number (866-519-6362) between 8 a.m. and 5 p.m. weekdays.
Mississippi’s Coastal Hazard Outreach Strategy Team (C-HOST) is a regional outreach team that was established March 5, 2008. The Team strives to deliver the general floodplain management messaging so that residents are educated about flood hazards, flood insurance, flood protection measures, and the NFIP. Education and outreach information is provided at http://chost.stormsmart.org.
Mississippi River Flooding, Vicksburg 2011
Hurricane Isaac Flooding, 2012

Sect. 3 : 180
Mississippi Emergency Management Agency
Location - River Basins
The state of Mississippi is located within the Gulf of Mexico drainage area. The nine primary river basins within the state are categorized (from north to south) as the:
• North Independent Basin
• Tennessee River Basin
• Yazoo River Basin
• Tombigbee River Basin
• Big Black River Basin
• Pearl River Basin
• South Independent Basin
• Pascagoula River Basin
• Coastal River Basin
The state is primarily concerned with the risk associated with the floodplains found within the nine basins listed above. The local governments focus their risk assessments on the tributaries and secondary streams associated with the primary rivers located within their environs.
The state recognizes the importance of watershed planning and regional planning when implementing flood mitigation solutions. The identified basins and their member counties are listed on the subsequent pages. The assigment of a county to a basin was based solely upon the placement of the majority of the county’s landmass within the appropriate basin boundary.
North Independent River Basin
The North Independent Basin encompasses portions of Alcorn and Tippah counties. Flood losses associated with this basin are due primarily to the Hatchie, Tuscumbia and Little Hatchie Rivers, Muddy Creek, South Tippah Creek, and their tributaries.
County
Total Area in Square
MilesAlcorn 401.3Tippah 459.9
Totals 861.2
Tennessee River Basin
The Tennessee River Basin encompasses portions of Tishomingo County. Flood losses associated with this basin are due primarily to the Tennessee and Tombigbee Rivers, Bear Creek, Yellow Creek, and their tributaries.
County
Total Area in Square
MilesTishomingo 444.6

Sect. 3 : 181
Mississippi Emergency Management Agency
Yazoo River Basin
The Yazoo River Basin encompasses portions of the twenty-five counties listed below. Flood losses associated with this basin are due primarily to the Yazoo, Sunflower, Coldwater and Tallahatchie Rivers and their associated tributaries.
County
Total Area Sq
Miles County
Total Area Sq
MilesBenton 408.5 Marshall 709.6Bolivar 905.7 Panola 704.9Calhoun 587.8 Pontotoc 500.9Carroll 634.3 Quitman 406.4Coahoma 583 Sharkey 434.8Desoto 496.6 Sunflower 707.1Grenada 449.2 Tallahatchie 651.9Holmes 764 Tate 410.8Humphreys 431.1 Tunica 480.7Issaquena 441.4 Union 416.8Lafayette 679.1 Washington 761.2Leflore 606.2 Yalobusha 494.8
Yazoo 933.9
Totals 12,773
Tombigbee River Basin
The Tombigbee River Basin encompasses portions of the ten counties listed below. Flood losses associated with this basin are due primarily to the Tombigbee, Luxpalila, ant the Buttahatchee Rivers, the Bull Mountain, Mattubby and Yellow Creeks and their associated tributaries.
County
Total Area in Square
Miles County
Total Area in Square
MilesChickasaw 504.2 Lowndes 516.5Clay 416 Monroe 772.1Itawamba 540.5 Noxubee 700Kemper 767.01 Oktibbeha 461.8Lee 453.1 Prentiss 418.2
Totals 55,49.4
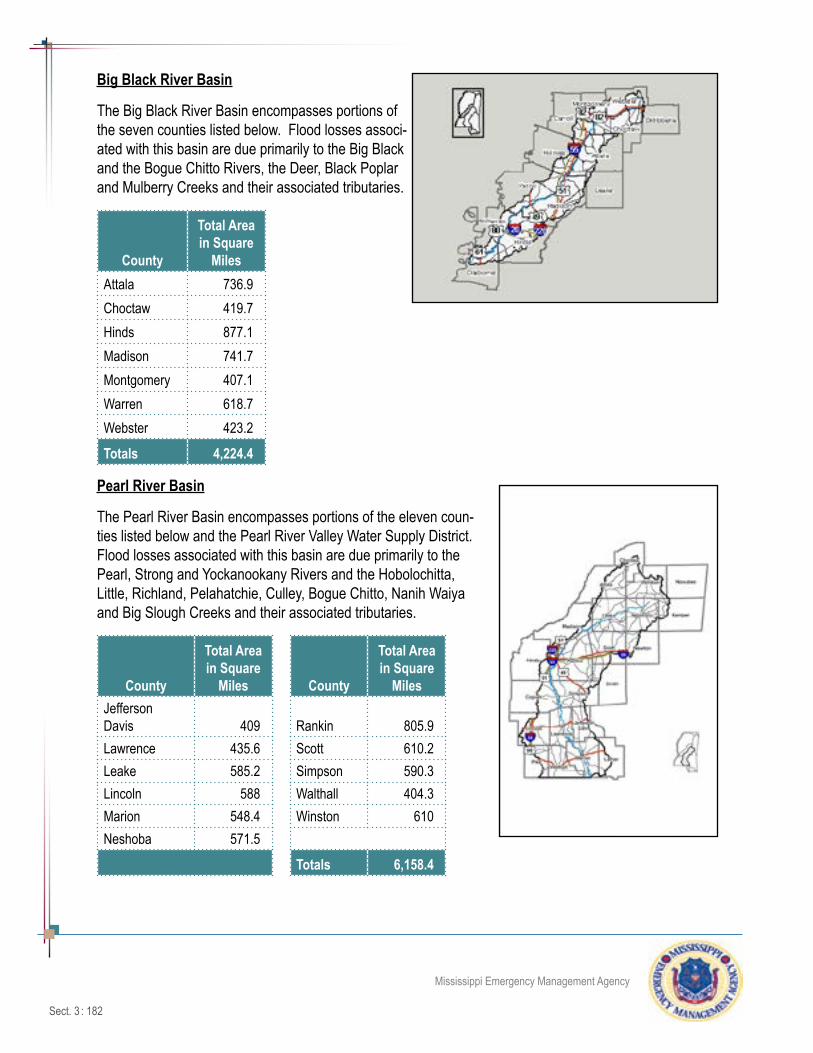
Sect. 3 : 182
Mississippi Emergency Management Agency
Big Black River Basin
The Big Black River Basin encompasses portions of the seven counties listed below. Flood losses associ-ated with this basin are due primarily to the Big Black and the Bogue Chitto Rivers, the Deer, Black Poplar and Mulberry Creeks and their associated tributaries.
County
Total Area in Square
MilesAttala 736.9Choctaw 419.7Hinds 877.1Madison 741.7Montgomery 407.1Warren 618.7Webster 423.2
Totals 4,224.4
Pearl River Basin
The Pearl River Basin encompasses portions of the eleven coun-ties listed below and the Pearl River Valley Water Supply District. Flood losses associated with this basin are due primarily to the Pearl, Strong and Yockanookany Rivers and the Hobolochitta, Little, Richland, Pelahatchie, Culley, Bogue Chitto, Nanih Waiya and Big Slough Creeks and their associated tributaries.
County
Total Area in Square
Miles County
Total Area in Square
MilesJefferson Davis 409 Rankin 805.9Lawrence 435.6 Scott 610.2Leake 585.2 Simpson 590.3Lincoln 588 Walthall 404.3Marion 548.4 Winston 610Neshoba 571.5
Totals 6,158.4

Sect. 3 : 183
Mississippi Emergency Management Agency
South Independent River Basin
The South Independent Basin encompasses portions of the eight counties listed below. Flood losses associated with this basin are due primarily to the Mississippi, Buffalo, Homochitto Rivers, Bayou Pierre and the Second and St. Cathrine Creeks and their associated tributaries.
County
Total Area in Square
Miles County
Total Area in Square
MilesAdams 486.4 Franklin 566.7Amite 731.6 Jefferson 527.2Claiborne 501.4 Pike 410.7Copiah 779.2 Wilkinson 687.8
Totals 4,691
Pascagoula River Basin
The Pascagoula River Basin encompasses portions of the 15 counties listed below. Flood losses associated with this basin are due primarily to the Pascagoula, Escatawpa, Chickasawhay, and Leaf Rivers, the Bogue Homa, Thomp-son, Tallahala, Tallahoma, Okatoma, Long, Okatibbee, and Sowashee Creeks and their associated tributaries.
County
Total Area in Square
Miles County
Total Area in Square
MilesClarke 693.4 Lamar 500.3Covington 414.8 Lauderdale 715.2Forrest 470 Newton 579.4George 483.6 Perry 650.1Greene 718.7 Smith 637.1Jackson 1,043.3 Stone 448Jasper 677.3 Wayne 813.4Jones 699.6
Totals 9,544.2

Sect. 3 : 184
Mississippi Emergency Management Agency
Coastal River Basin
The Coastal River Basin encompasses portions of Hancock, Harrison, and Pearl River Counties. Flood losses associated with this basin are due primarily to the Wolf, Jourdan, Biloxi, Little Biloxi, and Tchautac-abouffa Rivers, Rotten Bayou, Bayou La Croix, Bernard Bayou, Brickyard Bayou, Turkey and Tuxachanie Creeks, and their associated tributaries.
County
Total Area in Square
MilesHancock 552.4Harrison 975.9Pearl River 818.7
Totals 2,347
Mississippi River Basin
The Mississippi River Basin encompasses small portions of the eleven counties listed in the table below. The flood losses associated with this slice of terrain adjacent to the Mississippi River are primarily struc-tures known as “fish camps.” These structures are secondary homes or weekend homes. A large percent-age of the state’s repetitive loss structures are thought to consist of such structures, which are constructed on the “wet side” of the levee system. The analyses of the counties will be included in the appropriate basin that contains the largest landmass as indicated.
County River Basin
Adams South Independent RiverBolivar Yazoo River Claiborne South Independent RiverCoahoma Yazoo RiverDesoto Yazoo RiverIssaquena Yazoo RiverJefferson South Independent RiverTunica Yazoo RiverWarren Big Black RiverWashington Yazoo RiverWilkinson South Independent River

Sect. 3 : 185
Mississippi Emergency Management Agency
Historic Flood Events
Mississippi River Flood 2011
The Mississippi River floods in April and May 2011 were among the largest and most damag-ing recorded along the U.S. waterway in the past century, comparable in extent to the major floods of 1927 and 1993. In April 2011, two major storm systems deposited record levels of rainfall on the Mississippi River watershed. When that additional water combined with the springtime snowmelt, the river and many of its tributaries began to swell to record levels by the beginning of May. Areas along the Mississippi itself experiencing flooding include Illinois, Missouri, Kentucky, Tennessee, Arkansas, Mississippi, and Louisiana. U.S. President Barack Obama declared the western counties of Ken-tucky, Tennessee, and Mississippi federal disaster areas. For the first time in 37 years, the Morganza Spillway was opened on May 14, deliberately flooding 4,600 square miles (12,000 km2) of rural Louisiana to save most of Baton Rouge and New Orleans.
Fourteen people were killed in Arkansas, with 392 killed across seven states in the preceding storms. Thousands of homes were ordered evacuated, including over 1,300 in Memphis, Tennessee, and more than 24,500 in Louisiana and Mississippi, though some people disregarded mandatory evacuation or-ders. As of May 2011 up to 13% of U.S. petroleum refinery output is expected to be disrupted by flood levels exceeding historical records in several locations, with gasoline prices expected to rise. The flood crested in Memphis on May 10 and artificially crested in southern Louisiana on May 15, a week earlier than it would have if spillways had not been opened. The United States Army Corps of Engineers stated that an area in Louisiana between Simmesport and Baton Rouge was expected to be inundated with 20–30 feet (6.1–9.1 m) of water. Baton Rouge, New Orleans, and many other river towns are threatened, but officials stressed that they should be able to avoid catastrophic flooding.
From April 14–16, the storm system responsible for one of the largest tornado outbreaks in U.S. history also produced large amounts of rainfall across the southern and midwestern United States. Two more storm systems, each with heavy rain and tornadoes, hit in the third week of April. In the fourth week of April, from April 25–28, another, even more extensive and deadly storm system passed through the Mississippi Valley dumping more rainfall resulting in deadly flash floods. The unprecedented extensive rainfall from these four storms, combined with springtime snow melt from the Upper Midwest, created the perfect situation for a 500-year flood along the Mississippi.
!
!
!
!
!
!
!
!
!
!
!
!
!
Vanderburgh
Alexander
Iberia
St.Martin
WestBatonRouge
ALABAMA
ARKANSAS
GEORGIA
ILLINOIS
INDIANA
IOWA
KANSAS
KENTUCKY
LOUISIANA
MISSISSIPPI
MISSOURI
NEBRASKA
OHIO
OKLAHOMA
TENNESSEE
TEXAS
Cleburne
Cleveland
Cross
Drew
Jackson
Lincoln
Poinsett
St.Francis
Sharp
Union
Brown
Hamilton
HardinJohnson
McDonough
Menard
Richland
Saline
Scott
Warren
Washington
Greene
Lawrence
Martin
Orange
Cedar
Calloway
Graves
McLean
Marshall
EastFeliciana
Iberville
La Salle
Ouachita
St.Bernard
St.James
Tang
ipah
oa
Attala
Franklin
Henry
Oregon
St.FrancoisIron
Lincoln
Montgom
ery
Panola
Warren
Carter
Benton
Fayette
Gibson
Weakley
Arkansas
Ashley
Independence
Izard
Jefferson
Lawrence
LeeLonoke
Mississippi
MonroePhillips
PrairiePulaski
Randolph
Bradley
Chicot
Clay
Craighead
Desha
Faulkner
Fulton
Grant
Greene
Stone
White
Woodruff
Crittenden
Ballard
Tazewell
Union
Wab
ash
Wayne
White
Williamson
Webster
Rapides
Richland
St.Charles
St.Helena
St. John th
e
Baptist
St.Landry
Scott
Bartho-lomew
Crawford
Hopkins
Ascension
Assump- tion
Avoyelles
St.Martin
St. Mary
Adams
Amite
Bolivar
Carroll
Edw
ards
Franklin
Fulton
Daviess
DuboisGibson
Jackson
Caldwell
Catahoula
St.Tammany
Tensas
Terrebonne
Union
Gallatin
Hancock
Hend
erso
n
Jackson
Caldwell
Livingston
LyonMcCracken
Conc
ordi
a
EastBatonRouge
EastCarroll
Claiborne
Carlisle
Coahoma
Copiah
DeSoto
Hinds
Holmes
Lawrence
Knox
Monroe
Perry
Pike
Franklin
Iberia
Jackson
DesMoines
Johnson
Mason
Massac
Mercer
Crittenden
Daviess
Jefferson
Lafourche
Livingston
Hum-phreys
Issa
quen
a
Fulton
Jefferson
WestCarroll
West
Feliciana
Monroe
Morgan
Peoria
Perry
Pike
Pope
Pulaski
Randolph PoseySpencer
Sullivan
Madison
Morehouse
Lee
Louisa
Muscatine
Rock Island
St.Clair
Schuyler
Trigg
Union
Orleans
Plaque- mines
PointeCoupee
Adams
Henderson
Hickman
Cass
Warrick
Washington
Lake
NewMadrid
Pem
iscot
Perry
Pike
Wilkinson
Yazoo
Bollinger
Butler
Lauderdale
Mississippi
Ralls
Reynolds
Ripley
Ste.Genevieve
Scott
CapeGirardeau
Clark
Obion
Crockett
Shelby
Stoddard
Wayne
Dunklin
Leflore
Madison
Marshall
Quitman
Stewart
Tipton
Dyer
Lewis
Madison
Marion
Rankin
Sharkey
Sunf
low
er
TateTunica
Was
hing
ton
Haywood
Henry
Memphis
Cape Girardeau
Greenville
Vicksburg
New Orleans
BatonRouge
Paducah
Louisville
Cincinnati
St.Louis
Quincy
Peoria
Evansville
Greene
Clinton
Logan
Jefferson
Knox
Sangamon
Marion
Woodford
Ohio
ButlerMuhlenberg
Jefferson
Saline
McLean
Macoupin
Stark
ToddLogan
Lincoln
Bienville
Winn
Grant
Grenada
Lafayette
Benton
YalobushaTallahatchie
Shelby
Hardeman
Carroll
Madison
Lafayette
Simpson
Leake
0 25 50 75 100 Miles
0 25 50 75 100 Kilometers
U.S. DEPARTMENT OF COMMERCE Economics and Statistics Administration U.S. Census Bureau Prepared by the Geography Division
Arkansas River
Ohio River
Missouri River
G u l f o f M e x i c o
Wabash River
Illinois River M
ississip
pi Ri
ver
Mississippi River
Missi
ssippi River
Mississippi River: Significant Flood OutlookAreas Where Significant Flooding is Occurring or Imminent
May 22-27, 2011
Sources: Significant River Flood Outlook boundaries issued May 22, 2011,NOAA/National Weather Service (www.hpc.ncep.noaa.gov/nationalfloodoutlook);Counties/parishes identified as being at risk of significant flooding arebased on Significant River Flood Outlooks issued May 9 - May 22, 2011,NOAA/National Weather Service (www.hpc.ncep.noaa.gov/nationalfloodoutlook);River courses are as of November 2006, National Atlas of the United States,http://nationalatlas.gov;Generalized state and county/parish boundaries are as of January 1, 2010,U.S. Census Bureau
County/Parish at risk of significant floodingWayne
Select cityMemphis!
RiverOhio River
State boundaryIOWACounty/Parish boundary
Significant flooding occurring or imminent May 22-27, 2011

Sect. 3 : 186
Mississippi Emergency Management Agency
Mississippi Summary:
In Tunica County, nine casinos located on stationary river barges were closed most of May. The hotel por-tions of the casinos are located on adjacent, low-lying land, and began to flood with the rising waters, some up to 6 feet. Near Vicksburg, Highway 465 in Warren and Issaquena counties was closed on May 3 due to high flood waters. North-south access to and from Vicksburg was cut off for more than two weeks. U.S. Highway 61 between Vicksburg and Port Gibson was closed by backwater flooding along the Big Black River on May 12; it reopened June 1. Another portion of U.S. Highway 61 near Redwood was closed by backwater flooding along the Yazoo River on May 13 and was closed until June 3.
In anticipation of major flooding, the U.S. federal government declared 14 counties along the Mississippi River: Adams, Bolivar, Claiborne, Coahoma, Desoto, Humphreys, Issaquena, Jefferson, Sharkey, Tunica, Warren, Washington, Wilkinson and Yazoo. Mississippi Governor Haley Barbour urged holdouts to head for higher ground, saying “The biggest danger is that they choose not to evacuate assuming there’ll be some-one to rescue them,” noting that emergency teams could be endangered as well. “More than anything else save your life and don’t put at risk other people who might have to come in and save your lives.”
The Flood of 2011 set new record stages at Vicksburg and Natchez. The peak streamflow at Vicksburg, 2,310,000 cubic feet per second (65,000 m3/s), exceeded the both the estimated peak streamflow of the Great Mississippi Flood of 1927, 2,278,000 cu ft/s (64,500 m3/s), and the measured peak streamflow of the 1937 flood, 2,080,000 cu ft/s (59,000 m3/s). The Project Design Flood predicts that a flowrate at Vicksburg of 2,710,000 cubic feet per second (77,000 m3/s) would still be within the limits of the downstream capaci-ties, meaning that the May 17 - May 18 peak flow was about 85% of the acceptable flowrate for Vicksburg.
Hurricane Katrina 2005
On August 29, 2005, Hurricane Katrina made landfall resulting in widespread flash flooding across the state. The 26 counties impacted by this event include: Newton, Scott, Neshoba, Leake, Kemper, Winston, Attala, Noxubee, Oktibbeha, Choctaw, Lowndes, Clay, Forrest, George, Greene, Lamar, Perry, Stone, Wayne, Marion, Prentiss, Covington, Jefferson Davis, Jones, Jasper and Smith. This storm dropped five to eight inches of rain over a six to ten hour period. This rainfall event caused many county roads and other secondary roads to remain flooded for a period of time with a number of roads being closed. Additionally, several roads had small sections washed out or nearly washed out due to their locations in low lying areas near creeks and creek-bottoms.
125-year event Central Mississippi 2003
On April 6, 2003, many counties in Mississippi experienced a 125-year rainfall event. To put the entire event into perspective, areas north of Interstate 20 and extending west and east across the entire state were impacted. The 16 counties impacted include: Hinds, Scott, Rankin, Yazoo, Grenada, Leflore, Lee, Warren, Choctaw, Madison, Leake, Winston, Newton, Neshoba, Lauderdale and Kemper. Rainfall totals averaged 7 to 12 inches in a period of 18 hours. River flooding quickly became a major problem due to the large amounts of rainfall. Pelahatchie Creek experienced a 100-year flood event. The Chunky River at Chunky set a new record. This river actually flooded a portion of Interstate 20 which had to be closed for a few hours. The Chickasawhay River at Enterprise also set a record. In addition to the flash flooding, river flood-ing caused major damage to homes and numerous roads.
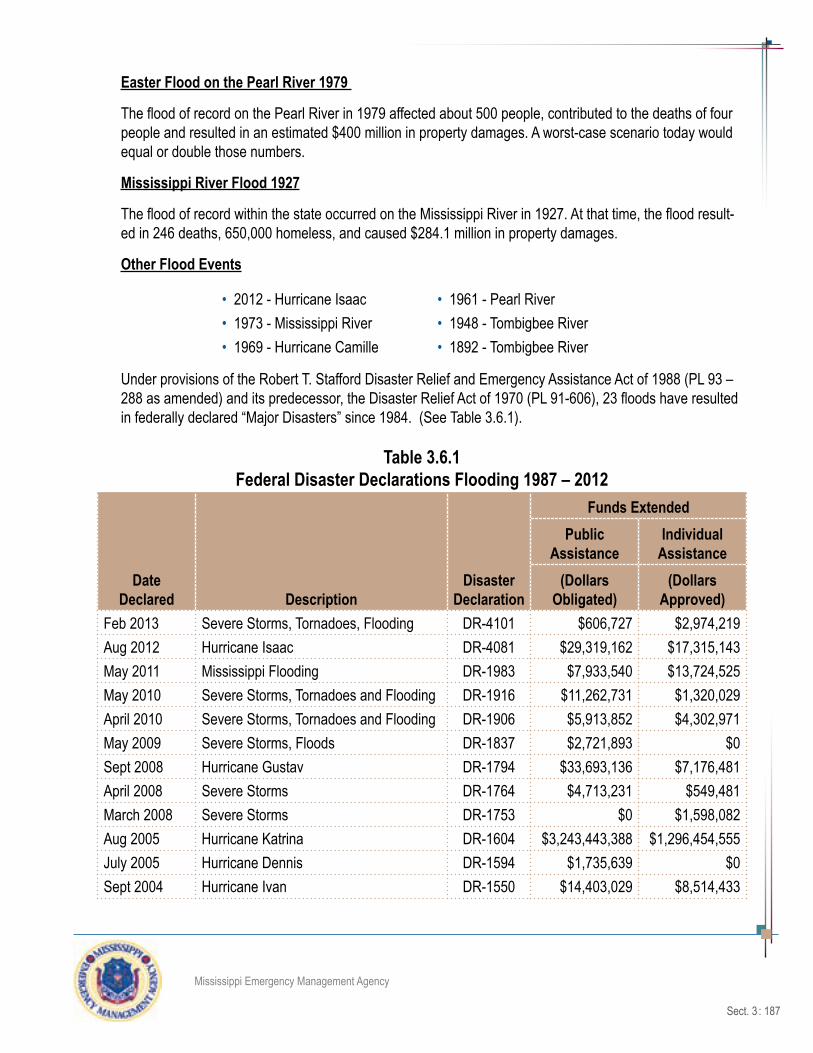
Sect. 3 : 187
Mississippi Emergency Management Agency
Easter Flood on the Pearl River 1979
The flood of record on the Pearl River in 1979 affected about 500 people, contributed to the deaths of four people and resulted in an estimated $400 million in property damages. A worst-case scenario today would equal or double those numbers.
Mississippi River Flood 1927
The flood of record within the state occurred on the Mississippi River in 1927. At that time, the flood result-ed in 246 deaths, 650,000 homeless, and caused $284.1 million in property damages.
Other Flood Events
• 2012 - Hurricane Isaac • 1961 - Pearl River• 1973 - Mississippi River • 1948 - Tombigbee River• 1969 - Hurricane Camille • 1892 - Tombigbee River
Under provisions of the Robert T. Stafford Disaster Relief and Emergency Assistance Act of 1988 (PL 93 – 288 as amended) and its predecessor, the Disaster Relief Act of 1970 (PL 91-606), 23 floods have resulted in federally declared “Major Disasters” since 1984. (See Table 3.6.1).
Table 3.6.1Federal Disaster Declarations Flooding 1987 – 2012
Date Declared Description
Disaster Declaration
Funds ExtendedPublic
AssistanceIndividual
Assistance(Dollars
Obligated)(Dollars
Approved)Feb 2013 Severe Storms, Tornadoes, Flooding DR-4101 $606,727 $2,974,219Aug 2012 Hurricane Isaac DR-4081 $29,319,162 $17,315,143May 2011 Mississippi Flooding DR-1983 $7,933,540 $13,724,525May 2010 Severe Storms, Tornadoes and Flooding DR-1916 $11,262,731 $1,320,029April 2010 Severe Storms, Tornadoes and Flooding DR-1906 $5,913,852 $4,302,971May 2009 Severe Storms, Floods DR-1837 $2,721,893 $0Sept 2008 Hurricane Gustav DR-1794 $33,693,136 $7,176,481April 2008 Severe Storms DR-1764 $4,713,231 $549,481March 2008 Severe Storms DR-1753 $0 $1,598,082Aug 2005 Hurricane Katrina DR-1604 $3,243,443,388 $1,296,454,555July 2005 Hurricane Dennis DR-1594 $1,735,639 $0Sept 2004 Hurricane Ivan DR-1550 $14,403,029 $8,514,433

Sect. 3 : 188
Mississippi Emergency Management Agency
April 2003 Severe Storms DR-1459 $6,031,462 $18,270,709Oct 2002 Tropical Storm Isidore and Hurricane Lili DR-1436 $6,784,617 $0 Nov 2001 Severe Storms DR-1398 $5,519,322 Not availableJune 2001 Tropical Storm Allison DR-1382 $1,804,361 Not availableApril 2001 Severe Storms DR-1365 $2,855,253 Not availableSept 1998 Hurricane Georges DR-1251 $32,124,060 Not availableJune1997 Mississippi River Floods DR-1178 $264,979 Not availableMay 1995 Response 1995 DR-1051 $996,257 Not availableMay 1991 April – May Floods DR-906 $7,390,442 Not availableFeb 1990 January – March Floods DR-859 $7,901,304 Not availableMarch 1987 Severe Storms, Floods DR-7687 Not available Not availableSource: Federal Emergency Management Agency Total dollars for PA and IA through April 2013
There are 82 counties within the state; all of which suffered at least one event since 1993. The number of instances for each of the counties by MEMA Region is indicated in Table 3.6.2.
Table 3.6.2Mississippi Flood History 1993 – December 2012
By County/MEMA Region
MEMA Region CountyNumber of
Events Deaths InjuriesProperty Damage
($)MEMA Region 1 Coahoma 19 1 0 $903,500
Desoto 44 3 0 $6,151,500Grenada 37 0 0 $2,135,500Panola 16 1 0 $264,500Quitman 4 0 0 $62,000Tallahatchie 12 0 0 $750,000Tate 19 3 7 $108,500Tunica 7 2 0 $1,000,226,500Yalobusha 6 0 0 $6,000
Total Region 1 164 10 7 $1,010,608,000

Sect. 3 : 189
Mississippi Emergency Management Agency
MEMA Region CountyNumber of
Events Deaths InjuriesProperty Damage
($)MEMA Region 2 Alcorn 27 1 0 $1,171,500
Benton 4 0 0 $12,000Itawmaba 11 0 0 $15,000Lafayette 18 1 0 $614,500Lee 35 1 0 $492,500Marshall 12 2 0 $632,500Pontotoc 13 0 0 $29,000Prentiss 14 0 0 $86,000Tippah 9 1 0 $102,500Tishomingo 11 3 0 $54,000Union 18 0 0 $52,000
Total Region 2 172 9 0 $3,261,500MEMA Region 3 Attala 18 0 0 $2,558,000
Bolivar 36 0 0 $3,373,690Carroll 12 0 0 $91,000Holmes 14 0 0 $12,923,000Humphreys 16 0 0 $1,042,000Leflore 23 0 0 $556,500Montgomery 15 0 0 $426,000Sunflower 21 0 0 $293,500Washington 29 0 0 $6,510,190
Total Region 3 184 0 0 $27,773,880MEMA Region 4 Calhoun 13 0 0 $17,000
Chickasaw 4 0 0 $3,000Choctaw 11 0 0 $980,000Clay 9 0 0 $705,500Lowndes 26 0 0 $5,549,000Monroe 16 0 0 $54,000Noxubee 12 0 0 $358,000Oktibbeha 16 0 0 $1,263,000Webster 8 0 0 $301,000Winston 11 0 0 $1,435,000
Total Region 4 126 0 0 $10,665,500
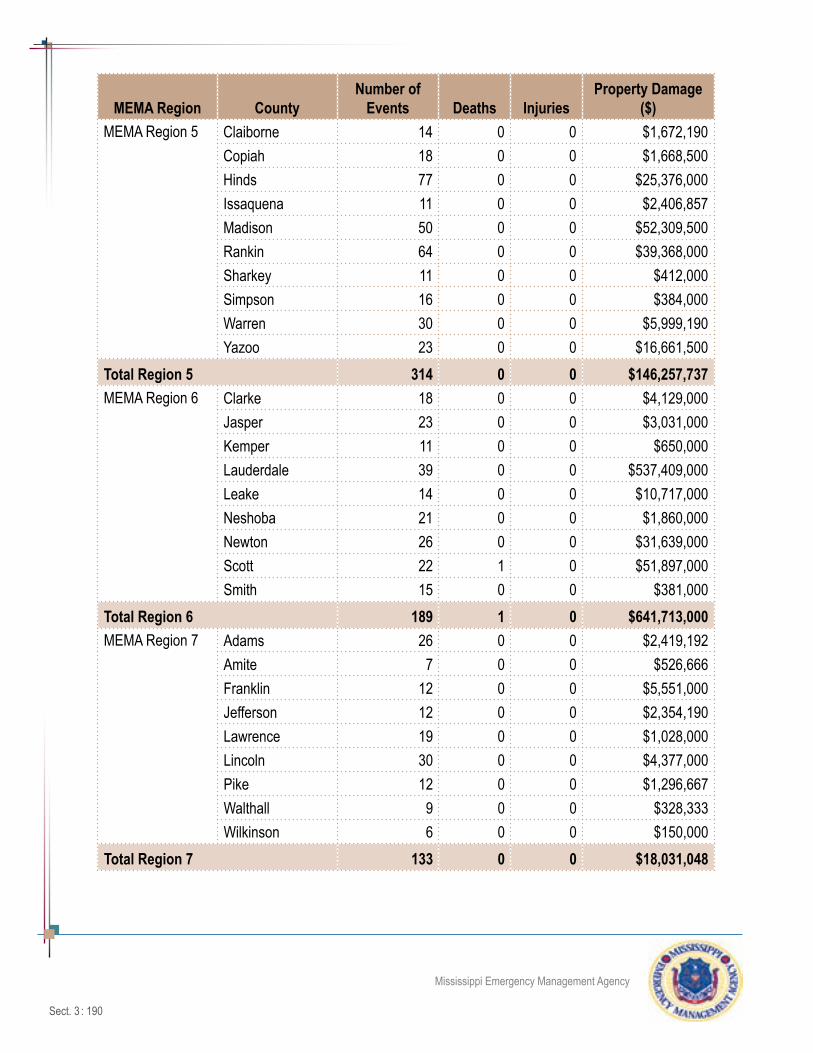
Sect. 3 : 190
Mississippi Emergency Management Agency
MEMA Region CountyNumber of
Events Deaths InjuriesProperty Damage
($)MEMA Region 5 Claiborne 14 0 0 $1,672,190
Copiah 18 0 0 $1,668,500Hinds 77 0 0 $25,376,000Issaquena 11 0 0 $2,406,857Madison 50 0 0 $52,309,500Rankin 64 0 0 $39,368,000Sharkey 11 0 0 $412,000Simpson 16 0 0 $384,000Warren 30 0 0 $5,999,190Yazoo 23 0 0 $16,661,500
Total Region 5 314 0 0 $146,257,737MEMA Region 6 Clarke 18 0 0 $4,129,000
Jasper 23 0 0 $3,031,000Kemper 11 0 0 $650,000Lauderdale 39 0 0 $537,409,000Leake 14 0 0 $10,717,000Neshoba 21 0 0 $1,860,000Newton 26 0 0 $31,639,000Scott 22 1 0 $51,897,000Smith 15 0 0 $381,000
Total Region 6 189 1 0 $641,713,000MEMA Region 7 Adams 26 0 0 $2,419,192
Amite 7 0 0 $526,666Franklin 12 0 0 $5,551,000Jefferson 12 0 0 $2,354,190Lawrence 19 0 0 $1,028,000Lincoln 30 0 0 $4,377,000Pike 12 0 0 $1,296,667Walthall 9 0 0 $328,333Wilkinson 6 0 0 $150,000
Total Region 7 133 0 0 $18,031,048

Sect. 3 : 191
Mississippi Emergency Management Agency
MEMA Region CountyNumber of
Events Deaths InjuriesProperty Damage
($)MEMA Region 8 Covington 20 0 0 $999,000
Forrest 54 1 0 $3,037,000Greene 21 0 0 $95,000Jefferson Davis 20 0 0 $672,000Jones 36 0 0 $590,000Lamar 48 0 0 $8,845,666Marion 45 0 0 $19,650,667Perry 17 0 0 $67,000Wayne 15 0 0 $109,000
Total Region 8 276 1 0 $34,065,333MEMA Region 9 George 21 0 0 $37,000
Hancock 18 0 0 $860,000Harrison 26 1 0 $6,813,333Jackson 22 0 0 $1,193,333Pearl River 24 0 0 $2,518,333Stone 24 0 0 $623,000
Total Region 9 135 1 0 $12,044,999Total 1,693 22 7 $1,904,420,997
Probability of Future Flood Events
Based on available historical data, major floods occur within the state of Mississippi every two to three years, resulting in a calculated probability of reoccurrence of from one-in-two to one-in-three. One in six acres in Mississippi is found within the designated floodplain.
The Flood Insurance Studies (FIS) and their accompanying Flood Insurance Rate Maps (FIRMs) provide a means to identify the probability of future flood events. Through use of the flood profiles for each river and stream, summary of discharge tables, and floodway data tables, each community’s future event probability can be adequately identified. The flood levels that can be predicted consist of the ten-year, 50-year, 100-year and 500-year Base Flood Elevation (BFE) depths.
Another means of prediction of future events is the examination of past events, as this also establishes a probability of reoccurring floods or repetitive flooding. There have been 23 federally declared disasters in Mississippi since 1987 (Table 3.6.2) and 17 Small Business Administration (Table 3.6.3) flood declarations. Each event contained some measure of the four types of flooding identified in the flood hazard description of this plan. These statistics place the state of Mississippi within the top tier of disaster prone states.

Sect. 3 : 192
Mississippi Emergency Management Agency
Table 3.6.3Number of Counties Desigated in
SBA Declared Flood Events Since 1998
Disaster Designation Initial Date of DeclarationNumber of
Counties DeclaredSBA MS-13543 April 2013 5SBA MS-13492 February 2013 10SBA MS-13439 January 2013 7SBA MS-13273 September 2013 22SBA MS-12938 November 2011 7SBA MS-00029 May 2009 7SBA MS-00033 April 2009 18SBA MS-00034 March 2009 82SBA MS-00028 March 2009 4SBA MS-00026 August 2008 63SBA MS-00020 May 2008 9SBA MS-00021 March 2008 12SBA MS-00009 November 2006 13SBA (Flooding) April 2005 18SBA (Flooding) August 2004 2SBA (Flooding) August 2003 7SBA (Flooding) August 2001 1Source: U.S. Small Business Administration
FEMA RiskMAP Program in Mississippi
Beginning with FEMA FY2010 funding the state of Mississippi and FEMA flood mapping has shifted from the original FEMA Map Mod Program where DFIRM work was based on county-wide projects to the new RiskMAP Program. What is different about RiskMAP vs. Map Mod is that DFIRM work is now based on HUC-8 basins (for example: the Big Sunflower Basin) which will included all or parts of multiple counties under RiskMAP. In addition to the regulatory products (Flood Insurance Study (FIS), DFIRM and DFIRM GIS Database), communities in a studied basin will receive new non-regulatory products which will include the following; Watershed Flood Risk Report, Watershed Risk Map, and Flood Risk GIS Database with Changes Since Last FIRM data, Multi-Frequency Flood Depth Grids, Percent Annual Chance of Flooding data, Percent Chance of Flooding over 30-Years and new HAZUS Annualized Risk data. All this data can be used in day-to-day floodplain management, mitigation work and can be incorporated into hazard plan-ning. All new DFIRM work will use Lidar elevation data where available. As of early 2013, approximately 65% of the State has Lidar coverage.

Sect. 3 : 193
Mississippi Emergency Management Agency
Project status from 2012 Annual Status Report - Mississippi Coordinating Council for Remote Sensing and Geographic Information Systems is provided below.
FY2009: As of the end of 2012, seven of the eight counties had preliminary DFIRMs completed and sumbitted to local county and communicty officials for review, three of the eight have entered the com-pliance stage and one of the eight have had their new mapping go effective for insurance purposes. Tunica is on-hold due to levee issues. The FY2009 mapping year is considered a transition year in funding between FEMA’s MAP MOD program and the RiskMAP program which began with FY2010 funding and run through FY2014.
RiskMAP FY2010-2014: With the FEMA RiskMAP program, all RiskMAP and new DFIRM studies are based on HUC_8 sub-basin basis. As of the end of 2012, scheduling and work had begun on seven HUC-8 sub-basins. Three sub-basins are schedued under FY2010 FEMA funding, four under FY2011 FEMA Funding and one under FY2012. The first discovery/scoping meeting with county and local city officials is scheduled for early February 2012. These meetings for FY2010 sub-basins are to be com-pleted in 2012 and FY2011 sub-basin meeting will be completed in 2014.
Figure 3.6.1MAP MOD Flood Mapping Status

Sect. 3 : 194
Mississippi Emergency Management Agency
Figure 3.6.2FY2009 County Flood Mapping Status
Figure 3.6.3FY2009 County Flood Mapping Status

Sect. 3 : 195
Mississippi Emergency Management Agency
National Flood Insurance Program (NFIP) Mississippi has 363 communities that have federally identified Special Flood Hazard Areas (SFHA) or floodplains. These areas indicate the water surface elevation resulting from a flood that has a one percent or greater chance of being equaled or exceeded in any given year.
There are 329 Mississippi communities that are members of the National Flood Insurance Program (NFIP), including 4 communities (Carrollton, Coahoma, Courtland and Renova) that are in the emergency plan. Additionally, 31 communities also participate in the Community Rating System (CRS). Details on the com-munities that participate in the program are found in Appendix 7.3.6-A.
To show the forward progress being made by communities, Table 3.6.4 provides a summary of the com-munity participation in the NFIP and CRS communities since the 2007 State of Mississippi Standard Hazard Mitigation Plan.
Table 3.6.4NFIP and CRS Community Participation
State Plan Year NFIP Communities Emergency Plan CRS Communities2013 329 4 312010 305 15 232007 276 4 19
The state analyzed National Flood Insurance Program (NFIP) flood-loss data to determine areas of Missis-sippi with the greatest flood risk. Mississippi flood-loss information was culled from FEMA’s “Loss Statistics Data by Community with County and State Data,” which documents losses from 1978 to the present (this analysis is based on the report dated February 28, 2013).
There are several limitations to this data, including:
• only insured losses to participating NFIP communities are represented,
• communities joined the NFIP at various times since 1978,
• the number of flood insurance policies in effect may not include all structures at risk to flooding, and
• some of the historical loss areas have been mitigated with property buyouts.
Despite these limitations, the data depict a pattern of historical flood losses in the state. The greatest losses continue to be located in the counties along the Gulf Coast: Harrison, Hancock, and Jackson. In the 2010 Plan, Rankin and Madison Counties were ranked 4th and 5th and are now ranked 11th and 18th respec-tively.
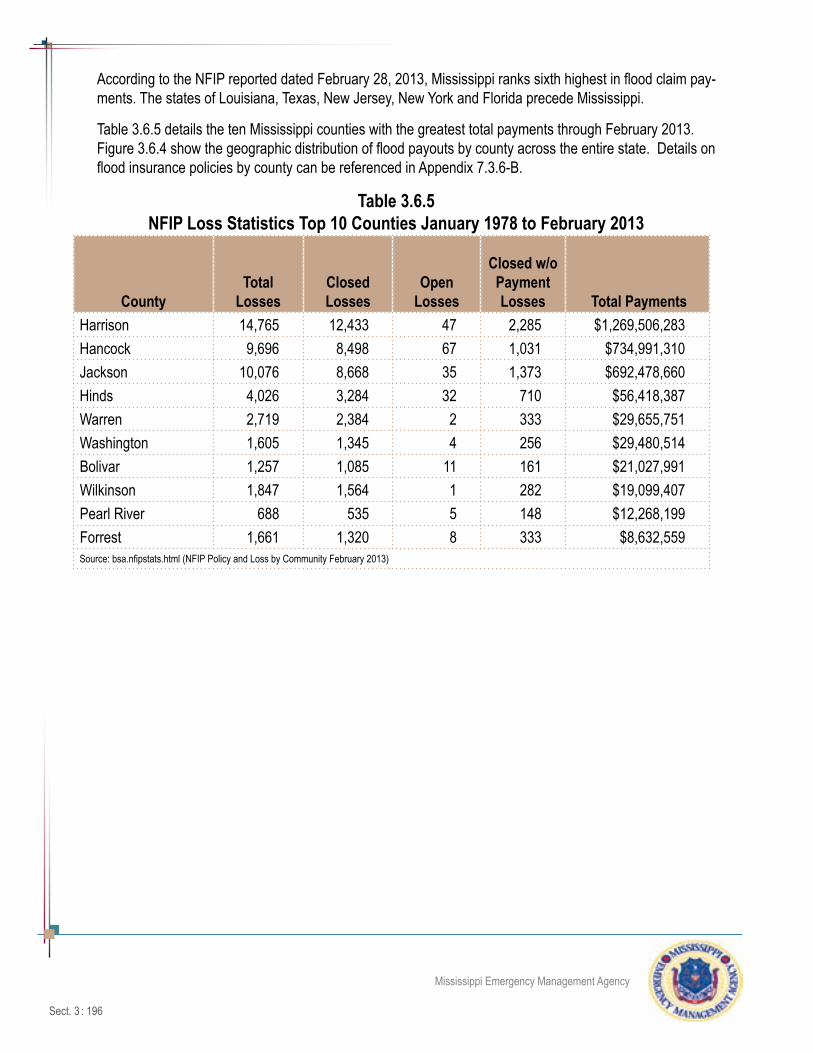
Sect. 3 : 196
Mississippi Emergency Management Agency
According to the NFIP reported dated February 28, 2013, Mississippi ranks sixth highest in flood claim pay-ments. The states of Louisiana, Texas, New Jersey, New York and Florida precede Mississippi.
Table 3.6.5 details the ten Mississippi counties with the greatest total payments through February 2013. Figure 3.6.4 show the geographic distribution of flood payouts by county across the entire state. Details on flood insurance policies by county can be referenced in Appendix 7.3.6-B.
Table 3.6.5NFIP Loss Statistics Top 10 Counties January 1978 to February 2013
CountyTotal
LossesClosed Losses
Open Losses
Closed w/o Payment Losses Total Payments
Harrison 14,765 12,433 47 2,285 $1,269,506,283 Hancock 9,696 8,498 67 1,031 $734,991,310 Jackson 10,076 8,668 35 1,373 $692,478,660 Hinds 4,026 3,284 32 710 $56,418,387 Warren 2,719 2,384 2 333 $29,655,751 Washington 1,605 1,345 4 256 $29,480,514 Bolivar 1,257 1,085 11 161 $21,027,991 Wilkinson 1,847 1,564 1 282 $19,099,407 Pearl River 688 535 5 148 $12,268,199 Forrest 1,661 1,320 8 333 $8,632,559 Source: bsa.nfipstats.html (NFIP Policy and Loss by Community February 2013)

Sect. 3 : 197
Mississippi Emergency Management Agency
FIGURE 3.6.4NFIP Loss Statistics - Total Payments 1978 - 2013
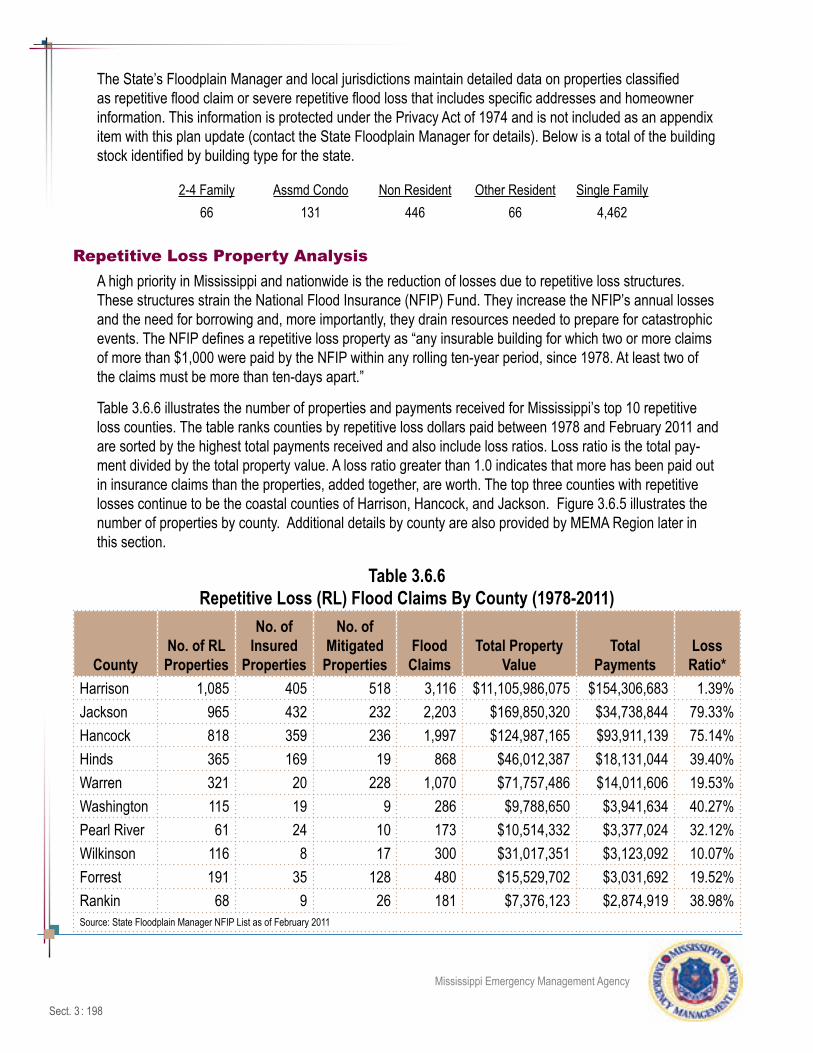
Sect. 3 : 198
Mississippi Emergency Management Agency
The State’s Floodplain Manager and local jurisdictions maintain detailed data on properties classified as repetitive flood claim or severe repetitive flood loss that includes specific addresses and homeowner information. This information is protected under the Privacy Act of 1974 and is not included as an appendix item with this plan update (contact the State Floodplain Manager for details). Below is a total of the building stock identified by building type for the state.
2-4 Family Assmd Condo Non Resident Other Resident Single Family66 131 446 66 4,462
Repetitive Loss Property AnalysisA high priority in Mississippi and nationwide is the reduction of losses due to repetitive loss structures. These structures strain the National Flood Insurance (NFIP) Fund. They increase the NFIP’s annual losses and the need for borrowing and, more importantly, they drain resources needed to prepare for catastrophic events. The NFIP defines a repetitive loss property as “any insurable building for which two or more claims of more than $1,000 were paid by the NFIP within any rolling ten-year period, since 1978. At least two of the claims must be more than ten-days apart.”
Table 3.6.6 illustrates the number of properties and payments received for Mississippi’s top 10 repetitive loss counties. The table ranks counties by repetitive loss dollars paid between 1978 and February 2011 and are sorted by the highest total payments received and also include loss ratios. Loss ratio is the total pay-ment divided by the total property value. A loss ratio greater than 1.0 indicates that more has been paid out in insurance claims than the properties, added together, are worth. The top three counties with repetitive losses continue to be the coastal counties of Harrison, Hancock, and Jackson. Figure 3.6.5 illustrates the number of properties by county. Additional details by county are also provided by MEMA Region later in this section.
Table 3.6.6Repetitive Loss (RL) Flood Claims By County (1978-2011)
CountyNo. of RL Properties
No. of Insured
Properties
No. of Mitigated
PropertiesFlood
ClaimsTotal Property
ValueTotal
PaymentsLoss Ratio*
Harrison 1,085 405 518 3,116 $11,105,986,075 $154,306,683 1.39%Jackson 965 432 232 2,203 $169,850,320 $34,738,844 79.33%Hancock 818 359 236 1,997 $124,987,165 $93,911,139 75.14%Hinds 365 169 19 868 $46,012,387 $18,131,044 39.40%Warren 321 20 228 1,070 $71,757,486 $14,011,606 19.53%Washington 115 19 9 286 $9,788,650 $3,941,634 40.27%Pearl River 61 24 10 173 $10,514,332 $3,377,024 32.12%Wilkinson 116 8 17 300 $31,017,351 $3,123,092 10.07%Forrest 191 35 128 480 $15,529,702 $3,031,692 19.52%Rankin 68 9 26 181 $7,376,123 $2,874,919 38.98%Source: State Floodplain Manager NFIP List as of February 2011

Sect. 3 : 199
Mississippi Emergency Management Agency
Figure 3.6.5Number of Repetitive Loss Properties by County

Sect. 3 : 200
Mississippi Emergency Management Agency
Severe Repetitive Loss Property Analysis
The Flood Insurance Reform Act of 2004 identified another category of repetitive loss. Severe repetitive loss (SRL) is defined as “a single family property (consisting of one-to-four residences) that is covered under flood insurance by the NFIP and has incurred flood-related damage for which four or more separate claims payments have been paid under flood insurance coverage with the amount of each claim payment exceeding $5,000 and with cumulative amount of such claims payments exceeding $20,000; or for which at least two separate claims payments have been made with the cumulative amount of such claims exceeding the reported value of the property.”
Table 3.6.7 illustrates the number of properties and the payments received for Mississippi’s top 10 severe repetitive loss counties. The table ranks counties by severe repetitive loss dollars paid between 1978 and February 2011 and are sorted by the highest total payments received and also include loss ratios. Loss ratio is the total payment divided by the total property value. A loss ratio greater than 1.0 indicates that more has been paid out in insurance claims than the properties, added together, are worth. The top three counties with repetitive losses continue to be the coastal counties of Harrison, Hancock, and Jackson. and Figure 3.6.6 illustrates the number of properties by county. Additional details by county are also provided by MEMA Region later in this section.
Table 3.6.7 Mississippi's Severe Repetitive Loss Summary by County (Ranked by Total Payment)
CountyNo. of SRL Properties
No. of Insured
PropertiesFlood
Claims
Total Property
Value
Total Payments (Bldg and Contents)
Loss Ratio*
Harrison 125 82 557 $25,379,797 $27,585,793 1.09 Jackson 95 25 394 $16,332,248 $21,064,542 1.29 Hancock 70 36 231 $8,227,715 $12,201,301 1.48 Wilkinson 86 7 440 $2,769,516 $7,135,380 2.58 Warren 60 6 299 $4,539,401 $4,980,559 1.10 Washington 48 18 250 $4,020,018 $4,512,832 1.12 Hinds 46 18 157 $4,352,456 $3,909,006 0.90 Bolivar 48 5 228 $1,950,584 $3,200,898 1.64 Lamar 19 6 128 $1,923,375 $2,469,416 1.28 Claiborne 32 9 162 $1,361,739 $1,662,501 1.22 Source: State Floodplain Manager NFIP List as of February 2011

Sect. 3 : 201
Mississippi Emergency Management Agency
Figure 3.6.6Number of Severe Repetitive Loss Properties
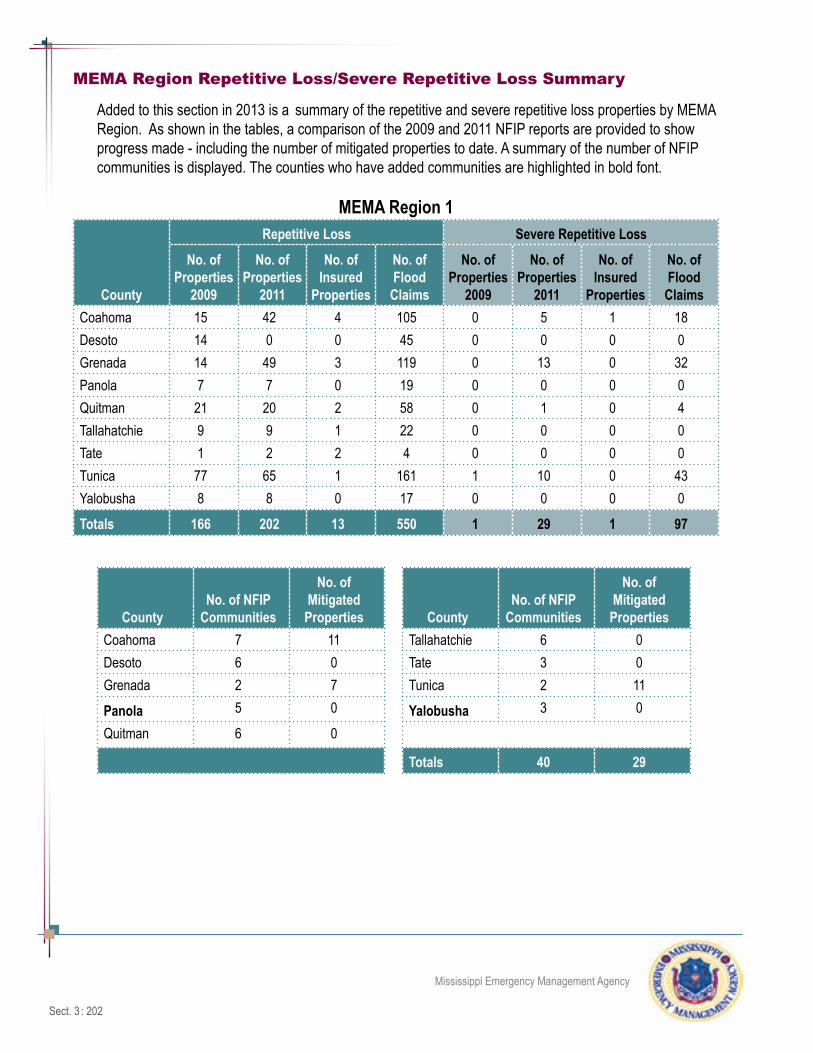
Sect. 3 : 202
Mississippi Emergency Management Agency
MEMA Region Repetitive Loss/Severe Repetitive Loss Summary
Added to this section in 2013 is a summary of the repetitive and severe repetitive loss properties by MEMA Region. As shown in the tables, a comparison of the 2009 and 2011 NFIP reports are provided to show progress made - including the number of mitigated properties to date. A summary of the number of NFIP communities is displayed. The counties who have added communities are highlighted in bold font.
MEMA Region 1
County
Repetitive Loss Severe Repetitive LossNo. of
Properties 2009
No. of Properties
2011
No. of Insured
Properties
No. of Flood
Claims
No. of Properties
2009
No. of Properties
2011
No. of Insured
Properties
No. of Flood
ClaimsCoahoma 15 42 4 105 0 5 1 18Desoto 14 0 0 45 0 0 0 0Grenada 14 49 3 119 0 13 0 32Panola 7 7 0 19 0 0 0 0Quitman 21 20 2 58 0 1 0 4Tallahatchie 9 9 1 22 0 0 0 0Tate 1 2 2 4 0 0 0 0Tunica 77 65 1 161 1 10 0 43Yalobusha 8 8 0 17 0 0 0 0
Totals 166 202 13 550 1 29 1 97
CountyNo. of NFIP
Communities
No. of Mitigated Properties County
No. of NFIP Communities
No. of Mitigated Properties
Coahoma 7 11 Tallahatchie 6 0Desoto 6 0 Tate 3 0Grenada 2 7 Tunica 2 11
Panola 5 0 Yalobusha 3 0
Quitman 6 0
Totals 40 29

Sect. 3 : 203
Mississippi Emergency Management Agency
MEMA Region 2
County
Repetitive Loss Severe Repetitive LossNo. of
Properties 2009
No. of Properties
2011
No. of Insured
Properties
No. of Flood
Claims
No. of Properties
2009
No. of Properties
2011
No. of Insured
Properties
No. of Flood
ClaimsAlcorn 0 7 6 14 0 0 0 0Benton 0 0 0 0 0 0 0 0Itawamba 0 0 0 0 0 0 0 0Lafayette 0 3 2 6 0 0 0 0Lee 4 7 4 17 0 1 1 6Marshall 1 1 0 3 0 0 0 0Pontotoc 1 1 0 2 0 0 0 0Prentiss 0 0 0 0 3 0 0 0Tippah 0 0 0 0 0 0 0 0Tishomingo 1 1 0 2 0 0 0 0Union 3 2 0 4 0 1 0 2
Totals 10 22 12 48 3 2 1 8
CountyNo. of NFIP
Communities
No. of Mitigated Properties County
No. of NFIP Communities
No. of Mitigated Properties
Alcorn 3 0 Pontotoc 3 0
Benton 3 0 Prentiss 2 0Itawamba 3 0 Tippah 4 0
Lafayette 4 0 Tishomingo 6 0
Lee 8 3 Union 4 0
Marshall 4 0
Totals 44 3

Sect. 3 : 204
Mississippi Emergency Management Agency
MEMA Region 3
County
Repetitive Loss Severe Repetitive LossNo. of
Properties 2009
No. of Properties
2011
No. of Insured
Properties
No. of Flood
Claims
No. of Properties
2009
No. of Properties
2011
No. of Insured
Properties
No. of Flood
ClaimsAttala 0 0 0 0 0 0 0 0Bolivar 155 108 11 272 2 48 5 228Carroll 4 4 0 8 0 0 0 0Holmes 11 12 4 27 0 0 0 0Humphreys 40 31 8 83 2 10 2 61LeFlore 29 27 0 70 0 2 0 8Montgomery 0 0 0 0 0 0 0 0Sunflower 19 16 0 51 1 4 0 21Washington 152 115 19 286 14 48 18 250
Totals 410 313 42 797 19 112 25 568
CountyNo. of NFIP
Communities
No. of Mitigated Properties County
No. of NFIP Communities
No. of Mitigated Properties
Attala 4 0 Leflore 6 1
Bolivar 16 3 Montgomery 3 0
Carroll 4 0 Sunflower 8 3Holmes 8 0 Washington 6 0
Humphreys 4 0
Totals 59 16

Sect. 3 : 205
Mississippi Emergency Management Agency
MEMA Region 4
County
Repetitive Loss Severe Repetitive LossNo. of
Properties 2009
No. of Properties
2011
No. of Insured
Properties
No. of Flood
Claims
No. of Properties
2009
No. of Properties
2011
No. of Insured
Properties
No. of Flood
ClaimsCalhoun 5 4 1 8 0 1 0 7Chickasaw 1 1 1 2 0 0 0 0Choctaw 0 0 0 0 0 0 0 0Clay 8 8 0 24 0 0 0 0Lowndes 125 109 24 292 2 14 4 79Monroe 12 9 4 24 1 3 1 11Noxubee 0 0 0 0 0 0 0 0Oktibbeha 2 2 0 7 0 0 0 0Webster 5 4 0 10 0 1 0 6Winston 2 2 2 4 0 0 0 0
Totals 160 139 32 371 3 19 5 103
CountyNo. of NFIP
Communities
No. of Mitigated Properties County
No. of NFIP Communities
No. of Mitigated Properties
Calhoun 6 0 Monroe 5 0
Chickasaw 5 0 Noxubee 3 0
Choctaw 3 0 Oktibbeha 2 0Clay 2 0 Webster 2 0Lowndes 2 2 Winston 2 0
Totals 32 2
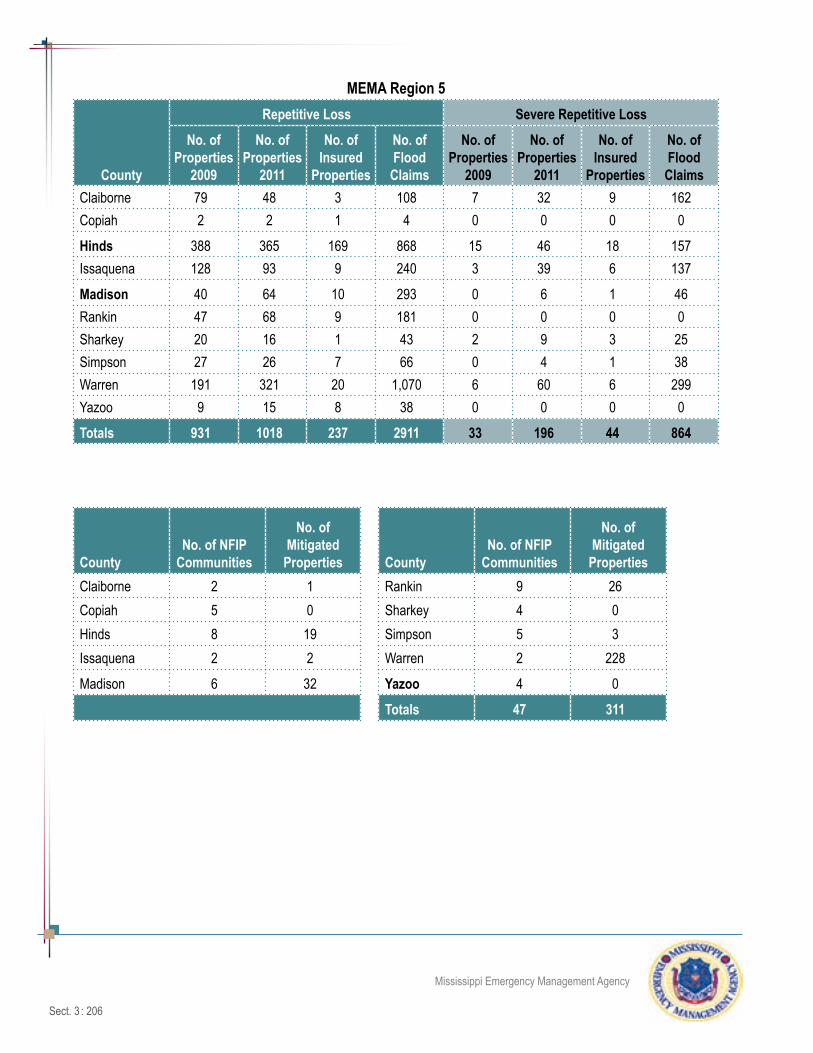
Sect. 3 : 206
Mississippi Emergency Management Agency
MEMA Region 5
County
Repetitive Loss Severe Repetitive LossNo. of
Properties 2009
No. of Properties
2011
No. of Insured
Properties
No. of Flood
Claims
No. of Properties
2009
No. of Properties
2011
No. of Insured
Properties
No. of Flood
ClaimsClaiborne 79 48 3 108 7 32 9 162Copiah 2 2 1 4 0 0 0 0
Hinds 388 365 169 868 15 46 18 157Issaquena 128 93 9 240 3 39 6 137
Madison 40 64 10 293 0 6 1 46Rankin 47 68 9 181 0 0 0 0Sharkey 20 16 1 43 2 9 3 25Simpson 27 26 7 66 0 4 1 38Warren 191 321 20 1,070 6 60 6 299Yazoo 9 15 8 38 0 0 0 0
Totals 931 1018 237 2911 33 196 44 864
CountyNo. of NFIP
Communities
No. of Mitigated Properties County
No. of NFIP Communities
No. of Mitigated Properties
Claiborne 2 1 Rankin 9 26Copiah 5 0 Sharkey 4 0Hinds 8 19 Simpson 5 3Issaquena 2 2 Warren 2 228
Madison 6 32 Yazoo 4 0
Totals 47 311

Sect. 3 : 207
Mississippi Emergency Management Agency
MEMA Region 6
County
Repetitive Loss Severe Repetitive LossNo. of
Properties 2009
No. of Properties
2011
No. of Insured
Properties
No. of Flood
Claims
No. of Properties
2009
No. of Properties
2011
No. of Insured
Properties
No. of Flood
ClaimsClarke 3 4 1 9 0 0 0 0Jasper 1 0 0 0 0 1 0 3Kemper 0 0 0 0 0 0 0 0Lauderdale 24 26 10 69 0 1 0 4Leake 4 4 2 8 0 0 0 0Neshoba 0 0 0 0 0 0 0 0Newton 1 1 0 2 0 0 0 0Scott 3 3 0 6 0 0 0 0Smith 0 0 0 0 0 0 0 0
Totals 36 38 13 94 0 2 0 7
CountyNo. of NFIP
Communities
No. of Mitigated Properties County
No. of NFIP Communities
No. of Mitigated Properties
Clarke 6 1 Neshoba 2 0Jasper 3 0 Newton 4 0Kemper 3 0 Scott 5 0Lauderdale 3 4 Smith 3 0
Leake 3 0
Totals 32 5

Sect. 3 : 208
Mississippi Emergency Management Agency
MEMA Region 7
County
Repetitive Loss Severe Repetitive LossNo. of
Properties 2009
No. of Properties
2011
No. of Insured
Properties
No. of Flood
Claims
No. of Properties
2009
No. of Properties
2011
No. of Insured
Properties
No. of Flood
ClaimsAdams 11 16 0 43 0 0 0 0Amite 0 0 0 0 0 0 0 0Franklin 0 0 0 0 0 0 0 0Jefferson 9 6 1 15 0 3 1 17Lawrence 2 1 0 2 1 1 0 11Lincoln 3 3 0 6 0 0 0 0Pike 10 12 4 26 0 3 1 16Walthall 19 16 5 34 0 3 1 8Wilkinson 204 116 8 300 3 86 7 440
Totals 258 170 18 426 4 96 10 492
CountyNo. of NFIP
Communities
No. of Mitigated Properties County
No. of NFIP Communities
No. of Mitigated Properties
Adams 2 5 Lincoln 1 0Amite 3 0 Pike 4 0
Franklin 1 0 Walthall 2 0Jefferson 2 0 Wilkinson 4 17
Lawrence 4 0
Totals 23 22

Sect. 3 : 209
Mississippi Emergency Management Agency
MEMA Region 8
County
Repetitive Loss Severe Repetitive LossNo. of
Properties 2009
No. of Properties
2011
No. of Insured
Properties
No. of Flood
Claims
No. of Properties
2009
No. of Properties
2011
No. of Insured
Properties
No. of Flood
ClaimsCovington 11 11 2 27 0 0 0 0Forrest 71 191 35 480 2 6 3 43Greene 0 2 2 4 0 0 0 0Jefferson Davis 0 0 0 0 0 0 0 0Jones 12 12 2 34 0 0 0 0Lamar 36 19 6 54 6 19 6 128Marion 83 77 16 209 2 14 1 73Perry 11 9 1 20 0 2 0 6Wayne 3 3 1 11 0 0 0 0
Totals 227 324 65 839 10 41 10 250
CountyNo. of NFIP
Communities
No. of Mitigated Properties County
No. of NFIP Communities
No. of Mitigated Properties
Covington 4 0 Lamar 4 1Forrest 2 128 Marion 2 9Greene 3 0 Perry 4 0Jefferson Davis 2 0 Wayne 3 0Jones 3 0
Totals 27 138

Sect. 3 : 210
Mississippi Emergency Management Agency
MEMA Region 9
County
Repetitive Loss Severe Repetitive LossNo. of
Properties 2009
No. of Properties
2011
No. of Insured
Properties
No. of Flood
Claims
No. of Properties
2009
No. of Properties
2011
No. of Insured
Properties
No. of Flood
ClaimsGeorge 1 1 0 2 0 0 0 0Hancock 727 818 359 1,997 39 70 36 231Harrison 724 1,085 405 3,116 72 125 82 557Jackson 947 965 432 2,203 26 95 25 394Pearl River 61 61 24 173 6 10 7 44Stone 1 1 0 2 0 0 0 0
Totals 2461 2931 1220 7493 143 300 150 1226
CountyNo. of NFIP
Communities
No. of Mitigated Properties County
No. of NFIP Communities
No. of Mitigated Properties
George 2 0 Jackson 5 232Hancock 4 236 Pearl River 4 10Harrison 6 518 Stone 2 0
Totals 11 996

Sect. 3 : 211
Mississippi Emergency Management Agency
Assessing Vulnerability by Jurisdiction / Estimating Potential Losses
Methodology
This plan update utilized the same HAZUS runs for flood from the 2010 plan as the asset inventory, popula-tion and mapping formats have not changed.
During the 2010 plan update, the state used the most recent release of FEMA’s loss estimation software, HAZUS-MH MR4, to model flood loss for every county in Mississippi. HAZUS-MR4 can assess flood loss for an entire county if digital terrain data exists. Since digital elevation models (DEMs) were available for the entire state of Mississippi, the state was able to use HAZUS-MR4 to develop computer-generated floodplain boundaries for the flood elevation that has a one-percent chance of being equaled or exceeded each year (hereafter referred to as the “base flood,” also known as the 100-year flood) on major streams in each county. HAZUS-MR4 computes the potential flood impact on a building inventory database based on the extent and depth of the modeled floodwaters, enabling a consistent methodology for a county-by-county assessment of potential flood losses.
The HAZUS-MR4 flood analysis was a significant undertaking for the state. Producing a HAZUS-MR4 flood run is very computer-resource intensive. Processing a single county takes a minimum of 12 hours from start to finish, depending on the size of the county, density of the stream network, and density of census blocks. Several machines dedicated to running HAZUS-MR4 were used continually over a period of two months.
To develop countywide probabilistic analyses for each county, the following parameters were used:
• Thirty-meter (30-m) resolution DEMs as the terrain base to develop hydrologic and hydraulic models.
• Streams and rivers with a minimum drainage basin area of ten square miles all experiencing a base flood at the same time.
• U.S. Geological Survey hydrologic regional regression equations and stream gage data included in HAZUS-MR4.
• HAZUS-MR4 building inventory defaults summarized to the census-block level with 2006 building valuations.
HAZUS-MH produces a flood polygon and flood depth grid that represents the base flood. While not as accurate as official flood maps, such as digital flood insurance rate maps, these floodplain boundaries are available for use in GIS and could be valuable to communities that have not been mapped by the National Flood Insurance Program. A statewide digital flood hazard layer was created by appending floodplain boundaries created in each county run.
Flood damage is directly related to the depth of flooding. For example, a two-foot deep flood generally results in about 20 percent damage to the structure (which translates to 20 percent of the structure’s re-placement value). HAZUS-MR4 takes into account flood depth when modeling damage (based on FEMA’s depth-damage functions). The HAZUS-MR4 reports capture damage by occupancy class (in terms of square footage impacted) by damage percent classes. Occupancy classes in HAZUS-MR4 include agri-culture, commercial, education, government, industrial, religion, and residential. Damage percent classes

Sect. 3 : 212
Mississippi Emergency Management Agency
are grouped by ten percent increments: 1-10 percent, 11-20 percent, etc., up to 50 percent. Buildings that sustain more than 50 percent damage are considered to be “substantially” damaged. For example, in Quit-man County, HAZUS-MR4 predicts 44 buildings will be substantially damaged in a base flood.
The HAZUS-MR4 methodology provides the number of buildings impacted, estimates of the building repair costs, and the associated loss of building contents and business inventory. Building damage can also cause additional losses to a community as a whole by restricting the building’s ability to function properly. Income loss data accounts for losses such as business interruption and rental income losses as well as the resources associated with damage repair and job and housing losses. These losses are calculated by HAZUS-MR4 using a methodology based on the building damage estimates.
Data Limitations
Default HAZUS-MR4 data was used to develop the loss estimates. Thus, the potential losses derived from HAZUS-MR4, the best available data, may contain some inaccuracies. One obvious limitation is that the building inventory is based on 2006 counts. Some additional risk modeling was done in a GIS environment using the state facility list and the boundaries generated by HAZUS-MR4. However, the state facility list contained an insufficient number of attributes to be fully integrated into HAZUS-MR4.
The damaged building counts generated by HAZUS-MR4 are susceptible to rounding errors and are likely the weakest output of the model due to the use of census blocks for analysis. The HAZUS-MR4 “Building Damage Count by General Building Type” report includes this disclaimer:
“Unlike the earthquake and hurricane models, the flood model performs its analysis at the census block level. This means that the analysis starts with a small number of buildings within each census block and applies a series of distributions necessary for analyzing the potential damage. The application of these distributions and the small number of buildings make the flood model more sensitive to rounding errors that introduces uncertainty into the building count results. Please use these results with suitable caution.”
The counts of buildings at risk collected from flood insurance policy data and biennial reports could poten-tially provide a more realistic estimate of the actual numbers of buildings in the base-flood hazard areas (see the Flood Insurance Claims Analysis that follows), but the information in the biennial reports could contain errors as well.
There could be errors and inadequacies associated with the hydrologic and hydraulic modeling of the HAZUS-MR4 model. In several counties, the HAZUS-MR4 model underestimated the hydrologic discharges for a 100-year event. In these cases, discharge values were edited to match discharges on streams from flood insurance studies (FIS), where the information was available. In most cases, this FIS data was only available for a limited number of stream reaches, thus the model may underestimate overall results for these counties. Where an FIS was not available, www.weather.gov stream gage records for the “flood of record” were used, or, in some cases, discharges were estimated from HAZUS-MR4 or flood insurance studies from a neighboring county if the stream crossed county boundaries.

Sect. 3 : 213
Mississippi Emergency Management Agency
HAZUS-MR4 may or may not account for levee protection, depending on whether the levees are detected on the 30m resolution digital elevation model (DEM). In some counties, notably Coahoma County, HAZUS-MR4 modeled the base flood on the Mississippi River as completely contained within levees. There may be levees in other counties that were not detected on the DEM, or where HAZUS-MR4 did not model the flood within the levee. This is more likely due to deficiencies in the DEM than representative of levee inadequa-cies. In those cases, HAZUS-MR4 is modeling damage from the worst-case scenario, which is essentially no levee protection.
HAZUS-MR4 can analyze additional impacts, including what type of infrastructure could be affected and how severely. Project files for each county are available for use by local governments and the state if more details on the impacts discussed here, or information about other impacts, such as vehicle losses, agricul-tural losses, utility system losses, essential facility impacts, and transportation impacts, are desired.
Vulnerable JurisdictionsThe intent of this analysis was to enable the state to estimate where flood losses could occur and the de-gree of severity, county-by-county, using a consistent methodology. The computer modeling helps quantify risk along known flood hazard corridors such as along the Mississippi and Pearl rivers. In addition, flood losses are estimated for certain lesser streams and rivers where the flood hazard may not have been previ-ously studied.
HAZUS-MR4 impact analyses were run for direct economic losses for buildings and societal impacts (dis-placed people and shelter needs) to see which counties ranked the highest on these risk indicators (these losses and impacts are illustrated in the maps and tables that follow). Using GIS, HAZUS-MR4 flood results were mapped to show flood loss potential and how it varies across the state. The primary indicators used to assess flood losses were:
• direct building losses combined with income losses,
• loss ratio of the direct building losses compared to overall building inventory, and
• population displaced by the flood and shelter needs.
The results display the potential base-flood losses to each county. The results show potential losses and loss ratios as highest along the Gulf Coast counties of Hancock, Harrison, and Jackson, and Desoto county where coastal and riverine flood hazards are extensive. Counties along the Pearl and Mississippi river cor-ridors are likely to experience significant flood losses. The loss ratio analyses indicate that counties along the Tallahatchie and Yazoo river corridors (Quitman, Panola, Tallahatchie, Leflore, and Humphreys) could experience significant damage and large numbers of displaced populations. It should be noted that there are levees in these counties that may not be represented in the HAZUS-MR4 model, and that the model may represent little or no levee protection (Figures 3.6.7 and 3.6.8 and Table 3.6.8.). Detailed results by county (all counties) can be referenced in Appendix 7.3.6-C.

Sect. 3 : 214
Mississippi Emergency Management Agency
Figure 3.6.7HAZUS-MH Countywide Summary
100-Year Flood Scenarios: Building and Income Loss

Sect. 3 : 215
Mississippi Emergency Management Agency
Figure 3.6.8HAZUS-MH Countywide Summary
100-Year Flood Scenarios: Loss Ratio

Sect. 3 : 216
Mississippi Emergency Management Agency
Table 3.6.8HAZUS-MH 100-Year Flood Loss Estimation
Results: Building Impacts by County, Ranked by Highest Total Building Losses(Top Ten Counties Depicted)
County Total Building Loss Total Income lossTotal Building and
Income LossHarrison $1,703,818,000 $11,921,000 $1,715,739,000Jackson $1,397,087,000 $9,504,000 $1,406,591,000Hancock $989,489,000 $5,247,000 $994,736,000Rankin $240,975,000 $2,180,000 $243,155,000Hinds $155,795,000 $2,589,000 $158,384,000Lee $133,120,000 $1,390,000 $134,510,000Lowndes $129,615,000 $649,000 $130,264,000Forrest $100,557,000 $399,000 $100,956,000Humphreys $69,759,000 $721,000 $70,480,000Jefferson $64,787,000 $247,000 $65,034,000
HAZUS-MH 100-Year Flood Loss EstimationResults: Building Impacts by County, Ranked by Highest Total Building Loss Ratio
(Top Ten Counties Depicted)
CountyBuilding
Loss RatioHancock 32.5%Leflore 18.3%Harrison 17.3%Jackson 17.3%Quitman 17.3%Humphreys 14.5%Forrest 12.1%Tunica 11.2%Panola 9.4%Jefferson 8.6%

Sect. 3 : 217
Mississippi Emergency Management Agency
The displaced population is based on the inundation area. Individuals and households will be displaced from their homes even when the home has suffered little or no damage either because they were evacu-ated (i.e., a warning was issued) or there was no physical access to the property because of flooded roadways. Displaced people using shelters will most likely be individuals with lower incomes and those who do not have family and friends within the immediate area. Age plays a secondary role in shelter use in that there are some individuals who will go to a public shelter even if they have the financial means to go elsewhere. These will usually be younger, less established families and elderly families (HAZUS-MR4 Users Manual). HAZUS-MR4 does not model flood casualties given that flood-related deaths and injuries typically do not have the same significant impact on the medical infrastructure as those associated with earthquakes. Table 3.6.9 and the map depicted in Figure 3.6.9 compare the potential impacts of floods on Mississippi citizens for the top ten impacted counties. Detailed results for all counties can be referenced in Appendix 7.3.6-C.
Table 3.6.9Flooding Impacts on Populations
(Ranked by Displaced People)
CountyNumber of
householdsNumber of people needing shelter
Jackson 15,078 39,264
Harrison 13,902 36,925
Hancock 7,991 18,009
Humphreys 1,666 4,459
Hinds 825 2,017
Lowndes 944 2,009
Quitman 857 1,831
Leflore 757 1,599
Rankin 708 1,462
Washington 588 1,288
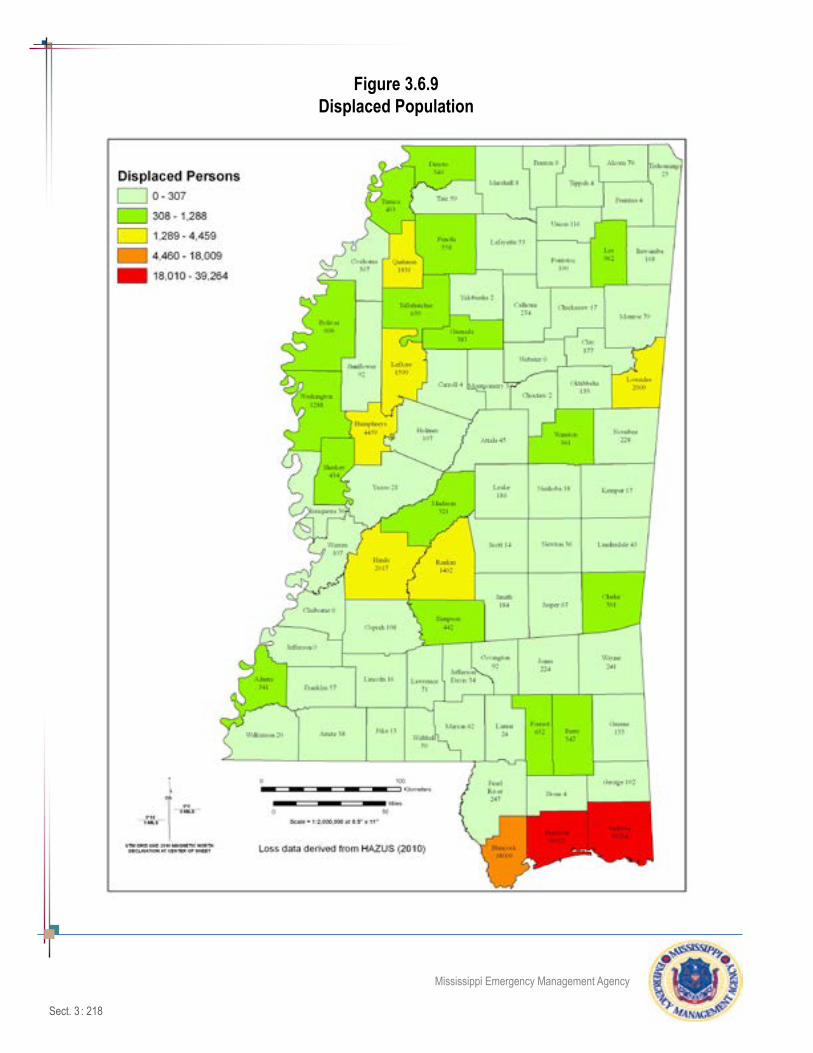
Sect. 3 : 218
Mississippi Emergency Management Agency
Figure 3.6.9Displaced Population

Sect. 3 : 219
Mississippi Emergency Management Agency
Local Critical Facility Floodplain Analysis
Critical facilities have been inventoried and geolocated where possible by region and are presented in Appendix 7.3.2-D. Information regarding the facility type and location were available, but valuations were not. The statewide HAZUS-MH-derived base-flood layer was overlaid, using GIS, on the geolocated critical facilities. The number and types of facilities located in a possible flood hazard area were summarized by county in Table 3.6.10. Note the number of facilities such as fire stations and emergency operations centers located in floodplains. A high number of wastewater facilities are in the floodplain as well, but this is not un-usual with these gravity-fed systems. These results are for general planning purposes only as there could be errors in the location of critical facilities as well as errors in HAZUS-MH modeled flood hazard boundar-ies noted previously.
Table 3.6.10Critical Facilities Potentially Within a Base-Flood Hazard Area
County
Number of Facilities at
Risk County
Number of Facilities at
Risk County
Number of Facilities at
RiskAdams 1 Humphreys 2 Panola 2Alcorn 1 Issaquena 5 Pearl River 2Amite 3 Itawamba 3 Perry 3Attala 1 Jackson 44 Pike 4Bolivar 1 Jasper 1 Pontotoc 1Calhoun 4 Jefferson Davis 2 Quitman 15Carroll 2 Jones 12 Rankin 5Choctaw 1 Kemper 1 Scott 1Claiborne 1 Lafayette 2 Simpson 5Clarke 4 Lauderdale 3 Smith 1Clay 1 Lawrence 3 Stone 1Coahoma 3 Leake 2 Sunflower 3Copiah 3 Lee 6 Tallahatchie 8Covington 7 Leflore 11 Tate 1Forrest 1 Lincoln 1 Tippah 3Franklin 2 Lowndes 7 Tishomingo 3Greene 4 Madison 5 Walthall 1Grenada 6 Marion 4 Warren 4Hancock 31 Marshall 1 Washington 7Harrison 49 Montgomery 2 Wayne 1Hinds 10 Newton 2 Yalobusha 1Holmes 2 Noxubee 3 Yazoo 1

Sect. 3 : 220
Mississippi Emergency Management Agency
Flood Insurance Claims AnalysisAs previously stated in the flood profile section, Mississippi is rich in water resources that contribute to flooding issues for residential, commercial and essential facilities. With more than 5.2 million acres of floodplain (of a total landmass of 30,989,376 acres), Mississippi has the 5th largest floodplain in the United States. It is anticipated that the floodplain area will increase in size and could potentially change the rank-ing for Mississippi.
Essential facilities at risk are also identified by county. These facilities include hospitals, fire and police sta-tions, emergency operation centers, and schools. Based on the 2010 HAZUS-MH flood losses, the Yazoo River and Big Black River Basins are most at risk. Based on the number of repetitive and severe repetitive properties, the Coastal River and Pascagoula River Basins are most at risk.
A summary of the number of structures and essential facilities at risk by river basin is provided in Table 3.6.11 followed by detailed county data provided by MEMA Region (with a cross reference of their associ-ated river basin).
Table 3.6.11Summary of At Risk Properties by River Basin
River BasinNo. Structures
at RiskNo. Essential
Facilities at Risk
North Independent 27 0
Tennessee River Basin 9 1
Yazoo River Basin 3,490 19
Tombigbee River Basin 1,196 5
Big Black River Basin 1,098 3
Pearl River Basin 1,563 11
South Independent River Basin 815 0
Pascagoula River Basin 16,828 55
Coastal River Basin 27,088 44
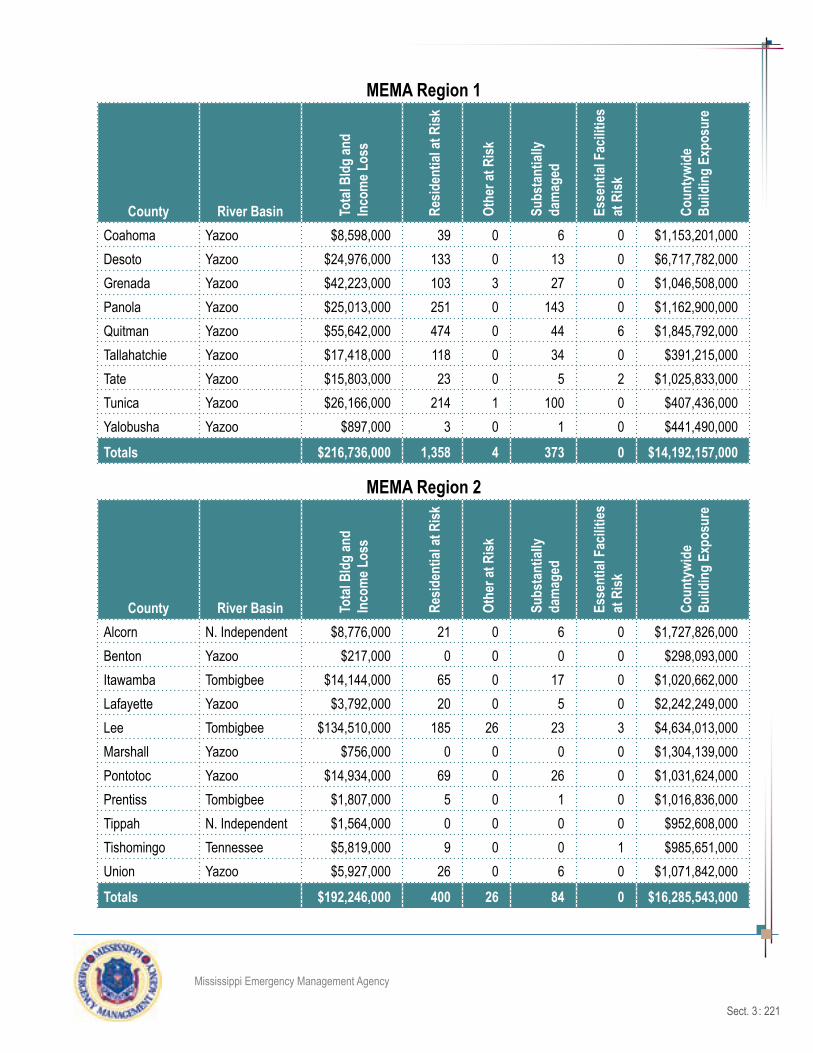
Sect. 3 : 221
Mississippi Emergency Management Agency
MEMA Region 1
County River Basin Tota
l Bld
g an
d In
com
e Los
s
Resid
entia
l at R
isk
Othe
r at R
isk
Subs
tant
ially
dam
aged
Esse
ntial
Fac
ilities
at
Risk
Coun
tywi
de
Build
ing
Expo
sure
Coahoma Yazoo $8,598,000 39 0 6 0 $1,153,201,000 Desoto Yazoo $24,976,000 133 0 13 0 $6,717,782,000 Grenada Yazoo $42,223,000 103 3 27 0 $1,046,508,000 Panola Yazoo $25,013,000 251 0 143 0 $1,162,900,000 Quitman Yazoo $55,642,000 474 0 44 6 $1,845,792,000 Tallahatchie Yazoo $17,418,000 118 0 34 0 $391,215,000 Tate Yazoo $15,803,000 23 0 5 2 $1,025,833,000 Tunica Yazoo $26,166,000 214 1 100 0 $407,436,000 Yalobusha Yazoo $897,000 3 0 1 0 $441,490,000
Totals $216,736,000 1,358 4 373 0 $14,192,157,000
MEMA Region 2
County River Basin Tota
l Bld
g an
d In
com
e Los
s
Resid
entia
l at R
isk
Othe
r at R
isk
Subs
tant
ially
dam
aged
Esse
ntial
Fac
ilities
at
Risk
Coun
tywi
de
Build
ing
Expo
sure
Alcorn N. Independent $8,776,000 21 0 6 0 $1,727,826,000 Benton Yazoo $217,000 0 0 0 0 $298,093,000 Itawamba Tombigbee $14,144,000 65 0 17 0 $1,020,662,000 Lafayette Yazoo $3,792,000 20 0 5 0 $2,242,249,000 Lee Tombigbee $134,510,000 185 26 23 3 $4,634,013,000 Marshall Yazoo $756,000 0 0 0 0 $1,304,139,000 Pontotoc Yazoo $14,934,000 69 0 26 0 $1,031,624,000 Prentiss Tombigbee $1,807,000 5 0 1 0 $1,016,836,000 Tippah N. Independent $1,564,000 0 0 0 0 $952,608,000 Tishomingo Tennessee $5,819,000 9 0 0 1 $985,651,000 Union Yazoo $5,927,000 26 0 6 0 $1,071,842,000
Totals $192,246,000 400 26 84 0 $16,285,543,000

Sect. 3 : 222
Mississippi Emergency Management Agency
MEMA Region 3
County River Basin Tota
l Bld
g an
d In
com
e Los
s
Resid
entia
l at R
isk
Othe
r at R
isk
Subs
tant
ially
dam
aged
Esse
ntial
Fac
ilities
at
Risk
Coun
tywi
de
Build
ing
Expo
sure
Attala Big Black $2,346,000 4 0 1 0 $759,560,000 Bolivar Yazoo $16,835,000 69 1 25 2 $1,511,484,000 Carroll Yazoo $7,410,000 33 0 11 1 $368,321,000 Holmes Yazoo $20,510,000 29 0 13 0 $599,672,000 Humphreys Yazoo $70,480,000 695 2 60 5 $377,678,000 Leflore Yazoo $55,320,000 309 2 75 1 $1,443,286,000 Montgomery Big Black $2,272,000 5 0 1 0 $480,710,000 Sunflower Yazoo $11,231,000 24 0 4 1 $1,051,934,000 Washington Yazoo $23,156,000 76 0 8 0 $2,653,193,000
Totals $209,560,000 1,244 5 198 0 $9,245,838,000
MEMA Region 4
County River Basin Tota
l Bld
g an
d In
com
e Los
s
Resid
entia
l at R
isk
Othe
r at R
isk
Subs
tant
ially
dam
aged
Esse
ntial
Fac
ilities
at
Risk
Coun
tywi
de
Build
ing
Expo
sure
Calhoun Yazoo $37,792,000 110 8 8 0 $643,212,000 Chickasaw Tombigbee $1,206,000 1 0 0 0 $715,110,000 Choctaw Big Black $524,000 0 0 0 0 $368,030,000 Clay Tombigbee $19,615,000 116 0 44 0 $826,627,000 Lowndes Tombigbee $130,264,000 424 15 72 0 $2,901,505,000 Monroe Tombigbee $27,498,000 70 0 17 2 $1,536,477,000 Noxubee Tombigbee $9,507,000 62 0 21 0 $426,427,000 Oktibbeha Tombigbee $2,408,000 11 0 6 0 $2,377,285,000 Webster Big Black $231,000 0 0 0 0 $394,295,000 Winston Pearl River $2,960,000 14 0 3 0 $765,268,000
Totals $232,005,000 808 23 171 0 $10,954,236,000

Sect. 3 : 223
Mississippi Emergency Management Agency
MEMA Region 5
County River Basin Tota
l Bld
g an
d In
com
e Los
s
Resid
entia
l at R
isk
Othe
r at R
isk
Subs
tant
ially
dam
aged
Esse
ntial
Fac
ilities
at
Risk
Coun
tywi
de
Build
ing
Expo
sure
Claiborne S. Independent $3,292,000 0 0 0 0 $399,165,000 Copiah S. Independent $7,283,000 35 0 12 0 $1,094,933,000 Hinds Big Black $158,384,000 470 15 63 2 $13,637,918,000 Issaquena Yazoo $2,943,000 16 0 8 0 $60,543,000 Madison Big Black $34,272,000 209 0 62 1 $4,573,633,000 Rankin Pearl River $243,155,000 817 25 257 3 $6,404,976,000 Sharkey Yazoo $12,487,000 40 0 10 0 $233,070,000 Simpson Pearl River $22,358,000 107 0 17 3 $1,062,050,000 Warren Big Black $30,085,000 178 0 90 0 $2,581,726,000 Yazoo Yazoo $6,927,000 14 0 3 1 $991,388,000
Totals $521,186,000 1,886 40 522 0 $31,039,402,000
MEMA Region 6
County River Basin Tota
l Bld
g an
d In
com
e Los
s
Resid
entia
l at R
isk
Othe
r at R
isk
Subs
tant
ially
dam
aged
Esse
ntial
Fac
ilities
at
Risk
Coun
tywi
de
Build
ing
Expo
sure
Clarke Pascagoula $21,941,000 160 0 47 0 $638,529,000 Jasper Pascagoula $18,303,000 14 0 4 0 $588,727,000 Kemper Tombigbee $3,574,000 11 0 4 0 $382,982,000 Lauderdale Pascagoula $26,917,000 12 4 4 0 $3,597,091,000 Leake Pearl River $16,036,000 65 0 7 1 $745,796,000 Neshoba Pearl River $18,064,000 26 0 6 2 $1,101,227,000 Newton Pascagoula $3,018,000 2 0 0 0 $895,799,000 Scott Pearl River $1,351,000 0 0 0 0 $918,483,000 Smith Pascagoula $12,952,000 34 0 10 1 $623,057,000
Totals $122,156,000 324 4 82 0 $9,491,691,000

Sect. 3 : 224
Mississippi Emergency Management Agency
MEMA Region 7
County River Basin Tota
l Bld
g an
d In
com
e Los
s
Resid
entia
l at R
isk
Othe
r at R
isk
Subs
tant
ially
dam
aged
Esse
ntial
Fac
ilities
at
Risk
Coun
tywi
de
Build
ing
Expo
sure
Adams S. Independent $54,619,000 359 0 146 0 $1,685,219,000 Amite S. Independent $14,095,000 7 0 3 0 $524,887,000 Franklin S. Independent $2,263,000 7 0 2 0 $341,323,000 Jefferson S. Independent $65,034,000 0 4 1 0 $384,256,000 Lawrence Pearl River $10,645,000 46 0 11 0 $547,487,000 Lincoln Pearl River $2,981,000 2 0 0 0 $1,403,882,000 Pike S. Independent $7,901,000 11 0 4 0 $1,684,025,000 Walthall Pearl River $9,462,000 28 0 8 0 $451,719,000 Wilkinson S. Independent $8,279,000 130 0 94 0 $353,656,000
Totals $175,279,000 178 4 269 0 $7,376,454,000
MEMA Region 8
County River Basin Tota
l Bld
g an
d In
com
e Los
s
Resid
entia
l at R
isk
Othe
r at R
isk
Subs
tant
ially
dam
aged
Esse
ntial
Fac
ilities
at
Risk
Coun
tywi
de
Build
ing
Expo
sure
Covington Pascagoula $14,809,000 43 0 10 0 $699,185,000 Forrest Pascagoula $100,956,000 248 6 83 3 $3,385,873,000 Greene Pascagoula $14,474,000 93 0 36 1 $413,804,000 Jefferson Davis Pearl River $3,797,000 15 0 2 0 $423,233,000 Jones Pascagoula $23,852,000 71 0 17 0 $2,581,386,000 Lamar Pascagoula $8,110,000 14 0 0 2 $1,759,044,000 Marion Pearl River $13,820,000 45 0 12 2 $862,506,000 Perry Pascagoula $40,775,000 141 0 61 4 $408,564,000 Wayne Pascagoula $12,925,000 102 0 54 2 $713,035,000
Totals $233,518,000 772 6 275 0 $11,246,630,000

Sect. 3 : 225
Mississippi Emergency Management Agency
MEMA Region 9
County River Basin Tota
l Bld
g an
d In
com
e Los
s
Resid
entia
l at R
isk
Othe
r at R
isk
Subs
tant
ially
dam
aged
Esse
ntial
Fac
ilities
at
Risk
Coun
tywi
de
Build
ing
Expo
sure
George Pascagoula $26,008,000 237 0 55 0 $801,401,000 Hancock Coastal $994,736,000 8830 26 3767 20 $2,334,706,000 Harrison Coastal $1,715,739,000 11821 74 2065 24 $11,029,985,000 Jackson Pascagoula $1,406,591,000 13477 46 1737 42 $7,085,173,000 Pearl River Coastal $46,939,000 344 0 81 0 $2,073,577,000 Stone Pascagoula $2,791,000 5 0 1 0 $529,183,000
Totals $4,192,804,000 34,714 146 7,706 0 $23,854,025,000
Local Plan Risk Assessment SummaryBelow is a summary of the risk classification identified in the individual local mitigation plans by MEMA Region.
MEMA Region Low Medium High MEMA Region Low Medium High1 - - 1 6 - - 102 1 5 7 7 1 1 93 1 6 5 8 1 6 24 1 6 3 9 2 4 125 - 10 21

Sect. 3 : 226
Mississippi Emergency Management Agency
Assessing Vulnerability of State Facilities / Estimating Potential Losses
Methodology
The state of Mississippi Department of Finance and Administration’s Bureau of Buildings, Grounds and Real Property provided the number and value of state-owned buildings located in floodplains. Plan develop-ers know of no building located in a floodplain that is operated, but not owned, by the state.
Specific data on building elevation, location and vulnerability to flooding of varying depths was not avail-able. Without such data it was not possible to accurately determine any degree of building damage and potential loss. Theoretically each building has a potential for total loss. The same data from the 2010 plan was used since the statewide inventory project is not completed. A percentage of loss, instead of total exposure, was applied to estimate potential losses. Damage is directly related to the depth of the flooding. Based on FEMA’s depth-damage curves used in their benefit-cost models it can be inferred that a two-foot flood equates to roughly 20 percent loss of the structure value. For purposes of this plan, the value of 20 percent of building value is the estimate of potential loss.
Data Limitations
HAZUS-MH does not distinguish between federal, state or local ownership or operation in its inventory data on bridges. Therefore all bridges regardless of ownership are included in the assessment. At this time the state of Mississippi does not have a comprehensive list of state-owned or operated infrastructure, including bridges, sorted by county and keyed to location in floodplains. Without such data, plan developers deter-mined that the HAZUS-MH default inventory data was the “best available data” even though all facilities are represented in the data not just state-owned or operated infrastructure.
Because of their potential vulnerability, bridges were chosen to represent infrastructure in the loss es-timates. Due to time constraints only bridges, not all state-owned infrastructure, were addressed using HAZUS-MH inventory data. Additionally, the estimate of potential losses to bridges was limited to the top ten of the fifty most vulnerable communities. Vulnerable highways were noted but not included in the loss estimates.
The state has developed an ongoing strategy to address these data limitations for future plan updates. That strategy is included in the mitigation strategy section of the plan.
Table 3.6.12 serves as a summary of the potential losses to state-owned structures within the state of Mis-sissippi. As new information regarding state-owned facilities was not available for the 2013 plan update, the follow information provided on Table 3.6.12 was not updated from the 2010 plan. Details by county are provided in Appendix 7.3.2-E.
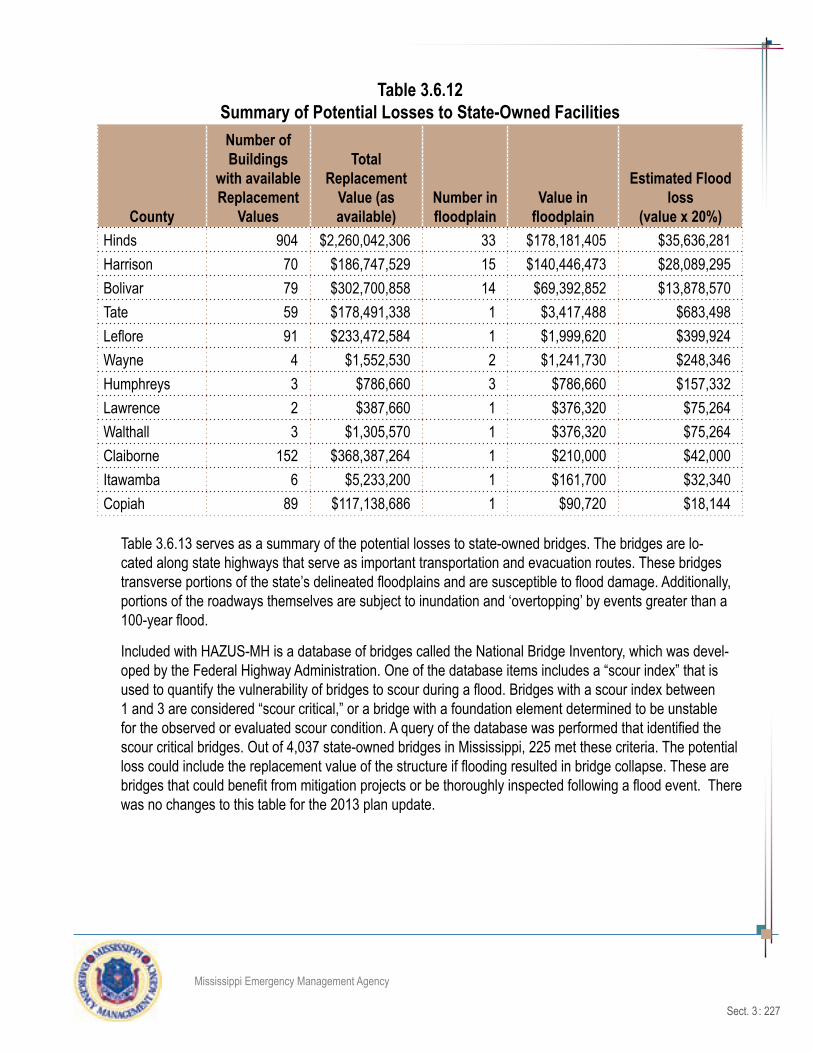
Sect. 3 : 227
Mississippi Emergency Management Agency
Table 3.6.12Summary of Potential Losses to State-Owned Facilities
County
Number of Buildings
with available Replacement
Values
Total Replacement
Value (as available)
Number in floodplain
Value in floodplain
Estimated Flood loss
(value x 20%)Hinds 904 $2,260,042,306 33 $178,181,405 $35,636,281Harrison 70 $186,747,529 15 $140,446,473 $28,089,295Bolivar 79 $302,700,858 14 $69,392,852 $13,878,570Tate 59 $178,491,338 1 $3,417,488 $683,498Leflore 91 $233,472,584 1 $1,999,620 $399,924Wayne 4 $1,552,530 2 $1,241,730 $248,346Humphreys 3 $786,660 3 $786,660 $157,332Lawrence 2 $387,660 1 $376,320 $75,264Walthall 3 $1,305,570 1 $376,320 $75,264Claiborne 152 $368,387,264 1 $210,000 $42,000Itawamba 6 $5,233,200 1 $161,700 $32,340Copiah 89 $117,138,686 1 $90,720 $18,144
Table 3.6.13 serves as a summary of the potential losses to state-owned bridges. The bridges are lo-cated along state highways that serve as important transportation and evacuation routes. These bridges transverse portions of the state’s delineated floodplains and are susceptible to flood damage. Additionally, portions of the roadways themselves are subject to inundation and ‘overtopping’ by events greater than a 100-year flood.
Included with HAZUS-MH is a database of bridges called the National Bridge Inventory, which was devel-oped by the Federal Highway Administration. One of the database items includes a “scour index” that is used to quantify the vulnerability of bridges to scour during a flood. Bridges with a scour index between 1 and 3 are considered “scour critical,” or a bridge with a foundation element determined to be unstable for the observed or evaluated scour condition. A query of the database was performed that identified the scour critical bridges. Out of 4,037 state-owned bridges in Mississippi, 225 met these criteria. The potential loss could include the replacement value of the structure if flooding resulted in bridge collapse. These are bridges that could benefit from mitigation projects or be thoroughly inspected following a flood event. There was no changes to this table for the 2013 plan update.

Sect. 3 : 228
Mississippi Emergency Management Agency
Table 3.6.13Exposure and Flood Vulnerability of State Bridges by County
(Values in thousands of dollars)
County Bridge Count Value Scour
Critical County Bridge Count Value Scour
CriticalAdams 16 $59,354.35 0 Issaquena 8 $12,409.80 0Alcorn 72 $99,883.86 0 Itawamba 74 $152,459.10 9Amite 41 $33,621.93 1 Jackson 56 $649,903.65 2Attala 46 $39,324.78 11 Jasper 42 $28,508.17 1Benton 54 $60,391.36 4 Jefferson 11 $6,913.09 0Bolivar 28 $22,534.88 2 Jeff. Davis 21 $20,112.19 2Calhoun 63 $45,618.08 4 Jones 91 $135,897.51 8Carroll 43 $43,183.27 7 Kemper 48 $61,903.86 0Chickasaw 51 $36,397.28 9 Lafayette 72 $64,338.53 1Choctaw 20 $14,146.20 2 Lamar 34 $38,973.09 2Claiborne 19 $55,342.46 1 Lauderdale 141 $208,051.89 1Clarke 70 $65,280.27 12 Lawrence 17 $22,141.20 2Clay 25 $54,115.41 3 Leake 54 $79,850.72 3Coahoma 28 $29,869.61 0 Lee 131 $204,006.54 23Copiah 49 $43,717.27 0 Leflore 32 $45,578.98 0Covington 40 $39,545.24 7 Lincoln 60 $61,895.46 1Desoto 72 $119,180.45 1 Lowndes 90 $191,660.50 6Forrest 56 $80,733.65 2 Madison 82 $101,987.37 4Franklin 35 $52,053.90 0 Marion 51 $67,208.34 2George 27 $55,277.87 2 Marshall 85 $117,323.02 4Greene 28 $101,453.50 1 Monroe 76 $188,235.90 1Grenada 48 $51,207.33 4 Montgomery 57 $53,470.84 1Hancock 26 $145,699.13 0 Neshoba 41 $34,011.07 1Harrison 82 $460,275.88 1 Newton 70 $64,145.34 3Hinds 185 $399,360.16 6 Noxubee 24 $39,135.99 3Holmes 79 $84,795.11 9 Oktibbeha 35 $34,457.36 2Humphreys 8 $23,971.50 0 Panola 75 $78,814.52 1Pearl River 70 $90,247.62 3 Tate 39 $53,338.10 2Perry 36 $64,396.78 3 Tippah 26 $25,323.31 2Pike 54 $58,800.65 3 Tishomingo 33 $78,274.19 3

Sect. 3 : 229
Mississippi Emergency Management Agency
Table 3.6.13Exposure and Flood Vulnerability of State Bridges by County
(Values in thousands of dollars)
County Bridge Count Value Scour
Critical County Bridge Count Value Scour
CriticalPontotoc 54 $42,949.87 6 Tunica 17 $11,849.09 0Prentiss 45 $49,366.41 3 Union 65 $73,748.68 3Quitman 29 $21,578.69 0 Walthall 27 $26,061.52 1Rankin 112 $212,858.86 3 Warren 61 $122,148.99 1Scott 42 $35,451.42 2 Washington 35 $35,864.93 1Sharkey 16 $14,459.88 0 Wayne 30 $42,152.86 2Simpson 38 $29,888.20 3 Webster 29 $31,583.84 1Smith 25 $26,402.18 4 Wilkinson 19 $65,158.54 0Stone 22 $31,987.16 2 Winston 40 $33,227.70 0Sunflower 23 $29,934.05 0 Yalobusha 67 $54,624.90 5Tallahatchie 29 $27,133.10 0 Yazoo 65 $111,103.38 0
Totals 4,037 $6,579,643.64 225
Twenty state-owned or -operated (maintained) highways important to movement of people and freight and are potentially at risk to flooding because all of them have segments that traverse floodplains. These highways are:
Interstate 55 U.S. Highway 98Interstate 10 U.S. Highway 84Interstate 20 State Highway 18Interstate 59 State Highway 80U.S. Highway 90 State Highway 1U.S. Highway 45 State Highway 302U.S. Highway 82 State Highway 25U.S. Highway 61 State Highway 49U.S. Highway 72 State Highway 63U.S. Highway 78 State Highway 11
Sect. 3 : 230
Mississippi Emergency Management Agency
3.7: Wildfire Risk Assessment
Hazard Description A wildfire is any fire that burns uncontrollably in a natural setting (such as, grasslands, forest, and brush land). Prescribed burnings are the only exception to a wildfire. Wildfires can be either man-made or natural. In Mississippi, most fires are man-made, with arson being the most prevalent cause, followed by burning of debris. The typical cause of natural wildfires is lightning.
Prescribed burning, also known as controlled burning, is the deliberate use of fire under specified and con-trolled conditions. Prescribed burns are used by forest management professionals and individual landown-ers to accomplish one or more of the following tasks:
• Fuel reduction: The reduction of accumulated grass, weeds, pine needles, and hardwood leaves that threaten wildfires in young stands and hinder regeneration of older stands.
• Hardwood control: Prevents hardwood trees from competing with pines for nutrients and mois-ture, impeding visibility and access through the stands and interfering with natural regeneration in land areas is better suited for growing pines.
• Site preparation: Reduces the number of small diameter hardwood and exposes mineral soil before harvest cutting.
• Wildlife habitat improvement: Prescribed burns in young stands encourage fresh, low vegetation for wildlife, remove heavy brush, and encourage growth of annual plants.
• Disease control: Burns done to reduce fuel before thinning trees may help control disease.
• Harvest cutting area improvement: Reducing brush growing low to the ground prior to harvesting trees increases visibility and expedites the marking and cutting of the selected trees. This form of prescribed burning can lower costs for the landowner and the logging professional.
Wildfires are very common in many places around the world. Fires are particularly prevalent in summer, au-tumn and during droughts when fallen branches, leaves, grasses and scrub can dry out and become highly flammable. Some experts believe global warming is increasing the intensity and frequency of droughts in many areas, thus creating more intense and frequent wildfires.
Wildfires tend to be most common and severe during years of drought and occur on days of strong winds. With extensive urbanization of wildlands, these fires often involve destruction of suburban homes located in the wildland urban interface, a zone of transition between developed areas and undeveloped wildland.
On occasion, wildfires cause large scale damage to private or public property, destroying many homes and causing deaths, particularly when they reach urban fringe communities. Wildfires are extremely dangerous, and often deliberately lit.
It is important to note what constitutes an urban fire and how that impacts mitigation planning for local ju-risdictions. Urban fires may be created by electrically-related structural and vehicle fires, incendiary arson, unattended cooking fires, smoking materials, heating devices, fuel systems, sparks, hazardous material spills, and spontaneous combustion.

Sect. 3 : 231
Mississippi Emergency Management Agency
The adjective class rating presented in Table 3.7.1 is a method of normalizing rating classes across dif-ferent fuel models, indexes, and station locations. It is based on the primary fuel model cataloged for the station, the fire danger index selected to reflect staffing levels, and climatological class breakpoints. This information is provided by local station managers. About 90% use the Burning Index (BI); others use Energy Release Component (ERC). Staffing class breakpoints are set by local managers from historical fire weather climatology.
Table 3.7.1Adjective Class Rating
Fire Danger Rating and Color
CodeDescription
Low (L) Dark Green
Fuels do not ignite readily from small firebrands although a more intense heat source, such as lightning, may start fires in duff or punky wood. Fires in open cured grasslands may burn freely a few hours after rain, but woods fires spread slowly by creeping or smoldering, and burn in irregular fingers. There is little danger of spotting.
Moderate (M)
Light Green or
Blue
Fires can start from most accidental causes, but with the exception of lightning fires in some areas, the number of starts is generally low. Fires in open cured grasslands will burn briskly and spread rapidly on windy days. Timber fires spread slowly to moderately fast. The average fire is of moderate intensity, although heavy concentrations of fuel, especially draped fuel, may burn hot. Short-distance spotting may occur, but is not persistent. Fires are not likely to become serious and control is relatively easy.
High (H) Yellow All fine dead fuels ignite readily and fires start easily from most causes. Unattended brush and campfires are likely to escape. Fires spread rapidly and short-distance spot-ting is common. High-intensity burning may develop on slopes or in concentrations of fine fuels. Fires may become serious and their control difficult unless they are attacked successfully while small.
Very High (VH)
Orange Fires start easily from all causes and, immediately after ignition, spread rapidly and increase quickly in intensity. Spot fires are a constant danger. Fires burning in light fuels may quickly develop high intensity characteristics, such as long-distance spotting and fire whirlwinds when they burn into heavier fuels.
Extreme (E)
Red Fires start quickly, spread furiously, and burn intensely. All fires are potentially serious. Devel-opment into high intensity burning will usually be faster and occur from smaller fires than in the very high fire danger class. Direct attack is rarely possible and may be dangerous except immediately after ignition. Fires that develop headway in heavy slash or in conifer stands may be unmanageable while the extreme burning condition lasts. Under these conditions the only effective and safe control action is on the flanks until the weather changes or the fuel supply lessens.
(Source USFS WFAS)

Sect. 3 : 232
Mississippi Emergency Management Agency
Fire managers in the south also use the Keetch-Byram Drought Index (KBDI) a mathematical system for relating current and recent weather conditions to potential/expected fire behavior. This system, originally developed for the southeastern United States, is based primarily on recent rainfall patterns and was specifi-cally developed to equate the effects of drought with potential fire activities.
A full discussion on the KBDI is provided in Section 3.8 – Drought.
Figure 3.7.1 provides data on observed fire dangers as reported through various weather stations. For the time period reflected, a majority of Mississippi is in a low danger class while the southern counties experi-ence a moderate danger class.
Figure 3.7.1 Keetch-Byram Observed Fire Danger Class

Sect. 3 : 233
Mississippi Emergency Management Agency
Hazard Profile
Wildland/Urban Interface
According to the MFC 2012 Annual Report, Mississippi averages 3,200 wildfires a year burning more than 55,000 acres. As the population in rural areas increases, so do the issues facing Wildland/Urban Interface (WUI). Wildland/Urban Interface is the development of residential and commercial areas adjacent to or commingled with vegetative areas. More than half of the homes in Mississippi are considered to be part of a WUI. As further development in forested areas occurs this number increases. Wildfires in urban areas threaten human life, structures and wildland resources. As shown in Figure 3.7.2, WUI is broken into two categories; intermix and interface. Intermix defines housing and commercial development mixed in with wildland vegetation. Interface describes housing and commercial development in proximity to wildland vegetation. Figure 3.7.3 represents housing density in Mississippi.
Figure 3.7.2Wildland Urban Interface

Sect. 3 : 234
Mississippi Emergency Management Agency
Figure 3.7.3Housing Density

Sect. 3 : 235
Mississippi Emergency Management Agency
Education and Outreach
Forest Information
The Mississippi Forestry Commission Forest Information Department provides support to all MFC programs through the development of displays, exhibits, brochures and other informational material. The department is the point of contact for media relations and is responsible for maintaining the MFC Web site (www.mfc.ms.gov), producing the agency’s newsletter, annual report, and MFC News. The Forest Information Depart-ment utilizes social media to help carry the MFC message. Accounts were developed on Facebook and YouTube at no cost to the agency. Other social media outlets are being considered and will be activated if MFC determines they can further assist the Commission in reaching the people of Mississippi.
The Web site, www.mfc.ms.gov, is accessible to the public and employees. During periods of high fire danger, the Web site is used to provide public service information, including daily fire reports and news releases.
The Commission provides the following weather and fire information on the Web site:
• Fire Danger Rating (USDA Forest Service Wildland Fire Assessment System)
• Current Weather Forecast
• Fire Danger Rating and Color Code
• Keetch-Byram Drought Index
• MFC Daily Fire Situation Report
• Southern Area Coordination Center (SACC)
• National Weather Service Enhanced Radar
• Image Loop for the United States
• NWS Enhanced Radar Image Loop for Lower Mississippi Valley Sector
• NWS Fire Weather Report
Public Outreach
The Public Outreach/Conservation Education Department maintains an active outreach program designed to educate youths and adults about forestry and related issues, in addition to the agency’s mission and services. Local outreach activities such as civic club presentations, forestry field days and visits to school groups are conducted across the state to reach individuals at the community level. In FY12, outreach activi-ties reached more than 24,000 youths and 86,000 adults. These numbers do not include interaction with people at the Mississippi State Fair, Mississippi Wildlife Extravaganza, or Mississippi Garden and Patio Show. Two outreach programs are housed within the Public Outreach Department: the Firewise Program and the Underserved Landowner Outreach Program. Consult www.mfc.ms.gov/public-outreach for informa-tion on other MFC outreach efforts.

Sect. 3 : 236
Mississippi Emergency Management Agency
Firewise
Firewise is an educational program for homeowners and community leaders. This program is for anyone liv-ing in, or connected to, the wildland/urban interface. Information is available to design, construct, landscape and maintain a home or community to withstand a wildfire without the aid of firefighting resources on the scene. Firewise literature can be found on the MFC website at www.mfc.ms.gov/firewise.
Firewise Workshops are also conducted throughout the state. These one day workshops are free of charge and bring together citizens, business, and community leaders, getting them involved in planning, financing, building, sustaining, and protecting communities in the wildland/urban interface. Participants learn about the reason homes burn, various wildland fuel reduction techniques, and assessing the fire danger of their own home. The dates for Firewise Workshops can be found on the MFC website as well. For more informa-tion on the Firewise program, contact Leslie Blackwell at 601-540-3358.
There are six communities in Mississippi officially designated as Firewise Communities/USA Communities. They are:
• Snow Lake Shores (Benton County)• Lake Hillsdale Property Owner’s
Association (Pearl River County)
• Gloster (Amite County)• Summit (Pike County)
• Noxapater (Winston County)• Ethel (Attala County)
Underserved Landowner Program
The Underserved Landowner Outreach Program is a joint project between the MFC, Alcorn State University and the USDA Forest Service. The program offers assistance to underserved landowners in Mississippi and has three primary goals:
• To provide outreach support and technical assistance to underserved landowners
• To encourage young people to seek careers in forestry
• To work with Alcorn State University to develop and/or enhance projects of mutual forestry interest
Mississippi Forest Facts
Mississippi Forestry Association, Mississippi Institute for Forest Inventory, and Mississippi State University compiled the following information to help Mississippians gain an understanding of the hazards wildfires pose to lives, homes, other structures, the forestry industry, and the state’s economy.

Sect. 3 : 237
Mississippi Emergency Management Agency

Sect. 3 : 238
Mississippi Emergency Management Agency
Location
The state of Mississippi is divided into seven Mississippi Forestry Commission districts, shown in Figure 3.7.4. The commission tracks wildfires by district (Table 3.8.2) and by cause (Table 3.8.3). Averaging over 700 fires annually during the last three years, the Southeast District maintains the highest history of wild-fires in the state. The areas with minimal amounts of previous wildfire events are along the Mississippi River. With the exception of one district in the northeast section of the state, Mississippi’s three southern-most districts continue to experience the highest average number of wildfires. This trend is most apparent following major Gulf Coast storms, when forest floor litter is greatest.
Figure 3.7.4

Sect. 3 : 239
Mississippi Emergency Management Agency
Table 3.7.2Wildfire Incident Summary by District
District 2012 2011 2010 2009 2008 2007
Southeast 413 1,220 507 700 587 711
Northeast 378 480 270 262 130 718
Southwest 356 792 334 368 457 501
S. Central 205 560 167 234 289 477
E. Central 231 452 188 166 188 448
Capital 134 327 98 106 167 192
Northwest 147 311 108 121 107 216
Total 1,864 4,142 1,672 1,957 1,925 3,263
With 100 state parks, national parks and forests, and wildlife management areas and refuges in 63 coun-ties, a correlation between the locations of reserved lands to the location of previous wildfires was attempt-ed in the Southern Wildfire Risk Assessment, described in detail in this section. Though some of the coun-ties with the most previous wildfires in the state do have reserved land for parks and forests, the same can be said for some of the counties with few prior wildfire events. The conclusion is Mississippi’s prescribed burn techniques are producing forests with not only healthy ecosystems, but areas that do not encourage wildfires through ground litter but prevent them through natural buffers and clean forest floors.
Past Occurrences
Typically Mississippi’s wildfires are started by man-made causes, such as arson, campfires, and equipment. Causing an average of 1,078 fires each year in Mississippi (2005 - 2012), arson is the state’s biggest fire threat. The second most likely cause of wildfires in Mississippi is the burning of debris. Averaging about 960 fires a year, debris-burning fires increased dramatically to 2,144 fires in 2006. Acreage lost to wildfires statewide increased fourfold from 2005 to 2006. This increase in acreage burned can be attributed to the increased amount of fuel on the forest floors due to fallen timber from Hurricane Katrina. With the increase in fuel on the ground, fires become uncontrollable and difficult to contain.
Other man-made causes of wildfires in Mississippi include railroads, children, smoking, and other miscel-laneous causes. Individually these elements do not pose a serious threat to Mississippi’s natural resources, but combined they account for approximately 347 fires annually, about 14% of all fires.
As shown in Table 3.7.3, lightning strikes typically make up a small percentage of wildfires in Mississippi. Contributing to an average of 25 wildfires ignited annually, lightning-ignited wildfires are not considered a serious hazard to the state.

Sect. 3 : 240
Mississippi Emergency Management Agency
Table 3.7.3Mississippi Wildfires by Cause 2005 – 2012
Cause of Fire
2012 2011 2010 2009No. of Fires
No. Acres Burned
No. of Fires
No. Acres Burned
No. of Fires
No. Acres Burned
No. of Fires
No. Acres Burned
Incendiary/Arson 758 11,452 1,706 29,240 728 11,005 906 14,444
Debris Burning 773 5,735 1,713 15,230 731 6,612 769 7,748
Lightning 21 275 47 641 10 147 12 202
Campfire 3 31 9 155 1 3 4 11
Smoking 22 110 37 279 14 34 9 57
Equipment 51 297 115 949 31 254 18 109
Railroads 9 141 8 66 2 3 5 44
Children 12 64 20 241 9 125 9 141
Miscellaneous 154 1,366 249 2,710 108 503 164 2,254
Re-ignition 62 585 238 5,279 38 427 61 743
Totals 1,865 20,056 4,142 54,790 1,672 19,113 1,957 25,753
Cause of Fire
2008 2007 2006 2005No. of Fires
No. Acres Burned
No. of Fires
No. Acres Burned
No. of Fires
No. Acres Burned
No. of Fires
No. Acres Burned
Incendiary/Arson 814 16,312 1,452 30,840 2,651 78,804 1,768 30,306
Debris Burning 824 9,470 1,344 17,028 2,144 33,916 1,299 12,145
Lightning 18 407 28 354 56 1,148 8 50
Campfire 5 26 6 46 7 34 4 19
Smoking 10 91 19 212 31 311 14 211
Equipment 44 208 59 723 100 1,241 73 919
Railroads 11 564 20 506 28 327 5 29
Children 11 133 12 821 28 818 18 71
Miscellaneous 128 763 186 1,789 268 5,671 0 0
Re-ignition 60 462 137 1,750 0 0 0 0
Other 0 0 0 0 462 8,402 291 3,074
Totals 1,925 28,436 3,263 54,069 5,747 130,672 3,480 46,824

Sect. 3 : 241
Mississippi Emergency Management Agency
Potential Damages from Wildfires
Agriculture is Mississippi’s number one industry, employing about one-third of the state’s workforce either directly or indirectly. With approximately 42,000 farms in the state covering 11 million acres, wildfires in Mississippi not only threaten human life, but economic viability as well. Table 3.7.4 presents Mississippi’s top ten agricultural crops ranked and listed with their respective revenue for 2012. All of these crops have a significant impact on the state’s economy. As shown by the map in Figure 3.7.5, agriculture makes a signifi-cant impact in all of Mississippi’s 82 counties.
Table 3.7.4Mississippi’s Top Ten Agricultural Crops
Rank Agricultural Crop 2012 Revenue Rank Agricultural Crop 2012 Revenue
1 Poultry/Eggs $2.53 billion 6 Cattle & Calves $329 million2 Soybeans $1.16 billion 7 Catfish $165 million3 Forestry $1.03 billion 8 Hay $145 million4 Corn $891 million 9 Wheat $134 million5 Cotton $397 million 10 Rice $124 million
Source: Mississippi State University, Division of Agriculture, Forestry and Veterinary Medicine
Figure 3.7.52012 Cropland Data Layer
2012 Mississippi
0 19.32 38.65 57.97
miles
Land Cover Categories
(by decreasing acreage)
AGRICULTURE*
Pasture/Hay
Soybeans
Corn
Cotton
Other Hay/Non Alfalfa
Fallow/Idle Cropland
Grassland Herbaceous
Dbl Crop WinWht/Soybeans
Rice
Winter Wheat
Sorghum
Peanuts
Aquaculture
Pecans
Sweet Potatoes
Sod/Grass Seed
NON-AGRICULTURE**
Evergreen Forest
Deciduous Forest
Woody Wetlands
Shrubland
Mixed Forest
Developed/Open Space
Produced by CropScape - http://nassgeodata.gmu.edu/CropScape * Only top 16 agriculture categroies are listed. ** Only top 6 non-agriculture categroies are listed.

Sect. 3 : 242
Mississippi Emergency Management Agency
In 2010, the Forest Industry Sector provided over 36,000 jobs and paid $1.6 billion in wages to Mississippi workers, which reflects a decrease from the 2006 report (see Table 3.7.5).
Table 3.7.5Mississippi Forest Industry’s
Direct Impact on Jobs and Wages - 2010 and 2006
Forest Industry Sector
2010 2006
Wages Paid (in Millions) Jobs Wages Paid
(in Millions) Jobs
Miscellaneous Forest Products $32.91 449 $19.39 526
Logging $244.35 5,734 $133.44 6,427
Solid Wood Products $391.06 8,443 $594.91 14,679
Wood Furniture $654.90 17,882 $959.26 24,605
Pulp and Paper $309.24 3,623 $380.82 5,044
Totals $1,632.46 36,130 $2,087.82 51,281Source: Forest and Wildlife Research Center, Mississippi State University
Probability of Future Events
Debris accumulation from Hurricane Katrina in 2005 caused a 300% increase in wildfires in 2006 and a 200% increase in 2007. Storm debris will continue to pose some threat toward future wildfires. Since Katrina, communities have worked with local emergency management agencies to remove debris and dead standing trees and numbers of wildfires are nearing the normal average. However, more and more people are moving to inland areas from the southern coast of Mississippi due to the threat of hurricanes. As this happens, more housing and other structures are built within wildland intermix and wildland interface areas, increasing the risk of wildfire to life and property. (See Figure 3.7.2)
Fire is a natural part of a healthy ecosystem and future wildfires are inevitable. Mississippi may be able to de-crease future wildfire events through continued educa-tion and outreach. Making well-informed decisions when recreating outdoors can reduce wildfire occurrences in the state. Increasing manpower to fight and deter arson can also lower Mississippi’s threat of future wildfires.
Madison County 2010 (WLBT)

Sect. 3 : 243
Mississippi Emergency Management Agency
Assessing Vulnerability An assessment of Mississippi’s vulnerability to wildfires is dependent on the proximity of development to natural wildland areas. The most common means of assessing wildfire threat is to quantify the amount of development (residential and non-residential structures) in proximity to or built within wildland areas. The best available information for assessing wildfire threat to Mississippi is contained in the Southern Wildfire Risk Assessment (SWRA). Using that data, the state of Mississippi used funding received after Hurricane Katrina to prepare County Wildfire Protection Plans (CWPPs) for the 15 lower counties in Mississippi. Following that initial effort, the state prepared CWPPs for 19 high-occurrence counties, making a total of 34 counties with prevention plans (Table 3.7.6). The Mississippi Forestry Commission has a copy of these completed plans. The CWPPs will also be incorporated into the update of local hazard mitigation plans as they are developed. These CWPPs contain valuable initiatives for improved safety and economic security. Counties are encouraged to move toward their implementation. (See Figure 3.7.6).
Table 3.7.6County Wildfire Protection Plans
County Plan Date County Plan Date
Amite September 2008 Lawrence September 2009Attala September 2008 Leake July 2008Benton September 2009 Lincoln September 2008Carroll September 2008 Marshall September 2008Clarke September 2009 Panola September 2008Copiah September 2009 Pearl River December 2007Covington October 2008 Perry October 2008Forrest October 2008 Pike September 2009George December 2007 Simpson September 2009Greene October 2008 Smith September 2009Hancock October 2008 Stone December 2007Harrison December 2007 Tippah September 2008Jackson December 2007 Tishomingo September 2008Jasper July 2008 Walthall September 2008Jefferson Davis and Marion October 2008 Wayne October 2008Lamar October 2008 Winston September 2008Lauderdale August 2008Source: Mississippi Forestry Commission

Sect. 3 : 244
Mississippi Emergency Management Agency
Figure 3.7.6Forestry Commission 2012
The development of Mississippi’s Statewide Forest Resource Assessment and Forest Resource Strategy Plan was completed and approved by the U.S. Forest Service in 2010. This plan is a comprehensive analy-sis of forest-related conditions, trends, threats, and opportunities; as well as strategies to address them. Wildfire fuel reduction strategies in the plan include:
• Identify at-risk communities and high fire-occurrence areas• Increase the Number of Certified Prescribed Burn Managers (CPBMs)• Increase the number of prescribed-burn acres annually in high-risk areas identified in the 34 WPPs
(Fig. 3.7.7)• Use current land owner burn assistance programs to reduce fuel loading from invasive species
plants• Continue to provide funding to insure plans are completed in remaining counties• Provide equipment to volunteer fire departments for use in controlling non-forest fires inside and
outside of the WUI• Identify locations of MFC tractor/plow units and volunteer fire departments

Sect. 3 : 245
Mississippi Emergency Management Agency
Figure 3.7.7
Local Plan Risk Assessment SummaryBelow is a summary of the risk classification identified in the individual local mitigation plans by MEMA Region.
MEMA Region Low Medium High MEMA Region Low Medium High1 - - 1 6 - 1 92 2 11 - 7 1 10 -3 4 3 2 8 2 6 -4 2 3 3 9 6 5 15 22 3 5
Exposure Analysis of Critical Facilities
The state of Mississippi developed a definition for “critical facilities and infrastructure” as discussed in Section 3.0. Location data for these facilities was collected from various state agencies for the purpose of determining which facilities are at risk to various hazards. The critical facility categories deemed most perti-nent to wildfire risk are: Emergency Operations Centers, Fire Stations, Police Stations, Medical and Power Facilities and Red Cross shelters and facilities. Refer to the regional maps in Appendix 7.3.2–D.

Sect. 3 : 246
Mississippi Emergency Management Agency
3.8: Drought Risk Assessment
Hazard DescriptionBased on the local plan roll-up of identified and ranked hazards, limited options for state level mitigation, and lack of historical need for state-level response, it was concluded that drought does not pose a serious statewide threat capable of being addressed by this plan. Droughts can and do, however, occur in Missis-sippi.
According to the National Oceanic and Atmospheric Administration (NOAA), a drought is defined as a pe-riod of unusually dry weather persisting long enough to cause serious problems, such as crop damage and/or water supply shortages. The severity of the drought depends upon the degree of moisture deficiency and the duration of the drought.
Drought occurs under differing conditions, based on these reference points:
Meteorological drought is defined by a period of substantially diminished precipitation duration and/or intensity. The commonly used definition of meteorological drought is an interval of time, generally on the order of months or years, during which the actual moisture supply at a given place consistently falls below the average moisture supply.
Agricultural drought occurs when there is inadequate soil moisture to meet the needs of a particular crop during a given time. Agricultural drought usually occurs after or during meteorological drought, but before hydrological drought and can affect livestock and other dry-land agricultural operations.
Hydrological drought refers to deficiencies in surface and subsurface water supplies from lack of precipitation. It is measured as stream flow, snow pack, and as lake, reservoir, and groundwater levels. There is usually a delay between lack of rain or snow and less measurable water in streams, lakes, and reservoirs. Therefore hydrological measurements tend to lag behind other drought indicators.
Socio-economic drought occurs when physical water shortages start to affect the health, well-being, and quality of life of people, or when drought starts to affect the supply and demand of an economic product.
A drought’s severity depends on numerous factors, including duration, intensity, and geographic extent, as well as regional water demands by humans, livestock, crops, and vegetation. The severity of drought can be aggravated by other climatic factors, such as prolonged high winds and low relative humidity. Due to its multi-dimensional nature, drought is difficult to define in exact terms and also poses difficulties in terms of comprehensive risk assessments.
In 1965, Wayne Palmer developed an index to “measure the departure of the moisture supply.” This index was based on the supply-and-demand concept of the water balance equation, taking into account more than merely the precipitation deficit at specific locations. The objective of the Palmer Drought Severity Index (PDSI) was to provide a measurement of “standardized” moisture conditions so comparisons using the in-dex could be made between locations and between time periods. While Palmer’s indices are water balance indices that consider water supply (precipitation), demand (evapotranspiration) and loss (runoff), another

Sect. 3 : 247
Mississippi Emergency Management Agency
commonly used drought index, the Standardized Precipitation Index (SPI), is a probability index considering only precipitation. Therefore, for the purposes of this plan, drought will be analyzed using the PDSI.
The PDSI varies between -4.0 and +4.0. Weekly Palmer Index values are calculated for the Climate Divi-sions during every growing season and are available from the Climate Prediction Center. Mississippi could expect to experience the entire range of drought severity and classification. Table 3.8.1 lists the Palmer Drought Severity Index.
Table 3.8.1 Palmer Drought Severity Index
Index Value Classification Index Value Classification4.00 or more Extremely wet -0.50 to -0.99 Incipient dry spell3.00 to 3.99 Very wet -1.00 to -1.99 Mild drought2.00 to 2.99 Moderately wet -2.00 to -2.99 Moderate drought1.00 to 1.99 Slightly wet -3.00 to -3.99 Severe drought0.50 to 0.99 Incipient wet spell -4.00 or less Extreme drought0.49 to -0.49 Near normal
Source: http://drought.unl.edu/whatis/indices.htm
Another means of analyzing drought is the Keetch-Byram Drought Index (KBDI), a mathematical system for relating current and recent weather conditions to potential or expected fire behavior. This system, originally developed for the southeastern United States, is based primarily on recent rainfall patterns.
The KBDI drought index system is the most widely used by fire managers in the south. It is also one of the only drought index systems specifically developed to equate the effects of drought with potential fire activi-ties.
The result of this system is a drought index number ranging from 0 to 800 accurately describing the amount of moisture missing. A rating of zero defines the point of no moisture deficiency and 800 is the maximum drought possible.
These numbers correlate with potential fire behavior as follows:
• 0 - 200: Soil moisture and large class fuel moistures are high and do not contribute much to fire intensity. Typical of spring dormant season following winter precipitation.
• 200 - 400: Typical of late spring, early growing season. Lower litter and duff layers are drying and beginning to contribute to fire intensity.
• 400 - 600: Typical of late summer, early fall. Lower litter and duff layers actively contribute to fire intensity and will burn actively.
• 600 - 800: Often associated with more severe drought with increased wildfire occurrence. Intense, deep burning fires with significant downwind spotting can be expected. Live fuels can also be expected to burn actively at these levels.

Sect. 3 : 248
Mississippi Emergency Management Agency
Figures 3.8.1 provides another illustration of drought potential by using the Keetch-Bryam index for a similar time period as the U.S. Drought Monitor. These figures indicate fire intensity significantly increased due to lower litter and duff layers drying out.
Figure 3.8.1Keetch-Byram Drought Index Data for the United States
June 20, 2013(Source: USDA)
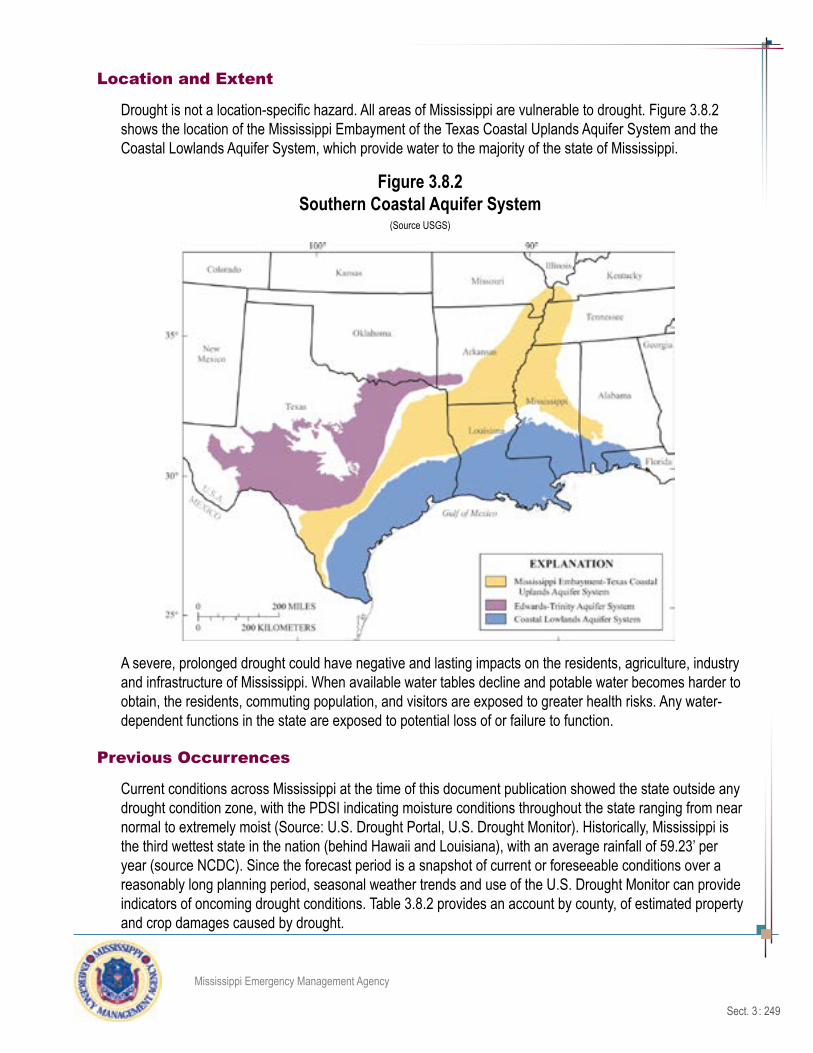
Sect. 3 : 249
Mississippi Emergency Management Agency
Location and Extent
Drought is not a location-specific hazard. All areas of Mississippi are vulnerable to drought. Figure 3.8.2 shows the location of the Mississippi Embayment of the Texas Coastal Uplands Aquifer System and the Coastal Lowlands Aquifer System, which provide water to the majority of the state of Mississippi.
Figure 3.8.2Southern Coastal Aquifer System
(Source USGS)
A severe, prolonged drought could have negative and lasting impacts on the residents, agriculture, industry and infrastructure of Mississippi. When available water tables decline and potable water becomes harder to obtain, the residents, commuting population, and visitors are exposed to greater health risks. Any water-dependent functions in the state are exposed to potential loss of or failure to function.
Previous Occurrences
Current conditions across Mississippi at the time of this document publication showed the state outside any drought condition zone, with the PDSI indicating moisture conditions throughout the state ranging from near normal to extremely moist (Source: U.S. Drought Portal, U.S. Drought Monitor). Historically, Mississippi is the third wettest state in the nation (behind Hawaii and Louisiana), with an average rainfall of 59.23’ per year (source NCDC). Since the forecast period is a snapshot of current or foreseeable conditions over a reasonably long planning period, seasonal weather trends and use of the U.S. Drought Monitor can provide indicators of oncoming drought conditions. Table 3.8.2 provides an account by county, of estimated property and crop damages caused by drought.
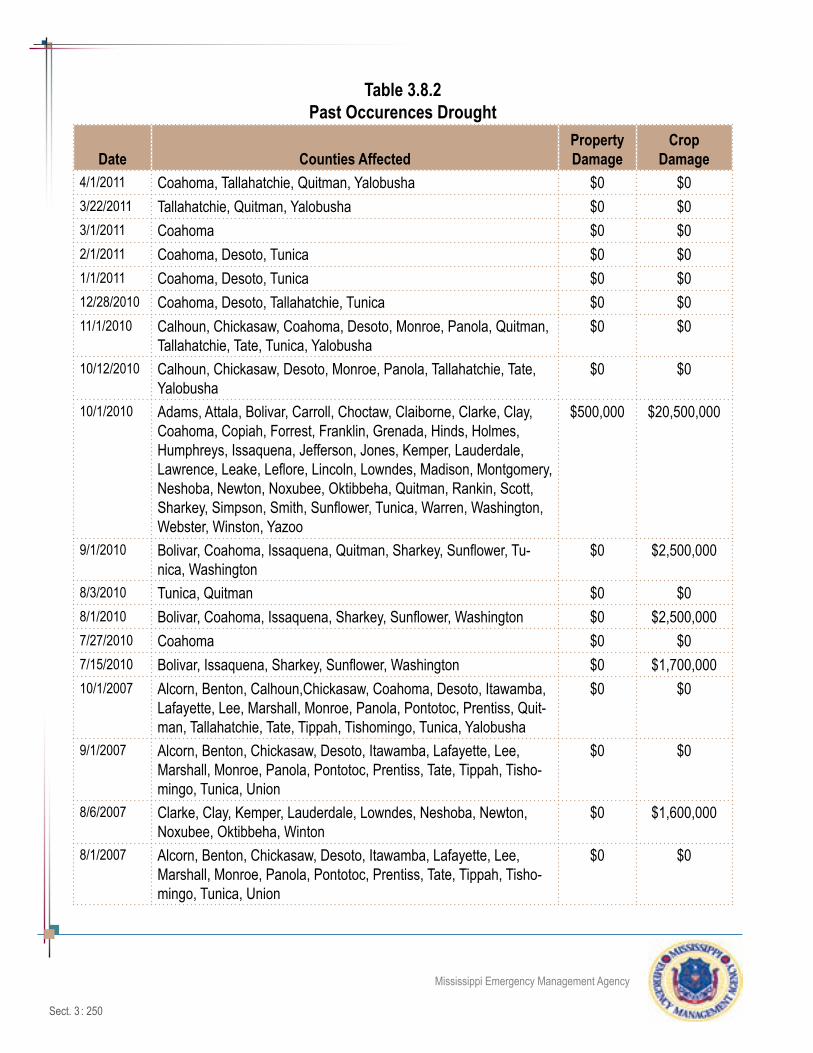
Sect. 3 : 250
Mississippi Emergency Management Agency
Table 3.8.2 Past Occurences Drought
Date Counties AffectedProperty Damage
Crop Damage
4/1/2011 Coahoma, Tallahatchie, Quitman, Yalobusha $0 $03/22/2011 Tallahatchie, Quitman, Yalobusha $0 $03/1/2011 Coahoma $0 $02/1/2011 Coahoma, Desoto, Tunica $0 $01/1/2011 Coahoma, Desoto, Tunica $0 $012/28/2010 Coahoma, Desoto, Tallahatchie, Tunica $0 $011/1/2010 Calhoun, Chickasaw, Coahoma, Desoto, Monroe, Panola, Quitman,
Tallahatchie, Tate, Tunica, Yalobusha$0 $0
10/12/2010 Calhoun, Chickasaw, Desoto, Monroe, Panola, Tallahatchie, Tate, Yalobusha
$0 $0
10/1/2010 Adams, Attala, Bolivar, Carroll, Choctaw, Claiborne, Clarke, Clay, Coahoma, Copiah, Forrest, Franklin, Grenada, Hinds, Holmes, Humphreys, Issaquena, Jefferson, Jones, Kemper, Lauderdale, Lawrence, Leake, Leflore, Lincoln, Lowndes, Madison, Montgomery, Neshoba, Newton, Noxubee, Oktibbeha, Quitman, Rankin, Scott, Sharkey, Simpson, Smith, Sunflower, Tunica, Warren, Washington, Webster, Winston, Yazoo
$500,000 $20,500,000
9/1/2010 Bolivar, Coahoma, Issaquena, Quitman, Sharkey, Sunflower, Tu-nica, Washington
$0 $2,500,000
8/3/2010 Tunica, Quitman $0 $08/1/2010 Bolivar, Coahoma, Issaquena, Sharkey, Sunflower, Washington $0 $2,500,0007/27/2010 Coahoma $0 $07/15/2010 Bolivar, Issaquena, Sharkey, Sunflower, Washington $0 $1,700,00010/1/2007 Alcorn, Benton, Calhoun,Chickasaw, Coahoma, Desoto, Itawamba,
Lafayette, Lee, Marshall, Monroe, Panola, Pontotoc, Prentiss, Quit-man, Tallahatchie, Tate, Tippah, Tishomingo, Tunica, Yalobusha
$0 $0
9/1/2007 Alcorn, Benton, Chickasaw, Desoto, Itawamba, Lafayette, Lee, Marshall, Monroe, Panola, Pontotoc, Prentiss, Tate, Tippah, Tisho-mingo, Tunica, Union
$0 $0
8/6/2007 Clarke, Clay, Kemper, Lauderdale, Lowndes, Neshoba, Newton, Noxubee, Oktibbeha, Winton
$0 $1,600,000
8/1/2007 Alcorn, Benton, Chickasaw, Desoto, Itawamba, Lafayette, Lee, Marshall, Monroe, Panola, Pontotoc, Prentiss, Tate, Tippah, Tisho-mingo, Tunica, Union
$0 $0

Sect. 3 : 251
Mississippi Emergency Management Agency
7/1/2007 Alcorn, Attala, Benton, Calhoun,Carroll, Chickasaw, Choctaw, Clai-borne, Clarke, Clay, Copiah, Covington, Forrest, Franklin, Hinds, Holmes, Humphreys, Issaquena, Itawamba, Jasper, Jefferson, Jefferson Davis, Jones, Kemper, Lafayette, Lamar, Lauderdale, Lawrence, Leake, Lee, Leflore, Lincoln, Lowndes, Madison, Marion, Marshall, Monroe, Montgomery, Neshoba, Newton, Noxubee, Oktib-beha, Panola, Pontotoc, Prentiss, Rankin, Scott, Sharkey, Simpson, Smith, Tallahatchie, Tippah, Tishomingo, Union, Warren, Webster, Winston, Yalobusha, Yazoo
$2,650,000 $0
6/1/2007 Alcorn, Attala, Benton, Calhoun,Carroll, Chickasaw, Choctaw, Clai-borne, Clarke, Clay, Copiah, Covington, Forrest, Franklin, Grenada, Hinds, Holmes, Humphreys, Issaquena, Itawamba, Jasper, Jeffer-son, Jefferson Davis, Jones, Kemper, Lafayette, Lamar, Lauderdale, Lawrence, Leake, Lee, Leflore, Lincoln, Lowndes, Madison, Marion, Marshall, Monroe, Montgomery, Neshoba, Newton, Noxubee, Oktib-beha, Panola, Pontotoc, Prentiss, Rankin, Scott, Sharkey, Simpson, Smith, Tallahatchie, Tippah, Tishomingo, Union, Warren, Webster, Winston, Yalobusha, Yazoo
$0 $748,500,000
5/1/2007 Alcorn, Attala, Benton, Calhoun,Carroll, Chickasaw, Choctaw, Clai-borne, Clarke, Clay, Copiah, Covington, Forrest, Franklin, Grenada, Hinds, Holmes, Humphreys, Issaquena, Itawamba, Jasper, Jeffer-son, Jefferson Davis, Jones, Kemper, Lafayette, Lamar, Lauderdale, Lawrence, Leake, Lee, Leflore, Lincoln, Lowndes, Madison, Marion, Marshall, Monroe, Montgomery, Neshoba, Newton, Noxubee, Oktib-beha, Panola, Pontotoc, Prentiss, Rankin, Scott, Sharkey, Simpson, Smith, Tallahatchie, Tippah, Tishomingo, Union, Warren, Webster, Winston, Yalobusha, Yazoo
$0 $28,800,000
4/25/2007 Attala, Carroll, Choctaw, Claiborne, Clarke, Clay, Copiah, Cov-ington, Grenada, Hinds, Holmes, Jasper, Jefferson Davis, Jones, Kemper, Lauderdale, Lawrence, Leake, Lincoln, Lowndes, Madison, Montgomery, Neshoba, Newton, Noxubee, Oktibbeha, Rankin, Scott, Simpson, Smith, Warren, Webster, Winston, Yazoo
$0 $0
4/12/2007 Attala, Choctaw, Clarke, Clay, Hinds, Jasper, Kemper, Lauderdale, Leake, Lowndes, Madison, Montgomery, Neshoba, Newton, Nox-ubee, Oktibbeha, Rankin, Scott, Smith, Webster, Winston
$0 $0
4/5/2007 Alcorn, Benton, Calhoun, Chickasaw, Itawamba, Lafayette, Lamar, Lee, Monroe, Pontotoc, Prentiss, Tippah, Tishomingo, Union, Yalo-busha
$0 $0
Total Damages $3,150,000 $806,100,000Source: NCDC

Sect. 3 : 252
Mississippi Emergency Management Agency
Probability of Future Occurrences
Forecasting limitations makes estimating probability of drought unrealistic within the context of this plan. Given statewide drought indices, the probability of future drought conditions is considered to be low, as determined by the U.S. seasonal drought outlook. However, it is important to note the seasonal drought outlook is forecast through June 2013 (Figure 3.8.3), a much shorter timeframe than the three-year plan-ning horizon of this plan. Continuous monitoring of drought indices and forecasts is recommended.
Figure 3.8.3U.S. 12 Month Climate Forecast
(Source: Climate Prediction Center)

Sect. 3 : 253
Mississippi Emergency Management Agency
Vulnerability AssessmentIt is very difficult to quantify the vulnerability of any given area to droughts or to assess inventories of at-risk property for estimating exposure or losses. The intense agricultural land use areas are most vulnerable. Drought would have a negligible impact to state-owned and critical facilities and public safety and deemed not to pose a serious statewide threat that could be addressed by this plan. For that reason, this plan de-fers to local vulnerability assessments.
The most obvious primary impact from drought in Mississippi is crop damage which can and has resulted in significant secondary impacts (e.g. economic losses). Drought can also create conditions that promote the occurrence of other natural hazards such as wildfires and wind erosion. While dry conditions increase the likelihood of wildfires, low-flow conditions decrease the quantity and pressure of water for use by firefight-ers. The likelihood of flash flooding is increased if a period of severe drought is followed by a period of extreme precipitation.
Environmental drought impacts include human and animal habitats and hydrologic units. During periods of drought, the amount of available water decreases in lakes, streams, aquifers, soil, wetlands, springs, and other surface and subsurface water sources. This decrease in water availability can affect water quality by altering the salinity, bacteria, turbidity, temperature, and pH levels. Changes in any of these levels can have a significant effect on the aquatic habitat of numerous plants and animals found throughout the state.
Low water flow may result in decreased sewage flows and subsequent increases in contaminants in the water supply. Decreased availability of water decreases the drinking water supply and the food supply. This disruption can work its way up the food chain within a habitat. Loss of biodiversity and increases in mortality can lead to increases in disease and endangered species.
Local Plan Risk Assessment SummaryBelow is a summary of the risk classification identified in the individual local mitigation plans by MEMA Region.
MEMA Region Low Medium High MEMA Region Low Medium High1 6 2 - 6 - - -2 11 1 - 7 1 1 -3 4 3 - 8 1 3 14 - - 6 9 5 1 -5 2 27 -

Sect. 3 : 254
Mississippi Emergency Management Agency
3.9: Extreme Winter Weather Risk Assessment
Hazard DescriptionThe National Weather Service defines a winter storm as having three factors: cold air, moisture and lift. These three factors acting together create conditions suitable for a winter storm. Below are definitions for winter weather events that could impact the Mississippi Gulf Coast:
Snow Flurries: Light snow falling for short durations. No accumulation or light dusting is all that is expected.
SnowShowers: Snow falling at varying intensities for brief periods of time. Some accumulation is possible.
Sleet: Rain drops that freeze into ice pellets before reaching the ground. Sleet usually bounces when hitting a surface and does not stick to objects. However, it can accumulate like snow and cause a hazard to motor-ists.
Freezing Rain: Rain that falls onto a surface with a temperature below freezing. This causes it to freeze to surfaces, such as trees, cars, and roads, forming a coating or glaze of ice. Even small accumulations of ice can cause a significant hazard.
Wind Chill: The combination of wind and temperature that serves as an estimate of how cold it actually feels to exposed human skin. Wind chill values below -19 degrees are considered dangerous
The National Weather Service issues the following watches and warnings when impacts are suspected.
Winter Storm Warning: Issued when hazardous winter weather in the form of heavy snow, heavy freezing rain, or heavy sleet is imminent or occurring. Winter Storm Warnings are usually issued 12 to 24 hours before the event is expected to begin.
Winter Storm Watch: Alerts the public to the possibility of a blizzard, heavy snow, heavy freezing rain, or heavy sleet. Winter Storm Watches are usually issued 12 to 48 hours before the beginning of a Winter Storm.
Winter Storm Outlook: Issued prior to a Winter Storm Watch. The Outlook is given when forecasters believe winter storm conditions are possible and usually issued 3 to 5 days in advance of a winter storm.
Wind Chill Warning: Issued when wind chill temperatures are expected to be hazardous to life within sev-eral minutes of exposure.
Wind Chill Advisory: Issued when wind chill temperatures are expected to be a significant inconvenience to life with prolonged exposure and, if caution is not exercised, could lead to hazardous exposure.
Winter Weather Advisories: Issued for accumulations of snow, freezing rain, freezing drizzle, and sleet which will cause significant inconveniences and, if caution is not exercised, could lead to life-threatening situations.
Winter storms in the south typically consist of light snow (snow flurries with little to no accumulation), freez-ing rain (rain that falls when ground temperatures are below freezing), or sleet (transparently frozen or partially frozen raindrops).

Sect. 3 : 255
Mississippi Emergency Management Agency
Hazard ProfileThe hazard profile for extreme winter weather in Mississippi was updated from the previously approved plan of 2010 to include current statistics regarding winter activity throughout the state.
Maximum Winter Storm Threat
Severe winter storms can cause immense economic losses to the state of Mississippi. Hampered transpor-tation routes caused by closed or blocked roads can prevent the movement of essential economic goods by airports and waterways. An intense cold weather system during the winter of 1989 – 1990 brought about a widespread emergency in Central Mississippi. Unlike previous winter emergencies, this crisis occurred be-cause manufacturers and product brokers were unable to gain access to essential transportation systems, such as pipelines, trucks and rail tankers that move heating fuel (propane). This lack of fuel had a cascad-ing effect on the domestic and manufacturing economies.
Extreme winter weather in 2010 caused a similar disruption of the Central Mississippi economy. Accord-ing to the National Weather Service (NWS), the winter of 2009/2010 was characterized by below-normal temperatures across the state of Mississippi. In Jackson, it was the fourth-coldest winter since temperature records were first collected in 1896. It was also the ninth-snowiest winter in Jackson, with one snowfall of 5.5 inches recorded by the NWS Forecast Office. In January, prolonged sub-freezing temperatures caused massive failure of water mains throughout Jackson and the Central Mississippi region, creating problems for residents and causing emergency conditions at hospitals, police precincts, businesses, restaurants, communications systems and state facilities. (See a recap of this event under the heading “Prolonged Sub-Freezing Temperatures – January 2010” in this section.)
Timber, a vital asset to the state’s economy, was severely impacted by the February 1994 ice storm (FEMA-1009-DR-MS). Damage to public facilities – coupled with $1.3 billion from timber losses – resulted in one of the costliest disasters of this type the state ever experienced. Not only did the downed timber create a problem from potential wildfires, but collapsed roofs and downed power lines, resultin in loss of heating, lighting, water and sewer systems.
Other secondary problems included flooding from melting ice and snow, and rainfall on heavily glazed and saturated surfaces. Icy, snow-covered areas can create increased accidents to drivers and walkers. Downed power lines can create a risk of electrocution to residents and to electric power workers. Finally, frozen and broken water lines in homes are not only costly to repair, but create additional hazards from electrocution.
Education and Outreach
Severe Weather Awareness Week occurs in the month of February and is set each year in coordination with the National Weather Service. For more information on severe weather awareness call the MEMA Public Information number (866-519-6362) between 8 a.m. and 5 p.m. weekdays.

Sect. 3 : 256
Mississippi Emergency Management Agency
Location / Past Occurrences
The NCDC improved their data for winter-weather events by enhancing classifications and reassessing the events from 1996 to current. The data for the years 1993 and 1994 were brought forward from the 2010 plan, but the data was not available through NCDC to verify any changes. Table 3.9.1 was updated from the previous plan to reflect the new categories and number of events reported.
Table 3.9.1Summary of Mississippi Winter Storm Events 1996-2013
Year
Incident Type (No. counties/events recorded)
Total Property Damage
($)
Total Crop Damage
($)Heavy Snow
Ice Storm/Sleet Winter Storm Winter Weather
2013 28 24 0 18 $540,000 $02012 0 0 0 0 $0 $02011 41 71 44 29 $25,845,000 $240,0002010 40 4 35 46 $12,695,000 $02009 24 0 6 23 $0 $02008 52 10 14 42 $3,390,000 $02007 0 0 0 19 $0 $02006 0 10 22 0 $1,372,000 $02005 0 0 0 0 $0 $02004 7 2 11 0 $408,700 $02003 3 4 0 0 $148,000 $02002 6 0 0 16 $30,000 $02001 0 0 0 0 $0 $02000 42 31 3 0 $1,415,000 $01999 0 0 0 0 $0 $01998 0 53 21 0 $16,699,000 $01997 16 0 0 0 $50,000 $01996 3 30 32 0 $3,500,000 $01995 0 0 0 0 $0 $01994 0 1 0 0 $500,000 $5,000,000,0001993 0 1 0 0 $0 $0
Totals 262 241 188 193 $66,592,700 $5,000,240,000Source: NCDC
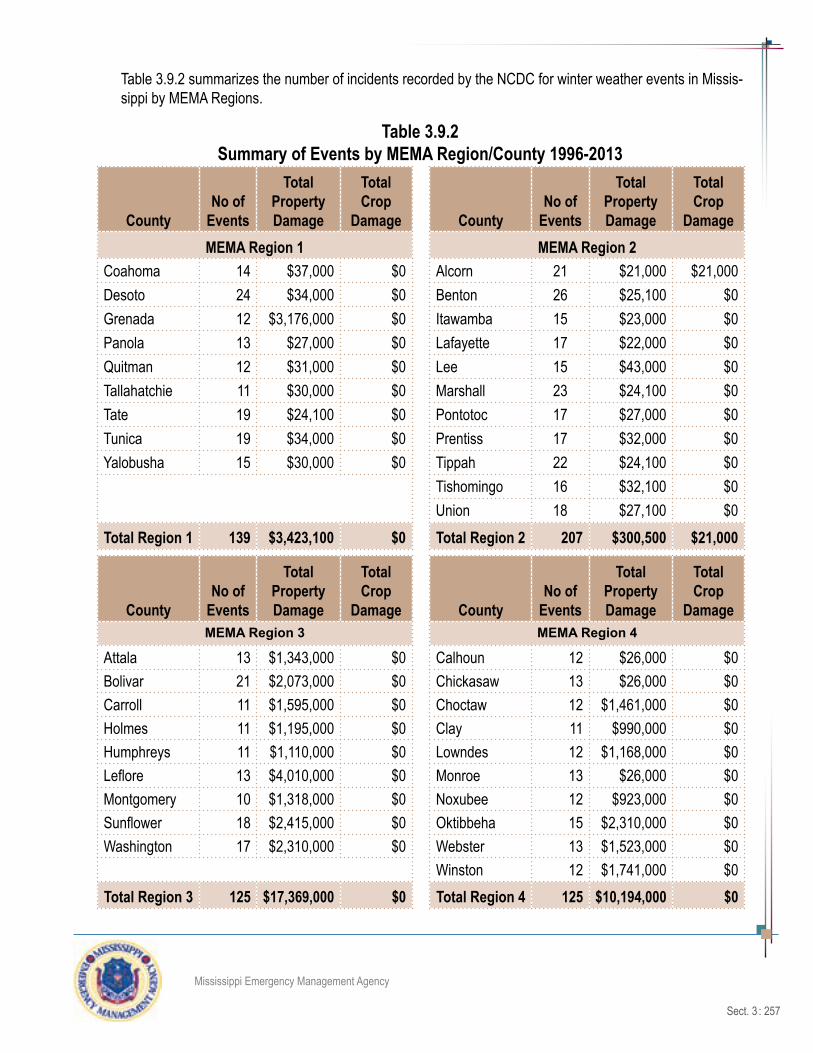
Sect. 3 : 257
Mississippi Emergency Management Agency
Table 3.9.2 summarizes the number of incidents recorded by the NCDC for winter weather events in Missis-sippi by MEMA Regions.
Table 3.9.2Summary of Events by MEMA Region/County 1996-2013
CountyNo of
Events
Total Property Damage
Total Crop
Damage CountyNo of
Events
Total Property Damage
Total Crop
DamageMEMA Region 1 MEMA Region 2
Coahoma 14 $37,000 $0 Alcorn 21 $21,000 $21,000Desoto 24 $34,000 $0 Benton 26 $25,100 $0Grenada 12 $3,176,000 $0 Itawamba 15 $23,000 $0Panola 13 $27,000 $0 Lafayette 17 $22,000 $0Quitman 12 $31,000 $0 Lee 15 $43,000 $0Tallahatchie 11 $30,000 $0 Marshall 23 $24,100 $0Tate 19 $24,100 $0 Pontotoc 17 $27,000 $0Tunica 19 $34,000 $0 Prentiss 17 $32,000 $0Yalobusha 15 $30,000 $0 Tippah 22 $24,100 $0
Tishomingo 16 $32,100 $0Union 18 $27,100 $0
Total Region 1 139 $3,423,100 $0 Total Region 2 207 $300,500 $21,000
CountyNo of
Events
Total Property Damage
Total Crop
Damage CountyNo of
Events
Total Property Damage
Total Crop
DamageMEMA Region 3 MEMA Region 4
Attala 13 $1,343,000 $0 Calhoun 12 $26,000 $0Bolivar 21 $2,073,000 $0 Chickasaw 13 $26,000 $0Carroll 11 $1,595,000 $0 Choctaw 12 $1,461,000 $0Holmes 11 $1,195,000 $0 Clay 11 $990,000 $0Humphreys 11 $1,110,000 $0 Lowndes 12 $1,168,000 $0Leflore 13 $4,010,000 $0 Monroe 13 $26,000 $0Montgomery 10 $1,318,000 $0 Noxubee 12 $923,000 $0Sunflower 18 $2,415,000 $0 Oktibbeha 15 $2,310,000 $0Washington 17 $2,310,000 $0 Webster 13 $1,523,000 $0
Winston 12 $1,741,000 $0Total Region 3 125 $17,369,000 $0 Total Region 4 125 $10,194,000 $0
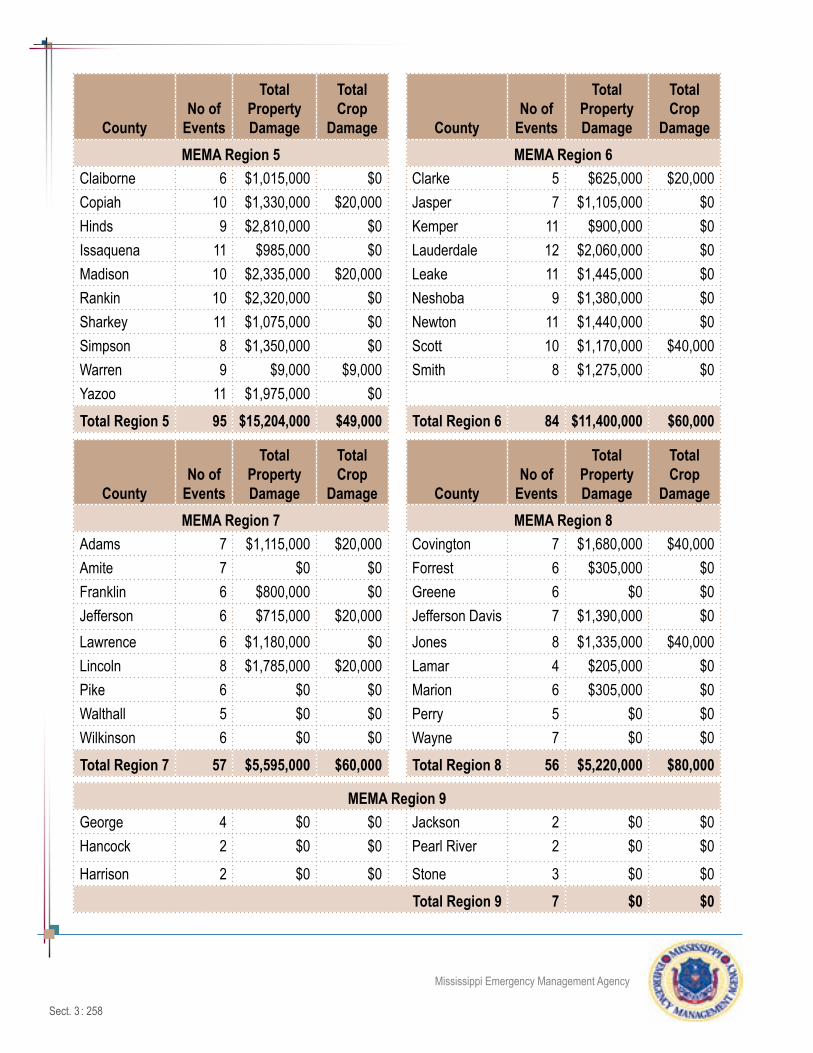
Sect. 3 : 258
Mississippi Emergency Management Agency
CountyNo of
Events
Total Property Damage
Total Crop
Damage CountyNo of
Events
Total Property Damage
Total Crop
DamageMEMA Region 5 MEMA Region 6
Claiborne 6 $1,015,000 $0 Clarke 5 $625,000 $20,000Copiah 10 $1,330,000 $20,000 Jasper 7 $1,105,000 $0Hinds 9 $2,810,000 $0 Kemper 11 $900,000 $0Issaquena 11 $985,000 $0 Lauderdale 12 $2,060,000 $0Madison 10 $2,335,000 $20,000 Leake 11 $1,445,000 $0Rankin 10 $2,320,000 $0 Neshoba 9 $1,380,000 $0Sharkey 11 $1,075,000 $0 Newton 11 $1,440,000 $0Simpson 8 $1,350,000 $0 Scott 10 $1,170,000 $40,000Warren 9 $9,000 $9,000 Smith 8 $1,275,000 $0Yazoo 11 $1,975,000 $0Total Region 5 95 $15,204,000 $49,000 Total Region 6 84 $11,400,000 $60,000
CountyNo of
Events
Total Property Damage
Total Crop
Damage CountyNo of
Events
Total Property Damage
Total Crop
DamageMEMA Region 7 MEMA Region 8
Adams 7 $1,115,000 $20,000 Covington 7 $1,680,000 $40,000Amite 7 $0 $0 Forrest 6 $305,000 $0Franklin 6 $800,000 $0 Greene 6 $0 $0Jefferson 6 $715,000 $20,000 Jefferson Davis 7 $1,390,000 $0Lawrence 6 $1,180,000 $0 Jones 8 $1,335,000 $40,000Lincoln 8 $1,785,000 $20,000 Lamar 4 $205,000 $0Pike 6 $0 $0 Marion 6 $305,000 $0Walthall 5 $0 $0 Perry 5 $0 $0Wilkinson 6 $0 $0 Wayne 7 $0 $0Total Region 7 57 $5,595,000 $60,000 Total Region 8 56 $5,220,000 $80,000
MEMA Region 9George 4 $0 $0 Jackson 2 $0 $0Hancock 2 $0 $0 Pearl River 2 $0 $0
Harrison 2 $0 $0 Stone 3 $0 $0Total Region 9 7 $0 $0
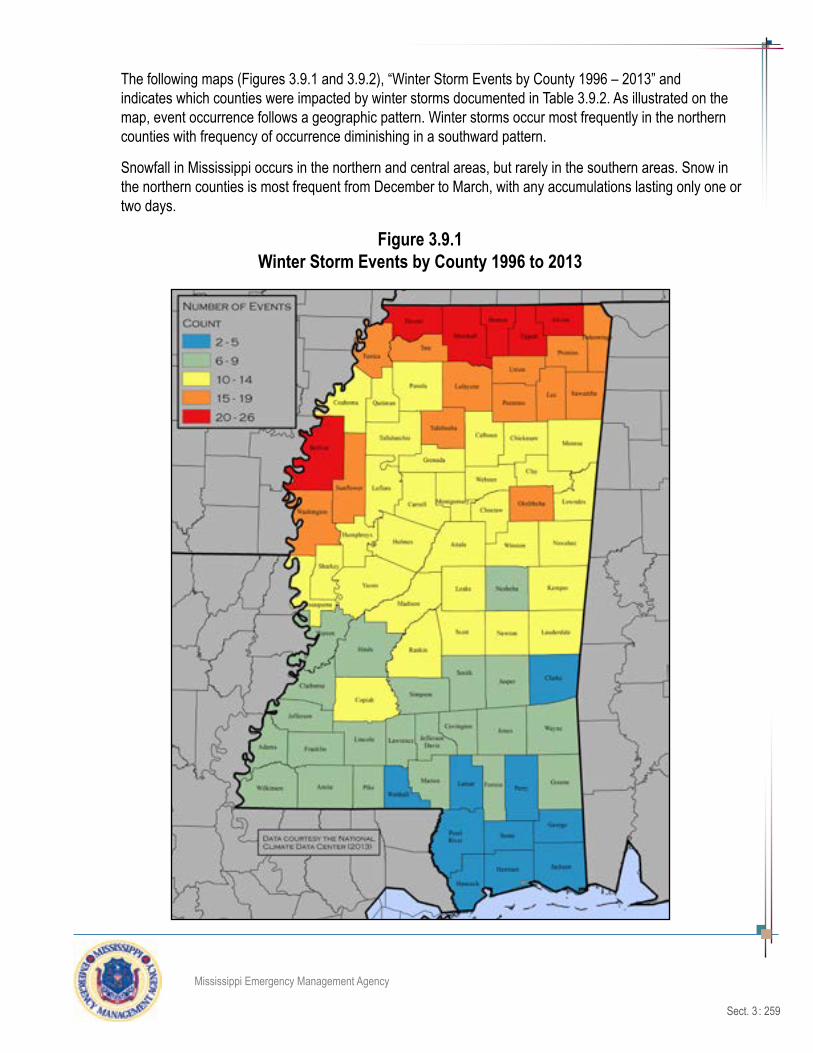
Sect. 3 : 259
Mississippi Emergency Management Agency
The following maps (Figures 3.9.1 and 3.9.2), “Winter Storm Events by County 1996 – 2013” and indicates which counties were impacted by winter storms documented in Table 3.9.2. As illustrated on the map, event occurrence follows a geographic pattern. Winter storms occur most frequently in the northern counties with frequency of occurrence diminishing in a southward pattern.
Snowfall in Mississippi occurs in the northern and central areas, but rarely in the southern areas. Snow in the northern counties is most frequent from December to March, with any accumulations lasting only one or two days.
Figure 3.9.1Winter Storm Events by County 1996 to 2013
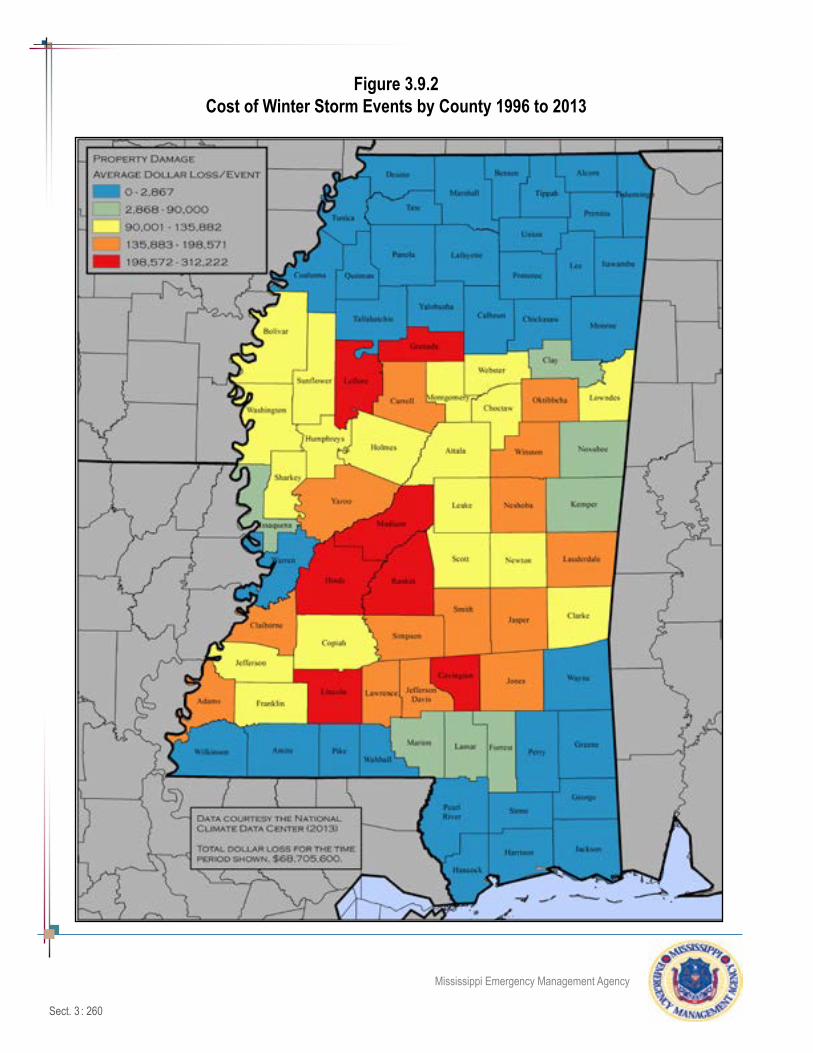
Sect. 3 : 260
Mississippi Emergency Management Agency
Figure 3.9.2Cost of Winter Storm Events by County 1996 to 2013

Sect. 3 : 261
Mississippi Emergency Management Agency
Cold weather, including extreme cold and wind chill, impact Mississippi causing property damage and deaths. These events also impact aging infrastructure, as in 2010, which is described in the historical events section. Table 3.9.3 and Figure 3.9.3 provide details of these events and the counties impacted
Table 3.9.3Cold-Related Events
Event Type Date No. of Events/Counties Affected DeathsProperty Damage
Cold/Wind Chill Jan 14, 2011 1 Lowndes 1 $0Cold/Wind Chill Jan 1-14, 2010 47 Adams, Attala, Bolivar, Carroll, Choctaw,
Claiborne, Clarke, Clay, Covington, Copiah, Forrest, Franklin, Grenada, Hinds, Holmes, Humphreys, Issaquena, Jasper, Jefferson, Jefferson Davis, Jones, Kemper, Lamar, Lauderdale, Lawrence, Leake, Leflore, Lin-coln, Lowndes, Madison, Marion, Montgom-ery, Neshoba, Newton, Noxubee, Oktibbeha, Rankin, Scott, Sharkey, Simpson, Smith, Sunflower, Warren, Washington, Webster, Winston and Yazoo
3 $15,180,000
Cold/Wind Chill Dec 25, 2004 1 Itawamba 1 $0Cold/Wind Chill Jan 24, 2003 1 Monroe 1 $0Extreme Cold/Wind Chill
Dec 31, 2000 1 Lafayette 1 $0
Cold/Wind Chill Dec 18, 1996 8 Amite, Hancock, Harrison, Jackson, Pearl River, Pike, Walthall and Wilkinson
0 $0
Cold/Wind Chill Feb 1-2, 1996 10 Amite, Desoto, Hancock, Harrison, Jackson, Pearl River, Pike, Walthall, Wilkinson and Yalobusha,
3 $100,000
Total 69 10 $15,280,000Source: NCDC

Sect. 3 : 262
Mississippi Emergency Management Agency
Figure 3.9.3Cold Weather-Related Property Damages 1996-2013

Sect. 3 : 263
Mississippi Emergency Management Agency
As previously stated, Mississippi is susceptible to winter-weather related events causing deaths and significant property and crop damages. Table 3.9.4 identifies two presidentially declared events in 1994 and 1998, followed by brief descriptions of each. The 2010 cold weather event, described in the historical events section, caused damage to water lines serving residents, city and state agencies and crippled the city of Jackson.
Table 3.9.4Presidential Disaster Declarations - Winter Weather
Declaration Number Incident Period
No. of Counties Affected
Date of Major Declaration
DR-1265 December 23 - 26, 1998 33 January 25, 1999DR-1009 February 9 - 14, 1994 26 February 18, 1994
Source: www.fema.gov/disaster
Historical Events
Prolonged Sub-Freezing Temperatures – January 1-14, 2010Source: Mississippi Emergency Management Agency, Mississippi State Department of Health, The Clarion-Ledger news reports
The Central Mississippi water supply failure of January 2010 is an example of how large metropolitan and less populated areas can be affected by extreme cold weather events. Prior to January 11, 2010, Central Mississippi experienced 11 straight days of sub-freezing overnight temperatures and six days of overnight temperatures of 20 degrees or less. From the evening of January 7 to the morning of January 10, tem-peratures remained below 32 degrees. By January 10 the Jackson, Mississippi water supply system began losing pressure, and when the daily high temperature reached 48 degrees on January 11, it became appar-ent Jackson and several other Central Mississippi towns and cities would experience major water-pressure problems due to water main breaks.
On January 11, Governor Haley Barbour issued an emergency declaration that was eventually expanded to include all affected areas. The state’s Emergency Operations Center was partially activated January 13 to help cities and counties with the ongoing crisis. Staff specializing in public works, engineering, logistics management and public health went on 12-hour shifts. Mississippi Emergency Management Agency deliv-ered bottled water to the affected areas.
The city of Jackson water system sustained 80 major breaks and spewed 22 million gallons of water throughout the city. That number eventually reached 150 broken water mains with an unknown quantity of wasted water. According to news reports, the City of Jackson reported up to 200,000 residents were without water. Adding to the problems, an electrical fire took a city water treatment plant off line and further dimin-ished the city’s capacity to pump water. Many Jackson residents were entirely without water for more than 24 hours. The cities of Madison, Ridgeland, Hattiesburg and Greenville offered water crews to help patch the leaks, and the city of Pearl furnished water for two of Jackson’s largest hospitals.
On January 7 portions of Jackson and the city of Byram, south of Jackson, were placed on a boil water notice that remained in effect until January 24. On January 11 the entire Jackson water system, including

Sect. 3 : 264
Mississippi Emergency Management Agency
most of the metropolitan area, was placed under a boil water notice that lasted seven days. These require-ments, combined with a lack of water pressure, caused a multitude of problems including business, restau-rant and school closures, relocation of two police precincts and adjournment of the Mississippi Legislature, which was in session at the Capitol in Jackson. For locations that remained in operation, flushing toilets and other hygienic measures became a problem. The Jackson Convention Complex was forced to provide ex-traordinary water and restroom facilities for a 400-person Affordable Housing Conference. Fire departments delivered water to jails and other critical facilities. Portable toilets were in such demand that vendors had to go out of state to supply the crisis.
AT&T, which operates switching centers for its cell and land lines and other providers that utilize the com-pany’s infrastructure, including emergency communications systems, was forced to park water-filled tanker trucks outside its facilities to cool equipment and provide fire protection. A National Guard tanker provided 5,000 gallons of water to cool computers for several state agencies providing essential services.
Mississippi State Department of Health (MSDH) went into emergency mode. Tasked with providing engi-neers for Emergency Support Function (ESF) #3 of the state’s Comprehensive Emergency Management Plan (CEMP), MSDH also began emergency procedures to protect the health and safety of the public. That task included providing extra staff to sample and test potable water supplies from affected communities and inspect food service providers such as restaurants, shelters, clinics and schools to ensure safe opera-tion. The department temporarily closed some restaurants until they could adjust to emergency operation requirements.
State Agencies Impacted
On Sunday, January 17 the boil-water alert was cancelled for most of the city, ending a week of crises unequaled in recent Jackson history. This event left behind a legacy of business losses, school days to be made up, huge potholes to be repaired where water crews accessed system breaks, and a large budgetary problem for the city of Jackson. Mitigation of future problems for Jackson’s aging water main system was projected to cost over $75 million. With tax revenues in decline, the city’s water supply problem was not a small one.
Affected cities and counties
The following numbers of residents of Central Mississippi cities and counties were affected by the January 2010 water supply emergency: Jackson (200,000); Lauderdale County (14,000); Port Gibson (10,500); Marks (2,300); Walnut (500); Vicksburg (250); Wayne County (150); Tunica County (number not available); Carroll County (num-ber not available).
Graphic above shows Sleet/Snowfall(In) totals from 6:00am, January 9th - 12:00pm, January 10th.

Sect. 3 : 265
Mississippi Emergency Management Agency
DR-1265 - December 23-26, 1998
A crippling ice storm struck Arkansas, Louisiana, and Mississippi on the evening of December 22, 1998, bringing freezing rain and sleet to the three-state region. Much of the fall and early winter season of late 1998 was very mild, but a strong surge of shallow arctic air drove southward and spelled an end to the unseasonable warmth. A moist southwest flow above the cold air brought several upper level disturbances. The combination of cold air and moisture caused periods of freezing rain and sleet until Christmas morning.
Almost two inches of ice accumulated on power lines, causing outages for up to seven days. Tree and power line damage was moderate to severe from northeast Louisiana to northcentral Mississippi. Due to more foliage than usual on trees, the extra weight of ice accumulation caused large oaks and maples to split in half. Travel was severely hampered for several days with motorists stranded at airports, bus sta-tions, and truck stops.
Counties in Mississippi affected by the storm included Leake, Lee, Leflore, Lowndes, Monroe, Montgomery, Neshoba, Noxubee, Oktibbeha, Pontotoc, Prentiss, Sharkey, Sunflower, Tallahatchie, Tishomingo, Union, Warren, Washington, Webster, Winston, Yalobusha, and Yazoo.
Impact Summary Public Assistance Dollars Obligated Declared Counties
• No. of Counties Affected: 33• Deaths: 0• Injuries: 0• Estimated Property Damage: $16,699,000
Total PA Grants Emergency Work (Categories A-B)
Permanent Work (Categories C-G)
$6,970,269 $2,590,192 $4,349,918Source: NCDC Source: FEMA June 20, 2013
DR-1009 - February 9-14, 1994
In 1994, a damaging ice storm with freezing rain accumulations of three to six inches occurred across north Mississippi, southeast Arkansas, west Ten-nessee, northwest Alabama, north Louisiana, and extreme northeast Texas between February 9th and 11th. In Mississippi, the ice storm was the worst since 1951, with total damage estimates exceeding $300 million and a federal disaster declaration for 26 counties.
According to Mississippi Power and Light Company estimates, 500,000 persons in roughly 200,000 homes had no electricity at the height of the storm, and 175,000 homes had no water. Twenty percent of Mississippians lost power for at least one day. Ap-proximately 300 water systems were also severely affected for a week or more with over 300,000 custom-ers advised to boil water before use.
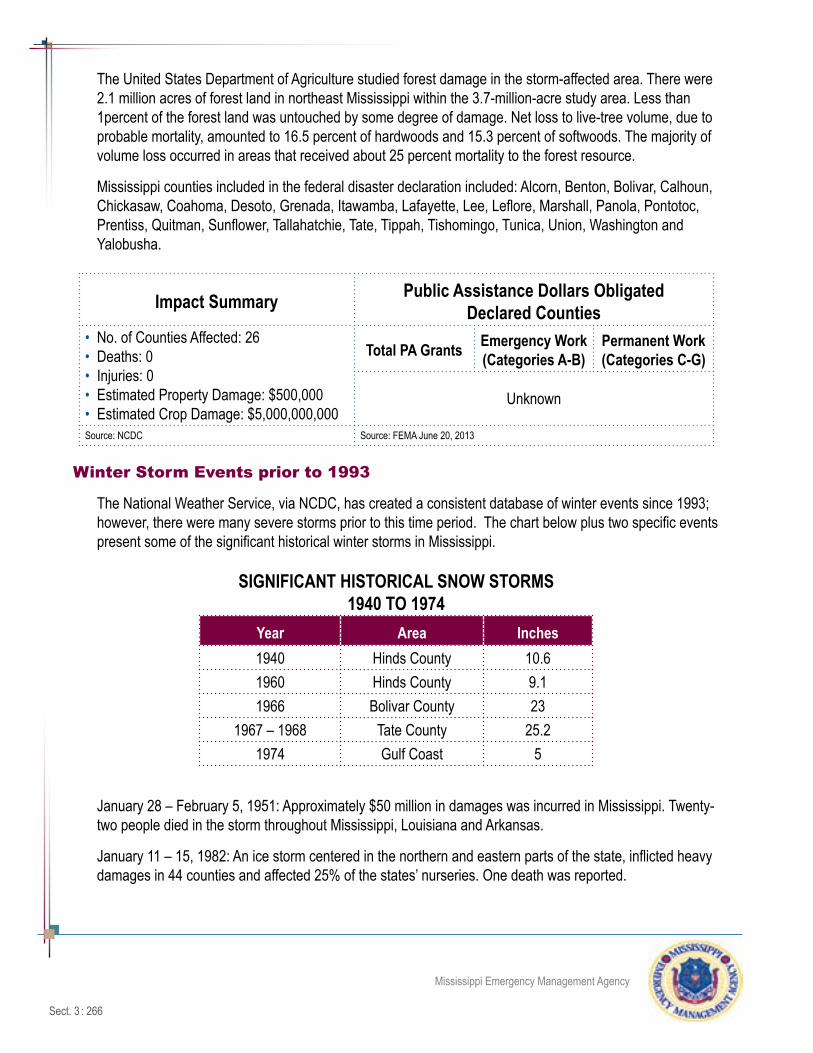
Sect. 3 : 266
Mississippi Emergency Management Agency
The United States Department of Agriculture studied forest damage in the storm-affected area. There were 2.1 million acres of forest land in northeast Mississippi within the 3.7-million-acre study area. Less than 1percent of the forest land was untouched by some degree of damage. Net loss to live-tree volume, due to probable mortality, amounted to 16.5 percent of hardwoods and 15.3 percent of softwoods. The majority of volume loss occurred in areas that received about 25 percent mortality to the forest resource.
Mississippi counties included in the federal disaster declaration included: Alcorn, Benton, Bolivar, Calhoun, Chickasaw, Coahoma, Desoto, Grenada, Itawamba, Lafayette, Lee, Leflore, Marshall, Panola, Pontotoc, Prentiss, Quitman, Sunflower, Tallahatchie, Tate, Tippah, Tishomingo, Tunica, Union, Washington and Yalobusha.
Impact Summary Public Assistance Dollars Obligated Declared Counties
• No. of Counties Affected: 26• Deaths: 0• Injuries: 0• Estimated Property Damage: $500,000• Estimated Crop Damage: $5,000,000,000
Total PA Grants Emergency Work (Categories A-B)
Permanent Work (Categories C-G)
Unknown
Source: NCDC Source: FEMA June 20, 2013
Winter Storm Events prior to 1993
The National Weather Service, via NCDC, has created a consistent database of winter events since 1993; however, there were many severe storms prior to this time period. The chart below plus two specific events present some of the significant historical winter storms in Mississippi.
SIGNIFICANT HISTORICAL SNOW STORMS 1940 TO 1974
Year Area Inches1940 Hinds County 10.61960 Hinds County 9.11966 Bolivar County 23
1967 – 1968 Tate County 25.21974 Gulf Coast 5
January 28 – February 5, 1951: Approximately $50 million in damages was incurred in Mississippi. Twenty-two people died in the storm throughout Mississippi, Louisiana and Arkansas.
January 11 – 15, 1982: An ice storm centered in the northern and eastern parts of the state, inflicted heavy damages in 44 counties and affected 25% of the states’ nurseries. One death was reported.

Sect. 3 : 267
Mississippi Emergency Management Agency
Probability of Future Winter Storm Events
The area most likely to receive an ice storm, heavy snow, or winter storm activity is the area north of Inter-state 20, the northern half of Mississippi. Historically based on data from the NCDC, winter events occur as early as mid-December and as late as mid-March. In the past 20 years, Mississippi recorded some magni-tude of winter weather except for the years of 1995, 1999, 2001, 2005 and 2012. Therefore, a 25 percent probability of a winter weather event striking the state should be expected.
Assessing Vulnerability An assessment of Mississippi’s vulnerability to winter storms reveals advance warnings are often not heeded. Preparedness for a winter storm is paramount. As is the case with other natural hazards, the very young, the elderly, persons with special needs and handicapped people are vulnerable to winter storms. Officials also suggest institutions housing these individuals develop a plan to include preparedness for lack of electricity, water, and fuel for heating.
Public buildings are not as vulnerable to winter storms as infrastructure such as electric transmission lines and utility poles that can all be weighed down by ice and freezing rain. During the 1994 ice storm 8,000 utility poles were downed by the weight of ice, 4,700 miles of power lines were downed, and 491 water systems were affected, with 741,000 customers without water.
Vulnerability of People to Winter Storms
The public warning systems alerting the general public of an impending storm are the existing media outlets, the National Weather Service and NOAA weather radios. The oxygen- and insulin-dependent, the elderly, those whose medical conditions require regular visits by home health care workers, and children living in these households make up the special needs group whose lives are most in danger when a power failure occurs. These citizens must rely on neighbors and relatives for contact, supplies and assistance throughout the disruption. Previous incidents have left remote areas of the state without power for up to a month.
Roads are often blocked by trees felled by heavy ice, and road and bridge conditions may prevent home healthcare workers from reaching their patients until emergency personnel can clear roads and offer trans-port by ambulance. Any unnecessary automobile or pedestrian travel during icy conditions by citizens not involved in emergency assistance increases the burden on emergency personnel during these crises.
Loss of Life from Extreme Cold in Mississippi
Although the National Weather Service does not record cold-related deaths along with winter storm event statistics, the following information collected by the Mississippi State Department of Health, Bureau of Health Statistics, provides an understanding of recorded deaths in Mississippi due to extreme natural cold. Table 3.9.5 below summarizes cold-related deaths over a 28-year period from 1984 to 2011, the last year for which data was available. During that time, a total of 175 deaths from this cause occurred, an average of 6.25 deaths per year. Information on the location of the deaths was not available.

Sect. 3 : 268
Mississippi Emergency Management Agency
Table 3.9.5Loss of Life Excessive Cold
Year
Exposure to Excessive
Natural Cold Year
Exposure to Excessive
Natural Cold Year
Exposure to Excessive
Natural Cold Year
Exposure to Excessive
Natural Cold2011 4 2004 14 1997 3 1990 92010 6 2003 11 1996 9 1989 132009 5 2002 9 1995 3 1988 62008 2 2001 11 1994 8 1987 12007 5 2000 14 1993 2 1986 32006 3 1999 7 1992 3 1985 32005 7 1998 5 1991 4 1984 5
Vulnerability of Natural Resources to Winter Storms
Trees, crops, and decorative vegetation are subject to damage from winter storms. Ice storm damage docu-mented by the National Weather Service in 1994 caused damage to over 3.7 million acres of commercial forestland. The value of damaged timber was estimated at $27 million. The state’s pecan crop was reduced by 25% over the following five-to-ten years at an estimated cost of $5.5 million per year.
Fallen timber and tree limbs during winter storms provide a possibility of wildfires later in the year. Forestry Commission officials and private landowners minimize the severity of wildfires by cutting and sawing fallen timber and debris to prevent the spread of fire.
Vulnerability of Private Improvements to Winter Storms
In Mississippi, occasionally roofs of businesses and homes are stressed or collapse due to the weight of snow and ice accumulations. Cars and passengers are vulnerable when driving on icy or wet roads and surfaces. Decorative trees and shrubs can be expensive to replace should the weight of ice and snow force down or break limbs.
Businesses within the affected area are vulnerable to power outages and may be unable to open their doors for business, thus losing income due to closure. Communications facilities, such as telephone lines, microwave, and cellular telephone repeater towers were disrupted if not downed in the past. The failure of nine fiber optic lines, 26 local telephone exchanges and several cellular telephone repeater towers was caused by vulnerablity to ice and snow accumulations as documented in the FEMA-1009-DR-MS (February 18, 1994) Hazard Mitigation Team Report.
Homes and businesses served by local firefighters are vulnerable in an ice storm where downed power lines have reduced the amount of water available to fight fires. Other municipal services such as sewer and water purification services are not available to municipal and other residents.
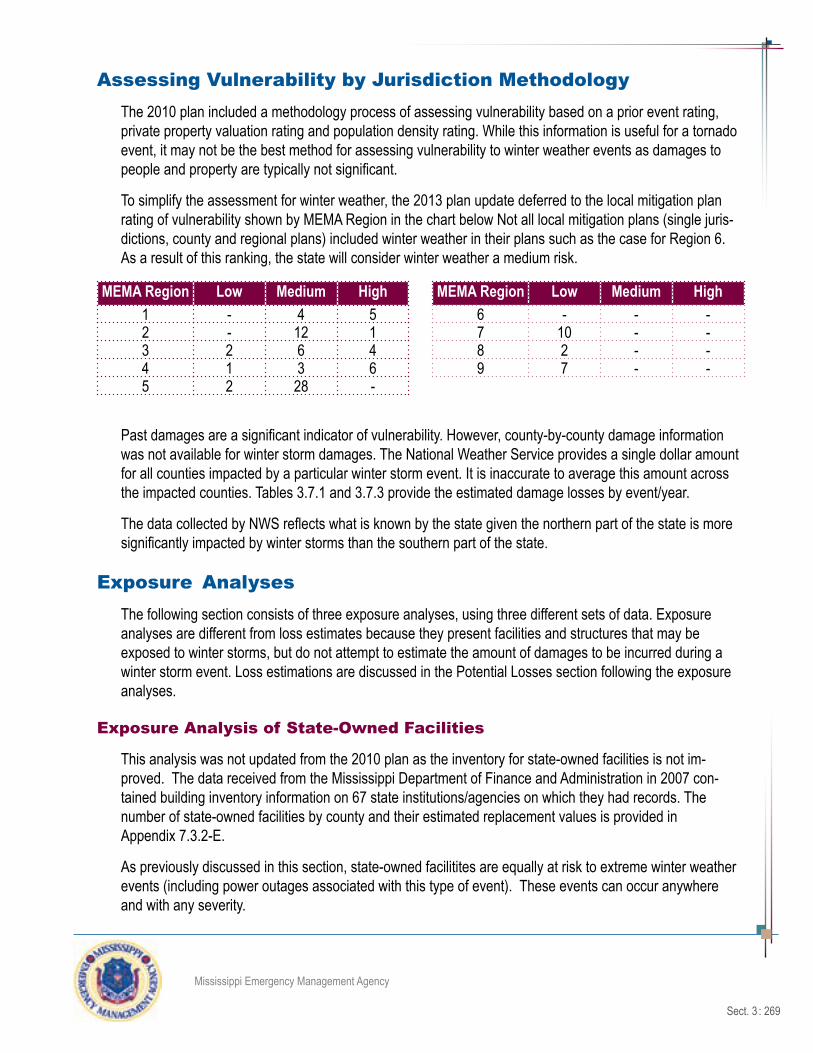
Sect. 3 : 269
Mississippi Emergency Management Agency
Assessing Vulnerability by Jurisdiction MethodologyThe 2010 plan included a methodology process of assessing vulnerability based on a prior event rating, private property valuation rating and population density rating. While this information is useful for a tornado event, it may not be the best method for assessing vulnerability to winter weather events as damages to people and property are typically not significant.
To simplify the assessment for winter weather, the 2013 plan update deferred to the local mitigation plan rating of vulnerability shown by MEMA Region in the chart below Not all local mitigation plans (single juris-dictions, county and regional plans) included winter weather in their plans such as the case for Region 6. As a result of this ranking, the state will consider winter weather a medium risk.
MEMA Region Low Medium High MEMA Region Low Medium High1 - 4 5 6 - - -2 - 12 1 7 10 - -3 2 6 4 8 2 - -4 1 3 6 9 7 - -5 2 28 -
Past damages are a significant indicator of vulnerability. However, county-by-county damage information was not available for winter storm damages. The National Weather Service provides a single dollar amount for all counties impacted by a particular winter storm event. It is inaccurate to average this amount across the impacted counties. Tables 3.7.1 and 3.7.3 provide the estimated damage losses by event/year.
The data collected by NWS reflects what is known by the state given the northern part of the state is more significantly impacted by winter storms than the southern part of the state.
Exposure Analyses
The following section consists of three exposure analyses, using three different sets of data. Exposure analyses are different from loss estimates because they present facilities and structures that may be exposed to winter storms, but do not attempt to estimate the amount of damages to be incurred during a winter storm event. Loss estimations are discussed in the Potential Losses section following the exposure analyses.
Exposure Analysis of State-Owned Facilities
This analysis was not updated from the 2010 plan as the inventory for state-owned facilities is not im-proved. The data received from the Mississippi Department of Finance and Administration in 2007 con-tained building inventory information on 67 state institutions/agencies on which they had records. The number of state-owned facilities by county and their estimated replacement values is provided in Appendix 7.3.2-E.
As previously discussed in this section, state-owned facilitites are equally at risk to extreme winter weather events (including power outages associated with this type of event). These events can occur anywhere and with any severity.

Sect. 3 : 270
Mississippi Emergency Management Agency
Exposure Analysis of Critical Facilities
The state of Mississippi developed a definition for “critical facilities and infrastructure” as discussed in Section 3.0. Location data for these facilities was collected from various state agencies for the purpose of determining which facilities are at risk to various hazards. However, because this data came from multiple sources, the need to validate the information is vital to producing accurate assessments for future planning. For planning and assessment purposes, Appendix 7.3.2-D provides regional maps with overlaid critical facilities and infrastructure to assist with identifying the proximity of their locations.
Like state-owned facilities, all critical facilities and infrastructure located within each county are susceptible to extreme winter weather events including power outages that can be caused by these events. The impact of an extreme winter weather event can happen anywhere and with any severity.
Potential Losses As discussed above, damage dollar amounts due to prior winter storm events were not available on a county-by-county basis. Therefore, the state of Mississippi is unable to develop potential loss estimates due to winter storm damage. The “Hazard Profile” section demonstrates ice storms cause more property dam-age than heavy snow events. In 1998 an ice storm caused $16 million in damages across 31 counties. In 2010, 41 counties had over $15 million in damages due to extreme cold temperatures that ruptured water lines in Hinds County and affected state agencies and the city of Jackson. This shows damages and loss due to winter storms may be significant in any county.
In addition, secondary impacts such as business, state and local governments and school closures and/or closure of major thoroughfares result in significant loss. These are difficult to quantify, but important to consider. A discussion of secondary impacts is included in the “Hazard Profile” section.

Sect. 3 : 271
Mississippi Emergency Management Agency
3.10: Earthquake Risk Assessment
Hazard DescriptionThe United States Geographic Suvey (USGS) defines an earthquake as a sudden motion or trembling of the each caused by an abrupt release of stored energy beneath the earth’s surface. A description of techni-cal terms associated with earthquakes are provided below:
Epicenter - The epicenter is the geographic location directly above the hypocenter on the earth’s surface. Ideally, the epicenter and the highest MMI values on the isoseismal map coincide; this relation-ship does not, however, always hold true.
Hypocenter - The hypocenter is the location in the subsurface where the rupture actually took place.
Fault - Faults can be defined as a rupture in subsurface geological materials where there is relative movement on the opposing sides of the rupture. The origin of this movement is stress built up in the earth’s crust from plate movement or other geological forces.
Normal Fault -. A normal or gravity fault is one where a fault block has moved downward as gravity moves a fault block down along an inclined fault plane.
Reverse Fault - A reverse fault is the opposite of a normal fault where a fault block has moved up an inclined fault plane, opposite of the movement that would be expected if gravity were the main force acting on the block.
Strike Slip Fault - A strike-slip fault is one where the movement is largely horizontal and oriented in the same direction as the fault trends. Normal faults are the result of an extension of the earth’s crust, reverse faults are a result of a shortening or compression of the earth’s crust and strike-slip faults result from forces acting in a horizontal fashion.
Fault Plane - The rupture along which the movement of the fault blocks takes place can be a sharp planar feature, referred to as a fault plane. In this case, the direction the fault blocks moved (up, down or sideways) can be fairly straightforward.
Fault Zone - Unfortunately, it is also common for the movement of fault blocks to take place across a zone consisting of a number of faults planes with small individual displacements. This zone of displacement is referred to as a fault zone and it can be only a few inches wide or it can consist of a series of large faults and may be measured in miles.
Isoseismal Map - Typically, site intensities are plotted on a map and like intensities are grouped. The groupings are separated by lines referred to as isoseismal and the map itself is referred to as

Sect. 3 : 272
Mississippi Emergency Management Agency
an isoseismal map. Intensities are always denoted by roman numbers so as to distinguish them from magnitude values which are always in arabic numerals. The assigned intensity value for any particular earthquake represents the highest MMI value assigned in the felt area.
Liquefaction - Liquefaction is an earthquake-related hazard involving geological conditions that pose a potential hazard to structures. Liquefaction is a complex process resulting in soils losing their bearing strength (i.e. they act more like a liquid than a solid) due to seismic induced vibrations. The major con-cern is that during an earthquake the liquefaction soils become “liquid” and move laterally away from the foundation of buildings causing foundation failure or causing them to literally topple over.
Peak Ground Acceleration (PGA) - The maximum level of vertical or horizontal ground acceleration caused by an earthquake. The PGA is typically expressed as a percent of the acceleration due to gravity.
Magnitude - There are several magnitude scales. All are different from intensity scales as they mea-sure completely different aspects of the earthquake i.e. the strength of the earthquake source (Reiter, 1990). Reiter (1990, p. 34) also defines the difference between intensity and magnitude stating that “...magnitude is determined by quantitatively analyzing instrumental recordings utilizing specific, explicitly defined formulas ...” Magnitude scales were originally devised in 1934 for use in California. This scale came to be known as the Richter or Local Magnitude Scale.
Modified Mercalli Intensity Scale - The size of an earthquake can be expressed in several ways, most commonly used are the various magnitude scales and the Modified Mercalli Intensity Scale (MMI). There are several intensity scales, but the MMI is most commonly used in this country. The intensity scales differ from magnitude scales in that they measure the effects of seismic waves as they are perceived by people in the “felt” area of the earthquake. The first question, for example, is usually “Did you feel the earthquake?” If the answer is “yes” then a set of questions are asked that will help the interviewer determine the level of intensity at that site (referred to as site intensity). Intensity levels vary from a MMI intensity level I, where the earthquake was not felt to a MMI value of XII which is described as total damage.
A comparison of magnitude and intensity is shown in the chart below followed by abbreviated descrip-tions for each intensity level.
Magnitude Modified Mercalli Intensity*
1.0 - 3.0 I3.0 - 3.9 II - III4.0 - 4.9 IV - V5.0 - 5.9 VI - VII6.0 - 6.9 VII - IX
7.0 and higher VIII - or Higher*Based on a typical maximum Modified Mercalli Intensity Scale as defined below Source: USGS Earthquake Hazards Program

Sect. 3 : 273
Mississippi Emergency Management Agency
Intensity ScaleI. Not felt except by a very few under especially favorable conditions.II. Felt only by a few persons at rest, especially on upper floors of buildings.III. Felt quite noticeably by persons indoors, especially on upper floors of buildings. Many people do
not recognize it as an earthquake. Standing motor cars may rock slightly. Vibrations are similar to the passing of a truck. Duration estimated.
IV. Felt indoors by many, outdoors by few during the day. At night, some awakened. Dishes, windows, doors disturbed; walls make cracking sound. Sensation is like a heavy truck striking building. Standing motor cars rocked noticeably.
V. Felt by nearly everyone; many awakened. Some dishes, windows broken. Unstable objects over-turned. Pendulum clocks may stop.
VI. Felt by all, many frightened. Some heavy furniture moved; a few instances of fallen plaster. Dam-age is slight.
VII. Damage negligible in buildings of good design and construction; slight to moderate in well- built or-dinary structures; considerable damage in poorly built or badly designed structures; some chimneys broken.
VIII. Damage slight in specially designed structures; considerable damage in ordinary substantial build-ings with partial collapse. Damage is great in poorly built structures. Fall of chimneys, factory stacks, columns, monuments, walls. Heavy furniture overturned.
IX. Damage considerable in specially-designed structures; well–designed, frame structures thrown out of plumb. Damage is great in substantial buildings, with partial collapse. Buildings shifted off foundations.
X. Some well-built wooden structures destroyed; most masonry and frame structures destroyed with foundations. Rails bent.
XI. Few, if any (masonry) structures remain standing. Bridges destroyed. Rails bent greatly.XII. Damage total. Lines of sight and level are distorted. Objects are thrown into the air.
Hazard ProfileEarthquakes originating in Mississippi are not the only threat; those originating in surrounding states have also affected Mississippi in the past. The greatest threat to Mississippi from earthquakes is from a strong event in the New Madrid Seismic Zone. The earthquakes of 1811-1812, which originated along the New Madrid fault zone, shook many areas in Mississippi, reaching as far south as the Gulf Coast. The vibra-tions from these earthquakes were so powerful they rang church bells in Boston, Massachusetts more than 1,000 miles away.
Although the New Madrid Seismic Zone (NMSZ) is the primary seismic activity source for the Southeastern United States, there are other potential earthquake sources in Mississippi. The USGS has recorded more than 40 earthquakes originating within the boundaries of Mississippi since 1911. Though none of these Mississippi-centered earthquakes have inflicted severe damage, they should not be disregarded.

Sect. 3 : 274
Mississippi Emergency Management Agency
One area of notable earthquake activity is in east-central Mississippi in Lauderdale and Clarke counties. This area is not well known, but it has produced more than 14 earthquakes in the past 30 years, according to data gathered from the Mississippi Department of Environmental Quality (MDEQ). Most of these events occurred within the boundaries of Clarke County.
The White River Fault Zone (WRFZ) is another notable seismic zone that was identified in 1944. The Charleston earthquake of 1931 in Tallahatchie County, Mississippi may have been centered along this fault. This is the largest recorded Mississippi-centered earthquake at a magnitude of 5.0. The WRFZ runs from Grenada, Mississippi northward to Newport, Arkansas, approximately 280 miles. Many of Mississippi’s epicenters are in the northwest quadrant of the state; some may be associated with the WRFZ. The WRFZ is an area that should be assessed as a significant seismic hazard.
Earthquakes do not occur solely from naturally active faults. Volcanoes and oil and gas production are also potential sources of earthquakes. Mississippi has not had volcanic activity for millions of years; therefore, this impact is minimal. Oil and gas production is common in Mississippi, but might produce only relatively small earthquakes that have minimal hazard.
Education and Outreach
The Great Central U.S. ShakeOut is an annual opportunity to practice how to be safer during big earthquakes: “Drop, Crover and Hold On.” The ShakeOut has also been organized to encourage individuals, communities, schools and organizations to review and update emergency prepared-ness plans and supplies, and to secure a space in order to prevent damage and injuries. Registration for this event is located at www.shakeout.org.
The web site also includes numerous educational resources such as 20 Cool Facts about the New Madrid Seismic Zone that summarizes a few of the more significant facts about the series of large earthquakes that struck the New Madrid seismic zone of southeastern Missouri, northeastern Arkansas, and adjacent parts of Tennessee and Kentucky from December 1811 to February 1812.
Maximum Threat
The NMSZ is considered the most likely source of seismic activity that could cause substantial damage to the state of Mississippi. This zone is considered the linear area of seismic activity extending from the southern portion of Illinois to Marked Tree, Arkansas, which is situated approximately 45 miles north of the Mississippi state line.
History of Mississippi EarthquakesHistorically, not many earthquakes are centered within Mississippi. As seen in Table 3.10.1 many earth-quakes that originated in Mississippi had a magnitude of 3.5 or less. Damage typically begins to occur when an earthquake reaches a magnitude of 4 or greater. Nevertheless, every earthquake is unique and potentially dangerous. There were no new events in Mississippi for the 2013 plan update. A complete listing of events (outside of Mississippi) from 1699 to 2010 is provided as Appendix 7.3.10-E.

Sect. 3 : 275
Mississippi Emergency Management Agency
Table 3.10.2 shows a sampling of earthquakes that have originated in other states but have been powerful enough for residents of Mississippi to feel the effects of the vibrations. Although no earthquake activity was recorded for Mississippi from 2010 to 2012, Table 3.7.3 presents seismic activity for Mississippi’s neighbor-ing states during those years. It is not known if any effects of this activity were felt in Mississippi. Figure 3.7.1 shows the epicenter distribution of events originating in and near Mississippi.
Table 3.10.1Mississippi Earthquakes
Date Latitude Longitude Magnitude City/TownMay 10, 2008 34.35 -88.83 3.1 ShermanOctober 26, 2002 34.03 -90.68 3.1 DuncanAugust 11, 2002 34.34 -90.17 2.8 BatesvilleFebruary 25, 1999 34.1 -89.87 2.9 OaklandAugust 11, 1996 33.58 -90.87 3.5 MeltoniaSeptember 25, 1984 34.06 -89.82 Not available Long BranchFebruary 5, 1983 34.7 -88.37 2.9 CairoOctober 12, 1980 34.26 -89.13 Not available TurnpikeJune 9, 1978 32.09 -88.58 3.3 QuitmanNovember 4, 1977 33.83 -89.28 3.4 Calhoun CityOctober 23, 1976 32.2 -88.73 3 MeridianSeptember 9, 1975 30.66 -89.25 2.9 RicevilleMay 25, 1973 33.94 -90.63 Not available LombardyJanuary 1, 1973 33.78 -90.62 3.5 RulevilleJune 29, 1967 33.55 -90.81 Not available ShawJune 4, 1967 33.55 -90.84 4.4 ShawOctober 22, 1964 31.23 -89.56 Not available Pine GroveJune 1, 1962 34.98 -90.18 Not available WallsSeptember 27, 1956 31.9 -88.5 Not available ShubutaFebruary 1, 1955 30.4 -89.1 Not available GulfportJune 28, 1941 32.4 -90.9 Not available VicksburgDecember 17, 1931 33.8 -90.1 4.6 OxberryNovember 13, 1927 32.8 -90.2 Not available LinwoodOctober 28, 1923 34.9 -88.1 Not available EastportMarch 27, 1923 34.6 -89.8 Not available BarrMarch 31, 1911 34 -91.8 4.7 Tutwiler

Sect. 3 : 276
Mississippi Emergency Management Agency
Table 3.10.2Earthquakes Affecting Mississippi 2006 to 1812
Date Origin MagnitudeMaximum Intensity
Intensities Reported
in MS Counties AffectedSeptember 10, 2006 253 miles SSW of
Apalachicola, FL6 VI I, II, III, IV Alcorn, Bolivar, Covington,
Desoto, Forrest, George, Hancock, Harrison, Hinds, Jackson, Jones, Lauder-dale, Lee, Marion, Pearl River, Rankin, Scott, Walthall, Warren and Webster
June 2, 2005 10 miles NNW of Dyersburg, TN
4 III I Alcorn, Desoto, Tate, Tishomingo, Tunica and Yalobusha
May 1, 2005 15 miles WSW of Blytheville, AR
4.1 IV I, II, III Bolivar, Tate and Tunica
February 10, 2005 22 miles WSW of Blytheville, AR
4.1 V I, II, III Alcorn, Benton, Coahoma, Desoto, Itawamba, Jones, Lafayette, Lee, Marshall, Pontotoc, Prentiss, Tate, Tippah, Tishomingo, Tunica, and Union
November 7, 2004 25 miles SW of Tuscaloosa, AL
4 V I, II, III, IV Clay, Coahoma, Desoto, Lauderdale, Leake, Oktib-beha, Monroe, Newton, and Scott
April 29, 2003 8 miles ENE of Fort Payne, AL
4.6 V I, II, III, IV Alcorn, Chickasaw, Clay, Desoto, Hancock, Har-rison, Itawamba, Lafay-ette, Lauderdale, Lee, Lowndes, Monroe, Oktib-beha, Panola, Prentiss, Tate, Tishomingo, and Yalobusha
March 29, 1972 New Madrid Seismic Zone
Not available
IV I, II, III, IV Bolivar, Desoto, and Panola
1811-1812 New Madrid Seismic Zone
7.8 - 8.1 XI Not available
Affected counties as far as the Gulf Coast
Source: USGS and MDEQ Office of Geology
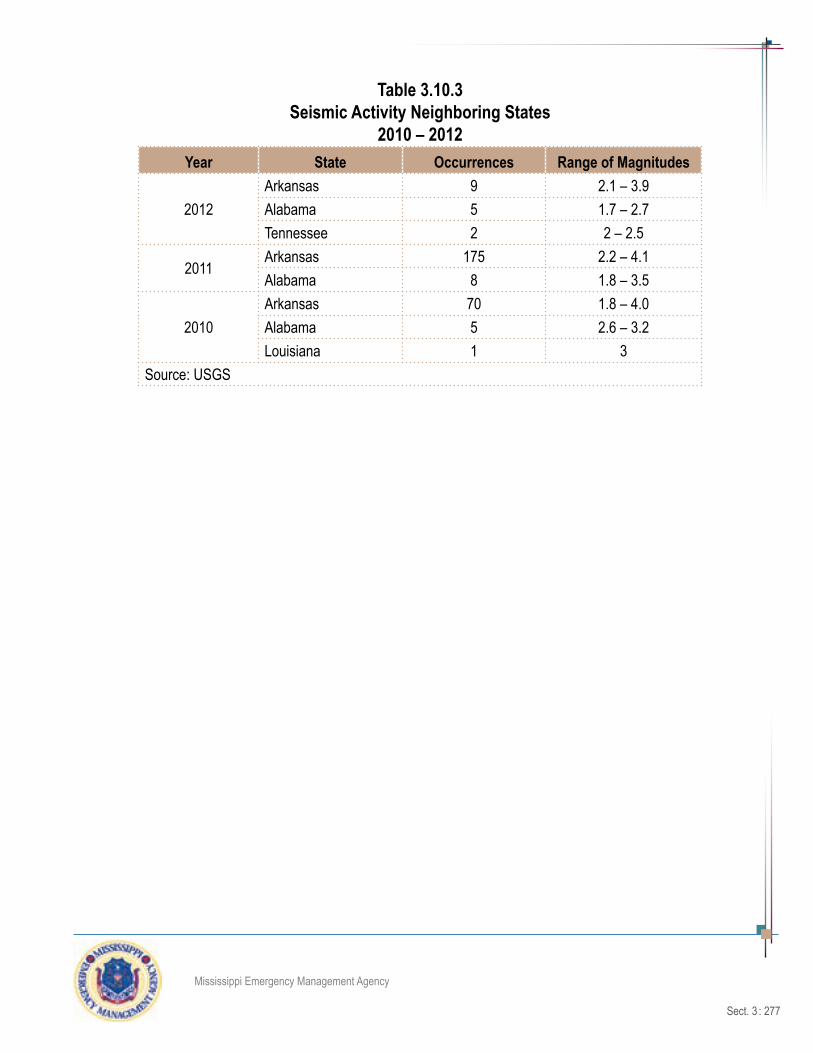
Sect. 3 : 277
Mississippi Emergency Management Agency
Table 3.10.3Seismic Activity Neighboring States
2010 – 2012Year State Occurrences Range of Magnitudes
2012Arkansas 9 2.1 – 3.9Alabama 5 1.7 – 2.7Tennessee 2 2 – 2.5
2011Arkansas 175 2.2 – 4.1Alabama 8 1.8 – 3.5
2010Arkansas 70 1.8 – 4.0Alabama 5 2.6 – 3.2Louisiana 1 3
Source: USGS

Sect. 3 : 278
Mississippi Emergency Management Agency
Figure 3.10.1Regional Earthquakes, Normal and Quaternary Faults, and Fault Areas

Sect. 3 : 279
Mississippi Emergency Management Agency
Summary of Previous EventsAlthough the number of earthquakes known to have been centered within Mississippi’s boundaries is small, the state has been affected by numerous shocks located in neighboring States. In 1811 and 1812, a series of great earthquakes near the New Madrid, Missouri area was felt in Mississippi as far south as the Gulf Coast. The New Madrid series caused the banks of the Mississippi River to cave in as far as Vicksburg, more than 300 miles from the epicentral region.
The earliest and strongest earthquake reported within Mississippi occurred on December 16, 1931, at about 9:36 p.m. at Charleston, in the area of maximum intensity, the walls and foundation of the agricultural high school cracked and several chimneys were thrown down (intensity VI - VII). At Belzoni, plaster fell and several chimneys were damaged (intensity VI). In Tillatoba, one chimney toppled and a vase was thrown to the floor (intensity VI). At Water Valley, several chimneys were damaged (intensity VI). The shock was perceptible over a 65,000 square mile area including the northern two-thirds of Mississippi and adjacent portions of Alabama, Arkansas, and Tennessee.
On February 1, 1955, an earthquake was strongly felt by many people along a 30 mile strip of the Missis-sippi Gulf Coast. In Gulfport, houses shook, windows and dishes rattled, and deep rumbling sounds were heard by many (intensity V). At Biloxi, several persons were alarmed and a rumbling noise was heard. Simi-lar effects were noted at Mississippi City and Pass Christian. The Tremor was reported by many persons at Bay St. Louis, where buildings creaked and loose objects and windows rattled.
In June 1967, two earthquakes occurred about 18 miles northeast of Greenville, Mississippi. The first, on June 4, measured magnitude 3.8 on the Richter Scale and was felt over approximately 25,000 square miles. The region affected by this tremor included the Northwest quadrant of Mississippi and parts of Arkan-sas, Louisiana, and Tennessee. A few instances of cracked plaster were reported in the epicentral region. One resident near the epicenter reported a ground crack 1/4 to 1/2 inch wide and 39 feet long in his lawn.
On June 29, a second earthquake occurred in the same region with a magnitude of 3.4. The felt region of this shock was limited to parts of Bolivar, Sunflower, and Washington Counties.
Another earthquake felt in Mississippi occurred on March 29, 1972. This shock, which was centered in the New Madrid, Missouri region, reached a peak intensity of IV in Mississippi at Hillhouse, Mineral Wells, and Pleasant Grove. Intensity I to III effects were noted at Horn Lake.

Sect. 3 : 280
Mississippi Emergency Management Agency
Potential Damages from Earthquakes
The potential for an earthquake to produce damage arises from many factors, such as condition and/or construction of the affected structures, soil characteristics, and earthquake characteristics. Earthquake characteristics include magnitude, peak ground acceleration, and distance from the epicenter. The epicen-ter of an earthquake is located on the ground surface directly above the focus, or the location, where the earthquake begins. In most cases, the damage incurred by an earthquake is greatest near the epicenter and decreases with distance. Peak Ground Acceleration (PGA) is the maximum acceleration of a particle during an earthquake. More simply, PGA is the measure of the strength of ground movement. An earth-quake’s PGA is greatest near its epicenter, which helps explain why earthquake damage is greatest near the epicenter. Figure 3.10.2 provides the PGA potential for a ten percent in 50-year rupture of the New Ma-drid Fault along with the frequency at which the ground will shake. Figures 3.10.3-a-b on the subsequent page provide spectral acceleration for one and five hertz rupture.
Figure 3.10.2Peak Ground Acceleration
Rupture of the New Madrid FaultTen Percent in 50 Years Probability
Acceleration measured as a percent of the acceleration due to gravity (g’s)

Sect. 3 : 281
Mississippi Emergency Management Agency
Seismic waves may also create other earthquake-related hazards such as liquefaction and slope failure. Liquefaction may occur where loose sand and silt that is saturated with water is shaken by earthquake energy. The mixture takes on the qualities of a liquid when shaken and can result in a lack of structural support and eventual failure of a structure built upon the liquid-like soil. In Mississippi, liquefaction is more likely to occur where there is a significant floodplain. The rivers with significant floodplains of concern in Mississippi include the Mississippi River, Yalobusha River, Yocona River, Tallahatchie River and Coldwater River. As shown in Table 3.10.4, counties were evaluated based on their location within the aforementioned floodplains and seismic zone. This data has not been updated since the last plan. The liquefaction poten-tial listed in the table references the HAZUS scenario for liquefaction potential in each county. Since the liquefaction data has not changed, the HAZUS scenario will remain the same.
Figure 3.10.3-aSpectral Acceleration at one HzRupture of the New Madrid Fault
Two Percent in 50 Years Probability
Figure 3.10.3-bSpectral Acceleration at five HzRupture of the New Madrid Fault
Two Percent in 50 Years ProbabilityHz: Hertz, or cycles per second (frequency of ground shaking)
SA measured in g’s
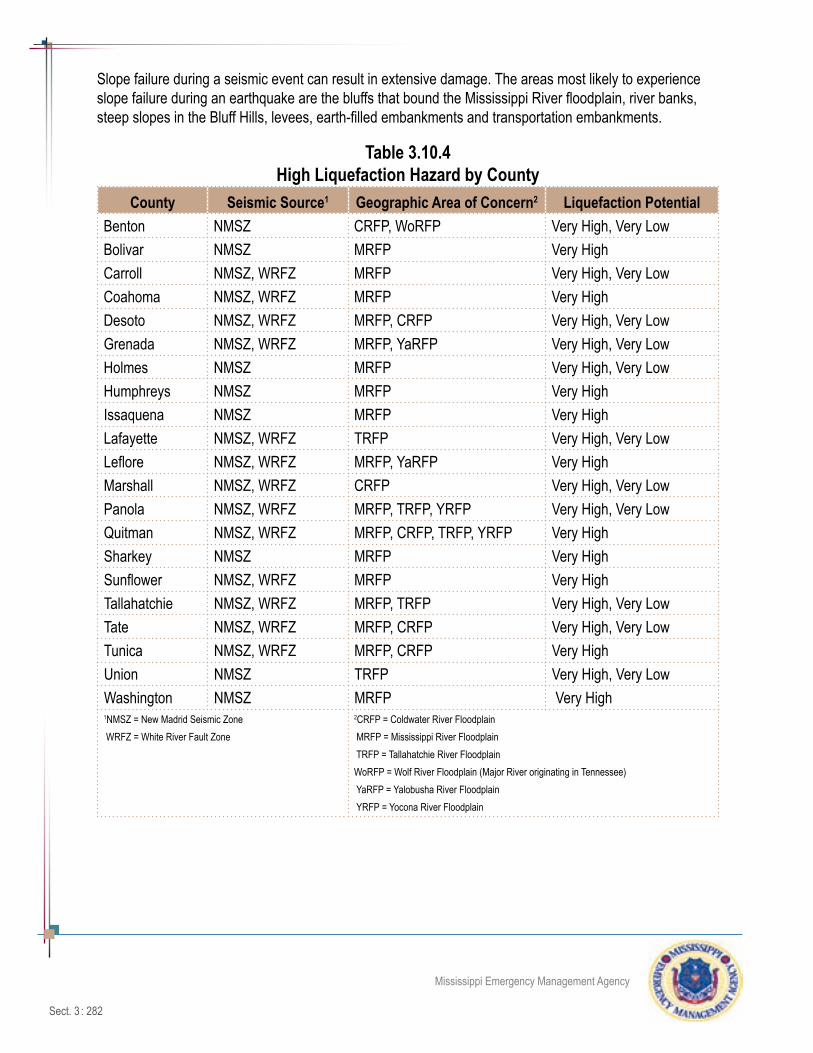
Sect. 3 : 282
Mississippi Emergency Management Agency
Slope failure during a seismic event can result in extensive damage. The areas most likely to experience slope failure during an earthquake are the bluffs that bound the Mississippi River floodplain, river banks, steep slopes in the Bluff Hills, levees, earth-filled embankments and transportation embankments.
Table 3.10.4High Liquefaction Hazard by County
County Seismic Source1 Geographic Area of Concern2 Liquefaction PotentialBenton NMSZ CRFP, WoRFP Very High, Very LowBolivar NMSZ MRFP Very HighCarroll NMSZ, WRFZ MRFP Very High, Very LowCoahoma NMSZ, WRFZ MRFP Very HighDesoto NMSZ, WRFZ MRFP, CRFP Very High, Very LowGrenada NMSZ, WRFZ MRFP, YaRFP Very High, Very LowHolmes NMSZ MRFP Very High, Very LowHumphreys NMSZ MRFP Very HighIssaquena NMSZ MRFP Very HighLafayette NMSZ, WRFZ TRFP Very High, Very LowLeflore NMSZ, WRFZ MRFP, YaRFP Very HighMarshall NMSZ, WRFZ CRFP Very High, Very LowPanola NMSZ, WRFZ MRFP, TRFP, YRFP Very High, Very LowQuitman NMSZ, WRFZ MRFP, CRFP, TRFP, YRFP Very HighSharkey NMSZ MRFP Very HighSunflower NMSZ, WRFZ MRFP Very HighTallahatchie NMSZ, WRFZ MRFP, TRFP Very High, Very LowTate NMSZ, WRFZ MRFP, CRFP Very High, Very LowTunica NMSZ, WRFZ MRFP, CRFP Very HighUnion NMSZ TRFP Very High, Very LowWashington NMSZ MRFP Very High1NMSZ = New Madrid Seismic Zone WRFZ = White River Fault Zone
2CRFP = Coldwater River Floodplain MRFP = Mississippi River Floodplain TRFP = Tallahatchie River FloodplainWoRFP = Wolf River Floodplain (Major River originating in Tennessee) YaRFP = Yalobusha River Floodplain YRFP = Yocona River Floodplain

Sect. 3 : 283
Mississippi Emergency Management Agency
Earthquake Effects on Dams
In reviewing potential impacts of earthquakes for the 2013 plan update, it was determined that vulnerability of dams should continue to be addressed. To assess this potential threat, the inventory of dams for MEMA Regions 1 and 3 are provided in Table 3.10.5 (the complete inventory of dams for all counties is provided in Section 3.3). These counties are located in areas that have felt impacts from previous tremors or are geographically susceptible to future impacts. Figure 3.10.4 overlays the significant and high hazard dams with the historic seismic recordings.
Table 3.10.5Dam Inventory in Relation to Earthquake Prone Counties
County Significant High Low Total County Significant High Low Total
MEMA Region 1 MEMA Region 3Coahoma - - 6 6 Attala - - 56 56Desoto 1 19 101 121 Bolivar - 1 25 26Grenada - 2 21 23 Carroll 4 21 80 105Panola 2 8 60 70 Holmes 2 3 56 61Quitman - - 2 2 Humphreys - - 63 63Tallahatchie 5 8 34 47 Leflore - - 10 10Tate 1 2 46 49 Montgomery 2 - 32 34Tunica - - 13 13 Sunflower - - 28 28Yalobusha 3 7 39 49 Washington - - 31 31
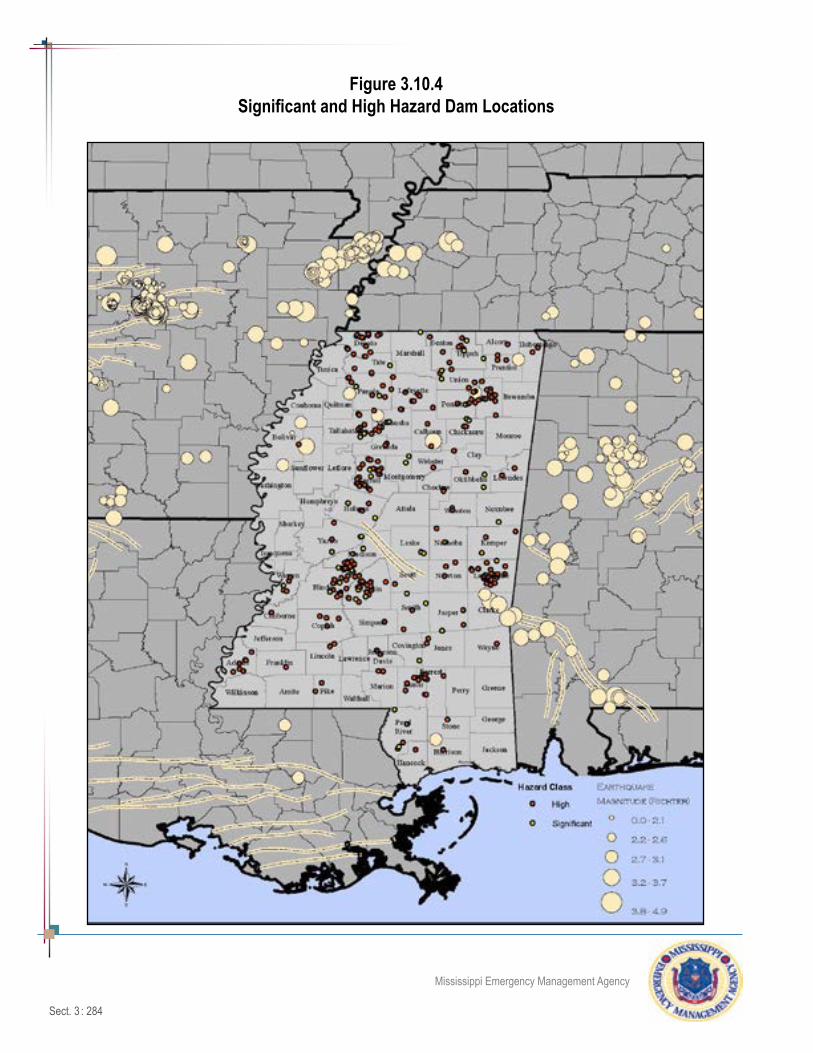
Sect. 3 : 284
Mississippi Emergency Management Agency
Figure 3.10.4Significant and High Hazard Dam Locations
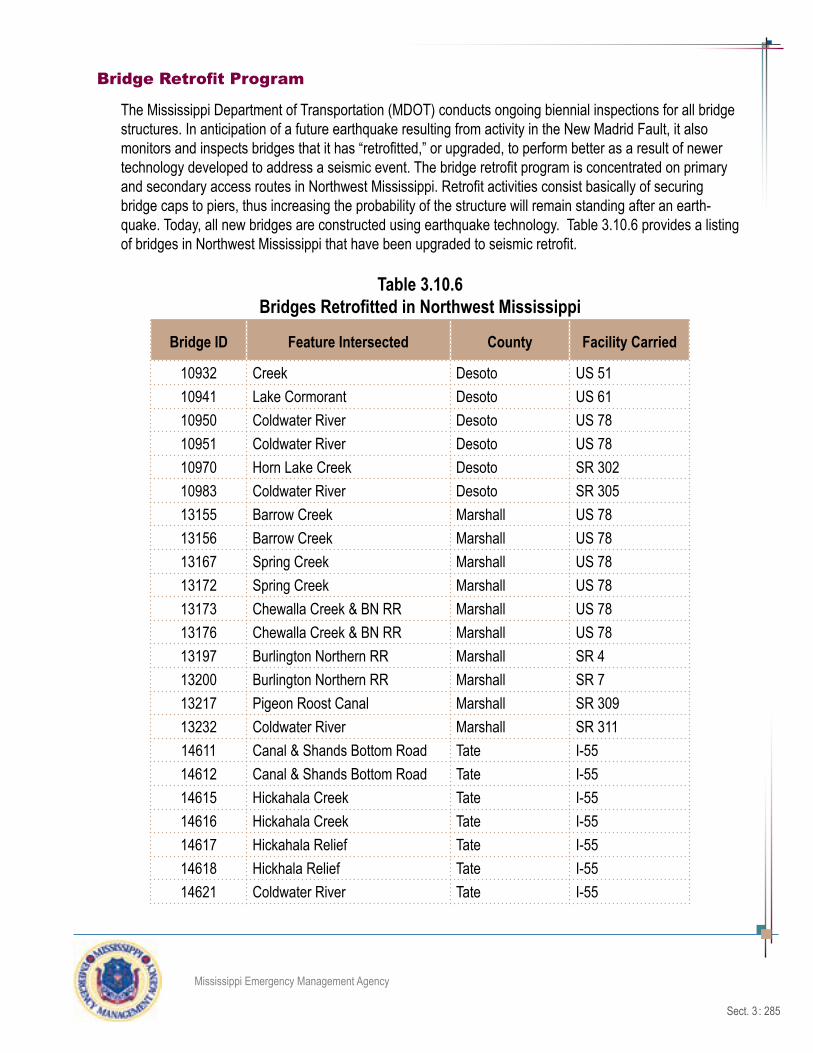
Sect. 3 : 285
Mississippi Emergency Management Agency
Bridge Retrofit Program
The Mississippi Department of Transportation (MDOT) conducts ongoing biennial inspections for all bridge structures. In anticipation of a future earthquake resulting from activity in the New Madrid Fault, it also monitors and inspects bridges that it has “retrofitted,” or upgraded, to perform better as a result of newer technology developed to address a seismic event. The bridge retrofit program is concentrated on primary and secondary access routes in Northwest Mississippi. Retrofit activities consist basically of securing bridge caps to piers, thus increasing the probability of the structure will remain standing after an earth-quake. Today, all new bridges are constructed using earthquake technology. Table 3.10.6 provides a listing of bridges in Northwest Mississippi that have been upgraded to seismic retrofit.
Table 3.10.6 Bridges Retrofitted in Northwest Mississippi
Bridge ID Feature Intersected County Facility Carried
10932 Creek Desoto US 5110941 Lake Cormorant Desoto US 6110950 Coldwater River Desoto US 7810951 Coldwater River Desoto US 7810970 Horn Lake Creek Desoto SR 30210983 Coldwater River Desoto SR 30513155 Barrow Creek Marshall US 7813156 Barrow Creek Marshall US 7813167 Spring Creek Marshall US 7813172 Spring Creek Marshall US 7813173 Chewalla Creek & BN RR Marshall US 7813176 Chewalla Creek & BN RR Marshall US 7813197 Burlington Northern RR Marshall SR 413200 Burlington Northern RR Marshall SR 713217 Pigeon Roost Canal Marshall SR 30913232 Coldwater River Marshall SR 31114611 Canal & Shands Bottom Road Tate I-5514612 Canal & Shands Bottom Road Tate I-5514615 Hickahala Creek Tate I-5514616 Hickahala Creek Tate I-5514617 Hickahala Relief Tate I-5514618 Hickhala Relief Tate I-5514621 Coldwater River Tate I-55

Sect. 3 : 286
Mississippi Emergency Management Agency
Table 3.10.6 Bridges Retrofitted in Northwest Mississippi
Bridge ID Feature Intersected County Facility Carried
14622 Coldwater River Tate I-5514631 Coldwater River Tate SR 314633 Arkabutla Canal Tate SR 313634 CNIC RR Tate SR 315413 Johnson Creek Desoto US 61
Probability of Future Events
The Central U.S. does not have as many earthquakes as the Western U.S. As a result, statistically valid data are not yet available for determining probabilities of future earthquake events in this region. The USGS has stated that there are marked differences in determining probabilities of future earthquakes in California as opposed to along the New Madrid Seismic Zone. On the west coast, locations of future earthquakes can be anticipated based on measurements of land deformation. Such predictions are much more difficult with earthquakes along the New Madrid. The New Madrid Fault Zone generates very little surface deformation over time; therefore, as seismic events occur along the New Madrid, data are collected and probabilities can be calculated. According to a study by the Center for Earthquake Research and Information (CERI) at the University of Memphis in 2002, the probability of a repeat of the 1811-1812 earthquakes in a 50-year time period is 7-10%. In the same study, the probability of a magnitude 6.0 or greater earthquake within a 50-year time period was estimated to be 25-40%.
Local Plan Risk Assessment SummaryBelow is a summary of the risk classification identified in the individual local mitigation plans by MEMA Region.
MEMA Region Low Medium High MEMA Region Low Medium High1 - 2 7 6 - - 12 5 6 - 7 9 - -3 5 6 1 8 1 - -4 5 - 4 9 7 - 15 30 - -

Sect. 3 : 287
Mississippi Emergency Management Agency
Vulnerability Assessment
Impact of Earthquakes on the Central USA - 2008
Impact of Earthquakes on the Central USA was funded by FEMA through a grant from the U.S. Army Corp of Engineers. This planning project brought together regional and local experts and a Scenario Develop-ment Workgroup to select scenarios intended to provide credible worst case impacts for individual states who participated in this study.
The data presented below was extracted as presented in the study and focuses on the results for Mississippi. The table, figure and appendix references are those from the study. A copy of the full study can be found at www.cusec.org/documents/aar/NMSZ_CAT_PLANNING_SCENARIO.pdf.
Executive Summary
The region of potential impact due to earthquake activity in the New Madrid Seismic Zone (NMSZ) is comprised of eight states: Alabama, Arkansas, Illinois, Indiana, Kentucky, Mississippi, Missouri and Tennes-see. Moreover, the Wabash Valley Seismic Zone (WVSZ) in southern Illinois and southeast Indiana and the East Tennessee Seismic Zone in eastern Tennessee and northeastern Alabama constitute significant risk of moderate-to-severe earthquakes throughout the central region of the USA. The investigation summarized in this report includes earthquake impact assessment scenarios completed using HAZUS-MH MR2 for several potential earthquake scenarios affecting the aforementioned eight-state region. The NMSZ includes eight scenarios - one for each state - whilst the WVSZ scenario in Indiana and the ETSZ scenario in Alabama complete the suite of ten total scenarios. These ten scenarios are designed to provide scientifically credible, worst case damage and loss estimates for the purposes of emergency planning, response and recovery.
The earthquake impact assessments presented in this report employ an analysis methodology comprising three major components; namely hazard, inventory and fragility (or vulnerability). The hazard characterizes not only the shaking of the ground but also the consequential transient and permanent deformation of the ground due to strong ground shaking. The inventory comprises all assets in a specified region, including the built environment and population data. Fragility or vulnerability functions relate the severity of shaking to the likelihood of reaching or exceeding damage states (light, moderate, extensive and near-collapse, for example). Social impact models are also included in the current assessment methodology and employ infrastructure damage results to estimate the effects on populations subjected to the earthquake. Whereas the modeling software used (HAZUS-MH MR2, FEMA-NIBS, 2006) provides default values for all of the above, most of these default values were replaced by components of traceable provenance and higher reli-ability than the default data, as described below.
The hazard employed in this investigation includes ground shaking for three seismic zones and various events within those zones. The NMSZ consists of three fault segments: the northeast segment, the reelfoot thrust or central segment, and the southwest segment. Each segment comprises a deterministic, magni-tude 7.7 (Mw7.7) earthquake caused by a rupture over the entire length of the segment. The employed magnitude was provided by US Geological Survey (USGS). The NMSZ represents the first of three hazard

Sect. 3 : 288
Mississippi Emergency Management Agency
events utilized in this report. Two deterministic events are also included, namely a magnitude Mw7.1 in the Wabash Valley Seismic Zone (WVSZ) and a magnitude Mw5.9 in the East Tennessee Seismic Zone (ETSZ) earthquakes. Permanent ground deformation is characterized by a liquefaction susceptibility map that provides data for part of the eight states. Full liquefaction susceptibility maps for the entire region are still under development and will be utilized in subsequent phases of the current project.
Inventory is enhanced through the use of the Homeland Security Infrastructure Program (HSIP) 2007 Gold Dataset (NGA Office of America, 2007). This dataset contains various types of critical infrastructure that are key inventory components for earthquake impact assessment. Transportation and utility facility inventories are improved while regional natural gas and oil pipelines are added to the inventory, alongside some high potential loss facility inventories. Additional essential facilities data were used for the state of Illinois via another impact assessment project at the Mid-America Earthquake Center, funded by FEMA and the Illinois Emergency Management Agency. Existing HAZUSMH MR2 fragility functions are utilized in this study and default values are used to determine damage likelihoods for all infrastructure components.
The results indicate that the state of Tennessee incurs the highest level of damage and social impacts. Over 250,000 buildings are moderately or more severely damaged, over 260,000 people are displaced and well over 60,000 casualties (injuries and fatalities) are expected. Total direct economic losses surpass $56 billion. The state of Missouri also incurs substantial damage and loss, though estimates are less than those in Tennessee. Well over 80,000 buildings are damaged leaving more than 120,000 people displaced and causing over 15,000 casualties. Total direct economic losses in Missouri reach nearly $40 billion. Kentucky and Illinois also incur significant losses with total direct economic losses reaching approximately $45 and $35 billion, respectively. The state of Arkansas incurs nearly $19 billion in direct economic loss while the state of Mississippi incurs $9.5 billion in direct economic losses. States such as Indiana and Alabama experience limited damage and loss from NMSZ events with approximately $1.5 and $1.0 billion, respec-tively. Noting that experience confirms that the indirect economic loss due to business interpretation and loss of market share, amongst other features, is at least as high if not much higher than the direct economic losses, the total economic impact of a series of NMSZ earthquakes is likely to constitute by far the highest economic loss due to a natural disaster in the USA.
The contents of this report provide the various assumptions used to arrive at the impact estimates, detailed background to the above figures, and a breakdown of the figures per sector at the county and state levels. The main body of the report gives state-level impact assessments, whilst the Appendices give earthquake impact modeling results at the county level. The results are designed to provide emergency managers and agencies with information required to establish response plans based on likely impacts of plausible earth-quakes in the central USA.
For the 2013 plan update of this section, the results of the Earthquake Impact Assessment and Social Impact and Direct Economic Loss data for Mississippi are extracted from this report and inserted as written below. The study used HAZUS-MH MR2 for modeling and best available data and can be found at www.cusec.org/plans-a-programs/multi-state-planning.html.

Sect. 3 : 289
Mississippi Emergency Management Agency
Results of Earthquake Impact Assessment
Mississippi New Madrid Seismic Zone ScenarioThe NMSZ event on the southwest segment of the fault generates intense shaking in Mississippi’s northern counties. As a result, 25 counties are identified as critical and most of the damage incurred by the state of Mississippi is expected to occur in this set of counties. These 25 critical counties are highlighted in Figure 16 and are listed below:
• Alcorn• Benton• Bolivar• Calhoun• Chickasaw
• Coahoma• Desoto • Grenada• Itawamba• Lafayette
• Lee • Marshall• Monroe• Panola• Pontotoc
• Prentiss• Quitman• Sunflower• Tallahatchie• Tate
• Tippah• Tishomingo• Tunica• Union• Yalobusha
Buildings in Mississippi are expected to incur moderate damage in the northern portion of the state, with limited cases of complete damage which are limited to the critical counties. There are 7,300 buildings that are estimated to incur complete damage, all of which are in the 25 critical counties. Approximately 35,000 of the 39,000 moderate and severe damage cases occur in the critical counties. Table 43 illustrates the distribution of building damage by occupancy type. Nearly all complete and moderate/severe damage is experienced by residential construction, leaving 45,000 of the one million residential structures in Missis-sippi damaged.
As with many other NMSZ states, wood frame buildings and mobile homes are the most common structural systems. What is uncommon, however, is the small percentage of building inventory belonging to URMs. In Mississippi, approximately 5% of the total building inventory is URM construction. Nearly half of all complete damage occurs in wood frame buildings even though only 25% of moderate damage is incurred by this type of construction. Approximately 60% of all moderate damage is attributed to mobile homes, as shown in Table 44. It is also relevant to note that while steel, concrete and precast (concrete) structures are a much smaller portion of the building stock in Mississippi, approximately 15% of each of these building types experiences at least moderate damage, while only 1.4% of all wood frame buildings incurs at least moderate damage.
Table 43: NMSZ Event Building Damage by Occupancy Type for the State of Mississippi
General Occupancy Type Damage
General OccupancyType Total No. Buildings
Moderate toSevere Damage Complete Damage
Single FamilyOther ResidentialCommercialIndustrialOther
793,953212,185
8,0621,6571,478
11,34326,741
705466127
3,8813,094
19011223
Total 1,017,335 39,382 7,300

Sect. 3 : 290
Mississippi Emergency Management Agency
Table 44: NMSZ Event Building Damage by Building Type for the State of Mississippi
Building Damage by Building Type
Building Type None Slight Moderate Extensive CompleteWoodSteelConcretePrecastReinforced MasonryUnreinforced MasonryMobile Home
703,5682,512
906955494
44,187133,149
50,80729710210439
6,10427,429
7,09229684
11336
3,55316,731
189269637821
1,5319,326
3,335181304012
7642,938
Total 885,771 84,882 27,905 11,477 7,300
The northernmost counties in Mississippi are greatly affected by damage and functional losses to essential facilities. Over 100 schools experience at least moderate damage and over 150 are not functioning the day after the earthquake, as shown in Table 45. Nearly all of these damaged schools are located in Desoto, Tunica, Tate, Marshall and Benton Counties. Additionally, Lafayette, Union, Tippah, Alcorn, and Prentiss Counties experience substantial functional loss to schools immediately after the earthquake. There are 81 at least moderately damaged fire stations and nearly 130 not functioning the day after the earthquake. Hospitals in northwest Mississippi are not functioning as well, with 34 facilities in the critical counties along with Leflore, Montgomery, Webster, Lowndes and Oktibbeha Counties. Not only will this region be without medical care services for those injured by the earthquake, but care for current patients will likely require transport to fully functioning facilities outside the critical counties.
Transportation lifelines experience damage primarily in northwestern Mississippi. Table 46 illustrates that over 70 highway bridges are damaged and 65 are not functioning the day after the earthquake. Most of these non-functioning bridges are in Desoto, Tunica, Tate and Marshall Counties. Five airports in northwest Mississippi incur at least moderate damage, though they are expected to remain fully functional. In some cases damage to structures may not affect functionality of the facility. Using airports as an example, some portion of the facility may be damaged, though enough of the facility’s structure remains undamaged so that the facility can remain operational, despite some damage to one portion of the facility.

Sect. 3 : 291
Mississippi Emergency Management Agency
Table 45: NMSZ Event Essential Facilities Damage for the State of Mississippi
Essential Facilities Damage & Functionality
Essential FacilityType
Total No.Facilities
At Least ModerateDamage
(Damage >50%)
CompleteDamage
(Damage >50%)Functionality>50% at Day 1
HospitalsSchoolsEOCsPolice StationsFire Stations
1231,281
37365984
11110
13081
210023
891,130
35322856
Table 46: NMSZ Event Highway Bridge Damage for the State of Mississippi
Highway Bridge Damage Assessments
Total No.Of Bridges
At Least ModerateDamage
(Damage >50%)
CompleteDamage
(Damage >50%)Functionality>50% at Day 1
25 Critical CountiesRemaining Counties
5,04311,893
730
00
4,97811,893
Total State 16,936 73 0 16,871
Table 47: NMSZ Event Communication Facilities Damage for the State of Mississippi
Communication Damage Assessments
Total No.Of
Communication Facilities
At Least ModerateDamage
(Damage >50%)
CompleteDamage
(Damage >50%)Functionality>50% at Day 1
25 Critical CountiesRemaining Counties
2,5536,663
2900
00
2,5536,663
Total State 9,216 290 0 9,216

Sect. 3 : 292
Mississippi Emergency Management Agency
Utility lifelines experience substantial losses in the critical counties, especially in the northwestern-most critical counties. Damage to communication facilities is shown in Table 47, which illustrates that nearly 300 communication facilities, all in Desoto and Tate Counties, are at least moderately damaged. Damage to these facilities is not severe enough to cause a substantial loss of functionality, however. There are nearly 300 waste water facilities and 48 electric power facilities that are not operational immediately following the earthquake. Most of these facilities are located in Desoto, Tate, Tunica and the surrounding counties.
There are approximately one million households, or residences, in the state of Mississippi and nearly 42,000 of those are without potable water the day after the earthquake. In addition, 33,000 are without electricity. Only 2,000 households have potable water service restored after a week, though 26,000 have electricity restored in that same period of time. A lack of potable water service for an extended period of time, as shown in Table 48, may force some families to leave their homes, even if the home is not signifi-cantly damaged. For more information on direct damage and functional losses in the state of Mississippi, please refer to Appendix V for detailed assessment results and to Appendix VIII for damage and functional-ity maps.
Table 48: NMSZ Event Utility Service Interruptions for the State of Mississippi
Utility Service Interruptions Number of Households without Service
No. Households Day 1 Day 3 Day 7 Day 30 Day 90
Potable WaterElectric Power
1,046,43441,79032,601
40,25618,416
39,7826,452
28,7491,276
044
Social Impact and Direct Economic Loss
This section provides social impacts and direct economic losses for Mississippi from the scenario de-veloped in the New Madrid Seismic Zone Catastrophic Event Planning project. Induced damage is also included in this section and is quantified by various types of debris resulting from infrastructure damage. Social impacts include displaced residents, temporary shelter population, various food, medical and hous-ing requirements for sheltered populations and casualties. Lastly, direct economic losses include estimates of building, transportation and utility losses plus building loss ratios.
Mississippi New Madrid Seismic Zone Scenario
Damage to infrastructure in Mississippi creates two million tons of debris. The majority of this debris, 1.2 million tons, is steel and concrete, while the remaining 0.8 tons is brick, wood and buildings contents. A total of 80,000 truckloads with a 25-ton capacity truck are required to remove all the debris generated by this southwest segment rupture.
Tens of thousands of people are forced to leave their homes due to structural damage. Approximately 21,000 people are displaced with nearly all of those people residing in the critical counties. Nearly 5,600 of those displaced seek public shelter, as shown in Table 82. To care for this sheltered population, 2.7 million
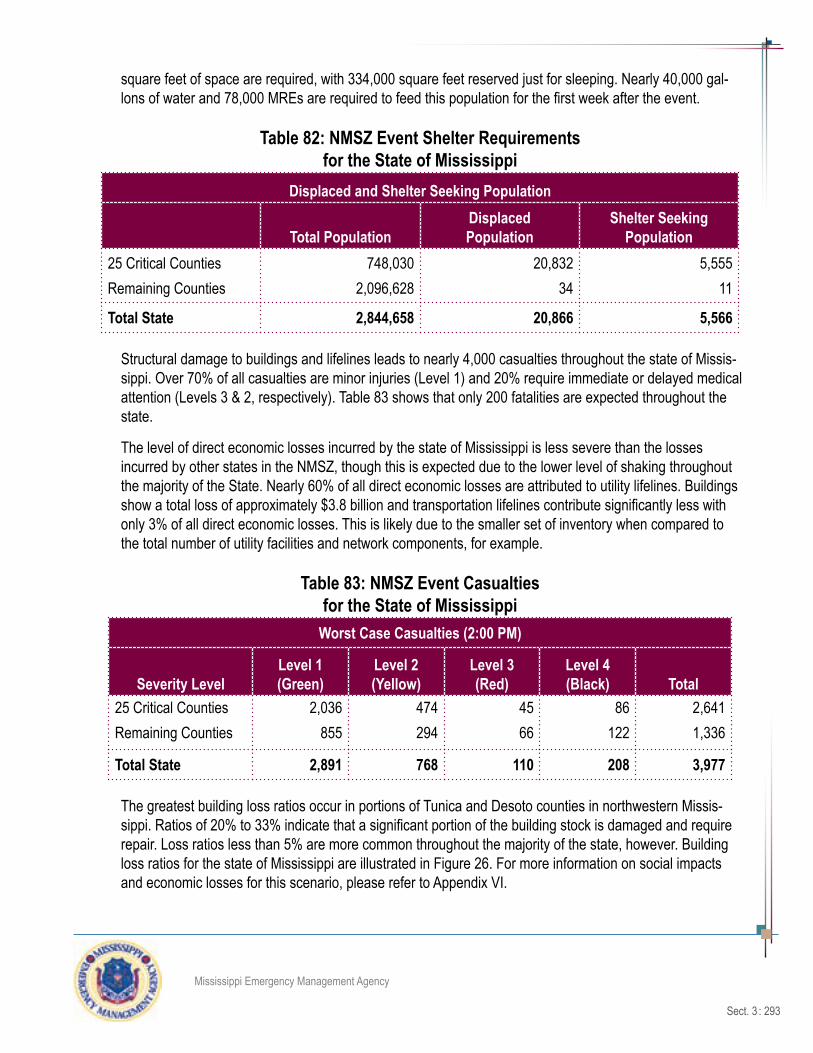
Sect. 3 : 293
Mississippi Emergency Management Agency
square feet of space are required, with 334,000 square feet reserved just for sleeping. Nearly 40,000 gal-lons of water and 78,000 MREs are required to feed this population for the first week after the event.
Table 82: NMSZ Event Shelter Requirements for the State of Mississippi
Displaced and Shelter Seeking Population
Total PopulationDisplacedPopulation
Shelter SeekingPopulation
25 Critical CountiesRemaining Counties
748,0302,096,628
20,83234
5,55511
Total State 2,844,658 20,866 5,566
Structural damage to buildings and lifelines leads to nearly 4,000 casualties throughout the state of Missis-sippi. Over 70% of all casualties are minor injuries (Level 1) and 20% require immediate or delayed medical attention (Levels 3 & 2, respectively). Table 83 shows that only 200 fatalities are expected throughout the state.
The level of direct economic losses incurred by the state of Mississippi is less severe than the losses incurred by other states in the NMSZ, though this is expected due to the lower level of shaking throughout the majority of the State. Nearly 60% of all direct economic losses are attributed to utility lifelines. Buildings show a total loss of approximately $3.8 billion and transportation lifelines contribute significantly less with only 3% of all direct economic losses. This is likely due to the smaller set of inventory when compared to the total number of utility facilities and network components, for example.
Table 83: NMSZ Event Casualties for the State of Mississippi
Worst Case Casualties (2:00 PM)
Severity LevelLevel 1(Green)
Level 2(Yellow)
Level 3(Red)
Level 4(Black) Total
25 Critical CountiesRemaining Counties
2,036855
474294
4566
86122
2,6411,336
Total State 2,891 768 110 208 3,977
The greatest building loss ratios occur in portions of Tunica and Desoto counties in northwestern Missis-sippi. Ratios of 20% to 33% indicate that a significant portion of the building stock is damaged and require repair. Loss ratios less than 5% are more common throughout the majority of the state, however. Building loss ratios for the state of Mississippi are illustrated in Figure 26. For more information on social impacts and economic losses for this scenario, please refer to Appendix VI.

Sect. 3 : 294
Mississippi Emergency Management Agency
Table 84: NMSZ Event Total Direct Economic Losses for the State of MississippiTotal Direct Economic Losses
System Inventory Value Total Direct Economic LossBuildingsTransportationUtility
$1,131,314,000,000$69,176,250,000
$266,440,450,000
$3,769,990,000$279,730,000
$5,441,930,000Total $466,930,700,000 $9,491,650,000
Figure 26NMSZ Event Loss Ratio (% of Total Building Assets)
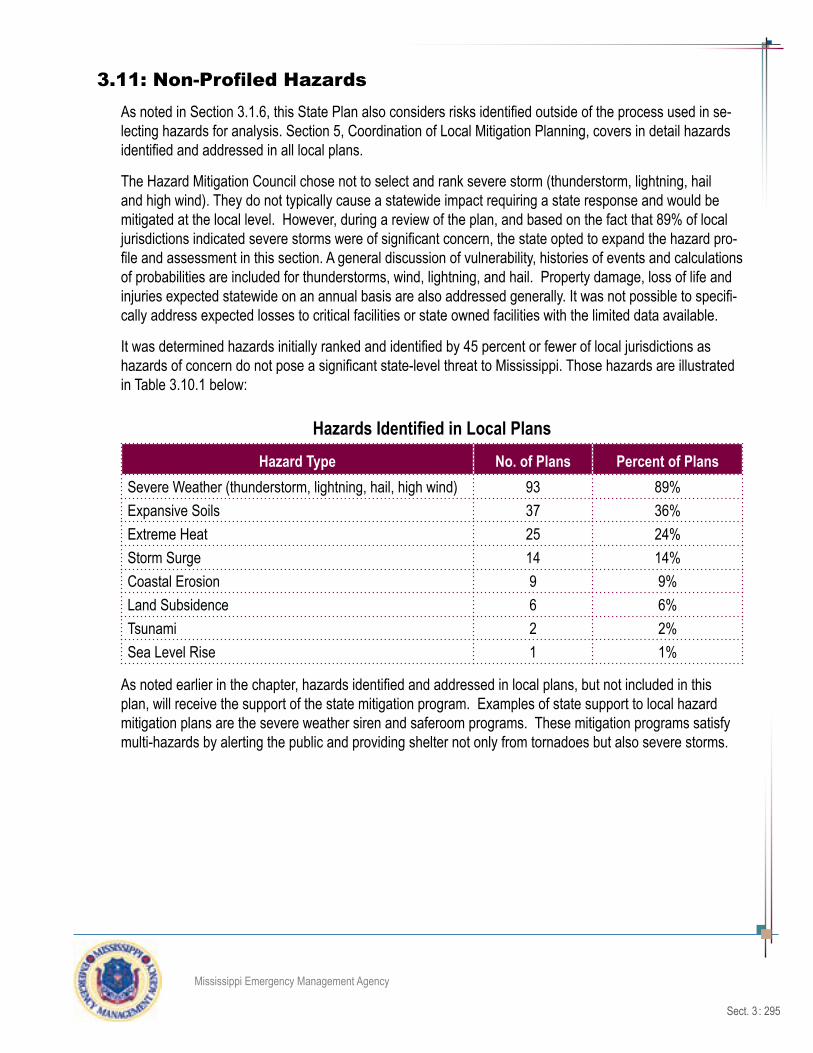
Sect. 3 : 295
Mississippi Emergency Management Agency
3.11: Non-Profiled HazardsAs noted in Section 3.1.6, this State Plan also considers risks identified outside of the process used in se-lecting hazards for analysis. Section 5, Coordination of Local Mitigation Planning, covers in detail hazards identified and addressed in all local plans.
The Hazard Mitigation Council chose not to select and rank severe storm (thunderstorm, lightning, hail and high wind). They do not typically cause a statewide impact requiring a state response and would be mitigated at the local level. However, during a review of the plan, and based on the fact that 89% of local jurisdictions indicated severe storms were of significant concern, the state opted to expand the hazard pro-file and assessment in this section. A general discussion of vulnerability, histories of events and calculations of probabilities are included for thunderstorms, wind, lightning, and hail. Property damage, loss of life and injuries expected statewide on an annual basis are also addressed generally. It was not possible to specifi-cally address expected losses to critical facilities or state owned facilities with the limited data available.
It was determined hazards initially ranked and identified by 45 percent or fewer of local jurisdictions as hazards of concern do not pose a significant state-level threat to Mississippi. Those hazards are illustrated in Table 3.10.1 below:
Hazards Identified in Local PlansHazard Type No. of Plans Percent of Plans
Severe Weather (thunderstorm, lightning, hail, high wind) 93 89%Expansive Soils 37 36%Extreme Heat 25 24%Storm Surge 14 14%Coastal Erosion 9 9%Land Subsidence 6 6%Tsunami 2 2%Sea Level Rise 1 1%
As noted earlier in the chapter, hazards identified and addressed in local plans, but not included in this plan, will receive the support of the state mitigation program. Examples of state support to local hazard mitigation plans are the severe weather siren and saferoom programs. These mitigation programs satisfy multi-hazards by alerting the public and providing shelter not only from tornadoes but also severe storms.

Sect. 3 : 296
Mississippi Emergency Management Agency
Severe Storms
Hazard Descriptions
Severe storms caused by cold fronts and daytime heating of the atmosphere can occur at any time in Mis-sissippi. These storms can produce tornadoes, high winds, lightning, hail and heavy rain, and this hazard section focuses on thunderstorm, high wind, hail and lightning.
Thunderstorms are defined by the National Weather Service (NWS) as a local storm (accompanied by lightning and thunder) produced by a cumulonimbus cloud, usually with gusty winds, heavy rain, and sometimes hail. Non-severe thunderstorms rarely have lifetimes over two hours. The NWS considers a thunderstorm severe if it produces hail at least three-quarters of an inch in diameter, has winds of 58 miles per hour or higher, or produces a tornado. Severe thunderstorms are distinguished by stronger winds and heavier rain than the normal thunderstorm. These severe storms have the potential to produce damaging hail, spawn tornadoes, and initiate flash flooding. Thunderstorms may occur singly, in clusters, or in lines. Some of the most severe weather occurs when a single thunderstorm affects one location for extended time.
High winds are a general term associated with sustained or gusting winds of significant strength to cause risk or damage to crops, vegetation, buildings, infrastructure, or transportation. High winds are typically associated with weather frontal systems often bringing other severe weather products, such as hail and lightning.
High winds can damage property by carrying projectile debris or breaking building envelopes as wind buffets weak points around doors, windows, and roof structures. Wind speed can increase as it passes between closely situated buildings through a Venturi effect increasing the potential for damage. Metal build-ings, tall structures, open fields, and swimming pools are at greater risk of lightning strikes.
The National Weather Service recognizes and defines three levels of wind events:
• Wind Advisory – Sustained winds of 30 mph or more or gusts of 45 mph or greater for a duration of one hour or longer.
• High Winds – Sustained winds of 40 mph or greater for at least one hour, or frequent gusts of wind of 58 mph or greater.
• Extreme Wind Warnings – Sustained winds of 115 mph or greater during a land-falling hurricane.
Winds and related damages can also be defined through the Beaufort Wind Scale as shown in Table 3.11.1.
Damaging wind events in the state of Mississippi typically occur in the form of tornadoes, straight-line wind events, and severe thunderstorms. Depending on the type of wind event, the damage sustained can range from extremely localized to widespread and from moderate to devastating. The potential impacts of a se-vere wind event in the state depend on the specific characteristics of the storm, but can include broken tree branches and uprooted trees; snapped power, cable, and telephone lines; damaged radio, television, and communication towers; damaged and torn-off roofs; blown out walls and garage doors; overturned vehicles; totally destroyed homes and businesses; and serious injury and loss of life. Downed trees and power lines can fall across roadways and block key access routes, as well as cause extended power outages to portions of the state.

Sect. 3 : 297
Mississippi Emergency Management Agency
Table 3.11.1Beaufort Wind Scale
Force Wind (Knots)
WMO Classification
Appearance of Wind Effects
On the Water On Land
0 Less than 1 Calm Sea surface smooth and mirror-like Calm, smoke rises vertically
1 1-3 Light Air Scaly ripples, no foam crests Smoke drift indicates wind direction, still wind vanes
2 4-6 Light Breeze Small wavelets, crests glassy, no breaking
Wind felt on face, leaves rustle, vanes begin to move
3 7-10 Gentle Breeze Large wavelets, crests begin to break, scattered whitecaps
Leaves and small twigs constantly moving, light flags extended
4 11-16 Moderate Breeze
Small waves 1-4 ft. becoming longer, numerous whitecaps
Dust, leaves, and loose paper lifted, small tree branches move
5 17-21 Fresh Breeze Moderate waves 4-8 ft. taking longer form, many whitecaps, some spray
Small trees in leaf begin to sway
6 22-27 Strong Breeze Larger waves 8-13 ft., whitecaps common, more spray
Larger tree branches mov-ing, whistling in wires
7 28-33 Near Gale Sea heaps up, waves 13-20 ft., white foam streaks off breakers
Whole trees moving, resis-tance felt walking against wind
8 34-40 Gale
Moderately high (13-20 ft.) waves of greater length, edges of crests begin to break into spindrift, foam blown in streaks
Whole trees in motion, re-sistance felt walking against wind
9 41-47 Strong GaleHigh waves (20 ft.), sea begins to roll, dense streaks of foam, spray may reduce visibility
Slight structural damage oc-curs, slate blows off roofs
10 48-55 Storm
Very high waves (20-30 ft.) with overhanging crests, sea white with densely blown foam, heavy rolling, lowered visibility
Seldom experienced on land, trees broken or uprooted, "considerable structural dam-age"
11 56-63 Violent StormExceptionally high (30-45 ft.) waves, foam patches cover sea, visibility more reduced
12 64+ HurricaneAir filled with foam, waves over 45 ft., sea completely white with driving spray, visibility greatly reduced
Source: NOAA Storm Prediction Center

Sect. 3 : 298
Mississippi Emergency Management Agency
Lightning is a visible electrical discharge produced by a thunderstorm. The discharge may occur within or between clouds, between the cloud and air, between a cloud and the ground or between the ground and a cloud. Lightning is created by static electrical energy and can generate enough electricity to set buildings on fire and electrocute people.
Lightning can strike anywhere and anytime thunder-storms are in the area. Almost all lightning occurs within 10 miles of the parent thunderstorm, but in rare cases it can strike as much as 50 miles away. There are two major categories of lightning:
• Cloud Flashes – Cloud flashes sometimes have visible channels extending out into the air around the storm but not striking the ground. This is further defined as cloud-to-air, cloud-to-cloud, or intra-cloud lightning.
• Ground Flashes – Lightning channels that travel from cloud-to-ground or ground-to-cloud. There are two categories of ground flashes: natural and artificially initiated/triggered. Artificially initiated lightning includes strikes to tall structures, airplanes, rockets, and towers on mountains. Artificially initiated lightning travels from ground to cloud while natural lightning travels from cloud to ground.
Hail is defined by the National Weather Service (NWS) as a showery precipitation in the form of irregular pellets or balls of ice more than 5 mm in diameter, falling from a cumulonimbus cloud. Studies of thunder-storms provided through the NWS indicate two conditions are required for hail to develop: sufficiently strong and persistent up-draft velocities and an accumulation of liquid water in a super-cooled state in the upper parts of the storm. Hailstones are formed as water vapor in the warm surface layer rises quickly into the cold upper atmosphere. The water vapor is frozen and begins to fall; as the water falls, it accumulates more water vapor. This cycle continues until there is too much weight for the updraft to support and the frozen water falls too quickly to the ground to melt along the way.
The size of hailstones is best determined by measuring their diameter with a ruler. In the absence of a ruler, hailstone size is often visually estimated by comparing its size to known objects. Table 3.11.2 provides a reference of commonly used objects for this purpose.

Sect. 3 : 299
Mississippi Emergency Management Agency
Table 3.11.2Hail Size Chart
Hail Diameter Size Description Hail Diameter Size Description
1/4" Pea 2" Hen Egg / Lime
1/2" Plain M&M 2 1/2" Tennis Ball
3/4" Penny 2 3/4" Baseball
7/8" Nickel 3" Teacup / Large Apple
1" (severe) Quarter 4" Softball
1 1/4" Half Dollar 4 1/2" Grapefruit
1 1/2" Ping Pong Ball / Walnut 4 3/4"- 5" Computer CD-DVD
1 3/4" Golf BallSource: National Weather Service
Location/Extent
Severe storms events are typically isolated to relatively small areas. Historical records indicate the entire state is vulnerable to severe thunderstorms. Trends in the data do not clearly indicate if portions of the state are more vulnerable than others. Based on available data, the Hazard Mitigation Council concluded every county is vulnerable.
To demonstrate the extent and location of severe wind and hail, Figures 3.11.1 and 3.11.2 are provided on the subsequent pages and reflect the location of past events (1950 to 2012); and Figure 3.11.3 provides lightning incidents from 1997 to 2010. A summary of the past occurrences and probability of future impacts is also presented.

Sect. 3 : 300
Mississippi Emergency Management Agency
Figure 3.11.1Severe Winds 1950 - 2012

Sect. 3 : 301
Mississippi Emergency Management Agency
Figure 3.11.2Hail 1950 - 2012
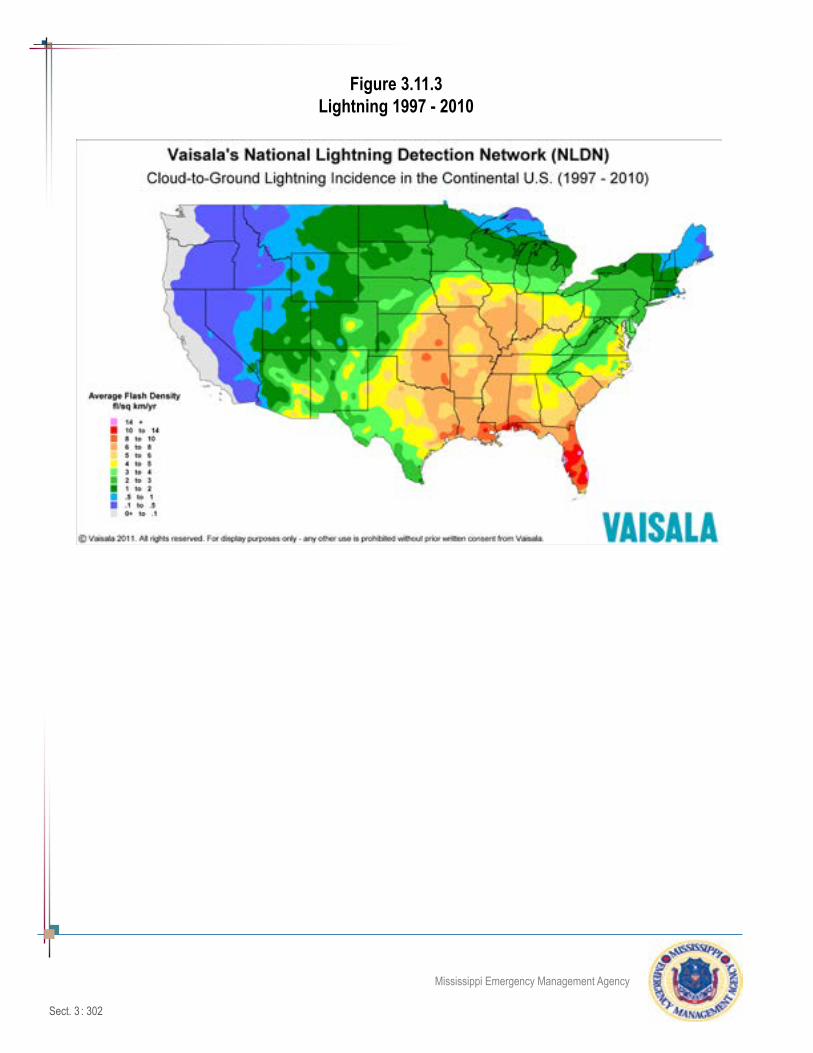
Sect. 3 : 302
Mississippi Emergency Management Agency
Figure 3.11.3Lightning 1997 - 2010

Sect. 3 : 303
Mississippi Emergency Management Agency
Past Occurrences
High Wind, Thunderstorm Wind and Strong Wind Events
Every year, damaging thunderstorm winds occur in all Mississippi counties and the number of events recorded in the NCDC database is staggering. To manage the data, events from the past 12 years are presented for high wind, thunderstorm wind, and strong wind (Table 3.11.3). It should be noted not all wind events are reported and the context should be considered when applying further analysis. The main point is each county is susceptible to winds and further analysis and mitigation activities should be identified on the local plan level.
Table 3.11.3High Wind Events 2000 - 2012
Year No. of EventsNo. of Counties
Affected Death InjuryProperty Damage
($)Crop Damage
($)2012 0 0 0 0 $0 $02011 8 8 0 0 $500,000 $485,0002010 0 0 0 0 $0 $02009 15 15 0 0 $490,000 $02008 23 23 0 0 $1,074,000 $02007 0 0 0 0 $0 $02006 0 0 0 0 $0 $02005 0 0 0 0 $0 $02004 0 0 0 0 $0 $02003 0 0 0 0 $0 $02002 20 19 0 0 $115,000 $02001 1 1 0 0 $5,000 $02000 15 15 1 1 $74,000 $0
Totals 82 1 1 $2,258,000 $485,000

Sect. 3 : 304
Mississippi Emergency Management Agency
Thunderstorm Wind Events 2000 - 2012
Year No. of EventsNo. of Counties
Affected Death InjuryProperty Damage
($)Crop Damage
($)2012 518 74 1 12 $6,437,000 $02011 697 81 4 1 $20,274,000 $356,0002010 489 74 0 0 $5,898,000 $106,0002009 469 77 2 6 $11,720,000 $2,303,0002008 203 74 0 5 $104,355,000 $9,698,0002007 450 78 0 $7,970,000 $480,0002006 333 73 0 10 $45,962,000 $3,0002005 411 75 1 7 $19,446,000 $1,280,0002004 420 78 1 9 $3,330,000 $02003 28 16 0 0 $1,200,000 $02002 414 75 0 0 $11,115,000 $02001 466 80 2 8 $31,352,000 $02000 520 3 9 $5,763,060 $0
Totals 5,418 14 67 $274,822,060 $14,226,000
Strong Wind Events 2000 - 2012
Year No. of EventsNo. of Counties
Affected Death InjuryProperty Damage
($)Crop Damage
($)2012 40 23 1 0 $1,066,000 $02011 21 15 0 0 $144,000 $02010 15 12 0 0 $127,000 $02009 31 27 0 0 $985,020 $02008 29 21 0 0 $1,036,000 $2,0002007 19 16 0 1 $179,011 $02006 15 12 0 0 $221,060 $02005 0 0 0 0 $0 $02004 3 3 0 0 $17,000 $02003 4 4 0 0 $165,000 $02002 0 0 0 0 $0 $02001 0 0 0 0 $0 $02000 0 0 0 0 $0 $0
Totals 177 1 1 $3,940,091 $2,000Source: NCDC

Sect. 3 : 305
Mississippi Emergency Management Agency
Lightning
Lightning is a major threat during a severe storm. It is very unpredictable, which increases the risk to individuals and property. In the United States, an average of 44 people are killed each year by lightning, although most lightning victims survive. People struck by lightning often report a variety of long-term, debili-tating symptoms, including memory loss, attention deficits, sleep disorders, numbness, dizziness, stiffness in joints, irritability, fatigue, weakness, muscle spasms, depression, and an inability to sit for long periods. Lightning never strikes the same place twice is a myth. In fact, lightning will strike several times in the same place in the course of one discharge.
According to Vaisala’s National Lightning Detection Indicator shown in Figure 3.11.3, Mississppi can expect an average range of 5 - 10 flash density per square mile.
Records found in the NCDC database (Table 3.11.4) indicate 16 reported deaths and 40 reported injuries in Mississippi were caused by lightning in the past 12 years (2000 to 2012). It should be noted not all light-ning events are reported, therefore the context should be considered when applying further analysis. The main point is each county is susceptible to lightning, and further analysis and mitigation activities should be identified on the local plan level. The table below provides a summary of the events from 2000 to 2012 and their impact.
Table 3.11.4Lightning Events 2000-2012
Year No. of Events
No. of Counties Affected Death Injury
Property Damage ($)
Crop Damage ($)
2012 26 14 0 1 $1,943,000 $02011 24 18 1 2 $1,403,000 $02010 17 13 0 2 $1,849,000 $02009 15 11 1 3 $254,000 $02008 24 17 1 1 $990,000 $7,0002007 13 12 0 0 $975,000 $02006 20 14 2 4 $1,080,000 $2,0002005 21 16 2 0 $4,696,000 $02004 12 11 1 3 $145,000 $02003 12 8 0 1 $388,000 $02002 16 12 2 0 $115,025 $02001 12 11 1 11 $350,000 $02000 4 4 1 0 $53,000 $0
Totals 216 12 28 $14,241,025 $9,000Source: NCDC

Sect. 3 : 306
Mississippi Emergency Management Agency
Damaging Hail
Many strong severe storms produce hail, with more frequent hailstorms occurring in the late spring and early summer. Large hail, plus the glass it may break, can injure people and animals. Hail can be smaller than a pea, as large as a softball, and very destructive to automobiles, glass surfaces (e.g. skylights and windows), roofs, plants, and crops. The size of hailstones is a direct result of the severity and size of the storm. The land area affected by individual hailstorms is not much smaller than a parent thunderstorm, an average of 15 miles in diameter around the center of a storm.
Most of the incidents reported hail between .75 and 1 inch in diameter. Thousands of hail incidents were reported since 1950 according to the NCDC and shown in Figure 3.11.2. It should be noted not all hail events are reported so the context should considered when applying further analysis. The main point is each county is susceptible to hail, and further anaylsis and mitigation activities should be identifed on the local plan level. A summary of the events from 2000 to 2012 as reported to the NCDC and their impacts is listed in Table 3.11.5.
Table 3.11.5Hail Events 2000 - 2012
Year No. of Events
No. of Counties Affected Death Injury Property Damage Crop Damage
2012 197 63 0 0 $812,050 $16,0502011 368 74 0 15 $3,050,000 $02010 290 67 0 0 $1,345,000 $50,0002009 323 76 0 0 $157,000 $4,0002008 469 78 0 0 $2,014,000 $02007 223 74 0 0 $321,025 $80,0002006 342 78 0 0 $17,768,000 $6,600,0002005 447 75 0 2 $29,743,000 $600,0002004 153 59 0 0 $41,075 $02003 363 76 0 0 $3,423,000 $02002 136 61 0 0 $230,044 $02001 211 61 0 0 $1,280,000 $02000 227 72 0 0 $439,000 $0
Totals 3,749 0 17 $60,623,194 $7,350,050Source: NCDC

Sect. 3 : 307
Mississippi Emergency Management Agency
Historical Event
Hail Event - March 18, 2013
A strong super cell produced golf ball-to-baseball-sized hail along a swath through the downtown and metropoli-tan areas of Jackson on March 18, 2013. The largest hailstone reached softball size, or 4.25 inches, and fell in the suburban Clinton area. The large hail from this super cell caused major roof damage, shattered windshields, dented tens of thousands of vehicles, and damaged sid-ing to numerous mobile homes in the Jackson metro area. Insurance companies considered many damaged vehicles totally destroyed. Damage to government property was estimated at $25 million. At least one injury occurred in the Pinehaven community near Clinton when a baseball-size hailstone caused head trauma.
The National Weather Service said a strong upper-level disturbance brought very cold temperatures aloft which, when combined with a very warm and moist surface environment, led to a very unstable atmosphere. Strong wind shear also aided in the threat of severe weather development. The combination of all factors primed the region for a risk of large hail and a small possibility of tornadoes. The resulting system produced strong thunder-storms, damaging straight-line winds, and hail as it contin-ued across southeast Arkansas, northeast Louisiana, and northwest Mississippi.
As this storm weakened another formed, causing dam-ages and injuries as it moved into northern Warren County then continued eastward into Jackson and surrounding areas causing extreme damages. A squall line in north-eastern Mississippi produced an outflow boundary moving to the southwest and served as a focus of increased thunderstorm and super cell development ahead of the storm moving into western Mississippi. Thunderstorms increased in intensity along the outflow boundary, with nu-merous reports of large hail continuing a swath down into southern Mississippi. The thunderstorms gradually moved out of the Pine Belt region late on the evening of the 18th.
March 18, 2013 Reported Hail Locations

Sect. 3 : 308
Mississippi Emergency Management Agency
Severe Storm Vulnerability DiscussionTypically, damage associated with these hazards includes structural fires, broken glass, dented automo-biles or siding, and personal injuries or even death. Wind damages typically include broken branches, uprooted trees, roofs blown off, walls blown down, small structures leveled, and in extreme cases, boats and airplanes being overturned.
People, buildings, and property are at risk from the effects of high wind and lightning. Buildings, automo-biles, and infrastructural components (such as electrical feed lines) can suffer damage from high wind and lightning; outdoor populations are vulnerable to injury or death from lightning. High winds can cause debris to strike people, animals, buildings and property, which in turn causes significant injuries, fatalities, and property damage.
Critical infrastructure associated with power transmission, telecommunications and road signage are vulnerable to hail. Manufactured homes are particularly susceptible to hail events due to construction types (vinyl siding, lesser gauge metal roofs). People and animals are also be impacted by hail if they are caught outdoors with no protection.
Although no specific areas of the state can be designated as having a higher risk of being affected by severe storms, there are a number of factors that contribute to a particular area’s vulnerability to damages. Certain characteristics of an area or of a structure, increase its resistance to damages due to high wind events, lightning and hail. Many of these factors are extremely specific to the particular location or the par-ticular structure in question. Areas of higher population can be expected to experience more damage from hail, whereas more rural areas might be more vulnerable to fire from lightning due to longer response time for fire suppression. For these reasons, the state of Mississippi feels it is important to include these hazards in local mitigation plans, as they are best able to be mitigated at that level.
When combining thunderstorm wind, lightning and hail damage to property, statewide on an annual aver-age basis, Mississippi can expect approximately $16.5 million in damage in any given year. Mississippi can also expect three deaths and eight injuries from these perils in any given year based on the periods of record analyzed.
According to the National Weather Service, Mississippi falls into the following national rankings for hail and wind events:
National Ranking 2007 2008 2009 2010 2011 2012
Hail 22nd 15th 14th 13th 14th 19th
Wind 10th 4th 9th 9th 9th 6th
Source: National Weather Service

Sect. 3 : 309
Mississippi Emergency Management Agency
Coastal/Beach Erosion
Hazard Description
As defined by NOAA, coastal erosion is a process whereby large storms, flooding, strong wave action, sea level rise, and human activities, such as inappropriate land use, alterations, and shore protection struc-tures, erodes the beaches and bluffs along the U.S. coasts. Erosion undermines and often destroys homes, businesses, and public infrastructure and can have long-term economic and social consequences.
In the United States, coastal erosion is responsible for approximately $500 million per year in coastal prop-erty loss, including damage to structures and loss of land. To mitigate coastal erosion, the federal govern-ment spent approximately $300 billion on beach nourishment and other shoreline erosion control measures and projects. Despite these efforts and according to NOAA scientists, it appears the new sand “often disappears rapidly, does not prevent erosion and remains vulnerable to loss from [storms].” Other experts estimate nourished beaches disappear two to 12 times faster than natural ones. (Source CBS News May 2009).
While coastal erosion affects all regions of the United States, erosion rates and potential impacts are highly localized. Average coastline recession rates of 25 feet per year are not uncommon on some barrier islands in the southeast. In a single event, severe storms can remove even wider beaches. In undeveloped areas, these high recession rates are not likely to cause significant concern, but in some heavily populated loca-tions, one or two feet of erosion may be considered catastrophic.
The Gulf of Mexico is impacted by the development of oil, gas and mineral resources. The Gulf accounts for over 95% of the U.S.’s outer continental shelf oil and gas production, and processes over two-thirds of the nation’s oil imports. Invasive species are a serious threat to native biota in many gulf coast ecosystems, and aquatic nuisance species pose severe economic problems; interfering with transportation, energy production, reservoir capacity and recreational uses. The effect of oil breaches on coastal erosion is deter-mined by how much oil reaches the coastal regions and how long it remains. Oiled plants can die, along with roots that bind and stabilize the soil, leading to erosion.
Location and Extent
The issue of beach erosion applies to three counties in Mississippi: Hancock, Harrison and Jackson. Each of these counties had comprehensive beach maintenance and protection programs in place for many years. These programs utilized locally budgeted funds and were occasionally supplemented with state and federal funds. Hurricane Katrina damaged many of the beaches as well as the beach protection facilities.
The Mississippi River is also susceptible to erosion. As Louisiana continues to experience erosion to it will increase erosion along the Mississippi River as the current land mass of Louisiana provides somewhat of a buffer to .
The United States Army Corps of Engineers completed an investigative report identifying major restoration and mitigation projects. This project received a supplemental appropriation for implementation and is being tracked as Mississippi Mitigation Action – Hurricane 6, USACOE Mississippi Coastal Improvements Pro-gram.
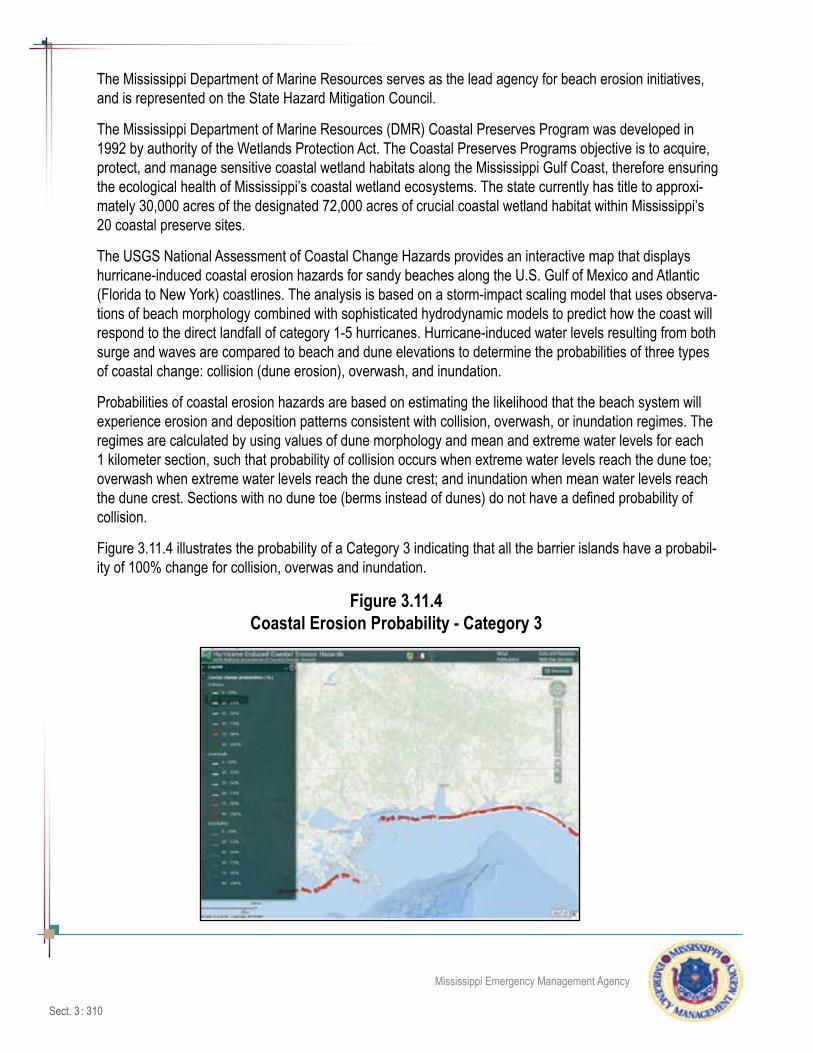
Sect. 3 : 310
Mississippi Emergency Management Agency
The Mississippi Department of Marine Resources serves as the lead agency for beach erosion initiatives, and is represented on the State Hazard Mitigation Council.
The Mississippi Department of Marine Resources (DMR) Coastal Preserves Program was developed in 1992 by authority of the Wetlands Protection Act. The Coastal Preserves Programs objective is to acquire, protect, and manage sensitive coastal wetland habitats along the Mississippi Gulf Coast, therefore ensuring the ecological health of Mississippi’s coastal wetland ecosystems. The state currently has title to approxi-mately 30,000 acres of the designated 72,000 acres of crucial coastal wetland habitat within Mississippi’s 20 coastal preserve sites.
The USGS National Assessment of Coastal Change Hazards provides an interactive map that displays hurricane-induced coastal erosion hazards for sandy beaches along the U.S. Gulf of Mexico and Atlantic (Florida to New York) coastlines. The analysis is based on a storm-impact scaling model that uses observa-tions of beach morphology combined with sophisticated hydrodynamic models to predict how the coast will respond to the direct landfall of category 1-5 hurricanes. Hurricane-induced water levels resulting from both surge and waves are compared to beach and dune elevations to determine the probabilities of three types of coastal change: collision (dune erosion), overwash, and inundation.
Probabilities of coastal erosion hazards are based on estimating the likelihood that the beach system will experience erosion and deposition patterns consistent with collision, overwash, or inundation regimes. The regimes are calculated by using values of dune morphology and mean and extreme water levels for each 1 kilometer section, such that probability of collision occurs when extreme water levels reach the dune toe; overwash when extreme water levels reach the dune crest; and inundation when mean water levels reach the dune crest. Sections with no dune toe (berms instead of dunes) do not have a defined probability of collision.
Figure 3.11.4 illustrates the probability of a Category 3 indicating that all the barrier islands have a probabil-ity of 100% change for collision, overwas and inundation.
Figure 3.11.4Coastal Erosion Probability - Category 3

Sect. 3 : 311
Mississippi Emergency Management Agency
3.12: Growth and Development Trends
Requirement §201.4(c)(2)(ii): [The State risk assessment shall include an] overview and analysis of the State’s vulnerability to the hazards described in this paragraph (c)(2), based on estimates provided in local risk assessments as well as the State risk assessment. The State shall de-scribe vulnerability in terms of the jurisdictions most threatened by the identified hazards, and most vulnerable to damage and loss associated with hazard events.
Update Requirement §201.4(d): Plan must be reviewed and revised to reflect changes in devel-opment.
As part of the plan update process, trends in growth and development were analyzed to determine how changing development and socioeconomic trends could influence loss and vulnerability especially in Mis-sissippi’s hazard-prone areas. Historic, estimated and projected population, population density, housing units and housing unit density were studied at the state, regional and county level. Specific counties and regions of the state that experienced significant changes are discussed in this section, as well as the long-term effects of Hurricane Katrina on population and housing units. A special section on social vulnerability is also included.
In many cases population and population density offer insight into vulnerabilities, particularly in areas subject to natural hazards with concentrated populations. Counties with the most assets, infrastructure and people are perceived as the most vulnerable to damage and loss; however some hazards, such as flooding, are more directly related to topography and elevation. It is important to analyze all factors when assessing vulnerability.
PopulationMississippi is a relatively sparsely populated state. According to the 2010 U. S. Census among the 50 states, Mississippi ranked 31st in population and housing density; 34th in population density; and 40th in the population growth rate between 2000 and 2010. The state has 46,906 square miles and a population of 2,967,297, according to the 2010 census. Historic population figures from the decennial census illus-trate Mississippi’s growth trends for the past six decades (see Table 3.12.1). Table 3.12.2 presents certain “quick facts” about the demographics of the state.
Table 3.12.1Mississippi’s Population Growth
Census Total Population Percent Change2010 2,967,297 4.00%2000 2,848,753 10.50%1990 2,575,475 2.18%1980 2,520,638 13.70%1970 2,216,994 1.79%1960 2,178,000 --

Sect. 3 : 312
Mississippi Emergency Management Agency
Table 3.12.2Mississippi Quick Facts
Population, 2012 estimate 2,984,926
Population, 2010 (April 1) estimates base 2,967,299
Population, percent change, April 1, 2010 to July 1, 2012 0.6%
Population, 2010 2,967,297
Persons per square mile, 2010 63.2
Number of Incorporated Cities, Towns and Villages 362
Number of Counties 82
Urban / Rural Population 49.3 / 50.65
Counties with a Population of 100,000 or Greater 4
Counties with a Population of 50,00 to 99,000 9
Counties with a Population of 10,001 to 49,000 58
Counties with a Population of 10,000 or less 10
Source: U. S. Bureau of Census
Between 2000 and 2010, 39 of Mississippi’s 82 counties gained in population and 13 of these gained by ten percent or more. This growth was concentrated primarily in three areas of the state (coastal-south, central and extreme north-west).
Mississippi’s ten most populous counties are listed in Table 3.12.3 and the ten least populous counties are listed in Table 3.12.4. Counties declining or growing in population are listed in Table 3.12.5; those growing or declining by the greatest numbers and percentages are listed in Tables 3.12.6 and illustrated in Figure 3.12.1. A demographic worksheet by county is provided in Appendix 7.3.12-A with complete information on all counties.

Sect. 3 : 313
Mississippi Emergency Management Agency
Table 3.12.3Ten Most Populous Counties
2010 Census
Ranking/County 2010 Population Ranking/County 2010 Population
1. Hinds 250,802 6. Lee 75,7552. Harrison 189,606 7. Lauderdale 78,1613. Jackson 131,420 8. Forrest 72,6064. Desoto 130,694 9. Jones 64,9615. Rankin 115,328 10. Lowndes 61,586Source: US Census Bureau
Table 3.12.4Ten Least Populous Counties
2010 Census
Ranking/County 2010 Population Ranking/County 2010 Population
1. Wilkinson 10,312 6. Tunica 9,227
2. Webster 10294 7. Franklin 8,448
3. Quitman 10,115 8. Benton 8,026
4. Choctaw 9,758 9. Sharkey 6,580
5. Jefferson 9,740 10. Issaquena 2,274Source: US Census Bureau
Forty-one counties experienced a population decline between 2000 and 2010 and 12 counties experienced double digit decline. The Delta region of the state, located in the western portion of the state and extending to within fifty miles of Memphis, TN, was most affected by declining populations.

Sect. 3 : 314
Mississippi Emergency Management Agency
Table 3.12.5Counties with the Greatest Population
Losses and Gains (Numerical) 2000 – 2010
CountyPopulation Loss
2000 – 2010 CountyPopulation Gain
2000 - 2010Washington -11,840 Desoto 54,053Bolivar -6,488 Rankin 26,290Leflore -5,630 Madison 20,529Hinds -5,515 Lamar 16,588Sunflower -4,919 Lafayette 8,607Coahoma -4,471 Jackson 8,248Harrison -2,496 Pearl River 7,213Holmes -2,411 Lee 7,155Claiborne -2,227 Oktibbeha 4,769Chickasaw -2,048 Stone 4,164Source: US Census Bureau Source: US Census Bureau
Table 3.12.6Counties with the Greatest Population Loss and Gain (Percent) 2000 – 2010
County % Change County % Change
Issaquena -38.20% Desoto 50.40%Sharkey -25.30% Lamar 42.50%Jefferson -20.70% Stone 30.60%Claiborne -18.80% Madison 27.50%Washington -18.80% Rankin 22.80%Quitman -18.70% Lafayette 22.20%Humphreys -16.30% George 17.90%Bolivar -16.00% Tunica 16.80%Jefferson Davis -9.45% Pear River 14.80%Jefferson -8.95 Tate 13.90%Source: US Census Bureau
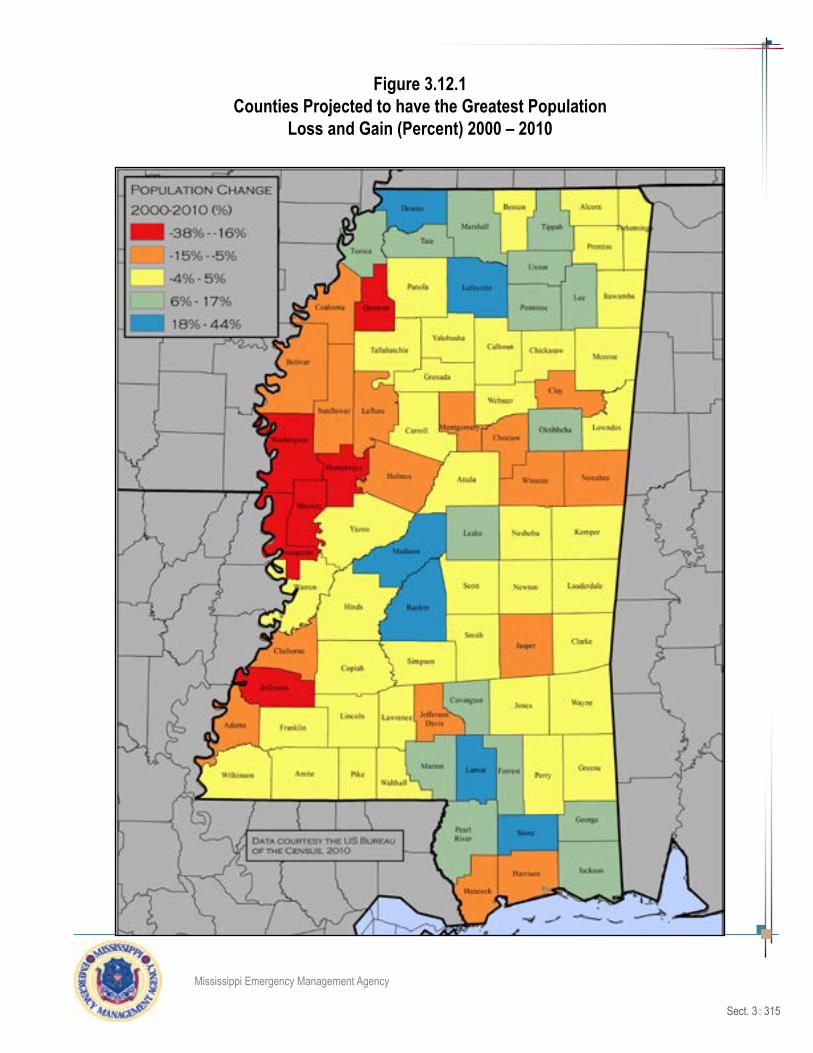
Sect. 3 : 315
Mississippi Emergency Management Agency
Figure 3.12.1Counties Projected to have the Greatest Population
Loss and Gain (Percent) 2000 – 2010
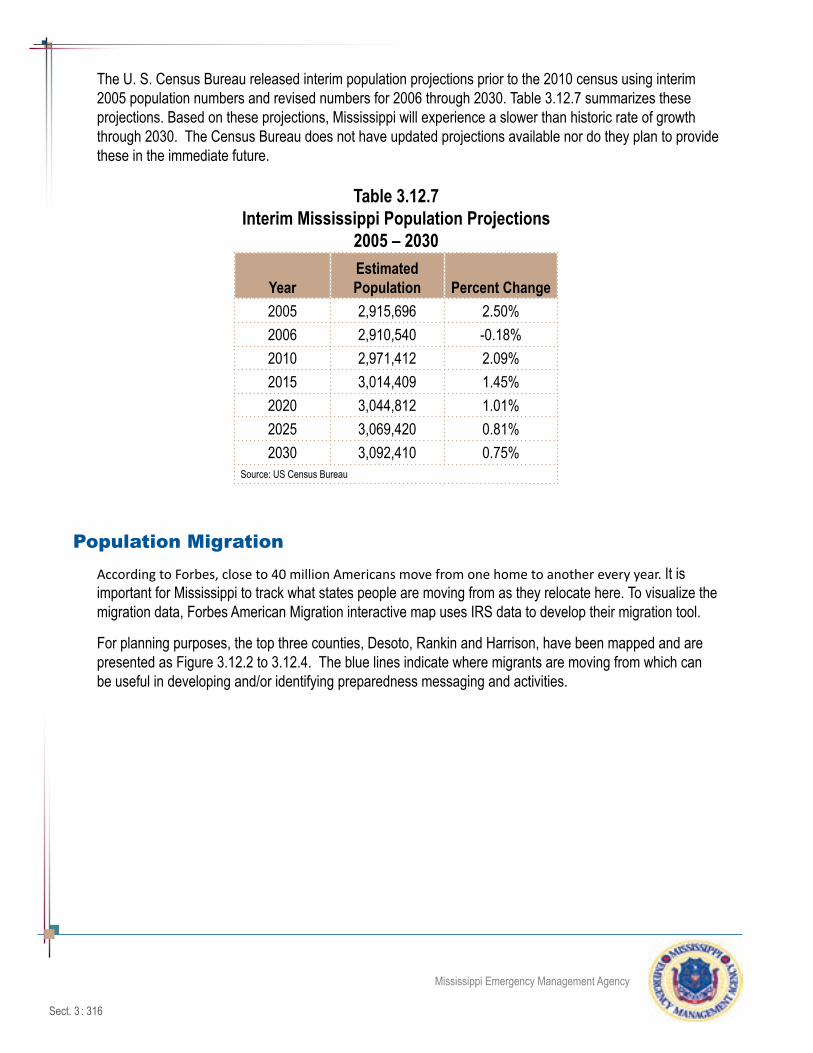
Sect. 3 : 316
Mississippi Emergency Management Agency
The U. S. Census Bureau released interim population projections prior to the 2010 census using interim 2005 population numbers and revised numbers for 2006 through 2030. Table 3.12.7 summarizes these projections. Based on these projections, Mississippi will experience a slower than historic rate of growth through 2030. The Census Bureau does not have updated projections available nor do they plan to provide these in the immediate future.
Table 3.12.7Interim Mississippi Population Projections
2005 – 2030
YearEstimated Population Percent Change
2005 2,915,696 2.50%2006 2,910,540 -0.18%2010 2,971,412 2.09%2015 3,014,409 1.45%2020 3,044,812 1.01%2025 3,069,420 0.81%2030 3,092,410 0.75%
Source: US Census Bureau
Population MigrationAccording to Forbes, close to 40 million Americans move from one home to another every year. It is important for Mississippi to track what states people are moving from as they relocate here. To visualize the migration data, Forbes American Migration interactive map uses IRS data to develop their migration tool.
For planning purposes, the top three counties, Desoto, Rankin and Harrison, have been mapped and are presented as Figure 3.12.2 to 3.12.4. The blue lines indicate where migrants are moving from which can be useful in developing and/or identifying preparedness messaging and activities.
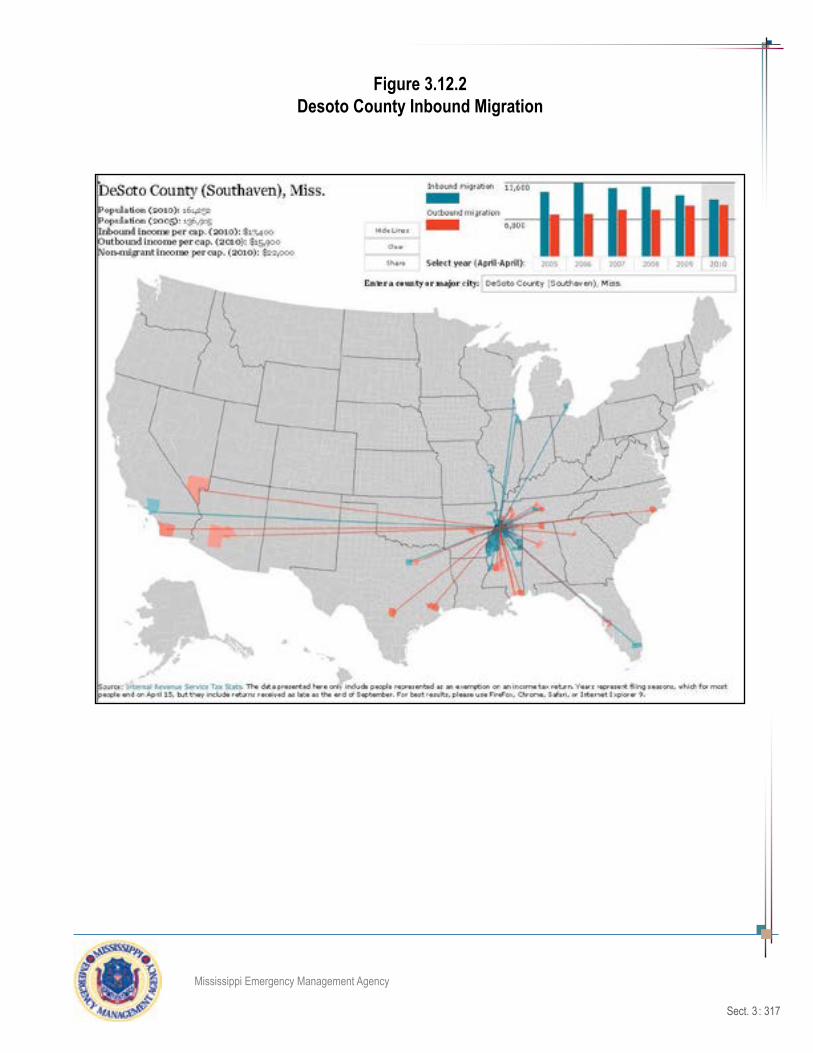
Sect. 3 : 317
Mississippi Emergency Management Agency
Figure 3.12.2Desoto County Inbound Migration

Sect. 3 : 318
Mississippi Emergency Management Agency
Figure 3.12.3Rankin County Inbound Migration

Sect. 3 : 319
Mississippi Emergency Management Agency
Figure 3.12.4Madison County Inbound Migration
Housing UnitsThe total number of housing units is another indicator of growth or decline and helps identify the geographi-cal location of new development occurring based on increases within discrete areas. According to the US Census Bureau, the number of housing units in Mississippi increased 9.7% between 2000 and 2010. Desoto County experienced the greatest percentage of increase (51.08%) during the ten year period. Rankin and Madison Counties were second and third with a 25.33% and 33.97% increase respectively. Tables 3.12.8 and 3.12.9 list the counties having grown the most in terms of housing units by number and percent respectively. Table 3.12.10 lists the top ten counties with the most housing units according to the latest census. Figure 3.12.5 (percent change) illustrates the results statewide.

Sect. 3 : 320
Mississippi Emergency Management Agency
Table 3.12.8Counties with the Greatest Housing Gains
(Numeric) 2000 – 2010County 2000 2010 Net Gain
Desoto 40,795 61,634 20,839Rankin 45,070 56,487 11,417Madison 28,781 38,558 9,777Lamar 15,433 24,070 8,637Jackson 51,678 60,067 8,389Lafayette 16,587 22,729 6,142Harrison 79,636 85,181 5,545Lee 31,887 35,872 3,985Oktibbeha 17,344 20,947 3,603Pearl River 20,610 23,968 3,358Source: U. S. Census
Table 3.12.9Counties with the Greatest Housing Unit Gains (Percent) 2000 – 2010
County 2000 2010Percent Change County 2000 2010
Percent Change
1. Lamar 15,433 24,070 55.96% 6. Tunica 3,705 4,803 29.64%2. Desoto 40,795 61,634 51.08% 7. Rankin 45,070 56,487 25.33%3. Lafayette 16,587 22,729 37.03% 8. George 7,513 9,330 24.18%4. Stone 5,343 7,161 34.03% 9. Benton 3,456 4,186 21.12%5. Madison 28,781 38,558 33.97% 10. Oktibbeha 17,344 20,947 20.77%
Source: U. S. Census
Table 3.12.10Top 10 Counties Ranked by Number of
Housing Units 2010
County 2010 County 20101. Hinds 103,421 6. Lee 35,8722. Harrison 85,181 7. Lauderdale 34,6903. Desoto 61,634 8. Forrest 32,2894. Jackson 60,067 9. Jones 28,4245. Rankin 56,487 10. Lowndes 26,556

Sect. 3 : 321
Mississippi Emergency Management Agency
Figure 3.12.5Counties with the Greatest HousingLoss and Gain (Percent) 2000 – 2008
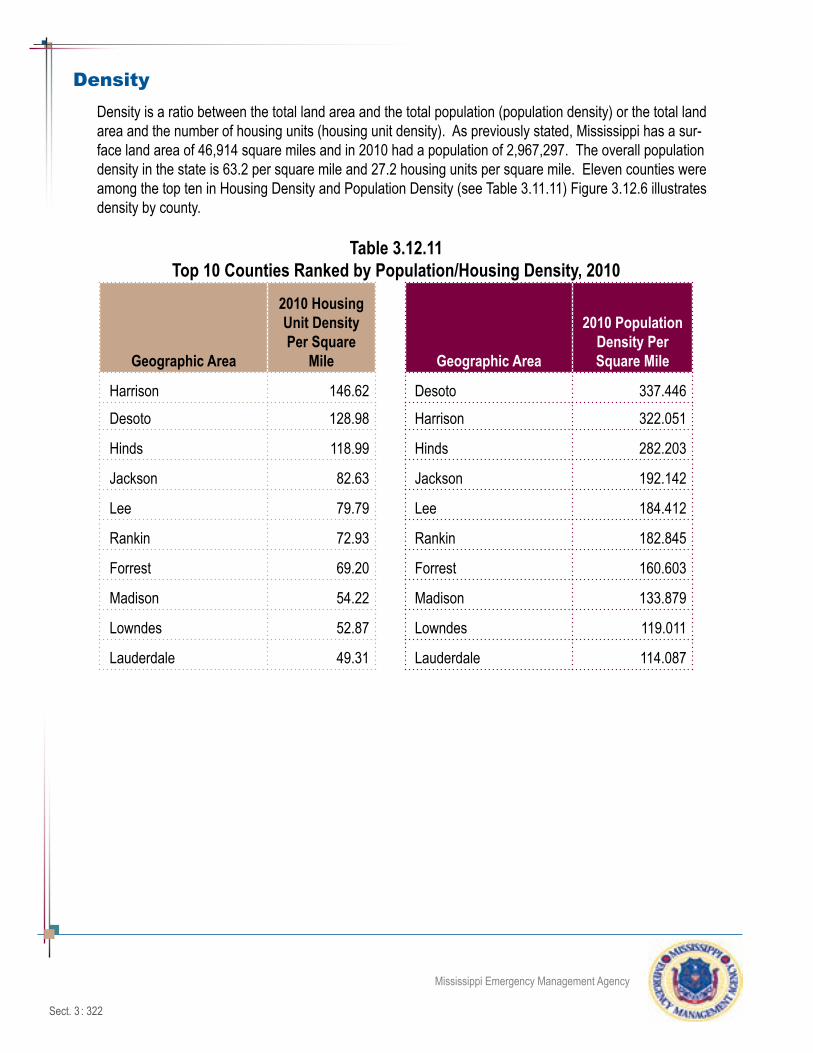
Sect. 3 : 322
Mississippi Emergency Management Agency
Density Density is a ratio between the total land area and the total population (population density) or the total land area and the number of housing units (housing unit density). As previously stated, Mississippi has a sur-face land area of 46,914 square miles and in 2010 had a population of 2,967,297. The overall population density in the state is 63.2 per square mile and 27.2 housing units per square mile. Eleven counties were among the top ten in Housing Density and Population Density (see Table 3.11.11) Figure 3.12.6 illustrates density by county.
Table 3.12.11Top 10 Counties Ranked by Population/Housing Density, 2010
Geographic Area
2010 Housing Unit Density Per Square
Mile Geographic Area
2010 Population Density Per Square Mile
.Harrison 146.62 .Desoto 337.446
.Desoto 128.98 .Harrison 322.051
.Hinds 118.99 .Hinds 282.203
.Jackson 82.63 .Jackson 192.142
.Lee 79.79 .Lee 184.412
.Rankin 72.93 .Rankin 182.845
.Forrest 69.20 .Forrest 160.603
.Madison 54.22 .Madison 133.879
.Lowndes 52.87 .Lowndes 119.011
.Lauderdale 49.31 .Lauderdale 114.087

Sect. 3 : 323
Mississippi Emergency Management Agency
Figure 3.12.6Housing Unit Density per Square Mile 2010
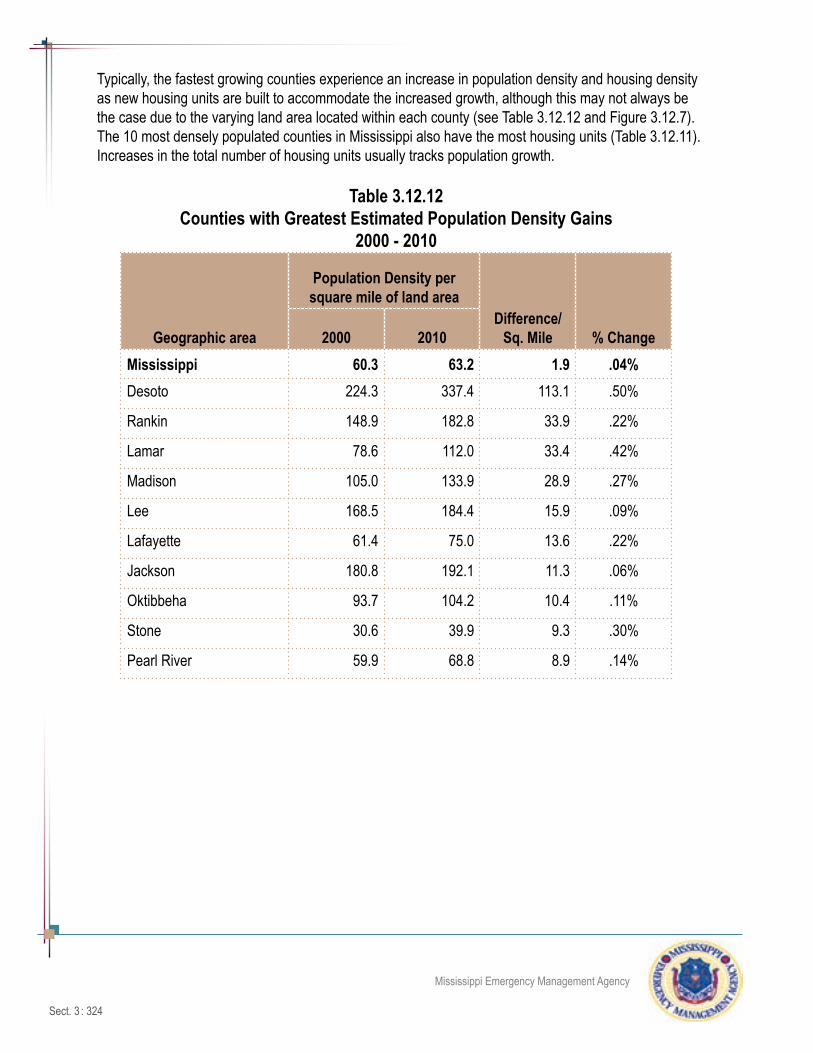
Sect. 3 : 324
Mississippi Emergency Management Agency
Typically, the fastest growing counties experience an increase in population density and housing density as new housing units are built to accommodate the increased growth, although this may not always be the case due to the varying land area located within each county (see Table 3.12.12 and Figure 3.12.7). The 10 most densely populated counties in Mississippi also have the most housing units (Table 3.12.11). Increases in the total number of housing units usually tracks population growth.
Table 3.12.12Counties with Greatest Estimated Population Density Gains
2000 - 2010
Geographic area
Population Density per square mile of land area
Difference/Sq. Mile % Change2000 2010
Mississippi 60.3 63.2 1.9 .04%Desoto 224.3 337.4 113.1 .50%
Rankin 148.9 182.8 33.9 .22%
Lamar 78.6 112.0 33.4 .42%
Madison 105.0 133.9 28.9 .27%
Lee 168.5 184.4 15.9 .09%
Lafayette 61.4 75.0 13.6 .22%
Jackson 180.8 192.1 11.3 .06%
Oktibbeha 93.7 104.2 10.4 .11%
Stone 30.6 39.9 9.3 .30%
Pearl River 59.9 68.8 8.9 .14%

Sect. 3 : 325
Mississippi Emergency Management Agency
Figure 3.12.7Population Density Per Square Mile 2010
Sect. 3 : 326
Mississippi Emergency Management Agency
Effect of Hurricane Katrina on Population and Housing Units
Prior to the devastation of Hurricane Katrina in August 2005, the coastal counties of Hancock, Harrison and Jackson were experiencing steady population growth. According to the Census Bureau the combined pop-ulation in 1970 was 239,944 and by 2000 the population increased to 363,988, a net increase of 124,044. Significant population shifts and the damage inflicted on the residents of Mississippi were seen as immedi-ate responses to Hurricane Katrina. The Census Bureau estimated the coastal counties lost 40,334 people immediately after the Hurricane. Figure 3.11.2 identifies the Mississippi Counties experiencing the most significant population shifts as a result of Hurricane Katrina.
Post-Katrina, the population changes and shifts continued with population growth in this region. In July 2007 the population was estimated to be 345,890, and by July 2009 the population was estimated to have increased to 349,294. The 2010 census shows a population of 363,995 which is essentially the same as the 2000 census.
Re-building efforts in the Gulf Coast region have been significant with federal, state and non-profit fund-ing channeled toward critical infrastructure, housing and major employment centers. As evidenced by the stabilization of the population, it is expected this region will continue to be one of the most economically viable of the state.
Social VulnerabilityThe University of South Carolina’s Department of Geography’s Hazards and Vulnerability Research In-stitute compiled a Social Vulnerability index which measures the social vulnerability of U.S. counties to environmental hazards. The purpose of this measure is to examine the differences in social vulnerability among counties. Based on national data sources, the index analyzed 42 socioeconomic and built environ-ment variables that may contribute to the community’s ability to prepare for, respond to and recover from hazards (i.e. social vulnerability).
Social vulnerability is partially a product of social inequalities—those social factors and forces that cre-ate the susceptibility of various groups to harm, and in turn affect their ability to respond and bounce back (resilience) after the disaster. . (Susan L. Cutter, Bryan. J. Boruff, and W. Lynn Shirley, 2003. “Social Vulner-ability to Environmental Hazards,” Social Science Quarterly 84 (1):242-261.)
Eleven composite factors were identified that differentiate counties according to their relative level of social vulnerability. These eleven factors include: personal wealth, age, density of the built environment, single sector economic dependence, housing stock and tenancy, race, ethnicity, occupation and infrastructure dependence.
When applied to the state of Mississippi demographics, a determination can be made as to where social vulnerability and exposure to hazards overlap and how and where mitigation resources might best be invested. Figure 3.12.8 displays Mississippi’s geographic variation in social vulnerability. According to the index, the following twenty Mississippi counties (Table 3.12.13) are the most vulnerable counties in the state.
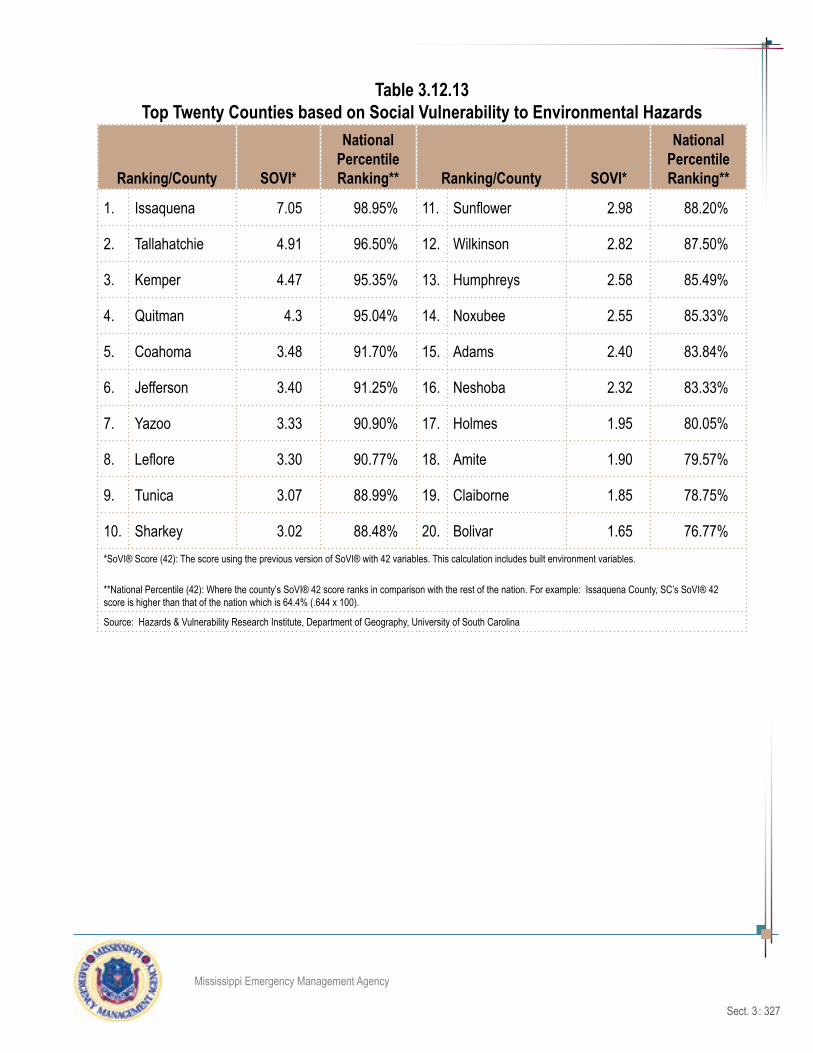
Sect. 3 : 327
Mississippi Emergency Management Agency
Table 3.12.13Top Twenty Counties based on Social Vulnerability to Environmental Hazards
Ranking/County SOVI*
National Percentile Ranking** Ranking/County SOVI*
National Percentile Ranking**
1. Issaquena 7.05 98.95% 11. Sunflower 2.98 88.20%
2. Tallahatchie 4.91 96.50% 12. Wilkinson 2.82 87.50%
3. Kemper 4.47 95.35% 13. Humphreys 2.58 85.49%
4. Quitman 4.3 95.04% 14. Noxubee 2.55 85.33%
5. Coahoma 3.48 91.70% 15. Adams 2.40 83.84%
6. Jefferson 3.40 91.25% 16. Neshoba 2.32 83.33%
7. Yazoo 3.33 90.90% 17. Holmes 1.95 80.05%
8. Leflore 3.30 90.77% 18. Amite 1.90 79.57%
9. Tunica 3.07 88.99% 19. Claiborne 1.85 78.75%
10. Sharkey 3.02 88.48% 20. Bolivar 1.65 76.77%*SoVI® Score (42): The score using the previous version of SoVI® with 42 variables. This calculation includes built environment variables.
**National Percentile (42): Where the county’s SoVI® 42 score ranks in comparison with the rest of the nation. For example: Issaquena County, SC’s SoVI® 42 score is higher than that of the nation which is 64.4% (.644 x 100).
Source: Hazards & Vulnerability Research Institute, Department of Geography, University of South Carolina

Sect. 3 : 328
Mississippi Emergency Management Agency
Figure 3.12.8 Social Vulnerability Index 2009

Sect. 3 : 329
Mississippi Emergency Management Agency
Summary Mississippi is a relatively sparsely populated state. According to the 2010 U. S. Census among the 50 states, Mississippi ranked 31st in population and housing density; 34th in population density; and 40th in population growth rate between 2000 and 2010. The state has 46,906 square miles and a population of 2,967,297 according to the 2010 census.
Growth patterns in Mississippi are similar to those in other states with the most pronounced growth being in counties close to major cities or within Metropolitan Statistical Areas. Examples include Rankin and Madi-son counties within the Jackson MSA, adjacent to the capital city, and Desoto County within the Memphis MSA. Areas located close to universities such as Lamar County (University of Southern Mississippi) and Lafayette County (Mississippi State University) also show significant growth. Coastal counties including Pearl River, Stone, Hancock, Harrison and Jackson also experienced positive population growth.
Between 2000 and 2010, 39 of Mississippi’s 82 counties gained in population and 13 of these gained by ten percent or more. The following counties experienced the most growth (numerical and/or percentage) during the 2000 decade: Desoto, Rankin, Madison, Lamar, Lafayette, Jackson, Pearl River, Lee, Oktib-beha, Stone, and Tate. The six most southerly counties all gained in population and the coastal counties of Harrison, Hancock, and Jackson have rebounded to pre-Katrina population numbers. Counties that experienced a loss of population are primarily located in the Mississippi Delta region where the economic base has historically been heavily reliant on agriculture. The following counties experienced double digit population loss: Sharkey, Jefferson, Claiborne, Washington, Quitman, Humphreys, and Bolivar.
Recent natural disasters heightened interest in consistent building codes, flood control, storm water control and protection of wetlands. Sustainable development, especially in the most populous counties, gained momentum. FEMA recently completed new flood maps for Mississippi and all six gulf coast counties adopted building codes including hurricane resistant construction standards. Manufactured homes, mobile homes and recreational vehicle areas are considered vulnerable. There are also concentrations of older homes that remain a concern.
Future growth trends are predicted to range from .75% to 1.56% each decade. It is expected areas which have experienced the most significant growth during the first decade of this century will continue to lead the state with some “spill-over” into adjacent areas.

Sect. 3 : 330
Mississippi Emergency Management Agency
3.13: Infrastructure Interdependencies
BackgroundIn a post 9/11 world, terrorism is the principal concern and main focus of man-made threats and disasters. While this fear is appropriate and anti-terrorism mitigating actions should not be discounted, more signifi-cant man-made threats exist and are principally related to built infrastructure. For example, an informal review of news items for the past five years suggests the number of crises related to critical infrastructure failure far outnumbers events caused by terrorism on domestic soil. The same informal review strongly suggests the loss of life and property due to critical infrastructure failure and man-made accidents signifi-cantly outnumbers the losses experienced through terrorism.
While truly tragic, the Boston Marathon bombing on April 15, 2013 - the most recent major terrorist inci-dent on domestic soil - killed three and caused less than $100,000 dollars of physical damage. This event dominated the media news for weeks. Shortly thereafter, an errant truck driver caused the collapse of the Interstate 5 Skagit River Bridge in Washington State, severely injuring three, causing several million dollars in damage, and incapacitating a major transportation route in the Pacific Northwest for months,. The two events are not purported to be comparable, but rather provides a frame of reference illustrating the collec-tive fear of terrorism attacks outweighing the fear of bridge collapse or similar life-threatening infrastructure failures. This fear drives the amount of investment in mitigation.
Again, for illustrative purposes and not direct comparison, there are approximately 58,000 armed Transpor-tation Security Administration agents in the US and every piece of luggage flown on commercial airlines is inspected. The National Bridge Inventory lists over 17,000 bridges which are at least 2 years overdue for inspection. While it is reasonable to have a greater fear of a terrorist attack, the probability of dying through such means was estimated by Richard Barrett, coordinator of the United Nations al Qaeda/Taliban Monitor-ing Team at approximately 20,000,000:1. Consider the following obtained by “Washington Blog” and based upon statistics from a 2004 National Safety Council report, the National Center for Health Statistics, the U.S. Census Bureau, and 2003 mortality data from the Center for Disease Control:
• One is 17,600 times more likely to die from heart disease than a terrorist attack
• One is 12,571 times more likely to die from cancer than a terrorist attack
• One is 11,000 times more likely to die in an airplane accident than a terrorist plot involving an airplane
• One is1048 times more likely to die in a car accident than a terrorist attack
• One is 404 times more likely to die in a fall than a terrorist attack
• One is 87 times more likely to drown than die in a terrorist attack
• One is 13 times more likely to die in a railway accident than a terrorist attack
• One is 12 times more likely to die from accidental suffocation in bed than a terrorist attack
• One is 9 times more likely to choke to death on your own vomit than die in a terrorist attack

Sect. 3 : 331
Mississippi Emergency Management Agency
• One is 8 times more likely to be killed by a police officer than a terrorist
• One is8 times more likely to die from accidental electrocution than a terrorist attack
• One is 6 times more likely to die from hot weather than a terrorist attack
Not to discount the threat and consequences of a terrorist attack, but to highlight the relative investment in mitigating this risk as compared to the investment needed to prevent potential deaths, injuries, and signifi-cant loss through the failure of critical infrastructure. Incidents similar to the Interstate 5 Skagit River Bridge collapse happen with alarming frequency, yet the investment in preventing such tragedies is minimal. Infra-structure failure events happen on a fairly routine basis throughout the United States and are a symptom of the nation’s aging infrastructure.
Mississippi Infrastructure Summary
The most pressing example of recent infrastructure failure in Mis-sissippi was the near total collapse of the water distribution system during the 2010 cold event when water distribution pipes froze and broke. Tens of thousands of residents were without potable water for an extended period of time and Governor Barbour declared a state of emergency, closing state offices and schools.
The American Society for Civil Engineering (ASCE) assesses the state of the national infrastructure on a regular basis and reports the following concerns:
Water and Environment• Drinking Water
◊ Mississippi reported $3.2 billion in drinking water infrastructure needs during the next 20 yearsHazardous Waste
• Mississippi has 8 sites on the National Priorities ListLevees
• Mississippi has approximately 1,130 miles of levee according to the current FEMA Midterm Levee Inventory and many are struggling to maintain renewed certification. The Center for Interdisciplin-ary Geospatial Information Technologies at Delta State University estimates the location of approxi-mately 20% of the state’s levee infrastructure is not mapped or known to regulators
Wastewater• Mississippi reported $1.4 billion in wastewater infrastructure needs during the next 20 years
Transportation• There are 80 public-use airports in Mississippi
Bridges• 2,417 of the 17,061 bridges in Mississippi (14.2%) are considered structurally deficient• 1,357 of the 17,061 bridges in Mississippi (8.0%) are considered functionally obsolete• Mississippi received $51 million from the Federal Highway Bridge Fund in FY2011

Sect. 3 : 332
Mississippi Emergency Management Agency
Inland Waterways• Mississippi has 870 miles of inland waterways, ranking it 12th in the nation
Ports• Mississippi’s ports handled 52.2 million short tons of cargo in 2009, ranking it 15th in the nation
Rail• Mississippi has 27 freight railroads covering 2,454 miles across the state, ranking it 29th by mile-
ageRoads
• Roads in need of repairs cost Mississippi motorists $811 million a year in extra vehicle repairs and operating costs – $419 per motorist
• 51% of Mississippi’s roads are in poor or mediocre condition• Mississippi has 74,983 public road miles• Mississippi’s highway vehicle-miles traveled in 2009 was approximately 13,414 per capita, ranking
it 2nd in the nation
ASCE consistently rates the overwhelming majority of infrastructure in Mississippi with the grade of D or F. For example, the US 49 bridge between Coahoma County and Helena, AR has received a grade D for over 10 years. Furthermore, the threat of infrastructure failure extends beyond Mississippi’s borders. The failure of Pearl River Lock and Dam Number 1, located in Louisiana, threatened the downstream community of Pearlington, MS during hurricane Isaac in the fall of 2012. This piece of infrastructure was abandoned by the US Army Corps of Engineers and destined to become parkland. Lack of proper maintenance most likely contributed to the images shown below.
Pearl River Lock and Dam Number 1 Louisiana

Sect. 3 : 333
Mississippi Emergency Management Agency
The ability to assess both the status and the potential losses created through critical infrastructure failure, whether caused by human error, age, or intentional attack, is complicated due to a lack of collaboration between the private sector stakeholders and the government. Approximately 85% of all infrastructure in the US is owned and managed by private sector firms who are under no obligation to provide location data or status updates about their infrastructure components. This is particularly true with electric, gas, rail, telephone, data, and similar components as these segments of critical infrastructure are often proprietary in nature with respect to their design. Yet they are critical to the protection of life, property and the economic wellbeing of the state, and often inter-dependent upon one another.
Inter-dependent infrastructure implies one system failure may cause cascading failure of many others. For illustrative purposes consider the prolonged blackout of Peoria, AZ in 2004 after a significant electric transformer burned in Arizona Public Utility’s Westwing Substation facility. During Arizona’s brutal summer, more than 150,000 customers were left without power or with rolling blackouts for nearly a month as they waited for a replacement transformer to be installed. While waiting for a new transformer to be construct-ed, critical facilities were supported with generator power; and others, including some water and wastewa-ter systems, were left with no power. Toxic runoff from the fire created significant environmental hazards with smoke snarling traffic for days and landing patterns disrupted at nearby airports. Little imagination is needed to foresee similar consequences if an accidental fire occurred at the electric utility substation located near the Interstate 55 - Interstate 20 interchange south of Jackson, shown below

Sect. 3 : 334
Mississippi Emergency Management Agency
Similar adjacency issues related to the placement of critical infrastructure are shown in Figure 3.13.1. Ad-ditional consideration, for which data are not readily available for Mississippi, must be made not only for inter-dependent adjacency problems, but physical interdependency as well. The Howard Street Tunnel Fire in Baltimore, MD highlights such a problem and the following is a synopsis of that event:
• 62 car freight train carrying hazardous chemicals derailed in Baltimore’s Howard Street Tunnel
• Caused a cascading degradation of infrastructure components not previously anticipated
◊ Tunnel fire caused a water main to break above the tunnel
◊ The water caused flooding in the area and knocked out power to a large area of down-town Baltimore
◊ Fiber optic cables running through the tunnel were destroyed, resulting in major disrup-tions of communications (voice and data)
◊ Rail service was also disrupted for weeks affecting manufacturing along the Middle Atlan-tic states
Figure 3.13.1City of Jackson Critical Infrastructure
Sect. 3 : 335
Mississippi Emergency Management Agency
Other failures of privately held infrastructure elements were easily discovered and, as of this writing, range from the explosion of PG&E’s gas pipelines in San Bruno to the runaway train incident in Lac Magantec, Quebec, Canada. Many fail to make the news because categorical data summarizing failures are not regularly reported, plus awareness by government is extremely limited, which highlights another important issue: data availability.
In some instances data resources for privately held elements are available at the Federal level, but not for modeling or training purposes and may not be shared with state and local government unless a presi-dentially declared disaster has occurred. (Homeland Security Infrastructure Protection dataset elements have highly restricted uses due to licensing concerns). Lack of availability of these data resources for high return of investment activities, such as hazard mitigation planning, severely limits their usefulness. Simi-larly, data coordination in Mississippi at the state level focuses primarily on features such as roads, critical infrastructure facilities, and physical features. Coordination among state agencies, such as the Mississippi Coordinating Council for Remote Sensing and GIS, focuses largely on non-infrastructure data and clearing houses or sharing points do not exist. There is no intergovernmental body which coordinates the sharing of information with MEMA, OHS, and similar emergency management entities. (While the serves as an inte-gration point, it is principally concerned with law enforcement actions and lacks the comprehensive nature required.)
Lacking appropriate data, the analysis of a potential crisis through failure of critical infrastructure, includ-ing accidental or intentional destruction, is difficult at best. However, rudimentary analysis which examines the spatial proximity of differing key infrastructure components hints at the frightening possibilities. Figure 3.13.2 illustrates if three or more elements of infrastructure (significant hydrography, railroad, pipeline, electric transmission, and major roadways) converge to within 250 meters of each other the failure of one system could potentially cause catastrophic destruction of the others.

Sect. 3 : 336
Mississippi Emergency Management Agency
Figure 3.13.2Grouped Infrastructure with Potential for
Associative/Adjacency Failure
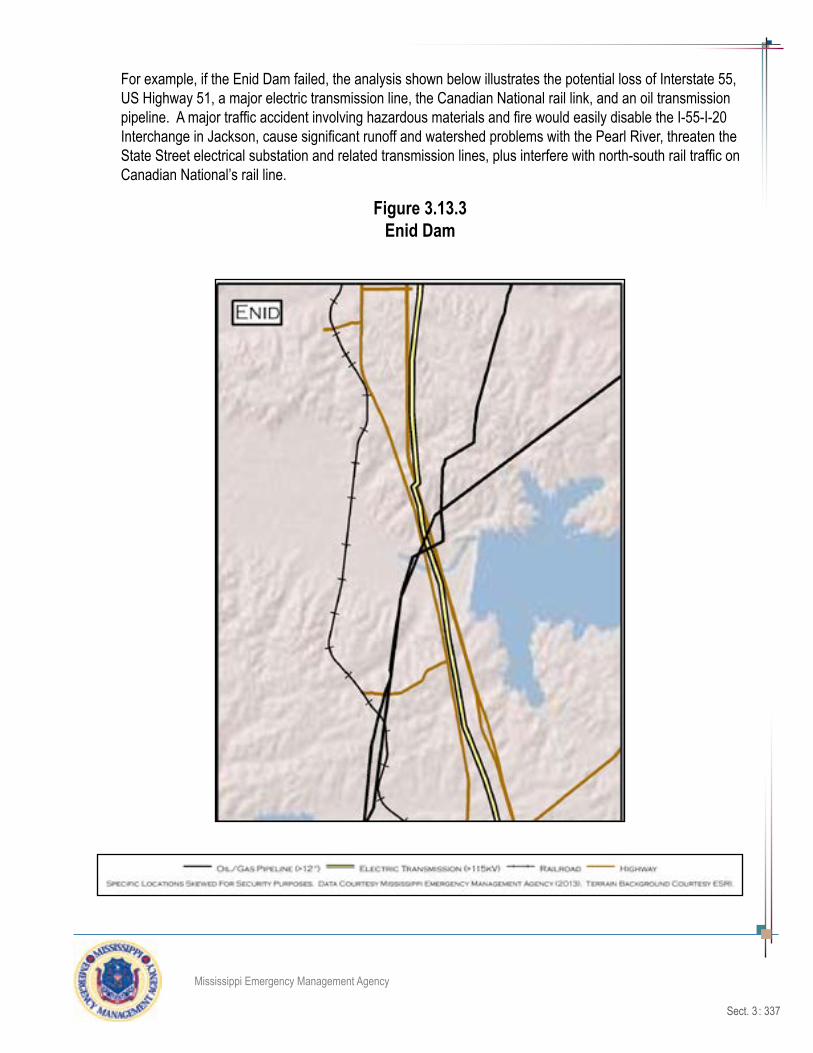
Sect. 3 : 337
Mississippi Emergency Management Agency
For example, if the Enid Dam failed, the analysis shown below illustrates the potential loss of Interstate 55, US Highway 51, a major electric transmission line, the Canadian National rail link, and an oil transmission pipeline. A major traffic accident involving hazardous materials and fire would easily disable the I-55-I-20 Interchange in Jackson, cause significant runoff and watershed problems with the Pearl River, threaten the State Street electrical substation and related transmission lines, plus interfere with north-south rail traffic on Canadian National’s rail line.
Figure 3.13.3Enid Dam
Sect. 3 : 338
Mississippi Emergency Management Agency
Recommendations
Major recommendations with respect to man-made threats and hazards are:
1. Continue current activities related to terror, including the identification of potential terrorist targets.
2. Conduct one or more workshops to facilitate data exchange about critical infrastructure among state, local, federal, and private stakeholders. The goals for these workshops should be:
a. Non-punitive assessment of the status of critical infrastructure
b. Discovery of infrastructure interdependencies
c. The development of data sharing agreements
d. The development of a plan for identifying mitigation funding for critical infrastructure
3. Develop infrastructure data sets for state and local level use.

Mississippi Emergency Management Agency
Sect. 4 : 339
4.0: Comprehensive State Hazard Mitigation Program
It is essential that State and local mitigation policies be directed to reduce or eliminate the risk of future devastation and the corresponding impact on the citizens of the State of Mississippi. This can only be accomplished by establishing workable goals and objectives that integrate the efforts of state and local governments into one cohesive mitigation strategy that also takes full advantage of public-private partnerships.
Development of a sound mitigation strategy provides a focus that assists State and local governments in identifying priorities and channeling limited resources toward critical mitigation projects. This process helps government at all levels make the most effective use of available resources. “Local governments” include any county, municipality, city, town, township, public authority, school district, special district, intrastate district, council of governments (regardless of whether the council of governments is incorporated as a nonprofit corporation under State law), regional or interstate government entity, or agency or instrumentality of a local government; any Indian tribe or authorized tribal organization, or Alaska Native village or organization; and any rural community, unincorporated town or village, or other public entity. Eligible governmental entities would also include all institutions, authorities, bodies or boards created under Federal, state or local authority to manage, oversee or regulate for a public purpose such as, but not limited to, special water/sewer districts, levee boards, floodplain management authorities, and agricultural or forestry boards.
The State of Mississippi will enhance its ability to complete its goals and objectives by taking maximum advantage of the mitigation resources available, both present and future, to reduce the impact of natural and human caused disasters on the citizens and infrastructure. The State will also vigorously pursue methods to augment existing state and local programs by involving other opportunities, such as public-private partnerships. Involvement of a wide range of participants in mitigation efforts, increases the feasibility of implementing mitigation projects as resources become available.
The State will provide, promote, and support education and training on the benefits of a comprehensive statewide hazard mitigation program for state agencies, local governments, and private enterprises. Throughout the process, Mississippi’s citizens will remain a priority. With a comprehensive overview of the hazards that threaten Mississippi, goals and objectives have been developed to mitigate potential losses from those hazards.

Sect. 4 : 340
Mississippi Emergency Management Agency
Summary of Changes - 2013 Comprehensive State Hazard Mitigation Program
In updating the 2004 State of Mississippi Hazard Mitigation Plan, a total of 60 local plans were reviewed. An additional 32 approved local hazard mitigation plans were reviewed for the 2010 plan. For the 2013 plan update, a total of 104 local hazard mitigation plans were reviewed. This section was updated with a commitment to improve on ways to reduce losses from natural hazards and to adequately reflect changes in development. A summary of changes is listed below:
Goals and Objectives (section 4.1) - Goals and objectives are described based on the updated hazard identification risk assessment and reconsideration of goals and objectives from the previously approved plan. The goals and objectives of local plans were reviewed. All tables and graphics/figures were updated with new data.
State Capabilities (section 4.2) - State agencies reviewed their capabilities and provided updates describing how their means and resources can aid mitigation efforts. All information was updated based on agency response. The Mitigation Programs Table was reviewed for update.
Local Capabilities Assessment (section 4.3) - Local capabilities were reviewed, analyzed, and evaluated for effectiveness and for improvement. All tables and graphics/figures were updated with new data.
Mitigation Measures (section 4.4) - Two new mitigation project were added. These actions are noted as “New Mitigation Actions for 2013” in Table 4.4.1. One project was completed and added to Table 4.4.2. All tables and graphics/figures were updated with new data.
Table 4.5.1 has been updated from the 2010 plan to include those that are still active for the “2013 Plan Update. The list below has been deleted from the table and no longer active for this update:
• Community Revitalization Program
• Community Revitalization Program Go Zone
• Temporary Housing Program
• Public Housing Program
• Small Rental Progarm
• Diaster Unemployment Assistance
• Building Inspection Grant Program
• Planning Program
• Gulf Coast Regional Water and Wastewater Program
• Homeowner Assistance Program (Phases I and II)
• Ratepayer and Wind Pool Mitigation Program

Mississippi Emergency Management Agency
Sect. 4 : 341

Sect. 4 : 342
Mississippi Emergency Management Agency
4.1: Goals and Objectives
44 CFR 201.4(c)(3)(i) - The State mitigation strategy shall include the following elements:
A mitigation strategy that provides the State’s blueprint for reducing the losses identified in the risk assessment. This section shall include:
A description of State goals to guide the selection of activities to mitigate and reduce potential losses.
This section describes the mission, goals, and objectives of the Mississippi State Hazard Mitigation Plan and the process used to update the goals and objectives in the 2013 update planning process. The state is tracking progress toward accomplishing the plan goals and improving alignment with local mitigation strategies (goals, objectives, and actions). The framework of the state’s mitigation strategy has four parts: mission, goals, objectives, and actions, which are defined as the following:
• The mission is a philosophical or value statement that states the purpose and primary function of the plan.
• The goals describe the overall direction that the State will take to reach their mission.
• The objectives link the goals and actions and help organize the plan for efficient implementation and evaluation.
• The actions describe the activities or projects used to support the accomplishment of the goals and mission.
During the 2013 update process, the Hazard Mitigation Council reviewed the mission statement and the goals and objectives from the previously approved 2010 hazard mitigation plan. The Hazard Mitigation Council determined that the mission, goals, and objectives remain valid. The 2013 mission, goals, and objectives are the following:
Mission: To create a disaster-resilient, sustainable Mississippi through the implementation of a comprehensive statewide mitigation strategy.
Goal 1 - Minimize loss of life, injury, and damage to property, the economy, and the environment from natural hazards
Objective 1.1 Protect critical facilities, infrastructure, and systems
Objective 1.2 Reduce the number of at-risk and repetitive loss properties
Objective 1.3 Reduce potential damage to future buildings and infrastructure
Objective 1.4 Develop and maintain hazards-related research, modeling, data, and analysis to support program and project implementation
Objective 1.5 Identify needs and appropriate projects from post disaster damage assessments

Mississippi Emergency Management Agency
Sect. 4 : 343
Objective 1.6 Preserve, create, and restore natural systems to serve natural mitigation functions
Objective 1.7 Protect historic and cultural resources
Objective 1.8 Provide state and local agencies statewide communications with an interoperable, highly reliable, fast access, public safety-grade communication system for use during events that threaten the health and welfare of the citizens of Mississippi.
Goal 2 - Build and enhance local mitigation capabilities
Objective 2.1 Support and provide guidance for local hazard mitigation planning and projects
Objective 2.2 Encourage the adoption, improvement, and enforcement of local codes, ordinances, and land use planning
Objective 2.3 Provide and promote technical assistance and training to local governments
Objective 2.4 Identify and provide financial incentives and funding opportunities
Goal 3 - Improve public education and awareness
Objective 3.1 Develop and improve outreach programs and materials to increase awareness to the public and private sector about risk and mitigation in Mississippi
Objective 3.2 Promote and utilize existing hazard and mitigation education programs from state, federal, and nonprofit sources
Objective 3.3 Develop tailored outreach strategies for vulnerable populations, such as tourists, disabled persons, children and the elderly, non-English speakers, and low-income residents
Goal 4 - Sustain and enhance a coordinated state mitigation program
Objective 4.1 Strengthen coordination, communication, capabilities, and partnerships with all levels of government, the private sector, and nonprofit organizations
Objective 4.2 Institutionalize hazard mitigation as integrated state policy
Objective 4.3 Implement, monitor, and assess the effectiveness of the mitigation strategy and promote successes

Sect. 4 : 344
Mississippi Emergency Management Agency
Process for Updating Goals and Objectives
The goals and objectives of the 2004 plan were a compilation of previous goals and objectives from the Mississippi 409 plan, as well as those being implemented through other state agencies involved in the mitigation planning process. As part of the 2007 plan update, the goals and objectives from the 2004 plan were reviewed and revised to addressed current and anticipated future conditions. On April 22, 2010 the Hazard Mitigation Council met to assess the goals and objectives from the previously approved 2007 hazard mitigation plan. The Council determined that the goals and objectives still remain valid and would not be changed in the 2010 update. On January 23, 2013 the Hazard Mitigation Council met to assess the goals and objectives from the 2010 hazard mitigation plan. The Mitigation Council determined that the goals and objectives still remain valid and would remain the same for the 2013 plan update. The review for the 2013 update was based on the following:
• The updated statewide risk assessment, which includes changes in growth and development, recent state and federal declared events, enhanced vulnerability assessments, and analysis of local risk assessments;
• Assessment of changes and challenges in state and local capabilities since the 2010 plan;
• Types and status of mitigation actions from the 2010 state plan;
• Analysis of the similarities and differences of the state mitigation plan goals with local mitigation plan goals and objectives; and
• The development of a more integrated strategic plan framework for aligning goals, objectives, and actions.
As a result of this review, the Hazard Mitigation Council reaffirmed the mission statement, goals, and objectives from the 2010 hazard mitigation plan.
The key issues identified in the statewide risk assessment and the analysis of local risk assessments can be found in Section 3 Risk Assessment. Information on the changes in state and local mitigation capabilities is summarized in Sections 4.2 State Capability Assessment and 4.3 Local Capability Assessment. The following section describes how the local mitigation plan goals and objectives were reviewed and considered during the 2013 update. Section 4.4 Mitigation Actions includes detailed and updated mitigation measures designed to meet the designated goals and objectives. Progress on these actions is evaluated in Sections 4.4 and Section 4.5 Effective Use of Available Mitigation Funding.
Review of Local Goals and Objectives
The Hazard Mitigation Council analyzed the goals and objectives of FEMA-approved local hazard mitigation plans in Mississippi to assess their consistency with state goals and objectives. The analysis involved calculating the percentage of local plans (out of a total of 104 plans) that have a similar goal or objective to each of the goals and objectives in the 2010 Mississippi State Hazard Mitigation Plan. There were an additional 44 plans to review since the 2004 update. The data collection involved some interpretation because many local goals and objectives addressed multiple issues. The results of the analysis are presented in Table 4.1.1.
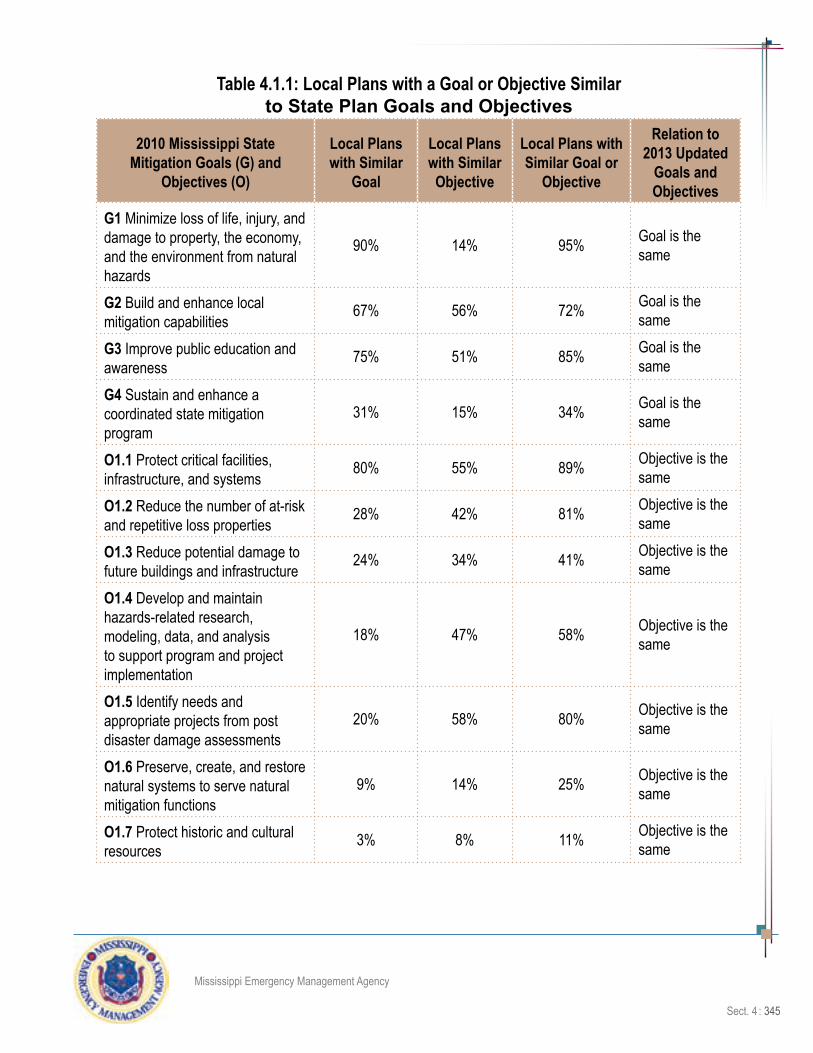
Mississippi Emergency Management Agency
Sect. 4 : 345
Table 4.1.1: Local Plans with a Goal or Objective Similar to State Plan Goals and Objectives
2010 Mississippi State Mitigation Goals (G) and
Objectives (O)
Local Plans with Similar
Goal
Local Plans with Similar Objective
Local Plans with Similar Goal or
Objective
Relation to 2013 Updated
Goals and Objectives
G1 Minimize loss of life, injury, and damage to property, the economy, and the environment from natural hazards
90% 14% 95% Goal is the same
G2 Build and enhance local mitigation capabilities
67% 56% 72% Goal is the same
G3 Improve public education and awareness
75% 51% 85% Goal is the same
G4 Sustain and enhance a coordinated state mitigation program
31% 15% 34% Goal is the same
O1.1 Protect critical facilities, infrastructure, and systems
80% 55% 89% Objective is the same
O1.2 Reduce the number of at-risk and repetitive loss properties
28% 42% 81% Objective is the same
O1.3 Reduce potential damage to future buildings and infrastructure
24% 34% 41% Objective is the same
O1.4 Develop and maintain hazards-related research, modeling, data, and analysis to support program and project implementation
18% 47% 58% Objective is the same
O1.5 Identify needs and appropriate projects from post disaster damage assessments
20% 58% 80% Objective is the same
O1.6 Preserve, create, and restore natural systems to serve natural mitigation functions
9% 14% 25% Objective is the same
O1.7 Protect historic and cultural resources
3% 8% 11% Objective is the same
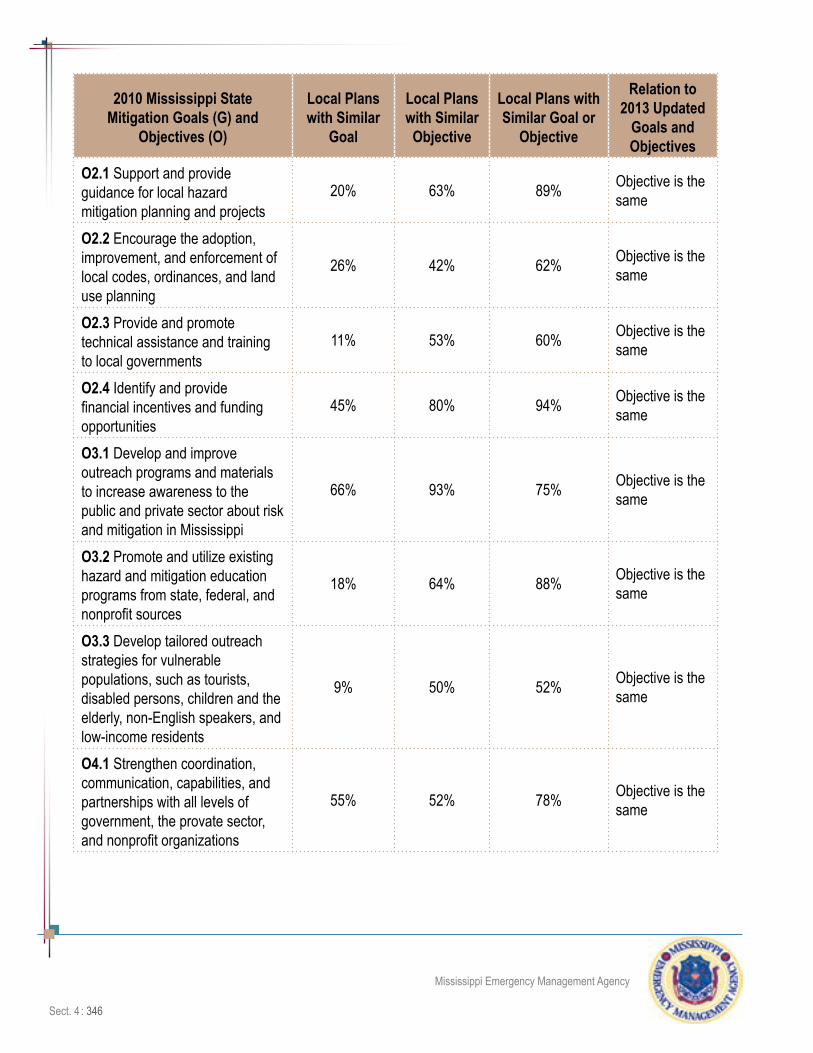
Sect. 4 : 346
Mississippi Emergency Management Agency
2010 Mississippi State Mitigation Goals (G) and
Objectives (O)
Local Plans with Similar
Goal
Local Plans with Similar Objective
Local Plans with Similar Goal or
Objective
Relation to 2013 Updated
Goals and Objectives
O2.1 Support and provide guidance for local hazard mitigation planning and projects
20% 63% 89% Objective is the same
O2.2 Encourage the adoption, improvement, and enforcement of local codes, ordinances, and land use planning
26% 42% 62% Objective is the same
O2.3 Provide and promote technical assistance and training to local governments
11% 53% 60% Objective is the same
O2.4 Identify and provide financial incentives and funding opportunities
45% 80% 94% Objective is the same
O3.1 Develop and improve outreach programs and materials to increase awareness to the public and private sector about risk and mitigation in Mississippi
66% 93% 75% Objective is the same
O3.2 Promote and utilize existing hazard and mitigation education programs from state, federal, and nonprofit sources
18% 64% 88% Objective is the same
O3.3 Develop tailored outreach strategies for vulnerable populations, such as tourists, disabled persons, children and the elderly, non-English speakers, and low-income residents
9% 50% 52% Objective is the same
O4.1 Strengthen coordination, communication, capabilities, and partnerships with all levels of government, the provate sector, and nonprofit organizations
55% 52% 78% Objective is the same

Mississippi Emergency Management Agency
Sect. 4 : 347
2010 Mississippi State Mitigation Goals (G) and
Objectives (O)
Local Plans with Similar
Goal
Local Plans with Similar Objective
Local Plans with Similar Goal or
Objective
Relation to 2013 Updated
Goals and Objectives
O4.2 Institutionalize hazard mitigation as integrated state policy
9% 10% 12% Objective is the same
O4.3 Implement, monitor, and assess the effectiveness of the mitigation strategy and promote successes
36% 52% 53% Objective is the same
The state goals most represented in local plans are Goal 1 and Goal 3. State Goal 1: Minimize loss of life, injury, and damage to property, the economy, and the environment from natural hazards. When compared to local goals and objectives, ninety-five percent of local plans had a goal or objective to minimize loss from natural hazards.
Seventy-five percent of local plans have a goal similar to State Goal 3: Improve public education and awareness. In addition, the state objective 3.1 to develop and improve outreach programs and materials to increase awareness to the public and private sector about risk and mitigation in Mississippi received the highest percentage of similar objectives in local plans (93 percent). Objective 1.7 to protect historic and cultural resources received the lowest of the three objectives with 8 percent.
The Hazard Mitigation Council also analyzed other goals and objectives that occur commonly in local plans; some differ from state goals and objectives. Table 4.1.2 lists common goals and objectives in local plans and the percent of plans that contain the similar goal or objective. Because most local plans were developed by Mississippi’s Planning and Development Districts, many plans of jurisdictions in the same district have the same goals and objectives.
Protect/improve critical facilities was the issue most common in local plans. Objective 1.1 in the state plan also addresses this issue. Increasing local capacity for mitigation and emergency management was another common issue (78 percent). Involving and/or educating public officials in natural hazards mitigation and enhancing public warning and information systems were also common. State Goal 3 and Objective 3.1 and Objective 2.3 share this common issue. Promoting local hazard mitigation plans was a frequent goal or objective in local plans (72 percent). Sixty percent of local plans seek to support state identified initiatives.

Sect. 4 : 348
Mississippi Emergency Management Agency
Table 4.1.2: Other Goals and Objectives Common in Local Plans
Common Goals and Objectives in Local Plans Percentage of Local Plans with Goal or Objective
Protect/improve critical facilities 88%
Promote local hazard mitigation plans 72%
Improve emergency response operations 50%
Increase local capacity for mitigation and emergency management 78%
Involve and/or educate public officials in natural hazards mitigation 73%
Enhance public warning and information systems 73%
Monitor effectiveness of measures and initiatives 18%
Identify and address repetitive loss properties 45%
Reduce damage to future buildings and infrastructure 30%
Increase property acquisitions 17%
Integrate mitigation in land use planning 26%
Promote the National Flood Insurance Program 50%
Encourage jurisdictions to implement and share GIS system 12%
Improve and retrofit public buildings 55%
Protect business continuity and economic vitality 31%
Improve sheltering capabilities 31%
Plan for continuity of local government operations 43%
Plan for vulnerable populations 32%
Develop or improve stormwater/drainage programs 23%
Improve communications systems 61%
Support State identified initiatives 60%
Improve evacuation capabilities 24%
Seek funding for mitigation 19%

Mississippi Emergency Management Agency
Sect. 4 : 349
4.2: State Capabilities
44 CFR 201.4(c)(3)(ii) - The State mitigation strategy shall include the following elements:
A mitigation strategy that provides the State’s blueprint for reducing the losses identified in the risk assessment. This section shall include:
A discussion of the State’s pre- and post-disaster hazard management policies, programs, and capabilities to mitigate the hazards in the area, including: an evaluation of State laws, regulations, policies, and programs related to hazard mitigation as well as to development in hazard-prone areas.
4.2.1 State Policy and Programs
The State of Mississippi authorizes local governments to regulate development in flood-prone hazard areas. The State has not assumed authority to oversee development in flood-prone or hazard areas. Similarly, while the State has passed enabling legislation for local governments to zone and to adopt building codes, it has not sought the authority to do so.
All state agencies with state-owned or leased buildings that are located in a special flood hazard area are required to carry the maximum amount of flood insurance. The premiums are paid out of the agencies operating budget.
State funding capabilities for hazard mitigation projects: mitigation projects require a non-federal match of 25% or more. Mitigation projects do not have a State identified funding source. Projects throughout the State are implemented with a non-federal match from budgeted funds, CDBG funds or in-kind match. The applicant or sub-grantee will be provided administrative and technical assistance to implement a proposed project. Administrative and management cost are available to the state and local governments that participate in federal mitigation grant programs.
The following are eligible federal funds available to contribute to the 75 / 25 local matches for overall funding:
• U.S. Department of Housing and Urban Development Community Development Block Grant Funds,
• Appalachian Regional Commission Funds,
• Indian Health Service Funds,
• Increased Cost of Compliance (ICC) to fund elevation, relocation, demolition, and floodproofing costs,
• Small Business Administration funds, and
• Federal Home Administration loan funds.
Each state agency from the 2010 plan was afforded the opportunity to review their mitigation capabilities from the existing standard plan and provide updates to their current agency capabilities. This was accomplished by personal contact with agencies represented at the Hazard Mitigation Council meetings.
Sect. 4 : 350
Mississippi Emergency Management Agency
For those agencies who were not physically present at these events, an email which included a copy of their 2010 capability response and instructions as to how to evaluate their 2010 capabilities requesting them to review for update. The agencies who did not have changes are noted as no change from the 2010 submittal in the agency capabilities listed below.
Mississippi Emergency Management Agency (MEMA)
Authority for mitigation: Miss. Code 1972, Annotated. 33-15-7 Et. Seq.
The Office of Mitigation is responsible for coordinating disaster loss reduction programs, initiatives, and policies throughout the State of Mississippi. Disaster loss reduction measures are carried out through disaster reduction programs, initiatives, and policies through the development of State and local Hazard Mitigation plans and the implementation of strategies identified in the plans.
The Office of Mitigation administers the Hazard Mitigation Grant program, the National Flood Insurance Program’s Community Assistance Program and Map Modernization program, the Flood Mitigation Assistance Program, and the Pre-Disaster Mitigation program, and Severe Repetitive Loss Program. The Office of Mitigation’s Staff has grown from six to currently eighteen personnel. Floodplain Management, Grants and Planning Staff are assigned to all nine districts in the state. Mitigation Bureau Staff have been extensively trained in Benefit Cost Analysis, Grants Management, National Flood Insurance Program, Plan review, CAV, CAC, environmental, project application review, HAZUS and NEMIS Entry.
The Mitigation Grants Management Bureau administers hazard mitigation grants to State and local governments. These grants include mitigation planning grants, drainage projects, acquisition of high-risk flood structures, retrofitting critical facilities, warning systems, saferooms and storm shelters, and other cost-effective measures identified in the State and local government’s Hazard Mitigation Plan. The Mitigation Grants Management Bureau has developed a web site, www.MitigationMS.org that allows local governments/eligible applicants to submit applications online.
The Floodplain Management Bureau serves as the only compliance/regulatory focused bureau within the Agency. It is charged with the management of the Community Assistance Program - State Support Services Element (CAP-SSSE) which consists of providing oversight for the 330 participating National Flood Insurance Program (NFIP) communities and the 29 Community Rating System (CRS) members within the state.
A compliant community membership in the NFIP provides both the citizens and their communities with the opportunity to utilize the federally subsidized flood policies to protect their property and qualify for various grant and disaster assistance programs. As of 5/15/2013, this program has resulted in 75,057 individual flood insurance policies that equate to an insured flood damage coverage of $16.5 billion dollars. There have been 58,573 claims paid since 1978, in the amount of $2.9 billion dollars. Of those claims, approximately 1,520 policyholders filed additional Increased Cost of Compliance (ICC) claims for substantially damaged structures. Those actions resulted in payments of $30.2 million dollars, which resulted in the approximate 1,520 flood damaged structures being elevated or demolished (mitigated) within two years of damage.
The Bureau’s staff conducts an average of 35 Community Assistance Visits (CAV) compliance inspections per year. These inspections ensure the compliance of the communities with the NFIP, which enables
Mississippi Emergency Management Agency
Sect. 4 : 351
them to participate in the five Hazard Mitigation Assistance (HMA) programs, the state’s Hazard Mitigation Planning process, and the various disaster assistance programs administered by the federal government. Additionally, there is an average of 15 FPM training sessions or workshops conducted per year, as well as numerous technical assistance actions to state and local associations and to community governments.
The FPM Bureau is tasked with coordinating the agency’s portion of the Mississippi Flood Map Modernization Initiative. All of the 82 counties (including all incorporated communities within the counties), but 6 counties have maps which include both digital and paper format. This allows communities to better identify and regulate development in their Special Flood Hazard Areas. The 6 counties will be finished under this program when additional guidance for mapping decertified levees and funding comes from FEMA.
The FPM Bureau is joining the Risk Map Project. Risk Map expands traditional flood mapping to include risk assessment and mitigation planning. Risk Map is meant to better inform communities as they make decisions related to reducing flood risk by implementing all mitigation actions. This project calls for 4 meetings: Discovery, Flood Risk Review, Resilience, and Final/COO and Public. This bureau will support meeting for technical information. If flood map work occurs in the community, then the FPM will help by guiding local official with map adoption. The FPM Bureau will assist MDEQ on performing project outreach activities.
The Floodplain Management Bureau continues to conduct specialized training for state and local officials, such as offering the national Certified Floodplain Manager examination as a tool to both increase the professionalism and knowledge base within the floodplain management field. Since the inception of the CFM program within the United States, there have been 143 Mississippians certified as floodplain managers (as of 5/16/2013).
The Mitigation Planning Bureau is responsible for maintaining and updating the State of Mississippi Standard Hazard Mitigation Plan, which documents statewide hazard risk and the capability to mitigate the risk. The Planning Bureau also works with other state agencies, regional planning authorities, and local governments in the development of mitigation plans and strategies. The Mitigation Plans Bureau also provides technical assistance and training to local governments and state agencies in the development of their local hazard mitigation plans and keeps the local governments apprised of any new advances or policy changes in hazard mitigation planning.
Department of Agriculture and Commerce
(No change from the 2010 submittal)
Authority for Mitigation: Miss. Code 1972, Annotated. 69-1-1 (1972) Et. Seq.
The Department performs a regulatory function in the areas of sanitary inspections of grocery stores; agriculture theft; meat inspection; fruit and vegetable inspection; feed, seed, fertilizer and soil and plant inspection; weights and measure. The Department operates a seed testing laboratory, a metrology laboratory, and a grain moisture testing laboratory. The mitigation function of the agency is to ensure a sanitary food supply where the Department has authority.

Sect. 4 : 352
Mississippi Emergency Management Agency
Department of Archives And History
(No change from the 2010 submittal)
Authority for mitigation: Miss. Code 1972, Annotated. 39-5-1.
This agency has custody of and maintains care of all state records and material pertaining to the history of Mississippi. It also administers the State Records Management Program. It aids mitigation by supplying information on the frequency and severity of past disasters and the effectiveness of recovery efforts. It also supplies historical information on sites of proposed mitigation projects. Archives and History is a first response agency and is responsible for responding after a disaster to retrieve and stabilize record recovery for government offices. According to Federal Section 106 Review – Archives and History is required to make comment on debris removal on any project involving federal funding. The agency is collaborating with MEMA to develop a GIS data system in order to have that data (what is in place/existing) prior to a disaster.
Department Of Audit
(No change from 2010 submittal)
Authority for mitigation: Miss. Constitution, 1890. Art. V, 134.
The State Auditor’s Office conducts and maintains inventories of all state property. It aids mitigation by providing information on the state’s physical and financial resources and their locations.
Information Technology Services
(No change from 2010 submittal)
Authority for mitigation: Miss. Code 1972, Annotated. 25-53-5.
This agency is responsible for: the cost effective acquisition of data processing equipment and services for use by state agencies; computer communication facilities to provide necessary services to state government; engaging in the long-term planning of equipment acquisition for state agencies, and training state personnel in the use of equipment and programs. Information Technology Services (ITS) aids mitigation by maintaining communication and information networks and ensuring adequately trained personnel to operate them.
As a member of the Mississippi Coordinating Council for Remote Sensing (RS) and Geographic Information Systems (GIS), ITS maintains the Mississippi Geospatial Clearinghouse, which is designed to house the Mississippi Digital Earth Model (MDEM). The MDEM is comprised of the following GIS data layers: Geodetic Control, Elevation and Bathymetry, Orthoimagery, Hydrography, Transportation, Government Boundaries, and Cadastral. The Mississippi Geospatial Clearinghouse will be accessible to local governments, state and federal agencies, planning and development districts, and private entities in support of disaster mitigation, planning, and recovery.

Mississippi Emergency Management Agency
Sect. 4 : 353
Mississippi Development Authority
Marketing and Communications Division
Authority for mitigation: Miss. Code 1972, Annotated 33-15-2
Timely communication during and after a disaster to prevent loss of life and to mitigate public danger and property damage. Specifically, mitigation of business-related damage.
The MDA Communications Director serves also as the State’s CIO/Public Information Officer (PIO) acting as a key member of the agency’s emergency response team to perform essential functions including handling all media inquiries, organizing press conferences and press releases, and responding to information inquiries from Mississippi businesses and industries.
Under MEMA ESF 11 and 15, the PIO coordinates where appropriate with the Joint Information Center at MEMA and may provide communication support to MEMA during and after a disaster. When needed, the agency may activate a call center. The PIO will assist in the staffing and operation of the call center.
Mitigation and minimization of damage through timely communication is a key objective of this function.
Community Services Division
Authority for mitigation: Miss. Code 1972, Annotated. 57-1-5 (1984 supplement).
Administration of Community Development Block Grant (CDBG) Program funding for the non-Federal share of mitigation projects.
The Community Services Division creates a climate favorable to community growth and development. It administers the Community Development Block Grant Program (CDBG) and aids mitigation by funding the non-Federal share of hazard mitigation projects.
Department Of Environmental Quality
(No change from 2010 submittal)
Authority for mitigation: Miss. Code 1972, Annotated. 49-2-9 Et. Seq.
The Department of Environmental Quality promulgates rules and regulation; receives and expends state and federal funds, conducts studies on alternate uses of natural resources; and responds to incidents that threaten them. It aids mitigation by protecting the state’s natural resources and regulating their use. The Dam Safety Division is housed in the agency. MDEQ and MEMA serve as State Technical Partners in the Map Modernization Program and in active participants in the Mississippi Digital Earth Model and Remote Sensing Initiative.
MDEQ in collaboration with MDA, is administering the use of HUD CDBG funds designated for the development and enhancement of new water, wastewater and storm water infrastructure on the Gulf Coast. Key in the development of the Master Plan for this program was providing infrastructure in areas less likely to be impacted by storms. Additionally, MDEQ has expanded ability to respond and collaborate with our State and Federal Partners in natural disaster related impacts such has debris disposal management,

Sect. 4 : 354
Mississippi Emergency Management Agency
hazardous material management and wastewater treatment system recovery.
Department Of Marine Resources
(No change from 2010 submittal)
Authority for Mitigation: Miss Code 1972, Annotated. 49-15-11 (1972)
This agency aids hazard mitigation through (1) buyout programs, (2) preservation, creation, restoration, and enhancement activities, (3) education and outreach programs, and (4) our Mississippi Coastal Preserves Program. With buyouts, we partner with federal and state agencies, environmental organizations, and the private sector to identify susceptible, repetitive-loss properties and move them into public ownership through donation, purchase, or other means. These partnerships also facilitate our preservation, creation, restoration, and enhancement programs. DMRs current plan, which has been endorsed by Governor Barbour, is to preserve, create, restore, or enhance over 15,000 acres of coastal marsh, wetlands, or forests, to double the footprint of Deer Island, and to restore our offshore barrier islands (Petit Bois, Horn, Ship, and Cat Islands) to their pre-Camille footprint and functionality. Our education and outreach programs are through partnerships with local academic institutions, other state and federal agencies, and the private sector. We focus on environmental conservation, principles and practices of smart growth and smart code, sustainable development, and sound environmental stewardship. Our Coastal Preserves Program is a partnership with the MS Secretary of State and the MS Legislature through which parcels of land are identified as complimentary to increased environmental protection and conservation, those parcels are acquired through purchase, donation, or other means, and funds are provided to manage and enhance those properties.
Department Of Public Safety
Authority for mitigation: Miss. Code 1972
The Department of Public Safety (DPS) aids mitigation by enforcing traffic laws and regulations on Mississippi highways and roads. It issues and renews driver’s licenses, furnishes qualified personnel to take part in investigations, and provides assistance to communities during emergencies and disasters.
This department also houses the Office of Homeland Security. The Mississippi Office of Homeland Security assists by providing funding to state and local agencies. This funding is used to purchase preparedness equipment, provide training and certification to first responders, develop plans and standard operating guidelines for agencies and response teams, and to exercise and evaluate these response plans.
DPS also works with MDOT and Louisiana State Police during emergencies to provide logistical and security support consistent with contraflow operations on our Interstates. DPS also now has the capability to feed and fully support our first responders when deployed to a disaster area. DPS has also added an additional helicopter designated to assist in search and rescue operations as well as having a heavy lift capability.
Department Of Wildlife, Fisheries, And Parks
Authority for mitigation: Miss. Code 1972, Annotated. §49-1-29; §49-4-1, Et. Seq.
The Department of Wildlife, Fisheries and Parks aids in hazard mitigation through its conservation and

Mississippi Emergency Management Agency
Sect. 4 : 355
protection of wildlife habitats, and freshwater and estuarine fisheries and ecosystems.
Institutes Of Higher Learning
(No change from 2010 submittal)
Authority for mitigation: Miss. Code 1972, Annotated. 37-101-1.
Mississippi Institutions of Higher Learning, through its eight universities, continues mitigation efforts to provide safe environments for its employees, faculty, students and guests. Additionally, Mississippi Institutions of Higher Learning contributes to statewide hazard mitigation efforts though education, research, technical assistance, community service and facilities.
Mississippi Insurance Department
(No change from 2010 submittal)
Authority for mitigation: Miss. Code 1972, Annotated. 83-1-1 Et. Seq.
The Insurance Department executes all laws relative to insurance companies, corporations, associations, and their agents and adjusters. It aids mitigation by licensing and regulating manufacturers and dealers of mobile homes; enforcing the LP gas inspection program; and administering the Standard Fire Code. The State Fire Marshal’s office is located in the Department of Insurance.
Since 2005, the following changes have been created, made, or supported by the Mississippi Insurance Department (MID) which support hazard mitigation:
• The creation and continued progress of the MID Hurricane Katrina Mediation Program which can now be used to mediate future disaster claims.
• The creation and continued progress of the MID Hurricane Katrina Arbitration Program which may also be used in arbitration of future claims.
• The development and continued use of a Flood Insurance Outreach program.
• The development and continued use of an updated Storm Preparedness web site.
• Support from MID and the State Fire Marshal’s office of the state legislation which created the Building Codes Council which advocates stronger building codes for coastal counties
• Regulation which now requires the licensing of public adjusters in Mississippi
• Policy holder Bill of Rights regulation which will assist consumers in completely understanding homeowner policy coverage
• Working with Governor’s office in securing CDBG grant funds to assist funding for the Mississippi Windstorm Underwriting Association, which will aid in lowering premium costs for both homeowner’s and businesses
• Championed passage of the Wind Pool Bill which sets in place future state funding for the program
*NOTE: The State Fire Academy, a sub-agency of the Mississippi Insurance Department, submitted its

Sect. 4 : 356
Mississippi Emergency Management Agency
plans separately.
Mississippi Library Commission
(No change from 2010 submittal)
Authority for mitigation: Mississippi Code 1972, Annotated, 39-3-107.
The Library Commission gives advice to libraries and communities on establishing and maintaining libraries; accepts and uses funds to establish, stimulate, increase, improve, and equalize library services; adopts rules/regulations relative to the allocation of state aid funds to public library systems; and operates a library to support libraries, state government, and the public. The agency’s mission is “Commitment – through leadership, advocacy, and service – to strengthening and enhancing libraries and library services for all Mississippians.”
To accomplish this mission, the Library Commission:
1. Operates a secure, state-of-the-art 62,000 sq. ft. facility at 3881 Eastwood Drive in Jackson, MS. The five-story building, of poured concrete and steel, includes: one below-ground level; wired and wireless high-speed Internet connectivity; a natural gas-powered generator to support basic functions, including data center, in power outages; 100+ windows throughout the building that open; meeting rooms equipment with distance learning capabilities and kitchen facilities; computer training facilities; public access computers; large parking lots; large, open research facilities; and a state-of-the-art data center to support Internet services to Mississippi public libraries & the agency’s networking needs.
2. Operates a large library with traditional and electronic information resources and a highly qualified research staff to respond to requests for information and in-depth research. Provides interlibrary loan services for specific titles and loans materials on a short-term and long-term basis to libraries, state government, and the general public. Serves as the only library for the blind and physically handicapped in the state. Is the only patents and trademarks library in the state. Is a depository for federal publications and the depository of all publicly-released publications of state government.
3. Provides consulting services to library staffs, trustees, and local governments on establishing and maintaining library services.
4. Provides grant funds, federal and state, to public libraries.
5. Works with public libraries statewide. People have access to public library services in all 82 MS counties. All 241 public libraries are
managed by trained, dedicated staff with local community knowledge, skills to assist the public and high-speed Internet capabilities available through multiple public access computers. Most have meeting room facilities with kitchen facilities, large reading rooms, comfortable seating, study tables, etc.
6. Is a member of the statewide cultural alliance comprised of the MS Arts Commission, the MS Department of Archives & History, the MS Humanities Council, and the Library Commission.
The purpose of the “Culture Club” is to coordinate responses in case of an emergency; to encourage

Mississippi Emergency Management Agency
Sect. 4 : 357
local cooperation among cultural organizations (i.e. libraries, museums, visual & performing arts groups, etc.); to secure funds, supplies, manpower, and facilities to protect cultural heritage such as local histories, city & county records, art works, buildings, etc. before and after a disaster.
In case of an emergency, the Library Commission:
• Serves as clearinghouse for evacuated or stranded public library employees and public library systems to ensure communication outside disaster area.
• Provides public library systems with access to remote office space/equipment/supplies to ensure business continuity.
• Secures and delivers needed resources (supplies, equipment, labor, library materials, etc.) to affected libraries.
• Identifies and seeks outside funding and assistance.
• Connects affected libraries with funders, opportunities, suppliers, vendors, counselors, etc.
• Advocates for libraries at local, state, and national levels on:
◊ Central, community roles of libraries including communications; connectivity; comfortable, safe environment; staff trained to assist; meeting facilities; etc.
◊ Funding needs.
◊ Role of libraries as early responders in times of disaster.
• Modifies rules & regulations to accommodate affected libraries & libraries serving the affected public (evacuees, law enforcement, military, relief workers, volunteers, etc,).
• Serves as spokesperson with state, national, and international media.
• Seeks speaking opportunities to tell library story and story of lessons learned.
• People turn to libraries in times of emergency for information, for access, for comfort, and for a place of refuge. After Katrina, this fact was validated as evacuees sought shelter further inland or returned to affected areas.
• Supports work of libraries serving the affected public in many ways including:
◊ Reestablishing public library service as quickly as possible.
◊ Setting up alternate ways to deliver services through temporary facilities, donated bookmobiles, information kiosks, satellite Internet connectivity, etc.
◊ Using trained library staff to assist people, relief workers, city/county government, etc.
◊ Serving as communication centers; volunteer coordination centers; relief centers and early responders.

Sect. 4 : 358
Mississippi Emergency Management Agency
◊ Expanding library hours to accommodate people in need;
◊ Issuing library cards to anyone temporarily living in community;
◊ Designating library computers for relief-efforts-only to for completion of FEMA and insurance forms online, to contact friends and family, and to search for assistance;
◊ Offering free photocopy and fax services.
◊ Using library facilities to accommodate relief workers and relief efforts. Serving as relief centers for water/ice, blue tarp distribution, makeshift shower facilities, food stamp card distribution, etc.
The Mississippi Library Commission and the Mississippi library community have a great deal to contribute to mitigation before and after an emergency. The library garners public trust: despite being a public institution, it is not perceived as “the government”. Several factors make libraries ideal as early responders to emergencies: the library staff is trained to assist the public; libraries have multiple points-of-access to high speed connectivity, which facilitates communication; and in many instances, the facilities can accommodate larger groups of people.
Mississippi Automated Resource Information Systems (MARIS)
(No change from the 2010 submittal)
Authority for mitigation: Miss. Code 1972, Annotated. 57-13-23.
Mitigation capability: MARIS stores, processes, extracts, and disseminates useful information on the state’s resources. The Policy Committee is made up of representatives from 22 state agencies. The agency aids mitigation by developing uniform standards for geographic information systems used in state agencies.
Mississippi Department Of Transportation
(No change from the 2010 submittal)
Authority for mitigation: Miss. Code 1972, Annotated. 65-1-13.
The following is a brief description of the Mississippi Department of Transportation’s (MDOT) on-going hazard mitigation capabilities.
1. Construction, reconstruction and maintenance of transportation facilities vital to evacuation, response, and re-entry. This includes but is not limited to seismic retrofitting of bridges, the upgrading of traffic control devices after destruction, construction of transportation facilities to avoid flood prone areas whenever possible, and other precautionary design work – including wetlands mitigation – which reduces risk before, during and after an emergency.
2. Education and communication outreach programs to include information provided to the general public concerning Contraflow, pet evacuation, and general preparedness.

Mississippi Emergency Management Agency
Sect. 4 : 359
3. Training for MDOT response personnel at all levels for a wide range of natural and man-made hazards.
4. In-house emergency coordination staff increased from 4 in 2005 to 15 today; this group is MDOT’s ESF-1 representative at the State Emergency Operations Center.
5. Maintenance of a Comprehensive Emergency Transportation Response Plan which is updated regularly.
6. Emergency preparedness for a 72-hour window of self-sufficient after a disaster. This is accomplished through improvements made to emergency supplies, storage facilities, acquiring sufficient fuel reserves, as well as housing, food and water for transportation emergency workers.
7. Improvements in communication capabilities through the purchase of additional satellite radio units to serve as redundant communications backup. In addition, a mobile communications platform and a command/control center have been made operational.
8. Evaluation of standard operating procedures in all areas, but specifically within procurement to enable the agency to function more efficiently and quickly in the purchase of emergency supplies.
9. Provision of remote traffic sensing, which will aid in traffic management during evacuations and re-entries.
10. Development of partnerships with various state, federal and/or local agencies to save lives and reduce future losses. These include:
a) The GIS Coordinating Council in the development of the Mississippi Digital Earth Mapping Initiative.
b) Key emergency response agencies to aid in providing fuel. These agencies include the Mississippi Emergency Management Agency, Mississippi Department of Health, and Wildlife, Fisheries and Parks.
11. Acquiring travel trailers to provide housing accommodations for transportation emergency workers during extended events.
12. Placement of three Mobilization Centers in northwest Mississippi to provide for command/control and serve as a base of operations to support earthquake emergency response activities.
Mississippi Authority for Educational Television (d/b/a Mississippi Public Broadcasting)
(No change from 2010 submittal)
Authority for mitigation: Miss. Code 1972, Annotated. 37-63-1 Et. Seq.
Mitigation capability: Mississippi Public Broadcasting (MPB) is a public service agency, providing the citizens of the state with Educational, Public Service and Informative programming. Mississippi Public Broadcasting aids mitigation by serving as the primary source for statewide Emergency information utilizing

Sect. 4 : 360
Mississippi Emergency Management Agency
its network of Radio and Television transmitters and towers. MPB supports MEMA with technical and production staff and broadcast equipment to offer video and audio to all outside news organizations from MEMA’s Press Room and aids in the operation of the Joint Information Center. The Mississippi Department of Transportation, in partnership with MPB, has identified MPB FM frequencies on evacuation route signs. When a mandatory evacuation is ordered, MPB is required to provide updates every 15 minutes via its statewide Radio network. In the event of a state of emergency, MPB Radio will broadcast crucial information as long as a need for information exists.
Mississippi Forestry Commission
Authority for Mitigation: Miss. Code 1972, Annotated § 49-19-1.
The Mississippi Forestry Commission (MFC), by statute, has the responsibility “To take such action so as to provide and maintain the organized means, as deemed necessary and expedient, to prevent, control and extinguish forest fires. This responsibility extends to cover approximately 19.2 million acres of private, school trust and other state-owned forest and non-forest lands. The MFC has apportioned Mississippi into seven (7) administrative districts, each with a compliment of staffed dozer/plow units. There are five dispatch centers and aerial detection resources to provide the capability of coordinating wildland fire mitigation efforts. The MFC embraces and uses the Incident Command System when engaged in wildland suppression efforts and other disaster emergencies that impact the state and where the agency’s resources are needed to support mitigation and/or recovery efforts.
The Public Outreach arm of the Mississippi Forestry Commission provides the capability to inform and educate the public and private sectors. A full time Firewise Coordinator is actively engaged in promoting the means by which individual and communities can take measures to protect personal property.
Office Of The Attorney General
(No change from the 2010 submittal)
Authority for mitigation: Miss. Constitution, 1890. Art. VI, 173.
The Attorney General’s Office has a staff of attorneys to represent state agencies and officials in the areas of litigation, opinion processing, governmental affairs, public integrity investigations, and public interest advocacy. It aids mitigation by interpreting state law and providing legal counsel to state agencies.
Office of the Governor
(No change from 2010 submittal)
Authority for mitigation: Miss. Constitution, 1890. Art. V, 116.
In response to Hurricane Katrina, the Governor created the Governor’s Commission on Recovery, Rebuilding and Renewal. The commission brought together citizens, community officials, business leaders, non-profits, and other experts to formulate plans and make recommendations to establish a framework for rebuilding areas damaged by Hurricane Katrina. Recovery plans and recommendations dealt with mitigation issues and redevelopment that avoids the impact of hurricanes and other natural disasters. Publications issued by the Governor’s Commission include “After Katrina: Building Back Better

Mississippi Emergency Management Agency
Sect. 4 : 361
Than Ever”, “Mississippi Renewal Forum Summary Report“, and “A Pattern Book for Rebuilding Gulf Coast Neighborhoods.” These publications and the commission’s mass planning effort ensured the smart redevelopment of damaged areas and encouraged planning that considered the impact of future natural disasters.
After the commission issued its final report in December 2005, the Governor created the Office of Recovery and Renewal within the Governor’s Office. The office coordinates government recovery assistance at all levels and offers advisory help to state agencies and local jurisdictions. The office is assigned four overarching tasks:
1. Obtaining the maximum amount of disaster assistance funds and maximizing the use of credit in-lieu of cash
2. Providing policy advice to the Governor, his staff, other state agencies, and local governments
3. Providing technical assistance, education, and outreach to organizations tasked with recovery
4. Identifying responsible entities and facilitating the implementation of the recommendations in the Governor’s Commission final report as directed by the Governor
The Governor is coordinating both the distribution and use of Hurricane Katrina disaster funds and overall recovery policy in a manner that is cognizant of the threat of future hurricanes and other natural disasters.
Office of the Lieutenant Governor
(No change from the 2010 submittal)
Authority for mitigation: Miss. Constitution, 1890. Art. V, 128.
The Lieutenant Governor will preside over the Senate, rule on points of order, assign bills to committees, nominate standing committees of the senate, and appoint all select and conference committees as passed by the Senate. An ex officio member of the Senate Rules Committee and member of the Legislative Budget Committee. May vote only in the case of a tie, may speak from the floor while the Senate is in Committee of the Whole, and signs all finally adopted bills and resolutions.
Public Service Commission
(No change from 2010 submittal)
Authority for Mitigation: Miss. Code 1972, Annotated. 77-1-1 (1990).
The duty and responsibility of the Public Service Commission is to regulate communication, electric, gas, water and sewer utilities that are under the supervision and regulation of the commission. Primary mitigation responsibility is to insure that the facilities constructed or acquired are required for the convenience, safety and necessity of the public. The Public Service Commission also helps to identify threats to public utilities by natural hazards.
Soil And Water Conservation Commission
(No change from the 2010 submittal)
Sect. 4 : 362
Mississippi Emergency Management Agency
Authority for mitigation: Miss. Code 1972, Annotated. 69-27-2 (1984 supplement).
This agency is responsible for coordinating the programs of soil and water conservation districts. It aids mitigation by securing cooperation and assistance from Federal and other State agencies. The agency studies, evaluates, and classifies land use problems and needs; distributes funds, and manages the agricultural and non-point source pollution program. The Commission’s contribution to hazard mitigation is to develop an awareness and to mitigate local pollution problems.
State Board for Community and Junior Colleges
(No change from 2010 submittal)
Authority for mitigation: Miss. Code 1972, Annotated. 37-4-3 (1986 supplement).
These institutions can contribute to hazard mitigation through their educational programs to prepare for and overcome natural disasters. This could be accomplished through community service programs and career technical programs in the various districts. Due to the many locations statewide, community colleges could also provide facilities for the delivery of shelter and supplies to victims.
State Department Of Health
(No change from the 2010 submittal)
Authority for Mitigation: Miss. Code 1972, Annotated. 41-3-15 (1972).
Providing protection to the public from threats to health and safety from unsanitary conditions relating to food, drinking water and sewage, unnecessary exposure to radiation and unhealthy and unsafe conditions in health care facilities, childcare facilities, and the workplace. Helps identify threats to potable water supply caused by natural hazards.
State Fire Academy
(No change from 2010 submittal)
Authority for mitigation: Miss. Code 1972, Annotated. 45-11-7 (1988 supplement).
The Fire Academy trains and educates persons engaged in municipal, county, and industrial fire protection and trains local law enforcement officers in arson investigation.
The Fire Academy is in compliance with the National Incident Management Systems (NIMS) under the Presidential Directive. Also, the Academy offers NIMS courses state-wide to all emergency response personnel through a federally funded grant.
Water Development Districts
(No change from 2010 submittal)
Pat Harrison Water Management District, Pearl River Valley Water Supply District and Tombigbee River Valley Water Management District
Mississippi Emergency Management Agency
Sect. 4 : 363
Authority for mitigation: Miss. Code 1972, Annotated. 51-13-103, 51-15-103, 51-9-105.
These watershed management districts are responsible for regulating the waters within their jurisdictions in order to conserve, protect, and develop them to provide adequate, sanitary water supply, control flooding, and ensure irrigation water when needed.
Board Of Animal Health
(No change from the 2010 submittal)
Authority for Mitigation: Miss. Code of 1972, Annotated. § 69-15-1.
To deal with all contagious and infectious diseases of animals in the opinion of the Board as may be prevented, controlled, or eradicated with power to make, promulgate, and enforce such rules so as to prevent the introduction and spread of those diseases.
Department of Finance and Administration
(No change from 2010 submittal)
Authority for mitigation: Miss. Code 1972, Annotated. 33-15-307(5)
The Department of Finance and Administration (DFA) is responsible for managing and administering state finances and programs. Its primary mitigation responsibility is to ascertain if amounts requisitioned by the Mississippi Emergency Management Agency (MEMA) from the Disaster Assistance Trust Fund are within the limits set forth in statute and transfer appropriate amounts from the Working Cash Stabilization Fund to the Disaster Assistance Trust Fund. DFA also administers the Disaster Recovery Fund and the Emergency Aid to Local Government Loand and Grant Program, provides administrative support to the Governor’s Authorized Representative (GAR)/MEMA in connection with the Special Community Disaster Loan Program (SCDL), and provides daily support to MEMA insofar as routine and extraordinary fiscal, budget and procurement activities.
Post-Katrina, DFA has developed and is in the process of finalizing, its formal Continuity of Operations Plan (COOP) and Business Continuity Plan (BCP), both of which will interface with its successfun pre-Katrina Business Resumption Plan (BRP).
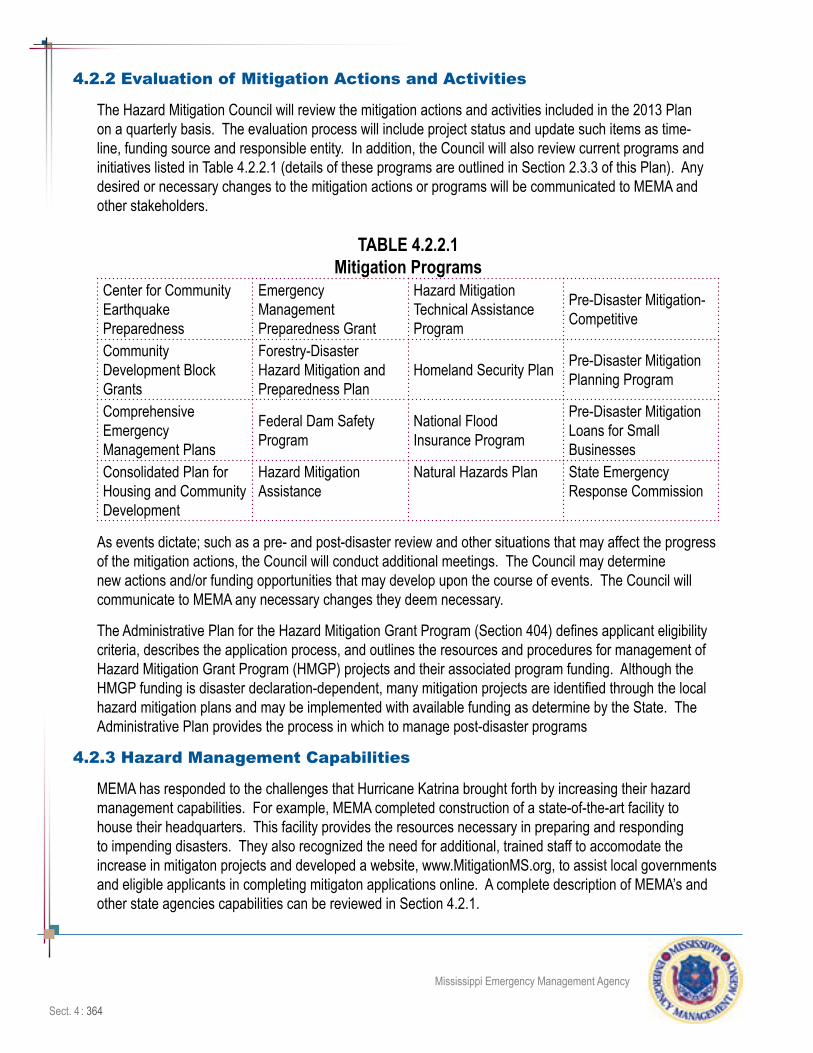
Sect. 4 : 364
Mississippi Emergency Management Agency
4.2.2 Evaluation of Mitigation Actions and Activities
The Hazard Mitigation Council will review the mitigation actions and activities included in the 2013 Plan on a quarterly basis. The evaluation process will include project status and update such items as time-line, funding source and responsible entity. In addition, the Council will also review current programs and initiatives listed in Table 4.2.2.1 (details of these programs are outlined in Section 2.3.3 of this Plan). Any desired or necessary changes to the mitigation actions or programs will be communicated to MEMA and other stakeholders.
TABLE 4.2.2.1Mitigation Programs
Center for Community Earthquake Preparedness
Emergency Management Preparedness Grant
Hazard Mitigation Technical Assistance Program
Pre-Disaster Mitigation-Competitive
Community Development Block Grants
Forestry-Disaster Hazard Mitigation and Preparedness Plan
Homeland Security Plan Pre-Disaster Mitigation Planning Program
Comprehensive Emergency Management Plans
Federal Dam Safety Program
National Flood Insurance Program
Pre-Disaster Mitigation Loans for Small Businesses
Consolidated Plan for Housing and Community Development
Hazard Mitigation Assistance
Natural Hazards Plan State Emergency Response Commission
As events dictate; such as a pre- and post-disaster review and other situations that may affect the progress of the mitigation actions, the Council will conduct additional meetings. The Council may determine new actions and/or funding opportunities that may develop upon the course of events. The Council will communicate to MEMA any necessary changes they deem necessary.
The Administrative Plan for the Hazard Mitigation Grant Program (Section 404) defines applicant eligibility criteria, describes the application process, and outlines the resources and procedures for management of Hazard Mitigation Grant Program (HMGP) projects and their associated program funding. Although the HMGP funding is disaster declaration-dependent, many mitigation projects are identified through the local hazard mitigation plans and may be implemented with available funding as determine by the State. The Administrative Plan provides the process in which to manage post-disaster programs
4.2.3 Hazard Management Capabilities
MEMA has responded to the challenges that Hurricane Katrina brought forth by increasing their hazard management capabilities. For example, MEMA completed construction of a state-of-the-art facility to house their headquarters. This facility provides the resources necessary in preparing and responding to impending disasters. They also recognized the need for additional, trained staff to accomodate the increase in mitigaton projects and developed a website, www.MitigationMS.org, to assist local governments and eligible applicants in completing mitigaton applications online. A complete description of MEMA’s and other state agencies capabilities can be reviewed in Section 4.2.1.
Mississippi Emergency Management Agency
Sect. 4 : 365
4.3: Local Capabilities Assessment
44 CFR 201.4(c)(3)(ii) - The State mitigation strategy shall include the following elements:
A mitigation strategy that provides the State’s blueprint for reducing the losses identified in the risk assessment. This section shall include:
A general description and analysis of the effectiveness of local mitigation policies, programs, and capabilities.
The local capability assessment provides a general description of local mitigation capabilities in Mississippi, including examples of successful policies and programs, and an analysis of the effectiveness of these capabilities based on local evaluations. Local capabilities are the existing programs and policies through which local governments implement mitigation actions to reduce potential disaster losses. The assessment concludes with a discussion of challenges and opportunities to implementing and strengthening local capabilities.
Methodology
The State analyzed the local capabilities identified in FEMA-approved local hazard mitigation plans in Mississippi to provide an updated general description of local mitigation capabilities and to assess the challenges and opportunities to improving local capabilities. Additional information on the effectiveness of local mitigation capabilities and opportunities and challenges for building local capabilities was gathered through a survey distributed at the Mississippi Preparedness Summit, “Partners in Preparedness” on April 17-19, 2013, the annual conference of the Association of Floodplain Managers of Mississippi, April 29-May 1, 2013, the Building Association of Mississippi on June 10-14, 2013, and the Mississippi Civil Defense Emergency Management Association April 17-19, 2013.
Local Policies, Programs, and Capabilities
Planning, building, zoning, floodplain management, and fire codes are functions of local government. State law authorizes local governments to undertake these activities, but does not require them to do so. Regulations and their enforcement will vary between communities throughout the state. The effectiveness of local mitigation policies, programs, and capabilities is directly related to the level of adoption and degree of enforcement. The State has encouraged communities to adopt codes and ordinances and has provided Model A and Model B-E ordinances for this purpose. Through mitigation planning, local governments can identify the strengths and weaknesses in their mitigation capabilities and implement strategies to improve these. A general description of the types of local mitigation capabilities in Mississippi follows.
Land Use Planning
Authority: Miss Code 1972, Annotated. 17-1-11 et. seq.
Title 17, Chapter 1 permits municipal and county governments to adopt zoning regulations for the purpose of ensuring the most appropriate use of community lands and to provide for the preparation, adoption, amendment, extension, and carrying out of a comprehensive plan for the purpose of bringing about coordinated physical development in accordance with present and future needs. Chapter 1

Sect. 4 : 366
Mississippi Emergency Management Agency
also authorizes the establishment of local planning commissions to advise municipal and county governments in matters pertaining to physical planning, subdivision of land, zoning ordinances, building set back lines, and enforcement of regulations. Title 17 further authorizes any two or more counties or municipalities to establish regional planning commissions composed of representatives from the participating counties and municipalities. Regional planning commissions are established for the purpose of advising local governments on problems related to acquisition, planning, construction, development, financing, control, use, improvement, and disposition of buildings and other structures, facilities, goods, and services.
No local land use plans are mandated by state law. State law does specify that the city or county legislative body must legally adopt a comprehensive plan to put it into effect. The state also requires that the zoning be based upon and consistent with the legally adopted plan. If a local government chooses to develop and adopt a comprehensive plan, the law does specify a list of elements that must be included, but no natural hazards element is required.
Building, Fire, and Other Codes
Authority: Miss. Code 1972, Annotated. 19-5-9.
Title 19, Chapter 5 authorizes certain counties to adopt, as minimum standards, building codes published by a nationally recognized code group.
Authority: Miss Code 1972, Annotated. 2 1-19-25.
Under Title 21, Governing authorities of any municipality are authorized to adopt building, plumbing, electrical, gas, sanitary, and other codes to protect the public health, safety, and welfare.
Authority: Miss. Code 1972, Annotated. 21-19-21.
Title 21, Chapter 19 authorizes municipal authorities to pass fire safety regulations relating to structures and buildings used as residences or businesses. Chapter 19 further permits local authorities to inspect all buildings and land and take down, remove, or rehabilitate, at the owner’s expense, properties found to be unsafe with respect to fire hazard.
Mississippi does not adopt or enforce a statewide building code for all structures, nor does it mandate a code for residential construction. It is up to local jurisdictions to adopt and enforce building codes.
House Bill 1406, passed in 2006, creates the Mississippi Building Code Council. It also requires five coastal counties, Jackson, Harrison, Hancock, Stone, and Pearl River, and the municipalities located there, to enforce all the wind and flood mitigation requirements prescribed by the 2003 International Residential Code and the 2003 International Building Code. The Mississippi Building Codes Council adopted the 2003 International Building Code and 2003 International Residential Code for the state, but does not require local jurisdictions to adopt building codes, but requires that they use the International Codes if they do adopt codes.
Mississippi Emergency Management Agency
Sect. 4 : 367
Local Emergency Management
Authority: Miss Code 1972, Annotated. 33-15-17.
Local governments are authorized to establish organizations for emergency management with a director having responsibility for the organization’s administration and operation. Local emergency management organizations may be composed of a single county or municipality or two or more counties or municipalities. Local emergency management organizations are further authorized to enter into mutual aid agreements with other public and private agencies in the state.
Authority: Miss. Code 1972, Annotated. 2 1-19-23.
The Statewide Mutual Aid Compact, or SMAC, began in 1995 by MEMA to provide a more effective use of resources in times of disaster. It provides a way for cities and counties to request and receive help from each other when local resources are exhausted. SMAC provides a mechanism for assistance to come from different parts of the state. It addresses the issues of liability, compensation, direction and control in a uniform manner. SMAC allows members of the compact to have a mutual aid agreement with both the state and other compact members.
All 82 counties and the Mississippi Band of Choctaw Indians (MBCI) in Mississippi now have a full or part-time emergency management program as well as a designated emergency management or civil defense director. In addition all 82 counties are in the process of updating their Comprehensive Emergency Management Plan (CEMP) and they will be on file with the Mississippi Emergency Management Agency (MEMA).
Water Management and Flood Control Districts
Authority: Miss. Code 1972, Annotated. 51-29-1 et. Seq.; 51-31-1 Et seq.
Counties may form drainage districts for the purpose of developing, maintaining, and improving drainage systems to prevent flood-related damage.
Authority: Miss. Code 1972, Annotated. 51-35-101 Et seq.
Counties may form flood control districts for the purpose of cooperating with the federal government in the construction, maintenance, and operation of dams, reservoirs, and other flood control projects.
Authority: Miss. Code 1972, Annotated. 51-35-301.
Municipalities of 100,000 or more and urban counties of 100,000 or more and adjacent areas are authorized to establish urban flood and drainage districts.
Authority: Miss. Code 1972, Annotated. 5 1-8-1 Et seq.
Chapter 8 authorizes the formation of master water management districts composed of two or more existing drainage or water management districts, parts of existing districts, or territory not included in any district. Formation of a master water management district is contingent on the approval of a certain percentage of landowners within the proposed district. Master water management districts may cooperate with federal agencies in projects designed to prevent flood damage, improve drainage, and

Sect. 4 : 368
Mississippi Emergency Management Agency
foster conservation of water resources.
Flood Insurance
Authority: Miss. Code 1972, Annotated 43-41-11.
The National Flood Insurance Program (NFIP) has identified flood hazards in Mississippi communities. Presently, 81 counties, one water supply district (Pearl River Valley), and 248 municipalities participate in the NFIP, for a total of 330 “communities”. Authority was granted at the local level by the state legislature to administer the NFIP using the local government’s “police power” to regulate land use.
Tables of Community Mitigation Capability Assessment
Table 4.3.1 in the previously-approved 2010 Mississippi Hazard Mitigation Plan displayed local capabilities related to existing planning and policy mechanisms. The table provided status for each county and city on the following capabilities:
• National Flood Insurance Program (NFIP) participation
• Number of Flood Insurance Policies within NFIP participating jurisdictions
• Community Rating System (CRS) participation
• Comprehensive/master/general plan
• Hazard mitigation plan
• Residential building code
• Commercial building official
• Building Code Effectiveness Grading System (BCEGS) rating for residential buildings
• Building Code Effectiveness Grading System (BCEGS) rating for commercial buildings
• Zoning code
• Subdivision regulations
• Fire code rating
During the 2013 update process, information was collected from 104 approved local hazard mitigation plans and was used to update the table and provide additional information on capabilities. These fields were updated and additional information was collected on CRS participation and rating and building code type. Some local plans did not provide information on each of these capabilities. Table 4.3.1 displays the number of counties and cities that reported whether they had each capability or not, and of those counties and cities, the percent with each capability.

Mississippi Emergency Management Agency
Sect. 4 : 369
Table 4.3.1: Mitigation Capabilities of Counties and Cities
Identified in Local Plans
CapabilityCounties Cities
Number Reporting
Percent with Capability
Number Reporting
Percent with Capability
Comprehensive Plan 28 36% 82 30%Building Code 14 18% 76 29%Building Official 4 5% 24 9%Zoning Ordinance 11 14% 110 39%Subdivision Ordinance 16 20% 77 27%Floodplain Ordinance* 82 99% 248 87%*Adoption of floodplain ordinance is assumed based on participation in the NFIP, as calculated from the NFIP Community Status Book Report, May 22, 2013.
As shown in Table 4.3.1, a greater percentage of cities have each of the capabilities in place than counties, with the exception of comprehensive plan and floodplain ordinance. Besides comprehensive emergency management plans, floodplain ordinances are the capability, of those tracked, that the highest percentage of counties (99 percent) and cities (87 percent) have in place. In approved local plans that identified whether building codes had been adopted or not, 18 percent of counties and 29 percent of cities had adopted building codes.
All 82 counties have adopted comprehensive emergency management plans, and all have FEMA-approved local hazard mitigation plans. There are a total of 104 hazard mitigation plans. By reviewing and incorporating these local hazard mitigation plans with the state plan, a more comprehensive approach to reducing future losses from natural hazards is implemented. All levels of government can effectively prepare for, respond and recover from emergencies and disasters.
Table 4.3.2 shows the changes in local participation in the NFIP, CRS, and BCEGS from 2010 to 2013. The NFIP Participation total has increased by eighteen communities. BCEGS Rating increased from 44 cities and counties to 45 cities and counties.
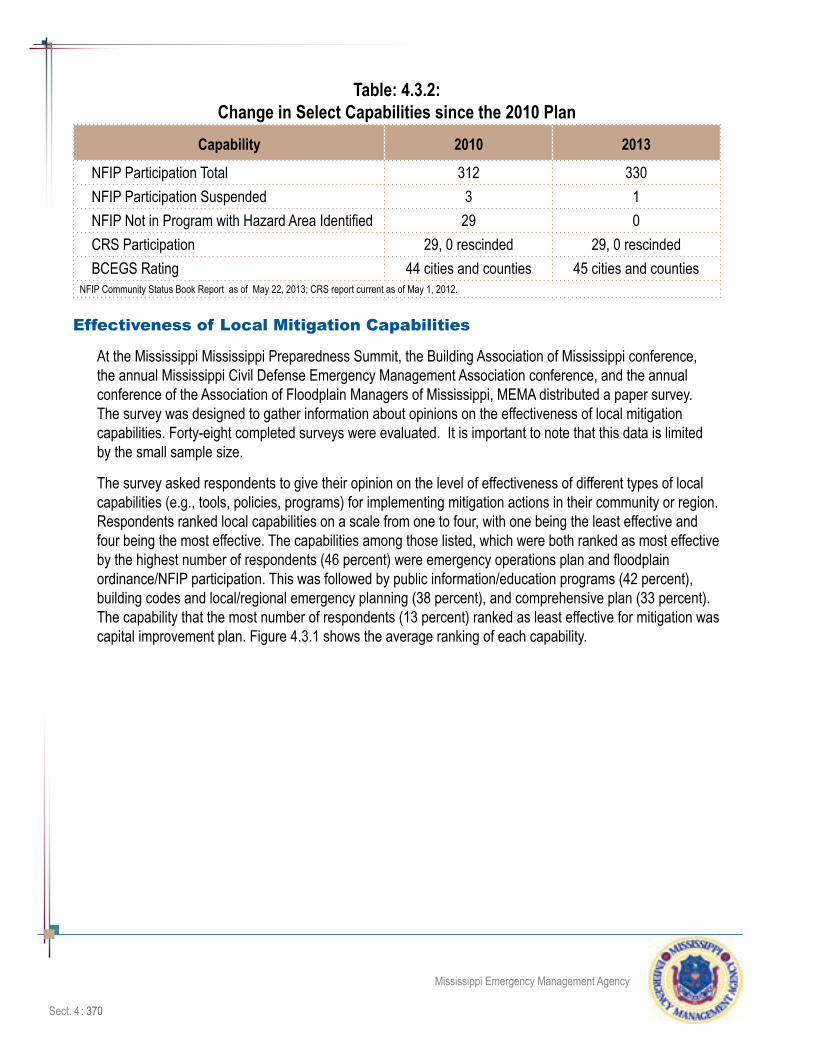
Sect. 4 : 370
Mississippi Emergency Management Agency
Table: 4.3.2: Change in Select Capabilities since the 2010 Plan
Capability 2010 2013
NFIP Participation Total 312 330NFIP Participation Suspended 3 1NFIP Not in Program with Hazard Area Identified 29 0CRS Participation 29, 0 rescinded 29, 0 rescindedBCEGS Rating 44 cities and counties 45 cities and counties
NFIP Community Status Book Report as of May 22, 2013; CRS report current as of May 1, 2012.
Effectiveness of Local Mitigation Capabilities
At the Mississippi Mississippi Preparedness Summit, the Building Association of Mississippi conference, the annual Mississippi Civil Defense Emergency Management Association conference, and the annual conference of the Association of Floodplain Managers of Mississippi, MEMA distributed a paper survey. The survey was designed to gather information about opinions on the effectiveness of local mitigation capabilities. Forty-eight completed surveys were evaluated. It is important to note that this data is limited by the small sample size.
The survey asked respondents to give their opinion on the level of effectiveness of different types of local capabilities (e.g., tools, policies, programs) for implementing mitigation actions in their community or region. Respondents ranked local capabilities on a scale from one to four, with one being the least effective and four being the most effective. The capabilities among those listed, which were both ranked as most effective by the highest number of respondents (46 percent) were emergency operations plan and floodplain ordinance/NFIP participation. This was followed by public information/education programs (42 percent), building codes and local/regional emergency planning (38 percent), and comprehensive plan (33 percent). The capability that the most number of respondents (13 percent) ranked as least effective for mitigation was capital improvement plan. Figure 4.3.1 shows the average ranking of each capability.
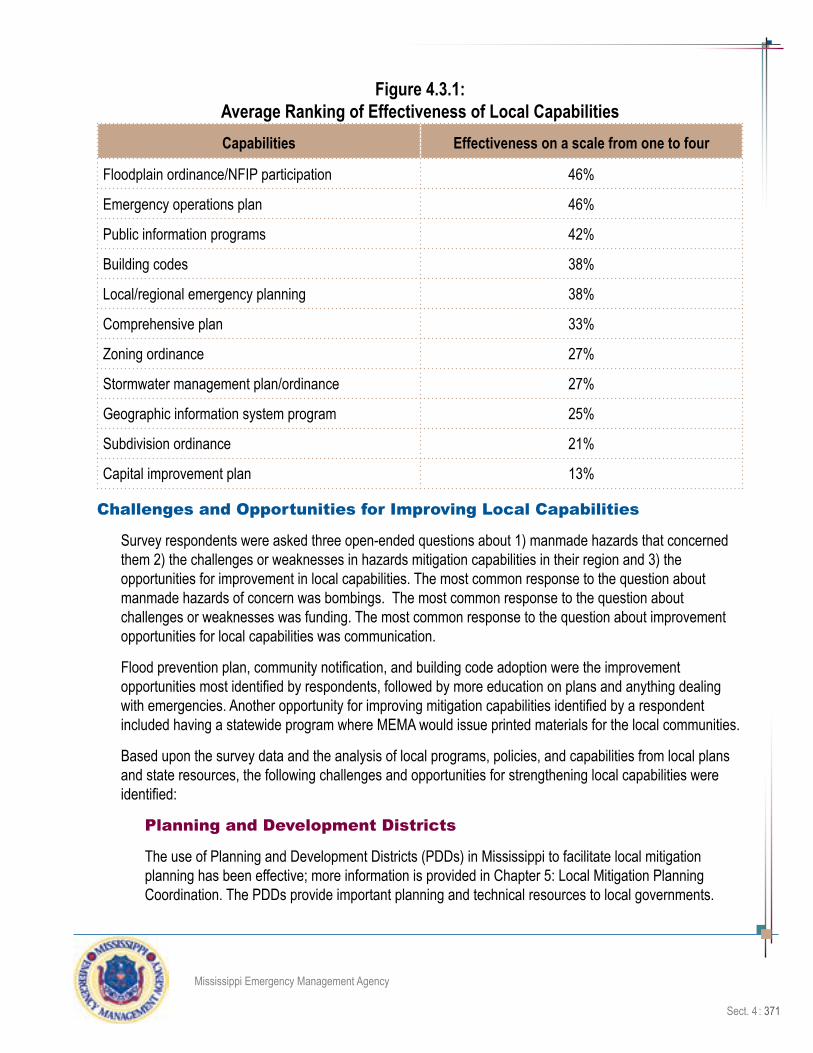
Mississippi Emergency Management Agency
Sect. 4 : 371
Figure 4.3.1: Average Ranking of Effectiveness of Local CapabilitiesCapabilities Effectiveness on a scale from one to four
Floodplain ordinance/NFIP participation 46%
Emergency operations plan 46%
Public information programs 42%
Building codes 38%
Local/regional emergency planning 38%
Comprehensive plan 33%
Zoning ordinance 27%
Stormwater management plan/ordinance 27%
Geographic information system program 25%
Subdivision ordinance 21%
Capital improvement plan 13%
Challenges and Opportunities for Improving Local Capabilities
Survey respondents were asked three open-ended questions about 1) manmade hazards that concerned them 2) the challenges or weaknesses in hazards mitigation capabilities in their region and 3) the opportunities for improvement in local capabilities. The most common response to the question about manmade hazards of concern was bombings. The most common response to the question about challenges or weaknesses was funding. The most common response to the question about improvement opportunities for local capabilities was communication.
Flood prevention plan, community notification, and building code adoption were the improvement opportunities most identified by respondents, followed by more education on plans and anything dealing with emergencies. Another opportunity for improving mitigation capabilities identified by a respondent included having a statewide program where MEMA would issue printed materials for the local communities.
Based upon the survey data and the analysis of local programs, policies, and capabilities from local plans and state resources, the following challenges and opportunities for strengthening local capabilities were identified:
Planning and Development Districts
The use of Planning and Development Districts (PDDs) in Mississippi to facilitate local mitigation planning has been effective; more information is provided in Chapter 5: Local Mitigation Planning Coordination. The PDDs provide important planning and technical resources to local governments.

Sect. 4 : 372
Mississippi Emergency Management Agency
Regional planning efforts also are an opportunity to coordinate land use issues to prevent one jurisdiction from adversely affecting the other and to integrate the mitigation plan with other regional plans. For example, the East Central Planning and Development District maintains the Comprehensive Economic Development Strategy for its nine-county district and incorporates projects identified in the hazard mitigation plan into this strategy, as applicable, as part of its overall planning process. As local governments begin to update their local hazard mitigation plans, the PDDs provide an opportunity for the state to exchange and reinforce information on mitigation capabilities with local governments.
Intergovernmental Assistance and Coordination
Support from the state and the federal government is critical to improving local mitigation capabilities. Training and workshops may be the most important types of assistance the state and federal government can provide, particularly related to planning and program grant applications and in developing effective mitigation projects. When survey respondents identified factors that contributed to the successful implementation of mitigation projects, all responses were related to incentive programs and partnerships with the state and federal government, many associated with Hurricane Katrina recovery.
Coordination with other Planning Efforts
Some local plans describe other planning projects that implement mitigation measures. These include watershed plans and coastal impact assistance plans. Coordination with these other planning efforts can improve local governments’ capabilities through accomplishing multiple objectives and leveraging additional funding sources.
Adoption and Enforcement of Codes and Ordinances
Codes and ordinances may be the greatest opportunity and challenge for local governments. With the exception of floodplain ordinances, less than half of approved plans identify the adoption of land use ordinances. Although many plans emphasize the importance of land use planning and regulations for mitigation, many also comment on the unlikelihood of getting them adopted due to the rural nature of their area and the perceived stigma attached to zoning by many rural residents. Several plans describe the difficulty in inspecting buildings and enforcing codes due to lack of staffing and funding capabilities.
An example of an implementation program that has been successful is in Pearl River County, Mississippi. The mitigation plan for Pearl River County discusses the Building Code Implementation Plan developed by the county and the cities of Poplarville and Picayune. They are working toward consolidating building permits and inspections as a mitigation tool to ensure uniform enforcement of standards for construction in flood hazard zones, wind construction standards, and building codes. The three jurisdictions and the Lower Pearl River Valley Foundation contributed funding for a comprehensive and coordinated step-by-step guide to implement the International Building Codes countywide to protect lives and minimize damage to property.
Floodplain Management
There are no communities in Mississippi with identified flood hazard areas that do not participate in the NFIP. The state and many local governments recognize floodplain management and the NFIP as highly effective local mitigation capabilities and as primary opportunities to strengthen local capabilities.

Mississippi Emergency Management Agency
Sect. 4 : 373
The state can do this through continuing to enhance its program that provides information and support for new communities to participate in the NFIP and CRS and for existing participants to promote and enforce their floodplain management programs.
Local Funding
Funding for mitigation planning and projects remains one of the greatest challenges for improving local capabilities. Local plans indicate that most local governments use federal funds for mitigation and have met match requirements through in-kind services or their general operating fund. A dedicated tax revenue source for mitigation is difficult to implement as tax increases are unpopular with the public. A tax designated to targeted, tangible benefits, such as funding an emergency manager position and/or an advance warning system, may be more acceptable to the public. The state can improve local success with federal funding programs by efficiently managing the programs and providing assistance to local governments with applications, ideas for meeting match requirements, and continued eligibility.
One approach communities are using to overcome the funding obstacle is improving integration with other local plans and programs, such as capital improvement plans and stormwater management programs, to help achieve mitigation through other community objectives. Improved public education and awareness of hazard vulnerabilities and mitigation options also may help to garner more funding for mitigation through tax dollars and private sources. The best time to implement this approach is often in the window of opportunity after a disaster.
Impact of Hurricane Katrina
Many local plans were written prior to Hurricane Katrina. In fact, several of the plans in the Southern PDD were approved in August of 2005, the same month the hurricane made landfall on the Mississippi coast. Since then, the following changes have been made:
• Intergovernmental agency communication has improved.
• Additional emergency generators to operate critical facilities during and after a disaster.
• Increased emergency sheltering capabilities.
• Redundancy on local communications.
• Hardening of emergency shelters.
• Widening of road systems and development of unincorporated areas to smart codes.
• Hardening infrastructure, sewer systems, etc.
• Adoption of higher standards for reconstruction to create more disaster-resistant structures.
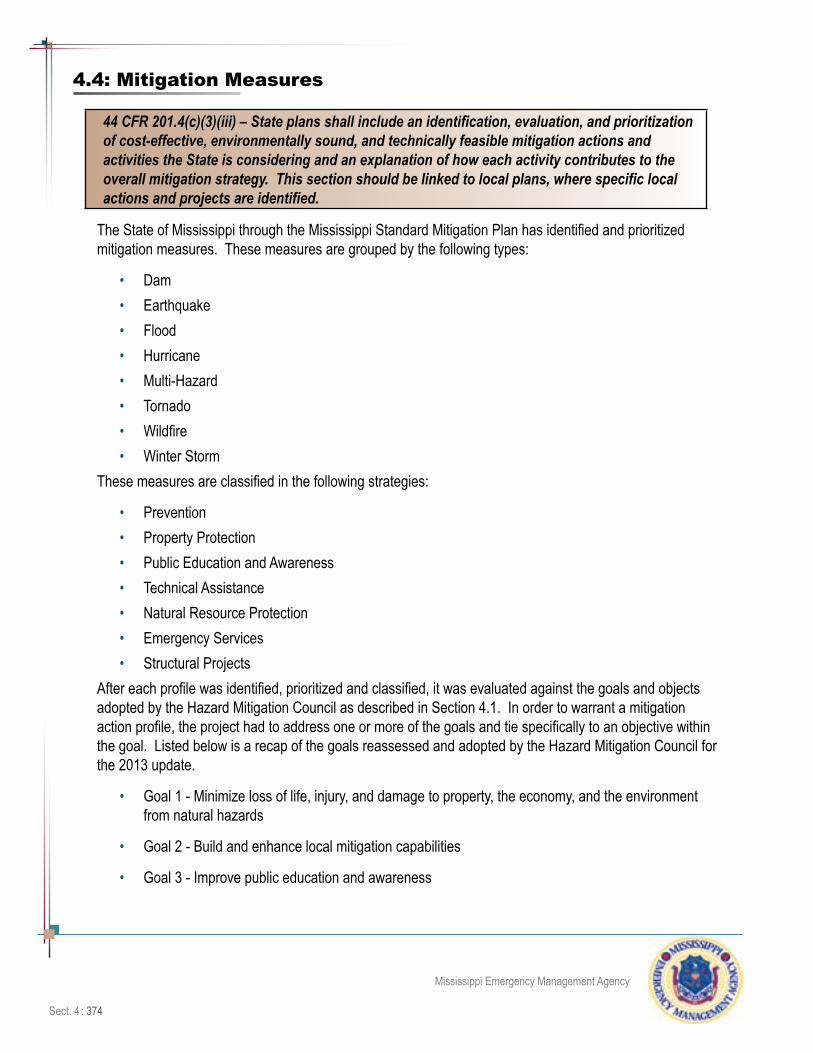
Sect. 4 : 374
Mississippi Emergency Management Agency
4.4: Mitigation Measures
44 CFR 201.4(c)(3)(iii) – State plans shall include an identification, evaluation, and prioritization of cost-effective, environmentally sound, and technically feasible mitigation actions and activities the State is considering and an explanation of how each activity contributes to the overall mitigation strategy. This section should be linked to local plans, where specific local actions and projects are identified.
The State of Mississippi through the Mississippi Standard Mitigation Plan has identified and prioritized mitigation measures. These measures are grouped by the following types:
• Dam• Earthquake• Flood• Hurricane• Multi-Hazard• Tornado• Wildfire• Winter Storm
These measures are classified in the following strategies:
• Prevention• Property Protection• Public Education and Awareness• Technical Assistance• Natural Resource Protection• Emergency Services• Structural Projects
After each profile was identified, prioritized and classified, it was evaluated against the goals and objects adopted by the Hazard Mitigation Council as described in Section 4.1. In order to warrant a mitigation action profile, the project had to address one or more of the goals and tie specifically to an objective within the goal. Listed below is a recap of the goals reassessed and adopted by the Hazard Mitigation Council for the 2013 update.
• Goal 1 - Minimize loss of life, injury, and damage to property, the economy, and the environment from natural hazards
• Goal 2 - Build and enhance local mitigation capabilities
• Goal 3 - Improve public education and awareness

Mississippi Emergency Management Agency
Sect. 4 : 375
• Goal 4 - Sustain and enhance a coordinated state mitigation program
The following Table (4.4.1) gives information about these measures with each measure uniquely identified by the following parameters:
Project Number – Each measure is numbered sequentially within each type.
Type – Each measure is listed by type of hazard with general measures or those addressing more than one hazard listed by type “multi-hazard”.
Project Name – Each measure has been given a name that briefly describes the measure.
Agency – A State agency with primary responsibility has been identified even though more than one Federal, State or Local agency may be involved. Each agency identified is a member of the Mississippi Hazard Mitigation Council.
Funding Strategy – A primary funding source has been identified. Additional funding sources may be utilized to supplement the primary funds. Section 4.5 provides information regarding the funding sources including type of assistance and agency/contact in Table 4.5.1. The table has been updated from the 2010 plan to include programs not identified or available in the 2010 plan. These programs include the reference “2013 Plan Update” in the Program/Activity column.
Completion – The year of completion has been identified. Some measures are completed on an annual basis. Table 4.4.1 identifies the mitigation strategies and the status of each project.
Priority – Each measure has been ranked as high, medium or low priority. The basis of the rankings are identified below:
• High - Activities for which funding sources are readily available or are vital to the state’s reconstruction or recovery efforts.
• Medium - Assigned to activities that are identified as long-range in nature or for which funding is not presently available but may be in the relatively near future.
• Low - Assigned to activities for which there is no clear method of funding, or may not ever be funded, and are not critical to the state’s reconstruction and recovery efforts.
Table 4.4.1 is not intended to capture all the pertinent data regarding the mitigation action. Project profile/progress reports are provided in Appendix 7.5.3, which gives additional data including goals and objectives referenced in Section 4.1. These project profile/progress reports serve as an interactive information sheet to communicate the latest information regarding the mitigation action. The project managers update project profile/progress reports showing the current status and and progress made in the implementation of a mitigation project. Appendix 7.5.3 and Section 5.3 Funding Priority and Prioritizing Alternatives also describe pritization process for mitigation actions.
During the 2010 update of the state hazard mitigation plan, a number of mitigation projects identified in the 2007 state plan were either deleted, reclassified, or combined with other projects. The deleted, reclassified, and combined projects with the reasons for the actions are provided in Table 4.4.2 Deleted, Completed, Combined, and eclassified Mitigation Actions. During the 2013 plan update process, one project was

Sect. 4 : 376
Mississippi Emergency Management Agency
Tabl
e 4.4.
1:
Miss
issip
pi M
itiga
tion A
ctio
ns S
orte
d By
Type
Proj
ect
No.
Type
Stra
tegy
Proj
ect N
ame
Agen
cyPr
ojec
t Cos
t ($
)Fu
ndin
g St
rate
gyCo
mpl
etio
nPr
iorit
y
1Da
m Sa
fety
Prev
entio
nPe
rmitti
ng N
ew D
ams a
nd R
egula
tory
Comp
lianc
eMD
EQ$3
32,50
0 Bu
dget
Annu
alH
2Da
m Sa
fety
Outre
ach a
nd
Educ
ation
Publi
c Edu
catio
n and
Outr
each
MDEQ
$17,5
00
Budg
etAn
nual
H
3Da
m Sa
fety
Prev
entio
nInu
ndati
on M
aps/E
APs
for H
igh H
azar
d W
atersh
ed D
ams
MDEQ
$80,0
00
Budg
et20
15H
5Da
m Sa
fety
Stru
ctura
lRe
pair a
nd R
ehab
Dam
sMD
EQ$1
,000,0
00
Priva
teAn
nual
H
7Da
m Sa
fety
Prev
entio
nEn
force
Imple
menta
tion o
f 200
6 Dam
Sa
fety L
egisl
ation
MDEQ
$250
,000
Budg
etAn
nual
H
9Da
m Sa
fety
Tech
nical
Assis
tance
Infor
matio
n Man
agem
ent fo
r Inu
ndati
on
Area
Vuln
erab
ilities
MDEQ
$100
,000
HMGP
Annu
alH
1Ea
rthqu
ake
Tech
nical
Assis
tance
Revie
w an
d Upd
ate H
AZUS
-MH
Data
Base
MEMA
$70,0
00
HMGP
2016
H
2Ea
rthqu
ake
Prev
entio
nHA
ZUS-
MH P
rojec
t Imple
menta
tion f
or
Loca
l Initia
tives
MEMA
$10,0
00,00
0 HM
GP20
17H
3Ea
rthqu
ake
Tech
nical
Assis
tance
Comp
ile N
ew S
oil E
valua
tions
MDEQ
$40,0
00
Budg
etAn
nual
M
5Ea
rthqu
ake
Tech
nical
Assis
tance
HAZU
S-MH
Upd
ate w
ith P
ipelin
e Lo
catio
nsME
MA$1
0,000
Bu
dget
2016
M
6Ea
rthqu
ake
Outre
ach a
nd
Educ
ation
Partn
ersh
ip Pr
ogra
ms fo
r Coll
abor
ating
Pr
ogra
ms w
ith ot
her S
tates
MEMA
$10,0
00
Budg
etAn
nual
H
10Ea
rthqu
ake
Tech
nical
Assis
tance
Monit
or S
tate o
f Com
preh
ensiv
e Inf
rastr
uctur
e Retr
ofit
MDOT
$10,0
00
Budg
etAn
nual
H
11Ea
rthqu
ake
Tech
nical
Assis
tance
Infor
matio
n Man
agem
ent S
ystem
for
Critic
al Inf
rastr
uctur
eMD
EQ$5
0,000
HM
GP20
16H
1Flo
odOu
treac
h and
Ed
ucati
onMa
p Mod
erniz
ation
: New
Firm
Ado
ption
by
Com
munit
iesME
MA$2
0,000
CA
PAn
nual
H
4Flo
odTe
chnic
al As
sistan
ceCo
mmun
ity R
ating
Sys
tem: P
rogr
am
Imple
menta
tion
MEMA
$7,00
0 CA
PAn
nual
M

Mississippi Emergency Management Agency
Sect. 4 : 377
5Flo
odPr
oper
ty Pr
otecti
onRe
petiti
ve Lo
ss S
tructu
res:
Targ
et Gr
oup
Mitig
ation
MEMA
$10,0
00,00
0 FM
A20
17M
6Flo
odTe
chnic
al As
sistan
ceNF
IP Im
pleme
ntatio
n: Mo
del O
rdina
nce
Adop
tion
MEMA
$7,00
0 CA
PAn
nual
M
7Flo
odOu
treac
h and
Ed
ucati
onNF
IP Im
pleme
ntatio
n: Flo
odpla
in Ma
nage
ment
Wor
ksho
psME
MA$7
,000
CAP
Annu
alM
8Flo
odTe
chnic
al As
sistan
ceNF
IP Im
pleme
ntatio
n: Ce
rtified
Flo
odpla
in Ma
nage
r Acc
redit
ation
MEMA
$7,00
0 CA
PAn
nual
H
9Flo
odOu
treac
h and
Ed
ucati
onNF
IP Im
pleme
ntatio
n: St
ate F
loodp
lain
Mana
geme
nt As
socia
tion
MEMA
$7,00
0 CA
PAn
nual
M
11Flo
odTe
chnic
al As
sistan
ceNF
IP Im
pleme
ntatio
n: Co
mmun
ity
Assis
tance
Con
tact a
nd V
isit
MEMA
$7,00
0 CA
PAn
nual
H
12Flo
odOu
treac
h and
Ed
ucati
onNF
IP Im
pleme
ntatio
n Edu
catio
n and
Ou
treac
hME
MA$7
,000
CAP
Annu
alH
13Flo
odTe
chnic
al As
sistan
ceAs
sess
ing V
ulner
abilit
y by J
urisd
iction
MEMA
$100
,000
FMA
2016
H
15Flo
odTe
chnic
al As
sistan
ceInf
orma
tion M
anag
emen
t Sys
tem fo
r Cr
itical
Infra
struc
ture
MEMA
$100
,000
FMA
2016
H
16Flo
odSt
ructu
ral
Comm
unity
Ass
istan
ce fo
r Floo
d W
arnin
g Sys
tems
MEMA
$1,00
0,000
FM
A20
17H
21Flo
odPr
oper
ty Pr
otecti
onCo
ntinu
e to S
uppo
rt flo
odpr
oofin
g and
ha
rden
ing of
wate
r/was
tewate
r sys
tems
MDEQ
$100
,000,0
00
CDBG
2017
H
23Flo
odTe
chnic
al As
sistan
ce
Supp
ort u
pdati
ng of
stor
mwate
r or
dinan
ces t
o add
ress
futur
e de
velop
ment
MEMA
$7,00
0 CA
P-SS
SEAn
nual
H
24Flo
odTe
chnic
al As
sistan
ceSu
ppor
t Loc
al Ca
pital
Impr
ovem
ent
Infra
struc
ture P
lannin
gMD
EQ$7
,000
CAP-
SSSE
Annu
alH
26Flo
odTe
chnic
al As
sistan
ceGI
S Inv
entor
y of H
azar
dous
Was
te/Ma
terial
s Stor
age F
acilit
iesMD
EQ$1
50,00
0 HM
GP20
16H
28Flo
odTe
chnic
al As
sistan
cePr
ovide
HAZ
US flo
od ru
ns to
each
co
unty
MEMA
$7,00
0 Bu
dget
2016
H
30Flo
od
Tech
nical
Assis
tance
Deve
lop a
comp
rehe
nsive
GIS
base
d inv
entor
y of le
vees
MDEQ
$50,0
00
PDM
2016
H
31Flo
odPr
oper
ty Pr
otecti
onIm
pleme
nt Flo
od M
itigati
on pr
ojects
MEMA
$10,0
00,00
0 US
ACOE
2017
H
2Hu
rrica
neOu
treac
h and
Ed
ucati
onPu
blic I
nform
ation
For
ums a
nd F
airs
State
wide
MEMA
$7,00
0 Bu
dget
Annu
alH

Sect. 4 : 378
Mississippi Emergency Management Agency
4Hu
rrica
neTe
chnic
al As
sistan
ceLo
cal R
eview
of B
uildin
g Cod
es an
d Flo
od P
rotec
tion O
rdina
nces
MEMA
$7,00
0 Bu
dget
Annu
alH
5Hu
rrica
neTe
chnic
al As
sistan
ceSt
ate M
oder
nizati
on Te
am R
eview
of
Coas
tal F
loodin
gME
MA$5
0,000
CA
P20
16H
6Hu
rrica
neSt
ructu
ral
USAC
OE M
ississ
ippi C
oasta
l Im
prov
emen
ts Pr
ogra
mMD
MR$1
60,00
0,000
US
ACOE
2017
H
7Hu
rrica
neTe
chnic
al As
sistan
ceUS
ACOE
Miss
issipp
i Coa
stal
Comp
rehe
nsive
Plan
MDMR
$3,00
0,000
US
ACOE
2016
H
11Hu
rrica
neSt
ructu
ral
Imple
ment
Regio
nal U
tility
Syste
msMD
EQ$2
00,00
0,000
CD
BG20
17H
12Hu
rrica
neSt
ructu
ral
Supp
ort M
itigati
on w
ith N
atura
l Bar
riers
MDMR
$100
,000,0
00
USAC
OE20
17H
14Hu
rrica
neSt
ructu
ral
New
Act
ion
for 2
013 C
onstr
uctio
n of
Gulf C
oast
Regio
nal O
ffice/F
irst
Resp
onde
rs’ B
uildin
gMD
OT$3
,963,1
28
Budg
et20
15H
2Mu
lti-Ha
zard
Outre
ach a
nd
Educ
ation
HMA
Gran
t App
licati
on Tr
aining
MEMA
$7,00
0 Bu
dget
Annu
alH
4Mu
lti-Ha
zard
Outre
ach a
nd
Educ
ation
“Stor
m Re
ady”
Comm
unity
Edu
catio
nME
MA$2
7,000
Bu
dget
Annu
alH
6Mu
lti-Ha
zard
Tech
nical
Assis
tance
Deve
lop Lo
cal H
azar
d Mitig
ation
Pl
annin
gME
MA$7
,000
HMGP
Annu
alH
9Mu
lti-Ha
zard
Emer
genc
y Se
rvice
sPr
ovide
Aux
iliary
Powe
r Sou
rce fo
r All
Critic
al Fa
cilitie
sME
MA$1
0,000
,000
HMGP
2017
H
11Mu
lti-Ha
zard
Tech
nical
Assis
tance
Coor
dinate
d Eme
rgen
cy A
ction
Plan
s for
He
alth C
are F
acilit
iesMS
DH$1
0,000
HM
GPAn
nual
H
13Mu
lti-Ha
zard
Natur
al Re
sour
ces
Prote
ction
Wet
Debr
is Ma
nage
ment
for A
cces
s, W
ater Q
uality
and E
nviro
nmen
talMD
MR$1
0,000
,000
USAC
OE20
17H
15Mu
lti-Ha
zard
Tech
nical
Assis
tance
Comp
lete/e
nhan
ce in
vento
ry of
state
owne
d/ope
rated
facil
ities
MDFA
$500
,000
HMGP
2013
H
18Mu
lti-Ha
zard
Emer
genc
y Se
rvice
sInc
reas
e She
lter C
apac
ity in
each
Co
unty
MEMA
$1,00
0,000
HM
GPAn
nual
H
20Mu
lti-Ha
zard
Tech
nical
Assis
tance
Prep
are I
nform
ation
Man
agem
ent
Syste
m for
Plan
Upd
ates f
or 20
13ME
MA$2
0,000
Bu
dget
Annu
alH
21Mu
lti-Ha
zard
Emer
genc
y Se
rvice
sTr
ack P
rojec
t Imple
menta
tion P
rogr
ess
for M
itigati
on A
ction
sME
MA$2
0,000
Bu
dget
Annu
alH
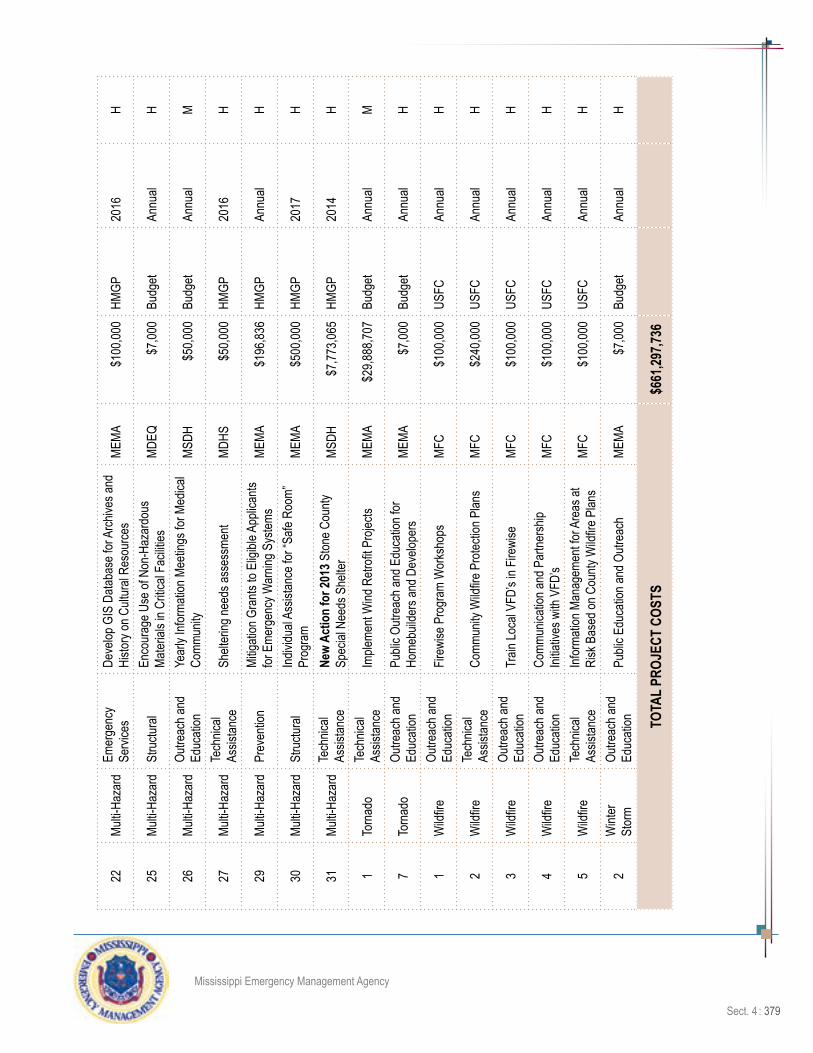
Mississippi Emergency Management Agency
Sect. 4 : 379
22Mu
lti-Ha
zard
Emer
genc
y Se
rvice
sDe
velop
GIS
Data
base
for A
rchive
s and
Hi
story
on C
ultur
al Re
sour
ces
MEMA
$100
,000
HMGP
2016
H
25Mu
lti-Ha
zard
Stru
ctura
lEn
cour
age U
se of
Non
-Haz
ardo
us
Mater
ials i
n Criti
cal F
acilit
iesMD
EQ$7
,000
Budg
etAn
nual
H
26Mu
lti-Ha
zard
Outre
ach a
nd
Educ
ation
Year
ly Inf
orma
tion M
eetin
gs fo
r Med
ical
Comm
unity
MSDH
$50,0
00
Budg
etAn
nual
M
27Mu
lti-Ha
zard
Tech
nical
Assis
tance
Shelt
ering
need
s ass
essm
ent
MDHS
$50,0
00
HMGP
2016
H
29Mu
lti-Ha
zard
Prev
entio
nMi
tigati
on G
rants
to E
ligibl
e App
lican
ts for
Eme
rgen
cy W
arnin
g Sys
tems
MEMA
$196
,836
HMGP
Annu
alH
30Mu
lti-Ha
zard
Stru
ctura
lInd
ividu
al As
sistan
ce fo
r “Sa
fe Ro
om”
Prog
ram
MEMA
$500
,000
HMGP
2017
H
31Mu
lti-Ha
zard
Tech
nical
Assis
tance
New
Actio
n fo
r 201
3 Ston
e Cou
nty
Spec
ial N
eeds
She
lter
MSDH
$7,77
3,065
HM
GP20
14H
1To
rnad
oTe
chnic
al As
sistan
ceIm
pleme
nt W
ind R
etrofi
t Pro
jects
MEMA
$29,8
88,70
7 Bu
dget
Annu
alM
7To
rnad
oOu
treac
h and
Ed
ucati
onPu
blic O
utrea
ch an
d Edu
catio
n for
Ho
mebu
ilder
s and
Dev
elope
rsME
MA$7
,000
Budg
etAn
nual
H
1W
ildfire
Outre
ach a
nd
Educ
ation
Firew
ise P
rogr
am W
orks
hops
MFC
$100
,000
USFC
Annu
alH
2W
ildfire
Tech
nical
Assis
tance
Comm
unity
Wild
fire P
rotec
tion P
lans
MFC
$240
,000
USFC
Annu
alH
3W
ildfire
Outre
ach a
nd
Educ
ation
Train
Loca
l VFD
’s in
Firew
iseMF
C$1
00,00
0 US
FCAn
nual
H
4W
ildfire
Outre
ach a
nd
Educ
ation
Comm
unica
tion a
nd P
artne
rship
Initia
tives
with
VFD
’sMF
C$1
00,00
0 US
FCAn
nual
H
5W
ildfire
Tech
nical
Assis
tance
Infor
matio
n Man
agem
ent fo
r Are
as at
Ri
sk B
ased
on C
ounty
Wild
fire P
lans
MFC
$100
,000
USFC
Annu
alH
2W
inter
St
orm
Outre
ach a
nd
Educ
ation
Publi
c Edu
catio
n and
Outr
each
MEMA
$7,00
0 Bu
dget
Annu
alH
TOTA
L PR
OJEC
T CO
STS
$661
,297,7
36

Sect. 4 : 380
Mississippi Emergency Management Agency
Tab
le 4.4
.2:
Delet
ed, C
ompl
eted
, Com
bine
d, &
Rec
lassifi
ed M
itiga
tion A
ctio
nsPr
ojec
t No
. T
ype
Stra
tegy
Proj
ect N
ame
Agen
cyPr
ojec
t Cos
tFu
ndin
g St
rate
gyCo
mpl
etio
nPr
iorit
yAp
prov
ed C
hang
es
by H
MC
D-3
Dam
Safet
yPr
even
tion
Inund
ation
Map
s and
Eme
rgen
cy
Actio
ns P
lans f
or H
igh H
azar
d Dam
s M
DEQ
$500
,000
Pr
ivate
2012
HInc
ludes
D-4
by C
ounc
il vote
10
-14-
08
D-4
Dam
Safet
yPr
even
tion
Deve
lopme
nt of
Owne
r Eme
rgen
cy
Actio
n Plan
sCo
mbine
d with
D-3
by
Coun
cil vo
te 10
-14-
08
D-6
Dam
Safet
ySt
ructu
ral
Estab
lish R
evolv
ing Lo
an P
rogr
am to
Fu
nd D
am R
ehab
ilitati
onDe
leted
by C
ounc
il vote
10
-14-
08
D-7
Dam
Safet
yPr
even
tion
Imple
ment
and e
nforce
sign
ifican
t 20
04 an
d 200
5 reg
ulator
y rev
ision
s to
the D
am S
afety
Prog
ram
desig
ned t
o be
tter p
rotec
t live
s and
prop
erty
MDE
Q$8
0,000
B
udge
t
Ann
ual
HInc
ludes
D-8
by C
ounc
il vote
10
-14-
08
D-8
Dam
Safet
yOu
treac
h an
d Ed
ucati
on
Educ
ate D
am O
wner
s abo
ut 20
06
Dam
Safet
y Reg
ulatio
nCo
mbine
d with
D-7
Cou
ncil
vote
10-1
4-08
E-4
Earth
quak
eOu
treac
h an
d Ed
ucati
on
Year
ly Inf
orma
tion M
eetin
gs fo
r Me
dical
Comm
unity
Recla
ssifie
d as M
H-26
by
Coun
cil vo
te on
10-1
4-08
E-7
Earth
quak
eTe
chnic
al As
sTsta
nce
Infor
matio
n Man
agem
ent S
ystem
Sy
stem
with
Site
Spec
ific In
forma
tion
Delet
ed by
Cou
ncil 1
0-14
-08
E-8
Earth
quak
eOu
treac
h an
d Ed
ucati
on
Partn
ersh
ip Pr
ogra
ms fo
r Utili
zing C
CP
Data
Delet
ed by
Cou
ncil v
ote
10-1
4-08
E-9
Earth
quak
eTe
chnic
al As
sistan
ceInf
orma
tion M
anag
emen
t Sys
tem fo
r Cr
itical
Facil
ities
Recla
ssifie
d and
inclu
ded i
n MH
-15 b
y Cou
ncil 1
0-14
-08
E-12
Earth
quak
eTe
chnic
al As
sistan
ceCo
mplet
e Loc
al Bu
ilding
Vuln
erab
ility
Analy
sisDe
leted
by C
ounc
il vote
10
-14-
08

Mississippi Emergency Management Agency
Sect. 4 : 381
E-13
Earth
quak
eTe
chnic
al As
sistan
ceSe
ismic
Vulne
rabil
ity A
sses
smen
t of
Critic
al Br
idges
in N
orth
Miss
issipp
i for
Natio
nal L
evel
Exer
cise
MEMA
$40,0
00
HMGP
2011
MPr
oject
was c
omple
ted in
20
11.
F-1
Flood
Outre
ach
and
Educ
ation
Map M
oder
nizati
on P
rogr
am
Imple
menta
tion
MEM
A$2
0,000
CAP
2010
HInc
ludes
F-2
and F
-3 by
Co
uncil
vote
01-2
8-09
F-2
Flood
Outre
ach
and
Educ
ation
Map M
oder
nizati
on: E
arly
FIRM
Ad
optio
n by C
ommu
nities
Comb
ined w
ith F
-1 by
Co
uncil
vote
01-2
8-09
F-3
Flood
Tech
nical
Assis
tance
Map M
oder
nizati
on: P
rogr
am
Imple
menta
tion
Comb
ined w
ith F
-1 by
Co
uncil
vote
01-2
8-09
F-5
Flood
Prop
erty
Prote
ction
Repe
titive
Loss
and S
ever
e Rep
etitiv
e Lo
ss P
rope
rty M
itigati
on M
EMA
$10,0
00,00
0
FMA
2017
MInc
ludes
F-1
4, F-
19 an
d F-
20 by
Cou
ncil v
ote 10
-14
-08
F-6
Flood
Tech
nical
Assis
tance
NFIP
Imple
menta
tion:
Mode
l Or
dinan
ce A
dopti
on M
EMA
$7,00
0
CAP
A
nnua
lM
Includ
es F
-10 b
y Cou
ncil
vote
01-2
8-09
F-10
Flood
Tech
nical
Assis
tance
NFIP
Imple
menta
tion:
High
er
Regu
lator
y Stan
dard
Ado
ption
Comb
ined w
ith F
-6 by
Co
uncil
vote
01-2
8-09
F-14
Flood
Prev
entio
nRe
petiti
ve an
d Sev
ere R
epeti
tive L
oss
Prop
ertie
sCo
mbine
d with
F-5
by
Coun
cil vo
te 10
-14-
08
F-17
Flood
Tech
nical
Assis
tance
Supp
ort R
econ
struc
tion P
ilot P
rogr
am M
EMA
$7,00
0 H
MGP
A
nnua
lH
Delet
ed by
Cou
ncil 0
5/201
0
F-18
Flood
Tech
nical
Assis
tance
Supp
ort G
lobal
Match
Initia
tive
De
leted
by C
ounc
il vote
10
-14-
08
F-19
Flood
Prop
erty
Prote
ction
Supp
ort Im
pleme
ntatio
n of L
ocal
Repe
titive
and S
ever
e Rep
etitiv
e Los
s Ac
quiai
tion P
rogr
am
Comb
ined w
ith F
-5 by
Co
uncil
vote
10-1
4-08
F-20
Flood
Prop
erty
Prote
ction
Supp
ort Im
pleme
ntatio
n of L
ocal
Elev
ation
, and
Floo
d Pro
ofing
Pr
ogra
ms
Comb
ined w
ith F
-5 by
Co
uncil
vote
10-1
4-08
F-22
Flood
Stru
ctura
lSu
ppor
t Acq
uistio
n of G
ener
ators
at Ex
isting
WW
TPs
Delet
ed by
Cou
ncil v
ote 01
-28
-09 (
dupli
catio
n of M
H-9)
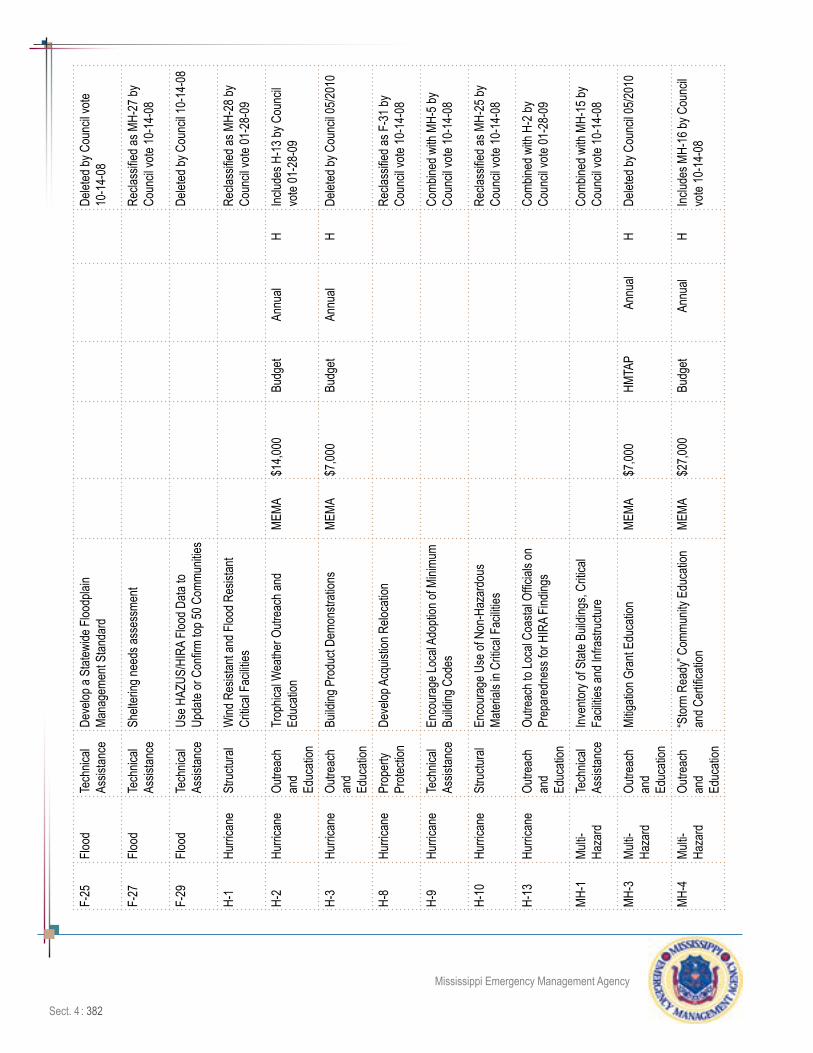
Sect. 4 : 382
Mississippi Emergency Management Agency
F-25
Flood
Tech
nical
Assis
tance
Deve
lop a
State
wide
Floo
dplai
n Ma
nage
ment
Stan
dard
Delet
ed by
Cou
ncil v
ote
10-1
4-08
F-27
Flood
Tech
nical
Assis
tance
Shelt
ering
need
s ass
essm
ent
Recla
ssifie
d as M
H-27
by
Coun
cil vo
te 10
-14-
08
F-29
Flood
Tech
nical
Assis
tance
Use H
AZUS
/HIR
A Flo
od D
ata to
Up
date
or C
onfirm
top 5
0 Com
munit
iesDe
leted
by C
ounc
il 10-
14-0
8
H-1
Hurri
cane
Stru
ctura
lW
ind R
esist
ant a
nd F
lood R
esist
ant
Critic
al Fa
cilitie
sRe
class
ified a
s MH-
28 by
Co
uncil
vote
01-2
8-09
H-2
Hurri
cane
Outre
ach
and
Educ
ation
Trop
hical
Wea
ther O
utrea
ch an
d Ed
ucati
on M
EMA
$14,0
00
Bud
get
A
nnua
lH
Includ
es H
-13 b
y Cou
ncil
vote
01-2
8-09
H-3
Hurri
cane
Outre
ach
and
Educ
ation
Build
ing P
rodu
ct De
mons
tratio
ns M
EMA
$7,00
0 B
udge
t
Ann
ual
HDe
leted
by C
ounc
il 05/2
010
H-8
Hurri
cane
Prop
erty
Prote
ction
Deve
lop A
cquis
tion R
eloca
tion
Recla
ssifie
d as F
-31 b
y Co
uncil
vote
10-1
4-08
H-9
Hurri
cane
Tech
nical
Assis
tance
Enco
urag
e Loc
al Ad
optio
n of M
inimu
m Bu
ilding
Cod
esCo
mbine
d with
MH-
5 by
Coun
cil vo
te 10
-14-
08
H-10
Hurri
cane
Stru
ctura
lEn
cour
age U
se of
Non
-Haz
ardo
us
Mater
ials i
n Criti
cal F
acilit
iesRe
class
ified a
s MH-
25 by
Co
uncil
vote
10-1
4-08
H-13
Hurri
cane
Outre
ach
and
Educ
ation
Outre
ach t
o Loc
al Co
astal
Offic
ials o
n Pr
epar
edne
ss fo
r HIR
A Fin
dings
Comb
ined w
ith H
-2 by
Co
uncil
vote
01-2
8-09
MH-1
Multi-
Haza
rdTe
chnic
al As
sistan
ceInv
entor
y of S
tate B
uildin
gs, C
ritica
l Fa
cilitie
s and
Infra
struc
ture
Comb
ined w
ith M
H-15
by
Coun
cil vo
te 10
-14-
08
MH-3
Multi-
Haza
rdOu
treac
h an
d Ed
ucati
on
Mitig
ation
Gra
nt Ed
ucati
on M
EMA
$7,00
0 H
MTAP
Ann
ual
HDe
leted
by C
ounc
il 05/2
010
MH-4
Multi-
Haza
rdOu
treac
h an
d Ed
ucati
on
“Stor
m Re
ady”
Comm
unity
Edu
catio
n an
d Cer
tifica
tion
MEM
A$2
7,000
B
udge
t
A
nnua
lH
Includ
es M
H-16
by C
ounc
il vo
te 10
-14-
08

Mississippi Emergency Management Agency
Sect. 4 : 383
MH-5
Multi-
Haza
rdOu
treac
h an
d Ed
ucati
on
Adop
tion a
nd E
nforce
ment
of Bu
ilding
Co
des
MEM
A$1
4,000
B
udge
t20
10H
Includ
es H
-9 10
-14-
08,
delet
ed 6-
8-10
by
Coun
cil.
MH-7
Multi-
Haza
rdOu
treac
h an
d Ed
ucati
on
Wor
ksho
ps fo
r Eva
luatin
g Wind
and
Flood
Dam
aged
Buil
dings
MEM
A$2
0,000
H
MGP
Annu
alH
Delet
ed by
Cou
ncil 0
5/201
0
MH-8
Multi-
Haza
rdOu
treac
h an
d Ed
ucati
on
Deve
lop, T
rain
and I
mplem
ent
Stra
tegies
for S
tate O
wned
Buil
dings
Comb
ined w
ith M
H-15
by
Coun
cil vo
te 10
-14-
08
MH-9
Multi-
Haza
rdEm
erge
ncy
Servi
ces
Prov
ide M
itigati
on G
rants
to E
ligibl
e Ap
plica
nts fo
r Aux
illiar
y Pow
er S
ource
s at
Critic
al Fa
cilitie
s
MEM
A$1
0,000
,000
HM
GP20
17H
Includ
es W
S-1 a
nd F
-22 b
y Co
uncil
vote
01-2
8-09
MH-1
0Mu
lti-Ha
zard
Tech
nical
Assis
tance
Utiliz
e NEM
IS to
Upd
ate H
istor
ical
Data
for D
isaste
rsDe
leted
by C
ounc
il vote
10-
14-0
8
MH-1
2Mu
lti-Ha
zard
Tech
nical
Assis
tance
Deve
lop M
ethod
ology
for F
uture
De
velop
ment
Tren
ds fo
r Vuln
erab
ility
Analy
sis
MEM
A$1
0,000
B
udge
t20
10H
Delet
ed by
Cou
ncil v
ote 10
-14
-08
MH-1
4Mu
lti-Ha
zard
Tech
nical
Assis
tance
Debr
is Ma
nage
ment
Plan
sDe
leted
by C
ounc
il vote
10-
14-0
8
MH-1
5Mu
lti-Ha
zard
Tech
nical
Assis
tance
Comp
lete/E
nhan
ce In
vento
ry of
State
Ow
ned/O
pera
ted F
acilit
ies M
DFA
$4,81
7,886
HMGP
2010
HInc
ludes
E-9
, MH-
1, MH
-8
and M
H-19
by C
ounc
il vote
10
-14-
08MH
-16
Multi-
Haza
rdEm
erge
ncy
Servi
ces
Prom
ote S
torm
Read
y Cer
tifica
tion b
y NO
AACo
mbine
d with
MH-
4 by
Coun
cil vo
te 1-
14-0
8
MH-1
7Mu
lti-Ha
zard
Tech
nical
Assis
tance
Upda
te St
atewi
de S
tanda
rds f
or
Comp
rehe
nsive
Plan
ning a
nd La
nd
Use R
egula
tions
Delet
ed by
Cou
ncil v
ote 10
-14
-08
MH-1
8Mu
lti-Ha
zard
Emer
genc
y Se
rvice
sMi
tigati
on G
rants
to E
ligibl
e App
lican
ts for
FEM
A 32
0 and
FEM
A 36
1 She
lters
MEM
A$1
,000,0
00
HMG
P
Ann
ual
HInc
ludes
T-2 b
y Cou
ncil v
ote
on 01
-28-
09
MH-1
9Mu
lti-Ha
zard
Tech
nical
Assis
tance
Comp
ile A
dditio
nal D
ata R
egar
ding
State
Own
ed C
ritica
l Infra
struc
ture
Comb
ined w
ith M
H-15
by
Coun
cil vo
te 10
-14-
08

Sect. 4 : 384
Mississippi Emergency Management Agency
MH-2
1Mu
lti-Ha
zard
Prev
entio
n/Pr
oper
ty Pr
otecti
on
Haza
rd M
itigati
on C
ounc
il Pro
gres
s/Ev
aluati
on of
Mitig
ation
Acti
ons
MEM
A$4
9,976
B
udge
t
Ann
ual
HInc
ludes
MH-
24 by
Cou
ncil
vote
10-1
4-08
MH-2
3Mu
lti-Ha
zard
Emer
genc
y Se
rvice
sSt
atewi
de In
terop
erab
le Co
mmun
icatio
n Sys
temNo
t acc
epted
by F
EMA
as a
mitig
ation
proje
ct
MH-2
4Mu
lti-Ha
zard
Prev
entio
n/Pr
oper
ty Pr
otecti
on
Prog
ress
/Eva
luatio
n of M
itigati
on
Actio
nsCo
mbine
d with
MH-
21 by
Co
uncil
vote
10-1
4-08
MH-2
5Mu
lti-Ha
zard
Stru
ctura
lEn
cour
age U
se of
Non
-Haz
ardo
us
Mater
ials i
n Criti
cal F
acilit
ies M
DEQ
$7,00
0 B
udge
t
Ann
ual
HRe
class
ified f
rom
H-10
by
Coun
cil vo
te 10
-14-
08
MH-2
6Mu
lti-Ha
zard
Outre
ach
and
Educ
ation
Year
ly Inf
orma
tion M
eetin
gs fo
r Me
dical
Medic
al Co
mmun
ity M
SDH
$50,0
00
Bud
get
A
nnua
lM
Recla
ssifie
d fro
m E-
4 by
Coun
cil vo
te 12
0-14
-08
MH-2
7Mu
lti-Ha
zard
Tech
nical
Assis
tance
Shelt
ering
Nee
ds A
sses
smen
t M
DHS
$50,0
00
HMG
P20
10Re
class
ified f
rom
F-27
by
Coun
cil vo
te 0n
10-1
4-08
MH-2
8Mu
lti-Ha
zard
Stru
ctura
lW
ind R
esist
ant a
nd F
lood R
esist
ant
Critic
al Fa
cilitie
s M
EMA
$10,0
00,00
0 HM
GP20
17H
Recla
ssifie
d fro
m H-
1 by
Coun
cil vo
te 01
-28-
09
MH-2
9Mu
lti-Ha
zard
Prev
entio
nMi
tigati
on G
rants
to E
ligibl
e App
lican
ts for
Eme
rgen
cy W
arnin
g Sys
tems
MEM
A$1
96,83
6 HM
GP20
10H
Recla
ssifie
d fro
m T-
3 and
inc
ludes
T-4 b
y Cou
ncil v
ote
on 01
-28-
09MH
-30
Multi-
Haza
rdSt
ructu
ral
Indivi
dual
Assis
tance
for “
Safe
Room
” Pr
ogra
m M
EMA
$500
,000
HMGP
2017
HRe
class
ified f
rom
T-8 b
y Co
uncil
vote
on 01
-28-
09
T-2
Torn
ado
Stru
ctura
lPu
blic A
cces
s to C
ommu
nity S
torm
Shelt
ers
Comb
ined w
ith M
H-18
by
Coun
cil vo
te 01
-28-
09
T-3
Torn
ado
Prev
entio
nW
arnin
g Sys
tem on
Coll
ege C
ampu
ses
Recla
ssifie
d as M
H-29
and
includ
es T-
4 by C
ounc
il vote
01
-28-
09T-
4To
rnad
oPr
even
tion
War
ning S
ystem
for C
ommu
nities
Comb
ined w
ith T-
3 as M
H-29
by C
ounc
il vote
01-2
8-09
T-5
Torn
ado
Outre
ach
and
Educ
ation
Torn
ado P
ublic
Edu
catio
n and
Ou
treac
h M
EMA
$7,00
0 B
udge
t
Ann
ual
HDe
leted
by C
ounc
il vote
10-
14-0
8

Mississippi Emergency Management Agency
Sect. 4 : 385
T-6
Torn
ado
Prev
entio
nPa
rtner
ship
Prog
rams
for P
urch
asing
W
eathe
r Rad
ios fo
r Ind
ividu
als M
EMA
$500
,000
HM
GP20
17H
Delet
ed by
Cou
ncil 0
5/200
8
T-8
Torn
ado
Stru
ctura
lInd
ividu
al As
sistan
ce fo
r “Sa
fe Ro
om”
Prog
ram
Recla
ssifie
d as M
H-30
by
Coun
cil vo
te 01
-28-
09
WS-
1W
inter
St
orm
Stru
ctura
lPl
acem
ent o
f Aux
illiar
y Pow
er
Sour
ces a
t Criti
cal F
acilit
iesCo
mbine
d with
MH-
9 by
Coun
cil vo
te 01
-28-
09

Sect. 4 : 386
Mississippi Emergency Management Agency
completed and included in Table 4.4.2 as a completed project. No projects were deleted; however, one project is pending council vote for deletion. Two mitigation projects were added and are included in Table 4.4.1., noted as “New Action for 2013”. There were no changes in priorities.
The mitigation tables and project profiles will be used interchangeably to assist with implementation of the projects. The sorted tables include a summary of each mitigation action. Details are given in the project profiles which include the goals and objectives of each mitigation profile. MEMA maintains a Mitigation Action Notebook that includes updated information as it is available. This information is being incorporated into each of the 65 project profiles, which are updated with information from MEMA and other lead agencies.
Local Mitigation Actions
The state has developed a database of all mitigation actions identified in FEMA-approved local hazard mitigation plans. Because of the large size of the database, it is not incorporated as part the plan document but is available at MEMA.
The database allows the state to sort local actions by hazards addressed, project type, funding source, cost estimate, and additional variables. It will be used to link state actions to local actions and to help identify new state actions. For instance, the state has an action to promote the National Weather Service’s StormReady certification program for local communities. The local actions database can be used to quickly identify which local governments have identified mitigation actions related to the StormReady program.
The state also plans to use this database as part of a more comprehensive system of prioritizing local projects for funding, tracking those projects that have been funded, and monitoring the effectiveness of implemented local projects. As local hazard mitigation plans are approved, the identified mitigation actions will be added to the database, so that it remains current.
The mitigation actions compiled in this database have been identified and prioritized by local governments based upon their unique processes for determining actions that are technically feasible, cost effective, and environmentally sound. Prior to any funding from state or federal sources, more detailed benefit-cost analysis of actions will occur during the project development and grant application phases. In addition to the review of local mitigation actions, the Mississippi Hazard Mitigation Council used the STAPLE/E(Social, Technical, Administrative, Political, Legal, Economic, and Environmental) criteria to analyze the cost-effectiveness of each project. Mitigation actions were screened for implementation with consideration that they must comply with federal and state requirements. Each project was reviewed to determine if it was environmentally sound, and technically feasible. The updated projects resulted from a number of council meetings. Some projects have been more effective than others. Based upon progress on mitigation actions, updated risk assessment, and review of mitigation priorities, effective mitigatioin actions have been identified. For the 2013 update, two new mitigation actions were added, and one mitigation action was completed. In the 2010 update, a number of mitigation actions were reclassified and combined as reflected in Table 4.4.2. Changes were considered and approved by the Hazard Mitigation Council.
Mississippi Emergency Management Agency
Sect. 4 : 387
4.5: Funding Sources
44 CFR 201.4(c)(3)(iv) - The State mitigation strategy shall include the following elements:
A mitigation strategy that provides the State’s blueprint for reducing the losses identified in the risk assessment. This section shall include:
Identification of current and potential sources of Federal, State, local or private funding to implement mitigation activities.
The State of Mississippi is well on its way to full recovery from the effects of Hurricane Katrina, the most destructive hurricane to hit the United States. As a result of Hurricane Katrina, The State Of Misssissippi received $434 million in Hazard Mitigation Assistance (HMA) funds and $4 billion in Community Development Block Grant (CDBG) funds to mitigate the effects. Since Hurricane Katrina made landfall, Mississippi has had ten smaller federally declared diasters which has resulted in approximately $33 million in HMA funds. The remaining Katrina funds and the HMA frunds from the more recent declared disasters will continue to fund the mitigation initiatives that began as a result of Hurricane Katrina.
Statewide Initiatives generated by Hurricane Katrina
The following statewide initiatives were funded through HMGP funds:
• The Statewide Generator Initiative - provides funding for generators for critical facilities.
• The Statewide College/University and Municipality Siren Initiative - provides funding for warning systems on junior and senior colleges as well as funding for counties and cities.
• The Statewide Saferoom/Storm Shelter Initiative - provides funding for individual and community storm shelters so that during a tornado or severe thunderstorm, the citizens of Mississippi have a safe place to go.
Since the previous plan was approved, the State under MEMA’s guidance, has funded in addition to the statewide initiatives, the following projects:
• Acquisition Projects
• Drainage Projects
• Planning Grants
• Retrofits and Codes
• Standards Projects
Under the Flood Mitigation Assistance, the State has provided funding for the following:
• Acquisition Projects
• Planning Grants

Sect. 4 : 388
Mississippi Emergency Management Agency
MEMA has also provided funding for Mitigation.MS.org, a web-based program that allows eligible applicants to submit project applications online.
The State Hazard Mitigation Plan Update is being funded under the Pre-Disaster Mitigation Program.
As can be seen from a review of the successful mitigation projects in Mississippi, it is very typical to leverage projects with multiple sources of funding. Table 4.5.1 provides a matrix that addresses the current and potential sources of funding for federal/state/local hazard mitigation programs, activities, and initiatives. The matrix identifies the program activity, type of assistance, and the responsible agency and point of contact.
The following “Programs/Activities” are addressed in the matrix on the following pages:
• General Emergency grants, loans, and assistance;
• Floods/Flood Control grants, loans, and assistance;
• Earthquake grants, loans, and assistance;
• All-Hazard Mapping grants, loans, and assistance;
• Ancillary Flood & Natural Resource Projects grants, loans, and assistance;
• Basic and Applied Research/Development grants, loans, and assistance;
• Other Planning Information, including Demographics, Societal Data, Transportation, Agricultural, Industrial, and Other Commercial Economic Statistics;
• Business Continuity Planning;
• Grants, loans, and technical assistance in addressing rehabilitation, health, safety, and emergency (fire, ambulance, sirens, etc.) Facilities and equipment needs in primarily low income rural areas.
This table has been updated from the 2010 plan to include programs/activities that were not defined or available and are designated with the notation of 2013 Update.

Mississippi Emergency Management Agency
Sect. 4 : 389
Table 4.5.1Funding Sources
Program / Activity Type of Assistance Agency & ContactGeneral EmergencyGrants, Loans &Assistance
Pre/Post DisasterMitigation, Relief, Recovery,Training, & TechnicalAssistance
Hazard Mitigation Grant Program
Provides grants to states and communities for the implementation of long-term hazard mitigation measures following a major disaster declaration.
FEMA Region IV NFIP & Mitigation (770) 220-5200 MEMA Office of MitigationTel: (601) 933-6362 Fax: (601) 933-6815 www.msema.org
Disaster Mitigation Planning and Technical Assistance
Provides technical and planning assistance for capacity building and mitigation project activities focusing on creating disaster resistant jobs and workplaces
Department of Commerce (DOC), Economic Development Administration (EDA) www.doc.gov/eda
N. Mississippi (404) 730-3020S. Mississippi (859) 224-7426
MEMA Office of MitigationTel: (601) 933-6362 Fax: (601) 933-6815 www.msema.org
Pre-Disaster Mitigation Provides funding and technical assistance to communities and states to implementpre-disaster mitigation projects and planning.
FEMA Region IV NFIP & Mitigation (770) 220-5200
MEMA Office of MitigationTel: (601) 933-6362 Fax: (601) 933-6815 www.msema.org

Sect. 4 : 390
Mississippi Emergency Management Agency
Table 4.5.1Funding Sources
Program / Activity Type of Assistance Agency & ContactEmergency Management I Mitigation Training
Offers training in disaster mitigation, preparedness, planning.
FEMA Region IV NFIP & Mitigation (770) 220-5200
MEMA Office of MitigationTel: (601) 933-6362 Fax: (601) 933-6815 www.msema.org
Post -Disaster Economic RecoveryGrants and Assistance
Provides grant funding to assist in the long-term economic recovery of communities, industries, and firms adversely impacted by disasters.
Department of Commerce (DOC), Economic Development Administration (EDA) N. Mississippi (404) 730-3020S. Mississippi (859) 224-7426www.doc.gov/eda
Economic Development Program Provides grants to communities and counties to fund publicily owned infrastructures and building.
Mississippi Development AuthorityProgram
Tel: (601) 359-3179Loan for Economic Development
2013 Plan Update
CDBG is a loan program for economic development projects that is available to fund individual business needs. Funding from this program can be used by municipalities and counties to assist with the location or expansion of businesses. Usage of the funds must be directly related to the construction, renovation, or expansion of industry.
Mississippi Development AuthorityProgram
Tel: (601) 359-3179
CDBG for Emergency Projects
2013 Plan Update
Provides grants to to fund publicly owned infrastructure for eommunity based projects funding from this program can be used by municipalities and counties.
Mississippi Development AuthorityCDBG Program
Tel: (601) 359-3179

Mississippi Emergency Management Agency
Sect. 4 : 391
Table 4.5.1Funding Sources
Program / Activity Type of Assistance Agency & ContactDevelopment Infrastructure Grant Program (DIP)
2013 Plan Update
DIP is a grant program that is available to fund publicly owned infrastructure. Funding from this program can be used by municipalities and counties to assist with the location or expansion of businesses. Usage of the funds must be directly related to the construction, renovation, or expansion of industry.
Mississippi Development AuthorityCDBG Program
Tel: (601) 359-3179
Emergency Shelter Grants Program (ESG)
2013 Plan Update
ESG grants provides fund shelters for homeless individuals and families. Funding from this program can be used by municipalities and counties, as well as non-profit organizations approved by the Mississippi Development Authority.
Mississippi Development AuthorityCDBG Program
Tel: (601) 359-3179
HOME Program for Homebuyer Assistance Projects
2013 Plan Update
(HOME) for homebuyer Assistance projects is a grant program to provide assistance to credit worthy families that are purchasing a home. The Program is available to low income families as determined the U.S. Department of Housing and Urban Development.
Mississippi Development Authority CDBG Program
Tel: (601) 358-3179
HOME Program for Rehabilitation/Reconstruction Projects
2013 Plan Update
(HOME) for Homeowner Rehabilitation and Reconstruction Projects is a grant program that is available to provide assistance to families that are rexonstructing or making major reparis to a home. Funding from this program can be used by minicipalities and counties to assist eligible homeowners in making repairs to their homes to correct deficiencies in existing homes, or reconstuuct their home because of the state of disrepair.
Mississippi Development AuthorityCDBG Program
Tel: (601) 359-3179

Sect. 4 : 392
Mississippi Emergency Management Agency
Table 4.5.1Funding Sources
Program / Activity Type of Assistance Agency & ContactJob Protection Grant Program
2013 Plan Update
Provides “at risk” industries that have been operating in the state for at least threee years and that have lost jobs or are at risk to lose jobs because such jobs have been outsourced. Funding from this program can be used by “at risk” industries tat retain jobs in Mississippi and improve productivity.
Mississippi Development AuthorityCDBG Program
Tel: (601) 359-3552
MS Single Family Residential Housing Fund Program
2013 Plan Update
Provides financing for the construction of low-to-moderate income single family residential housing units. The Mississippi Development Authority (MDA) collaborates with the Mississippi Home Corporation (MHC) to administer this loan program.
Mississippi Development AuthoritySupplemental CDBG Program
Tel: (601) 359-3552
MS Home Saver Program
2013 Plan Update
Assists by making mortage payments for homeowners who have lost their jobs or experience a reduction in income through no fault of their own due to the economy and are at risk of default or losing their home to a mortage foreclosure.
Mississippi Development Authority and Mississippi Home Saver Program
Tel: (601) 359-3179
Mississippi Rail Grant Program (RAIL)
2013 Plan Update
RAIL is designed for making grants to railroads to finance projects to promote exonomic growth in the state of Mississippi. Funding for this program is derived from appropriations or funds otherwise made available by the State Legislature.
Mississippi Development Authority
Tel (601) 359- 3552
Community Disaster Loan Program
2013 Plan Update
Provides funds to any eligible jurisdiction in a designated disaster area that has suffered a substantial loss of tax and other revenue.
FEMA(800) 621-3362www.fema.gov
Small Business Disaster Bridge Loan Program
Provides loans to qualifying businesses that experienced physical damage as a result of Hurricane Katrina.
Mississippi Development Authority
Tel: (601) 359-3179

Mississippi Emergency Management Agency
Sect. 4 : 393
Table 4.5.1Funding Sources
Program / Activity Type of Assistance Agency & ContactRural Business Enterprise Grants (RBEG)
Creates jobs and stimulate rural economics by providing real estate improvements, equipment, and working capital.
U.S. Department of Agriculture (USDA) State Office
(601) 965-4316
Economic Development Initiative (EDI) Program
Provides grants to communities and counties for the purpose of providing infrastructure to support economic development.
HUDNational OfficeCommunity Planning and Development, Office of Economic Development
(800) 998-9999Brownfields Economic Development Initiative (BEDI)Program
Assists local governments with the redevelopment of abandoned, idled, and underused industrial / commercial facilities where expansion and redevelopment is burdened by real or potential environmental contamination
HUDNational OfficeCommunity Planning and Development, Office of Economic Development
(800) 998-9999Rural Business Opportunity Grants(RBOG)
Provides technical assistance, business development, and planning in rural communities with exceptional need
U.S. Department of Agriculture (USDA) State Office
(601) 965-4316Rural Impact Fund Grant Program
Provides grants to construct or improve public infrastructure to promote job creation in rural areas
Mississippi Development Authority
Tel: (601) 359-3179Small Municipalities and Limited Population Counties Grant Program
Provides grants to promote economic growth by improving public infrastructure.
Mississippi Development Authority
Tel: (601) 359-3179DevelopmentInfrastructure Program (DIP)
Provides grants to construct or improve public infrastructure to promote job creation in rural areas
Mississippi Development Authority
Tel: (601) 359-3179
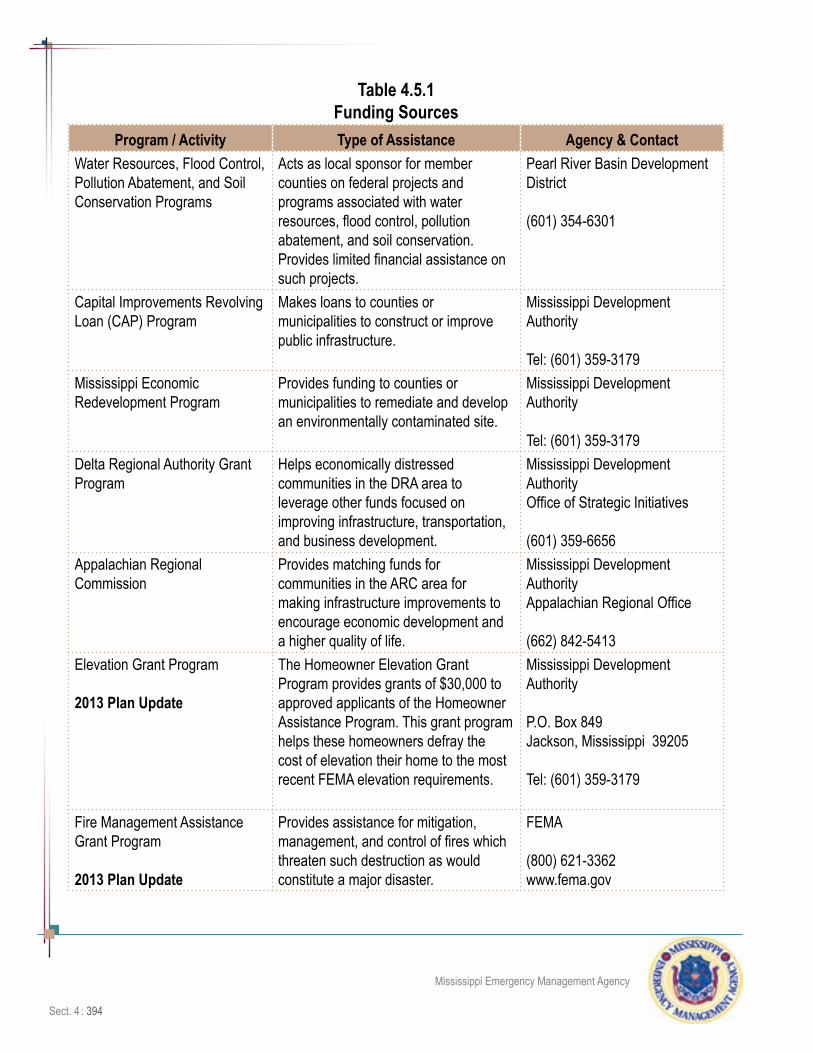
Sect. 4 : 394
Mississippi Emergency Management Agency
Table 4.5.1Funding Sources
Program / Activity Type of Assistance Agency & ContactWater Resources, Flood Control, Pollution Abatement, and Soil Conservation Programs
Acts as local sponsor for member counties on federal projects and programs associated with water resources, flood control, pollution abatement, and soil conservation. Provides limited financial assistance on such projects.
Pearl River Basin Development District
(601) 354-6301
Capital Improvements Revolving Loan (CAP) Program
Makes loans to counties or municipalities to construct or improve public infrastructure.
Mississippi Development Authority
Tel: (601) 359-3179Mississippi Economic Redevelopment Program
Provides funding to counties or municipalities to remediate and develop an environmentally contaminated site.
Mississippi Development Authority
Tel: (601) 359-3179Delta Regional Authority Grant Program
Helps economically distressed communities in the DRA area to leverage other funds focused on improving infrastructure, transportation, and business development.
Mississippi Development AuthorityOffice of Strategic Initiatives
(601) 359-6656Appalachian Regional Commission
Provides matching funds for communities in the ARC area for making infrastructure improvements to encourage economic development and a higher quality of life.
Mississippi Development AuthorityAppalachian Regional Office
(662) 842-5413Elevation Grant Program
2013 Plan Update
The Homeowner Elevation Grant Program provides grants of $30,000 to approved applicants of the Homeowner Assistance Program. This grant program helps these homeowners defray the cost of elevation their home to the most recent FEMA elevation requirements.
Mississippi Development Authority
P.O. Box 849Jackson, Mississippi 39205
Tel: (601) 359-3179
Fire Management Assistance Grant Program
2013 Plan Update
Provides assistance for mitigation, management, and control of fires which threaten such destruction as would constitute a major disaster.
FEMA
(800) 621-3362www.fema.gov

Mississippi Emergency Management Agency
Sect. 4 : 395
Table 4.5.1Funding Sources
Program / Activity Type of Assistance Agency & ContactReimbursement for Firefighting on Federal Property
Provides reimbursement to states and localities only for direct costs and losses over and above normal operating costs.
FEMA
(800) 621-3362www.fema.gov
Dry Fire Hydrant Program Assists communities within the district through funding assistance to increase rural fire protection where by dry fire hydrants are constructed at known water sources to fill up the equipment tanks of a rural fire department.
Pat Harrison Waterway District
(601) 264-5951
Repetitive Flood Claims Program Provides funding to states and communities to reduce or eliminate long-term risk of flood damage to structures insured under the NFIP
FEMA
(800) 621-3362www.fema.gov
Mosquito ControlGrant Program
Provides funding to counties and communities in the Go Zone for the start-up or enhancement of an existing mosquito control program.
Mississippi Department of HealthOffice of Epidemiology(601) 576-7725
Transportation Enhancement Program
Provides funding for various activities that enhance existing or historic transportation facilities including environmental mitigation of run-off pollution
Mississippi Department of TransportationOffice of Intermodal Planning
(601) 359-7025Public Library Capital Improvement Subgrant Program
Provide grants to public libraries for capital improvements, renovation and/or repair of existing facilities
Mississippi Library Commission
(800) 647-7542Physical Disaster Loans and Economic Injury Disaster Loans
Provides disaster loans to non-farm, private sector owners of disaster-damaged property for uninsured losses. Loans can be increased by up to 20 percent for mitigation purposes.
(FEMA registration required prior to contacting SBA)FEMA(800) 621-3362www.fema.gov
Small Business Administration (SBA), National Headquarters Associate Administrator for Disaster Assistance:(202) 205-6734

Sect. 4 : 396
Mississippi Emergency Management Agency
Table 4.5.1Funding Sources
Program / Activity Type of Assistance Agency & ContactPublic Assistance Program (Infrastructure)
Provides grants to states and communities to repair damaged infrastructure and public facilities and to help restore government or government-related services. Mitigation funding is available for work related to damaged components of the eligible building or structure.
FEMA Region IV NFIP & Mitigation (770) 220-5200
MEMA Office of MitigationTel: (601) 933-6362 Fax: (601) 933-6815 www.msema.org
Community Development Block Grant (CDBG) Program
State-Administered
Public Infrastructure Grants
Public Facilities: Provides grants to counties and municipalities to improve infrastructure to eliminate an existing health threat to residents, primarily of low- and moderate-income households.(includes water and sewer facilities, flood and drainage facilities, fire protection, roads and bridges.
Economic Development:. Provides grants to counties and municipalities to provide infrastructure on behalf of a business/industry that commits to job creation or job retention.
Mississippi DevelopmentAuthorityCDBG ProgramCommunity Services Division
Tel: (601) 359-3179
Community Development Block Grant (CDBG) Program
Entitlement Communities Program
Provides grants to entitled cities to improve public infrastructure, primarily benefiting low- and moderate-income persons.
Entitlement Communities include Jackson, Hattiesburg, Pascagoula, Moss Point, Biloxi, and Gulfport.
US Department of Housing and Urban Development (HUD) Entitlement Communities DivisionOffice of Block Grant Assistance(202) 708-1577
State Field OfficeCommunity Planning and Development(601) 965-4700, ext 3140
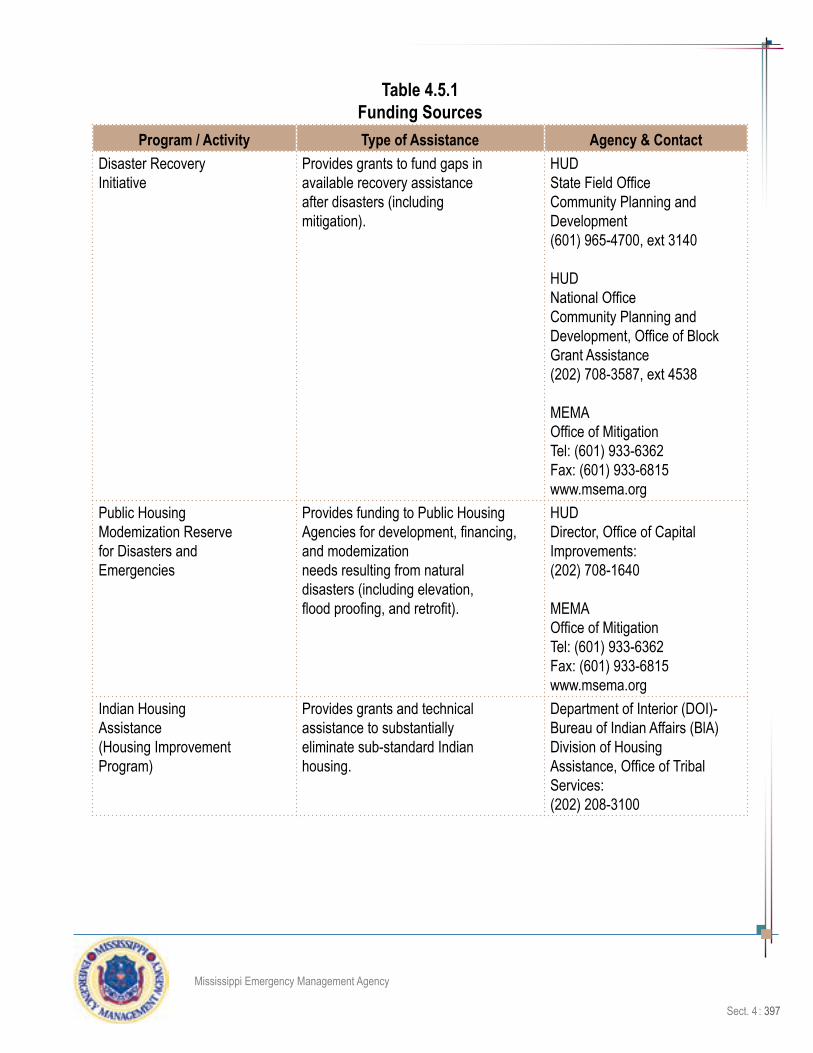
Mississippi Emergency Management Agency
Sect. 4 : 397
Table 4.5.1Funding Sources
Program / Activity Type of Assistance Agency & ContactDisaster Recovery Initiative
Provides grants to fund gaps in available recovery assistance after disasters (including mitigation).
HUDState Field OfficeCommunity Planning and Development(601) 965-4700, ext 3140
HUDNational OfficeCommunity Planning and Development, Office of Block Grant Assistance(202) 708-3587, ext 4538
MEMA Office of MitigationTel: (601) 933-6362 Fax: (601) 933-6815 www.msema.org
Public Housing Modemization Reserve for Disasters and Emergencies
Provides funding to Public Housing Agencies for development, financing, and modemization needs resulting from natural disasters (including elevation, flood proofing, and retrofit).
HUD Director, Office of Capital Improvements: (202) 708-1640 MEMA Office of MitigationTel: (601) 933-6362 Fax: (601) 933-6815 www.msema.org
Indian Housing Assistance (Housing Improvement Program)
Provides grants and technical assistance to substantially eliminate sub-standard Indian housing.
Department of Interior (DOI)- Bureau of Indian Affairs (BlA) Division of Housing Assistance, Office of Tribal Services: (202) 208-3100

Sect. 4 : 398
Mississippi Emergency Management Agency
Table 4.5.1Funding Sources
Program / Activity Type of Assistance Agency & ContactSection 504 Loans for Housing
Offers repair loans, grants and technical assistance to very low-income senior homeowners living in rural areas to repair their homes and remove health and safety hazards.
US Department of Agriculture (USDA) - Rural Housing Service (RHS) State RHS Field Office(601) 965-4325(800) 548-0071 or National RHS HeadquartersHousing and Community Facilities Programs (202) 720-4323
Section 502 Loan and Guaranteed Loan Program
Provides loans, loan guarantees, and technical assistance to very low and low-income applicants to purchase, build, or rehabilitate a home in a rural area
USDA - RHS State RHS Field Office(601) 965-4325(800) 548-0071 or National RHS HeadquartersHousing and Community Facilities Programs (202) 720-4323
Farm Ownership Loans
Provides direct loans, guaranteed/insured loans, and technical assistance to farmers so that they may develop, construct, improve, or repair farm homes, farms, and service buildings, and to make other needed improvements
USDA-Farm Service Agency (FSA) FSA State Field Office(601) 965-4300
orFSA National Office(601) 720-3865

Mississippi Emergency Management Agency
Sect. 4 : 399
Table 4.5.1Funding Sources
Program / Activity Type of Assistance Agency & ContactHOME Investments Partnerships Program
Provides grant funding to States, local governments and consortia for permanent and transitional housing (including support for property acquisition and rehabilitation) for low-income persons.
HUD Community Planning and Development Office of Affordable Housing (877) 833-2483(800) 225-5342
Mississippi Development AuthorityCommunity Services Division Tel: (601) 359-3179
Self-Help Homeownership Opportunity Program (SHOP)
Provides grants to non-profit organizations to purchase home sites and improve infrastructure needed for volunteer-based homeownership programs for low-income families
HUD Community Planning and Development Office of Affordable Housing (877) 833-2483(800) 225-5342
Homeownership Zone (HOZ)Program
Provides grants to communities to reclaim vacant and blighted properties, to increase homeownership and to promote economic revitalization
HUD Community Planning and Development Office of Affordable Housing (877) 833-2483(800) 225-5342
Rural Development Assistance - Housing
Provides grants, loans, and technical assistance in addressing rehabilitation, health and safety needs in primarily low-income rural areas. Declaration of major disaster necessary.
USDA - RHS State RHS Field Office(601) 965-4325(800) 548-0071 or National RHS HeadquartersHousing and Community Facilities Programs (202) 720-4323

Sect. 4 : 400
Mississippi Emergency Management Agency
Table 4.5.1Funding Sources
Program / Activity Type of Assistance Agency & ContactRural DevelopmentAssistance -- Utilities
Provide direct and guaranteed rural economic loans and business-enterprise grants to address utility issues and development needs
USDA-Rural Utilities Service (RUS)Program SupportNational Headquarters(202) 720-9540
State Rural Development Office(601) 965-5460
Rural DevelopmentAssistance – Community Facilities Loans and Grants Program
Provides grants and loans in addressing rehabilitation, health, safety, and emergency (fire, ambulance, sirens, etc.) facilities and equipment needs in rural communities and primarily in low income areas
USDA - RHS State RHS Field Office(601) 965-4325(800) 548-0071 or National RHS HeadquartersHousing and Community Facilities Programs (202) 720-4323
Rural Community Fire Protection
Provides grants for rural fire projects, truck acquisition, or other assistance.
Mississippi State Fire Marshal (601) 359-3569 (888) 648-0877
Section 108 Loan Guarantee Program
Provides loan guarantees to public entities for community and economic development (including mitigation measures).
HUD State Field OfficeCommunity Planning and Development(601) 965-4757
HUD National HeadquartersSection 108 Office(202) 708-1871

Mississippi Emergency Management Agency
Sect. 4 : 401
Table 4.5.1Funding Sources
Program / Activity Type of Assistance Agency & ContactFloods/Flood Control Grants, Loans & Assistance
Floods/Flood Control Technical/Planning Assistance and Program Support.
National Flood Insurance Program
Makes available flood insurance to residents of communities that adopt and enforce minimum floodplain management requirements.
FEMA Region IV NFIP & Mitigation (770) 220-5200
MEMA Office of MitigationTel: (601) 933-6362 Fax: (601) 933-6815 www.msema.org
Flood Mitigation Assistance
Provides grants to States andcommunities for pre-disaster mitigation to help reduce or eliminate the long-term risk of flood damage to structures insurable under the National Flood Insurance Program. Requires flood mitigation plan to be developed by the applicant.
FEMA Region IV NFIP & Mitigation (770) 220-5200
MEMA Office of MitigationTel: (601) 933-6362 Fax: (601) 933-6815 www.msema.org
Flood Control Planning Assistance
Provides technical and planning assistance for the preparation of comprehensive plans for the development, utilization, and conservation of water and related land resources.
Department of Defense (DOD) US Army Corps of Engineers (USACE) Floodplain Management Staff of Appropriate Regional Office:N. MS - Memphis District: (901) 544-3401 C. MS- Vicksburg District (601) 631-5126 S. MS - Mobile District: (334) 690-2495

Sect. 4 : 402
Mississippi Emergency Management Agency
Table 4.5.1Funding Sources
Program / Activity Type of Assistance Agency & ContactNon-Structural Alternatives to Structural Rehabilitation of Damaged Flood Control Works
Provides direct planning and construction grants for non- structural alternatives to the structural rehabilitation of flood control works damaged in floods or coastal storms. $9 million FY99
DOD-USACE Emergency Management Staff of Appropriate Regional Office N. MS - Memphis District: (901) 544-3401 C. MS- Vicksburg District (601) 631-5126 S. MS - Mobile District: (334) 690-2495
Floodplain Management Services
Provides technical and planning assistance at the local, regional, or national level needed to support effective floodplain management.
Department of Defense (DOD) US Army Corps of Engineers (USACE) Floodplain Management Staff of Appropriate Regional Office:N. MS - Memphis District: (901) 544-3401 C. MS- Vicksburg District (601) 631-5126 S. MS - Mobile District: (334) 690-2495 MEMA Office of MitigationTel: (601) 933-6362 Fax: (601) 933-6815 www.msema.org
Works Projects Grants
Flood Control and Water Management
Assists communities within the district to eliminate long and short-term flooding and drainage problems.
Pat Harrison Waterway District
(601) 264-5951

Mississippi Emergency Management Agency
Sect. 4 : 403
Table 4.5.1Funding Sources
Program / Activity Type of Assistance Agency & ContactLand Protection Provides technical assistance for run-off
retardation and soil erosion prevention to reduce hazards to life and property.
USDA-Natural Resources Conservation Service (NRCS) Conservation Planning and Technical Assistance Division National NRCS Office(202) 720-8851 State NRCS Conservationist (601) 965-5196
Dam Safety Programs Provides technical assistance, training, and grants to help improve State dam safety programs.
FEMA Region IV NFIP & Mitigation (770) 220-5200
Mississippi Department of Environmental Quality (MDEQ) Dam Safety Tel: (601) 961-5642 Fax: (601) 354-6938
MEMA Office of MitigationTel: (601) 933-6362 Fax: (601) 933-6815 www.msema.org

Sect. 4 : 404
Mississippi Emergency Management Agency
Table 4.5.1Funding Sources
Program / Activity Type of Assistance Agency & ContactEarthquake Grants, Loans & Assistance
Earthquake Mitigation, Relief, Recovery, Technical/Planning/ Training Grant/Loan Assistance and Program Support.
National Earthquake Hazard Reduction Program
Provides technical and planning assistance for activities associated with earthquake hazards mitigation
FEMA, Dept. of the Interior (DOI), U. S. Geological Survey (USGS), National Institute of Standards and Technology FEMA Region IV NFIP & MitigationEarthquake Program Manager (770) 220-5426
MEMA Office of MitigationTel: (601) 933-6362 Fax: (601) 933-6815 www.msema.org
Geological Survey Program
Acquires, maintains and manages basic geological data; identifies and evaluates geological hazards. The Geological Survey Program assists citizens, industry, and government in the wise use of the state’s minerals, land, and water resources.
Mississippi Department of Environmental Quality Office of Geology (601) 961-5500
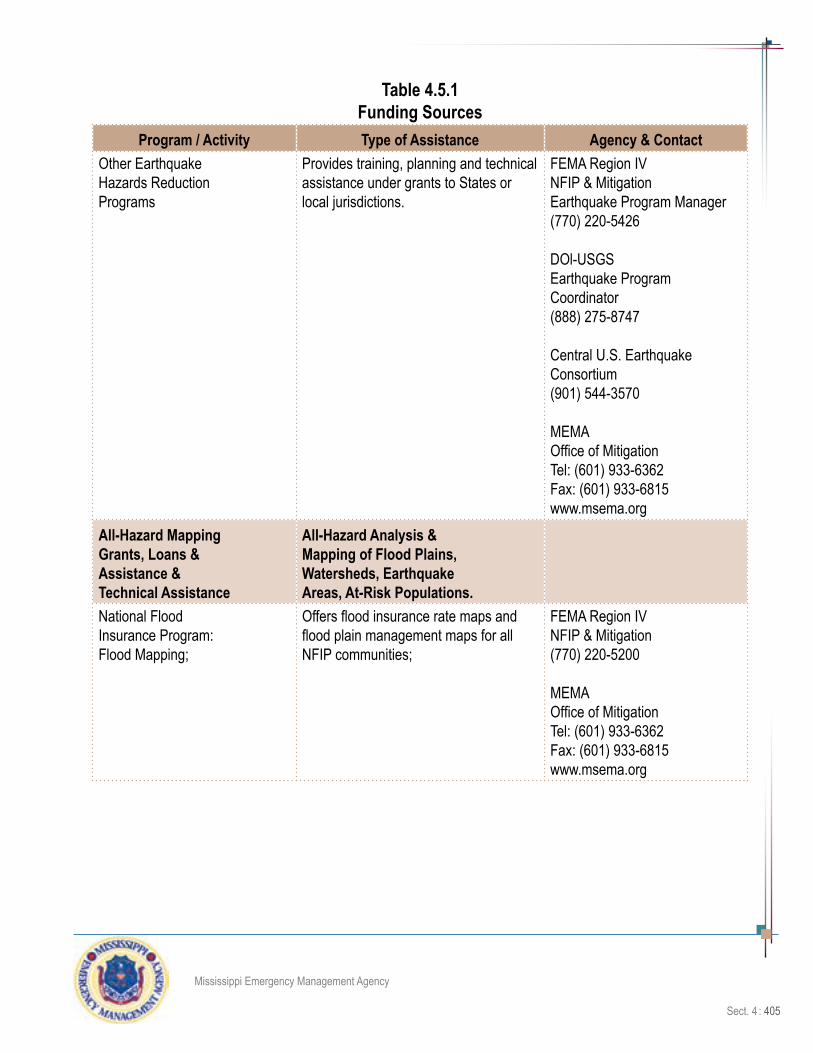
Mississippi Emergency Management Agency
Sect. 4 : 405
Table 4.5.1Funding Sources
Program / Activity Type of Assistance Agency & ContactOther Earthquake Hazards Reduction Programs
Provides training, planning and technical assistance under grants to States or local jurisdictions.
FEMA Region IV NFIP & MitigationEarthquake Program Manager (770) 220-5426
DOl-USGSEarthquake Program Coordinator (888) 275-8747 Central U.S. Earthquake Consortium (901) 544-3570 MEMA Office of MitigationTel: (601) 933-6362 Fax: (601) 933-6815 www.msema.org
All-Hazard Mapping Grants, Loans & Assistance & Technical Assistance
All-Hazard Analysis & Mapping of Flood Plains, Watersheds, Earthquake Areas, At-Risk Populations.
National Flood Insurance Program: Flood Mapping;
Offers flood insurance rate maps and flood plain management maps for all NFIP communities;
FEMA Region IV NFIP & Mitigation (770) 220-5200 MEMA Office of MitigationTel: (601) 933-6362 Fax: (601) 933-6815 www.msema.org

Sect. 4 : 406
Mississippi Emergency Management Agency
Table 4.5.1Funding Sources
Program / Activity Type of Assistance Agency & ContactNational Flood Insurance Program: Technical Mapping Advisory Council
Offers technical guidance and advice to coordinate FEMA map modernization efforts for the National Flood Insurance Program.
DOl-USGS National Mapping Division (573) 308-3802
MEMA Office of MitigationTel: (601) 933-6362 Fax: (601) 933-6815 www.msema.org
Mississippi Digital Earth Model
Develops topographic quadrangles for use in mapping of flood and other hazards.
DOl-USGS National Mapping Division (573) 308-3802
MDEQ Office of Geology and Geospatial Resources DivisionRemote Sensing and GIS. (601) 961-5506 MEMA Office of MitigationTel: (601) 933-6362 Fax: (601) 933-6815 www.msema.org
Stream Gaging and Flood Forecasting Network
Operates a network of over 7,000 stream gaging stations that provide data on river flood characteristics and issues flood warnings and river forecasts to reduce flood damages.
USGS / National Weather Service
USGSNational Office of Surface Water(703) 648-5977
USGS State Office(601) 933-2900
National Weather ServiceOffice of Hydrology(301) 713-0006

Mississippi Emergency Management Agency
Sect. 4 : 407
Table 4.5.1Funding Sources
Program / Activity Type of Assistance Agency & ContactMapping Standards Support
Provides expertise in mapping and digital data standards to support the National Flood Insurance Program.
DOl-USGS
USGSNational Mapping Division (573) 308-3802
MDEQ Office of Geology Geospatial Resources Division (601) 961-5506
National Earthquake Hazards Reduction Program
Provides seismic mapping for U.S. DOl-USGS Earthquake Program Coordinator (703) 648-6785
FEMA, Region IV Mitigation Division Earthquake Program Manager (770) 220-5426
MEMA Office of MitigationTel: (601) 933-6362 Fax: (601) 933-6815 www.msema.org
Ancillary Flood & Natural Resource Projects Grants, Loans & Assistance
Watershed Management, Clean Water, Conservation, Environmental, Forestry, Grant/Loan Assistance, Technical Aid, and Program Support
Natural Resources Financial Assistance
Assist communities with funding for projects that protect the natural environment.
MDEQ Tel: (601) 961-5158
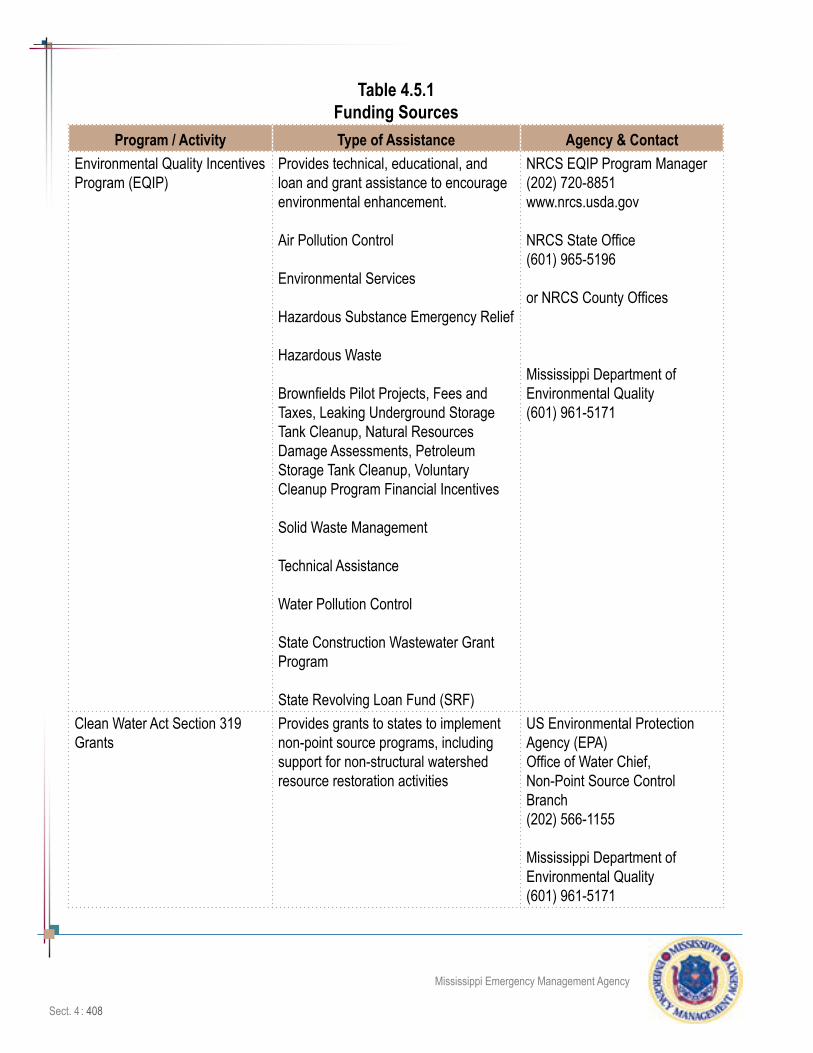
Sect. 4 : 408
Mississippi Emergency Management Agency
Table 4.5.1Funding Sources
Program / Activity Type of Assistance Agency & ContactEnvironmental Quality Incentives Program (EQIP)
Provides technical, educational, and loan and grant assistance to encourage environmental enhancement.
Air Pollution Control
Environmental Services
Hazardous Substance Emergency Relief
Hazardous Waste
Brownfields Pilot Projects, Fees and Taxes, Leaking Underground Storage Tank Cleanup, Natural Resources Damage Assessments, Petroleum Storage Tank Cleanup, Voluntary Cleanup Program Financial Incentives
Solid Waste Management
Technical Assistance
Water Pollution Control
State Construction Wastewater Grant Program
State Revolving Loan Fund (SRF)
NRCS EQIP Program Manager(202) 720-8851 www.nrcs.usda.gov
NRCS State Office(601) 965-5196
or NRCS County Offices
Mississippi Department of Environmental Quality (601) 961-5171
Clean Water Act Section 319 Grants
Provides grants to states to implement non-point source programs, including support for non-structural watershed resource restoration activities
US Environmental Protection Agency (EPA)Office of Water Chief, Non-Point Source Control Branch(202) 566-1155
Mississippi Department of Environmental Quality(601) 961-5171

Mississippi Emergency Management Agency
Sect. 4 : 409
Table 4.5.1Funding Sources
Program / Activity Type of Assistance Agency & ContactClean Water State Revolving Funds
Provides loans at actual or below-market interest rates to help build, repair, relocate, or replace wastewater treatment plants.
EPA Office of Water State Revolving Fund Branch (202) 260-7359
A list of Regional Offices is available upon request
Wetlands Protection - Development Grants
Provides grants to support the development and enhancement of State and tribal wetlands protection programs.
EPA National Wetlands Hotline(800) 832-7828 orEPA Region IVChief, Wetlands Section (404) 562-9900 Mississippi Department of Environmental Quality. (601) 961-5171
Watershed Protection, Flood Prevention, and Soil and Water Conservation Program
Provides technical and financial assistance for installing works of improvement to protect, develop, and utilize land or water resources in watersheds under 250,000 acres.
US Department of Agriculture (USDA) - National Resources Conservation Service (NRCS) Conservation Planning and Technical Assistance Division National NRCS Office(202) 720-8851
Watershed Surveys and Planning Small Watershed Protection Act (PL 566)
Provides surveys and planning studies for appraising water and related resources, and formulating alternative plans for conservation use and development. Provides grants and advisory counseling services to assist with planning and implementing improvement.
USDA-NRCSConservation Planning and Technical Assistance Division National NRCS Office(202) 720-8851 State NRCS Conservationist (601) 965-5196

Sect. 4 : 410
Mississippi Emergency Management Agency
Table 4.5.1Funding Sources
Program / Activity Type of Assistance Agency & ContactEmergency Watershed Protection Program
Provides technical and financial assistance for relief from imminent hazards in small watersheds, and to reduce vulnerability of life and property in small watershed areas damaged by natural hazard events.
USDA-NRCSConservation Planning and Technical Assistance Division National NRCS Office(202) 720-8851 State NRCS Conservationist (601) 965-5196
Wetlands Reserve Program
Provides financial and technical assistance to protect and restore wetlands through easements and restoration agreements.
USDA-NRCSConservation Planning and Technical Assistance Division National NRCS Office(202) 720-8851 State NRCS Conservationist (601) 965-5196
Project Modifications for Improvement of the Environment
Provides for ecosystem restoration by modifying structures and/or operations or water resources projects constructed by the USACE, or restoring areas where a USACE project contributed to the degradation of an area
DOD-USACE Chief of Planning @ appropriate USACE Regional Office (212) 264-7813
Aquatic Ecosystem Management and Restoration
Provides direct support for carrying out aquatic ecosystem restoration projects that will improve the quality of the environment.
DOD-USACE Chief of Planning @ appropriate USACE Regional Office (U.S. Army Corps of Engineers) (212) 264-7813
Beneficial Uses of Dredged Materials
Provides direct assistance for projects that protect, restore, and create aquatic and ecologically-related habitats, including wetlands, in connection with dredging an authorized Federal navigation project.
DOD-USACE Chief of Planning @ appropriate USACE Regional Office (U.S. Army Corps of Engineers) (212) 264-7813
National Cooperative Soil Survey
Maintains soil surveys of counties or other areas to assist with farming, conservation, mitigation or related purposes.
USDA-NRCS Soil Survey Division (202) 720-4593

Mississippi Emergency Management Agency
Sect. 4 : 411
Table 4.5.1Funding Sources
Program / Activity Type of Assistance Agency & ContactLand Acquisition Acquires or purchases easements
on high-quality lands and waters for inclusion into the National Wildlife Refuge System.
DOl-Fish and Wildlife Service (FWS) Southeast RegionDivision of Realty (404) 679-7199
Transfers of Inventory Farm Properties to Federal and State Agencies for Conservation Purposes
Transfers title of certain inventory farm properties owned by FSA to Federal and State agencies for conservation purposes (including the restoration of wetlands and floodplain areas to reduce future flood potential)
US Dept. of Agriculture (USDA) - Farm Service Agency (FSA) Farm Loan Programs National Office (202) 720-3467
State Field Office (601) 965-4300
Federal Land Transfer / Federal Land to Parks Program
Identifies, assesses, and transfers available Federal real property for acquisition for State and local parks and recreation, such as open space.
DOI-National Parks Service (NPS) Federal Lands to Parks OfficeSoutheast Region(404) 562-3175
Federal Lands to Parks Leader NPS National Office: (202) 354-6915
Partners for Fish and Wildlife Provides financial and technical assistance to private landowners interested in pursuing restoration projects affecting wetlands and riparian habitats.
DOl - FWS Southeast RegionEcological Services(404) 679-7138
State Field Office(601) 965-4900
Forest Tree Seedlings Produces and distributes quality seedlings to assure forest regeneration and to sustain Mississippi’s forest resources.
Regeneration Forester Mississippi Forestry Commission (601) 359-2825

Sect. 4 : 412
Mississippi Emergency Management Agency
Table 4.5.1Funding Sources
Program / Activity Type of Assistance Agency & ContactMississippi Reforestation Tax Credit
Promotes reforestation on private, non-industrial lands. A Mississippi Tax Credit on up to 50% of the cost of approved hardwood and pine reforestation practices.
Mississippi Forestry Commission
Tel: (601) 359-1386 Fax: (601) 359-1349www.mfc.state.ms.us
Forest Health Assists timber owners in forest pest management by conducting forest pest surveys and evaluation. Recommendations on practices to salvage lumber, reduce and prevent damage from pests, will be provided to landowners upon request.
Mississippi Forestry Commission
Tel: (601) 359-1386 Fax: (601) 359-1349www.mfc.state.ms.us
Forest Land Enhancement Program
Promotes long-term sustainability of private, non-industrial forestlands. Cost-share assistance is available.
Contact your County Forester
Landowner Services Offers a variety of forest management services to private non-industrial owners of relatively small acreages. Most technical assistance and forestry advice is free to the landowner. Direct services, such as plowing fire lanes, tree planting, and timber-marking are available for a fee.
Contact your County Forester
Forest Resource Development Program
Provides financial assistance to eligible landowners for establishing and improving a crop of trees. This program helps offset a landowner’s expense by sharing the cost implementing one or more forestry practices.
Mississippi Forestry Commission
Tel: (601) 359-1386 Fax: (601) 359-1349 www.mfc.state.ms.us/landownerassistance

Mississippi Emergency Management Agency
Sect. 4 : 413
Table 4.5.1Funding Sources
Program / Activity Type of Assistance Agency & ContactConservation Contracts
Assists debt reduction for delinquent and non-delinquent borrowers in exchange for conservation contracts placed on environmentally sensitive real property that secures FSA loans.
USDA-FSA Farm Loan Programs FSA National Office: (202) 720-3467
FSA State Office(601) 965-4300
Historic Preservation Fund Grants
Provides grants to assist communities in carrying out historic preservation activities.
DOI-National Park ServiceMississippi Department of Archives and History (601) 576-6940
The Foundation Directory
Provides annual source of information about grants & loans from federal and private sources. Available for a fee.
The Foundation Center
(800) 424-9836 www.foundationcenter.org
Federal and Foundation Assistance Monitor
Provides semi-monthly reports on federal and private grants. Available for a fee
CD Publications 8204 Fenton Street Silver Springs, MD 20910 Tel: (301) 588-6380www.cdpublications.com
Environmental Grantmaking Foundations
Provides a comprehensive list of foundations that support environmental nonprofit activities and programs.Available for a fee.
Environmental Grantmaking Foundations
Provides a comprehensive list of foundations that support environmental nonprofit activities and programs.Available for a fee.
Resources for Global Sustainability, Inc.Cary, North Carolina
(800) 724-1857

Sect. 4 : 414
Mississippi Emergency Management Agency
Table 4.5.1Funding Sources
Program / Activity Type of Assistance Agency & ContactBasic & Applied Research/ Development Grants, Loans & Assistance
Research and Educational Assistance Information, Grants / Loans and Technical Assistance
Center for Integration of Natural Disaster Information
Develops and evaluates technology for information integration and dissemination
Department of Interior (DOl) US Geological Survey (USGS)
(888) 275-8747www.usgs.gov
Hazard Reduction Program
Provides funding for research and related educational activities on hazards.
National Science Foundation (NSF), Directorate for Engineering, Division of Civil and Mechanical Systems (703) 292-8360
Decision, Risk, and Management Science Program
Provides funding for research and related educational activities on risk, perception, communication, and management (primarily technological hazards)
NSFDirectorate for Social, Behavioral and Economic Science, Division of Social Behavioral and Economic Research, Decision, Risk, and Management Science Program (DRMS) (703) 292-7263www.nsf.gov/sbe.drms
Societal Dimensions of Engineering, Science, and Technology Program
Provides funding for research and related educational activities on topics such as ethics, values, and the assessment, communication, management, and perception of risk
NSFDirectorate for Social, Behavioral and Economic Science, Division of Social, Behavioral and Economic Research, Societal Dimensions of Engineering, Science and Technology Program(703) 292-7279

Mississippi Emergency Management Agency
Sect. 4 : 415
Table 4.5.1Funding Sources
Program / Activity Type of Assistance Agency & ContactNational EarthquakeHazard Reduction Program (NEHRP) in Earth Sciences
Research into basic and applied earth and building sciences
NSFDirectorate for GeosciencesDivision of Earth Sciences(703) 292-8550
Other Planning Information, Including Demographics, Societal Data, Transportation, Agricultural, Industrial & Other Commercial Economic Statistics
Low and/ or No Cost Information Helpful for Determining At-Risk Populations and Potential Economic Damages & Information to Help Determine Avoidance of Losses.
Demographics, Societal Statistics and Economic Statistics
Provides free Planning Information Concerning Jobs, Business and Economic Statistics, Population and Housing Statistics, and Help with Census Products (i.e. statistics, maps, reports, etc.), State Government, etc. Note: For statistics regarding clean water, wetlands, conservation, disasters, natural resources, rivers, and other subjects covered separately in this document, use the contact information provided in those subject areas.
U.S. Census Bureau Washington DC 20233 General telephone inquiries(800) 923-8282 www.census.gov
Bureau of Economic Analysis (BEA) 1441 L Street NW Washington DC 20230
Public Information Office 202-606-9900 BEA Order Desk 800- 704-0415 Bureau of Labor Statistics Division of Information Services 2 Massachusetts Avenue, N.E. Room 2860 Washington, D. C. 20212 800-877-8339 202-691-5200 www.bls.gov

Sect. 4 : 416
Mississippi Emergency Management Agency
Table 4.5.1Funding Sources
Program / Activity Type of Assistance Agency & ContactUniversity of Mississippi Center for Population Studies
Disseminates U S Census data, provides technical assistance in the collection and analysis of Census and other demographic and social data, and undertakes research on population issues
University of MississippiCollege of Liberal ArtsCenter for Population Studies(662) 915-7288
University of Mississippi Geoinformatics Center
Provides satellite data and crop information
Geology and Geological Engineering
Dr. Greg Easson, Director(662) 915-5995
Hal Robinson(662) 915-1074
Lance Yarborough (662) 915-7651
University of Mississippi
Research Centers www.olemiss.edu
National Climactic Data Maintains the largest active archive of national weather data, produces numerous climate publications, and responds to data requests
U. S. Dept. of CommerceNational Climactic Data Center(828) 271-4800
State Climactic Data Provides current weather information and forecasts, maintains an active archive of weather data for the state, and responds to data requests.
Office of the Mississippi State ClimatologistDr. Charles L. Wax(662) 325-3915

Mississippi Emergency Management Agency
Sect. 5 : 417
5.0: Local Mitigation PlanningA key element of the Disaster Mitigation Act of 2000 is the strengthening of interactions between the state and local communities, particularly in coordination of implementation strategies. It is thought that most significant mitigation occurs at the local level. Thus, it is beneficial to all concerned to make sure that local plans are as effective in identifying hazards and developing action plans.
The Mitigation staff at Mississippi Emergency Management Agency works with counties and local jurisdic-tions to encourage and support local hazard mitigation planning. By developing the State Hazard Mitigation Plan, MEMA is assisting communities in updating local mitigation strategies by initiating a number of activi-ties designed to integrate objectives consistent at both the State and local levels. These activities include funding and technical support, as well as educational opportunities.
Summary Of ChangesTechnical Support (Section 5.1) Planning Assistance for Local Governments were updated. Recipients, funding source and amounts changed. Technical Assistance for Local Governments were updated. Recipi-ents, funding source and amounts changed. CAV’s and CAC numbers were updated along with applicant briefings conducted between 2010-2013.
Methodology and Analysis of Local Plans (Section 5.2) Vulnerability Assessment Methodology by Planning and Development District (Table 5.2.1) Updates To Severe Repetitive Loss Property Analysis and Repetitive Loss Amounts

Sect. 5 : 418
Mississippi Emergency Management Agency
5.1: Local Mitigation Planning Coordination
44 CFR 201.4(c)(4)(i) – To be effective, the plan must include the following elements:
A section on the Coordination of Local Mitigation Planning that includes the following:
A description of the State process to support, through funding and technical assistance, the development of local mitigation plans.
Funding SupportThe State has met it’s goal to have an approved hazard mitigation plan in every community in the state. All 82 counties has an approved hazard mitigation plan. The State will continue the process to support the development of local mitigation plans through funding and technical assistance as follows:
Mississippi has a number of local communities that have the capability and need to develop and implement a local hazard mitigation plan. Many of these communities have existing mitigation plans that are being updated to ensure that the effective implementation of mitigation initiatives is realized. Also these plans are being updated to identify potential utilization of funds for projects in these communities.
Also there are a large number of small communities within the State that do not have the capability of de-veloping and implementing a local hazard mitigation plan. These communities are served by one of the ten regional planning and development districts. These Districts have the capability and experience of develop-ing regional plans and assisting the local communities in implementing those plans.
Planning & Development Districts Counties Point of Contact
Central Mississippi Planning & Development District
Copiah, Hinds, Madison, Rankin, Simpson, Warren & Yazoo
Mr. F. Clarke HolmesExecutive Officer1170 Lakeland Drive Post Office Box 4935Jackson, Mississippi 39296-4935601) 981-1511 (601) 981-1515-Fax
East Central Mississippi Planning & Development District
Clarke, Jasper, Kemper, Lauderdale, Leake, Nesho-ba, Newton, Scott & Smith
Mr. Bill RichardsonExecutive Officer280 Commercial Drive Post Office Box 499Newton, Mississippi 39345(601) 683-2007 (601) 683-7873-Fax

Mississippi Emergency Management Agency
Sect. 5 : 419
Planning & Development Districts Counties Point of Contact
Golden Triangle Planning & Development District
Choctaw, Clay, Lowndes, Noxubee, Oktibbeha, Web-ster & Winston
Mr. Rupert L. JohnsonExecutive Director Post Office Box 828Starkville, Mississippi 39760-0828 (662) 324-7860 (662) 324-7328-Fax
North Central Planning & Development District
Attala, Carroll, Grenada, Holmes, Leflore, Montgom-ery & Yalobusha
Mr. Robert Berry, Jr.Executive Director711B South Applegate Winona, Mississippi 38967(662) 283-2675 (662) 283-5875-Fax
North Delta Planning & Development District
Coahoma, Desoto, Panola, Quitman, Tallahatchie, Tate & Tunica
Mr. Glen BrownExecutive Director220 Power DriveBatesville, Mississippi 38606(662) 561-4100 (662) 561-4112- Fax
Northeast Mississippi Planning & Development District
Alcorn, Benton, Marshall, Prentiss, Tippah & Tishom-ingo
Ms. Sharon Gardner Executive DirectorPost Office Box 600Booneville, Mississippi 38829(662) 728-6248 (662) 728-2417-Fax
South Delta Planning & Development District
Bolivar, Humphreys, Is-saquena, Sharkey, Sunflow-er & Washington
Mr. William B. Haney, Jr.Executive Director124 South Broadway, Post Office Box 1776Greenville, Mississippi 38702(662) 378-3831 (662) 378-3834-Fax
Southern MississippiPlanning & Development District
Covington, Forrest, George, Greene, Hancock, Harrison, Jackson, Jefferson Davis, Jones, Lamar, Marion, Pearl River, Perry, Stone & Wayne Counties
Mr. Leslie NewcombExecutive Director 9229 U. S. Highway 49Gulfport, Mississippi 39503(228) 868-2311 (228) 868-2550-Fax

Sect. 5 : 420
Mississippi Emergency Management Agency
Planning & Development Districts Counties Point of Contact
Southwest Mississippi Planning & Development District
Adams, Amite, Claiborne, Franklin, Jefferson, Law-rence, Lincoln, Pike, Walthall & Wilkinson
Mr. Wirt PetersonExecutive Director 100 South Wall Street Natchez, Mississippi 39120 (601) 446-6044 (601) 446-6071-Fax
Three Rivers Planning & Development District
Calhoun, Chickasaw, Itawamba, Lafayette, Lee, Monroe, Pontotoc & Union
Mr. Vernon R. Kelley IIIExecutive Director75 South Main Street, Post Office Drawer 690Pontotoc, Mississippi 38863 (662) 489-2415 (662) 489-6815-Fax
Technical SupportTechnical Support is provided to local jurisdictions and the Planning and Development Districts (PDD) in developing mitigation plans, identifying mitigation action strategies, and applying for assistance through various funding sources. This support is provided primarily by the MEMA Mitigation Bureau and FEMA Region IV.
The State has a Memorandum of Understanding (MOU) with the ten PDDs to develop local hazard mitiga-tion plans. Under that MOU, the State provided technical assistance funded by FEMA’s Technical As-sistance Program. . The Hazard Mitigation Grant Program and Pre-Disaster Mitigation Program funding are currently being used to develop plans for the local jurisdictions. The State continues to use the FEMA Technical Assistance Program for funding the National Flood Insurance Program, Hazard Mitigation Grant Program, and Hazard Mitigation Planning training workshops for local governments as needed and re-quested.
MEMA has conducted 30 Applicants’ Briefings in support of federally declared disasters since 2010 plan update. MEMA is also a member of Mississippi Civil Defence/Emergency Management Association (MCDE-MA), Building Officials Association of Mississippi (BOAM), and an affiliate of the Mississippi Municipal League (MML) and the Mississippi Association of Supervisors (MAS). MEMA representatives attend the annual and semi-annual meetings of these organizations and provides updates on all mitigation activities taking place throughout the state.
MEMA’s Floodplain Management Specialist conducted a total number of 95 CACs from 2010-2013 and 149 CAV’s from 2010-2013
Additional technical support opportunities provided are shown on the subsequent page.
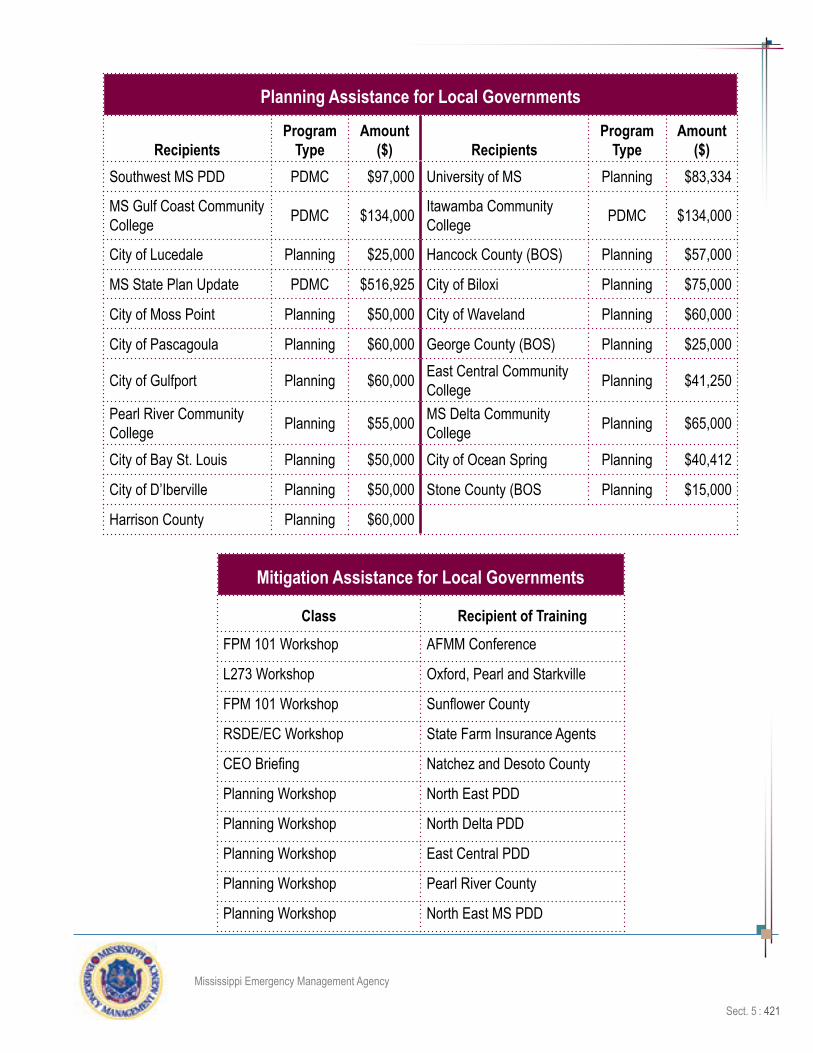
Mississippi Emergency Management Agency
Sect. 5 : 421
Planning Assistance for Local Governments
RecipientsProgram
TypeAmount
($) RecipientsProgram
TypeAmount
($)Southwest MS PDD PDMC $97,000 University of MS Planning $83,334
MS Gulf Coast Community College PDMC $134,000 Itawamba Community
College PDMC $134,000
City of Lucedale Planning $25,000 Hancock County (BOS) Planning $57,000
MS State Plan Update PDMC $516,925 City of Biloxi Planning $75,000
City of Moss Point Planning $50,000 City of Waveland Planning $60,000
City of Pascagoula Planning $60,000 George County (BOS) Planning $25,000
City of Gulfport Planning $60,000 East Central Community College Planning $41,250
Pearl River Community College Planning $55,000 MS Delta Community
College Planning $65,000
City of Bay St. Louis Planning $50,000 City of Ocean Spring Planning $40,412
City of D’Iberville Planning $50,000 Stone County (BOS Planning $15,000
Harrison County Planning $60,000
Mitigation Assistance for Local Governments
Class Recipient of TrainingFPM 101 Workshop AFMM Conference
L273 Workshop Oxford, Pearl and Starkville
FPM 101 Workshop Sunflower County
RSDE/EC Workshop State Farm Insurance Agents
CEO Briefing Natchez and Desoto County
Planning Workshop North East PDD
Planning Workshop North Delta PDD
Planning Workshop East Central PDD
Planning Workshop Pearl River County
Planning Workshop North East MS PDD

Sect. 5 : 422
Mississippi Emergency Management Agency
5.2: Local Plan Integration
44 CFR 201.4(c)(4)(i) – To be effective, the plan must include the following elements:
A section on the Coordination of Local Mitigation Planning that includes the following:
A description of the State process and timeframe by which the local plans will be reviewed, coordinated, and linked to the State Mitigation Plan.
Review and Approval of Local PlansFederal mandate 44 CFR Sec. 201.4 requires that states and local jurisdictions must have an approved mitigation plan in order to receive grant funding. Once a local jurisdiction has applied for and received grant funding for a local hazard mitigation plan, they have one year in which to complete it. Applicants are not eligible to receive mitigation grant funds unless their plan has been approved. During plan development, technical assistance is provided by MEMA upon request, in addition to any plans training already provided.
The Mitigation Planning Bureau of MEMA reviews all local hazard mitigation plans based on the FEMA local plan crosswalk. MEMA and FEMA planners developed a plan review methodology to expedite the plan re-view process. As a result, the State now has over 370 jurisdictions with approved hazard mitigation plans. Prior to the joint review process, only 18 jurisdictions had approved hazard mitigation plans. Once MEMA receives a plan from a local jurisdiction, MEMA planners will review the plan within 30-45 days of receipt and either return the local plan for required revisions or forward the plan to FEMA for final review.
Plans that pass the state review are forwarded to the FEMA Region IV Mitigation Division for conditional approval. Once the local jurisdiction(s) adopts the plan, the State forwards the adoption resolution(s) to FEMA for final approval. FEMA encourages the adoption of local hazard mitigation plans within 90-days of the federal approval.
For local plans that do not pass State review and require additional work, MEMA’s Mitigation Planning Bureau provides a crosswalk with explanations of the actions and or changes that must occur in order to bring the plan into compliance with FEMA planning guidance and the Code of Federal Regulations (CFR) 44. Furthermore, each jurisdiction is provided technical assistance through the Mitigation Planning Bureau Director and the three mitigation planners assigned to regions within the State. Eighteen months prior to plan expiration, local jurisdictions are notified to begin looking at the plan update process and made aware of any available funding sources. The local jurisdictions are again notified at twelve, six and three months before plan expiration.
The Mitigation Planning Bureau will continue to use this review and educational process to assist local jurisdiction leaders in developing and updating plans.

Mississippi Emergency Management Agency
Sect. 5 : 423
Methodology and Analysis of Local PlansThe plan developers analyzed the risk assessments of FEMA-approved local hazard mitigation plans in Mississippi to assess their consistency with the state plan’s risk assessment and to determine if the ranking of the state’s hazards should be revisited and if any additional hazards should be profiled in the state plan. All of Mississippi 82 counties have FEMA approved plans. The 104 approved plans were reviewed to de-termine which hazards each county was vulnerable to and to what degree (city-level plans were examined for consistency with the county-level determinations, but information presented is summarized to the county level).
Among the plans, roughly eight different methodologies were used to assess vulnerability by county (see Table 5.2.1). These methodologies largely follow planning and development district (PDD) boundaries. To properly analyze and summarize the data, a common scale was required. All vulnerability information in the county plans was converted to a High, Medium, Low scale.
Table 5.2.1Vulnerability Assessment Methodology by Planning and Development District
Planning and Development
District
Methodology(Information analyzed)
Central Overall Vulnerability Level Table; High, Medium, Low Scale
East Central Vulnerability Assessment: Overall Summary & Impact Table*
Golden Triangle Vulnerability Assessment Level Table; High, Meduim, Low Scale
Northeast Vulnerability Assessment: Overall Summary & Impact Table*
North Central Hazard Rankings/Priority Vulnerable Areas/ Table; Scale of 0-11 (0-3=Low, 4-7=Me-dium, 8-11=High)
North Delta Individual Vulnerabilities Table; High, Medium, Low Scale
South Delta Overall Vulnerability Level Table; Very High, High, Medium High, Medium, Medium Low, Low, Very Low
Southern Varied; All Converted to High, Medium, Low Scale
Southwest Assessing Vulnerability—Overall Summary and Impact*
Three Rivers Vulnerability Assessment: Overall Summary & Impact*Note: *These assessments did not include rankings or ratings. Information provided about likelihood and expected impacts were assigned numeric values, added together, and converted to the High, Medium, Low scale.
Sect. 5 : 424
Mississippi Emergency Management Agency
Linking Local Plans to the State PlanDuring the 2013 plan update process, the State gathered information from local plans to integrate this data into the State plan. The Hazard Mitigation Council reviewed and summarized information from the local plans on the following categories:
• Hazard identification and risk assessment• Goals and objectives• Local capabilities• Mitigation actions
The process in 2013 involved reviewing all of the county-level plans and capturing the information related to the four categories above in spreadsheets for further review and comparison purposes. (For more details on this process, and how the information was collected and incorporated, see Section 3.0 Risk Assess-ment, Section 4.1 Hazard Mitigation Goals and Objectives, Section 4.3 Local Capability Assessment, and Section 4.4 Mitigation Actions.)
This information was used to inform the planning process and to reassess the plan for the following pur-poses:
• To improve the alignment of the state mitigation strategy with local goals, objectives, and actions;• To update the statewide risk and vulnerability assessments;• To identify and promote initiatives proven successful at the local level; • To review state initiatives to determine if they meet the overall mitigation needs of the state and to
change those that have not produced anticipated results; and • To link local action with the state’s mitigation strategy.
New and updated plans will be incorporated into the state plan during the three-year update cycle. Should state priorities change, these plans may be incorporated sooner.
The Mitigation Planning Bureau of MEMA makes a copy of the State plan and a summary of state pri-oritized strategies available to each local community. It was evident in the local plan review that some jurisdictions did incorporate information from the State plan’s risk assessment and goals and objectives into their local plan. Upon approval of this plan update, the State would like to further promote the use of the updated risk assessment and mitigation strategy in local government mitigation planning by using the Planning and Development Districts. HAZUS flood models developed for each county, and hurricane and earthquake models developed for vulnerable counties, will also be distributed to counties through the Plan-ning and Development Districts.
This 2013 update reflects the successful integration of the plans from all 82 counties in the state. MEMA has encouraged local governments to participate in multi-jurisdictional, county-level plans, to maximize the number of communities covered by mitigation plans and to help develop more coordinated, regional ap-proaches to mitigation. Now that all the counties have a FEMA approved plan, MEMA’s priority is to ensure timely updates of the local jurisdictions plans. As local plans are updated, the local governments will be en-couraged to develop more tailored actions to their specific community. MEMA’s priority will be facilitating the completion of remaining local plans, followed by technical assistance on plan implementation and updates.
Mississippi Emergency Management Agency
Sect. 5 : 425
5.3: Prioritizing Local Technical Assistance
44 CFR 201.4(c)(4)(i) – To be effective, the plan must include the following elements:
A section on the Coordination of Local Mitigation Planning that includes the following:
Criteria for prioritizing communities and local jurisdictions that would receive planning and project grants under available funding programs, which should include consideration for com-munities with the highest risks, repetitive loss properties, and most intense development pres-sures. Further, that for non-planning grants, a principal criterion for prioritizing grants shall be the extent to which benefits are maximized according to a cost benefit review of proposed projects and their associated costs.
Funding PriorityThe state has established the following types of projects for funding priority:
• Hazard Mitigation Planning.
• Retrofit of critical facilities and critical infrastructure.
• Repetitive flood properties and severe repetitive flood loss areas.
• Projects that would result in a general improvement of regional or local mitigation capability.
• State Identified Mitigation Initiatives such as saferooms and storm shelters, severe weather warn-ing systems for universities and colleges, and severe weather notification systems for local com-munities.
• Post-disaster identified mitigation needs.
• Other projects initiatives identified in the state and local mitigation plan.
For non-planning grants, a principal criterion for prioritizing grants shall be the extent to which benefits are maximized according to a cost benefit review of proposed projects and their associated costs.
Prioritizing Alternatives STAPLE/E (Social, Technical, Administrative, Political, Legal, Economic, and Environmental) criteria to select and prioritize the most appropriate mitigation alternatives for the plan. This methodology requires that social, technical, administrative, political, legal, economic, and environmental considerations be taken into account when reviewing potential actions to undertake. This process was used to help ensure that the most equitable and feasible actions would be undertaken based on the state’s capabilities. Appendix 7.5.3-A provides additional information regarding the review and selection criteria for alternatives.

Sect. 5 : 426
Mississippi Emergency Management Agency
Prioritization of Communities /Jurisdictions for Planning Grants This section provides a description of the criteria by which the State will prioritize communities and local jurisdictions that would receive planning grants under the Hazard Mitigation Grant Program (HMGP), Flood Mitigation Assistance (FMA), Pre-Disaster Mitigation (PDM), and other available funding programs.
Federal and State funding for mitigation planning will be limited and in some instances may not be avail-able. There will always be more requests for mitigation planning funds than there will be available funds. Approval of funds for mitigation planning will be based on the availability of funds and the determination as to whether the requesting jurisdiction has demonstrated the desire and ability to complete the plan and follow through on the strategies identified in the plan. This desire to comply with the initiatives in the local mitigation plan should not be dependent on the availability of state or federal funds. Local jurisdictions should develop mitigation plans based on their unique capabilities and needs.
In an effort to allow some flexibility in the distribution of mitigation planning funds, the following general guidelines have been developed. These guidelines are not all inclusive and compliance with all of the is-sues listed below may not be required for approval of a planning grant.
• The community must meet the criteria for the specific source of funds referenced in Section 5.1 (Funding Support).
• MEMA will consider its past experience in dealing with the community on other grants (such as disaster grants, mitigation projects, etc.).
• MEMA may contact the Mississippi Development Authority (MDA) Community Development Block Grant (CDBG) program, other State agencies/departments, and/or the Planning & Development District (PDD) to check on their past experiences with the requesting community.
• The State and local risk assessment will be reviewed to determine the susceptibility of the commu-nity to natural and human caused disasters.
• MEMA will review previous presidential disaster declarations to determine the number of times the requesting community has been impacted by declared disasters and the magnitude of damages resulting from those disasters. This review would consider impact on community infrastructure, as well as families and businesses.
• MEMA will also consider the number of non-declared disasters that have impacted the community. This review would consider impact on community infrastructure, as well as families and businesses.
• MEMA will consider whether or not the community participates in the National Flood Insurance Program (NFIP).
• MEMA will consider the number of insured, repetitive loss structures in the community.
• MEMA will also consider the community’s status as a small-impoverished community and communi-ties with special developmental pressures, if applicable.
• The community has identified natural disaster hazards in areas under its jurisdiction.

Mississippi Emergency Management Agency
Sect. 5 : 427
Prioritization of Non-Planning Grants This section provides a description of the criteria by which the State will prioritize communities and local jurisdictions that would receive non-planning grants under the Hazard Mitigation Grant Program (HMGP), Flood Mitigation Assistance (FMA), Pre-Disaster Mitigation, and other available funding programs.
• The extent and nature of the hazards to be mitigated;
• The degree of commitment of the local government to reduce damages from future natural disas-ters;
• The degree of commitment of the local government to support the hazard mitigation measures to be carried out using the technical and financial assistance;
• The extent to which the hazard mitigation measures to be carried out using the technical and finan-cial assistance contribute to established State/Local mitigation goals and priorities;
• The extent to which prioritized, cost-effective mitigation activities that produce meaningful and definable outcomes are clearly identified;
• If the local government has submitted a mitigation plan, the extent to which the activities identified under paragraph (5) above are consistent with the mitigation plan;
• The opportunity to fund activities that maximize net benefits to society;
• The extent to which assistance will fund activities in small impoverished communities;
• The extent of development pressure particularly in those areas experiencing unexpected growth as a result of the post-Katrina evacuation and relocations;
• Communities with the highest risk; and
• Small and Impoverished Community Provisions
As used in pre-disaster mitigation, a small-impoverished community means a community of 3,000 or fewer individuals that is economically disadvantaged, as determined by the State. Additional criteria may be de-termined by FEMA. The President may increase the federal cost share to 90% of the total cost of mitigation activities carried out by small impoverished communities; however, all other requirements will be the same as any other community participating in pre-disaster mitigation activities.
In order for a project to be considered for funding, it has to have a benefit cost ratio of a minimum of 1.0 that is technically feasible and cost-effective in accordance to FEMA requirements. Only projects that meet this criteria along with the other bulleted elements listed above are considered eligible, this ensures that the benefits are maximized from the projects. In accordance with the Hazard Mitigation Plan and the Adminis-trative Plan, the Hazard Mitigation Council approves projects that meet the goals and objectives of the state plan and based also on the recommendations of the State Hazard Mitigation Officer. Mississippi Gulf Coast communities have received more grant funding than the other areas of the state because of the higher risks associated with the coastal area.

Sect. 5 : 428
Mississippi Emergency Management Agency
Mississippi is classified as a mostly rural state. Sixty-three percent of the state is classified as rural and thirty-four percent urban. At the time of this plan update, the Hazard Mitigation Council is unaware of any significant development pressures within the state’s communities. None of the communities have identified any development pressures in their local plans and was not addressed in the state plan. Should the state’s communities identify any development pressures in the future, they will be addressed at the appropriate time.
The State of Mississippi amended it’s plan to participate in FEMA’s Severe Repetitive Loss Program to take advantage of the 90/10 cost share to help mitigate RL properties. The state is committed to mitigating these properties.
Evaluation of Prioritizing Planning and Non-Planning GrantsThe Hazard Mitigation Bureau’s Administrative Plan for the Hazard Mitigation Grant Program provides an evaluation process for approval of grant applications as stated in Section VI – Program Administration. In addition, this plan presents a process to ensure benefits are maximized according to a cost benefit review of proposed projects.
Repetitive and Severe Repetitive LossSection 3 provides details about hazard assessments in Mississippi and appropriate mitigation actions to increase safety and reduce losses. One of the most revealing facts is the repetitive and severe repetitive losses that occur to structures and infrastructures. Mitigation Actions have been identified to address these repetitive and severe repetitive losses and are listed in Table 3.6.7. These actions were developed from an historical, as well as a vulnerability, perspective.
Table 3.6.4 provides details about the National Flood Insurance Program. This information shows 9,816 repetitive loss properties with 13,529 claims and over $332 million repetitive losses paid. With 1,423 repetitive loss properties mitigated, the State of Mississippi has shown to place a high priority on assisting local communities in reducing future losses through defined mitigation actions. Our goal is to continue to increase the mitigation of repetitive and severe repetitive loss properties. The State of Mississippi is com-mitted to mitigate its repetitive and severe repetitive loss properties, to that end we have previously amend-ed the state plan to take advantage of the SRL Program with the 90/10 share cost. With that being said, the State of Mississippi does not adopt or enforce a statewide building code for all structures, nor does it man-date a code for residential construction. It is up to local jurisdictions to adopt and enforce building codes.
• We do encourage communities to restrict development in flood prone areas by implementing stricter building codes, zoning and ordinances.
• Placed and continue to place higher priority for applications inclusive of, but not limited to, develop-ing a floodplain management program, restricting development in flood prone areas, acquiring flood prone properties, elevate structures that have been deemed repetitive loss and severe repetitive loss structures, and flood proofing businesses that meet the criteria of repetitive loss and severe repetitive loss structures.
Hurricane Katrina mitigated a large number of repetitive loss properties, the exact number is unknown at this time and the state is continuing to make mitigating RL properties a priority.

Mississippi Emergency Management Agency
Sect. 6 : 429
6.0: Plan Maintenance ProcessA formal process is required to ensure that the Plan will remain an active and relevant document. This section, Plan Maintenance, includes a schedule for monitoring and evaluating the Plan annually, and for revising the Plan every three years. It describes how the Hazard Mitigation Council and individual member institutions will receive public input throughout the process. Finally, this section explains how institutions will transform the mitigation strategies outlined in this plan into existing planning mechanisms.
Summary of Changes-2010 Plain Maintenance• Plan Monitoring,Evaluating, and Updating (Section 6.1.1) Mitigation action appendix numbers
updated
• Plan Evaluation (Section 6.1.2) Quarterly meetings that involved periodic reports from other agen-cies.
• The projects were worked on and narrowed down to 65 projects.
• Staffing (Section 6.2.3) Updates were done on staff titles and duties.

Sect. 6 : 430
Mississippi Emergency Management Agency
6.1: Monitoring, Evaluating, and Updating the Plan
44 CFR 201.4(c)(5)(i)(ii) - The State mitigation strategy shall include the following elements:
A Plan Maintenance Process that includes:
An established method and schedule for monitoring, evaluating, and updating the plan.
A system for monitoring implementation of mitigation measures and project closeouts.
6.1.1 Plan Monitoring, Evaluating, and UpdatingThe Mississippi Hazard Mitigation Council participants will review the goals, objectives, and action items listed in the plan on a quarterly basis. They shall be responsible for communicating any desired or neces-sary changes to the Mississippi Emergency Management Agency and other stakeholders. The Hazard Mitigation Council will convene quarterly meetings to conduct the following activities:
• Review existing action items to determine appropriateness of funding;
• Identify issues that may not have been identified when the plan was developed;
• Prioritize potential mitigation projects using the methodology described in the plan; and
• Assist in development of funding proposals for priority action items.
The mitigation action worksheets included in Appendix 7.3.12 C will be used to evaluate project status and to update such items as time-line, funding source, and responsible entity. The Mississippi Emergency Management Agency Office of Mitigation will be responsible for updating the plan on a three-year cycle. A memorandum, describing needed changes and progress on implementation, will be provided annually to MEMA, FEMA Region IV, and the Hazard Mitigation Council.
The previously approved State of Mississippi Standard Mitigation Plan dated August of , dealt with monitor-ing, evaluating, and updating the plan in section 6.1. This section called for review in three ways:
• Annual review of mitigation actions and identified projects,
• Review after each major disaster to determine the need for Plan refocus, and
• Review every three years before resubmission to FEMA for approval.
The State focused its priorities on sustaining those communities most affected by Hurricane Katrina, how-ever; from this point forward in an effort to make the updated plan a living document that will be constantly reviewed and utilized to track projects, the new plan will be evaluated at each quarterly Hazard Mitigation Council Meeting. This change will provide an opportunity for effective utilization of the Plan and will involve stakeholders from State agencies with responsibility for mitigation actions and projects.

Mississippi Emergency Management Agency
Sect. 6 : 431
6.1.2 Plan EvaluationIn addition to quarterly reviews, the Hazard Mitigation Council and each participating agency will perform a more comprehensive review of the Plan every two years, or as deemed necessary by the Council and MEMA. The coordinating organizations responsible for the various action items will report on the status of their projects, the success of various implementation processes, difficulties encountered, and success of coordination efforts. They will then evaluate the content of the plan using the following questions:
• Are these programs effective?
• Have there been any changes in development that affect our mitigation priorities?
• Do our goals, objectives, and action items meet STAPLE/E criteria?
• Are our goals, objectives, and action items relevant, given any changes in our Agency?
• Are our goals, objectives, and action items relevant given any changes to State or Federal regula-tions and policy?
• Is there any new data that affects the risk assessment portion of the Plan?
The Hazard Mitigation Council meets quarterly. During our quarterly meetings, the following occured:
• Review updates of risk assessment data and findings, as well as new events and data
• Discuss methods of continued public and stakeholder participation, and
• Document successes and lessons learned based on actions that were accomplished during the past two years.
Any resulting updates or changes will be included in the Plan. Again, the Hazard Mitigation Council and the Mississippi Emergency Management Agency Office of Mitigation will be responsible for making any chang-es and will provide the updates via a memorandum, as described earlier, and will keep files of changes needed for the three-year re-submittal.
The 2010 Standard Mitigation Plan contained project profiles; these profiles are regularly updated and reviewed by all State agencies that have assigned projects using State’s intrasite. During the quarterly Haz-ard Mitigation Council meetings, these projects were discussed and evaluated to make sure that projects remained relevent and viable.
The State began with a total of 110 projects assigned to different state agencies to monitor and imple-ment. Based on evaluation and feedback of the mitigation actions/projects, the projects that were found to redundant or obsolete were combined or deleted. The State started out with 110 and narrowed it down to 65 actions to date.
The process for monitoring the mitigation actions has been modified. A tabular summary of all projects referenced to a profile will be available and will detail each mitigation action. The monitoring process will be organized in an information management system, which will be maintained and updated by MEMA. The new process will provide for efficient and effective updates of the mitigation actions. Since the Hazard Mitigation Council will now meet quarterly, review of the mitigation action will result in timely updates.

Sect. 6 : 432
Mississippi Emergency Management Agency
6.1.3 Plan UpdatesThe Hazard Mitigation Council is responsible for making updates to the Plan, and the Agency participants are responsible for the content of the updates. The council meets quarterly and continue to contribute input and periodically reporting on agency projects.The Agencies will provide institutional-level updates to the Plan when necessary. At the time of review, the following key questions will be addressed:
• Are the plan goals still applicable?
• Are there new partners or stakeholders who should be targeted for involvement?
• Do existing actions need to be re-evaluated or re-prioritized for implementation?
• Are the actions still appropriate given current resources?
• Have changes in construction and development influenced the effects of hazards?
• Are there new studies or data available that would enhance the risk assessment?
• Have the Agencies been affected by any disasters, and did the plan accurately address the impacts of the events?
The Plan will be submitted for review to MEMA and FEMA every three years.
6.1.4 Implementation through Existing ProgramsThe multi-institutional participants can use the Plan as a baseline of information on the natural hazards that impact their institutions.
6.1.5 Continued Public InvolvementThe public, as well as State and Local communities, will be directly involved in reviewing and updating the Plan. The Hazard Mitigation Council and its representatives should solicit feedback from the public during monitoring, evaluating, and updating the Plan as described above. The State Plan is accessible on our MEMA website for the public to view and give feedback to the state plan.

Mississippi Emergency Management Agency
Sect. 6 : 433
6.2: Monitoring Progress of Mitigation Actions and Assessments of Mitigation Actions
44 CFR 201.4(c)(5)(iii) - The State mitigation strategy shall include the following elements:
A Plan Maintenance Process that includes:
A system for reviewing progress on achieving goals as well as activities and projects identified in the Mitigation Strategy.
The plan maintenance process should include:
• A system for monitoring implementation of mitigation measures and project closeouts.
• A system for reviewing progress on achieving goals as well as activities and projects in the Mitiga-tion Strategy.
6.2.1 Monitoring Implementation of Mitigation Measures and Project Closeouts
Mississippi Emergency Management Agency (as grantee) recognizes the responsibilities laid out in 44 CFR 206.438(a): The State, serving as grantee, has primary responsibility for project management, account-ability of funds as indicated in 44 CFR part 13, and is responsible for ensuring that subgrantees meet all program and administrative requirements.
The State Hazard Mitigation Grant Administrative Plan outlines the administrative procedures that the state employs for meeting these requirements.
6.2.2 Progress Review for Mitigation Goals and Objectives In order for any program to remain effective, the goals and objectives of that program must be reviewed periodically. That review should address, as a minimum, the following issues:
• Are the established goals and objectives realistic? Take into consideration available funding, staff-ing, and state/local capabilities, and the overall State mitigation strategy.
• Has the State clearly explained the overall mitigation strategy to local governments?
• Are proposed mitigation projects evaluated based on how they help the State and/or local govern-ment meet overall mitigation goals and objectives?
• How have approved mitigation projects complemented existing State and/or local government mitigation goals and objectives?
• Have completed mitigation projects generated the anticipated cost avoidance or other disaster reduction result?
Sect. 6 : 434
Mississippi Emergency Management Agency
A thorough and realistic evaluation of the benefits of a mitigation project may be delayed until the area of the project is impacted by another disaster. The lack of realized benefits from a completed mitigation project may result in the disapproval or modification of similar projects in the future. At the same time, mitigation projects that have proven their worth may be repeated in other areas of the State.
Based on the results of the review/evaluation mentioned above, the State may need to adjust its goals and objectives to meet the current and future mitigation needs of the State and local governments. A quar-terly mitigation status report will be prepared by the MEMA Mitigation Planning Bureau. This report will be provided to the MEMA Director and Deputy Director for review and distribution, as needed. The report will address, as a minimum, the following items:
• Mitigation goals, objectives and strategies ◊ Brief description of the project
◊ Linkage of the project with goals and objectives
◊ Linkage of project with strategies.
◊ Linkage of the project with funding priorities
• Completed mitigation projects ◊ Affected jurisdiction
◊ Brief description of the project
◊ Source of funding
◊ Brief summary of any problem areas, with proposed solution
◊ Brief summary of effectiveness (cost-avoidance) of project, if available
• Mitigation projects in progress ◊ Affected jurisdiction
◊ Brief description of the project
◊ Source of funding
◊ Brief summary of project status
◊ Anticipated completion date
• Pending (under review) mitigation projects ◊ Affected jurisdiction
◊ Brief description of the project
◊ Source of funding
◊ Brief summary of project status

Mississippi Emergency Management Agency
Sect. 6 : 435
6.2.3 Staffing The Mississippi Emergency Management Agency will implement the State Plan and administer the mitiga-tion programs by utilizing the following positions:
Mitigation Office Director
The Mitigation Office Director has overall management responsibility for the program and is responsible for ensuring that the state properly carries out its Section 404 and Section 406 responsibilities subse-quent to a Presidential Disaster Declaration. In this regard, the Mitigation Office DIrector will monitor the activities of the mitigation staff and the State Hazard Mitigation Team. Responsibilities include, but are not limited to:
◊ Ensuring the Administrative Plan is updated, outlining how the state will administer the Hazard Mitigation Grant Program and other applicable hazard grant programs.
◊ Ensuring that the State Hazard Mitigation Plan is active and identifies potential hazard mitigation projects, as well as establishes priorities among those projects.
◊ Ensuring that all potential applicants are notified of the program and receive the assis-tance to which they are entitled.
◊ Ensuring that a proper initial application and any necessary supplemental applications, including SF-424’s, are submitted in a timely fashion to the FEMA Region IV Director.
◊ Ensuring that technical assistance is provided to potential applicants and/or eligible sub-grantees.
◊ Ensuring that adequate procedures are developed for the distribution of financial assis-tance to eligible subgrantees by the technical assistance staff.
◊ Ensuring development of a system to monitor completion of approved projects in federally required time frames.
◊ Ensuring that a system exists to monitor subgrantee accounting systems and is in compli-ance with 44 CFR parts 13 and 14.
◊ Ensuring that appropriate state agencies are on the State Hazard Mitigation Team and are involved as necessary with the hazard mitigation process.
◊ Ensuring participation of the appropriate local agencies in the administration and imple-mentation of the hazard mitigation process.
◊ Coordinating with the GAR on all policy/regulatory issues. Reviewing and making appro-priate recommendation to the GAR regarding appeals, cost overruns/underruns and all other program issues is also included.

Sect. 6 : 436
Mississippi Emergency Management Agency
Mitigation Grants Bureau Director
The Mitigation Grants Bureau Director is responsible for the grants program coordination, implementa-tion and administration. He/She will asure the necessary work required to deliver the Mitigation Grant Programs to eligible subgrantees. The individual filling this is usually appointed as the state hazard miti-gation officer (SHMO) for Hazard Mitigation Grants Program funding. In addition to assisting the Office Director in all aspects of mitigation, the Mitigation Grants Bureau Director’s responsibilities include, but are not limited to:
◊ Develop the Administrative Plan which outlines how the State will administer the Hazard Mitigation Grant Program and implement the plan in a Presidential Disaster Declaration.
◊ Develop and implement a process for identifying potential hazard mitigation projects and setting priorities among those projects.
◊ Maintain a management system for hazard mitigation activities and products.
◊ Notify potential applicants of the program and brief them, with appropriate handout mate-rial on elements of the program.
◊ Coordinate with Federal, State and local officials to ensure that they understand the involvement of the Hazard Mitigation effort in the Public Assistance program.
◊ Provide technical assistance to potential applicants and /or eligible subgrantees in devel-oping and submitting applications and in completing projects.
◊ Implement departmental procedures to monitor the status of approved projects, for pro-cessing extention requests and appeals, and for closing out completed projects
◊ Coordinate with the Administrative and Finance Bureau staff in monitoring subgrantee accounting systems to meet requirements of Code of Federal Regulations (CFR) 44 Part 13 and Part 14.
◊ Help update the State Hazard Mitigation Plan.
◊ Conduct site visits to monitor progress and provide technical assistance.
◊ Assist the Mitigation Office Director in conducting mitigation conferences and or public meetings.
Mississippi Emergency Management Agency
Sect. 6 : 437
Grants Management Specialist
The Grants Management Specialist is responsible for program coordination, implementation and ad-ministration. The specialist will accomplish the necessary work required to deliver the Hazard Mitigation Grant Program to eligible subgrantees. In addition to assisting the SHMO in all aspects of mitigation, the Grants Specialist responsibilities include, but are not limited to:
◊ Developing the Administrative Plan, which outlines how the State will administer the Hazard Mitigation Grant Program, and implementing the plan in a Presidential Disaster Declaration.
◊ Developing and implementing a process for identifying potential hazard mitigation projects and for setting priorities among those projects.
◊ Maintaining a management system for hazard mitigation activities and products.
◊ Notifying potential applicants of the program and briefing them, with appropriate handout material, on elements of the program.
◊ Coordinating with Federal, State and local officials to ensure that they understand the involvement of the Hazard Mitigation effort in the Public Assistance program.
◊ Providing technical assistance to potential applicants and/or eligible subgrantees in devel-oping and submitting applications and in completing projects.
◊ Implementing departmental procedures to monitor the status of approved projects, for processing extension requests and appeals, and for closing out completed projects.
◊ Coordinating with the Administrative & Finance Bureau staff in monitoring subgrantee ac-counting systems to meet requirements of Code of Federal Regulations (CFR) 44 Part 13 and Part 14.
◊ Helping update the State Hazard Mitigation Plan.
◊ Conducting site visits to monitor progress and provide technical assistance.
◊ Assisting the Mitigation Office Director in conducting mitigation conferences and or public meetings.

Sect. 6 : 438
Mississippi Emergency Management Agency
NFIP State Coordinator/ Floodplain Management Bureau Director
The National Flood Insurance Program (NFIP) State Coordinator is responsible for the direction, evalu-ation, oversight, planning, and promotion of the 312 + local floodplain management programs within the state of Mississippi. Work also invlolves advising MEMA staff of floodplain management requirements; as they pertain to emergency preparedness, response, and recovery actions. Successful oversight of the local communitites’ floodplain management programs enables the MEMA hazard mitigation assis-tance, mitigation planning, public assistance, and individual assistance bureaus to effectively adminis-ter their programs.
The FPM Bureau is the only compliance/regulatory focused staff element within MEMA. Accordingly, its compliance and enforcement actions include frequent contacts/inspections with state and local officials, public agencies; community and civic groups, etc. Other duties include, but are not limited tot he follow-ing:
◊ Planning and conducting the Agency’s portion of the Flood Map Modernization Initiative and the follow-up Risk MAP initiative.
◊ Oversight of the 23 Community Rating System (CRS) communities within the state.
◊ Advising and assisting local officials on floodplain management and NFIP training, work-shops, conferences, and emergency test exercises.
◊ Planning and participating in floodplain management and NFIP training, workshops, con-ferences, and emergency test exercises
◊ Making public appearances before civic and community groups to promote the floodplain management program.
◊ Corresponding with local officials, government agencies, federal floodplain management representatives, etc., and preparing reports as required.
◊ Assisting local communities throughout the state in preparation of flood damage preven-tion ordinances, pamphlets, training, and education documents.
◊ Traveling extensively throughout the state to conduct both Community Assistance Visits (CAV) and Community Assistance Contact (CAC) visits.
◊ Reviewing local regulations and FPM programs for compliance with federal regulations.
◊ Providing staff to the State Emergency Response and FPM programs for compliance with federal regulations.
◊ Providing staff to the State Emergency Response Team (SERT) and to the logistics ele-ment within the State Emergency Operations Center during times of state emergencies and activiations.
Mississippi Emergency Management Agency
Sect. 6 : 439
Floodplain Management Specialist
The duties of the Floodplain Management Specialist include providing regulatory and programmatic oversight, technical assistance, and floodplain management training to communities within an assigned district (of counties) that participate in the NFIP. All actions are based on the 44 CFR 60.1 – 60.3, Executive Order 11988, and other Federal/State regulations. Other duties include, but are not limited to the following:
◊ Providing technical assistance with local community governments.
◊ Conducting Community Assistance Visits (CAV) and Community Assistance Contact (CAC) actions per FEMA and MEMA guidelines.
◊ Responsible for inputting and tracking all floodplain managemnet actions through the use of the FEMA community Information System (CIS)
◊ Responsible for inputting and tracking all actions through the use of the FEMA Commu-nitInformation System (CIS).
◊ Assisting the State Coordinator in facilitating the Risk Map which includes, delivery, review and adoption of new Digital Flood Insurance Rate Maps (DFRIMS).
◊ Notifying apprpriate officials of meetings through correspondence.
◊ Performing follow-up actions as required.
◊ Facilitating the DFIRMS adoption process by the community.
◊ Coordinating and scheduling “Discovery” and any other followup meetings with local com-munities.
◊ Procuring training site locations.
◊ Providing floodplain review letter for request received
Bureau Director, Mitigation Plans
The Bureau Director, Mitigation Plans, formulates, controls, and directs the Mitigation Planning Bu-reau’s operations in regard and in compliance with mandates by the Federal Emergency Management Agency. These duties include the following:
◊ Supervising the activities of the Planning Bureau Staff in performing specific functions and duties.
◊ Performing a variety of administrative tasks consisting of fiscal management, strategic planning, legal compliance, and required reports.
◊ Serving as liaison to various government agencies, other public/private agencies, and/or the general public in matters related to hazard mitigation planning.

Sect. 6 : 440
Mississippi Emergency Management Agency
◊ Coordinating plans and budgets with other Bureau Directors to ensure that they meet the stated goals of the office and the agency.
◊ Coordinating with FEMA on any necessary training requirements and/or providing techni-cal assistance for the local communities concerning mitigation planning.
◊ Submitting reports to the Office of Mitigation in reference to any accomplishments and/or any deviations from bureau-stated goals.
◊ Coordinating with the Director of the Office of Mitigation and the Bureau Director of Grants Management to establish a budget for the state hazard mitigation plan.
◊ Using FEMA mandated guidelines, develop the state hazard mitigation plan.
◊ Overseeing the development of the state hazard mitigation plan.
Mitigation Planner
The Mitigation Planner assists the Bureau Director in formulating and controlling the Mitigation Planning Bureau’s operations in regard and in compliance with mandates by the Federal Emergency Manage-ment Agency. In addition, the Mitigation Planner’s duties include the following tasks:
◊ Performing specific functions and duties including a variety of administrative tasks consist-ing of strategic planning, legal compliance, and required reports.
◊ Serving as liaison to various government agencies, other public/private agencies, and/or the general public in matters related to hazard mitigation planning.
◊ Reviewing plans and assisting local communities, consultants and other state agencies to ensure that developed plans meet or exceed FEMA standards.
◊ Reviewing and monitoring plan updates.
◊ Coordinating with FEMA on any necessary training requirements and/or providing techni-cal assistance for local communities concerning mitigation planning.
◊ Submitting reports to the Office of Mitigation in reference to any accomplishments and/or any deviations from bureau-stated goals.
◊ Using FEMA mandated guidelines, assisting the Bureau Director with development and update of the state hazard mitigation plan.
◊ Overseeing and procuring training sites and venues.
◊ Facilitating mitigation planning training with local officials and state agencies. Coordinating administrative requirements for workshops and training seminars.
◊ Attending conferences to furnish various audiences with programmatic advice and assist-ing with planning matters.
◊ Enhancing public understanding of mitigation planning programs through presentations.
Mississippi Emergency Management Agency
Sect. 6 : 441
Administrative Assistant
The Administrative Assistant performs skilled clerical work and provides secretarial services for mitiga-tion staff. This work involves making independent decisions concerning the procedure or process to be followed and the actions to be taken. Examples of tasks performed include, but are not limited to:
◊ Supervising and participating in the receipt and processing of correspondence; preparing, coding and typing of personnel, purchasing, supply, financial, and other documents; and the checking and posting of program transactions.
◊ Organizing work and coordinating workflow; establishing priorities, setting deadlines and reviewing work for adequacy, accuracy, timeliness, and conformance with instructions and standard practices.
◊ Receiving visitors and answering calls, ascertaining the purpose of calls and visits, and furnishing information from knowledge of agency policies, rules and procedures.
◊ Performing a variety of supportive secretarial duties for administrative staff.
An up-to-date copy of the plan will reside within the Mississippi Emergency Management Agency web site, on a home page devoted to Hazard Mitigation and Emergency Preparedness. Annual and biennial status memorandums will also be posted there.
A copy of the Plan will be publicized and available for review at the Mississippi Emergency Management Agency offices and additional copies of the plan will be catalogued and made available at pertinent State Agencies. The existence and locations of these copies will also be posted on the Mississippi Emergency Management Agency web site. The site will contain contact information for members of the Hazard Mitiga-tion Council to which the public may direct comments and concerns. All public feedback will be forwarded to the appropriate institution for review.
In addition to these activities, many of the educational and outreach activities will support continued public involvement in the Plan implementation process.
Sect. 6 : 442
Mississippi Emergency Management Agency
This page intentionally left blank
Related Documents