1 Drafting Authors: Ottmar Edenhofer (Germany), Ramón Pichs-Madruga (Cuba), Youba Sokona (Mali), Shardul Agrawala (France), Igor Alexeyevich Bashmakov (Russia), Gabriel Blanco (Argentina), John Broome (UK), Thomas Bruckner (Germany), Steffen Brunner (Germany), Mercedes Bustamante (Brazil), Leon Clarke (USA), Felix Creutzig (Germany), Shobhakar Dhakal (Nepal / Thailand), Navroz K. Dubash (India), Patrick Eickemeier (Germany), Ellie Farahani (Canada), Manfred Fischedick (Germany), Marc Fleurbaey (France), Reyer Gerlagh (Netherlands), Luis Gómez-Echeverri (Colombia / Austria), Sujata Gupta (India / Philippines), Jochen Harnisch (Germany), Kejun Jiang (China), Susanne Kadner (Germany), Sivan Kartha (USA), Stephan Klasen (Germany), Charles Kolstad (USA), Volker Krey (Austria / Germany), Howard Kunreuther (USA), Oswaldo Lucon (Brazil), Omar Masera (México), Jan Minx (Germany), Yacob Mulugetta (Ethiopia / UK), Anthony Patt (Austria / Switzerland), Nijavalli H. Ravindranath (India), Keywan Riahi (Austria), Joyashree Roy (India), Roberto Schaeffer (Brazil), Steffen Schlömer (Germany), Karen Seto (USA), Kristin Seyboth (USA), Ralph Sims (New Zealand), Jim Skea (UK), Pete Smith (UK), Eswaran Somanathan (India), Robert Stavins (USA), Christoph von Stechow (Germany), Thomas Sterner (Sweden), Taishi Sugiyama (Japan), Sangwon Suh (Republic of Korea / USA), Kevin Chika Urama (Nigeria / UK / Kenya), Diana Ürge-Vorsatz (Hungary), David G. Victor (USA), Dadi Zhou (China), Ji Zou (China), Timm Zwickel (Germany) Draft Contributing Authors Giovanni Baiocchi (UK / Italy), Helena Chum (Brazil / USA), Jan Fuglestvedt (Norway), Helmut Haberl (Austria), Edgar Hertwich (Austria / Norway), Elmar Kriegler (Germany), Joeri Rogelj (Switzerland / Belgium), H.-Holger Rogner (Germany), Michiel Schaeffer (Netherlands), Steven J. Smith (USA), Detlef van Vuuren (Netherlands), Ryan Wiser (USA) This Summary for Policymakers should be cited as: IPCC, 2014: Summary for Policymakers. In: Climate Change 2014: Mitigation of Climate Change. Contribution of Work- ing Group III to the Fifth Assessment Report of the Intergovernmental Panel on Climate Change [Edenhofer, O., R. Pichs-Madruga, Y. Sokona, E. Farahani, S. Kadner, K. Seyboth, A. Adler, I. Baum, S. Brunner, P. Eickemeier, B. Kriemann, J. Savolainen, S. Schlömer, C. von Stechow, T. Zwickel and J.C. Minx (eds.)]. Cambridge University Press, Cambridge, United Kingdom and New York, NY, USA. Summary for Policymakers SPM Cambridge University Press 978-1-107-05821-7 - Climate Change 2014 Mitigation of Climate Change: Working Group III Contribution to the Fifth Assessment Report of the Intergovernmental Panel on Climate Change Edited by Ottmar Edenhofer, Ramón Pichs-Madruga, Youba Sokona, Jan C. Minx, Ellie Farahani, Susanne Kadner, Kristin Seyboth, Anna Adler, Ina Baum, Steffen Brunner, Patrick Eickemeier, Benjamin Kriemann, Jussi Savolainen, Steffen Schlömer, Christoph von Stechow and Timm Zwickel Excerpt More information www.cambridge.org © in this web service Cambridge University Press

Welcome message from author
This document is posted to help you gain knowledge. Please leave a comment to let me know what you think about it! Share it to your friends and learn new things together.
Transcript
1
Drafting Authors: Ottmar Edenhofer (Germany), Ramón Pichs-Madruga (Cuba), Youba Sokona (Mali), Shardul Agrawala (France), Igor Alexeyevich Bashmakov (Russia), Gabriel Blanco (Argentina), John Broome (UK), Thomas Bruckner (Germany), Steffen Brunner (Germany), Mercedes Bustamante (Brazil), Leon Clarke (USA), Felix Creutzig (Germany), Shobhakar Dhakal (Nepal / Thailand), Navroz K. Dubash (India), Patrick Eickemeier (Germany), Ellie Farahani (Canada), Manfred Fischedick (Germany), Marc Fleurbaey (France), Reyer Gerlagh (Netherlands), Luis Gómez-Echeverri (Colombia / Austria), Sujata Gupta (India / Philippines), Jochen Harnisch (Germany), Kejun Jiang (China), Susanne Kadner (Germany), Sivan Kartha (USA), Stephan Klasen (Germany), Charles Kolstad (USA), Volker Krey (Austria / Germany), Howard Kunreuther (USA), Oswaldo Lucon (Brazil), Omar Masera (México), Jan Minx (Germany), Yacob Mulugetta (Ethiopia / UK), Anthony Patt (Austria / Switzerland), Nijavalli H. Ravindranath (India), Keywan Riahi (Austria), Joyashree Roy (India), Roberto Schaeffer (Brazil), Steffen Schlömer (Germany), Karen Seto (USA), Kristin Seyboth (USA), Ralph Sims (New Zealand), Jim Skea (UK), Pete Smith (UK), Eswaran Somanathan (India), Robert Stavins (USA), Christoph von Stechow (Germany), Thomas Sterner (Sweden), Taishi Sugiyama (Japan), Sangwon Suh (Republic of Korea / USA), Kevin Chika Urama (Nigeria / UK / Kenya), Diana Ürge-Vorsatz (Hungary), David G. Victor (USA), Dadi Zhou (China), Ji Zou (China), Timm Zwickel (Germany)
Draft Contributing AuthorsGiovanni Baiocchi (UK / Italy), Helena Chum (Brazil / USA), Jan Fuglestvedt (Norway), Helmut Haberl (Austria), Edgar Hertwich (Austria / Norway), Elmar Kriegler (Germany), Joeri Rogelj (Switzerland / Belgium), H.-Holger Rogner (Germany), Michiel Schaeffer (Netherlands), Steven J. Smith (USA), Detlef van Vuuren (Netherlands), Ryan Wiser (USA)
This Summary for Policymakers should be cited as:
IPCC, 2014: Summary for Policymakers. In: Climate Change 2014: Mitigation of Climate Change. Contribution of Work-ing Group III to the Fifth Assessment Report of the Intergovernmental Panel on Climate Change [Edenhofer, O., R. Pichs-Madruga, Y. Sokona, E. Farahani, S. Kadner, K. Seyboth, A. Adler, I. Baum, S. Brunner, P. Eickemeier, B. Kriemann, J. Savolainen, S. Schlömer, C. von Stechow, T. Zwickel and J.C. Minx (eds.)]. Cambridge University Press, Cambridge, United Kingdom and New York, NY, USA.
Summaryfor PolicymakersSPM
Cambridge University Press978-1-107-05821-7 - Climate Change 2014 Mitigation of Climate Change: Working Group III Contribution to theFifth Assessment Report of the Intergovernmental Panel on Climate ChangeEdited by Ottmar Edenhofer, Ramón Pichs-Madruga, Youba Sokona, Jan C. Minx, Ellie Farahani, Susanne Kadner, Kristin Seyboth,Anna Adler, Ina Baum, Steffen Brunner, Patrick Eickemeier, Benjamin Kriemann, Jussi Savolainen, Steffen Schlömer, Christoph von Stechow and Timm Zwickel ExcerptMore information
www.cambridge.org© in this web service Cambridge University Press
3
SPM
Summary for Policymakers
SPMSPM
Table of Contents
SPM.1 Introduction . . . . . . . . . . . . . . . . . . . . . . . . . . . . . . . . . . . . . . . . . . . . . . . . . . . . . . . . . . . . . . . . . . . . . . . . . . . . . . . . . . . . . . . . . . . . . . . . . . . . . . . . . . . . . . 4
SPM.2 Approaches to climate change mitigation . . . . . . . . . . . . . . . . . . . . . . . . . . . . . . . . . . . . . . . . . . . . . . . . . . . . . . . . . . . . . . . . . . . . . . 4
SPM.3 Trends in stocks and fl ows of greenhouse gases and their drivers . . . . . . . . . . . . . . . . . . . . . . . . . . . . . . . . . . . . . . 6
SPM.4 Mitigation pathways and measures in the context of sustainable development . . . . . . . . . . . . . . . . . .10
SPM.4.1 Long-term mitigation pathways . . . . . . . . . . . . . . . . . . . . . . . . . . . . . . . . . . . . . . . . . . . . . . . . . . . . . . . . . . . . . . . . . . . . . . . . . . . . . .10
SPM.4.2 Sectoral and cross-sectoral mitigation pathways and measures . . . . . . . . . . . . . . . . . . . . . . . . . . . . . . . . . . . . . . . . . . . .17
SPM.4.2.1 Cross-sectoral mitigation pathways and measures . . . . . . . . . . . . . . . . . . . . . . . . . . . . . . . . . . . . . . . . . . .17
SPM.4.2.2 Energy supply . . . . . . . . . . . . . . . . . . . . . . . . . . . . . . . . . . . . . . . . . . . . . . . . . . . . . . . . . . . . . . . . . . . . . . . . . . . . . . . . . .20
SPM.4.2.3 Energy end-use sectors . . . . . . . . . . . . . . . . . . . . . . . . . . . . . . . . . . . . . . . . . . . . . . . . . . . . . . . . . . . . . . . . . . . . . . . .21
SPM.4.2.4 Agriculture, Forestry and Other Land Use (AFOLU) . . . . . . . . . . . . . . . . . . . . . . . . . . . . . . . . . . . . . . . . . . .24
SPM.4.2.5 Human settlements, infrastructure and spatial planning . . . . . . . . . . . . . . . . . . . . . . . . . . . . . . . . . . . . .25
SPM.5 Mitigation policies and institutions . . . . . . . . . . . . . . . . . . . . . . . . . . . . . . . . . . . . . . . . . . . . . . . . . . . . . . . . . . . . . . . . . . . . . . . . . . . . .26
SPM.5.2.1 Sectoral and national policies . . . . . . . . . . . . . . . . . . . . . . . . . . . . . . . . . . . . . . . . . . . . . . . . . . . . . . . . . . . . . . . . .26
SPM.5.2.2 International cooperation . . . . . . . . . . . . . . . . . . . . . . . . . . . . . . . . . . . . . . . . . . . . . . . . . . . . . . . . . . . . . . . . . . . . .30
Cambridge University Press978-1-107-05821-7 - Climate Change 2014 Mitigation of Climate Change: Working Group III Contribution to theFifth Assessment Report of the Intergovernmental Panel on Climate ChangeEdited by Ottmar Edenhofer, Ramón Pichs-Madruga, Youba Sokona, Jan C. Minx, Ellie Farahani, Susanne Kadner, Kristin Seyboth,Anna Adler, Ina Baum, Steffen Brunner, Patrick Eickemeier, Benjamin Kriemann, Jussi Savolainen, Steffen Schlömer, Christoph von Stechow and Timm Zwickel ExcerptMore information
www.cambridge.org© in this web service Cambridge University Press

4
SPM
Summary for PolicymakersSummary for Policymakers
SPM
Introduction
The Working Group III contribution to the IPCC’s Fifth Assessment Report (AR5) assesses literature on the scientifi c, technological, environmental, economic and social aspects of mitigation of climate change. It builds upon the Working Group III contribution to the IPCC’s Fourth Assessment Report (AR4), the Special Report on Renewable Energy Sources and Climate Change Mitigation (SRREN) and previous reports and incorporates subsequent new fi ndings and research. The report also assesses mitigation options at different levels of governance and in different economic sectors, and the societal implications of different mitigation policies, but does not recommend any particular option for mitigation.
This Summary for Policymakers (SPM) follows the structure of the Working Group III report. The narrative is supported by a series of highlighted conclusions which, taken together, provide a concise summary. The basis for the SPM can be found in the chapter sections of the underlying report and in the Technical Summary (TS). References to these are given in square brackets.
The degree of certainty in fi ndings in this assessment, as in the reports of all three Working Groups, is based on the author teams’ evaluations of underlying scientifi c understanding and is expressed as a qualitative level of confi dence (from very low to very high) and, when possible, probabilistically with a quantifi ed likelihood (from exceptionally unlikely to virtually certain). Confi dence in the validity of a fi nding is based on the type, amount, quality, and consistency of evidence (e. g., data, mechanistic understanding, theory, models, expert judgment) and the degree of agreement.1 Probabilistic estimates of quantifi ed measures of uncertainty in a fi nding are based on statistical analysis of observations or model results, or both, and expert judgment.2 Where appropriate, fi ndings are also formulated as statements of fact without using uncertainty qualifi ers. Within paragraphs of this summary, the confi dence, evidence, and agreement terms given for a bolded fi nding apply to subsequent statements in the paragraph, unless additional terms are provided.
Approaches to climate change mitigation
Mitigation is a human intervention to reduce the sources or enhance the sinks of greenhouse gases. Mitiga-tion, together with adaptation to climate change, contributes to the objective expressed in Article 2 of the United Nations Framework Convention on Climate Change (UNFCCC):
The ultimate objective of this Convention and any related legal instruments that the Conference of the Parties may adopt is to achieve, in accordance with the relevant provisions of the Convention, stabilization of greenhouse gas concentrations in the atmosphere at a level that would prevent dangerous anthropogenic interference with the climate system. Such a level should be achieved within a time frame suffi cient to allow ecosystems to adapt natu-rally to climate change, to ensure that food production is not threatened and to enable economic development to proceed in a sustainable manner.
Climate policies can be informed by the fi ndings of science, and systematic methods from other disciplines. [1.2, 2.4, 2.5, Box 3.1]
1 The following summary terms are used to describe the available evidence: limited, medium, or robust; and for the degree of agreement: low, medium, or high. A level of confi dence is expressed using fi ve qualifi ers: very low, low, medium, high, and very high, and typeset in italics, e. g., medium confi dence. For a given evidence and agreement statement, different confi dence levels can be assigned, but increasing levels of evidence and degrees of agreement are correlated with increasing confi dence. For more details, please refer to the guidance note for Lead Authors of the IPCC Fifth Assessment Report on consistent treatment of uncertainties.
2 The following terms have been used to indicate the assessed likelihood of an outcome or a result: virtually certain 99 – 100 % probability, very likely 90 – 100 %, likely 66 – 100 %, about as likely as not 33 – 66 %, unlikely 0 – 33 %, very unlikely 0 – 10 %, exceptionally unlikely 0 – 1 %. Addi-tional terms (more likely than not > 50 – 100 %, and more unlikely than likely 0 – < 50 %) may also be used when appropriate. Assessed likelihood is typeset in italics, e. g., very likely.
SPM.1
SPM.2
Cambridge University Press978-1-107-05821-7 - Climate Change 2014 Mitigation of Climate Change: Working Group III Contribution to theFifth Assessment Report of the Intergovernmental Panel on Climate ChangeEdited by Ottmar Edenhofer, Ramón Pichs-Madruga, Youba Sokona, Jan C. Minx, Ellie Farahani, Susanne Kadner, Kristin Seyboth,Anna Adler, Ina Baum, Steffen Brunner, Patrick Eickemeier, Benjamin Kriemann, Jussi Savolainen, Steffen Schlömer, Christoph von Stechow and Timm Zwickel ExcerptMore information
www.cambridge.org© in this web service Cambridge University Press
5
SPM
Summary for Policymakers
Sustainable development and equity provide a basis for assessing climate policies and highlight the need for addressing the risks of climate change.3 Limiting the effects of climate change is necessary to achieve sustainable development and equity, including poverty eradication. At the same time, some mitigation efforts could undermine action on the right to promote sustainable development, and on the achievement of poverty eradication and equity. Conse-quently, a comprehensive assessment of climate policies involves going beyond a focus on mitigation and adaptation policies alone to examine development pathways more broadly, along with their determinants. [4.2, 4.3, 4.4, 4.5, 4.6, 4.8]
Effective mitigation will not be achieved if individual agents advance their own interests independently. Climate change has the characteristics of a collective action problem at the global scale, because most greenhouse gases (GHGs) accumulate over time and mix globally, and emissions by any agent (e. g., individual, community, company, country) affect other agents.4 International cooperation is therefore required to effectively mitigate GHG emissions and address other climate change issues [1.2.4, 2.6.4, 3.2, 4.2, 13.2, 13.3]. Furthermore, research and development in support of mitigation creates knowledge spillovers. International cooperation can play a constructive role in the development, dif-fusion and transfer of knowledge and environmentally sound technologies [1.4.4, 3.11.6, 11.8, 13.9, 14.4.3].
Issues of equity, justice, and fairness arise with respect to mitigation and adaptation.5 Countries’ past and future contributions to the accumulation of GHGs in the atmosphere are different, and countries also face varying chal-lenges and circumstances, and have different capacities to address mitigation and adaptation. The evidence suggests that outcomes seen as equitable can lead to more effective cooperation. [3.10, 4.2.2, 4.6.2]
Many areas of climate policy-making involve value judgements and ethical considerations. These areas range from the question of how much mitigation is needed to prevent dangerous interference with the climate system to choices among specifi c policies for mitigation or adaptation [3.1, 3.2]. Social, economic and ethical analyses may be used to inform value judgements and may take into account values of various sorts, including human wellbeing, cultural values and non-human values [3.4, 3.10].
Among other methods, economic evaluation is commonly used to inform climate policy design. Practical tools for economic assessment include cost-benefi t analysis, cost-effectiveness analysis, multi-criteria analysis and expected utility theory [2.5]. The limitations of these tools are well-documented [3.5]. Ethical theories based on social welfare functions imply that distributional weights, which take account of the different value of money to different people, should be applied to monetary measures of benefi ts and harms [3.6.1, Box TS.2]. Whereas distributional weighting has not frequently been applied for comparing the effects of climate policies on different people at a single time, it is standard practice, in the form of discounting, for comparing the effects at different times [3.6.2].
Climate policy intersects with other societal goals creating the possibility of co-benefi ts or adverse side-effects. These intersections, if well-managed, can strengthen the basis for undertaking climate action. Mitiga-tion and adaptation can positively or negatively infl uence the achievement of other societal goals, such as those related to human health, food security, biodiversity, local environmental quality, energy access, livelihoods, and equitable sus-tainable development; and vice versa, policies toward other societal goals can infl uence the achievement of mitigation and adaptation objectives [4.2, 4.3, 4.4, 4.5, 4.6, 4.8]. These infl uences can be substantial, although sometimes diffi cult to quantify, especially in welfare terms [3.6.3]. This multi-objective perspective is important in part because it helps to identify areas where support for policies that advance multiple goals will be robust [1.2.1, 4.2, 4.8, 6.6.1].
3 See WGII AR5 SPM.4 In the social sciences this is referred to as a ‘global commons problem‘. As this expression is used in the social sciences, it has no specifi c implica-
tions for legal arrangements or for particular criteria regarding effort-sharing.5 See FAQ 3.2 for clarifi cation of these concepts. The philosophical literature on justice and other literature can illuminate these issues [3.2, 3.3, 4.6.2].
SPM
Cambridge University Press978-1-107-05821-7 - Climate Change 2014 Mitigation of Climate Change: Working Group III Contribution to theFifth Assessment Report of the Intergovernmental Panel on Climate ChangeEdited by Ottmar Edenhofer, Ramón Pichs-Madruga, Youba Sokona, Jan C. Minx, Ellie Farahani, Susanne Kadner, Kristin Seyboth,Anna Adler, Ina Baum, Steffen Brunner, Patrick Eickemeier, Benjamin Kriemann, Jussi Savolainen, Steffen Schlömer, Christoph von Stechow and Timm Zwickel ExcerptMore information
www.cambridge.org© in this web service Cambridge University Press
6
SPM
Summary for Policymakers
Climate policy may be informed by a consideration of a diverse array of risks and uncertainties, some of which are diffi cult to measure, notably events that are of low probability but which would have a signifi cant impact if they occur. Since AR4, the scientifi c literature has examined risks related to climate change, adaptation, and mitigation strategies. Accurately estimating the benefi ts of mitigation takes into account the full range of possible impacts of climate change, including those with high consequences but a low probability of occurrence. The benefi ts of mitigation may otherwise be underestimated (high confi dence) [2.5, 2.6, Box 3.9]. The choice of mitigation actions is also infl uenced by uncertainties in many socio-economic variables, including the rate of economic growth and the evolution of technology (high confi dence) [2.6, 6.3].
The design of climate policy is infl uenced by how individuals and organizations perceive risks and uncertain-ties and take them into account. People often utilize simplifi ed decision rules such as a preference for the status quo. Individuals and organizations differ in their degree of risk aversion and the relative importance placed on near-term versus long-term ramifi cations of specifi c actions [2.4]. With the help of formal methods, policy design can be improved by taking into account risks and uncertainties in natural, socio-economic, and technological systems as well as decision processes, perceptions, values and wealth [2.5].
Trends in stocks and fl ows of greenhouse gases
and their drivers
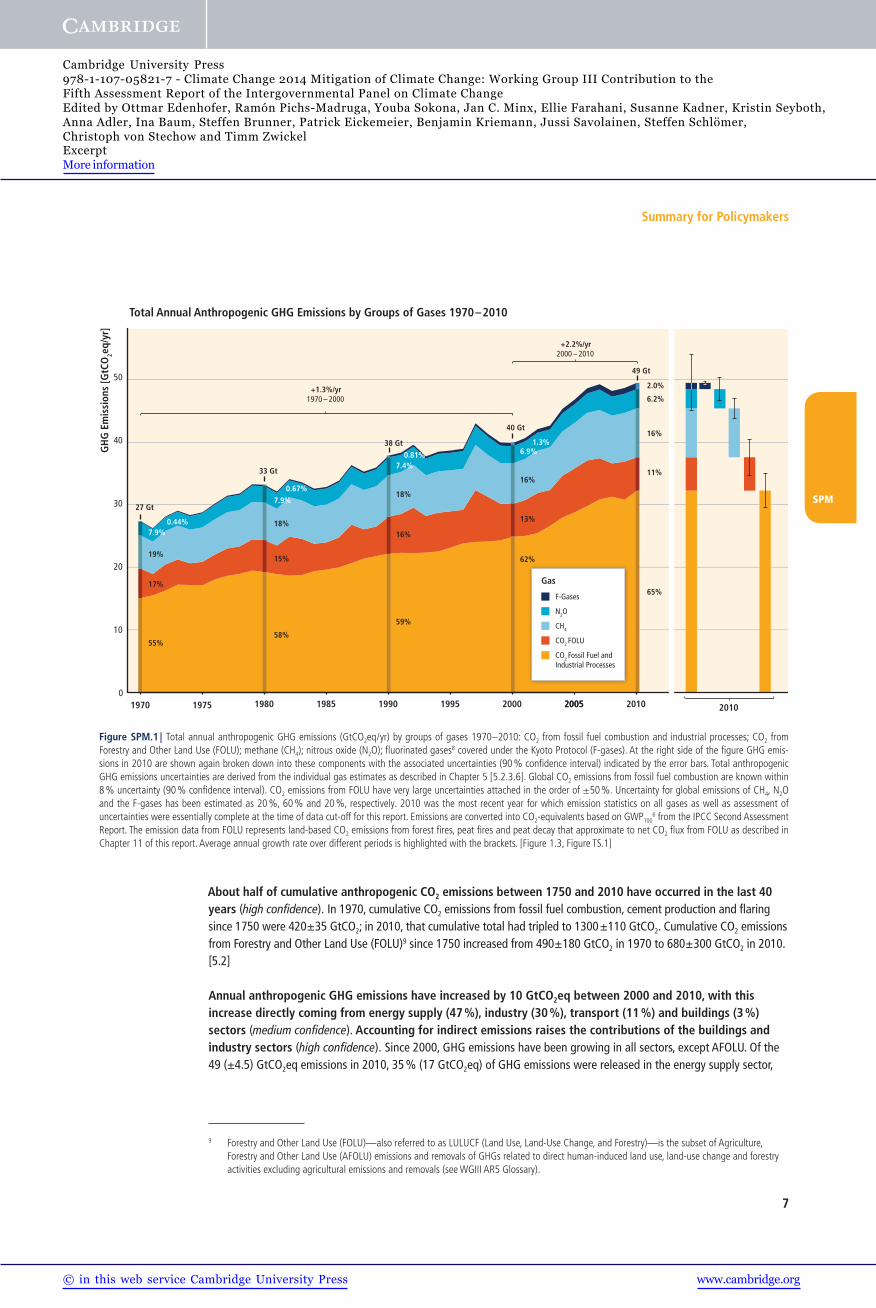
Total anthropogenic GHG emissions have continued to increase over 1970 to 2010 with larger absolute decadal increases toward the end of this period (high confi dence). Despite a growing number of climate change mitigation poli-cies, annual GHG emissions grew on average by 1.0 gigatonne carbon dioxide equivalent (GtCO2eq) (2.2 %) per year from 2000 to 2010 compared to 0.4 GtCO2eq (1.3 %) per year from 1970 to 2000 (Figure SPM.1).6,7 Total anthropogenic GHG emissions were the highest in human history from 2000 to 2010 and reached 49 (±4.5) GtCO2eq / yr in 2010. The global economic crisis 2007 / 2008 only temporarily reduced emissions. [1.3, 5.2, 13.3, 15.2.2, Box TS.5, Figure 15.1]
CO2 emissions from fossil fuel combustion and industrial processes contributed about 78 % of the total GHG emission increase from 1970 to 2010, with a similar percentage contribution for the period 2000 – 2010 (high confi dence). Fossil fuel-related CO2 emissions reached 32 (±2.7) GtCO2 / yr, in 2010, and grew further by about 3 % between 2010 and 2011 and by about 1 – 2 % between 2011 and 2012. Of the 49 (±4.5) GtCO2eq / yr in total anthropogenic GHG emissions in 2010, CO2 remains the major anthropogenic GHG accounting for 76 % (38 ± 3.8 GtCO2eq / yr) of total anthropogenic GHG emissions in 2010. 16 % (7.8 ± 1.6 GtCO2eq / yr) come from methane (CH4), 6.2 % (3.1 ± 1.9 GtCO2eq / yr) from nitrous oxide (N2O), and 2.0 % (1.0 ± 0.2 GtCO2eq / yr) from fl uorinated gases ( Figure SPM.1). Annually, since 1970, about 25 % of anthropogenic GHG emissions have been in the form of non-CO2 gases.8 [1.2, 5.2]
6 Throughout the SPM, emissions of GHGs are weighed by Global Warming Potentials with a 100-year time horizon (GWP100) from the IPCC Second Assessment Report. All metrics have limitations and uncertainties in assessing consequences of different emissions. [3.9.6, Box TS.5, Annex II.9, WGI SPM]
7 In this SPM, uncertainty in historic GHG emission data is reported using 90 % uncertainty intervals unless otherwise stated. GHG emission levels are rounded to two signifi cant digits throughout this document; as a consequence, small differences in sums due to rounding may occur.
8 In this report, data on non-CO2 GHGs, including fl uorinated gases, are taken from the EDGAR database (Annex II.9), which covers substances included in the Kyoto Protocol in its fi rst commitment period.
SPM.3
Cambridge University Press978-1-107-05821-7 - Climate Change 2014 Mitigation of Climate Change: Working Group III Contribution to theFifth Assessment Report of the Intergovernmental Panel on Climate ChangeEdited by Ottmar Edenhofer, Ramón Pichs-Madruga, Youba Sokona, Jan C. Minx, Ellie Farahani, Susanne Kadner, Kristin Seyboth,Anna Adler, Ina Baum, Steffen Brunner, Patrick Eickemeier, Benjamin Kriemann, Jussi Savolainen, Steffen Schlömer, Christoph von Stechow and Timm Zwickel ExcerptMore information
www.cambridge.org© in this web service Cambridge University Press
7
SPM
Summary for Policymakers
About half of cumulative anthropogenic CO2 emissions between 1750 and 2010 have occurred in the last 40 years (high confi dence). In 1970, cumulative CO2 emissions from fossil fuel combustion, cement production and fl aring since 1750 were 420 ± 35 GtCO2; in 2010, that cumulative total had tripled to 1300 ± 110 GtCO2. Cumulative CO2 emissions from Forestry and Other Land Use (FOLU)9 since 1750 increased from 490 ± 180 GtCO2 in 1970 to 680 ± 300 GtCO2 in 2010. [5.2]
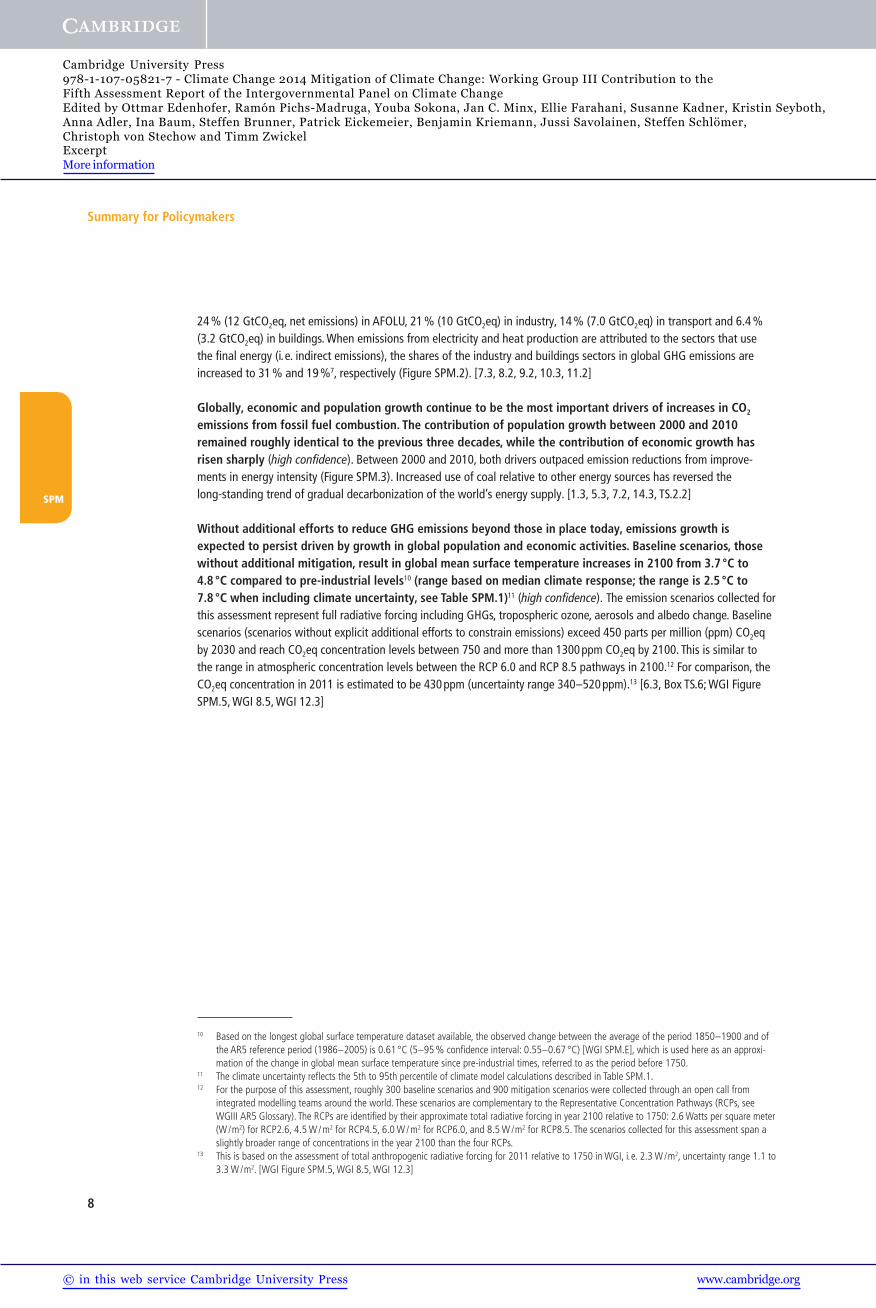
Annual anthropogenic GHG emissions have increased by 10 GtCO2eq between 2000 and 2010, with this increase directly coming from energy supply (47 %), industry (30 %), transport (11 %) and buildings (3 %) sectors (medium confi dence). Accounting for indirect emissions raises the contributions of the buildings and industry sectors (high confi dence). Since 2000, GHG emissions have been growing in all sectors, except AFOLU. Of the 49 (±4.5) GtCO2eq emissions in 2010, 35 % (17 GtCO2eq) of GHG emissions were released in the energy supply sector,
9 Forestry and Other Land Use (FOLU)—also referred to as LULUCF (Land Use, Land-Use Change, and Forestry)—is the subset of Agriculture, Forestry and Other Land Use (AFOLU) emissions and removals of GHGs related to direct human-induced land use, land-use change and forestry activities excluding agricultural emissions and removals (see WGIII AR5 Glossary).
Figure SPM.1 | Total annual anthropogenic GHG emissions (GtCO2eq / yr) by groups of gases 1970 – 2010: CO2 from fossil fuel combustion and industrial processes; CO2 from Forestry and Other Land Use (FOLU); methane (CH4); nitrous oxide (N2O); fl uorinated gases8 covered under the Kyoto Protocol (F-gases). At the right side of the fi gure GHG emis-sions in 2010 are shown again broken down into these components with the associated uncertainties (90 % confi dence interval) indicated by the error bars. Total anthropogenic GHG emissions uncertainties are derived from the individual gas estimates as described in Chapter 5 [5.2.3.6]. Global CO2 emissions from fossil fuel combustion are known within 8 % uncertainty (90 % confi dence interval). CO2 emissions from FOLU have very large uncertainties attached in the order of ± 50 %. Uncertainty for global emissions of CH4, N2O and the F-gases has been estimated as 20 %, 60 % and 20 %, respectively. 2010 was the most recent year for which emission statistics on all gases as well as assessment of uncertainties were essentially complete at the time of data cut-off for this report. Emissions are converted into CO2-equivalents based on GWP100
6 from the IPCC Second Assessment Report. The emission data from FOLU represents land-based CO2 emissions from forest fi res, peat fi res and peat decay that approximate to net CO2 fl ux from FOLU as described in Chapter 11 of this report. Average annual growth rate over different periods is highlighted with the brackets. [Figure 1.3, Figure TS.1]
27 Gt
33 Gt
55%
17%
19%
7.9%0.44%
58%
15%
18%
7.9%0.67%
62%
13%
16%
6.9%1.3%38 Gt
40 Gt
59%
16%
18%
7.4%0.81%
49 Gt
65%
11%
16%
6.2%
2.0%
2005
Gas
CO2 Fossil Fuel and Industrial Processes
CO2 FOLU
CH4
N2O
F-Gases
GH
G E
mis
sion
s [G
tCO
2eq/
yr]
0
10
20
30
40
50
201020052000199519901985198019751970
+2.2%/yr2000 – 2010
+1.3%/yr1970 – 2000
2010
Total Annual Anthropogenic GHG Emissions by Groups of Gases 1970 – 2010
Cambridge University Press978-1-107-05821-7 - Climate Change 2014 Mitigation of Climate Change: Working Group III Contribution to theFifth Assessment Report of the Intergovernmental Panel on Climate ChangeEdited by Ottmar Edenhofer, Ramón Pichs-Madruga, Youba Sokona, Jan C. Minx, Ellie Farahani, Susanne Kadner, Kristin Seyboth,Anna Adler, Ina Baum, Steffen Brunner, Patrick Eickemeier, Benjamin Kriemann, Jussi Savolainen, Steffen Schlömer, Christoph von Stechow and Timm Zwickel ExcerptMore information
www.cambridge.org© in this web service Cambridge University Press
8
SPM
Summary for Policymakers
24 % (12 GtCO2eq, net emissions) in AFOLU, 21 % (10 GtCO2eq) in industry, 14 % (7.0 GtCO2eq) in transport and 6.4 % (3.2 GtCO2eq) in buildings. When emissions from electricity and heat production are attributed to the sectors that use the fi nal energy (i. e. indirect emissions), the shares of the industry and buildings sectors in global GHG emissions are increased to 31 % and 19 %7, respectively (Figure SPM.2). [7.3, 8.2, 9.2, 10.3, 11.2]
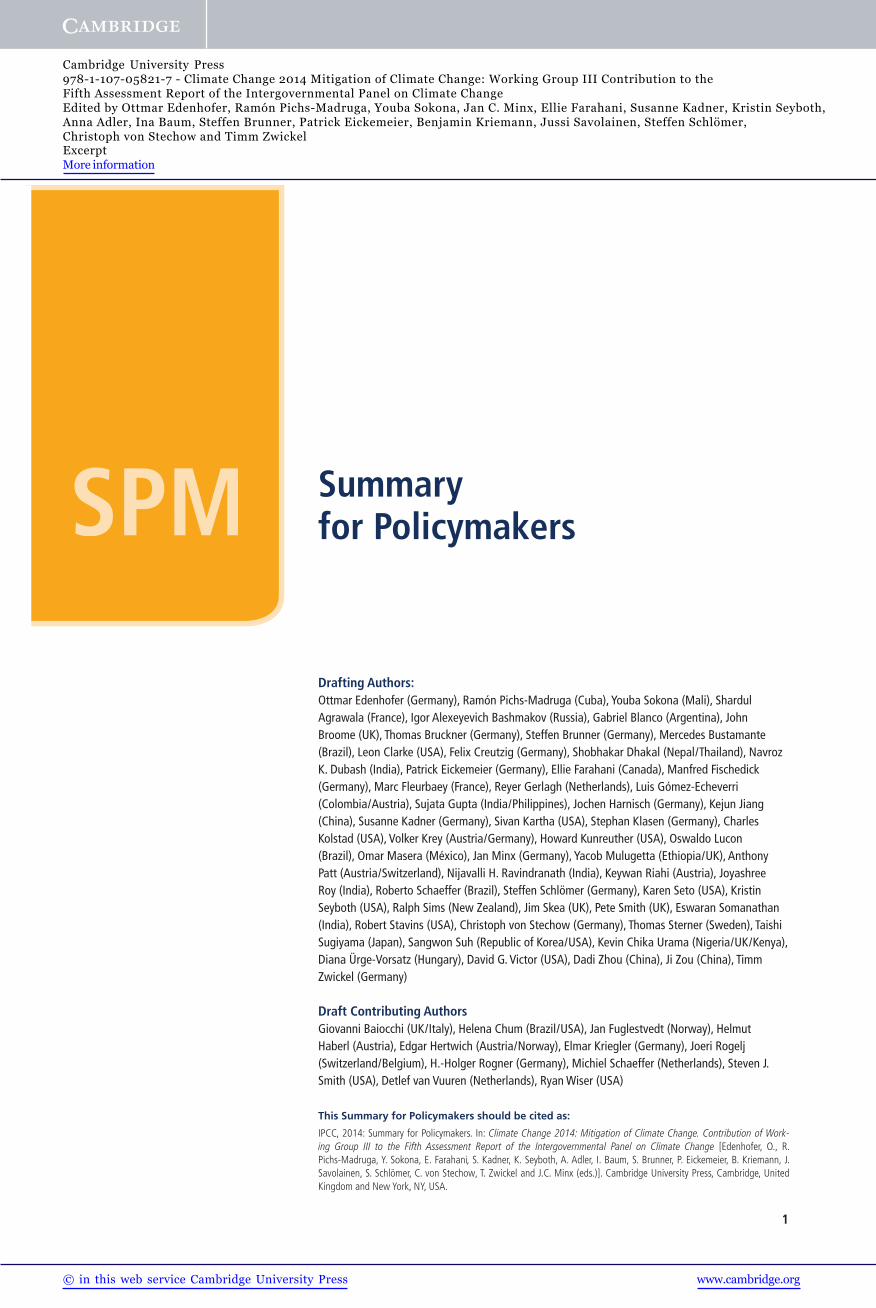
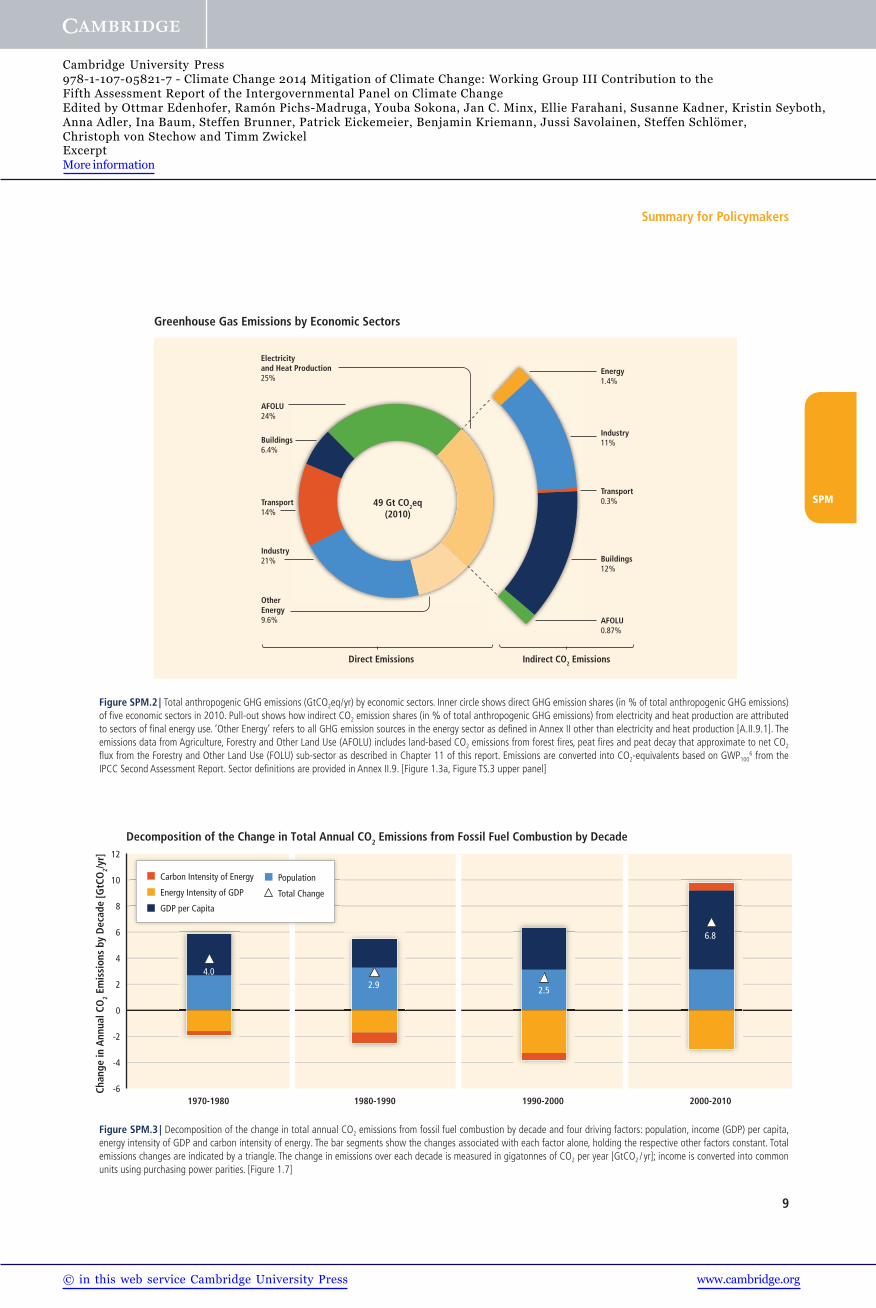
Globally, economic and population growth continue to be the most important drivers of increases in CO2 emissions from fossil fuel combustion. The contribution of population growth between 2000 and 2010 remained roughly identical to the previous three decades, while the contribution of economic growth has risen sharply (high confi dence). Between 2000 and 2010, both drivers outpaced emission reductions from improve-ments in energy intensity (Figure SPM.3). Increased use of coal relative to other energy sources has reversed the long-standing trend of gradual decarbonization of the world’s energy supply. [1.3, 5.3, 7.2, 14.3, TS.2.2]
Without additional efforts to reduce GHG emissions beyond those in place today, emissions growth is expected to persist driven by growth in global population and economic activities. Baseline scenarios, those without additional mitigation, result in global mean surface temperature increases in 2100 from 3.7 °C to 4.8 °C compared to pre-industrial levels10 (range based on median climate response; the range is 2.5 °C to 7.8 °C when including climate uncertainty, see Table SPM.1)11 (high confi dence). The emission scenarios collected for this assessment represent full radiative forcing including GHGs, tropospheric ozone, aerosols and albedo change. Baseline scenarios (scenarios without explicit additional efforts to constrain emissions) exceed 450 parts per million (ppm) CO2eq by 2030 and reach CO2eq concentration levels between 750 and more than 1300 ppm CO2eq by 2100. This is similar to the range in atmospheric concentration levels between the RCP 6.0 and RCP 8.5 pathways in 2100.12 For comparison, the CO2eq concentration in 2011 is estimated to be 430 ppm (uncertainty range 340 – 520 ppm).13 [6.3, Box TS.6; WGI Figure SPM.5, WGI 8.5, WGI 12.3]
10 Based on the longest global surface temperature dataset available, the observed change between the average of the period 1850 – 1900 and of the AR5 reference period (1986 – 2005) is 0.61 °C (5 – 95 % confi dence interval: 0.55 – 0.67 °C) [WGI SPM.E], which is used here as an approxi-mation of the change in global mean surface temperature since pre-industrial times, referred to as the period before 1750.
11 The climate uncertainty refl ects the 5th to 95th percentile of climate model calculations described in Table SPM.1.12 For the purpose of this assessment, roughly 300 baseline scenarios and 900 mitigation scenarios were collected through an open call from
integrated modelling teams around the world. These scenarios are complementary to the Representative Concentration Pathways (RCPs, see WGIII AR5 Glossary). The RCPs are identifi ed by their approximate total radiative forcing in year 2100 relative to 1750: 2.6 Watts per square meter (W / m2) for RCP2.6, 4.5 W / m2 for RCP4.5, 6.0 W / m2 for RCP6.0, and 8.5 W / m2 for RCP8.5. The scenarios collected for this assessment span a slightly broader range of concentrations in the year 2100 than the four RCPs.
13 This is based on the assessment of total anthropogenic radiative forcing for 2011 relative to 1750 in WGI, i. e. 2.3 W / m2, uncertainty range 1.1 to 3.3 W / m2. [WGI Figure SPM.5, WGI 8.5, WGI 12.3]
Cambridge University Press978-1-107-05821-7 - Climate Change 2014 Mitigation of Climate Change: Working Group III Contribution to theFifth Assessment Report of the Intergovernmental Panel on Climate ChangeEdited by Ottmar Edenhofer, Ramón Pichs-Madruga, Youba Sokona, Jan C. Minx, Ellie Farahani, Susanne Kadner, Kristin Seyboth,Anna Adler, Ina Baum, Steffen Brunner, Patrick Eickemeier, Benjamin Kriemann, Jussi Savolainen, Steffen Schlömer, Christoph von Stechow and Timm Zwickel ExcerptMore information
www.cambridge.org© in this web service Cambridge University Press
9
SPM
Summary for Policymakers
Figure SPM.2 | Total anthropogenic GHG emissions (GtCO2eq / yr) by economic sectors. Inner circle shows direct GHG emission shares (in % of total anthropogenic GHG emissions) of fi ve economic sectors in 2010. Pull-out shows how indirect CO2 emission shares (in % of total anthropogenic GHG emissions) from electricity and heat production are attributed to sectors of fi nal energy use. ‘Other Energy’ refers to all GHG emission sources in the energy sector as defi ned in Annex II other than electricity and heat production [A.II.9.1]. The emissions data from Agriculture, Forestry and Other Land Use (AFOLU) includes land-based CO2 emissions from forest fi res, peat fi res and peat decay that approximate to net CO2 fl ux from the Forestry and Other Land Use (FOLU) sub-sector as described in Chapter 11 of this report. Emissions are converted into CO2-equivalents based on GWP100
6 from the IPCC Second Assessment Report. Sector defi nitions are provided in Annex II.9. [Figure 1.3a, Figure TS.3 upper panel]
Greenhouse Gas Emissions by Economic Sectors
Indirect CO2 EmissionsDirect Emissions
Buildings6.4%
Transport14%
Industry 21%
Other Energy 9.6%
Electricity and Heat Production25%
49 Gt CO2eq(2010)
AFOLU24%
Buildings12%
Transport0.3%
Industry 11%
Energy1.4%
AFOLU0.87%
Figure SPM.3 | Decomposition of the change in total annual CO2 emissions from fossil fuel combustion by decade and four driving factors: population, income (GDP) per capita, energy intensity of GDP and carbon intensity of energy. The bar segments show the changes associated with each factor alone, holding the respective other factors constant. Total emissions changes are indicated by a triangle. The change in emissions over each decade is measured in gigatonnes of CO2 per year [GtCO2 / yr]; income is converted into common units using purchasing power parities. [Figure 1.7]
1970-1980 1980-1990 1990-2000 2000-2010-6
-4
-2
0
2
4
6
8
10
12
Chan
ge in
Ann
ual C
O2 E
mis
sion
s by
Dec
ade
[GtC
O2/y
r]
Carbon Intensity of Energy
Energy Intensity of GDP
GDP per Capita
Population
Total Change
6.8
2.52.94.0
Decomposition of the Change in Total Annual CO2 Emissions from Fossil Fuel Combustion by Decade
Cambridge University Press978-1-107-05821-7 - Climate Change 2014 Mitigation of Climate Change: Working Group III Contribution to theFifth Assessment Report of the Intergovernmental Panel on Climate ChangeEdited by Ottmar Edenhofer, Ramón Pichs-Madruga, Youba Sokona, Jan C. Minx, Ellie Farahani, Susanne Kadner, Kristin Seyboth,Anna Adler, Ina Baum, Steffen Brunner, Patrick Eickemeier, Benjamin Kriemann, Jussi Savolainen, Steffen Schlömer, Christoph von Stechow and Timm Zwickel ExcerptMore information
www.cambridge.org© in this web service Cambridge University Press
10
SPM
Summary for Policymakers
Mitigation pathways and measures in the context
of sustainable development
Long-term mitigation pathways
There are multiple scenarios with a range of technological and behavioral options, with different characteristics and implications for sustainable development, that are consistent with different levels of mitigation. For this assessment, about 900 mitigation scenarios have been collected in a database based on published integrated models.14 This range spans atmospheric concentration levels in 2100 from 430 ppm CO2eq to above 720 ppm CO2eq, which is comparable to the 2100 forcing levels between RCP 2.6 and RCP 6.0. Scenarios outside this range were also assessed including some scenarios with concentrations in 2100 below 430 ppm CO2eq (for a discussion of these scenarios see below). The mitigation scenarios involve a wide range of technological, socioeconomic, and institutional trajectories, but uncertainties and model limitations exist and developments outside this range are possible (Figure SPM.4, upper panel). [6.1, 6.2, 6.3, TS.3.1, Box TS.6]
Mitigation scenarios in which it is likely that the temperature change caused by anthropogenic GHG emis-sions can be kept to less than 2 °C relative to pre-industrial levels are characterized by atmospheric concen-trations in 2100 of about 450 ppm CO2eq (high confi dence). Mitigation scenarios reaching concentration levels of about 500 ppm CO2eq by 2100 are more likely than not to limit temperature change to less than 2 °C relative to pre-industrial levels, unless they temporarily ‘overshoot’ concentration levels of roughly 530 ppm CO2eq before 2100, in which case they are about as likely as not to achieve that goal.15 Scenarios that reach 530 to 650 ppm CO2eq concentra-tions by 2100 are more unlikely than likely to keep temperature change below 2 °C relative to pre-industrial levels. Scenarios that exceed about 650 ppm CO2eq by 2100 are unlikely to limit temperature change to below 2 °C relative to pre-industrial levels. Mitigation scenarios in which temperature increase is more likely than not to be less than 1.5 °C relative to pre-industrial levels by 2100 are characterized by concentrations in 2100 of below 430 ppm CO2eq. Tempera-ture peaks during the century and then declines in these scenarios. Probability statements regarding other levels of temperature change can be made with reference to Table SPM.1. [6.3, Box TS.6]
Scenarios reaching atmospheric concentration levels of about 450 ppm CO2eq by 2100 (consistent with a likely chance to keep temperature change below 2 °C relative to pre-industrial levels) include substantial cuts in anthropogenic GHG emissions by mid-century through large-scale changes in energy systems and poten-tially land use (high confi dence). Scenarios reaching these concentrations by 2100 are characterized by lower global GHG emissions in 2050 than in 2010, 40 % to 70 % lower globally,16 and emissions levels near zero GtCO2eq or below in
14 The long-term scenarios assessed in WGIII were generated primarily by large-scale, integrated models that project many key characteristics of mitigation pathways to mid-century and beyond. These models link many important human systems (e. g., energy, agriculture and land use, economy) with physical processes associated with climate change (e. g., the carbon cycle). The models approximate cost-effective solutions that minimize the aggregate economic costs of achieving mitigation outcomes, unless they are specifi cally constrained to behave otherwise. They are simplifi ed, stylized representations of highly-complex, real-world processes, and the scenarios they produce are based on uncertain projections about key events and drivers over often century-long timescales. Simplifi cations and differences in assumptions are the reason why output gen-erated from different models, or versions of the same model, can differ, and projections from all models can differ considerably from the reality that unfolds. [Box TS.7, 6.2]
15 Mitigation scenarios, including those reaching 2100 concentrations as high as or higher than about 550 ppm CO2eq, can temporarily ‘overshoot’ atmospheric CO2eq concentration levels before descending to lower levels later. Such concentration overshoot involves less mitigation in the near term with more rapid and deeper emissions reductions in the long run. Overshoot increases the probability of exceeding any given temperature goal. [6.3, Table SPM.1]
16 This range differs from the range provided for a similar concentration category in AR4 (50 % – 85 % lower than 2000 for CO2 only). Reasons for this difference include that this report has assessed a substantially larger number of scenarios than in AR4 and looks at all GHGs. In addition, a large proportion of the new scenarios include Carbon Dioxide Removal (CDR) technologies (see below). Other factors include the use of 2100 concentration levels instead of stabilization levels and the shift in reference year from 2000 to 2010. Scenarios with higher emissions in 2050 are characterized by a greater reliance on CDR technologies beyond mid-century.
SPM.4
SPM.4.1
Cambridge University Press978-1-107-05821-7 - Climate Change 2014 Mitigation of Climate Change: Working Group III Contribution to theFifth Assessment Report of the Intergovernmental Panel on Climate ChangeEdited by Ottmar Edenhofer, Ramón Pichs-Madruga, Youba Sokona, Jan C. Minx, Ellie Farahani, Susanne Kadner, Kristin Seyboth,Anna Adler, Ina Baum, Steffen Brunner, Patrick Eickemeier, Benjamin Kriemann, Jussi Savolainen, Steffen Schlömer, Christoph von Stechow and Timm Zwickel ExcerptMore information
www.cambridge.org© in this web service Cambridge University Press
Related Documents