LBNL-62397 Space Heaters, Computers, Cell Phone Chargers: How Plugged In Are Commercial Buildings? Marla Sanchez, Lawrence Berkeley National Laboratory Carrie Webber, Lawrence Berkeley National Laboratory Richard Brown, Lawrence Berkeley National Laboratory John Busch, Lawrence Berkeley National Laboratory Margaret Pinckard, Lawrence Berkeley National Laboratory Judy Roberson, Pacific Gas and Electric Environmental Energy Technologies Division Ernest Orlando Lawrence Berkeley National Laboratory University of California Berkeley, California 94720 February 2007 Also appears in the Proceedings of the 2006 ACEEE Summer Study on Energy Efficiency in Buildings, Less is More, En Route to Zero Energy Buildings (2006). The work described in this paper was supported by the Office of Atmospheric Programs, Climate Protection Partnerships Division of the U.S. Environmental Protection Agency and prepared for the U.S. Department of Energy - Contract No. DE-AC02-05CH11231.

Welcome message from author
This document is posted to help you gain knowledge. Please leave a comment to let me know what you think about it! Share it to your friends and learn new things together.
Transcript

LBNL-62397
Space Heaters, Computers, Cell Phone Chargers: How Plugged In Are Commercial Buildings?
Marla Sanchez, Lawrence Berkeley National Laboratory Carrie Webber, Lawrence Berkeley National Laboratory Richard Brown, Lawrence Berkeley National Laboratory
John Busch, Lawrence Berkeley National Laboratory Margaret Pinckard, Lawrence Berkeley National Laboratory
Judy Roberson, Pacific Gas and Electric
Environmental Energy Technologies Division Ernest Orlando Lawrence Berkeley National Laboratory
University of California Berkeley, California 94720
February 2007
Also appears in the Proceedings of the 2006 ACEEE Summer Study on Energy Efficiency in Buildings, Less is More, En Route to Zero Energy Buildings (2006).
The work described in this paper was supported by the Office of Atmospheric Programs, Climate Protection Partnerships Division of the U.S. Environmental Protection Agency and prepared for the U.S. Department of Energy - Contract No. DE-AC02-05CH11231.
2
DISCLAIMER
This document was prepared as an account of work sponsored by the United States Government. While this document is believed to contain correct information, neither the United States Government nor any agency thereof, nor The Regents of the University of California, nor any of their employees, makes any warranty, express or implied, or assumes any legal responsibility for the accuracy, completeness, or usefulness of any information, apparatus, product, or process disclosed, or represents that its use would not infringe privately owned rights. Reference herein to any specific commercial product, process, or service by its trade name, trademark, manufacturer, or otherwise, does not necessarily constitute or imply its endorsement, recommendation, or favoring by the United States Government or any agency thereof, or The Regents of the University of California. The views and opinions of authors expressed herein do not necessarily state or reflect those of the United States Government or any agency thereof or The Regents of the University of California.
3
ABSTRACT
Evidence of electric plug loads in commercial buildings is visible everyday: space heaters, portable fans, and the IT technician’s two monitors connected to one PC. The Energy Information Administration estimates that office and miscellaneous equipment together will consume 2.18 quads in 2006, nearly 50% of U.S. commercial electricity use. Although the importance of commercial plug loads is documented, its very nature (diverse product types, products not installed when building initially constructed, and products often hidden in closets) makes it difficult to accurately count and categorize the end use.
We audited sixteen buildings in three cities (San Francisco, Atlanta, Pittsburgh) including
office, medical and education building types1. We inventoried the number and types of office and miscellaneous electric equipment as well as estimated total energy consumption due to these product types. In total, we audited approximately 4,000 units of office equipment and 6,000 units of miscellaneous equipment and covered a diverse range of products ranging from electric pencil sharpeners with a unit energy consumption (UEC) of 1 kWh/yr to a kiln with a UEC of 7,000 kWh/yr. Our paper presents a summary of the density and type of plug load equipment found as well as the estimated total energy consumption of the equipment. Additionally, we present equipment trends observed and provide insights to how policy makers can target energy efficiency for this growing end use. Introduction
Each year, the Energy Information Administration (EIA) publishes the Annual Energy
Outlook (AEO). In the AEO 2006 commercial building summary, a couple of key figures stand out. In 2006, “other uses” of electricity consume over 1.6 Quads and office equipment consumption climbed to over 0.5 Quads. Combined, these two end-uses consume nearly half of the total electricity for commercial buildings.
While overall consumption and historic growth make these two end uses prime research targets, their very characteristics complicate robust data collection efforts. There is a large amount of variation in miscellaneous equipment across any sample of commercial buildings because it depends not just on building function but also on the types of products that employees choose to bring to work, which can be determined by work policy and/or personal preference. Miscellaneous equipment is often “out-of-sight” meaning that it is frequently located in utility or equipment closets, which allows it to be overlooked during energy audits and it is frequently unreported by building owners and energy managers either because it is dismissed as being unessential to building energy operations or because it remains an unknown factor to these key personnel. Similar to office equipment, miscellaneous equipment consumption varies heavily with individual user behavior.
The result of these factors is that even though the miscellaneous end use is the largest individual commercial electricity end use, we actually know surprisingly little about the end use itself. Our study objective was to build the foundation of a commercial plug-load equipment
1 Later we refer to just twelve buildings as we aggregated the five small office buildings into just “one”
small office.

4
database that inventoried the stock of both office equipment (OE) and miscellaneous equipment (ME) types that are found in commercial buildings. In order to better estimate consumption of commercial office equipment, this database also includes turn-off and power management rates for office equipment. Ultimately, this data can be used to estimate consumption and identify/determine ways to increase control of, and ultimately lower building electrical use. It was never our study goal to survey enough buildings to allow us to state with statistical certainty the profile of miscellaneous electricity across commercial buildings. It is our goal to generally characterize the ME and OE end use within certain building types by determining the number and types of units present. To meet our objective, we conducted a series of after-hours surveys in a total of sixteen buildings in three cities (San Francisco, Pittsburgh and Atlanta).
Methodology
To gather data on miscellaneous equipment, we conducted a series of after-hours surveys
in commercial buildings located in San Francisco, Pittsburgh and Atlanta (for a complete description, refer to Roberson 2004). We recorded the number and types of ME and OE. We also recorded the power status of ME as well as the turn-off rates and power management success rates of OE2.
Definition
ME refers to plug-load devices whose energy use is not usually accounted for by building
energy managers because they are portable, often occupant-provided units whose number, power consumption and usage patterns are largely unknown. All ME in this report, including lighting, is plug-load, as opposed to hard-wired. Our definition of ME excludes “traditional” end uses such as primary space heating/cooling, ventilation, water heating, and any hard-wired lighting or refrigeration equipment. Office equipment includes the following equipment categories and types:
• computers: desktop, laptop (notebook or mobile), server, and integrated computer system (ICS);
• monitors: cathode ray tube (CRT), and liquid crystal display (LCD); • printers: impact, inkjet, laser, thermal, solid ink, and wide format; • fax machines: inkjet, laser, and thermal; • copiers; • scanners: document, flatbed, slide, and wide format; and • multi-function devices: inkjet and laser.
Building Sample
2 We recorded the power status of ME in order to later be able to better estimate unit energy consumption for product types with multiple modes. The office equipment portion of this analysis was initiated by the US Environmental Protection Agency’s Energy Star Program and a portion of this project was aimed at estimating the success rate of power management enabling, office equipment turn-off rates and then using these inputs to estimate current consumption of commercial office equipment as well as calculate savings attained by the Energy Star office equipment program.

5
Our building types were selected based on the office equipment portion of the building audits. According to CEBCS 2002, 74% of the U.S. population of computers was found among office, education, and health care buildings; therefore, our building recruitment effort focused on these three types of buildings. This is only a subset of the total population of building types. A differently structured sample would have likely resulted in a different distribution of the number and types of ME.
In our analysis, a small office has <50 employees, a medium office has 50-500 employees, and a large office has >500 employees on site. In characterizing the size of an office, we do not consider employees working at other site locations. We also do not consider the number of employees that work outside of the audit space location. Our ‘small office’ is actually aggregated results for five small businesses in three different buildings: (1) a graphics and printing business, (2) an environmental consulting firm, (3) a commodity brokerage firm, (4) a software development firm, and (5) an engineering firm. Their number of employees ranged from 4 to 25, with a collective total of 77 employees3.
Data Collection
We conducted each survey on a weekday evening or weekend. A team of four people
participated in each survey and each survey took up to four hours to complete. Using a floor plan, clipboard, flashlight and tape measure, we systematically recorded each plug-load device. Our data collection was as unobtrusive as possible, if a workspace was occupied or obviously in use, we skipped it and returned later, if possible.
In each building, we surveyed as much area as possible in four hours or until we covered the area accessible to us, whichever came first. For each unit of ME, we recorded any information that could be used to estimate unit energy consumption. For lighting, we recorded lamp type, wattage, and fixture type. For battery chargers, we noted the portable component and whether the charger was empty or full. For vending machines, we recorded temperature, type of product vended and any product lighting information. We recorded power status of ME where applicable. For unknown equipment we noted make and model for later determination of identity and power specifications. We also noted if there was a plug-in power supply or an in-line power supply.
For each unit of OE, we recorded the make (brand) and model as it appears on the front or top of the unit. We recorded the diagonal measurement, to the nearest inch, of monitor screens, except those of laptops. In order to subsequently calculate equipment turnoff rates and power management success rates, the power state of each unit was recorded as on, low, off, or unplugged (exception: we did not record units that were unplugged if it appeared they were never used). We did not record load data. A detailed summary of our procedure for determining OE power states is found in Roberson 2004.
3 The aggregation of the small offices results in the 12 survey buildings as cited in tables (as opposed to 16
actual surveyed).

6
Results Overall Equipment Density
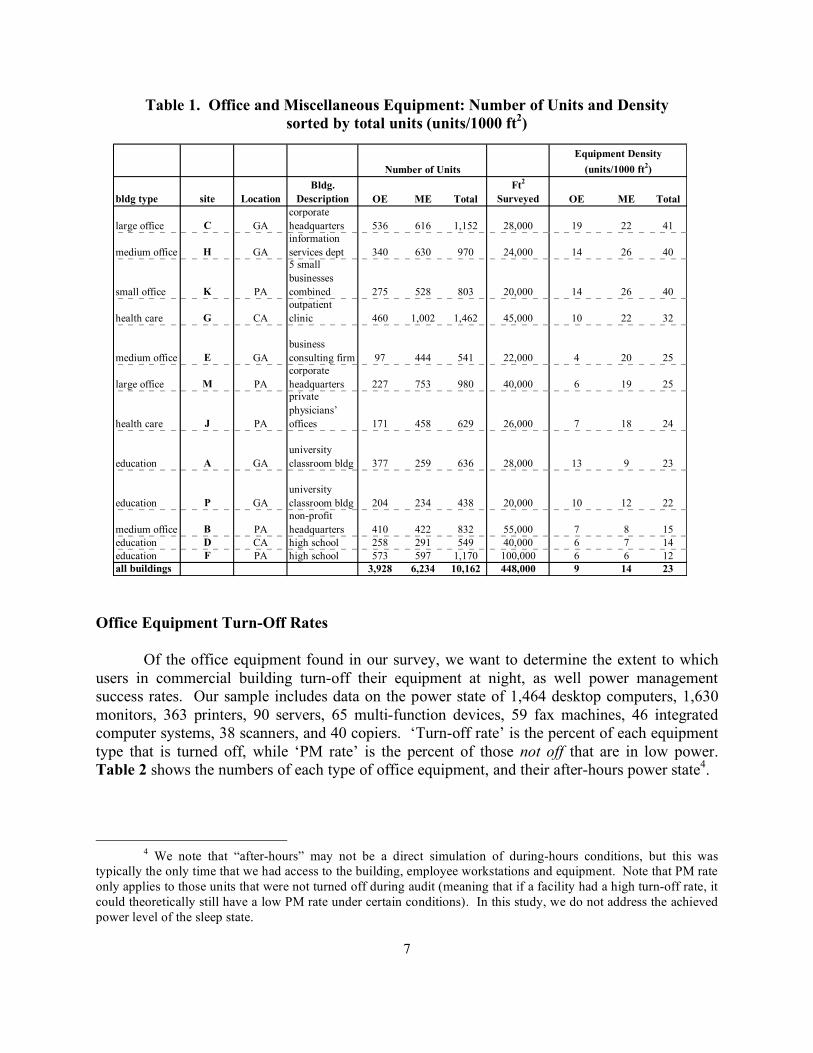
Table 1 shows a summary of the buildings in the survey as well as the number and
density of OE and ME found in each building. Our survey captured data on over 10,000 units of equipment, including almost 4,000 units of office equipment and over 6,000 units of miscellaneous equipment (note that the one small office building listed is actually an aggregate of five small office buildings surveyed).
Figure 1 shows that education buildings in our sample had the lowest equipment densities overall. Among our sample of 12 buildings, the building types with the highest densities are small and large offices. We suggest that small offices may have high equipment density because every office needs certain devices (e.g., copier, fax machine, microwave oven, refrigerator), regardless of how many or few people share it. Medium offices exhibited the largest range of density, but on average their total equipment density is similar to that of health care facilities.
Closer examination of the results for each building reveals some underlying trends. For example, the large variation in OE density between the two large office buildings is largely due to the fact that site M employees rely on laptop computers (most of which were absent during our visit; company policy requires employees to take their laptops home or lock them up when not at work). As a result, the computer density at that site was only 1.8 computers/1000 ft2. Similarly, site E (medium office building) also relied largely on laptop computers, which resulted in a computer density of only 1.7/1000 ft2 and explains the very low OE density for that site.
Figure 1. Office and Miscellaneous Equipment Density by Building Type
912
914
8 9
9
20
18
26
2014
0
5
10
15
20
25
30
35
40
45
education large
office
medium
office
small
office
health
care
all
buildings
Unit
s/1000 f
t 2
ME
OE
7
Table 1. Office and Miscellaneous Equipment: Number of Units and Density sorted by total units (units/1000 ft2)
Office Equipment Turn-Off Rates
Of the office equipment found in our survey, we want to determine the extent to which
users in commercial building turn-off their equipment at night, as well power management success rates. Our sample includes data on the power state of 1,464 desktop computers, 1,630 monitors, 363 printers, 90 servers, 65 multi-function devices, 59 fax machines, 46 integrated computer systems, 38 scanners, and 40 copiers. ‘Turn-off rate’ is the percent of each equipment type that is turned off, while ‘PM rate’ is the percent of those not off that are in low power. Table 2 shows the numbers of each type of office equipment, and their after-hours power state4.
4 We note that “after-hours” may not be a direct simulation of during-hours conditions, but this was
typically the only time that we had access to the building, employee workstations and equipment. Note that PM rate only applies to those units that were not turned off during audit (meaning that if a facility had a high turn-off rate, it could theoretically still have a low PM rate under certain conditions). In this study, we do not address the achieved power level of the sleep state.
Number of Units
Equipment Density
(units/1000 ft2)
bldg type site Location
Bldg.
Description OE ME Total
Ft2
Surveyed OE ME Total
large office C GA
corporate
headquarters 536 616 1,152 28,000 19 22 41
medium office H GA
information
services dept 340 630 970 24,000 14 26 40
small office K PA
5 small
businesses
combined 275 528 803 20,000 14 26 40
health care G CA
outpatient
clinic 460 1,002 1,462 45,000 10 22 32
medium office E GA
business
consulting firm 97 444 541 22,000 4 20 25
large office M PA
corporate
headquarters 227 753 980 40,000 6 19 25
health care J PA
private
physicians’
offices 171 458 629 26,000 7 18 24
education A GA
university
classroom bldg 377 259 636 28,000 13 9 23
education P GA
university
classroom bldg 204 234 438 20,000 10 12 22
medium office B PA
non-profit
headquarters 410 422 832 55,000 7 8 15
education D CA high school 258 291 549 40,000 6 7 14
education F PA high school 573 597 1,170 100,000 6 6 12
all buildings 3,928 6,234 10,162 448,000 9 14 23

8
Table 2. Office Equipment: After-Hours Power States
1. Table only includes units for which we recorded power status. 2. “PM rate” or power management success rate is the percent of units not off that were in low power.
Not surprisingly, turn-off rates were lowest among fax machines and server computers. Turn-off rates were highest for integrated computer systems (59%), copiers (45%), and scanners (41%)5. PM rates were highest among LCD monitors (75%), CRT monitors (71%), ICSs (61%), scanners (60%), and laser printers (60%).
Because copiers and MFDs often have long (2-4 hour) PM delay settings that may not have elapsed at the time of our visit, PM rates in Table 2 for this equipment should be considered a minimum or lower bound. The lowest power management rates were among desktop computers and fax machines (6% and 5% respectively).
Although the power management success rate among desktop computers is low, it is similar to the 5% rate found in a previous study (Webber et al. 2001) and is likely indicative of actual user behavior and the complexity of the office equipment environment. For example, at Site M, the building manager informed us that company policy (a consequence of a previous fire due to a piece of malfunctioning electronic equipment that had been left on all night) dictated that all office equipment was to be turned off each night and that no personal electric devices or electronics were allowed to be brought into the workplace. Since security patrolled each night enforcing the policy, we were assured that we would find little ME and no units of OE left on during the audit. What we actually found was plenty of personal fans and space heaters as well as equipment turn-off rates that weren’t any different than the average for the buildings in our survey. Miscellaneous Equipment
5 Turn-off rates were also high for plasma monitors and wide format printers, but we did not have a large sample size of units.
Number Percent
low off on unplugged total low off on unplugged PM rate
computers desktop 60 524 869 11 1464 4% 36% 59% 1% 6%
server 0 2 87 1 90 0% 2% 97% 1% -
ICS 11 27 7 1 46 24% 59% 15% 2% 61%
monitors CRT 648 422 259 12 1341 48% 31% 19% 1% 71%
LCD 164 49 56 17 286 57% 17% 20% 6% 75%
plasma 0 2 1 0 3 0% 67% 33% 0% -
printers laser 81 24 53 0 158 51% 15% 34% 0% 60%
inkjet 0 37 86 8 131 0% 28% 66% 6% -
impact 0 6 16 0 22 0% 27% 73% 0% -
thermal 0 7 31 2 40 0% 18% 78% 5% -
wide format 0 6 2 0 8 0% 75% 25% 0% -
solid ink 3 0 1 0 4 75% 0% 25% 0% 75%
MFDs all 18 15 31 1 65 28% 23% 48% 2% 37%
copiers all 5 18 14 3 40 13% 45% 35% 8% 26%
fax machines all 3 0 56 0 59 5% 0% 95% 0% 5%
scanners all 12 14 8 3 37 32% 38% 22% 8% 60%
9
To begin our analysis, we created a taxonomy for the commercial miscellaneous electricity end use (included as an appendix). Specifically, we named each individual equipment type and then more broadly assigned each equipment type to an end use category. Our taxonomy includes the following end use categories:
• audio/visual, lighting and portable HVAC, lab and medical (includes laboratory, medical and medical specialty), networking and peripherals, power, other (includes money exchange, office miscellaneous, security, specialty, telephony, utility/maintenance)
ME Results
We encountered a wide range of types of ME during our audit. We documented
numerous equipment types that we expected to see such as powered phones, computer speakers and cell phone chargers. We also documented several truly miscellaneous products such as walkie-talkie chargers, electric air fresheners, decorative water fountains, and even a levitating globe. In total, ME outnumbered OE at all sites except one (a university, site A). On average, the ratio of ME to OE was 1.5:1 and in one instance (a medium office, site E), the ratio of ME to OE was 4.6:1.
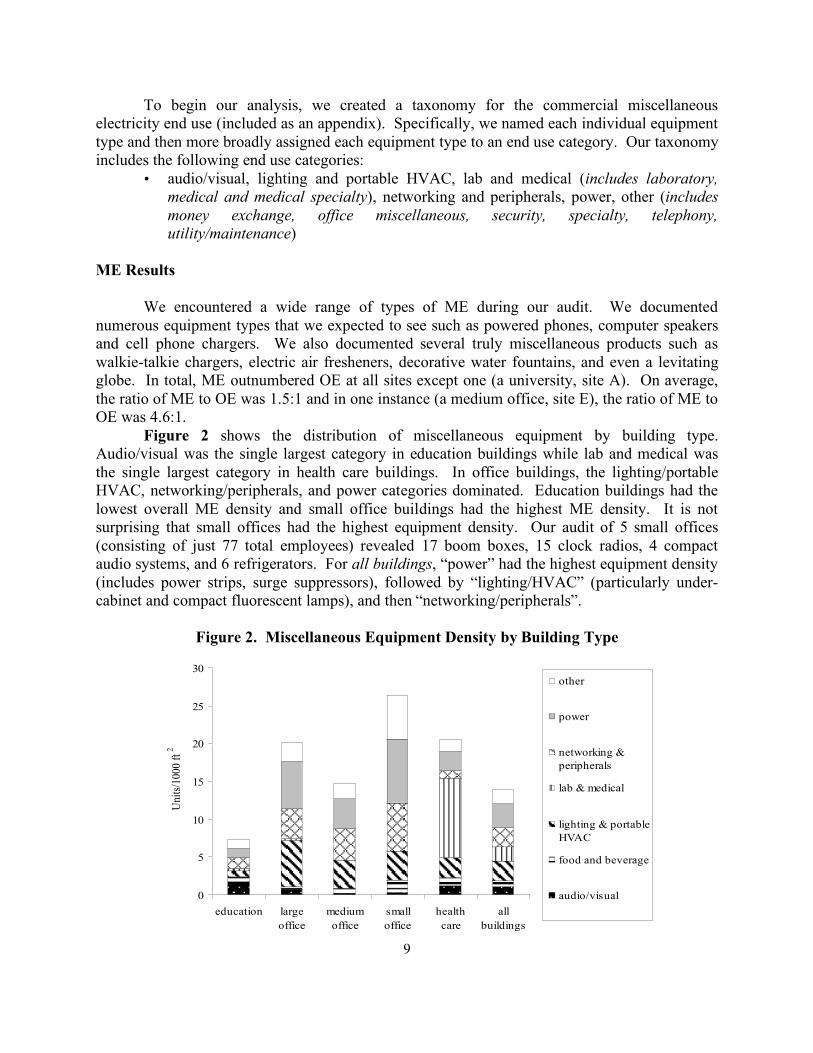
Figure 2 shows the distribution of miscellaneous equipment by building type. Audio/visual was the single largest category in education buildings while lab and medical was the single largest category in health care buildings. In office buildings, the lighting/portable HVAC, networking/peripherals, and power categories dominated. Education buildings had the lowest overall ME density and small office buildings had the highest ME density. It is not surprising that small offices had the highest equipment density. Our audit of 5 small offices (consisting of just 77 total employees) revealed 17 boom boxes, 15 clock radios, 4 compact audio systems, and 6 refrigerators. For all buildings, “power” had the highest equipment density (includes power strips, surge suppressors), followed by “lighting/HVAC” (particularly under-cabinet and compact fluorescent lamps), and then “networking/peripherals”.
Figure 2. Miscellaneous Equipment Density by Building Type
0
5
10
15
20
25
30
education large
office
medium
office
small
office
health
care
all
buildings
Uni
ts/1
000
ft 2
other
power
networking &
peripherals
lab & medical
lighting & portable
HVAC
food and beverage
audio/visual

10
In addition to estimating equipment density, we calculated the total energy consumption of ME in the surveyed buildings to accomplish the following: generate order-of-magnitude consumption estimates of ME for surveyed building types, estimate the percentage load due to ME for surveyed building types, and compare our estimates to AEO.
To calculate total energy consumption of the ME, we estimated typical unit energy consumption (UECs) for over 70% (230 of 321 types) of ME found among buildings in this survey. We used data from previous metering projects and other available sources to estimate power and operation hours. In some cases we found UEC estimates in the literature. To estimate power consumed in each power state, we relied primarily on metering data by Lawrence Berkeley National Laboratory and others, online and published sources, and comparison to similar devices for which we have data (AD Little 1996, Cadmus 2000, USDOE 1995, Wenzel 1997). Our UEC estimates ranged from 1 kWh/yr for pencil sharpeners to 7,008 kWh/yr for kilns; total energy consumption (TEC) estimates ranged from 1 kWh/yr (e.g., for one shaver) to almost 80,000 kWh/yr for 24 refrigerated vending machines.
Because of the high UECs associated with many food and beverage equipment types, the energy intensity of this category is considerably higher than its relative equipment densities would predict. Even though educational buildings had the lowest equipment densities, these buildings had relatively high-energy intensities because of the food and beverage equipment found in the survey (Figure 3).
Figure 3. Energy Intensity of Miscellaneous Equipment by Building Type
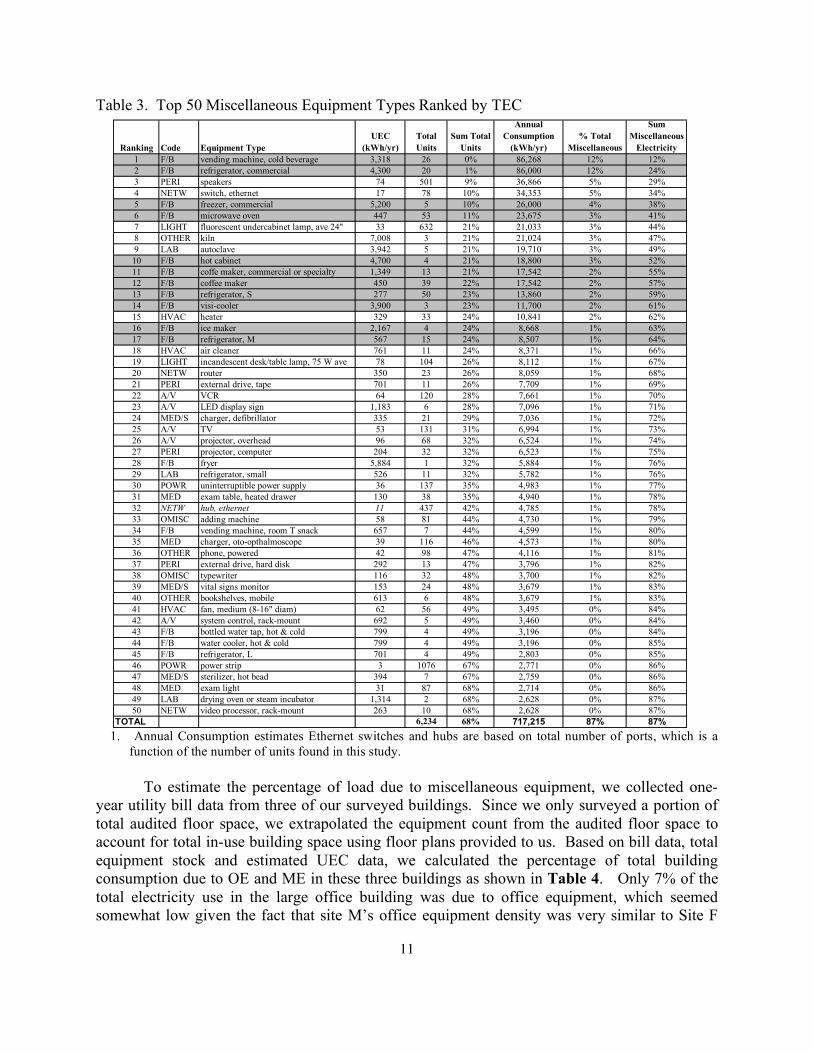
Table 3 shows the energy dominance of the food and beverage category. In terms of
total energy consumption, the top 25 equipment types consumed nearly 75% of all commercial electricity accounted for in the buildings surveyed (they account for 32% of the total number of units found in the buildings). Eleven of the 25 top end uses were from the food and beverage category (representing over 40% of the miscellaneous electricity surveyed).
0
500
1000
1500
2000
2500
3000
education large
office
medium
office
small
office
health
care
all
buildings
kW
h/1
000 f
t 2
other
power
networking &
peripherals
lab & medical
lighting & portable
HVAC
food and beverage
audio/visual
11
Table 3. Top 50 Miscellaneous Equipment Types Ranked by TEC
1. Annual Consumption estimates Ethernet switches and hubs are based on total number of ports, which is a function of the number of units found in this study.
To estimate the percentage of load due to miscellaneous equipment, we collected one-
year utility bill data from three of our surveyed buildings. Since we only surveyed a portion of total audited floor space, we extrapolated the equipment count from the audited floor space to account for total in-use building space using floor plans provided to us. Based on bill data, total equipment stock and estimated UEC data, we calculated the percentage of total building consumption due to OE and ME in these three buildings as shown in Table 4. Only 7% of the total electricity use in the large office building was due to office equipment, which seemed somewhat low given the fact that site M’s office equipment density was very similar to Site F
Ranking Code Equipment Type
UEC
(kWh/yr)
Total
Units
Sum Total
Units
Annual
Consumption
(kWh/yr)
% Total
Miscellaneous
Sum
Miscellaneous
Electricity
1 F/B vending machine, cold beverage 3,318 26 0% 86,268 12% 12%
2 F/B refrigerator, commercial 4,300 20 1% 86,000 12% 24%
3 PERI speakers 74 501 9% 36,866 5% 29%
4 NETW switch, ethernet 17 78 10% 34,353 5% 34%
5 F/B freezer, commercial 5,200 5 10% 26,000 4% 38%
6 F/B microwave oven 447 53 11% 23,675 3% 41%
7 LIGHT fluorescent undercabinet lamp, ave 24" 33 632 21% 21,033 3% 44%
8 OTHER kiln 7,008 3 21% 21,024 3% 47%
9 LAB autoclave 3,942 5 21% 19,710 3% 49%
10 F/B hot cabinet 4,700 4 21% 18,800 3% 52%
11 F/B coffe maker, commercial or specialty 1,349 13 21% 17,542 2% 55%
12 F/B coffee maker 450 39 22% 17,542 2% 57%
13 F/B refrigerator, S 277 50 23% 13,860 2% 59%
14 F/B visi-cooler 3,900 3 23% 11,700 2% 61%
15 HVAC heater 329 33 24% 10,841 2% 62%
16 F/B ice maker 2,167 4 24% 8,668 1% 63%
17 F/B refrigerator, M 567 15 24% 8,507 1% 64%
18 HVAC air cleaner 761 11 24% 8,371 1% 66%
19 LIGHT incandescent desk/table lamp, 75 W ave 78 104 26% 8,112 1% 67%
20 NETW router 350 23 26% 8,059 1% 68%
21 PERI external drive, tape 701 11 26% 7,709 1% 69%
22 A/V VCR 64 120 28% 7,661 1% 70%
23 A/V LED display sign 1,183 6 28% 7,096 1% 71%
24 MED/S charger, defibrillator 335 21 29% 7,036 1% 72%
25 A/V TV 53 131 31% 6,994 1% 73%
26 A/V projector, overhead 96 68 32% 6,524 1% 74%
27 PERI projector, computer 204 32 32% 6,523 1% 75%
28 F/B fryer 5,884 1 32% 5,884 1% 76%
29 LAB refrigerator, small 526 11 32% 5,782 1% 76%
30 POWR uninterruptible power supply 36 137 35% 4,983 1% 77%
31 MED exam table, heated drawer 130 38 35% 4,940 1% 78%
32 NETW hub, ethernet 11 437 42% 4,785 1% 78%
33 OMISC adding machine 58 81 44% 4,730 1% 79%
34 F/B vending machine, room T snack 657 7 44% 4,599 1% 80%
35 MED charger, oto-opthalmoscope 39 116 46% 4,573 1% 80%
36 OTHER phone, powered 42 98 47% 4,116 1% 81%
37 PERI external drive, hard disk 292 13 47% 3,796 1% 82%
38 OMISC typewriter 116 32 48% 3,700 1% 82%
39 MED/S vital signs monitor 153 24 48% 3,679 1% 83%
40 OTHER bookshelves, mobile 613 6 48% 3,679 1% 83%
41 HVAC fan, medium (8-16" diam) 62 56 49% 3,495 0% 84%
42 A/V system control, rack-mount 692 5 49% 3,460 0% 84%
43 F/B bottled water tap, hot & cold 799 4 49% 3,196 0% 84%
44 F/B water cooler, hot & cold 799 4 49% 3,196 0% 85%
45 F/B refrigerator, L 701 4 49% 2,803 0% 85%
46 POWR power strip 3 1076 67% 2,771 0% 86%
47 MED/S sterilizer, hot bead 394 7 67% 2,759 0% 86%
48 MED exam light 31 87 68% 2,714 0% 86%
49 LAB drying oven or steam incubator 1,314 2 68% 2,628 0% 87%
50 NETW video processor, rack-mount 263 10 68% 2,628 0% 87%
TOTAL 6,234 68% 717,215 87% 87%

12
and Site J’s. We did contact the maintenance supervisor at the large office building to see if our extrapolated office equipment counts matched those in their records and they seemed to be in agreement, which would tend to support the estimate in Table 4. Site M’s total electricity usage is twice that of Site J’s and 50% higher than Site F’s so it’s likely that the majority of their consumption is due to other loads in the building. Only 4% of the large office total electricity use was due to miscellaneous electricity, which may be due to the low energy intensity of miscellaneous electricity in large office buildings as shown in Figure 3. AEO 2006 shows 0.56 Quads of PC and non-PC office equipment or 12.7% of commercial electricity use (our buildings office equipment estimates range from 7-10% of total building electricity consumption). On the other hand, AEO shows 1.62 Quads of “other” electricity, 37% of total commercial electricity. Our results show a range of 4-9% of total electricity consumption due to miscellaneous (this difference is also supported by differences in energy intensities, AEO 2006 has an “other” energy intensity of ~6,100 kWh/1000 ft2 whereas our total building energy intensity is less than 2,000 kWh/ft2). There are several possible reasons for this discrepancy:
• there are real differences between the AEO (more a top-down modeling approach) and our (bottom-up) approach to stock-accounting
• we weren’t able to account for all miscellaneous loads in the building and we only estimated 70% of all UECs
• all building and product types (like ATMs and service stations) covered in AEO are not covered here
• it is also possible that AEO’s “other” end use consumption and projection is inflated beyond what is realistically consumed by many commercial buildings.
Table 4. Comparison of ME and OE Consumption in Three Surveyed Buildings
Conclusions
We audited sixteen buildings in three cities (San Francisco, Atlanta, Pittsburgh) including
office, medical and education building types. We inventoried the number and types of OE and ME equipment, recorded power status of equipment, and estimated total energy consumption due to these product types. In total, we audited approximately 4,000 units of OE and 6,000 units of ME. The database that resulted from this work will assist in better estimating consumption of the OE/ME end use, estimating savings from energy efficiency programs such as Energy Star, and examining strategies for reducing consumption in these key end uses. Our results show the following:
• for all buildings combined, the OE plug-load equipment density was about 9 units per 1000 gross ft2
• OE turn-off rates varied by equipment type (0% as expected for fax machines, 67% for plasma monitors) as did estimated power management success rates (only 6% for
Site F (Eduction)
kWh/yr
Site M (Large Office)
kWh/yr
Site J (Medical)
kWh/yr
Site F (Eduction)
% total kWh
Site M (Large Office)
% total kWh
Site J (Medical)
% total kWh
Office Equipment 288,404 333,927 242,822 9% 7% 10%
Miscellaneous 305,322 185,797 225,307 9% 4% 9%
Other 2,660,123 4,473,776 2,052,521 82% 90% 81%
Total 3,253,849 4,993,500 2,520,650 100% 100% 100%

13
desktop computers). These results suggest improving turn-off rates among low turn-off products and increasing equipment enabling can realize additional savings
• for all buildings combined, the ME plug-load equipment density was about 14 units per 1000 gross ft2
• it is hard to generalize miscellaneous electricity across all commercial buildings, as density, energy intensity, and especially “product composition” varies across the individual building types
• within the commercial miscellaneous electricity end use, there are a couple of “big ticket items” in terms of energy consumption. The top five are: cold beverage vending machines, commercial refrigerators, computer speakers, Ethernet switches, and commercial freezers
• for three of our audited buildings, OE is estimated to account for 7-10% of annual electricity consumption and ME is estimated to account for 4-9% of annual electricity consumption. Our ME estimate is substantially less than that in AEO 2006 (37%), which suggests the need to look in more detail at modeling this end use
Acknowledgements
This work was supported by the US Environmental Protection Agency, Office of Air and
Radiation, Climate Protection Division through the US Department of Energy under Contract No. DE-ACO3-76SF00098. References
AD Little. 1996. Energy Savings Potential for Commercial Refrigeration Equipment. Cadmus. 2000. Product Testing and Analysis of Water Dispensers. Memo prepared for EPA’s
Energy Star Program. February. EIA. 2006. Annual Energy Outlook 2006. Department of Energy, Energy Information
Administration, Washington DC. EIA/CBECS. 2002. Computers and Photocopiers in Commercial Buildings. Energy
Information Agency, Commercial Building Energy Consumption Survey. US Department of Energy, Washington DC.
Roberson et al. 2004. After-hours Power Status of Office Equipment and Energy Use of Miscellaneous Plug-Load Equipment. LBNL-53729-revised. Lawrence Berkeley National Laboratory, Berkeley CA.
US DOE 1995. Technical Support Document: Energy Efficiency Standards for Consumer Products: Refrigerators, Refrigerator-Freezers & Freezers. DOE/EE-0064.
Webber et al. 2001. Field Surveys of Office Equipment Operating Patterns. LBNL-46930. Lawrence Berkeley National Laboratory, Berkeley CA.
Wenzel et al. 1997. Energy Data Sourcebook for the U.S. Residential Sector. LBNL-40297. Lawrence Berkeley National Laboratory, Berkeley CA.

14
Appendix: Miscellaneous Equipment Taxonomy Category Equipment Type (not an exhaustive list)
audio/visual
television, video cassette player/recorder, overhead projector, audio amplifier, compact disk audio device, digital video disk device, slide projector, video monitor, audio mixer, audio tape device, LED display sign, receiver, speaker, tuner, digital video camera, video conferencing device, microfilm viewer, scan converter, public address system, set-top box
food & beverage
microwave oven, refrigerator (all sizes), coffee maker, toaster/toaster oven, vending machine, hot/cold bottled water tap, hot pot/kettle, water cooler, freezer, hot beverage dispenser, hot food cabinet, ice maker, coffee grinder, drinking fountain, fryer/griddle, steam trays, visi-cooler, meat slicer, mixer, soda fountain pump, blender, refrigerated case
hvac, portable fan, heater, air cleaner, room air conditioner
laboratory scale, spectrophotometer, tabletop centrifuge, temperature monitor, lab refrigerator, microscope, autoclave, shaker/stirrer, lab freezer, hot plate/warmer, drying oven, timer
lighting fluorescent undercabinet lamp (by size), desk/table/floor lamp (by lamp type and power use), incandescent spotlight or studio lamp, decorative lamp, strand or cable lights, fluorescent light box, incandescent or halogen track light or recessed lamp, exterior fluorescent sign
medical oto-opthalmoscope charger, exam light or headlamp, x-ray light box, exam chair or table, body scale, hospital bed, utensil sterilizer, blood pressure monitor, IV cart
medical specialty vital signs monitor, respirator, defibrillator charger, EKG machine & accessories, pulse oxymeter, eye chart projector, lensmeter, glucometer charger, hot bead sterilizer, suction pump charger, hearing test device, retinal scanner, fundus camera, hyfrecator, sonoscope
money exchange credit card reader, cash register, bar code scanner, change or stamp vending machine
networking modem, router, hub, printer hub, switch, print controller/server, video processor, wireless access point, audio/video modulator, tape drive, broadband distribution amplifier, driver
office miscellany clock and/or radio, boombox or compact audio system, pencil sharpener, adding machine, shredder, typewriter, stapler, postage meter or scale, hole punch, laminator, time stamper, binding machine, microfiche reader
peripheral computer speakers (pair), laptop docking station, personal digital assistant dock, computer projector, keyboard/video/mouse switch, external drive (CD, zip, hard disk, tape backup), pen tablet, digital whiteboard,
power power strip, surge protector, PIPS, ILPS, uninterruptible power supply, charger (for laptop computer, cell or cordless phone, power tool), power conditioner, battery backup system
security badge reader, book demagnetizer, shoplifting sensor, article surveillance system
specialty pottery wheel, mobile bookshelves, oscilloscope, shrinkwrapper, bench wheel, soldering iron
telephony conference or speaker phone, answering machine, intercom, phone switch, phone jack or box, dictation machine, PBX phone line converter, voice control box, switchboard phone, integrated voice server
utility/maintenance vacuum cleaner, floor polisher, dishwasher, ultrasonic cleaner, water purifier, clothes washer or dryer

15
Related Documents