Solving a Costly and Persistent Quality Problem with Visual Six Sigma ASQ Granite State Section Monthly Meeting 3/24/2011 Presented by the North Haven Group Philip J. Ramsey, Ph.D. www.northhavengroup.com , [email protected] [email protected]

Welcome message from author
This document is posted to help you gain knowledge. Please leave a comment to let me know what you think about it! Share it to your friends and learn new things together.
Transcript

Solving a Costly and Persistent Quality Problem
with Visual Six SigmaASQ Granite State SectionMonthly Meeting 3/24/2011
Presented by the North Haven GroupPhilip J. Ramsey, Ph.D.
www.northhavengroup.com ,[email protected]

Talk Outline• The Visual Six Sigma Book• Visual Six Sigma• Visual Six Sigma Roadmap• The JMP Statistical Software• Case Study: Improving a Polymer Manufacturing Process• Case Study: Framing the Problem• Case Study: Uncover Relationships• Case Study: Model Relationships• Case Study: Revise Knowledge• Case Study: Utilize Knowledge• Summary
2©2011 Philip J. Ramsey, Ph.D.

The Visual Six Sigma Book
3©2011 Philip J. Ramsey, Ph.D.
Copyright © 2010 by SAS Institute, Inc. Published by John Wiley & Sons, Inc., Hoboken, New Jersey.
An eBook version is available from Amazon.com.

The Visual Six Sigma Book
4©2011 Philip J. Ramsey, Ph.D.
The book is based upon six comprehensive case studies with a chapter for each study:
Chapter 4 Reducing Hospital Late Charge Incidents
Chapter 5 Transforming Pricing Management in a Chemical Supplier
Chapter 6 Improving the Quality of Anodized Parts
Chapter 7 Informing Pharmaceutical Sales and Marketing
Chapter 8 Improving a Polymer Manufacturing Process
Chapter 9 Classification of Breast Cancer Cells
Data sets are available for download, so that the reader can work through the case studies while reading the text.
Visual Six Sigma
5©2011 Philip J. Ramsey, Ph.D.
In conjunction with the development of powerful computers and software was the beginning of the data explosion.
When Six Sigma was first deployed, the problems tackled were often narrow in scope and limited data existed. In fact, teams typically had to initiate data collection plans to have any data at all.
Fast forward to 2011 where large data bases abound, even in small companies, partly due to the ability to collect large amounts of data in an automated or semi-automated manner.
We have gone from complaining about the lack of data to puzzling over what to do with too much data.
Today analysts struggle to deal with petabytes (250 bytes) and now zettabytes (270 bytes) of data collected on millions of variables.
Traditional statistical tools were never meant to deal with such large amounts of data and variables. Visualization now becomes ever more important to statistical analyses.

Visual Six Sigma
6©2011 Philip J. Ramsey, Ph.D.
Visual Six Sigma Strategies
Visual Six Sigma exploits the following three key strategies tosupport the goal of managing variation in relation to performance requirements (the fundamental goal of Six Sigma):
1. Using dynamic visualization to literally see the sources of variation in your data.
2. Using exploratory data analysis (EDA) techniques to identify key drivers and models, especially for situations with many variables.
3. Using confirmatory statistical methods (CDA) only when the conclusions are not obvious. This leans out the data analysis effort.

Visual Six Sigma Roadmap
7©2011 Philip J. Ramsey, Ph.D.
In defining the Visual Six Sigma Roadmap we use the usual convention in Six Sigma that a process output is represented by a “Y” and a process input is represented by an “X”. The Xs are the sources of variation in Ys.
Frame Problem. Identify the specific failure to produce what is required. Identify your general strategy for improvement, estimate the time and resources needed, and calculate the likely benefit if you succeed. Identify the Y or Ys of interest.
Collect Data. Identify potential Xs using techniques such as brainstorming, process maps, data mining, failure modes and effects analysis (FMEA), and subject matter knowledge. Passively or actively collect data that relate these Xs to the Ys of interest. Baseline the current process and determine measurement system capability.

Visual Six Sigma Roadmap
8©2011 Philip J. Ramsey, Ph.D.
Uncover Relationships. Validate the data to understand their strengths, weaknesses, and relevance to your problem. Use exploratory tools and your understanding of the data, generate hypotheses and explore whether and how the Xs relate to the Ys.
Model Relationships (optional). Build models relating the Xs to the Ys. Determine statistically which Xs explain variation in the Ys.
Revise Knowledge. Optimize settings of the Xs to give the best values for the Ys. Explore the distribution of Ys as the Xs are allowed to vary a little. Collect new data to verify that the improvement is real.
Utilize Knowledge. Implement the improvement and monitor the Ys to see that the improvement is maintained.

Visual Six Sigma Roadmap
9©2011 Philip J. Ramsey, Ph.D.
The Visual Six Sigma roadmap relates to the traditional DMAIC process in the following manner:
The Frame the Problem and Collect Data steps correspond to the Define and Measure phases of DMAIC. However, considerable data mining and clean-up may occur in these first two steps of the Visual Six Sigma Roadmap.
The Uncover Relationships step loosely corresponds to the Analyzephase of DMAIC. However, the initial emphasis is on data exploration and visualization not hypothesis testing.
If the results permit, then the Model Relationships step is skipped and one goes directly to the Revise Knowledge step. If results are unsatisfactory, then one may have to return to the Collect Data step.
The Model Relationships step is a bridge between the Analyze and Improve phases of DMAIC. It may not be necessary in many cases.

Visual Six Sigma Roadmap
10©2011 Philip J. Ramsey, Ph.D.
The Revise Knowledge step corresponds to the Improve phase of DMAIC.
Finally, the Utilize Knowledge step corresponds to the latter stages of Improve and then the Control phases of DMAIC.
The roadmap can be visualized as follows:
Visual Six Sigma Roadmap
11©2011 Philip J. Ramsey, Ph.D.
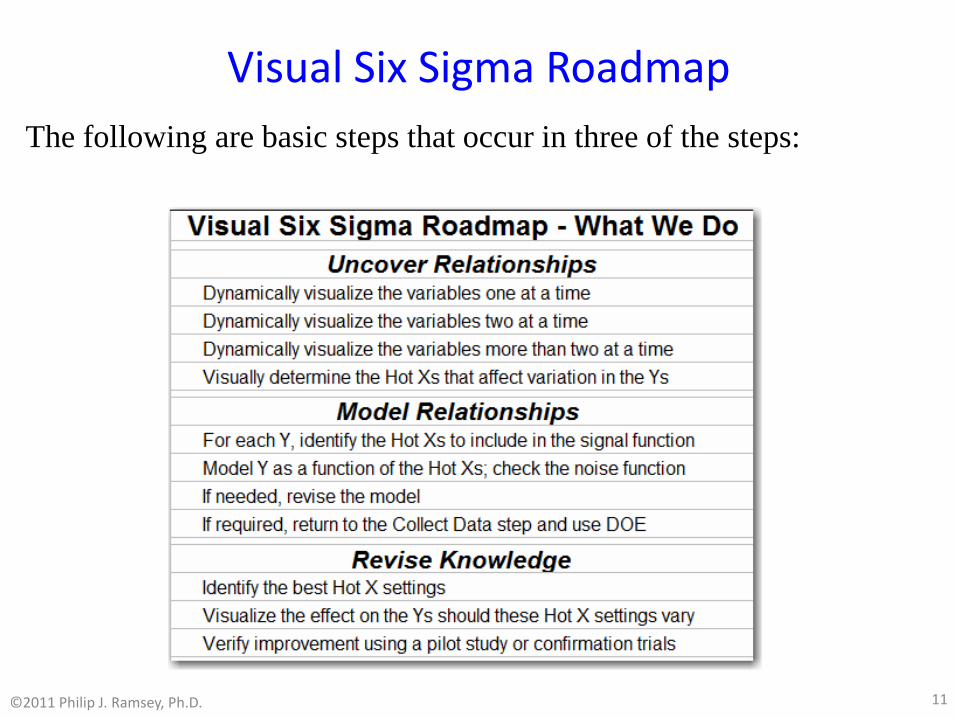
The following are basic steps that occur in three of the steps:

The JMP Statistical Software
12©2011 Philip J. Ramsey, Ph.D.
The Visual Six Sigma book is built around analyses performed using the JMP® statistical software from the SAS Institute.
All the JMP data sets used in the book are available for download at a Website referenced in the book.
Why JMP? At present JMP is unique among statistical software packages in that it has fully dynamic and integrated visualization built into its architecture and statistical modeling is straightforward.
All graphics and data tables opened in JMP are dynamically linked, which is critical to data mining and visualization. This is essential to the Uncover Relationships phase of Visual Six Sigma.
JMP also provides powerful analytic techniques for confirmatory data analysis. All graphics and analyses are fully integrated.
Note: I have absolutely no financial interest in sales of JMP.
Improving a Polymer Manufacturing Process
13©2011 Philip J. Ramsey, Ph.D.
Case Study: For the past 25 years, MoldMat Ltd. has supplied the plastic used by one of its major customers in Italy in making white garden furniture. Over the years, mysterious crises intermittently occur during which the flowability of the plastic leads to low yields for both MoldMat and its Italian customer. The crises tend to occur about 2 or 3 times per year with acceptable product yields in between the crisis periods. To date, numerous efforts to find the root causes of these crises have failed. Historically, many surefire fixes, that ultimately fail, have been implemented by different teams. Generally, the problem seems to go away on its own after a few weeks (although teams always believe it is a result of their fix) only to reappear later on. After the most recent crisis, a new team is formed, led by an engineer who is a black belt with training in Visual Six Sigma.
Improving a Polymer Manufacturing Process
14©2011 Philip J. Ramsey, Ph.D.
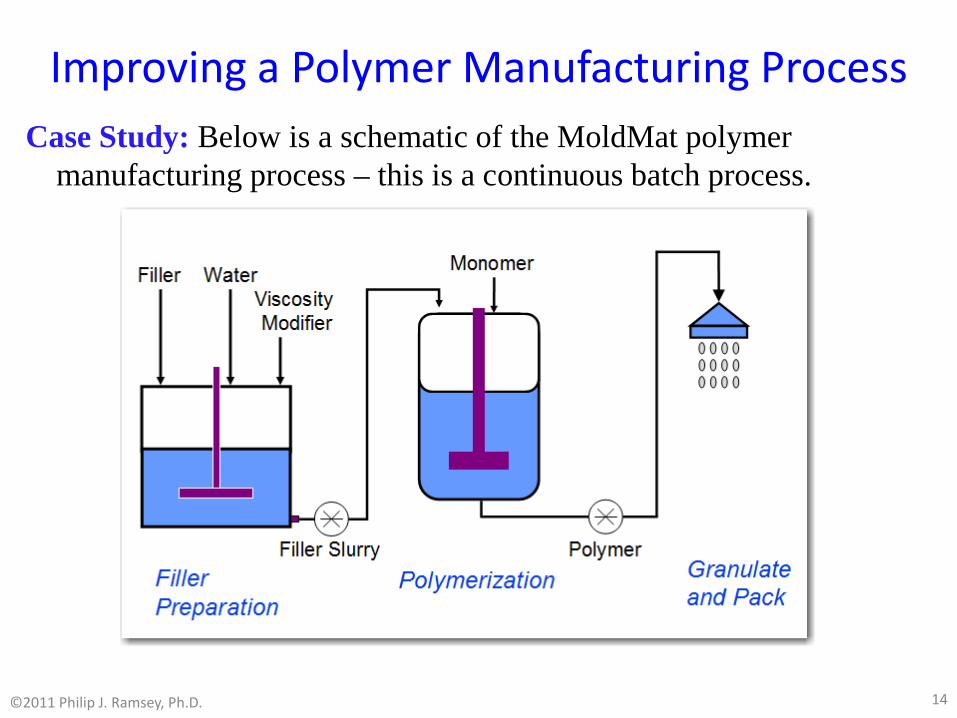
Case Study: Below is a schematic of the MoldMat polymer manufacturing process – this is a continuous batch process.

Improving a Polymer Manufacturing Process
15©2011 Philip J. Ramsey, Ph.D.
Case Study: The manufacturing process is driven by three critical to quality (CTQ) characteristics that are monitored or measured in process and batch adjustments can often be made if necessary.
The three CTQ’s are: Whiteness of plastic color measured by a colorimeter; Melt flow index (MFI), this is a surrogate measurement for
how well the plastic will flow during the molding operation; Yield, the amount of good polymer produced.
The filler content is an inert white powder that provides the correct color of the polymer and is an important process factor.
However, filler content also affects flowability, so content must be in a proper range to achieve desired color with acceptable flowability.

Framing the Problem
16©2011 Philip J. Ramsey, Ph.D.
The team first puts together a project charter agreed upon by the team and by the management sponsor of the project.

Framing the Problem
17©2011 Philip J. Ramsey, Ph.D.
To capture all of the process inputs (X’s) and outputs (Y’s), the team constructed a SIPOC map (or model). A Suppliers Inputs Process Outputs Customers, although simple in nature, is very useful in identifying all important variables in the manufacturing system.

Framing the Problem
18©2011 Philip J. Ramsey, Ph.D.
The team put together a detailed process map used in identifying potential critical process inputs (X’s) and help everyone on the team to understand the general manufacturing process.
The key performance indicator or KPI for the process is daily yield (Y3) computed as weight of good polymer produced divided by the weight of total polymer produced. The target for yield is 95% and good polymer is that which can be successfully used for molding.

Framing the Problem
19©2011 Philip J. Ramsey, Ph.D.
Below are definitions of the various X’s and Y’s. We refer back to these later.

Framing the Problem
20©2011 Philip J. Ramsey, Ph.D.
Fortunately for the team a considerable mount of historical data on yield is available and can be used to baseline the current process performance. Notice that overall yield is around 88.2% with many very low yield values during crisis periods. The data are in the file BaselineYieldData.JMP.
Framing the Problem
21©2011 Philip J. Ramsey, Ph.D.
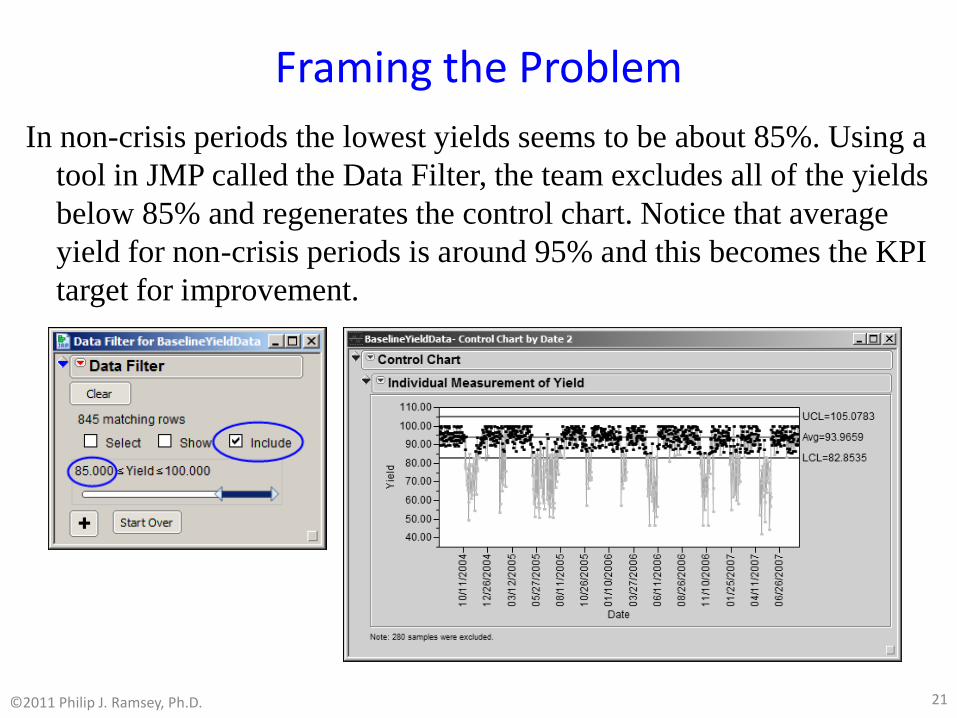
In non-crisis periods the lowest yields seems to be about 85%. Using a tool in JMP called the Data Filter, the team excludes all of the yields below 85% and regenerates the control chart. Notice that average yield for non-crisis periods is around 95% and this becomes the KPI target for improvement.
Framing the Problem
22©2011 Philip J. Ramsey, Ph.D.
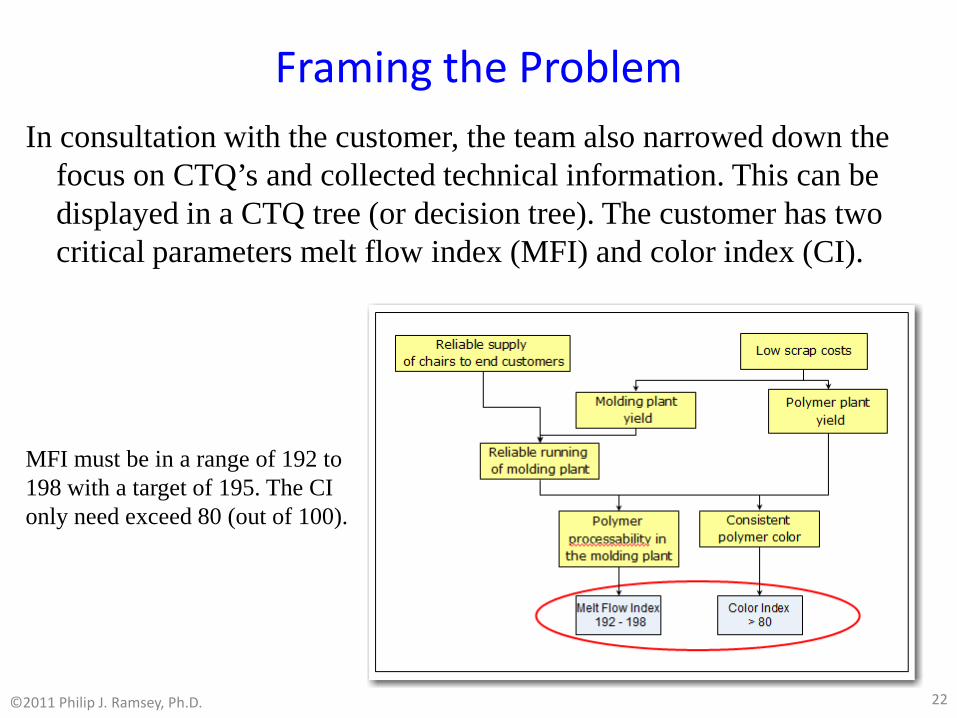
In consultation with the customer, the team also narrowed down the focus on CTQ’s and collected technical information. This can be displayed in a CTQ tree (or decision tree). The customer has two critical parameters melt flow index (MFI) and color index (CI).
MFI must be in a range of 192 to 198 with a target of 195. The CI only need exceed 80 (out of 100).
Uncover Relationships
23©2011 Philip J. Ramsey, Ph.D.
The team was fortunate to find out that a previous crisis team had compiled about six weeks worth of historical data on the process inputs and outputs.
The data covered about 127 production batches.The data was available and the team Blackbelt combined the data into
a large data set for further analysis.File CrisisTeamData.JMP contains the historical data.This precluded the need for the Data Collection step at this point in the
project and they moved on to the Uncover Relationships step.Generally, it is best to start the analysis of the data by looking at “one
variable at a time” to look at the shapes of the distributions, spot potential outliers, anomalous conditions, etc.
Uncover Relationships
24©2011 Philip J. Ramsey, Ph.D.
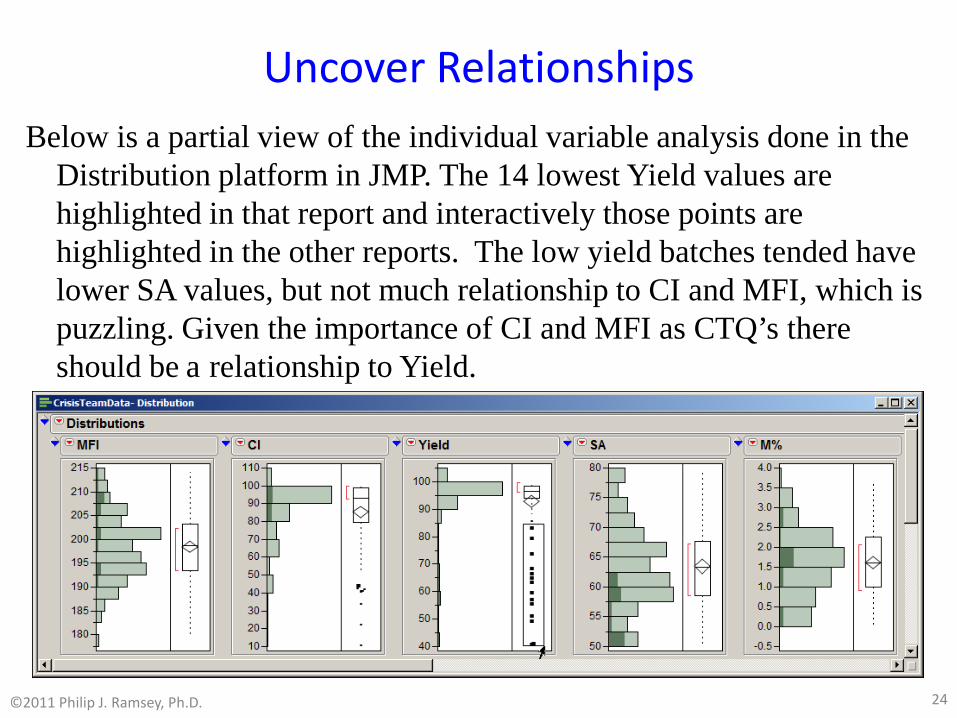
Below is a partial view of the individual variable analysis done in the Distribution platform in JMP. The 14 lowest Yield values are highlighted in that report and interactively those points are highlighted in the other reports. The low yield batches tended have lower SA values, but not much relationship to CI and MFI, which is puzzling. Given the importance of CI and MFI as CTQ’s there should be a relationship to Yield.
Uncover Relationships
25©2011 Philip J. Ramsey, Ph.D.
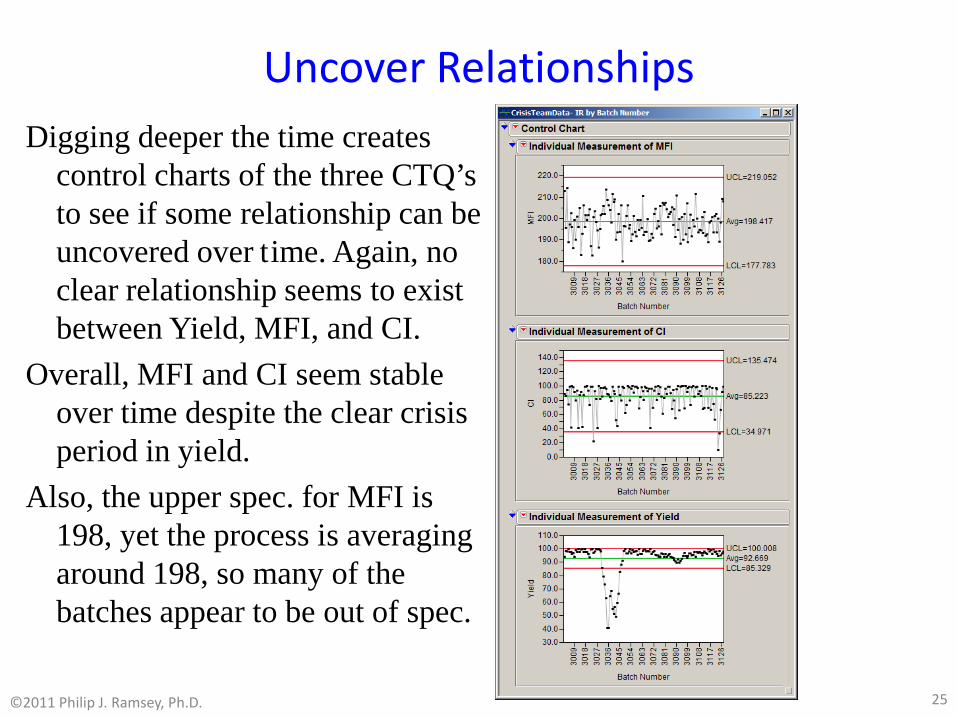
Digging deeper the time creates control charts of the three CTQ’s to see if some relationship can be uncovered over time. Again, no clear relationship seems to exist between Yield, MFI, and CI.
Overall, MFI and CI seem stable over time despite the clear crisis period in yield.
Also, the upper spec. for MFI is 198, yet the process is averaging around 198, so many of the batches appear to be out of spec.

Uncover Relationships
26©2011 Philip J. Ramsey, Ph.D.
The team quickly suspects that poor measurement system capability might be a potential reason for the inability to see relationships between MFI, CI, and Yield.
It was found that thorough measurement systems analyses (MSA) had been performed on most of the X’s and Y’s, but no record existed of an MSA on MFI or Xf.
Recall, Xf measures the amount of filler in the polymer and is directly related to color, viscosity, and somewhat to MFI.
The team decides that it is unwise to proceed with further data analysis until the capability of MFI and Xf are assessed and if need be improved.
Note, a simple form of MSA is a traditional Gage R&R study, however a full MSA may be significantly more complicated.

Uncover Relationships
27©2011 Philip J. Ramsey, Ph.D.
The MFI is measured using a commonly available type of instrument and the reported measures are average melted polymer flow in grams normalized to 10 minutes.
Four such instruments are used in the MoldMat lab.The MSA included all four instruments, three operators, and three
randomly chosen batches of polymer.Each combination was repeated twice for a total of 72 measurements
in the study.We omit most of the details of the MSA design, however the results
are contained in the file MSA_MFI_Initial.JMP.
Uncover Relationships
28©2011 Philip J. Ramsey, Ph.D.
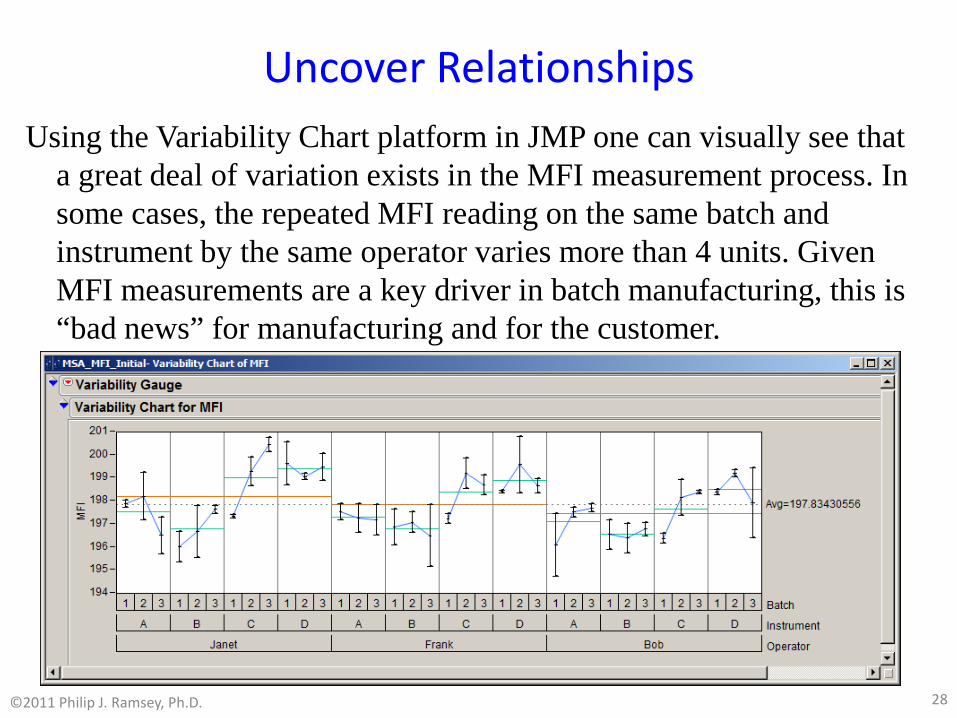
Using the Variability Chart platform in JMP one can visually see that a great deal of variation exists in the MFI measurement process. In some cases, the repeated MFI reading on the same batch and instrument by the same operator varies more than 4 units. Given MFI measurements are a key driver in batch manufacturing, this is “bad news” for manufacturing and for the customer.
Uncover Relationships
29©2011 Philip J. Ramsey, Ph.D.
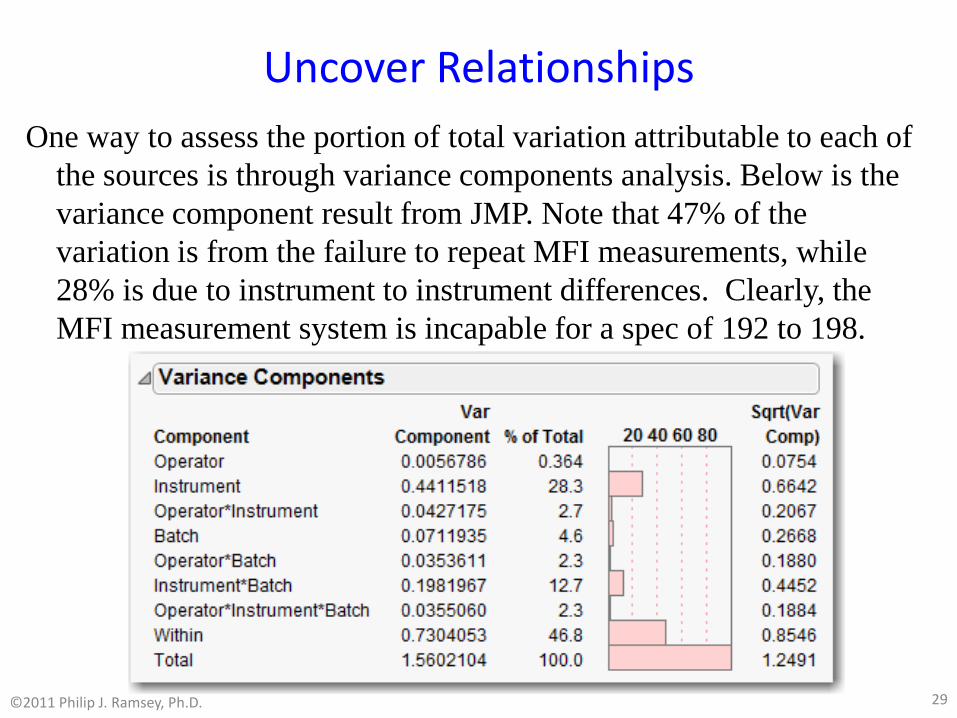
One way to assess the portion of total variation attributable to each of the sources is through variance components analysis. Below is the variance component result from JMP. Note that 47% of the variation is from the failure to repeat MFI measurements, while 28% is due to instrument to instrument differences. Clearly, the MFI measurement system is incapable for a spec of 192 to 198.
Uncover Relationships
30©2011 Philip J. Ramsey, Ph.D.
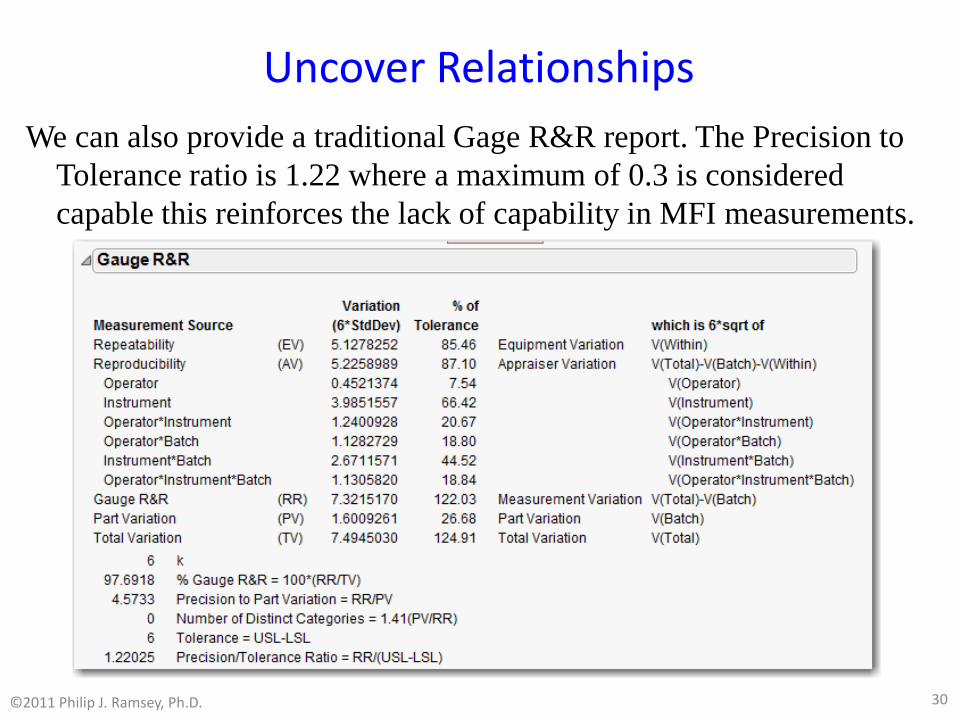
We can also provide a traditional Gage R&R report. The Precision to Tolerance ratio is 1.22 where a maximum of 0.3 is considered capable this reinforces the lack of capability in MFI measurements.
Uncover Relationships
31©2011 Philip J. Ramsey, Ph.D.
Similarly an MSA was performed for the Xf measurements. This is a common type of test referred to as an “ash test.”
The Xf MSA similarly revealed an incapable measurement system and since Xf measurements are used to control the amount of filler in the polymer this is further “bad news” for manufacturing and the customer.
We skip substantial detail, however significant sources of variation were uncovered in both measurement systems and fixes put in place by the team, causing a considerable delay in the project.
After improvements to the two measurements systems, both were found to be capable by additional MSAs.
Despite the delay, it would have been pointless to continue the project until capable MFI and Xf measurements were available.

Uncover Relationships
32©2011 Philip J. Ramsey, Ph.D.
Since two important measurement systems were incapable when the historical data was collected, the team had to backtrack to the Collect Data step and collect new process data.
A total of five weeks of new process data were collected and at that point the team returned to the Uncover Relationships step.
The new data are in the file VSSTeamData.JMP.Since, we have new and higher quality data it is useful to go back and
examine the control charts for MFI, CI, Yield to see if we can detect any patterns in the relationships.
Uncover Relationships
33©2011 Philip J. Ramsey, Ph.D.
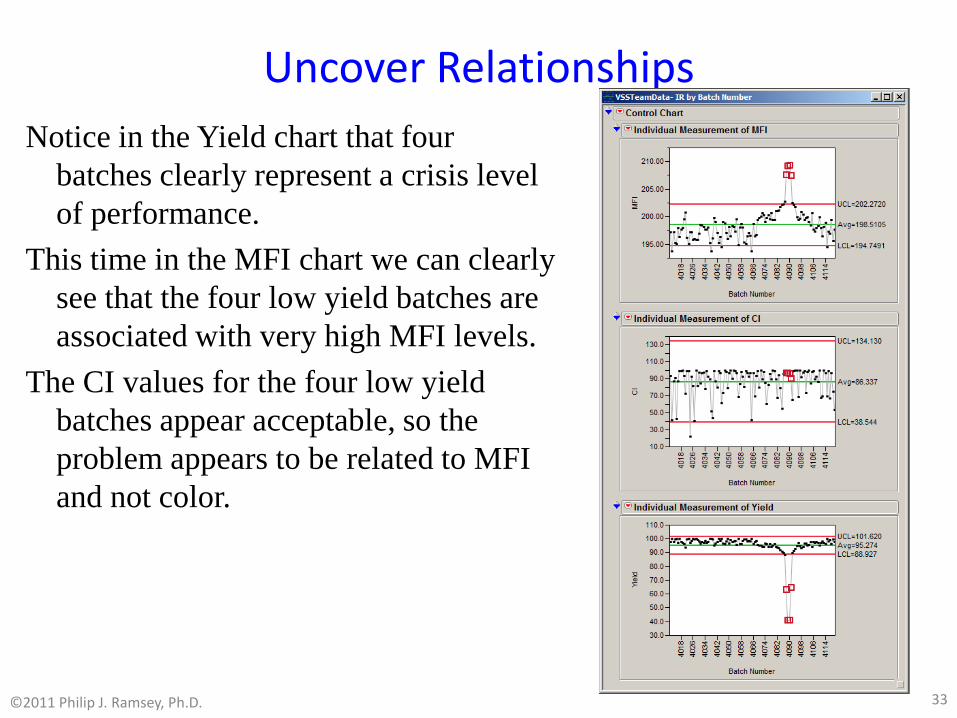
Notice in the Yield chart that four batches clearly represent a crisis level of performance.
This time in the MFI chart we can clearly see that the four low yield batches are associated with very high MFI levels.
The CI values for the four low yield batches appear acceptable, so the problem appears to be related to MFI and not color.

Uncover Relationships
34©2011 Philip J. Ramsey, Ph.D.
In order to better understand the relationships between Yield, MFI, CI, and Xf we use a series of scatter plots for the Fit Y by X platform in JMP.
From the Yield by MFI plot it appears that the upper MFI spec of 198 may be too high and should be closer to 194 or 195.

Uncover Relationships
35©2011 Philip J. Ramsey, Ph.D.
A Fit Y by X plot of CI by Xf also revealed an interesting relationship. It appears that Xf needs to be kept in an operating range in order to achieve acceptable CI.

Uncover Relationships
36©2011 Philip J. Ramsey, Ph.D.
A plot of MFI by SA also reveals that low SA settings may contribute to high MFI and most likely we need at least a lower limit for SA.

Uncover Relationships
37©2011 Philip J. Ramsey, Ph.D.
With the new capable data the team has found relationships between yield and MFI.
In addition, it is clear that both MFI and CI are affected by settings of at least some of the process variables.
However, it is difficult to find proper control points for the process factors based solely on one and two dimensional visualizations.
Most likely more complicated relationships exist among the input variables and the output variables than we can capture visually.
At this point, it appears that the team needs to move on to the Model Relationships step in order to understand how the input factors control MFI and CI (and thereby control Yield).
The model then becomes a basis for setting desirable processing conditions to assure high Yield.

Model Relationships
38©2011 Philip J. Ramsey, Ph.D.
Ideally the team would like to run designed experiments to better understand causal relationships between the input variables and the outputs MFI and CI.
Unfortunately, they are unable to secure production equipment time to run experiments due to an excessive production backlog attributable to the latest crisis.
However, given they do have a valid dataset it may be possible to generate useful process models from their observational data.
Before proceeding to model development, the four low yield batches were excluded from the data, since they appear to be outliers with the respect to the remainder of the data.
We want to find operating settings that deliver good polymer not bad.
Model Relationships
39©2011 Philip J. Ramsey, Ph.D.
Given the number of input factors and possible nonlinear relationships the modeling task is a difficult one.
A new platform in JMP called “Screening”, can be useful, especially for those not thoroughly versed in statistical modeling.
Screening automatically looks a lot of potential models and tries to select the best one for the user.
The team decided to try the Screening platform in JMP to see if a significant model could be found relating MFI and CI to the input variables.
Model Relationships
40©2011 Philip J. Ramsey, Ph.D.
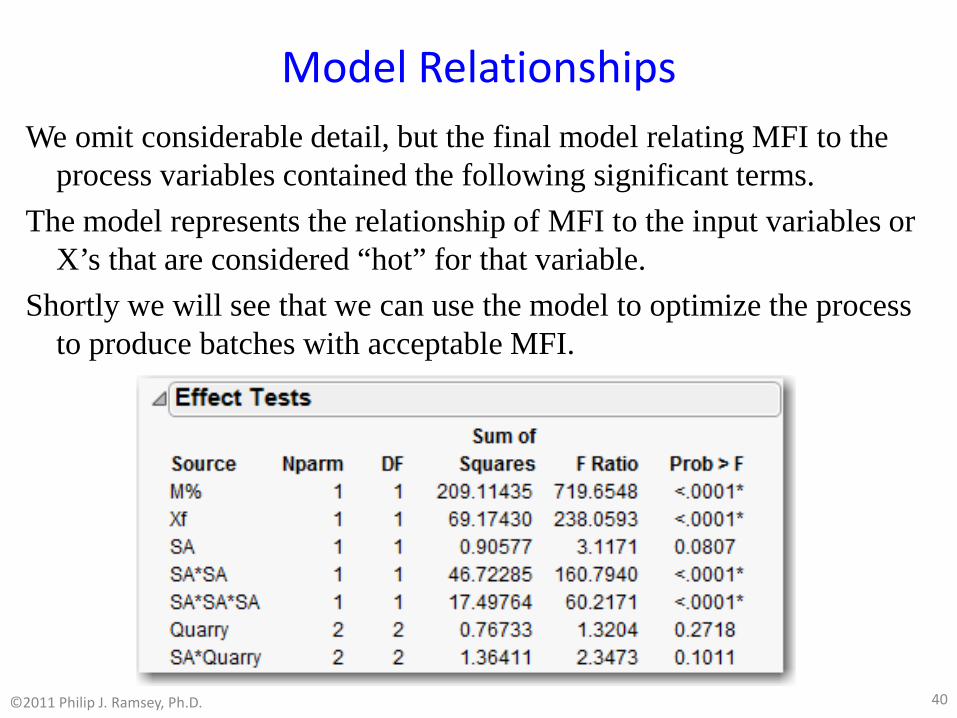
We omit considerable detail, but the final model relating MFI to the process variables contained the following significant terms.
The model represents the relationship of MFI to the input variables or X’s that are considered “hot” for that variable.
Shortly we will see that we can use the model to optimize the process to produce batches with acceptable MFI.
Model Relationships
41©2011 Philip J. Ramsey, Ph.D.
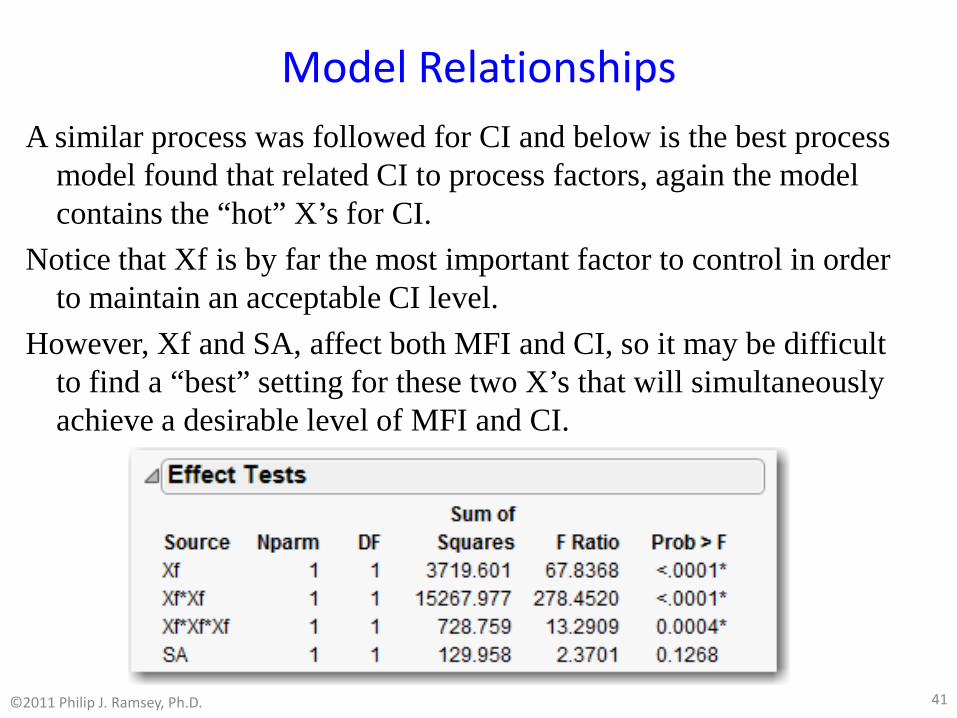
A similar process was followed for CI and below is the best process model found that related CI to process factors, again the model contains the “hot” X’s for CI.
Notice that Xf is by far the most important factor to control in order to maintain an acceptable CI level.
However, Xf and SA, affect both MFI and CI, so it may be difficult to find a “best” setting for these two X’s that will simultaneously achieve a desirable level of MFI and CI.

Revise Knowledge
42©2011 Philip J. Ramsey, Ph.D.
The remaining process variables not included in either model are assumed not to have a significant affect on MFI or CI and can be set a convenient levels in their current process range.
The two models amount to prediction formulas or equations that predict the MFI and CI levels for any given settings of the process factors included in the model.
We can now use these models in JMP to perform an optimization and capability analysis on the process.
Again, we skip some detail, however the Profiler in JMP contains a powerful optimization routine that also performs capability analysis.
Revise Knowledge
43©2011 Philip J. Ramsey, Ph.D.
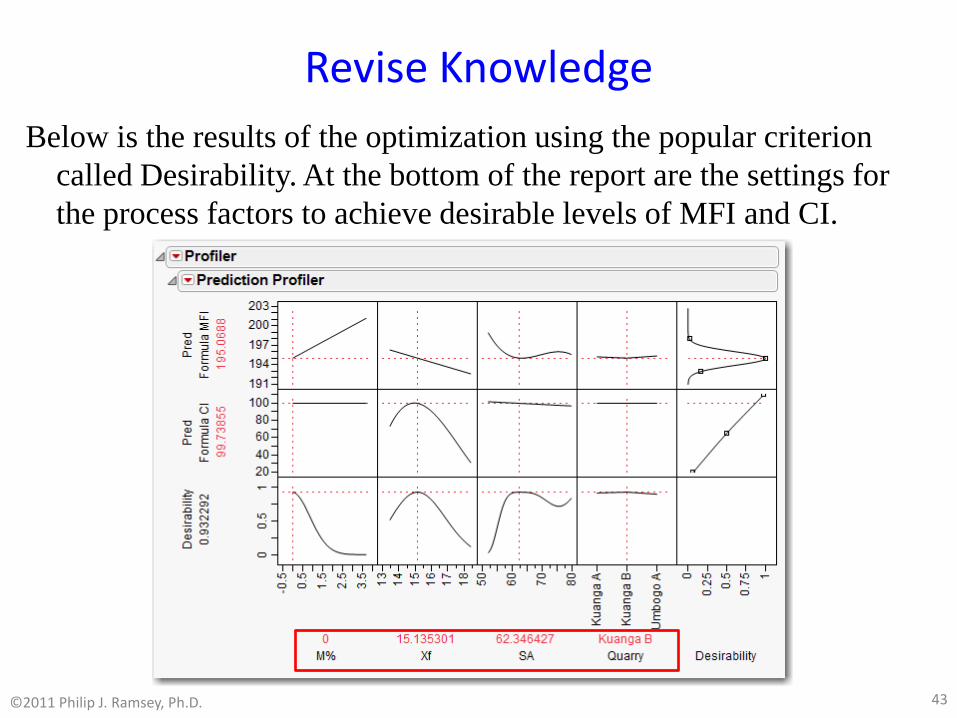
Below is the results of the optimization using the popular criterion called Desirability. At the bottom of the report are the settings for the process factors to achieve desirable levels of MFI and CI.

Revise Knowledge
44©2011 Philip J. Ramsey, Ph.D.
In manufacturing the team has observed that neither Xf nor SA are tightly controlled and they would like to know the impact on capability due to variation in Xf and SA.
The Profiler in JMP has a “Simulator” which allows one to vary the inputs to the process models and evaluate the overall impact on the process capability.
The team, using the process data that they have collected, have a good estimate of the variation in Xf and SA.
We express the variation as a standard deviation (a common measure of variation).
For Xf we have the standard deviation = 0.4 and for SA the standard deviation is 1.9. We will use these as inputs to the Simulator and assess the resultant process capability.

Revise Knowledge
45©2011 Philip J. Ramsey, Ph.D.
Notice that the defect rate for MFI is very low, but for CI it is too high, meaning in practice a problem with low CI may well occur.

Revise Knowledge
46©2011 Philip J. Ramsey, Ph.D.
Since CI is very sensitive to Xf, it should be possible to improve CI performance simply by instituting tighter process controls on Xf.
Although the results look promising, it is important perform confirmation production runs at the optimized settings to determine if the models are indeed properly predicting performance.
Below are the results of five confirmation runs and the team is quite pleased.

Utilize Knowledge
47©2011 Philip J. Ramsey, Ph.D.
Given the promising confirmation results the team moves on to the Utilize Knowledge step where the new process will be implemented and monitored.
As an aside, based upon the results presented by the team the sponsor agreed to invest in a new controller for SA and institute better control over filler to maintain tighter Xf control.
Although, the results look promising, the team must monitor the new process for sometime to ensure that the predicted capability or gains are sustainable.
The results for the next 79 batches after the changes are implemented is contained in the file VSSTeamFinalData.JMP.
Utilize Knowledge
48©2011 Philip J. Ramsey, Ph.D.
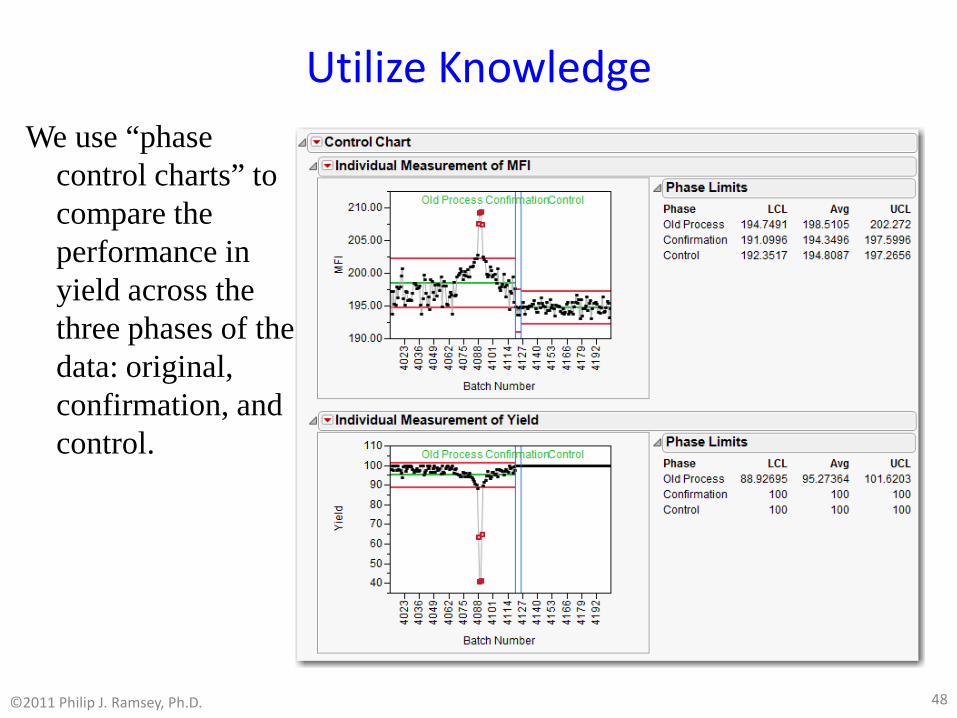
We use “phase control charts” to compare the performance in yield across the three phases of the data: original, confirmation, and control.
Summary
49©2011 Philip J. Ramsey, Ph.D.
It has been over 2 years since the changes were implemented and not a single batch of polymer has been rejected by the molding plant.
The total addition to margin for the polymer plant is about £2,100,000.
Some key lessons from the project: Never trust a measurement system until a proper MSA is
performed. Without capable measurements it is impossible to get meaningful
results from analyses of data – garbage in garbage out. Following the VSS roadmap results in a high level of process
understanding gained in a straightforward manner. VSS methodology allows technical and business users to solve
problems effectively in a timely manner.
Related Documents