Information Fusion 28 (2016) 45–59 Contents lists available at ScienceDirect Information Fusion journal homepage: www.elsevier.com/locate/inffus Social big data: Recent achievements and new challenges Gema Bello-Orgaz a , Jason J. Jung b,∗ , David Camacho a a Computer Science Department, Universidad Autónoma de Madrid, Spain b Department of Computer Engineering, Chung-Ang University, Seoul, Republic of Korea article info Article history: Available online 28 August 2015 Keywords: Big data Data mining Social media Social networks Social-based frameworks and applications abstract Big data has become an important issue for a large number of research areas such as data mining, machine learning, computational intelligence, information fusion, the semantic Web, and social networks. The rise of different big data frameworks such as Apache Hadoop and, more recently, Spark, for massive data processing based on the MapReduce paradigm has allowed for the efficient utilisation of data mining methods and ma- chine learning algorithms in different domains. A number of libraries such as Mahout and SparkMLib have been designed to develop new efficient applications based on machine learning algorithms. The combina- tion of big data technologies and traditional machine learning algorithms has generated new and interesting challenges in other areas as social media and social networks. These new challenges are focused mainly on problems such as data processing, data storage, data representation, and how data can be used for pattern mining, analysing user behaviours, and visualizing and tracking data, among others. In this paper, we present a revision of the new methodologies that is designed to allow for efficient data mining and information fu- sion from social media and of the new applications and frameworks that are currently appearing under the “umbrella” of the social networks, social media and big data paradigms. © 2015 Elsevier B.V. All rights reserved. 1. Introduction Data volume and the multitude of sources have experienced exponential growth, creating new technical and application chal- lenges; data generation has been estimated at 2.5 Exabytes (1 Ex- abyte = 1.000.000 Terabytes) of data per day [1]. These data come from everywhere: sensors used to gather climate, traffic and flight information, posts to social media sites (Twitter and Facebook are popular examples), digital pictures and videos (YouTube users upload 72 hours of new video content per minute [2]), transaction records, and cell phone GPS signals, to name a few. The classic methods, al- gorithms, frameworks, and tools for data management have become both inadequate for processing this amount of data and unable to of- fer effective solutions for managing the data growth. The problem of managing and extracting useful knowledge from these data sources is currently one of the most popular topics in computing research [3,4]. In this context, big data is a popular phenomenon that aims to provide an alternative to traditional solutions based on databases and data analysis. Big data is not just about storage or access to data; its solutions aim to analyse data in order to make sense of them and exploit their value. Big data refers to datasets that are terabytes to ∗ Corresponding author. Tel.: +821020235863. E-mail addresses: [email protected] (G. Bello-Orgaz), [email protected], [email protected], [email protected] (J.J. Jung), [email protected] (D. Camacho). petabytes (and even exabytes) in size, and the massive sizes of these datasets extend beyond the ability of average database software tools to capture, store, manage, and analyse them effectively. The concept of big data has been defined through the 3V model, which was defined in 2001 by Laney [5] as: “high-volume, high- velocity and high-variety information assets that demand cost-effective, innovative forms of information processing for enhanced insight and de- cision making”. More recently, in 2012, Gartner [6] updated the def- inition as follows: “Big data is high volume, high velocity, and/or high variety information assets that require new forms of processing to enable enhanced decision making, insight discovery and process optimization”. Both definitions refer to the three basic features of big data: Volume, Variety, and Velocity. Other organisations, and big data practitioners (e.g., researchers, engineers, and so on), have extended this 3V model to a 4V model by including a new “V”: Value [7]. This model can be even extended to 5Vs if the concepts of Veracity is incorporated into the big data definition. Summarising, this set of ∗V-models provides a straightforward and widely accepted definition related to what is (and what is not) a big-data-based problem, application, software, or framework. These concepts can be briefly described as follows [5,7]: • Volume: refers to large amounts of any kind of data from any different sources, including mobile digital data creation devices and digital devices. The benefit from gathering, processing, and analysing these large amounts of data generates a number http://dx.doi.org/10.1016/j.inffus.2015.08.005 1566-2535/© 2015 Elsevier B.V. All rights reserved.

Welcome message from author
This document is posted to help you gain knowledge. Please leave a comment to let me know what you think about it! Share it to your friends and learn new things together.
Transcript
Information Fusion 28 (2016) 45–59
Contents lists available at ScienceDirect
Information Fusion
journal homepage: www.elsevier.com/locate/inffus
Social big data: Recent achievements and new challenges
Gema Bello-Orgaz a, Jason J. Jung b,∗, David Camacho a
a Computer Science Department, Universidad Autónoma de Madrid, Spainb Department of Computer Engineering, Chung-Ang University, Seoul, Republic of Korea
a r t i c l e i n f o
Article history:
Available online 28 August 2015
Keywords:
Big data
Data mining
Social media
Social networks
Social-based frameworks and applications
a b s t r a c t
Big data has become an important issue for a large number of research areas such as data mining, machine
learning, computational intelligence, information fusion, the semantic Web, and social networks. The rise of
different big data frameworks such as Apache Hadoop and, more recently, Spark, for massive data processing
based on the MapReduce paradigm has allowed for the efficient utilisation of data mining methods and ma-
chine learning algorithms in different domains. A number of libraries such as Mahout and SparkMLib have
been designed to develop new efficient applications based on machine learning algorithms. The combina-
tion of big data technologies and traditional machine learning algorithms has generated new and interesting
challenges in other areas as social media and social networks. These new challenges are focused mainly on
problems such as data processing, data storage, data representation, and how data can be used for pattern
mining, analysing user behaviours, and visualizing and tracking data, among others. In this paper, we present
a revision of the new methodologies that is designed to allow for efficient data mining and information fu-
sion from social media and of the new applications and frameworks that are currently appearing under the
“umbrella” of the social networks, social media and big data paradigms.
© 2015 Elsevier B.V. All rights reserved.
1
e
l
a
f
i
p
7
a
g
b
f
m
c
p
d
s
e
j
p
d
t
w
v
i
c
i
v
e
B
V
(
t
e
t
a
b
c
h
1
. Introduction
Data volume and the multitude of sources have experienced
xponential growth, creating new technical and application chal-
enges; data generation has been estimated at 2.5 Exabytes (1 Ex-
byte = 1.000.000 Terabytes) of data per day [1]. These data come
rom everywhere: sensors used to gather climate, traffic and flight
nformation, posts to social media sites (Twitter and Facebook are
opular examples), digital pictures and videos (YouTube users upload
2 hours of new video content per minute [2]), transaction records,
nd cell phone GPS signals, to name a few. The classic methods, al-
orithms, frameworks, and tools for data management have become
oth inadequate for processing this amount of data and unable to of-
er effective solutions for managing the data growth. The problem of
anaging and extracting useful knowledge from these data sources is
urrently one of the most popular topics in computing research [3,4].
In this context, big data is a popular phenomenon that aims to
rovide an alternative to traditional solutions based on databases and
ata analysis. Big data is not just about storage or access to data; its
olutions aim to analyse data in order to make sense of them and
xploit their value. Big data refers to datasets that are terabytes to
∗ Corresponding author. Tel.: +821020235863.
E-mail addresses: [email protected] (G. Bello-Orgaz), [email protected],
[email protected], [email protected] (J.J. Jung), [email protected] (D. Camacho).
ttp://dx.doi.org/10.1016/j.inffus.2015.08.005
566-2535/© 2015 Elsevier B.V. All rights reserved.
etabytes (and even exabytes) in size, and the massive sizes of these
atasets extend beyond the ability of average database software tools
o capture, store, manage, and analyse them effectively.
The concept of big data has been defined through the 3V model,
hich was defined in 2001 by Laney [5] as: “high-volume, high-
elocity and high-variety information assets that demand cost-effective,
nnovative forms of information processing for enhanced insight and de-
ision making”. More recently, in 2012, Gartner [6] updated the def-
nition as follows: “Big data is high volume, high velocity, and/or high
ariety information assets that require new forms of processing to enable
nhanced decision making, insight discovery and process optimization”.
oth definitions refer to the three basic features of big data: Volume,
ariety, and Velocity. Other organisations, and big data practitioners
e.g., researchers, engineers, and so on), have extended this 3V model
o a 4V model by including a new “V”: Value [7]. This model can be
ven extended to 5Vs if the concepts of Veracity is incorporated into
he big data definition.
Summarising, this set of ∗V-models provides a straightforward
nd widely accepted definition related to what is (and what is not) a
ig-data-based problem, application, software, or framework. These
oncepts can be briefly described as follows [5,7]:
• Volume: refers to large amounts of any kind of data from any
different sources, including mobile digital data creation devices
and digital devices. The benefit from gathering, processing,
and analysing these large amounts of data generates a number

Fig. 1. The conceptual map of Social BigData.
t
t
e
s
s
H
d
h
m
a
a
m
A
e
a
s
d
T
w
p
a
s
a
p
o
T
i
d
b
[
a
a
a
S
fl
a
g
G. Bello-Orgaz et al. / Information Fusion 28 (2016) 45–5946
of challenges in obtaining valuable knowledge for people and
companies (see Value feature).• Velocity: refers to the speed of data transfers. The data’s contents
are constantly changing through the absorption of complemen-
tary data collections, the introduction of previous data or legacy
collections, and the different forms of streamed data from multi-
ple sources. From this point of view, new algorithms and meth-
ods are needed to adequately process and analyse the online and
streaming data.• Variety: refers to different types of data collected via sensors,
smartphones or social networks, such as videos, images, text, au-
dio, data logs, and so on. Moreover, these data can be structured
(such as data from relational databases) or unstructured in format.• Value: refers to the process of extracting valuable information
from large sets of social data, and it is usually referred to as big
data analytics. Value is the most important characteristic of any
big-data-based application, because it allows to generate useful
business information.• Veracity: refers to the correctness and accuracy of information.
Behind any information management practice lie the core doc-
trines of data quality, data governance, and metadata manage-
ment, along with considerations of privacy and legal concerns.
Some examples of potential big data sources are the Open Science
Data Cloud [8], the European Union Open Data Portal, open data from
the U.S. government, healthcare data, public datasets on Amazon
Web Services, etc. Social media [9] has become one of the most
representative and relevant data sources for big data. Social media
data are generated from a wide number of Internet applications and
Web sites, with some of the most popular being Facebook, Twitter,
LinkedIn, YouTube, Instagram, Google, Tumblr, Flickr, and WordPress.
The fast growth of these Web sites allow users to be connected
and has created a new generation of people (maybe a new kind of
society [10]) who are enthusiastic about interacting, sharing, and
collaborating using these sites [11]. This information has spread
to many different areas such as everyday life [12] (e-commerce,
e-business, e-tourism, hobbies, friendship, ...), education [13], health
[14], and daily work.
In this paper, we assume that social big data comes from join-
ing the efforts of the two previous domains: social media and big
data. Therefore, social big data will be based on the analysis of vast
amounts of data that could come from multiple distributed sources
but with a strong focus on social media. Hence, social big data
analysis [15,16] is inherently interdisciplinary and spans areas such
as data mining, machine learning, statistics, graph mining, informa-
tion retrieval, linguistics, natural language processing, the semantic
Web, ontologies, and big data computing, among others. Their appli-
cations can be extended to a wide number of domains such as health
and political trending and forecasting, hobbies, e-business, cyber-
crime, counterterrorism, time-evolving opinion mining, social net-
work analysis, and humanmachine interactions. The concept of social
big data can be defined as follows:
“Those processes and methods that are designed to provide sensitive
and relevant knowledge to any user or company from social media data
sources when data sources can be characterised by their different formats
and contents, their very large size, and the online or streamed generation
of information.”
The gathering, fusion, processing and analysing of the big social
media data from unstructured (or semi-structured) sources to extract
value knowledge is an extremely difficult task which has not been
completely solved. The classic methods, algorithms, frameworks and
tools for data management have became inadequate for processing
the vast amount of data. This issue has generated a large number
of open problems and challenges on social big data domain related
to different aspects as knowledge representation, data management,
data processing, data analysis, and data visualisation [17]. Some of
hese challenges include accessing to very large quantities of unstruc-
ured data (management issues), determination of how much data is
nough for having a large quantity of high quality data (quality ver-
us quantity), processing of data stream dynamically changing, or en-
uring the enough privacy (ownership and security), among others.
owever, given the very large heterogeneous dataset from social me-
ia, one of the major challenges is to identify the valuable data and
ow analyse them to discover useful knowledge improving decision
aking of individual users and companies [18].
In order to analyse the social media data properly, the traditional
nalytic techniques and methods (data analysis) require adapting
nd integrating them to the new big data paradigms emerged for
assive data processing. Different big data frameworks such as
pache Hadoop [19] and Spark [20] have been arising to allow the
fficient application of data mining methods and machine learning
lgorithms in different domains. Based on these big data frameworks,
everal libraries such as Mahout [21] and SparkMLib [22] have been
esigned to develop new efficient versions of classical algorithms.
his paper is focused on review those new methodologies, frame-
orks, and algorithms that are currently appearing under the big data
aradigm, and their applications to a wide number of domains such
s e-commerce, marketing, security, and healthcare.
Finally, summarising the concepts mentioned previously, Fig. 1
hows the conceptual representation of the three basic social big data
reas: social media as a natural source for data analysis; big data as a
arallel and massive processing paradigm; and data analysis as a set
f algorithms and methods used to extract and analyse knowledge.
he intersections between these clusters reflect the concept of mix-
ng those areas. For example, the intersection between big data and
ata analysis shows some machine learning frameworks that have
een designed on top of big data technologies (Mahoot [21], MLBase
23,24], or SparkMLib [22]). The intersection between data analysis
nd social media represents the concept of current Web-based
pplications that intensively use social media information, such as
pplications related to marketing and e-health that are described in
ection 4. The intersection between big data and social media is re-
ected in some social media applications such as LinkedIn, Facebook,
nd Youtube that are currently using big data technologies (Mon-
oDB, Cassandra, Hadoop, and so on) to develop their Web systems.
F
s
a
s
o
t
b
t
t
a
f
2
o
(
t
m
r
c
i
o
m
H
f
f
m
c
2
d
r
l
m
o
p
u
t
c
w
g
o
o
d
t
d
i
O
u
i
c
a
p
i
47G. Bello-Orgaz et al. / Information Fusion 28 (2016) 45–59
inally, the centre of this figure only represents the main goal of any
ocial big data application: knowledge extraction and exploitation.
The rest of the paper is structured as follows; Section 2 provides
n introduction to the basics on the methodologies, frameworks, and
oftware used to work with big data. Section 3 provides a description
f the current state of the art in the data mining and data analytic
echniques that are used in social big data. Section 4 describes a num-
er of applications related to marketing, crime analysis, epidemic in-
elligence, and user experiences. Finally, Section 5 describes some of
he current problems and challenges in social big data; this section
lso provides some conclusions about the recent achievements and
uture trends in this interesting research area.
. Methodologies for social big data
Currently, the exponential growth of social media has created seri-
us problems for traditional data analysis algorithms and techniques
such as data mining, statistics, machine learning, and so on) due to
heir high computational complexity for large datasets. This type of
ethods does not properly scale as the data size increases. For this
eason, the methodologies and frameworks behind the big data con-
ept are becoming very popular in a wide number of research and
ndustrial areas.
This section provides a short introduction to the methodol-
gy based on the MapReduce paradigm and a description of the
ost popular framework that implements this methodology, Apache
adoop. Afterwards Apache Spark is described as emerging big data
ramework that improves the current performance of the Hadoop
ramework. Finally, some implementations and tools for big data do-
ain related to distributed data file systems, data analytics, and ma-
hine learning techniques are presented.
.1. MapReduce and the big data processing problem
MapReduce [25,26] is presented as one of the most efficient big
ata solutions. This programming paradigm and its related algo-
ithms [27], were developed to provide significant improvements in
arge-scale data-intensive applications in clusters [28]. The program-
ing model implemented by MapReduce is based on the definition
f two basic elements: mappers and reducers. The idea behind this
rogramming model is to design map functions (or mappers) that are
sed to generate a set of intermediate key/value pairs, after which
(01, “I thought I”)
(02, ”thought of thinking”)
(03, ”of thanking you”)
Input Splitting Mapping
I thought, I
thought of thinking
of thanking you
(I, 2)
(thought, 1)
(thought, 1)
(of, 1)
(thinking, 1)
(of, 1)
(thanking, 1)
(you, 1)
(K1, value)(K2, value)
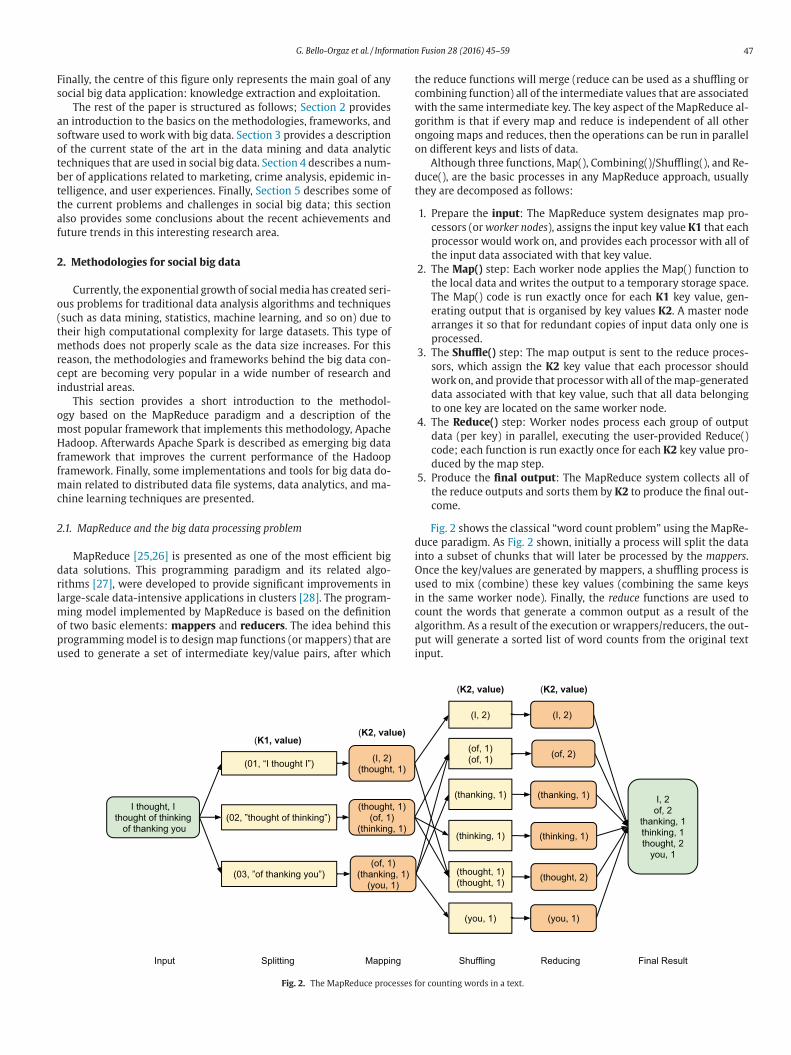
Fig. 2. The MapReduce processes f
he reduce functions will merge (reduce can be used as a shuffling or
ombining function) all of the intermediate values that are associated
ith the same intermediate key. The key aspect of the MapReduce al-
orithm is that if every map and reduce is independent of all other
ngoing maps and reduces, then the operations can be run in parallel
n different keys and lists of data.
Although three functions, Map(), Combining()/Shuffling(), and Re-
uce(), are the basic processes in any MapReduce approach, usually
hey are decomposed as follows:
1. Prepare the input: The MapReduce system designates map pro-
cessors (or worker nodes), assigns the input key value K1 that each
processor would work on, and provides each processor with all of
the input data associated with that key value.
2. The Map() step: Each worker node applies the Map() function to
the local data and writes the output to a temporary storage space.
The Map() code is run exactly once for each K1 key value, gen-
erating output that is organised by key values K2. A master node
arranges it so that for redundant copies of input data only one is
processed.
3. The Shuffle() step: The map output is sent to the reduce proces-
sors, which assign the K2 key value that each processor should
work on, and provide that processor with all of the map-generated
data associated with that key value, such that all data belonging
to one key are located on the same worker node.
4. The Reduce() step: Worker nodes process each group of output
data (per key) in parallel, executing the user-provided Reduce()
code; each function is run exactly once for each K2 key value pro-
duced by the map step.
5. Produce the final output: The MapReduce system collects all of
the reduce outputs and sorts them by K2 to produce the final out-
come.
Fig. 2 shows the classical “word count problem” using the MapRe-
uce paradigm. As Fig. 2 shown, initially a process will split the data
nto a subset of chunks that will later be processed by the mappers.
nce the key/values are generated by mappers, a shuffling process is
sed to mix (combine) these key values (combining the same keys
n the same worker node). Finally, the reduce functions are used to
ount the words that generate a common output as a result of the
lgorithm. As a result of the execution or wrappers/reducers, the out-
ut will generate a sorted list of word counts from the original text
nput.
(I, 2)
(of, 1)
(of, 1)
(thanking, 1)
(thinking, 1)
(thought, 1)
(thought, 1)
(you, 1)
Shuffling Reducing Final Result
I, 2
of, 2
thanking, 1
thinking, 1
thought, 2
you, 1
(I, 2)
(of, 2)
(thanking, 1)
(thinking, 1)
(thought, 2)
(you, 1)
(K2, value) (K2, value)
or counting words in a text.
48
a
c
T
i
g
d
t
I
(
m
u
r
t
r
m
S
A
w
C
p
m
a
i
2
a
fi
D
l
a
m
l
o
r
m
l
l
a
e
2
G. Bello-Orgaz et al. / Information Fusion 28 (2016) 45–59
Finally, and before the application of this paradigm, it is essential
to understand if the algorithms can be translated to mappers and re-
ducers or if the problem can be analysed using traditional strategies.
MapReduce provides an excellent technique to work with large sets
of data when the algorithm can work on small pieces of that dataset
in parallel, but if the algorithm cannot be mapped into this method-
ology, it may be “trying to use a sledgehammer to crack a nut”.
2.2. Apache Hadoop
Any MapReduce system (or framework) is based on a MapReduce
engine that allows for implementing the algorithms and distribut-
ing the parallel processes. Apache Hadoop [19] is an open-source
software framework written in Java for the distributed storage and
distributed processing of very large datasets using the MapReduce
paradigm. All of the modules in Hadoop have been designed taking
into account the assumption that hardware failures (of individual ma-
chines or of racks of machines) are commonplace and thus should be
automatically managed in the software by the framework. The core
of Apache Hadoop comprises a storage area, the Hadoop Distributed
File System (HDFS), and a processing area (MapReduce).
The HDFS (see Section 2.4.1) spreads multiple copies of the data
across different machines. This not only offers reliability without the
need for RAID-controlled disks but also allows for multiple locations
to run the mapping. If a machine with one copy of the data is busy
or offline, another machine can be used. A job scheduler (in Hadoop,
the JobTracker) keeps track of which MapReduce jobs are executing;
schedules individual maps; reduces intermediate merging operations
to specific machines; monitors the successes and failures of these in-
dividual tasks; and works to complete the entire batch job. The HDFS
and the job scheduler can be accessed by the processes and pro-
grams that need to read and write data and to submit and monitor
the MapReduce jobs. However, Hadoop presents a number of limita-
tions:
1. For maximum parallelism, you need the maps and reduces to
be stateless, to not depend on any data generated in the same
MapReduce job. You cannot control the order in which the maps
run or the reductions.
2. Hadoop is very inefficient (in both CPU time and power con-
sumed) if you are repeating similar searches repeatedly. A database
with an index will always be faster than running a MapReduce job
over un-indexed data. However, if that index needs to be regener-
ated whenever data are added, and data are being added continu-
ally, MapReduce jobs may have an edge.
3. In the Hadoop implementation, reduce operations do not take place
until all of the maps have been completed (or have failed and been
skipped). As a result, you do not receive any data back until the
entire mapping has finished.
4. There is a general assumption that the output of the reduce is
smaller than the input to the map. That is, you are taking a large
data source and generating smaller final values.
2.3. Apache Spark
Apache Spark [20] is an open-source cluster computing frame-
work that was originally developed in the AMPLab at University of
California, Berkeley. Spark had over 570 contributors in June 2015,
making it a very high-activity project in the Apache Software Founda-
tion and one of the most active big data open source projects. It pro-
vides high-level APIs in Java, Scala, Python, and R and an optimised
engine that supports general execution graphs. It also supports a rich
set of high-level tools including Spark SQL for SQL and structured data
processing, Spark MLlib for machine learning, GraphX for graph pro-
cessing, and Spark Streaming.
The Spark framework allows for reusing a working set of data
cross multiple parallel operations. This includes many iterative ma-
hine learning algorithms as well as interactive data analysis tools.
herefore, this framework supports these applications while retain-
ng the scalability and fault tolerance of MapReduce. To achieve these
oals, Spark introduces an abstraction called resilient distributed
atasets (RDDs). An RDD is a read-only collection of objects parti-
ioned across a set of machines that can be rebuilt if a partition is lost.
n contrast to Hadoops two-stage disk-based MapReduce paradigm
mappers/reducers), Sparks in-memory primitives provide perfor-
ance up to 100 times faster for certain applications by allowing
ser programs to load data into a clusters memory and to query it
epeatedly. One of the multiple interesting features of Spark is that
his framework is particularly well suited to machine learning algo-
ithms [[29]].
From a distributed computing perspective, Spark requires a cluster
anager and a distributed storage system. For cluster management,
park supports stand-alone (native Spark cluster), Hadoop YARN, and
pache Mesos. For distributed storage, Spark can interface with a
ide variety, including the Hadoop Distributed File System, Apache
assandra, OpenStack Swift, and Amazon S3. Spark also supports a
seudo-distributed local mode that is usually used only for develop-
ent or testing purposes, when distributed storage is not required
nd the local file system can be used instead; in this scenario, Spark
s running on a single machine with one executor per CPU core.
.4. Other MapReduce implementations and software
A list related to big data implementations and MapReduce-based
pplications was generated by Mostosi [30]. Although the author
nds that “It is [the list] still incomplete and always will be”, his “Big-
ata Ecosystem Table” [31] contains more than 600 references re-
ated to different big data technologies, frameworks, and applications
nd, to the best of this authors knowledge, is one of the best (and
ore exhaustive) lists related to available big data technologies. This
ist comprises 33 different topics related to big data, and a selection
f those technologies and applications were chosen. Those topics are
elated to: distributed programming, distributed files systems, a docu-
ent data model, a key-value data model, a graph data model, machine
earning, applications, business intelligence, and data analysis. This se-
ection attempts to reflect some of the recent popular frameworks
nd software implementations that are commonly used to develop
fficient MapReduce-based systems and applications.
.4.1. Distributed programming & distributed filesystems• Apache Pig. Pig provides an engine for executing data flows in
parallel on Hadoop. It includes a language, Pig Latin, for express-
ing these data flows. Pig Latin includes operators for many of the
traditional data operations (join, sort, filter, etc.), as well as the
ability for users to develop their own functions for reading, pro-
cessing, and writing data.• Apache Storm. Storm is a complex event processor and dis-
tributed computation framework written basically in the Clojure
programming language [32]. It is a distributed real-time compu-
tation system for rapidly processing large streams of data. Storm
is an architecture based on a master-workers paradigm, so that a
Storm cluster mainly consists of master and worker nodes, with
coordination done by Zookeeper [33].• Stratosphere [34]. Stratosphere is a general-purpose cluster com-
puting framework. It is compatible with the Hadoop ecosystem:,
accessing data stored in the HDFS and running with Hadoops new
cluster manager YARN. The common input formats of Hadoop are
supported as well. Stratosphere does not use Hadoops MapReduce
implementation; it is a completely new system that brings its own
runtime. The new runtime allows for defining more advanced op-
erations that include more transformations than only map and
2
2
2
3
m
s
s
e
l
l
b
n
f
f
3
t
n
49G. Bello-Orgaz et al. / Information Fusion 28 (2016) 45–59
reduce. Additionally, Stratosphere allows for expressing analysis
jobs using advanced data flow graphs, which are able to resemble
common data analysis task more naturally.• Apache HDFS. The most extended and popular distributed file
system for MapReduce frameworks and applications is the
Hadoop Distributed File System. The HDFS offers a way to store
large files across multiple machines. Hadoop and HDFS were de-
rived from the Google File System (GFS) [35].
.4.2. Document data model & graph data model• Apache Cassandra. Cassandra is a recent open source fork of a
stand-alone distributed non-SQL DBMS system that was initially
coded by Facebook, derived from what was known of the original
Google BigTable [36] and Google File System designs [35]. Cas-
sandra uses a system inspired by Amazons Dynamo for storing
data, and MapReduce can retrieve data from Cassandra. Cassan-
dra can run without the HDFS or on top of it (the DataStax fork of
Cassandra).• Apache Giraph. Giraph is an iterative graph processing system
built for high scalability. It is currently used at Facebook to analyse
the social graph formed by users and their connections. Giraph
was originated as the open-source counterpart to Pregel [37], the
graph processing framework developed at Google (see Section 3.1
for a further description).• MongoDB. MongoDB is an open-source document-oriented
database system and is part of the NoSQL family of database sys-
tems [38]. It provides high performance, high availability, and au-
tomatic scaling. Instead of storing data in tables as is done in
a classical relational database, MongoDB stores structured data
as JSON-like documents, which are data structures composed of
fields and value pairs. Its index system supports faster queries and
can include keys from embedded documents and arrays. More-
over, this database allows users to distribute data across a cluster
of machines.
.4.3. Machine learning• Apache Mahout [21]. The Mahout(TM) Machine Learning (ML) li-
brary is an Apache(TM) project whose main goal is to build scal-
able libraries that contain the implementation of a number of the
conventional ML algorithms (dimensionality reduction, classifi-
cation, clustering, and topic models, among others). In addition,
this library includes implementations for a set of recommender
systems (user-based and item-based strategies). The first ver-
sions of Mahout implemented the algorithms built on the Hadoop
framework, but recent versions include many new implemen-
tations built on the Mahout-Samsara environment, which runs
on Spark and H2O. The new Spark-item similarity implementa-
tions enable the next generation of co-occurrence recommenders
that can use entire user click streams and contexts in making
recommendations.• Spark MLlib [22]. MLlib is Sparks scalable machine learning li-
brary, which consists of common learning algorithms and utilities,
including classification, regression, clustering, collaborative filter-
ing, and dimensionality reduction, as well as underlying optimiza-
tion primitives. It supports writing applications in Java, Scala, or
Python and can run on any Hadoop2/YARN cluster with no pre-
installation. The first version of MLlib was developed at UC Berke-
ley by 11 contributors, and it provided a limited set of standard
machine learning methods. However, MLlib is currently experi-
encing dramatic growth, and it has over 140 contributors from
over 50 organisations.• MLBase [23]. The MLbase platform consists of three layers: ML
Optimizer, MLlib, and MLI. ML Optimizer (currently under develop-
ment) aims to automate the task of ML pipeline construction. The
optimizer solves a search problem over the feature extractors and
ML algorithms included in MLI and MLlib. MLI [24] is an experi-
mental API for feature extraction and algorithm development that
introduces high-level ML programming abstractions. A prototype
of MLI has been implemented against Spark and serves as a test
bed for MLlib. Finally, MLlib is Apache Sparks distributed ML li-
brary. MLlib was initially developed as part of the MLbase project,
and the library is currently supported by the Spark community.
.4.4. Applications & business intelligence & data analysis• Apache Nutch. Nutch is a highly extensible and scalable open
source web crawler software project, specifically, a search engine
based on Lucene (a Web crawler is an Internet bot that systemat-
ically browses the World Wide Web, usually for Web indexing). It
can process various document types (plain text, XML, OpenDocu-
ment, Word, Excel, Powerpoint, PDF, RTF, MP3) that are all parsed
by the Tika plugin. Currently, the project has two versions. Nutch
1.x is relying on Apache Hadoop data structures, which are ex-
cellent for batch processing. Nutch 2.x differs in the data storage,
which is performed using Apache Gora to manage persistent ob-
ject mappings. This allows for incorporating a flexible model/stack
to store everything (fetch time, status, content, parsed text, out-
links, inlinks, etc.) into a number of NoSQL storage solutions.• Apache Zeppelin. Zeppelin is a Web-based notebook that enables
interactive data analytics; it is an open source data analysis en-
vironment that runs on top of Apache Spark. Current languages
included in the Zeppelin interpreter are Scala, Python, SparkSQL,
Hive, Markdown, and Shell. Zeppelin can dynamically create some
input forms in your notebook and provides some basic charts to
show the results, and the notebook URL can be shared among
collaborators.• Pentaho. Pentaho is an open source data integration (Kettle) tool
that delivers powerful extraction, transformation, and loading
capabilities using a groundbreaking, metadata-driven approach.
It also provides analytics, reporting, visualisation, and a predic-
tive analytics framework that is directly designed to work with
Hadoop nodes. It provides data integration and analytic platforms
based on Hadoop in which datasets can be streamed, blended,
and then automatically published into one of the popular analytic
databases.• SparkR. There is an important number of R-based applications for
MapReduce and other big data applications. R [39] is a popular
and extremely powerful programming language for statistics and
data analysis. SparkR provides an R frontend for Spark. It allows
users to interactively run jobs from the R shell on a cluster, auto-
matically serializes the necessary variables to execute a function
on the cluster, and also allows for easy use of existing R packages.
. Social data analytic methods and algorithms
Social big data analytic can be seen as the set of algorithms and
ethods used to extract relevant knowledge from social media data
ources that could provide heterogeneous contents, with very large
ize, and constantly changing (stream or online data). This is inher-
ntly interdisciplinary and spans areas such as data mining, machine
earning, statistics, graph mining, information retrieval, and natural
anguage among others. This section provides a description of the
asic methods and algorithms related to network analytics, commu-
ity detection, text analysis, information diffusion, and information
usion, which are the areas currently used to analyse and process in-
ormation from social-based sources.
.1. Network analytics
Today, society lives in a connected world in which communica-
ion networks are intertwined with daily life. For example, social
etworks are one of the most important sources of social big data;

a
d
h
l
t
f
c
a
T
e
f
P
t
3
t
w
l
i
g
u
m
p
b
l
i
w
f
f
[
o
c
w
w
s
o
r
a
n
t
g
p
o
m
m
a
o
t
i
t
a
o
e
o
a
f
p
t
b
t
50 G. Bello-Orgaz et al. / Information Fusion 28 (2016) 45–59
specifically, Twitter generates over 400 million tweets every day [40].
In social networks, individuals interact with one another and provide
information on their preferences and relationships, and these net-
works have become important tools for collective intelligence extrac-
tion. These connected networks can be represented using graphs, and
network analytic methods [41] can be applied to them for extracting
useful knowledge.
Graphs are structures formed by a set of vertices (also called
nodes) and a set of edges, which are connections between pairs of
vertices. The information extracted from a social network can be
easily represented as a graph in which the vertices or nodes rep-
resent the users and the edges represent the relationships among
them (e.g., a re-tweet of a message or a favourite mark in Twitter). A
number of network metrics can be used to perform social analysis of
these networks. Usually, the importance, or influence, in a social net-
work is analysed through centrality measures. These measures have
high computational complexity in large-scale networks. To solve this
problem, focusing on a large-scale graph analysis, a second genera-
tion of frameworks based on the MapReduce paradigm has appeared,
including Hama, Giraph (based on Pregel), and GraphLab among
others [42].
Pregel [37] is a graph-parallel system based on the Bulk Syn-
chronous Parallel model (BSP) [43]. A BSP abstract computer can be
interpreted as a set of processors that can follow different threads
of computation in which each processor is equipped with fast local
memory and interconnected by a communication network. Accord-
ing to this, the platform based on this model comprises three major
components:
• Components capable of processing and/or local memory transac-
tions (i.e., processors).• A network that routes messages between pairs of these compo-
nents.• A hardware facility that allows for the synchronisation of all or a
subset of components.
Taking into account this model, a BSP algorithm is a sequence of
global supersteps that consists of three components:
1. Concurrent computation: Every participating processor may per-
form local asynchronous computations.
2. Communication: The processes exchange data from one processor
to another, facilitating remote data storage capabilities.
3. Barrier synchronisation: When a process reaches this point (the
barrier), it waits until all other processes have reached the same
barrier.
Hama [44] and Giraph are two distributed graph processing
frameworks on Hadoop that implement Pregel. The main difference
between the two frameworks is the matrix computation using the
MapReduce paradigm. Apache Giraph is an iterative graph process-
ing system in which the input is a graph composed of vertices and
directed edges. Computation proceeds as a sequence of iterations (su-
persteps). Initially, every vertex is active, and for each superstep, ev-
ery active vertex invokes the “Compute Method” that will implement
the graph algorithm that will be executed. This means that the algo-
rithms implemented using Giraph are vertex oriented. Apache Hama
does not only allow users to work with Pregel-like graph applica-
tions. This computing engine can also be used to perform compute-
intensive general scientific applications and machine learning algo-
rithms. Moreover, it currently supports YARN, which is the resource
management technology that lets multiple computing frameworks
run on the same Hadoop cluster using the same underlying stor-
age. Therefore, the same data could be analysed using MapReduce
or Spark.
In contrast, GraphLab is based on a different concept. Whereas
Pregel is a one-vertex-centric model, this framework uses vertex-
to-node mapping in which each vertex can access the state of
djacent vertices. In Pregel, the interval between two supersteps is
efined by the run time of the vertex with the largest neighbour-
ood. The GraphLab approach improves this splitting of vertices with
arge neighbourhoods across different machines and synchronises
hem.
Finally, Elser and Montresor [42] present a study of these data
rameworks and their application to graph algorithms. The k-core de-
omposition algorithm is adapted to each framework. The goal of this
lgorithm is to compute the centrality of each node in a given graph.
he results obtained confirm the improvement achieved in terms of
xecution time for these frameworks based on Hadoop. However,
rom a programming paradigm point of view, the authors recommend
regel-inspired frameworks (a vertex-centric framework), which is
he better fit for graph-related problems.
.2. Community detection algorithms
The community detection problem in complex networks has been
he subject of many studies in the field of data mining and social net-
ork analysis. The goal of the community detection problem is simi-
ar to the idea of graph partitioning in graph theory [45,46]. A cluster
n a graph can be easily mapped into a community. Despite the ambi-
uity of the community definition, numerous techniques have been
sed for detecting communities. Random walks, spectral clustering,
odularity maximization, and statistical mechanics have all been ap-
lied to detecting communities [46]. These algorithms are typically
ased on the topology information from the graph or network. Re-
ated to graph connectivity, each cluster should be connected; that
s, there should be multiple paths that connect each pair of vertices
ithin the cluster. It is generally accepted that a subset of vertices
orms a good cluster if the induced sub-graph is dense and there are
ew connections from the included vertices to the rest of the graph
47]. Considering both connectivity and density, a possible definition
f a graph cluster could be a connected component or a maximal
lique [48]. This is a sub-graph into which no vertex can be added
ithout losing the clique property.
One of the most well-known algorithms for community detection
as proposed by Girvan and Newman [49]. This method uses a new
imilarity measure called “edge betweenness” based on the number
f the shortest paths between all vertex pairs. The proposed algo-
ithm is based on identifying the edges that lie between communities
nd their successive removal, achieving the isolation of the commu-
ities. The main disadvantage of this algorithm is its high computa-
ional complexity with very large networks.
Modularity is the most used and best known quality measure for
raph clustering techniques, but its computation is an NP-complete
roblem. However, there are currently a number of algorithms based
n good approximations of modularity that are able to detect com-
unities in a reasonable time. The first greedy technique to maxi-
ize modularity was a method proposed by Newman [50]. This was
n agglomerative hierarchical clustering algorithm in which groups
f vertices were successively joined to form larger communities such
hat modularity increased after the merging. The update of the matrix
n the Newman algorithm involved a large number of useless opera-
ions owing to the sparseness of the adjacency matrix. However, the
lgorithm was improved by Clauset et al. [51], who used the matrix
f modularity variations to arrange for the algorithm to perform more
fficiently.
Despite the improvements to and modifications of the accuracy
f these greedy algorithms, they have poor performance when they
re compared against other techniques. For this reason, Newman re-
ormulated the modularity measure in terms of eigenvectors by re-
lacing the Laplacian matrix with the modularity matrix [52], called
he spectral optimization of modularity. This improvement must also
e applied in order to improve the results of other optimization
echniques [53,54].
g
l
e
Z
e
fi
a
N
b
p
c
n
n
b
p
m
w
a
p
m
p
p
o
p
i
i
a
e
3
s
m
u
t
p
l
t
m
p
r
m
f
f
t
i
t
r
d
t
m
a
c
[
a
t
s
c
p
d
e
v
a
i
c
p
t
t
c
h
c
i
g
m
m
d
t
a
c
g
a
c
i
s
t
h
o
i
k
t
fi
c
s
b
n
s
a
b
c
c
i
p
a
n
b
i
d
p
3
m
s
s
r
i
v
i
t
n
m
51G. Bello-Orgaz et al. / Information Fusion 28 (2016) 45–59
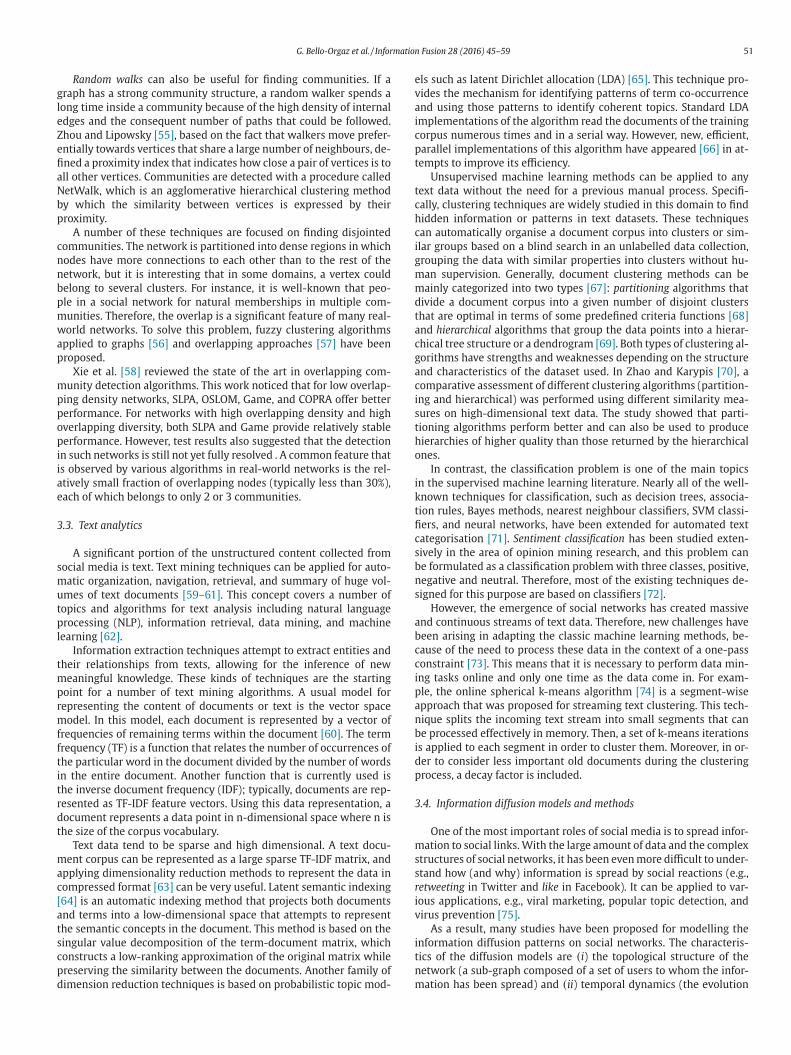
Random walks can also be useful for finding communities. If a
raph has a strong community structure, a random walker spends a
ong time inside a community because of the high density of internal
dges and the consequent number of paths that could be followed.
hou and Lipowsky [55], based on the fact that walkers move prefer-
ntially towards vertices that share a large number of neighbours, de-
ned a proximity index that indicates how close a pair of vertices is to
ll other vertices. Communities are detected with a procedure called
etWalk, which is an agglomerative hierarchical clustering method
y which the similarity between vertices is expressed by their
roximity.
A number of these techniques are focused on finding disjointed
ommunities. The network is partitioned into dense regions in which
odes have more connections to each other than to the rest of the
etwork, but it is interesting that in some domains, a vertex could
elong to several clusters. For instance, it is well-known that peo-
le in a social network for natural memberships in multiple com-
unities. Therefore, the overlap is a significant feature of many real-
orld networks. To solve this problem, fuzzy clustering algorithms
pplied to graphs [56] and overlapping approaches [57] have been
roposed.
Xie et al. [58] reviewed the state of the art in overlapping com-
unity detection algorithms. This work noticed that for low overlap-
ing density networks, SLPA, OSLOM, Game, and COPRA offer better
erformance. For networks with high overlapping density and high
verlapping diversity, both SLPA and Game provide relatively stable
erformance. However, test results also suggested that the detection
n such networks is still not yet fully resolved . A common feature that
s observed by various algorithms in real-world networks is the rel-
tively small fraction of overlapping nodes (typically less than 30%),
ach of which belongs to only 2 or 3 communities.
.3. Text analytics
A significant portion of the unstructured content collected from
ocial media is text. Text mining techniques can be applied for auto-
atic organization, navigation, retrieval, and summary of huge vol-
mes of text documents [59–61]. This concept covers a number of
opics and algorithms for text analysis including natural language
rocessing (NLP), information retrieval, data mining, and machine
earning [62].
Information extraction techniques attempt to extract entities and
heir relationships from texts, allowing for the inference of new
eaningful knowledge. These kinds of techniques are the starting
oint for a number of text mining algorithms. A usual model for
epresenting the content of documents or text is the vector space
odel. In this model, each document is represented by a vector of
requencies of remaining terms within the document [60]. The term
requency (TF) is a function that relates the number of occurrences of
he particular word in the document divided by the number of words
n the entire document. Another function that is currently used is
he inverse document frequency (IDF); typically, documents are rep-
esented as TF-IDF feature vectors. Using this data representation, a
ocument represents a data point in n-dimensional space where n is
he size of the corpus vocabulary.
Text data tend to be sparse and high dimensional. A text docu-
ent corpus can be represented as a large sparse TF-IDF matrix, and
pplying dimensionality reduction methods to represent the data in
ompressed format [63] can be very useful. Latent semantic indexing
64] is an automatic indexing method that projects both documents
nd terms into a low-dimensional space that attempts to represent
he semantic concepts in the document. This method is based on the
ingular value decomposition of the term-document matrix, which
onstructs a low-ranking approximation of the original matrix while
reserving the similarity between the documents. Another family of
imension reduction techniques is based on probabilistic topic mod-
ls such as latent Dirichlet allocation (LDA) [65]. This technique pro-
ides the mechanism for identifying patterns of term co-occurrence
nd using those patterns to identify coherent topics. Standard LDA
mplementations of the algorithm read the documents of the training
orpus numerous times and in a serial way. However, new, efficient,
arallel implementations of this algorithm have appeared [66] in at-
empts to improve its efficiency.
Unsupervised machine learning methods can be applied to any
ext data without the need for a previous manual process. Specifi-
ally, clustering techniques are widely studied in this domain to find
idden information or patterns in text datasets. These techniques
an automatically organise a document corpus into clusters or sim-
lar groups based on a blind search in an unlabelled data collection,
rouping the data with similar properties into clusters without hu-
an supervision. Generally, document clustering methods can be
ainly categorized into two types [67]: partitioning algorithms that
ivide a document corpus into a given number of disjoint clusters
hat are optimal in terms of some predefined criteria functions [68]
nd hierarchical algorithms that group the data points into a hierar-
hical tree structure or a dendrogram [69]. Both types of clustering al-
orithms have strengths and weaknesses depending on the structure
nd characteristics of the dataset used. In Zhao and Karypis [70], a
omparative assessment of different clustering algorithms (partition-
ng and hierarchical) was performed using different similarity mea-
ures on high-dimensional text data. The study showed that parti-
ioning algorithms perform better and can also be used to produce
ierarchies of higher quality than those returned by the hierarchical
nes.
In contrast, the classification problem is one of the main topics
n the supervised machine learning literature. Nearly all of the well-
nown techniques for classification, such as decision trees, associa-
ion rules, Bayes methods, nearest neighbour classifiers, SVM classi-
ers, and neural networks, have been extended for automated text
ategorisation [71]. Sentiment classification has been studied exten-
ively in the area of opinion mining research, and this problem can
e formulated as a classification problem with three classes, positive,
egative and neutral. Therefore, most of the existing techniques de-
igned for this purpose are based on classifiers [72].
However, the emergence of social networks has created massive
nd continuous streams of text data. Therefore, new challenges have
een arising in adapting the classic machine learning methods, be-
ause of the need to process these data in the context of a one-pass
onstraint [73]. This means that it is necessary to perform data min-
ng tasks online and only one time as the data come in. For exam-
le, the online spherical k-means algorithm [74] is a segment-wise
pproach that was proposed for streaming text clustering. This tech-
ique splits the incoming text stream into small segments that can
e processed effectively in memory. Then, a set of k-means iterations
s applied to each segment in order to cluster them. Moreover, in or-
er to consider less important old documents during the clustering
rocess, a decay factor is included.
.4. Information diffusion models and methods
One of the most important roles of social media is to spread infor-
ation to social links. With the large amount of data and the complex
tructures of social networks, it has been even more difficult to under-
tand how (and why) information is spread by social reactions (e.g.,
etweeting in Twitter and like in Facebook). It can be applied to var-
ous applications, e.g., viral marketing, popular topic detection, and
irus prevention [75].
As a result, many studies have been proposed for modelling the
nformation diffusion patterns on social networks. The characteris-
ics of the diffusion models are (i) the topological structure of the
etwork (a sub-graph composed of a set of users to whom the infor-
ation has been spread) and (ii) temporal dynamics (the evolution
4
s
p
I
n
i
n
i
e
m
p
g
n
4
c
t
t
c
e
f
fi
a
y
c
t
t
f
h
t
t
a
v
t
J
52 G. Bello-Orgaz et al. / Information Fusion 28 (2016) 45–59
of the number of users whom the information has reached over time)
[76].
According to the analytics, these diffusion models can be catego-
rized into explanatory and predictive approaches [77].
• Explanatory models: The aim of these models is to discover the
hidden spreading cascades once the activation sequences are col-
lected. These models can build a path that can help users to easily
understand how the information has been diffused. The NETINT
method [78] has applied sub-modular, function-based iterative
optimisation to discover the spreading cascade (path) that max-
imises the likelihood of the collected dataset. In particular, for
working with missing data, a k-tree model [79] has been proposed
to estimate the complete activation sequences.• Predictive models: These are based on learning processes with the
observed diffusion patterns. Depending on the previous diffu-
sion patterns, there are two main categories of predictive mod-
els: (i) structure-based models (graph-based approaches) and (ii)
content-analysis-based models (non-graph-based approaches).
Moreover, there are more existing approaches to understanding
information diffusion patterns. The projected greedy approach for
non-sub-modular problems [80] was recently proposed to populate
the useful seeds in social networks. This approach can identify the
partial optimisation for understanding the information diffusion. Ad-
ditionally, an evolutionary dynamics model was presented in [[81],
[82]] that attempted to understand the temporal dynamics of infor-
mation diffusion over time.
One of the relevant topics for analysing information diffusion pat-
terns and models is the concept of time and how it can be represented
and managed. One of the popular approaches is based on time series.
Any time series can be defined as a chronological collection of ob-
servations or events. The main characteristics of this type of data are
large size, high dimensionality, and continuous change. In the con-
text of data mining, the main problem is how to represent the data.
An effective mechanism for compressing the vast amount of time se-
ries data is needed in the context of information diffusion. Based on
this representation, different data mining techniques can be applied
such as pattern discovery, classification, rule discovery, and summari-
sation [83]. In Lin et al. [84], a new symbolic representation of time
series is proposed that allows for a dimensionality/numerosity reduc-
tion. This representation is tested using different classic data mining
tasks such as clustering, classification, query by content, and anomaly
detection.
Based on the mathematical models mentioned above, we need to
compare a number of various applications that can support users in
many different domains. One of the most promising applications is
detecting meaningful social events and popular topics in society. Such
meaningful events and topics can be discovered by well-known text
processing schemes (e.g., TF-IDF) and simple statistical approaches
(e.g., LDA, Gibbs sampling, and the TSTE method [85]). In particular,
not only the time domain but also the frequency domain have been
exploited to identify the most frequent events [86].
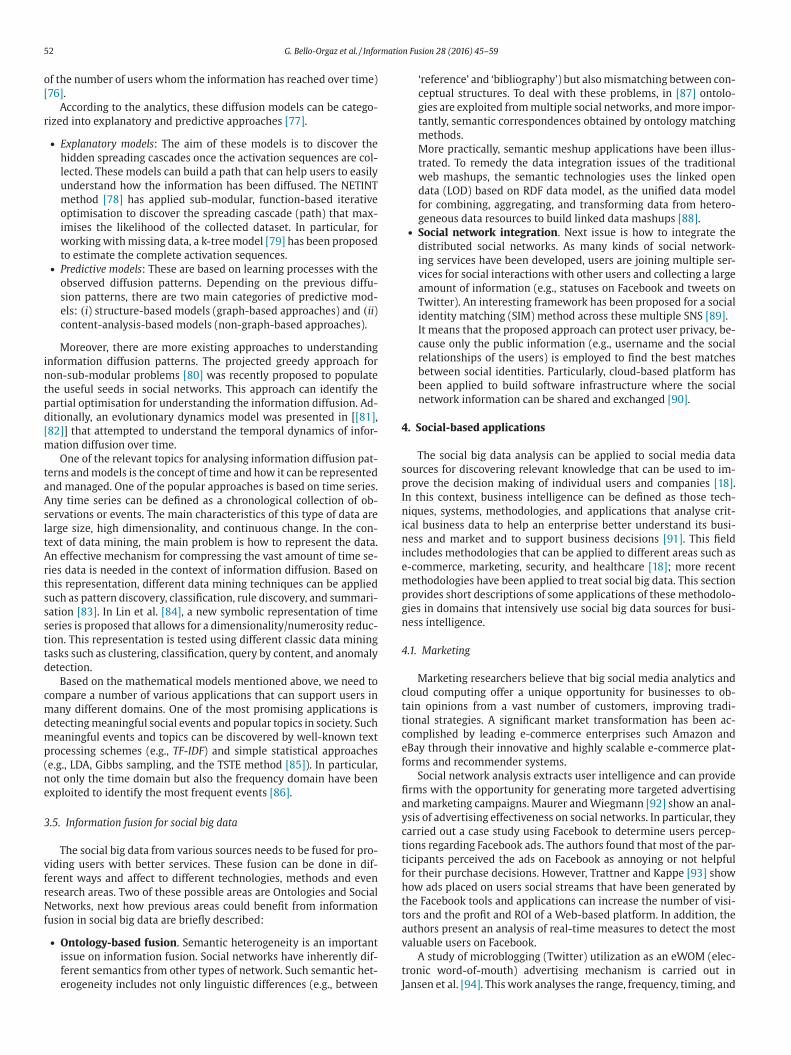
3.5. Information fusion for social big data
The social big data from various sources needs to be fused for pro-
viding users with better services. These fusion can be done in dif-
ferent ways and affect to different technologies, methods and even
research areas. Two of these possible areas are Ontologies and Social
Networks, next how previous areas could benefit from information
fusion in social big data are briefly described:
• Ontology-based fusion. Semantic heterogeneity is an important
issue on information fusion. Social networks have inherently dif-
ferent semantics from other types of network. Such semantic het-
erogeneity includes not only linguistic differences (e.g., between
‘reference’ and ‘bibliography’) but also mismatching between con-
ceptual structures. To deal with these problems, in [87] ontolo-
gies are exploited from multiple social networks, and more impor-
tantly, semantic correspondences obtained by ontology matching
methods.
More practically, semantic meshup applications have been illus-
trated. To remedy the data integration issues of the traditional
web mashups, the semantic technologies uses the linked open
data (LOD) based on RDF data model, as the unified data model
for combining, aggregating, and transforming data from hetero-
geneous data resources to build linked data mashups [88].• Social network integration. Next issue is how to integrate the
distributed social networks. As many kinds of social network-
ing services have been developed, users are joining multiple ser-
vices for social interactions with other users and collecting a large
amount of information (e.g., statuses on Facebook and tweets on
Twitter). An interesting framework has been proposed for a social
identity matching (SIM) method across these multiple SNS [89].
It means that the proposed approach can protect user privacy, be-
cause only the public information (e.g., username and the social
relationships of the users) is employed to find the best matches
between social identities. Particularly, cloud-based platform has
been applied to build software infrastructure where the social
network information can be shared and exchanged [90].
. Social-based applications
The social big data analysis can be applied to social media data
ources for discovering relevant knowledge that can be used to im-
rove the decision making of individual users and companies [18].
n this context, business intelligence can be defined as those tech-
iques, systems, methodologies, and applications that analyse crit-
cal business data to help an enterprise better understand its busi-
ess and market and to support business decisions [91]. This field
ncludes methodologies that can be applied to different areas such as
-commerce, marketing, security, and healthcare [18]; more recent
ethodologies have been applied to treat social big data. This section
rovides short descriptions of some applications of these methodolo-
ies in domains that intensively use social big data sources for busi-
ess intelligence.
.1. Marketing
Marketing researchers believe that big social media analytics and
loud computing offer a unique opportunity for businesses to ob-
ain opinions from a vast number of customers, improving tradi-
ional strategies. A significant market transformation has been ac-
omplished by leading e-commerce enterprises such Amazon and
Bay through their innovative and highly scalable e-commerce plat-
orms and recommender systems.
Social network analysis extracts user intelligence and can provide
rms with the opportunity for generating more targeted advertising
nd marketing campaigns. Maurer and Wiegmann [92] show an anal-
sis of advertising effectiveness on social networks. In particular, they
arried out a case study using Facebook to determine users percep-
ions regarding Facebook ads. The authors found that most of the par-
icipants perceived the ads on Facebook as annoying or not helpful
or their purchase decisions. However, Trattner and Kappe [93] show
ow ads placed on users social streams that have been generated by
he Facebook tools and applications can increase the number of visi-
ors and the profit and ROI of a Web-based platform. In addition, the
uthors present an analysis of real-time measures to detect the most
aluable users on Facebook.
A study of microblogging (Twitter) utilization as an eWOM (elec-
ronic word-of-mouth) advertising mechanism is carried out in
ansen et al. [94]. This work analyses the range, frequency, timing, and

Table 1
Basic features related to social big data applications in marketing area.
Authors Ref. num. Summary Methods
Trattner and Kappe [93] Targeted advertising on Facebook Real-time measures to detect the most valuable users
Jansen et al. [94] Twitter as eWOM advertising mechanism Sentiment analysis
Asur et al. [95] Using Twitter to forecast box-office revenues for movies Topics detection, sentiment analysis
Ma et al. [96] Viral marketing in social networks Social network analysis, information diffusion models
c
s
c
T
t
a
a
i
a
p
s
T
t
b
u
s
k
p
p
w
s
m
t
a
t
p
n
a
s
4
b
b
i
t
a
a
e
i
o
t
w
t
d
s
K
t
o
t
p
t
t
d
w
t
n
l
g
d
u
c
t
a
s
f
e
c
t
g
p
m
t
e
t
t
a
t
a
o
f
t
m
t
t
a
a
a
e
n
u
t
c
c
s
a
t
t
r
i
i
a
p
d
f
o
a
m
53G. Bello-Orgaz et al. / Information Fusion 28 (2016) 45–59
ontent of tweets in various corporate accounts. The results obtained
how that 19% of microblogs mention a brand. Of the branding mi-
roblogs, nearly 20% contained some expression of brand sentiments.
herefore, the authors conclude that microblogging reports what cus-
omers really feel about the brand and its competitors in real time,
nd it is a potential advantage to explore it as part of companies over-
ll marketing strategies. Customers brand perceptions and purchas-
ng decisions are increasingly influenced by social media services,
nd these offer new opportunities to build brand relationships with
otential customers. Another approach that uses Twitter data is pre-
ented in Asur et al. [95] to forecast box-office revenues for movies.
he authors show how a simple model built from the rate at which
weets are created about particular topics can outperform market-
ased predictors. Moreover, the sentiment extraction from Twitter is
sed to improve the forecasting power of social media.
Because of the exponential growth use of social networks, re-
earchers are actively attempting to model the dynamics of viral mar-
eting based on the information diffusion process. Ma et al. [96]
roposed modelling social network marketing using heat diffusion
rocesses. Heat diffusion is a physical phenomenon related to heat,
hich always flows from a position with higher temperature to a po-
ition with lower temperature. The authors present three diffusion
odels along with three algorithms for selecting the best individuals
o receive marketing samples. These models can diffuse both positive
nd negative comments on products or brands in order to simulate
he real opinions within social networks. Moreover, the authors com-
lexity analysis shows that the model is also scalable to large social
etworks. Table 1 shows a brief summary of the previously described
pplications, including the basic functionalities for each and their ba-
ic methods.
.2. Crime analysis
Criminals tend to have repetitive pattern behaviours, and these
ehaviours are dependent upon situational factors. That is, crime will
e concentrated in environments with features that facilitate crim-
nal activities [97]. The purpose of crime data analysis is to identify
hese crime patterns, allowing for detecting and discovering crimes
nd their relationships with criminals. The knowledge extracted from
pplying data mining techniques can be very useful in supporting law
nforcement agencies.
Communication between citizens and government agencies
s mostly through telephones, face-to-face meetings, email, and
ther digital forms. Most of these communications are saved or
ransformed into written text and then archived in a digital format,
hich has led to opportunities for automatic text analysis using NLP
echniques to improve the effectiveness of law enforcement [98]. A
ecision support system that combines the use of NLP techniques,
imilarity measures, and classification approaches is proposed by
u and Leroy [99] to automate and facilitate crime analysis. Fil-
ering reports and identifying those that are related to the same
r similar crimes can provide useful information to analyse crime
rends, which allows for apprehending suspects and improving crime
revention.
Traditional crime data analysis techniques are typically designed
o handle one particular type of dataset and often overlook geospa-
ial distribution. Geographic knowledge discovery can be used to
iscover patterns of criminal behaviour that may help in detecting
here, when, and why particular crimes are likely to occur. Based on
his concept, Phillips and lee [100] present a crime data analysis tech-
ique that allows for discovering co-distribution patterns between
arge, aggregated and heterogeneous datasets. In this approach, ag-
regated datasets are modelled as graphs that store the geospatial
istribution of crime within given regions, and then these graphs are
sed to discover datasets that show similar geospatial distribution
haracteristics. The experimental results obtained in this work show
hat it is possible to discover geospatial co-distribution relationships
mong crime incidents and socio-economic, socio-demographic and
patial features.
Another analytical technique that is now in high use by law en-
orcement agencies to visually identify where crime tends to be high-
st is the hotspot mapping. This technique is used to predict where
rime may happen, using data from the past to inform future ac-
ions. Each crime event is represented as a point, allowing for the
eographic distribution analysis of these points. A number of map-
ing techniques can be used to identify crime hotspots, such as: point
apping, thematic mapping of geographic areas, spatial ellipses, grid
hematic mapping, and kernel density estimation (KDE), among oth-
rs. Chainey et al. [101] conducted a comparative assessment of
hese techniques, and the results obtained showed that KDE was the
echnique that consistently outperformed the others. Moreover, the
uthors offered a benchmark to compare with the results of other
echniques and other crime types, including comparisons between
dvanced spatial analysis techniques and prediction mapping meth-
ds. Another novel approach using spatio-temporally tagged tweets
or crime prediction is presented by Gerber [102]. This work shows
he use of Twitter, applying a linguistic analysis and statistical topic
odelling to automatically identify discussion topics across a city in
he United States. The experimental results showed that adding Twit-
er data improved crime prediction performance versus a standard
pproach based on KDE.
Finally, the use of data mining in fraud detection is very popular,
nd there are numerous studies on this area. ATM phone scams
re one well-known type of fraud. Kirkos et al. [103] analysed the
ffectiveness of data mining classification techniques (decision trees,
eural networks and Bayesian belief networks) for identifying fraud-
lent financial statements, and the experimental results concluded
hat Bayesian belief networks provided higher accuracy for fraud
lassification. Another approach to detecting fraud in real-time credit
ard transactions was presented by Quah and Sriganesh [104]. The
ystem these authors proposed uses a self-organization map to filter
nd analyse customer behaviour to detect fraud. The main idea is
o detect the patterns of the legal cardholder and of the fraudulent
ransactions through neural network learning and then to develop
ules for these two different behaviours. One typical fraud in this area
s the ATM phone scams that attempts to transfer a victims money
nto fraudulent accounts. In order to identify the signs of fraudulent
ccounts and the patterns of fraudulent transactions, Li et al. [105] ap-
lied Bayesian classification and association rules. Detection rules are
eveloped based on the identified signs and applied to the design of a
raudulent account detection system. Table 2 shows a brief summary
f all of the applications that were previously mentioned, providing
description of the basic functionalities of each and their main
ethods.
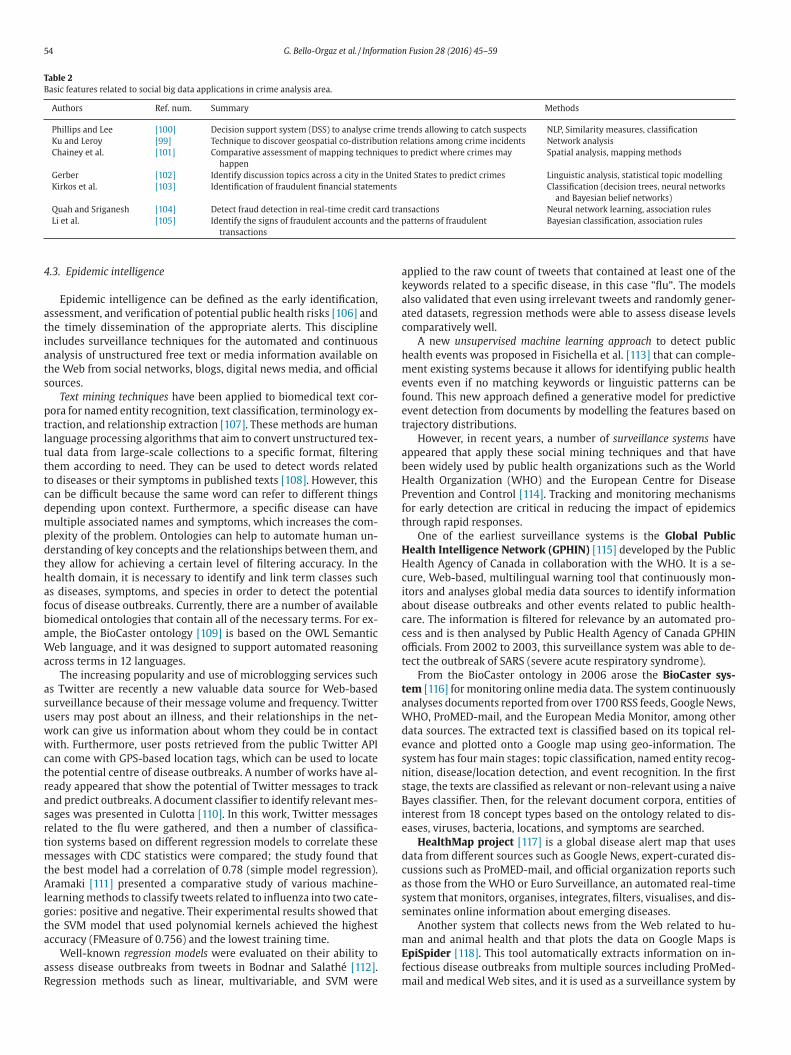
Table 2
Basic features related to social big data applications in crime analysis area.
Authors Ref. num. Summary Methods
Phillips and Lee [100] Decision support system (DSS) to analyse crime trends allowing to catch suspects NLP, Similarity measures, classification
Ku and Leroy [99] Technique to discover geospatial co-distribution relations among crime incidents Network analysis
Chainey et al. [101] Comparative assessment of mapping techniques to predict where crimes may
happen
Spatial analysis, mapping methods
Gerber [102] Identify discussion topics across a city in the United States to predict crimes Linguistic analysis, statistical topic modelling
Kirkos et al. [103] Identification of fraudulent financial statements Classification (decision trees, neural networks
and Bayesian belief networks)
Quah and Sriganesh [104] Detect fraud detection in real-time credit card transactions Neural network learning, association rules
Li et al. [105] Identify the signs of fraudulent accounts and the patterns of fraudulent
transactions
Bayesian classification, association rules
a
k
a
a
c
h
m
e
f
e
t
a
b
H
P
f
t
H
H
c
i
a
c
c
o
t
t
a
W
d
e
s
n
s
B
i
e
d
c
a
s
s
m
E
f
m
54 G. Bello-Orgaz et al. / Information Fusion 28 (2016) 45–59
4.3. Epidemic intelligence
Epidemic intelligence can be defined as the early identification,
assessment, and verification of potential public health risks [106] and
the timely dissemination of the appropriate alerts. This discipline
includes surveillance techniques for the automated and continuous
analysis of unstructured free text or media information available on
the Web from social networks, blogs, digital news media, and official
sources.
Text mining techniques have been applied to biomedical text cor-
pora for named entity recognition, text classification, terminology ex-
traction, and relationship extraction [107]. These methods are human
language processing algorithms that aim to convert unstructured tex-
tual data from large-scale collections to a specific format, filtering
them according to need. They can be used to detect words related
to diseases or their symptoms in published texts [108]. However, this
can be difficult because the same word can refer to different things
depending upon context. Furthermore, a specific disease can have
multiple associated names and symptoms, which increases the com-
plexity of the problem. Ontologies can help to automate human un-
derstanding of key concepts and the relationships between them, and
they allow for achieving a certain level of filtering accuracy. In the
health domain, it is necessary to identify and link term classes such
as diseases, symptoms, and species in order to detect the potential
focus of disease outbreaks. Currently, there are a number of available
biomedical ontologies that contain all of the necessary terms. For ex-
ample, the BioCaster ontology [109] is based on the OWL Semantic
Web language, and it was designed to support automated reasoning
across terms in 12 languages.
The increasing popularity and use of microblogging services such
as Twitter are recently a new valuable data source for Web-based
surveillance because of their message volume and frequency. Twitter
users may post about an illness, and their relationships in the net-
work can give us information about whom they could be in contact
with. Furthermore, user posts retrieved from the public Twitter API
can come with GPS-based location tags, which can be used to locate
the potential centre of disease outbreaks. A number of works have al-
ready appeared that show the potential of Twitter messages to track
and predict outbreaks. A document classifier to identify relevant mes-
sages was presented in Culotta [110]. In this work, Twitter messages
related to the flu were gathered, and then a number of classifica-
tion systems based on different regression models to correlate these
messages with CDC statistics were compared; the study found that
the best model had a correlation of 0.78 (simple model regression).
Aramaki [111] presented a comparative study of various machine-
learning methods to classify tweets related to influenza into two cate-
gories: positive and negative. Their experimental results showed that
the SVM model that used polynomial kernels achieved the highest
accuracy (FMeasure of 0.756) and the lowest training time.
Well-known regression models were evaluated on their ability to
assess disease outbreaks from tweets in Bodnar and Salathé [112].
Regression methods such as linear, multivariable, and SVM were
pplied to the raw count of tweets that contained at least one of the
eywords related to a specific disease, in this case ”flu”. The models
lso validated that even using irrelevant tweets and randomly gener-
ted datasets, regression methods were able to assess disease levels
omparatively well.
A new unsupervised machine learning approach to detect public
ealth events was proposed in Fisichella et al. [113] that can comple-
ent existing systems because it allows for identifying public health
vents even if no matching keywords or linguistic patterns can be
ound. This new approach defined a generative model for predictive
vent detection from documents by modelling the features based on
rajectory distributions.
However, in recent years, a number of surveillance systems have
ppeared that apply these social mining techniques and that have
een widely used by public health organizations such as the World
ealth Organization (WHO) and the European Centre for Disease
revention and Control [114]. Tracking and monitoring mechanisms
or early detection are critical in reducing the impact of epidemics
hrough rapid responses.
One of the earliest surveillance systems is the Global Public
ealth Intelligence Network (GPHIN) [115] developed by the Public
ealth Agency of Canada in collaboration with the WHO. It is a se-
ure, Web-based, multilingual warning tool that continuously mon-
tors and analyses global media data sources to identify information
bout disease outbreaks and other events related to public health-
are. The information is filtered for relevance by an automated pro-
ess and is then analysed by Public Health Agency of Canada GPHIN
fficials. From 2002 to 2003, this surveillance system was able to de-
ect the outbreak of SARS (severe acute respiratory syndrome).
From the BioCaster ontology in 2006 arose the BioCaster sys-
em [116] for monitoring online media data. The system continuously
nalyses documents reported from over 1700 RSS feeds, Google News,
HO, ProMED-mail, and the European Media Monitor, among other
ata sources. The extracted text is classified based on its topical rel-
vance and plotted onto a Google map using geo-information. The
ystem has four main stages: topic classification, named entity recog-
ition, disease/location detection, and event recognition. In the first
tage, the texts are classified as relevant or non-relevant using a naive
ayes classifier. Then, for the relevant document corpora, entities of
nterest from 18 concept types based on the ontology related to dis-
ases, viruses, bacteria, locations, and symptoms are searched.
HealthMap project [117] is a global disease alert map that uses
ata from different sources such as Google News, expert-curated dis-
ussions such as ProMED-mail, and official organization reports such
s those from the WHO or Euro Surveillance, an automated real-time
ystem that monitors, organises, integrates, filters, visualises, and dis-
eminates online information about emerging diseases.
Another system that collects news from the Web related to hu-
an and animal health and that plots the data on Google Maps is
piSpider [118]. This tool automatically extracts information on in-
ectious disease outbreaks from multiple sources including ProMed-
ail and medical Web sites, and it is used as a surveillance system by

Table 3
Basic features related to social big data applications in health care area.
Authors Ref. num. Summary Methods
Culotta [110] Track and predict outbreak detection using Twitter Classification (regression models)
Aramaki et al. [111] Classify tweets related to influenza Classification
Bodnar and Salathé [112] Assess disease outbreaks from tweets Regression methods
Fisichella et al. [113] Detect public health events Modelling trajectory distributions
GPHIN [115] Identify information about disease outbreaks and other events related to
public healthcare
Classification documents for relevance
BioCaster [116] Monitoring online media data related to diseases, viruses, bacteria, locations
and symptoms
Topic classification, named entity recognition,
event recognition
HealthMap [117] Global disease alert map Mapping techniques
EpiSpider [118] Human and animal disease alert map Topic and location detection
Table 4
Basic features related to social big data applications in user experiences-based visualisation.
Authors Ref. num. Summary Methods
GGobi [123] Visualisation program for exploring high-dimensional data Supervised Classification, Unsupervised Classification, Inference
MIMO [124] Visualisation Framework for Real Time Decision Making in a Multi-Input
Multi-Output System
Bayesian causal network, Decision Making Tools
Insense [126] Collecting user experiences into a continually growing and adapting
multimedia diary.
Classification of patterns in sensor readings from a camera,
microphone, and accelerometers
Many Eyes [127] Creating visualisations in collaborative environment from upload data sets Visualisation layout algorithms
TweetPulse [128] Building social pulse by aggregating identical user experiences Visualising temporal dynamics of the thematic events
p
r
v
f
t
t
l
H
a
i
t
t
a
4
e
c
f
c
b
c
[
a
s
a
u
i
a
d
S
M
e
(
e
s
a
l
s
p
g
o
u
u
a
c
s
b
l
v
a
a
n
a
t
l
c
t
s
a
5
a
a
p
t
k
a
T
a
a
d
t
55G. Bello-Orgaz et al. / Information Fusion 28 (2016) 45–59
ublic healthcare organizations, a number of universities, and health
esearch organizations. Additionally, this system automatically con-
erts the topic and location information from the reports into RSS
eeds.
Finally, Lyon et al. [119] conducted a comparative assessment of
hese three systems (BioCaster, EpiSpider, and HealthMap) related to
heir ability to gather and analyse information that is relevant to pub-
ic health. EpiSpider obtained more relevant documents in this study.
owever, depending on the language of each system, the ability to
cquire relevant information from different countries differed signif-
cantly. For instance, Biocaster gives special priority to languages from
he Asia-Pacific region, and EpiSpider only considers documents writ-
en in English. Table 3 shows a summary of the previous applications
nd their related functionalities and methods.
.4. User experiences-based visualisation
Big data from social media needs to be visualised for better user
xperiences and services. For example, the large volume of numeri-
al data (usually in tabular form) can be transformed into different
ormats. Consequently, user understandability can be increased. The
apability of supporting timely decisions based on visualising such
ig data is essential to various domains, e.g., business success, clini-
al treatments, cyber and national security, and disaster management
120]. Thus, user-experience-based visualisation has been regarded
s important for supporting decision makers in making better deci-
ions. More particularly, visualisation is also regarded as a crucial data
nalytic tool for social media [121]. It is important for understanding
sers needs in social networking services.
There have been many visualisation approaches to collecting (and
mproving) user experiences. One of the most well-known is inter-
ctive data analytics. Based on a set of features of the given big
ata, users can interact with the visualisation-based analytics system.
uch systems are R-based software packages [122] and GGobi [123].
oreover, some systems have been developed using statistical infer-
nces. A Bayesian inference scheme-based multi-input/multi-output
MIMO) system [124] has been developed for better visualisation.
We can also consider life-logging services that record all user
xperiences [125], which is also known as quantify-self. Various sen-
ors can capture continuous physiological data (e.g., mood, arousal,
nd blood oxygen levels) together with user activities. In this context,
ife caching has been presented as a collaborative social action of
toring and sharing users life events in an open environment. More
ractically, this collaborative user experience has been applied to
aming to encourage users. Systems such as Insense [126] are based
n wearable devices and can collect users experiences into a contin-
ally growing and adapting multimedia diary. The inSense system
ses the patterns in sensor readings from a camera, a microphone,
nd accelerometers to classify the users activities and automati-
ally collect multimedia clips when the user is in an interesting
ituation.
Moreover, visualisation systems such as Many Eyes [127] have
een designed to upload datasets and create visualisations in col-
aborative environments, allowing users to upload data, create
isualisation of that data, and leave comments on both the visu-
lisation and the data, providing a medium to foment discussion
mong users. Many Eyes is designed for ordinary people and does
ot require any extensive training or prior knowledge to take full
dvantage of its functionalities.
Other visual analytics tools have shown some graphical visualisa-
ions for supporting efficient analytics of the given big data. Particu-
arly, TweetPulse [128] has built social pulses by aggregating identi-
al user experiences in social networks (e.g., Twitter), and visualised
emporal dynamics of the thematic events. Finally, Table 4 provides a
ummary of those applications related to the methods used for visu-
lisation based on user experiences.
. Conclusions and open problems
With the large number and rapid growth of social media systems
nd applications, social big data has become an important topic in
broad array of research areas. The aim of this study has been to
rovide a holistic view and insights for potentially helping to find
he most relevant solutions that are currently available for managing
nowledge in social media.
As such, we have investigated the state-of-the-art technologies
nd applications for processing the big data from social media.
hese technologies and applications were discussed in the following
spects: (i) What are the main methodologies and technologies that
re available for gathering, storing, processing, and analysing big
ata from social media? (ii) How does one analyse social big data
o discover meaningful patterns? and (iii) How can these patterns
g
d
m
v
K
M
g
v
a
5
i
w
f
r
n
A
m
p
T
D
F
(
R
56 G. Bello-Orgaz et al. / Information Fusion 28 (2016) 45–59
be exploited as smart, useful user services through the currently
deployed examples in social-based applications?
More practically, this survey paper shows and describes a num-
ber of existing systems (e.g., frameworks, libraries, software applica-
tions) that have been developed and that are currently being used
in various domains and applications based on social media. The pa-
per has avoided describing or analysing those straightforward appli-
cations such as Facebook and Twitter that currently intensively use
big data technologies, instead focusing on other applications (such as
those related to marketing, crime analysis, or epidemic intelligence)
that could be of interest to potential readers.
Although it is extremely difficult to predict which of the different
issues studied in this work will be the next “trending topic” in social
big data research, from among all of the problems and topics that are
currently under study in different areas, we selected some ”open top-
ics” related to privacy issues, streaming and online algorithms, and
data fusion visualisation, providing some insights and possible future
trends.
5.1. Privacy issues
In the era of online big data and social media, protecting the pri-
vacy of the users on social media has been regarded as an impor-
tant issue. Ironically, as the analytics introduced in this paper become
more advanced, the risk of privacy leakage is growing.
As such, many privacy-preserving studies have been proposed to
address privacy-related issues. We can note that there are two main
well-known approaches. The first one is to exploit “k-anonymity”,
which is a property possessed by certain anonymised data [129].
Given the private data and a set of specific fields, the system (or ser-
vice) has to make the data practically useful without identifying the
individuals who are the subjects of the data. The second approach is
“differential privacy”, which can provide an efficient way to maximise
the accuracy of queries from statistical databases while minimising
the chances of identifying its records [130].
However, there are still open issues related to privacy. Social iden-
tification is the important issue when social data are merged from
available sources, and secure data communication and graph match-
ing are potential research areas [89]. The second issue is evaluation. It
is not easy to evaluate and test privacy-preserving services with real
data. Therefore, it would be particularly interesting in the future to
consider how to build useful benchmark datasets for evaluation.
Moreover, we have to consider this data privacy issues in many
other research areas. In the context of law (also, international law)
enforcement, data privacy must be prevented from any illegal usages,
whereas governments tend to trump the user privacy for the purpose
of national securities.
Also, developing educational program for technicians (also, stu-
dents) is important [131]. It is still open issue on how (and what) to
design the curriculum for the data privacy.
5.2. Streaming and online algorithms
One of the current main challenges in data mining related to
big data problems is to find adequate approaches to analysing mas-
sive amounts of online data (or data streams). Because classifica-
tion methods require previous labelling, these methods also require
great effort for real-time analysis. However, because unsupervised
techniques do not need this previous process, clustering has become
a promising field for real-time analysis, especially when these data
come from social media sources. When data streams are analysed, it
is important to consider the analysis goal in order to determine the
best type of algorithm to be used. We were able to divide data stream
analysis into two main categories:
• Offline analysis: We consider a portion of data (usually large data)
and apply an offline clustering algorithm to analyse the data.
• Online analysis: The data are analysed in real time. These kinds of
algorithms are constantly receiving new data and are not usually
able to keep past information.
A new generation of online [132,133] and streaming [134,135] al-
orithms is currently being developed in order to manage social big
ata challenges, and these algorithms require high scalability in both
emory consumption [136] and time computation. Some new de-
elopments related to traditional clustering algorithms, such as the
-mean [137], EM [138], which has been modified to work with the
apReduce paradigm, and more sophisticated approaches based on
raph computing (such as spectral clustering), are currently being de-
eloped [139–141] into more efficient versions from the state-of-the-
rt algorithms [142,143].
.3. Methods for data fusion & data visualisation
Finally, data fusion and data visualisation are two clear challenges
n social big data. Although both areas have been intensively studied
ith regard to large, distributed, heterogeneous, and streaming data
usion [144] and data visualisation and analysis [145], the current,
apid evolution of social media sources jointly with big data tech-
ologies creates some particularly interesting challenges related to:
• Obtaining more reliable methods for fusing the multiple features
of multimedia objects for social media applications [146].• Studying the dynamics of individual and group behaviour, char-
acterising patterns of information diffusion, and identifying influ-
ential individuals in social networks and other social media-based
applications [147].• Identifying events [148] in social media documents via clustering
and using similarity metric learning approaches to produce high-
quality clustering results [149].• The open problems and challenges related to visual analytics
[145], especially related to the capacity to collect and store new
data, are rapidly increasing in number, including the ability to
analyse these data volumes[150], to record data about the move-
ment of people and objects at a large scale [151], and to analyse
spatio-temporal data and solve spatio-temporal problems in so-
cial media [152], among others.
cknowledgements
This work has been supported by several research grants: Co-
unidad Autónoma de Madrid under CIBERDINE S2013/ICE-3095
roject; Spanish Ministry of Science and Education under grant
IN2014-56494-C4-4-P; Savier Open Innovation Project (Airbus
efence & Space, FUAM-076915), and by the National Research
oundation of Korea (NRF) grant funded by the Korea government
MSIP): (NRF-2013K2A1A2055213, NRF-2014R1A 2A2A05007154).
eferences
[1] IBM, Big Data and Analytics, 2015. URL http://www-01.ibm.com/software/data/bigdata/what-is-big-data.html
[2] Infographic, The Data Explosion in 2014 Minute by Minute, 2015. URLhttp://aci.info/2014/07/12/the-data-explosion-in-2014-minute-by-minute-
infographic
[3] X. Wu, X. Zhu, G.-Q. Wu, W. Ding, Data mining with big data, IEEE Trans. Knowl.Data Eng. 26 (1) (2014) 97–107.
[4] A. Cuzzocrea, I.-Y. Song, K.C. Davis, Analytics over large-scale multidimensionaldata: the big data revolution!, in: Proceedings of the ACM 14th International
Workshop on Data Warehousing and OLAP, ACM, 2011, pp. 101–104.[5] D. Laney, 3D Data Management: Controlling Data Volume, Velocity, and Va-
riety, Technical Report, 2001.URL http://blogs.gartner.com/doug-laney/files/2012/01/ad949-3D-Data-Management-Controlling-Data-Volume-Velocity-and-
Variety.pdf (accessed August 2015).
[6] M.A. Beyer, D. Laney, The Importance of ‘Big Data’: A Definition, Gartner, Stam-ford, CT (2012).
[7] I.A.T. Hashema, I. Yaqooba, N.B. Anuara, S. Mokhtara, A. Gania, S.U. Khanb, Therise of big data on cloud computing: review and open research issues, Inf. Syst.
47 (2015) 98–115.

57G. Bello-Orgaz et al. / Information Fusion 28 (2016) 45–59
[8] R.L. Grossman, Y. Gu, J. Mambretti, M. Sabala, A. Szalay, K. White, An overviewof the open science data cloud, in: Proceedings of the 19th ACM International
Symposium on High Performance Distributed Computing, HPDC ’10, ACM, NewYork, NY, USA, 2010, pp. 377–384, doi:10.1145/1851476.1851533.
[9] N. Khan, I. Yaqoob, I.A.T. Hashem, Z. Inayat, W.K.M. Ali, M. Alam, M. Shiraz,A. Gani, Big data: survey, technologies, opportunities, and challenges, The Sci.
World J. 2014 (2014) 1–18.[10] N. Couldry, Media, Society, World: Social Theory and Digital Media Practice,
Polity, 2012.
[11] T. Correa, A.W. Hinsley, H.G. De Zuniga, Who interacts on the web?: the inter-section of users’ personality and social media use, Comput. Hum. Behav. 26 (2)
(2010) 247–253.[12] A.M. Kaplan, M. Haenlein, Users of the world, unite! the challenges and oppor-
tunities of social media, Bus. Horizons 53 (1) (2010) 59–68.[13] P.A. Tess, The role of social media in higher education classes (real and virtual)–a
literature review, Comput. Hum. Behav. 29 (5) (2013) A60–A68.
[14] M. Salathé, D.Q. Vu, S. Khandelwal, D.R. Hunter, The dynamics of health behaviorsentiments on a large online social network, EPJ Data Sci. 2 (1) (2013) 1–12.
[15] E. Cambria, D. Rajagopal, D. Olsher, D. Das, Big social data analysis, Big Data Com-put. 13 (2013) 401–414.
[16] L. Manovich, Trending: the promises and the challenges of big social data, De-bates Digit. Hum. (2011) 460–475.
[17] S. Kaisler, F. Armour, J.A. Espinosa, W. Money, Big data: Issues and challenges
moving forward, in: Proceedings of 46th Hawaii International Conference onSystem Sciences (HICSS), IEEE, 2013, pp. 995–1004.
[18] H. Chen, R.H. Chiang, V.C. Storey, Business intelligence and analytics: from bigdata to big impact, MIS Q. 36 (4) (2012) 1165–1188.
[19] T. White, Hadoop: The Definitive Guide, O’Reilly Media, 2009.[20] M. Zaharia, M. Chowdhury, M.J. Franklin, S. Shenker, I. Stoica, Spark: Cluster com-
puting with working sets, in: Proceedings of the 2Nd USENIX Conference on Hot
Topics in Cloud Computing,HotCloud’10, USENIX Association, Berkeley, CA, USA,2010, p. 10. http://dl.acm.org/citation.cfm?id=1863103.1863113.
[21] S. Owen, R. Anil, T. Dunning, E. Friedman, Mahout in Action, 1, ManningPublications, 2011. URL http://www.amazon.com/exec/obidos/redirect?tag=citeulike07-20&path=ASIN/1935182684
[22] X. Meng, J. Bradley, B. Yavuz, E. Sparks, S. Venkataraman, D. Liu, J. Freeman, D.
Tsai, M. Amde, S. Owen, et al., MLlib: machine learning in apache spark, 2015,
pp. 1–7, arXiv:1505.06807.[23] T. Kraska, A. Talwalkar, J.C. Duchi, R. Griffith, M.J. Franklin, M.I. Jordan, Mlbase: a
distributed machine-learning system, in: Proceedings of Sixth Biennial Confer-ence on Innovative Data Systems Research, Asilomar CIDR, CA, USA, January 6-9,
2013, 2013.[24] E.R. Sparks, A. Talwalkar, V. Smith, J. Kottalam, X. Pan, J.E. Gonzalez, M.J. Franklin,
M.I. Jordan, T. Kraska, MLI: an API for distributed machine learning, in: Proceed-
ings of IEEE 13th International Conference on Data Mining, Dallas, TX, USA, De-cember 7-10, 2013, 2013, pp. 1187–1192, doi:10.1109/ICDM.2013.158.
[25] J. Dean, S. Ghemawat, Mapreduce: simplified data processing on large clusters,in: Proceedings of the 6th Conference on Symposium on Operating Systems De-
sign and Implementation, OSDI’04, USENIX Association, 2004.[26] J. Dean, S. Ghemawat, Mapreduce: simplified data processing on large clusters,
Commun. ACM 51 (1) (2008) 107–113, doi:10.1145/1327452.1327492.[27] K. Shim, Mapreduce algorithms for big data analysis, Proc. VLDB Endow. 5 (12)
(2012) 2016–2017.
[28] M. Zaharia, A. Konwinski, A.D. Joseph, R. Katz, I. Stoica, Improving mapre-duce performance in heterogeneous environments, in: Proceedings of the
8th USENIX Conference on Operating Systems Design and Implementa-tion, OSDI’08, USENIX Association, Berkeley, CA, USA, 2008, pp. 29–42.
http://dl.acm.org/citation.cfm?id=1855741.1855744.[29] R.S. Xin, J. Rosen, M. Zaharia, M.J. Franklin, S. Shenker, I. Stoica, Shark: Sql and
rich analytics at scale, in: Proceedings of the 2013 ACM SIGMOD International
Conference on Management of Data, SIGMOD ’13, ACM, New York, NY, USA, 2013,pp. 13–24, doi:10.1145/2463676.2465288.
[30] A. Mostosi, Useful stuff, 2015. http://blog.andreamostosi.name/big-data/[31] A. Mostosi, The big-data ecosystem table, 2015. URL http://bigdata.
andreamostosi.name/[32] C. Emerick, B. Carper, C. Grand, Clojure Programming, O’Really, 2011.
[33] M. Burrows, The chubby lock service for loosely-coupled distributed systems,
in: Proceedings of the 7th Symposium on Operating Systems Design and Imple-mentation, OSDI ’06, USENIX Association, Berkeley, CA, USA, 2006, pp. 335–350.
http://dl.acm.org/citation.cfm?id=1298455.1298487.[34] A. Alexandrov, R. Bergmann, S. Ewen, J.-C. Freytag, F. Hueske, A. Heise, O. Kao,
M. Leich, U. Leser, V. Markl, F. Naumann, M. Peters, A. Rheinländer, M.J. Sax,S. Schelter, M. Höger, K. Tzoumas, D. Warneke, The stratosphere platform for big
data analytics, VLDB J. 23 (6) (2014) 939–964, doi:10.1007/s00778-014-0357-y.
[35] S. Ghemawat, H. Gobioff, S.-T. Leung, The google file system, in: Proceedingsof the Nineteenth ACM Symposium on Operating Systems Principles, SOSP ’03,
ACM, New York, NY, USA, 2003, pp. 29–43, doi:10.1145/945445.945450.[36] F. Chang, J. Dean, S. Ghemawat, W.C. Hsieh, D.A. Wallach, M. Burrows, T. Chandra,
A. Fikes, R.E. Gruber, Bigtable: a distributed storage system for structured data,in: Proceedings of the 7th USENIX Symposium on Operating Systems Design and
Implementation, OSDI ’06, USENIX Association, Berkeley, CA, USA, 2006, p. 15.
http://dl.acm.org/citation.cfm?id=1267308.1267323.[37] G. Malewicz, M.H. Austern, A.J. Bik, J.C. Dehnert, I. Horn, N. Leiser, G. Czajkowski,
Pregel: a system for large-scale graph processing, in: Proceedings of the 2010ACM SIGMOD International Conference on Management of Data, SIGMOD ’10,
ACM, New York, NY, USA, 2010, pp. 135–146, doi:10.1145/1807167.1807184.
[38] K. Chodorow, MongoDB: The Definitive Guide, O’Reilly Media, Inc., 2013.[39] M.J. Crawley, The R Book, 1st, Wiley Publishing, 2007.
[40] S. Bennett, Twitter now seeing 400 million tweets per day, increased mobile adrevenue, says ceo, 2012. URL http://www.adweek.com/socialtimes/twitter-400-
million-tweets[41] L. Ott, M. Longnecker, R.L. Ott, An Introduction to Statistical Methods and Data
Analysis, 511, Duxbury Pacific Grove, CA, 2001.[42] B. Elser, A. Montresor, An evaluation study of bigdata frameworks for graph pro-
cessing, in: Proceedings of IEEE International Conference on Big Data, IEEE, 2013,
pp. 60–67.[43] L.G. Valiant, A bridging model for parallel computation, Commun. ACM 33 (8)
(1990) 103–111, doi:10.1145/79173.79181.[44] S. Seo, E.J. Yoon, J. Kim, S. Jin, J.-S. Kim, S. Maeng, Hama: an efficient matrix com-
putation with the mapreduce framework, in: Proceedings of the Second Inter-national Conference on Cloud Computing Technology and Science (CloudCom),
IEEE, 2010, pp. 721–726.
[45] A. Clauset, Finding local community structure in networks, Phys. Rev. E 72 (2005)026132, doi:10.1103/PhysRevE.72.026132.
[46] F. Santo, Community detection in graphs, Phys. Rep. 486 (3-5) (2010) 75–174,doi:10.1016/j.physrep.2009.11.002.
[47] R. Kannan, S. Vempala, A. Veta, On clusterings-good, bad and spectral, in:Proceedings of the 41st Annual Symposium on Foundations of Computer
Science, FOCS ’00, IEEE Computer Society, Washington, DC, USA, 2000, pp. 367–
377.[48] I.M. Bomze, M. Budinich, P.M. Pardalos, M. Pelillo, The maximum clique prob-
lem, in: Handbook of Combinatorial Optimization, Kluwer Academic Publishers,1999, pp. 1–74.
[49] M. Girvan, M.E.J. Newman, Community structure in social and biological net-works, Proc. Natl. Acad. Sci. 99 (12) (2002) 7821–7826.
[50] M.E.J. Newman, Fast algorithm for detecting community structure in networks,
Phys. Rev. E 69 (6) (2004) 066133+, doi:10.1103/physreve.69.066133.[51] A. Clauset, M.E. Newman, C. Moore, Finding community structure in very large
networks, Phys. Rev. E 70 (6) (2004) 066111.[52] M.E. Newman, Modularity and community structure in networks, Proc. Natl.
Acad. Sci. 103 (23) (2006) 8577–8582.[53] T. Richardson, P.J. Mucha, M.A. Porter, Spectral tri partitioning of networks, Phys.
Rev. E 80 (3) (2009) 036111.
[54] G. Wang, Y. Shen, M. Ouyang, A vector partitioning approach to detecting com-munity structure in complex networks, Comput. Math. Appl. 55 (12) (2008)
2746–2752.[55] H. Zhou, R. Lipowsky, Network brownian motion: a new method to measure
vertex-vertex proximity and to identify communities and subcommunities, in:Computational Science-ICCS 2004, Springer, 2004, pp. 1062–1069.
[56] Y. Dong, Y. Zhuang, K. Chen, X. Tai, A hierarchical clustering algorithm based on
fuzzy graph connectedness, Fuzzy Sets Syst. 157 (13) (2006) 1760–1774.[57] G. Bello-Orgaz, H.D. Menéndez, D. Camacho, Adaptive k-means
algorithm for overlapped graph clustering, Int. J. Neural Syst. 22 (05) (2012)1250018.
[58] J. Xie, S. Kelley, B.K. Szymanski, Overlapping community detection in networks:the state-of-the-art and comparative study, ACM Comput. Surv. (CSUR) 45 (4)
(2013) 43.[59] O. Zamir, O. Etzioni, Web document clustering: a feasibility demonstration, in:
Proceedings of the 21st Annual International ACM SIGIR Conference on Research
and Development in Information Retrieval, SIGIR ’98, ACM, New York, NY, USA,1998, pp. 46–54, doi:10.1145/290941.290956.
[60] W.B. Frakes, R.A. Baeza-Yates (Eds.), Information Retrieval: Data Structures & Al-gorithms, Prentice-Hall, 1992.
[61] C.D. Manning, P. Raghavan, H. Schütze, Introduction to Information Retrieval,Cambridge University Press, New York, NY, USA, 2008.
[62] X. Hu, H. Liu, Text analytics in social media, in: Mining Text Data, Springer, 2012,
pp. 385–414.[63] S. Wold, K. Esbensen, P. Geladi, Principal component analysis, Chemom. Intell.
Lab. Syst. 2 (1) (1987) 37–52.[64] S.C. Deerwester, S.T. Dumais, T.K. Landauer, G.W. Furnas, R.A. Harshman, Index-
ing by latent semantic analysis, JAsIs 41 (6) (1990) 391–407.[65] D.M. Blei, A.Y. Ng, M.I. Jordan, Latent Dirichlet allocation, J. Mach. Learn. Res. 3
(2003) 993–1022.
[66] L. Yao, D. Mimno, A. McCallum, Efficient methods for topic model inference onstreaming document collections, in: Proceedings of the 15th ACM SIGKDD In-
ternational Conference on Knowledge Discovery and Data Mining, ACM, 2009,pp. 937–946.
[67] A.K. Jain, M.N. Murty, P.J. Flynn, Data clustering: a review, ACM Comput. Surv. 31(3) (1999) 264–323, doi:10.1145/331499.331504.
[68] B. Larsen, C. Aone, Fast and effective text mining using linear-time document
clustering, in: Proceedings of the Fifth ACM SIGKDD International Conferenceon Knowledge Discovery and data mining, KDD ’99, ACM, New York, NY, USA,
1999, pp. 16–22, doi:10.1145/312129.312186.[69] Y. Zhao, G. Karypis, Evaluation of hierarchical clustering algorithms for docu-
ment datasets, in: Proceedings of the Eleventh International Conference on In-formation and Knowledge Management, CIKM ’02, ACM, New York, NY, USA,
2002, pp. 515–524, doi:10.1145/584792.584877.
[70] Y. Zhao, G. Karypis, Empirical and theoretical comparisons of selected crite-rion functions for document clustering, Mach. Learn. 55 (3) (2004) 311–331,
doi:10.1023/B:MACH.0000027785.44527.d6.[71] F. Sebastiani, Machine learning in automated text categorization, ACM Comput.
Surv. (CSUR) 34 (1) (2002) 1–47.
58 G. Bello-Orgaz et al. / Information Fusion 28 (2016) 45–59
[72] B. Pang, L. Lee, S. Vaithyanathan, Thumbs up?: sentiment classification using ma-chine learning techniques, in: Proceedings of the ACL-02 Conference on Empiri-
cal Methods in Natural Language Processing, 10, Association for ComputationalLinguistics, 2002, pp. 79–86.
[73] C.C. Aggarwal, Data Streams: Models and Algorithms, 31, Springer Science &Business Media, 2007.
[74] S. Zhong, Efficient online spherical k-means clustering, in: Proceedings of the2005 IEEE International Joint Conference on Neural Networks, IJCNN’05, 5, IEEE,
2005, pp. 3180–3185.
[75] W. Chen, C. Wang, Y. Wang, Scalable influence maximization for prevalentviral marketing in large-scale social networks, in: B. Rao, B. Krishnapuram,
A. Tomkins, Q. Yang (Eds.), Proceedings of the 16th ACM SIGKDD InternationalConference on Knowledge Discovery and Data Mining, , July 25-28, 2010, ACM,
Washington, DC, USA, 2010, pp. 1029–1038, doi:10.1145/1835804.1835934.[76] D.T. Nguyen, J.J. Jung, Real-time event detection on social data stream, Mobile
Netw. Appl. 20 (4) (2015) 475–486, doi:10.1007/s11036-014-0557-0.
[77] A. Guille, H. Hacid, C. Favre, D.A. Zighed, Information diffusion in online socialnetworks: a survey, SIGMOND Rec. 42 (2) (2013) 17–28.
[78] M. Gomez-Rodriguez, J. Leskovec, A. Krause, Inferring networks of dif-fusion and influence, ACM Trans. Knowl. Discov. Data 5 (4) (2012) 21,
doi:10.1145/2086737.2086741.[79] E. Sadikov, M. Medina, J. Leskovec, H. Garcia-Molina, Correcting for missing
data in information cascades, in: I. King, W. Nejdl, H. Li (Eds.), Proceedings
of the 4th International Conference on Web Search and Web Data Mining(WSDM 2011), Hong Kong, China, February 9-12, 2011, ACM, 2011, pp. 55–64,
doi:10.1145/1935826.1935844.[80] E. Anshelevich, A. Hate, M. Magdon-Ismail, Seeding influential nodes in non-
submodular models of information diffusion, Auton. Agents Multi-Agent Syst.29 (1) (2015) 131–159.
[81] C. Jiang, Y. Chen, K.R. Liu, Graphical evolutionary game for information
diffusion over social networks, IEEE J. Sel. Top. Signal Process. 8 (4) (2014b) 524–536.
[82] C. Jiang, Y. Chen, K.R. Liu, Evolutionary dynamics of information diffusion oversocial networks, IEEE Trans. Signal Process. 62 (17) (2014a) 4573–4586.
[83] T.-c. Fu, A review on time series data mining, Eng. Appl. Artif. Intell. 24 (1) (2011)164–181.
[84] J. Lin, E. Keogh, S. Lonardi, B. Chiu, A symbolic representation of time series, with
implications for streaming algorithms, in: Proceedings of the 8th ACM SIGMODWorkshop on Research Issues in Data Mining and Knowledge Discovery, ACM,
2003, pp. 2–11.[85] M. Cataldi, L.D. Caro, C. Schifanella, Emerging topic detection on twitter based on
temporal and social terms evaluation, in: Proceedings of the 10th InternationalWorkshop on Multimedia Data Mining, ACM, New York, NY, USA, 2010, pp. 1–10,
doi:10.1145/1814245.1814249.
[86] D.T. Nguyen, J.J. Jung, Privacy-preserving discovery of topic-based events fromsocial sensor signals: an experimental study on twitter, Sci. World J. 2014 (2014)
1–5.[87] J.J. Jung, Integrating social networks for context fusion in mobile service plat-
forms, J. Univers. Comput. Sci. 16 (15) (2010) 2099–2110.[88] H.H. Hoang, T.N.-P. Cung, D.K. Truong, D. Hwang, J.J. Jung, Semantic information
integration with linked data mashups approaches, Int. J. Distrib. Sens. Networks2014 (2014) 1–12. Article ID 813875
[89] N.H. Long, J.J. Jung, Privacy-aware framework for matching online social identi-
ties in multiple social networking services, Cybern. Syst. 46 (1-2) (2015) 69–83.[90] S. Caton, C. Haas, K. Chard, K. Bubendorfer, O.F. Rana, A social compute cloud:
allocating and sharing infrastructure resources via social networks, IEEE Trans.Serv. Comput. 7 (3) (2014) 359–372.
[91] T.H. Davenport, J.G. Harris, Competing on Analytics: The New Science of Win-ning, Harvard Business Press, 2007.
[92] C. Maurer, R. Wiegmann, Effectiveness of Advertising on Social Network Sites: A
Case Study on Facebook, Springer, 2011.[93] C. Trattner, F. Kappe, Social stream marketing on Facebook: a case study, Int. J.
Soc. Humanist. Comput. 2 (1-2) (2013) 86–103.[94] B.J. Jansen, M. Zhang, K. Sobel, A. Chowdury, Twitter power: tweets as electronic
word of mouth, J. Am. Soc. Inf. Sci. Tech. 60 (11) (2009) 2169–2188.[95] S. Asur, B. Huberman, et al., Predicting the future with social media, in: Pro-
ceedings of International Conference on Web Intelligence and Intelligent Agent
Technology (WI-IAT), 2010 IEEE/WIC/ACM, 1, IEEE, 2010, pp. 492–499.[96] H. Ma, H. Yang, M.R. Lyu, I. King, Mining social networks using heat diffusion
processes for marketing candidates selection, in: Proceedings of the 17th ACMConference on Information and Knowledge Management, ACM, 2008, pp. 233–
242.[97] R. Wortley, L. Mazerolle, Environmental Criminology and Crime Analysis, Willan,
2013.
[98] O. Knutsson, E. Sneiders, A. Alfalahi, Opportunities for improving egovern-ment: using language technology in workflow management, in: Proceed-
ings of the 6th International Conference on Theory and Practice of Elec-tronic Governance, ICEGOV ’12, ACM, New York, NY, USA, 2012, pp. 495–496,
doi:10.1145/2463728.2463833.[99] C.-H. Ku, G. Leroy, A decision support system: automated crime report analysis
and classification for e-government, Gov. Inf. Q. 31 (4) (2014) 534–544.
[100] P. Phillips, I. Lee, Mining co-distribution patterns for large crime datasets, ExpertSyst. Appl. 39 (14) (2012) 11556–11563.
[101] S. Chainey, L. Tompson, S. Uhlig, The utility of hotspot mapping for predictingspatial patterns of crime, Secur. J. 21 (1) (2008) 4–28.
[102] M.S. Gerber, Predicting crime using twitter and Kernel density estimation, Decis.Support Syst. 61 (2014) 115–125.
[103] E. Kirkos, C. Spathis, Y. Manolopoulos, Data mining techniques for the detectionof fraudulent financial statements, Expert Syst. Appl. 32 (4) (2007) 995–1003.
[104] J.T. Quah, M. Sriganesh, Real-time credit card fraud detection using computa-tional intelligence, Expert Syst. Appl. 35 (4) (2008) 1721–1732.
[105] S.-H. Li, D.C. Yen, W.-H. Lu, C. Wang, Identifying the signs of fraudulent accountsusing data mining techniques, Comput. Hum. Behav. 28 (3) (2012) 1002–1013.
[106] C. Paquet, D. Coulombier, R. Kaiser, M. Ciotti, Epidemic intelligence: a new
framework for strengthening disease surveillance in europe., Euro surveillance:bulletin europeen sur les maladies transmissibles European communicable dis-
ease bulletin 11 (12) (2005) 212–214.[107] A.M. Cohen, W.R. Hersh, A survey of current work in biomedical text mining,
Brief. Bioinform. 6 (1) (2005) 57–71.[108] V. Lampos, N. Cristianini, Nowcasting events from the social web with statistical
learning, ACM Trans. Intell. Syst. Technol. (TIST) 3 (4) (2012) 72.
[109] N. Collier, R.M. Goodwin, J. McCrae, S. Doan, A. Kawazoe, M. Conway, A. Kaw-trakul, K. Takeuchi, D. Dien, An ontology-driven system for detecting global
health events, in: Proceedings of the 23rd International Conference on Computa-tional Linguistics, Association for Computational Linguistics, 2010, pp. 215–222.
[110] A. Culotta, Towards detecting influenza epidemics by analyzing twitter mes-sages, in: Proceedings of the First Workshop on Social Media Analytics, ACM,
2010, pp. 115–122.
[111] E. Aramaki, S. Maskawa, M. Morita, Twitter catches the flu: detecting influenzaepidemics using twitter, in: Proceedings of the Conference on Empirical Meth-
ods in Natural Language Processing, Association for Computational Linguistics,2011, pp. 1568–1576.
[112] T. Bodnar, M. Salathé, Validating models for disease detection using twitter, in:Proceedings of the 22nd international conference on World Wide Web com-
panion, International World Wide Web Conferences Steering Committee, 2013,
pp. 699–702.[113] M. Fisichella, A. Stewart, A. Cuzzocrea, K. Denecke, Detecting health events on
the social web to enable epidemic intelligence, in: String Processing and Infor-mation Retrieval, Springer, 2011, pp. 87–103.
[114] D.M. Hartley, N.P. Nelson, R. Walters, R. Arthur, R. Yangarber, L. Madoff, J. Linge,A. Mawudeku, N. Collier, J.S. Brownstein, et al., The landscape of international
event-based biosurveillance., Emerg. Health Threat. 3 (2010).
[115] E. Mykhalovskiy, L. Weir, The global public health intelligence network and earlywarning outbreak detection, Can. J. Public Health 97 (1) (2006) 42–44.
[116] N. Collier, S. Doan, A. Kawazoe, R.M. Goodwin, M. Conway, Y. Tateno, Q.-H. Ngo,D. Dien, A. Kawtrakul, K. Takeuchi, et al., Biocaster: detecting public health
rumors with a web-based text mining system, Bioinformatics 24 (24) (2008)2940–2941.
[117] J.S. Brownstein, C.C. Freifeld, B.Y. Reis, K.D. Mandl, Surveillance sans frontieres:
internet-based emerging infectious disease intelligence and the healthmapproject, PLoS Med. 5 (7) (2008) e151.
[118] M. Keller, M. Blench, H. Tolentino, C.C. Freifeld, K.D. Mandl, A. Mawudeku, G. Ey-senbach, J.S. Brownstein, Use of unstructured event-based reports for global in-
fectious disease surveillance, Emerg. Infect. Dis. 15 (5) (2009) 689.[119] A. Lyon, M. Nunn, G. Grossel, M. Burgman, Comparison of web-based biosecurity
intelligence systems: biocaster, epispider and healthmap, Transbound. Emerg.Dis. 59 (3) (2012) 223–232.
[120] D. Keim, H. Qu, K.-L. Ma, Big-data visualization, IEEE Comput. Gr. Appl. 33 (4)
(2013) 20–21.[121] X.P. Kotval, M.J. Burns, Visualization of entities within social media: toward un-
derstanding users’ needs, Bell Labs Tech. J. 17 (4) (2013) 77–101.[122] A. Miroshnikov, E.M. Conlon, Parallelmcmccombine: an r package for bayesian
methods for big data and analytics, PLOS One 9 (9) (2014).[123] D.F. Swayne, D.T. Lang, A. Buja, D. Cook, GGobi: evolving from XGobi into an
extensible framework for interactive data visualization, Comput. Stat. Data Anal.
43 (4) (2003) 423–444, doi:10.1016/S0167-9473(02)00286-4.[124] P. Ashok, D. Tesar, A visualization framework for real time decision mak-
ing in a multi-input multi-output system, IEEE Syst. J. 2 (1) (2008) 129–145,doi:10.1109/JSYST.2008.916060.
[125] C. Gurrin, A.F. Smeaton, A.R. Doherty, Foundations and Trends in InformationRetrieval, 8, Now Publishers, 2014, pp. pp.1–125.
[126] M. Blum, A. Pentland, G. Troster, Insense: interest-based life logging, Multimed.
IEEE 13 (4) (2006) 40–48, doi:10.1109/MMUL.2006.87.[127] F.B. Viegas, M. Wattenberg, F. van Ham, J. Kriss, M. McKeon, Manyeyes: a site for
visualization at internet scale, IEEE Trans. Vis. Comput. Gr. 13 (6) (2007) 1121–1128, doi:10.1109/TVCG.2007.70577.
[128] D. Hwang, J.E. Jung, S. Park, H.T. Nguyen, Social data visualization system forunderstanding diffusion patterns on twitter: a case study on korean enterprises,
Comput. Inform. 33 (3) (2014) 591–608.
[129] L. Sweeney, K-anonymity: a model for protecting privacy, Int. J. Uncertain. Fuzzi-ness Knowledge-based Syst. 10 (5) (2002) 557–570.
[130] C. Dwork, Differential privacy: a survey of results, in: M. Agrawal, D. Du, Z. Duan,A. Li (Eds.), Proceedings of 5th International Conference on Theory and Applica-
tions of Models of Computation (TAMC 2008), Xi’an, China, April 25-29, LectureNotes in Computer Science, 4978, Springer, 2008, pp. 1–19.
[131] S. Landau, Educating engineers: teaching privacy in a world of open doors, IEEE
Secur. Priv. 12 (3) (2014) 66–70.[132] A. Fiat, Online Algorithms: The State of the Art, in: A. Fiat, G.J. Woeginge (Eds.),
Lecture Notes in Computer Science, 1442, 1998.[133] K. Crammer, Y. Singer, Ultraconservative online algorithms for multiclass prob-
lems, J. Mach. Learn. Res. 3 (2003) 951–991.
[
[
[
[
[
[
59G. Bello-Orgaz et al. / Information Fusion 28 (2016) 45–59
[134] M. Charikar, L. O’Callaghan, R. Panigrahy, Better streaming algorithms for clus-tering problems, in: Proceedings of the Thirty-Fifth annual ACM Symposium on
Theory of Computing, ACM, 2003, pp. 30–39.[135] J. Cheng, Y. Ke, W. Ng, A survey on algorithms for mining frequent itemsets over
data streams, Knowl. Inf. Syst. 16 (1) (2008) 1–27.136] H.D. Menéndez, D.F. Barrero, D. Camacho, A multi-objective genetic graph-
based clustering algorithm with memory optimization, in: Proceedings of IEEECongress on Evolutionary Computation (CEC), 2013, IEEE, 2013, pp. 3174–3181.
[137] W. Zhao, H. Ma, Q. He, Parallel k-means clustering based on mapreduce, in: Cloud
Computing, Springer, 2009, pp. 674–679.138] C. Chu, S.K. Kim, Y.-A. Lin, Y. Yu, G. Bradski, A.Y. Ng, K. Olukotun, Map-reduce for
machine learning on multicore, Adv. Neural Inf. Process. Syst. 19 (2007) 281.139] W.-Y. Chen, Y. Song, H. Bai, C.-J. Lin, E.Y. Chang, Parallel spectral clustering in
distributed systems, IEEE Trans. Pattern Anal. Mach. Intell. 33 (3) (2011) 568–586.
[140] H.D. Menendez, D.F. Barrero, D. Camacho, A co-evolutionary multi-objective ap-
proach for a k-adaptive graph-based clustering algorithm, in: Proceedings ofIEEE Congress on Evolutionary Computation (CEC), 2014, IEEE, 2014, pp. 2724–
2731.[141] H.D. Menendez, D. Camacho, Gany: a genetic spectral-based clustering algo-
rithm for large data analysis, in: IEEE Congress on Evolutionary Computation(CEC), 2015, IEEE, 2015, pp. 640–647.
[142] A. Ng, M. Jordan, Y. Weiss, On Spectral Clustering: Analysis and an al-
gorithm, in: T. Dietterich, S. Becker, Z. Ghahramani (Eds.), Advances inNeural Information Processing Systems, MIT Press, 2001, pp. 849–856.
http://citeseerx.ist.psu.edu/viewdoc/summary?doi=10.1.1.19.8100.
[143] F. Bach, M. Jordan, Learning spectral clustering, with applicationto speech separation, J. Mach. Learn. Res. 7 (2006) 1963–2001.URL
http://jmlr.csail.mit.edu/papers/volume7/bach06b/bach06b.pdf144] R. Kumar, M. Wolenetz, B. Agarwalla, J. Shin, P. Hutto, A. Paul, U. Ramachandran,
Dfuse: a framework for distributed data fusion, in: Proceedings of the 1st In-ternational Conference on Embedded Networked Sensor Systems, ACM, 2003,
pp. 114–125.[145] D. Keim, G. Andrienko, J.-D. Fekete, C. Görg, J. Kohlhammer, G. Melançon, Visual
Analytics: Definition, Process, and Challenges, Springer, 2008.
[146] B. Cui, A.K. Tung, C. Zhang, Z. Zhao, Multiple feature fusion for social media ap-plications, in: Proceedings of the 2010 ACM SIGMOD International Conference
on Management of Data, ACM, 2010, pp. 435–446.[147] E. Bakshy, I. Rosenn, C. Marlow, L. Adamic, The role of social networks in infor-
mation diffusion, in: Proceedings of the 21st International Conference on WorldWide Web, ACM, 2012, pp. 519–528.
148] H. Becker, M. Naaman, L. Gravano, Event identification in social media., in:
WebDB, 2009.149] H. Becker, M. Naaman, L. Gravano, Learning similarity metrics for event identi-
fication in social media, in: Proceedings of the Third ACM International Confer-ence on Web Search and Data Mining, ACM, 2010, pp. 291–300.
[150] P.C. Wong, J. Thomas, Visual analytics, IEEE Comput. Gr. Appl. (5) (2004) 20–21.[151] G. Andrienko, N. Andrienko, S. Wrobel, Visual analytics tools for analysis of
movement data, ACM SIGKDD Explor. Newsl. 9 (2) (2007) 38–46.
[152] G. Andrienko, N. Andrienko, U. Demsar, D. Dransch, J. Dykes, S.I. Fabrikant,M. Jern, M.-J. Kraak, H. Schumann, C. Tominski, Space, time and visual analyt-
ics, Int. J. Geogr. Inf. Sci. 24 (10) (2010) 1577–1600.
Related Documents