SKF Capital Markets Day 2018 Christian Johansson, Senior Vice President & CFO

Welcome message from author
This document is posted to help you gain knowledge. Please leave a comment to let me know what you think about it! Share it to your friends and learn new things together.
Transcript
SKF Capital Markets Day 2018
Christian Johansson, Senior Vice President & CFO
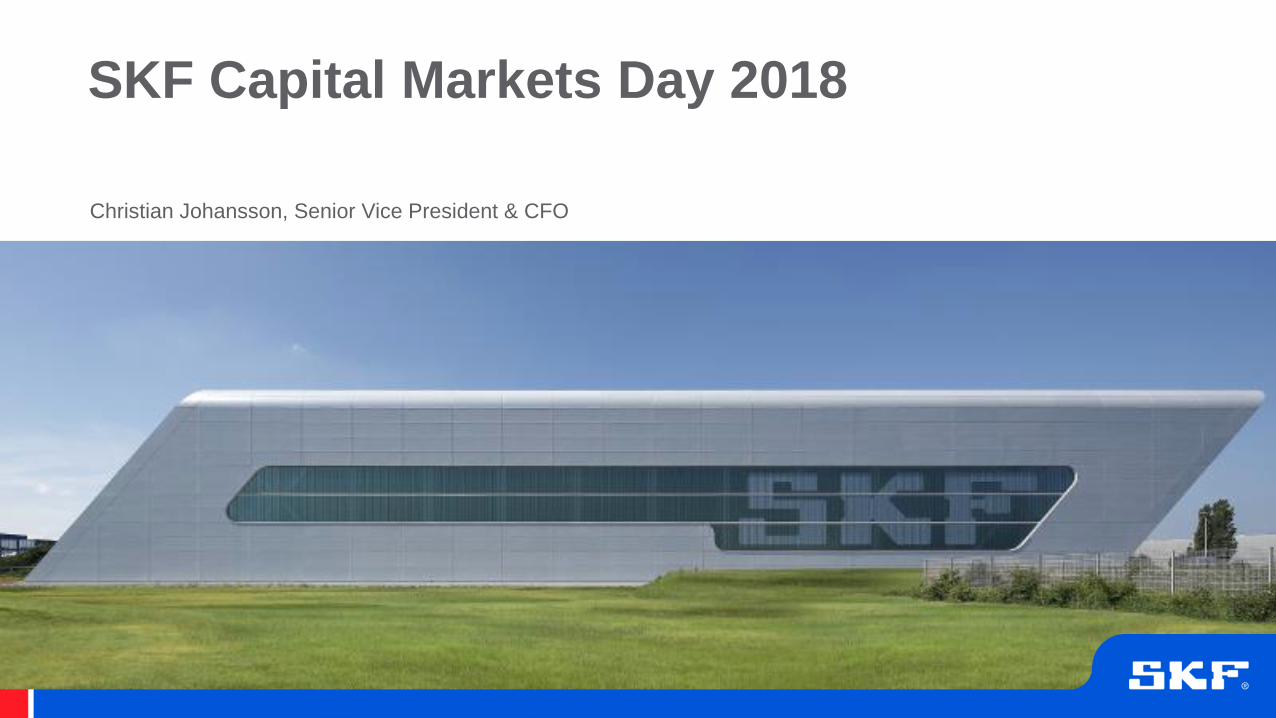
▪ Fast and customer focused
▪ Refocused on the core business (8 divestments in 3 years)
▪ Strengthened financial position
▪ Lowered cost level
=> market share growth, record sales & record high profit
SKF – in business for 111 years, fit and ready for the future!
6.9%Organic growth:
Target: 5%
12.2%Operating margin:
Target: 12%
60%Net debt / equity:
Target: <80%
16.5%Return on capital employed:
Target: 16%
29.0%Net working capital:
Target: 25%
© SKF Group
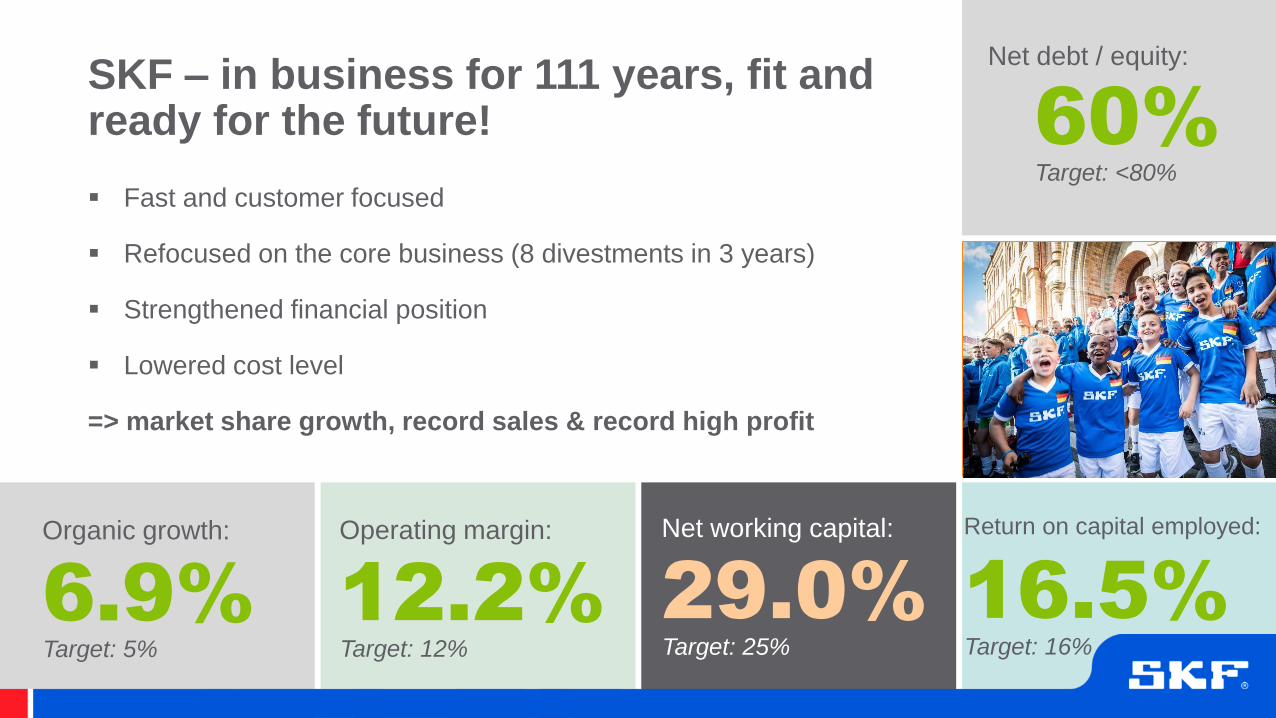
Performance versus targets 2014 - 2018
4
- 3 - 2
8 8
- 6
- 3
-
3
6
9
2014 2015 2016 2017 2018(Q3)
Organic sales growth
Growth Target
7 800
7 0007 500
8 600
10 200
5,0
8,0
11,0
14,0
5 000
7 000
9 000
11 000
2014 2016 2018
(rolling 12months)
Operating Result
Operating Result Margin Target
127
100
84
71 60
-
30
60
90
120
150
2014 2015 2016 2017 2018
(Q3)
Net debt/equity
Net debt/equity Target
31
27
30 29 29
20
25
30
35
2014 2015 2016 2017 2018
(Q3)
Net working capital/sales
NWC Target
14
11
12
14
17
9
11
13
15
17
2014 2015 2016 2017 2018
(Q3)
ROCE
ROCE Target
5 000
5 700
5 000
4 200
5 800
0%
40%
80%
120%
160%
3 500
4 000
4 500
5 000
5 500
6 000
2014 2016 2018
(rolling 12
months)
Cash flow after investments before financing*
Cash flow Cash Conversion
© SKF Group
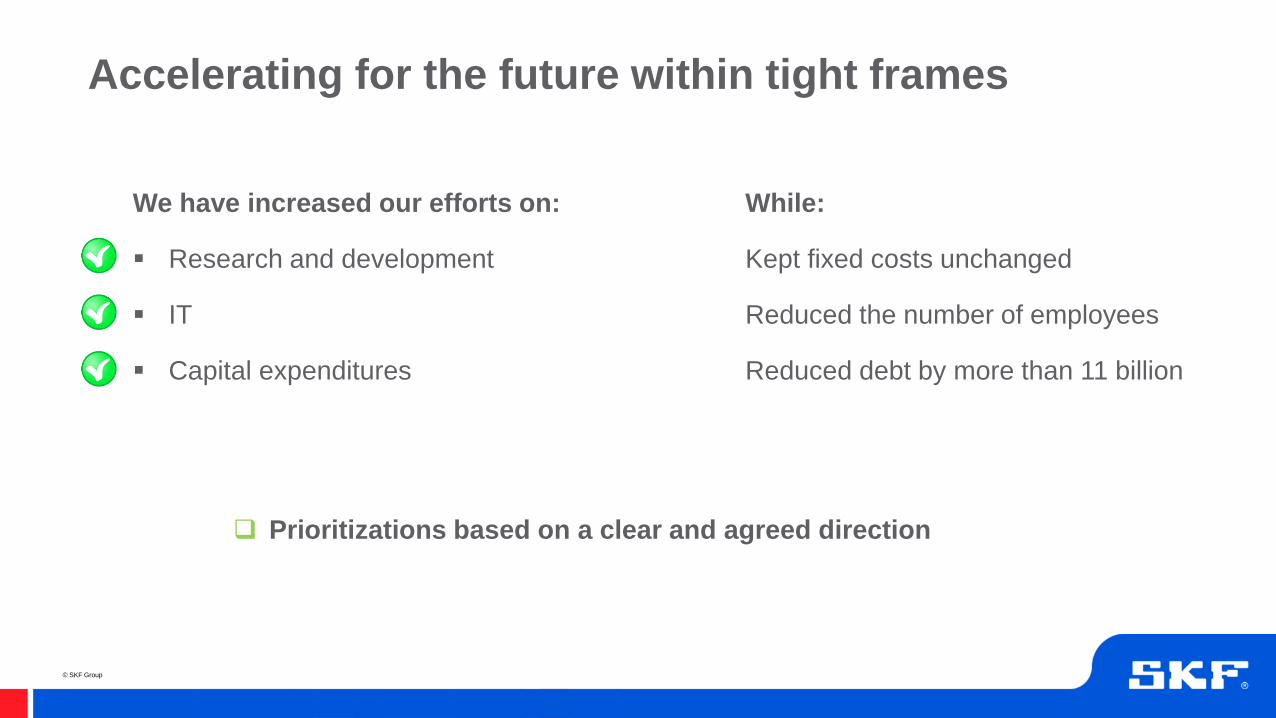
While:
Kept fixed costs unchanged
Reduced the number of employees
Reduced debt by more than 11 billion
We have increased our efforts on:
▪ Research and development
▪ IT
▪ Capital expenditures
Accelerating for the future within tight frames
Prioritizations based on a clear and agreed direction
© SKF Group
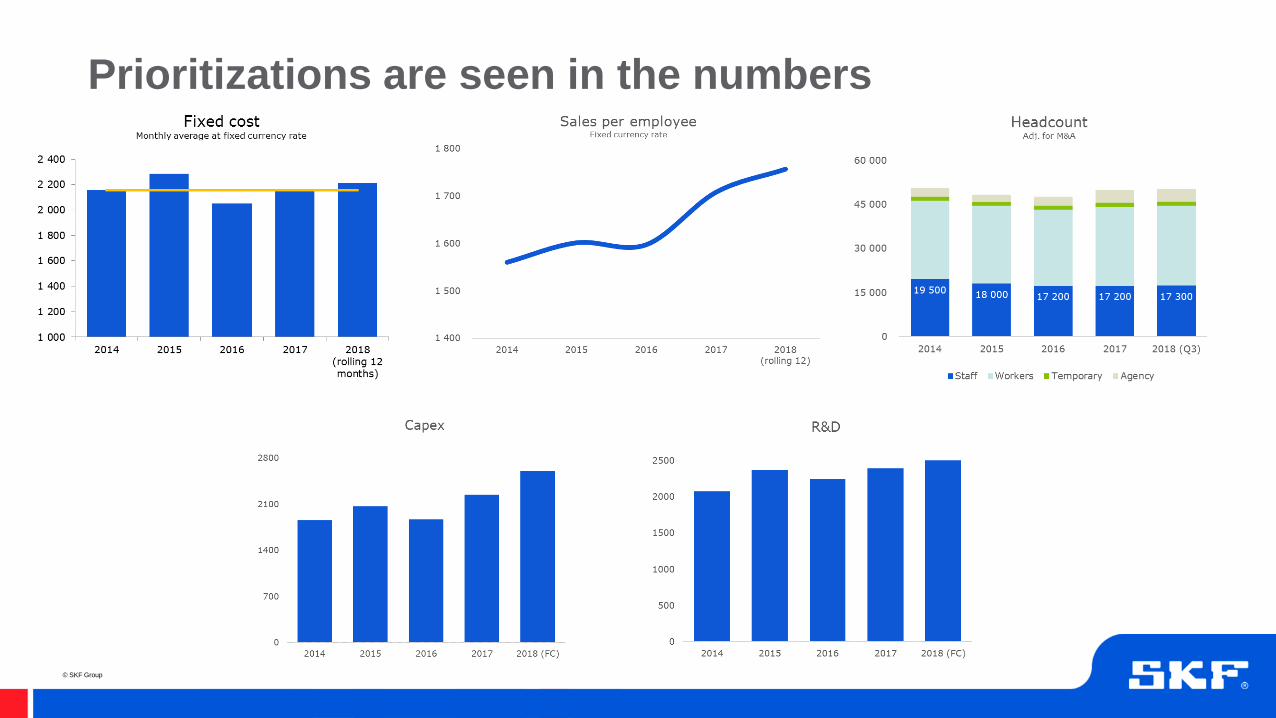
Prioritizations are seen in the numbers
© SKF Group
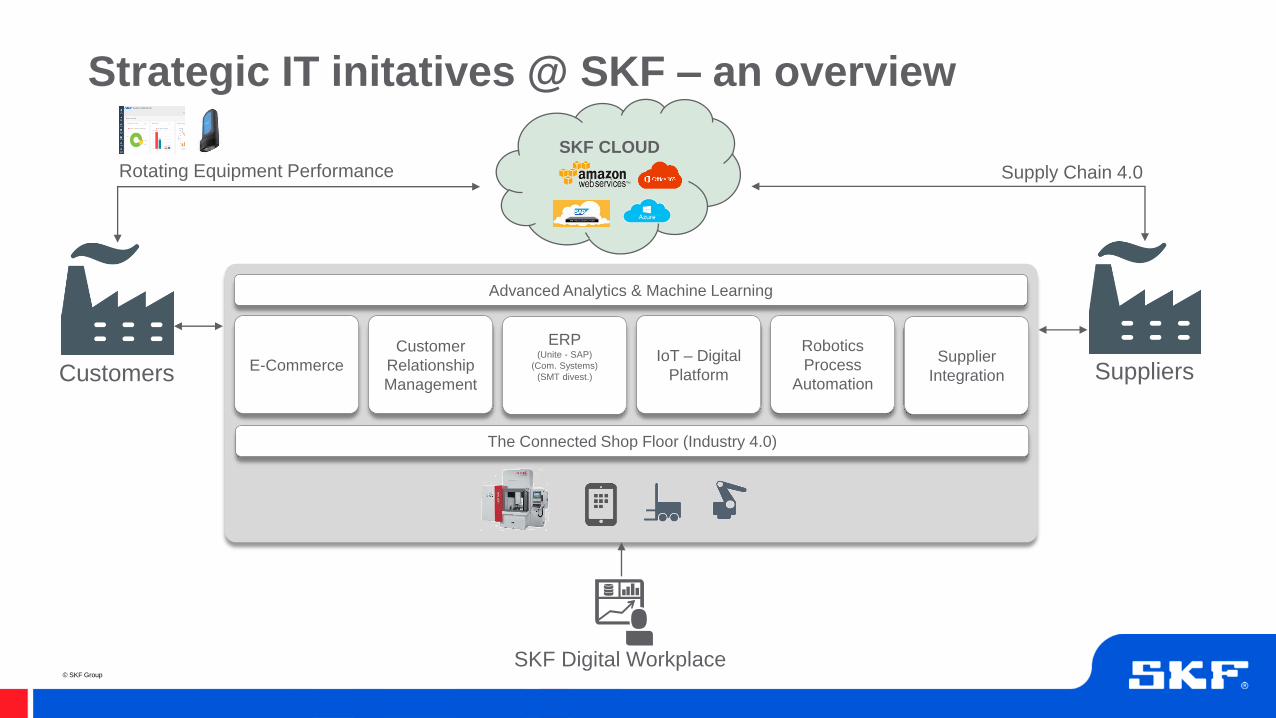
Strategic IT initatives @ SKF – an overview
The Connected Shop Floor (Industry 4.0)
E-Commerce
Customer
Relationship
ManagementCustomers Suppliers
SKF CLOUD
ERP(Unite - SAP)
(Com. Systems)
(SMT divest.)
IoT – Digital
Platform
Rotating Equipment Performance
Robotics
Process
Automation
Advanced Analytics & Machine Learning
Supplier
Integration
Supply Chain 4.0
SKF Digital Workplace
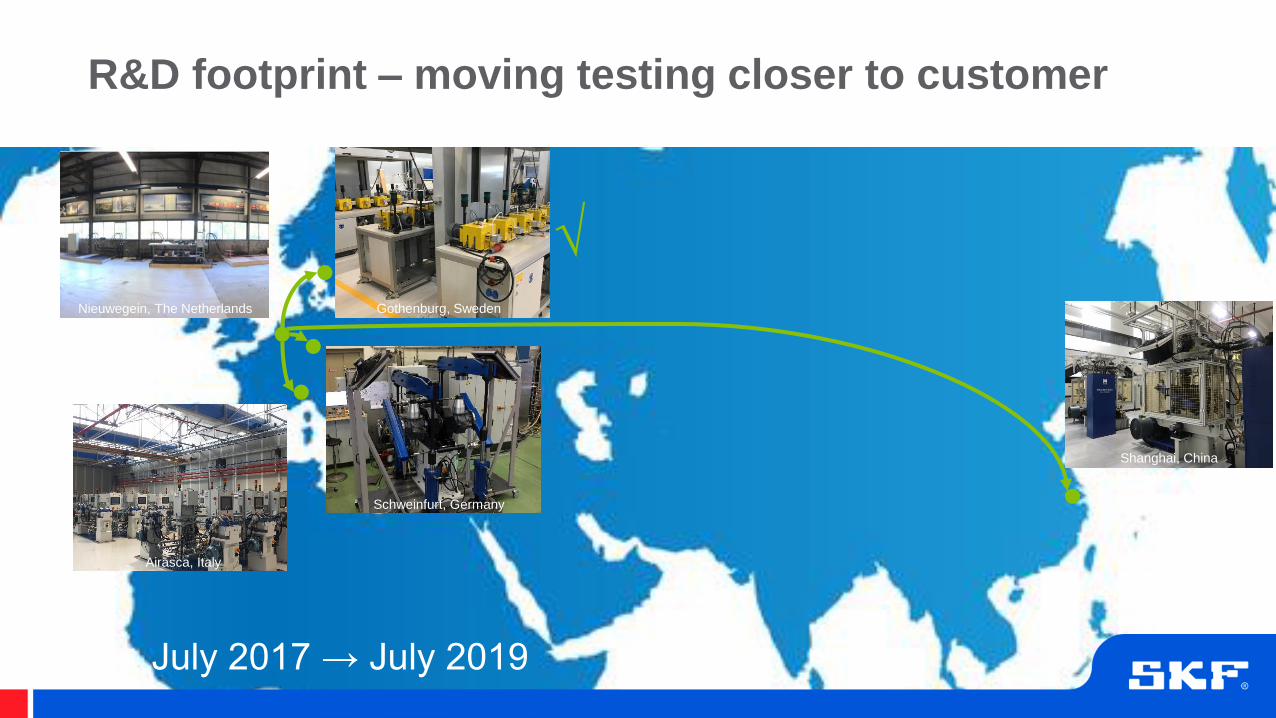
R&D footprint – moving testing closer to customer
Nieuwegein, The Netherlands
Shanghai, China
√
July 2017 → July 2019
Gothenburg, Sweden
Airasca, Italy
Schweinfurt, Germany

© SKF Group
New market offers for products and REP
Newly launched product offers New REP initiatives in Asia
© SKF Group
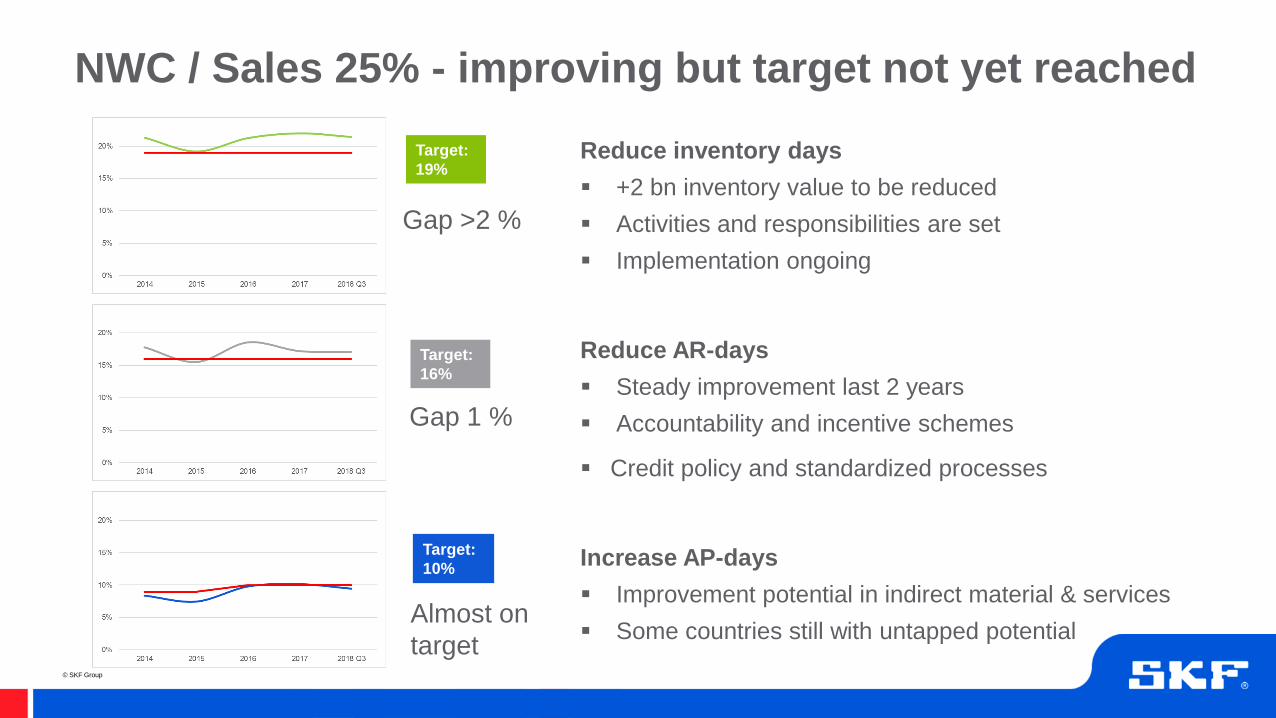
Reduce inventory days
▪ +2 bn inventory value to be reduced
▪ Activities and responsibilities are set
▪ Implementation ongoing
Reduce AR-days
▪ Steady improvement last 2 years
▪ Accountability and incentive schemes
▪ Credit policy and standardized processes
Increase AP-days
▪ Improvement potential in indirect material & services
▪ Some countries still with untapped potential
Target:
16%
Target:
19%
Target:
10%
Gap >2 %
Gap 1 %
Almost on
target
NWC / Sales 25% - improving but target not yet reached
© SKF Group
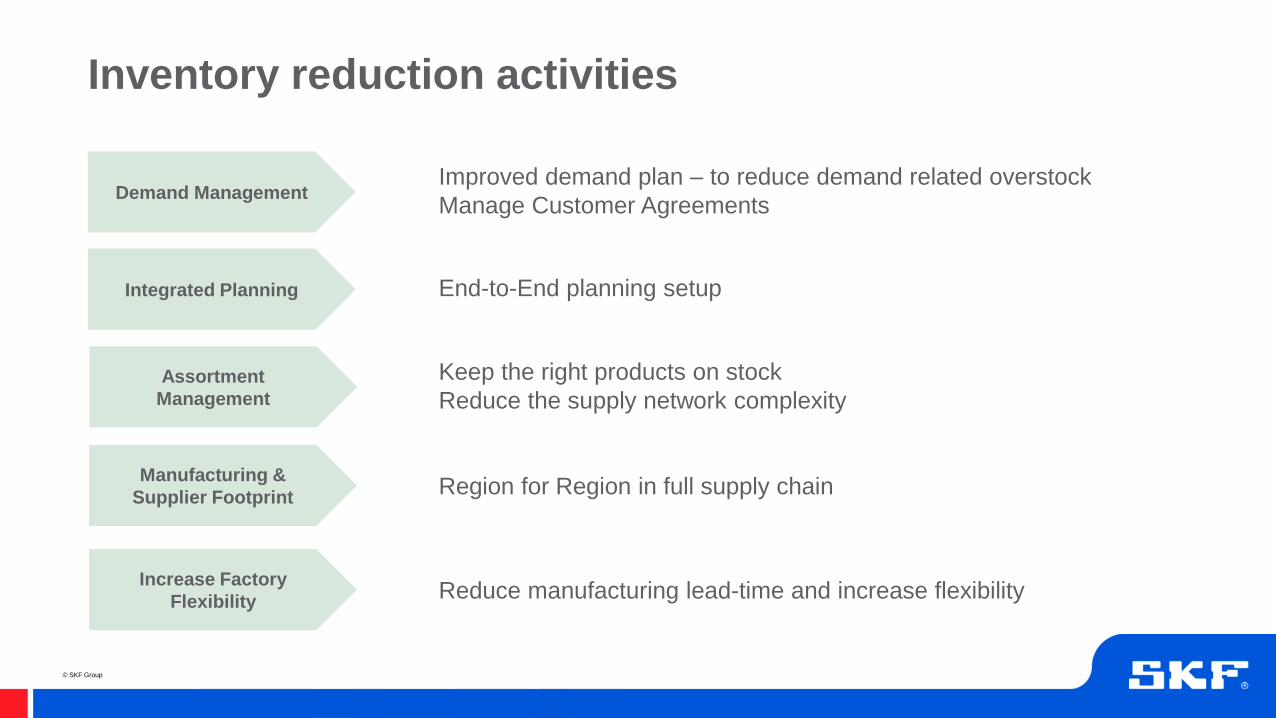
Inventory reduction activities
End-to-End planning setup
Region for Region in full supply chain
Reduce manufacturing lead-time and increase flexibility
Improved demand plan – to reduce demand related overstock
Manage Customer Agreements
Keep the right products on stock
Reduce the supply network complexity
Demand Management
Integrated Planning
Manufacturing &
Supplier Footprint
Increase Factory
Flexibility
Assortment
Management
© SKF Group
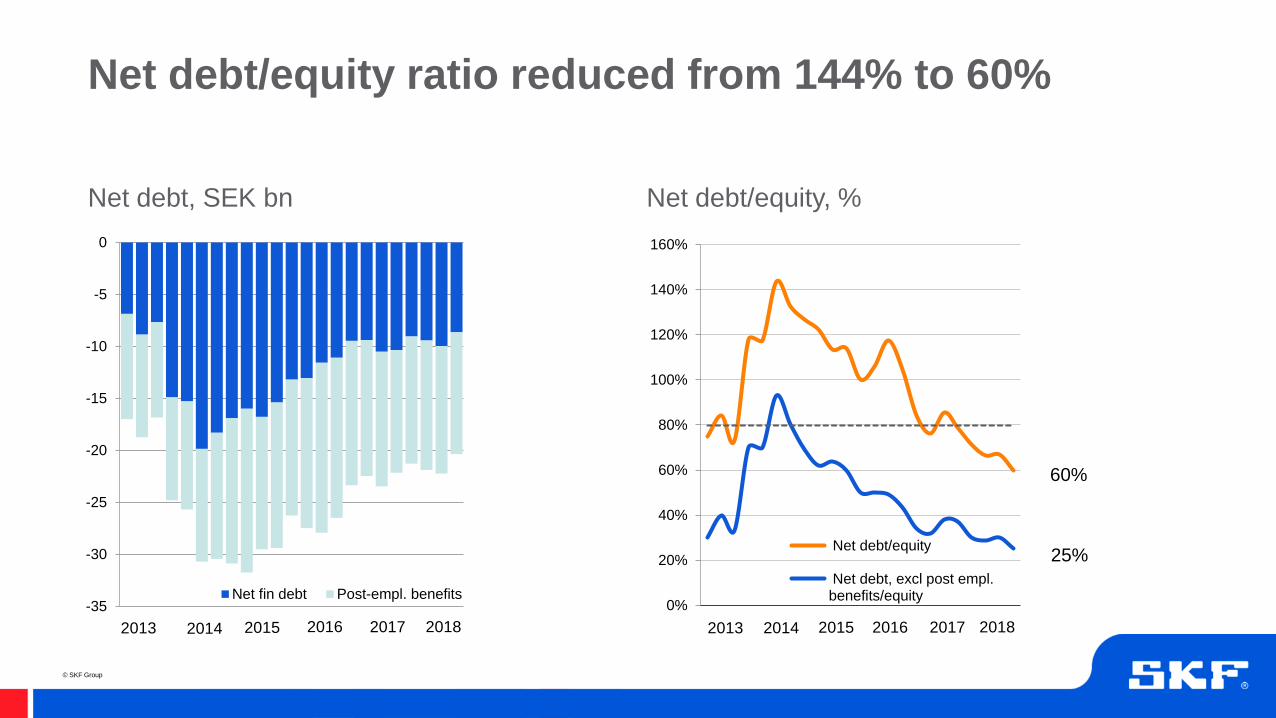
Net debt, SEK bn Net debt/equity, %
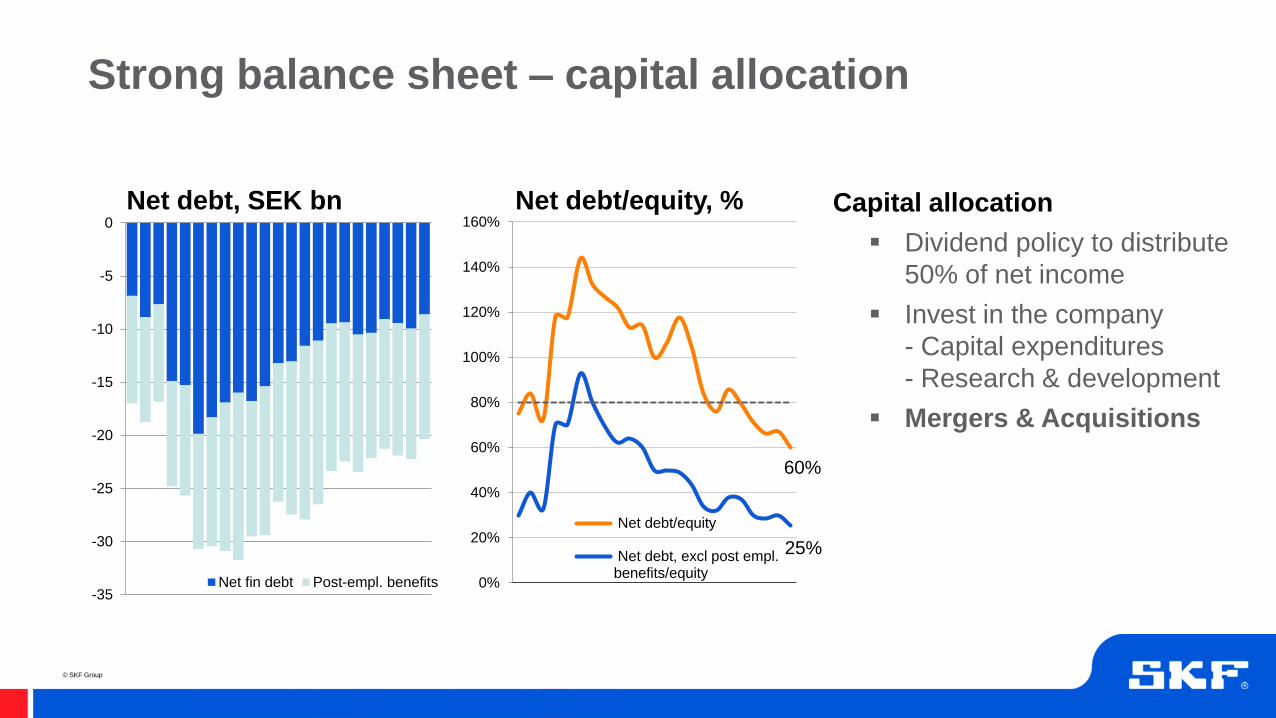
Net debt/equity ratio reduced from 144% to 60%
-35
-30
-25
-20
-15
-10
-5
0
Net fin debt Post-empl. benefits
2013 2014 2015 2016
0%
20%
40%
60%
80%
100%
120%
140%
160%
Net debt/equity
Net debt, excl post empl.benefits/equity
60%
2013 2014 2015 2016
25%
2017 2017 20182018
© SKF Group
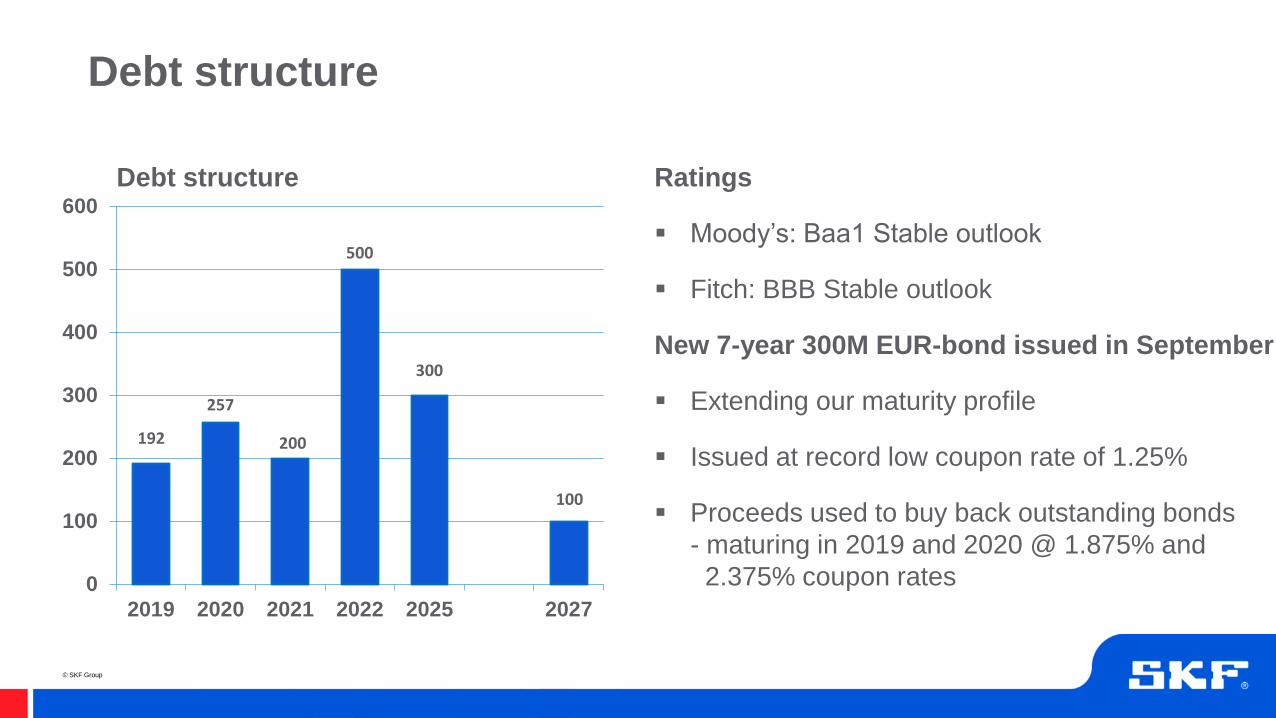
Debt structure
192
257
200
500
300
100
0
100
200
300
400
500
600
2019 2020 2021 2022 2025 2027
Ratings
▪ Moody’s: Baa1 Stable outlook
▪ Fitch: BBB Stable outlook
New 7-year 300M EUR-bond issued in September
▪ Extending our maturity profile
▪ Issued at record low coupon rate of 1.25%
▪ Proceeds used to buy back outstanding bonds
- maturing in 2019 and 2020 @ 1.875% and
2.375% coupon rates
Debt structure
© SKF Group
Strong balance sheet – capital allocation
Capital allocation
▪ Dividend policy to distribute
50% of net income
▪ Invest in the company
- Capital expenditures
- Research & development
▪ Mergers & Acquisitions
-35
-30
-25
-20
-15
-10
-5
0
Net fin debt Post-empl. benefits 0%
20%
40%
60%
80%
100%
120%
140%
160%
Net debt/equity
Net debt, excl post empl.benefits/equity
Net debt, SEK bn Net debt/equity, %
60%
25%
© SKF Group
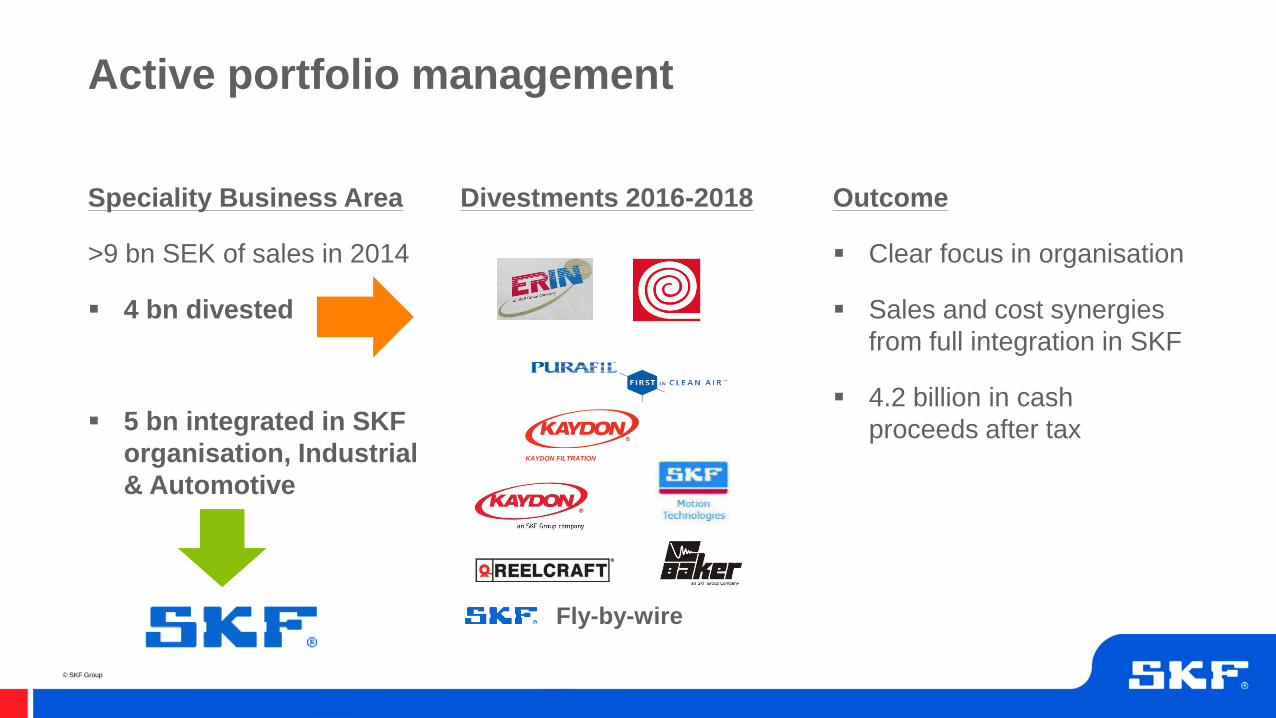
Speciality Business Area
>9 bn SEK of sales in 2014
▪ 4 bn divested
▪ 5 bn integrated in SKF
organisation, Industrial
& Automotive
Divestments 2016-2018
Fly-by-wire
Active portfolio management
Outcome
▪ Clear focus in organisation
▪ Sales and cost synergies
from full integration in SKF
▪ 4.2 billion in cash
proceeds after taxKAYDON FILTRATION
© SKF Group
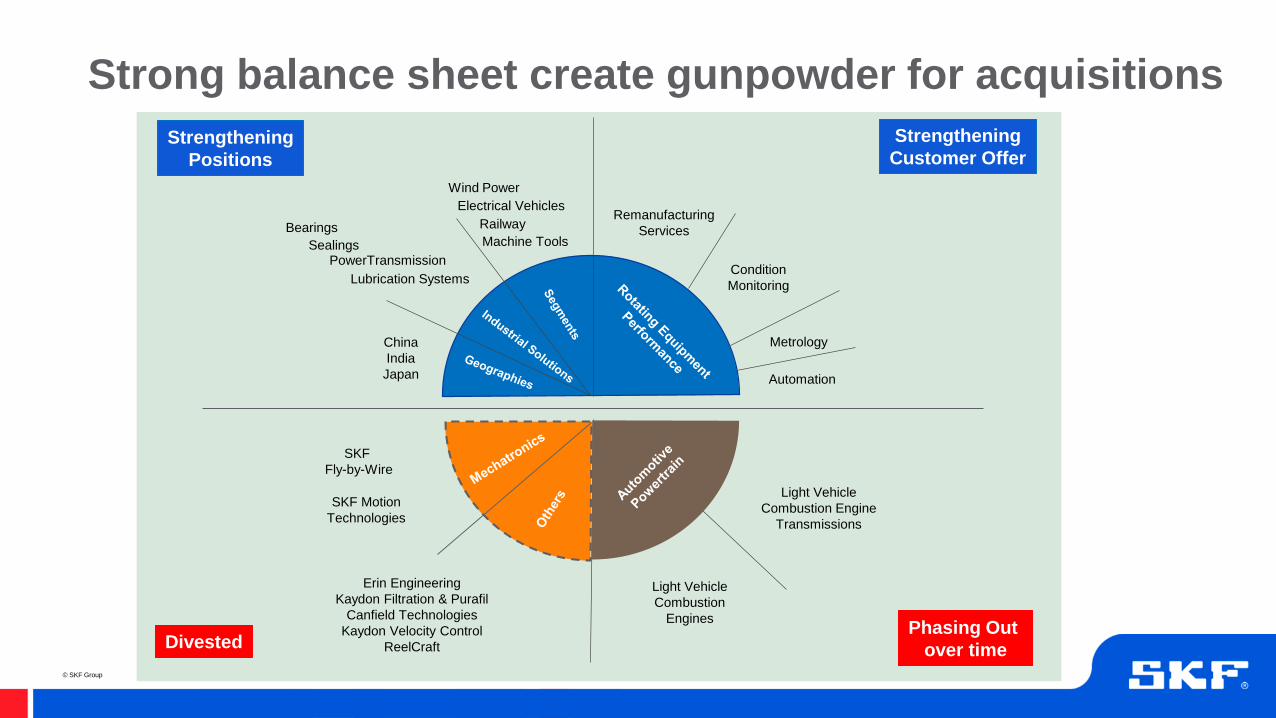
Railway
SKF Motion
Technologies
Light Vehicle
Combustion
Engines
SKF
Fly-by-Wire
Condition
Monitoring
Automation
Machine Tools
China
India
Japan
BearingsRemanufacturing
Services
Light Vehicle
Combustion Engine
Transmissions
Strengthening
Positions
Strengthening
Customer Offer
DivestedPhasing Out
over time
Sealings
Lubrication Systems
PowerTransmission
Electrical Vehicles
Wind Power
Metrology
Erin Engineering
Kaydon Filtration & Purafil
Canfield Technologies
Kaydon Velocity Control
ReelCraft
Strong balance sheet create gunpowder for acquisitions
© SKF Group
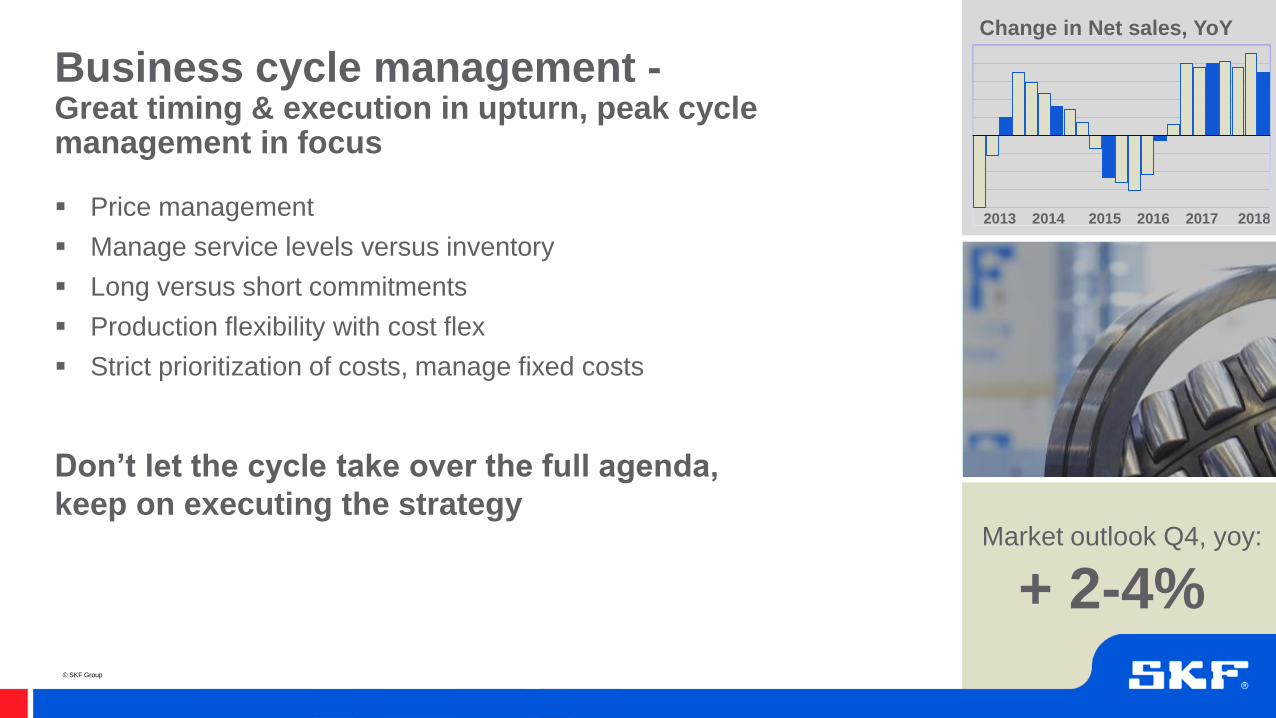
Market outlook Q4, yoy:
+ 2-4%
▪ Price management
▪ Manage service levels versus inventory
▪ Long versus short commitments
▪ Production flexibility with cost flex
▪ Strict prioritization of costs, manage fixed costs
Don’t let the cycle take over the full agenda,
keep on executing the strategy
Business cycle management -Great timing & execution in upturn, peak cycle management in focus
2013 2014 2015 2016 2017 2018
Change in Net sales, YoY
© SKF Group
▪ Historically best ever performance
▪ Accelerating for the future within tight frames
▪ Activities to reach 25% NWC to sales under implementation
▪ Strong balance sheet create gunpowder for acquisitions
▪ Peak cycle management in focus
Summary
Related Documents