Vol.:(0123456789) Journal of Atmospheric Chemistry https://doi.org/10.1007/s10874-021-09427-8 1 3 Size distributions and dry deposition fluxes of water‑soluble inorganic nitrogen in atmospheric aerosols in Xiamen Bay, China Shui‑Ping Wu, et al. [full author details at the end of the article] Received: 28 July 2021 / Accepted: 29 September 2021 © The Author(s), under exclusive licence to Springer Nature B.V. 2021 Abstract Size-segregated aerosol particles were collected using a high volume MOUDI sampler at a coastal urban site in Xiamen Bay, China, from March 2018 to June 2020 to examine the seasonal characteristics of aerosol and water-soluble inorganic ions (WSIIs) and the dry deposition of nitrogen species. During the study period, the annual average concentra- tions of PM 1 , PM 2.5 , PM 10 , and TSP were 14.8 ± 5.6, 21.1 ± 9.0, 35.4 ± 14.2 μg m −3 , and 45.2 ± 21.3 μg m −3 , respectively. The seasonal variations of aerosol concentrations were impacted by the monsoon with the lowest value in summer and the higher values in other seasons. For WSIIs, the annual average concentrations were 6.3 ± 3.3, 2.1 ± 1.2, 3.3 ± 1.5, and 1.6 ± 0.8 μg m −3 in PM 1 , PM 1-2.5 , PM 2.5–10 , and PM >10 , respectively. In addition, pro- nounced seasonal variations of WSIIs in PM 1 and PM 1-2.5 were observed, with the high- est concentration in spring-winter and the lowest in summer. The size distribution showed that SO 4 2− , NH 4 + and K + were consistently present in the submicron particles while Ca 2+ , Mg 2+ , Na + and Cl − mainly accumulated in the size range of 2.5–10 μm, reflecting their different dominant sources. In spring, fall and winter, a bimodal distribution of NO 3 − was observed with one peak at 2.5–10 μm and another peak at 0.44–1 μm. In summer, however, the fine mode peak disappeared, likely due to the unfavorable conditions for the formation of NH 4 NO 3 . For NH 4 + and SO 4 2− , their dominant peak at 0.25–0.44 μm in summer and fall shifted to 0.44–1 μm in spring and winter. Although the concentration of NO 3 –N was lower than NH 4 –N, the dry deposition flux of NO 3 –N (35.77 ± 24.49 μmol N m −2 d −1 ) was much higher than that of NH 4 –N (10.95 ± 11.89 μmol N m −2 d −1 ), mainly due to the larger deposition velocities of NO 3 –N. The contribution of sea-salt particles to the total particu- late inorganic N deposition was estimated to be 23.9—52.8%. Dry deposition of particulate inorganic N accounted for 0.95% of other terrestrial N influxes. The annual total N deposi- tion can create a new productivity of 3.55 mgC m −2 d −1 , accounting for 1.3–4.7% of the primary productivity in Xiamen Bay. In light of these results, atmospheric N deposition could have a significant influence on biogeochemistry cycle of nutrients with respect to projected increase of anthropogenic emissions from mobile sources in coastal region. Keywords Water-soluble inorganic nitrogen · Sea-salt · Size distribution · Dry deposition flux · New productivity

Welcome message from author
This document is posted to help you gain knowledge. Please leave a comment to let me know what you think about it! Share it to your friends and learn new things together.
Transcript
Vol.:(0123456789)
Journal of Atmospheric Chemistryhttps://doi.org/10.1007/s10874-021-09427-8
1 3
Size distributions and dry deposition fluxes of water‑soluble inorganic nitrogen in atmospheric aerosols in Xiamen Bay, China
Shui‑Ping Wu, et al. [full author details at the end of the article]
Received: 28 July 2021 / Accepted: 29 September 2021 © The Author(s), under exclusive licence to Springer Nature B.V. 2021
AbstractSize-segregated aerosol particles were collected using a high volume MOUDI sampler at a coastal urban site in Xiamen Bay, China, from March 2018 to June 2020 to examine the seasonal characteristics of aerosol and water-soluble inorganic ions (WSIIs) and the dry deposition of nitrogen species. During the study period, the annual average concentra-tions of PM1, PM2.5, PM10, and TSP were 14.8 ± 5.6, 21.1 ± 9.0, 35.4 ± 14.2 μg m−3, and 45.2 ± 21.3 μg m−3, respectively. The seasonal variations of aerosol concentrations were impacted by the monsoon with the lowest value in summer and the higher values in other seasons. For WSIIs, the annual average concentrations were 6.3 ± 3.3, 2.1 ± 1.2, 3.3 ± 1.5, and 1.6 ± 0.8 μg m−3 in PM1, PM1-2.5, PM2.5–10, and PM>10, respectively. In addition, pro-nounced seasonal variations of WSIIs in PM1 and PM1-2.5 were observed, with the high-est concentration in spring-winter and the lowest in summer. The size distribution showed that SO4
2−, NH4+ and K+ were consistently present in the submicron particles while Ca2+,
Mg2+, Na+ and Cl− mainly accumulated in the size range of 2.5–10 μm, reflecting their different dominant sources. In spring, fall and winter, a bimodal distribution of NO3
− was observed with one peak at 2.5–10 μm and another peak at 0.44–1 μm. In summer, however, the fine mode peak disappeared, likely due to the unfavorable conditions for the formation of NH4NO3. For NH4
+ and SO42−, their dominant peak at 0.25–0.44 μm in summer and
fall shifted to 0.44–1 μm in spring and winter. Although the concentration of NO3–N was lower than NH4–N, the dry deposition flux of NO3–N (35.77 ± 24.49 μmol N m−2 d−1) was much higher than that of NH4–N (10.95 ± 11.89 μmol N m−2 d−1), mainly due to the larger deposition velocities of NO3–N. The contribution of sea-salt particles to the total particu-late inorganic N deposition was estimated to be 23.9—52.8%. Dry deposition of particulate inorganic N accounted for 0.95% of other terrestrial N influxes. The annual total N deposi-tion can create a new productivity of 3.55 mgC m−2 d−1, accounting for 1.3–4.7% of the primary productivity in Xiamen Bay. In light of these results, atmospheric N deposition could have a significant influence on biogeochemistry cycle of nutrients with respect to projected increase of anthropogenic emissions from mobile sources in coastal region.
Keywords Water-soluble inorganic nitrogen · Sea-salt · Size distribution · Dry deposition flux · New productivity
Journal of Atmospheric Chemistry
1 3
1 Introduction
Size distribution of atmospheric particulate matter (PM) has been a concern of scientists for decades because it is closely related to the source and aerodynamic behavior and for-mation mechanisms. In general, the coarse particles (between 2.5 and 10 μm) are emitted directly into the atmosphere from natural sources such as sea-salt from bubble bursting and wind-blown crustal dust, whereas the fine particles (< 2.5 μm) are mainly from anthro-pogenic sources and secondary particles formed by gas-to-particle conversion processes (Senifeld and Pandis 2006). The fine- and coarse-mode particles concentrations are, how-ever, essentially independent of each other. Both the particle size and chemical composi-tion are crucial to evaluate their atmospheric lifetime, identify their major sources, under-stand their environmental and health effects, and quantify their radiative effects.
The major chemical compositions of PM include organic carbon, elemental carbon, water-soluble inorganic ions (WSIIs) and elements. Previous studies found that the propor-tion of WSIIs in PM2.5 varied between 20–77% and the secondary inorganic ions including SO4
2−, NO3− and NH4
+ (SNA) constituted the majority of WSIIs (Huang et al. 2014; Wu et al. 2020). According to Senifeld and Pandis (2006), Ca2+, Mg2+, Cl− and Na+ in the urban area are more abundant in the coarse mode particles, SO4
2− and NH4+ are found to
predominately in the fine mode, and NO3− exhibits a fine peak and a coarse peak depending
on aerosol composition and environmental conditions. The mass fractions of SNA in fine particles have been found to increase significantly during haze episode and the size distri-bution peaks of NO3
− and SO42− in the droplet mode also tended to move to a larger size
(Huang et al. 2016; Tian et al. 2014; Wu et al. 2020). In Canad rural area, NO3− showed
only one coarse mode peak at 4.0—7.0 μm; furthermore, the mass median aerodynamic diameters of fine mode NO3
− (~ 1 μm) at coastal sites were higher than at non-coastal sites (0.38–0.66 μm) (Zhang et al. 2008). Similarily, the concentrations and size distributions of NO3
− at a coastal site in Ningbo, a city in the Yangtz River Delta (YRD) region in China, showed obvious seasonal variations with a very minor peak in the size of 0.43–1.1 μm and a dominant peak peak at 4.7–5.8 μm in summer (Zhang et al. 2018). In summer in the coastal region in the Pearl River Delta (PRD), South China, 26.6% of NO3
− in PM10 could be attributable to sea-salt emissions because of the heterogeneous reaction of HNO3 on the surface of sea-salt particles while the portions decreased to less than 1% in the inland areas (Liu et al. 2015). However, at an inland site in the PRD region, NO3
− showed unimodal size distributions with peak at 0.56–1.0 μm in winter but bimodal ones in summer with peaks at 3.2–5.6 μm and 0.56–1 μm (Huang et al. 2020). In Beijing, the size distributions of NO3
− were bimodal types for the four seasons, with a dominant peak in the size range of 0.43–1.1 μm and a minor peak in the size range of 4.7–5.8 μm (Huang et al. 2016).
Apparently, the size distributions of WSIIs are strongly influenced by ambient tem-perature, geopraphical location, and air pollution level. Nevertheless, the size distributions of WSIIs have been investigated generally only during haze episodes, or representative months in two or four seasons (Zhang et al. 2008, 2018; Huang et al. 2016, 2020; Wu et al. 2019). The typical pollution characteristics and size distributions of WSIIs throughout the year have rarely been compared or analyzed comprehensively. The insufficient coverage of samples for the whole year may well contribute to the uncertainity of the nitrogen (N) deposition flux, which is a function of size-dependent particle dry deposition velocity and size-segragated N species (Senifeld and Pandis 2006; Zhu et al. 2013; Qi et al. 2020). The size-dependent dry deposition velocity is a critical factor in estimating the deposition flux. Atmospheric deposition of reactive N may serve as an important external N supplier to the
Journal of Atmospheric Chemistry
1 3
ecosystem and result in the change in the nutrient stoichiometry and contribute to ocean primary production and global N cycle (Srinivas et al. 2011; Taketani et al. 2018; Wu et al. 2019). In addition, the partition of gaseous HNO3 to sea-salt particles and crustal dusts would result in a spatially widespread deposition of the inorganic fixed N species to the open sea due to the relative lower deposition velocities of the aerosol species with respect to gaseous HNO3 and the higher HNO3 removal efficiency by precipitation (Spokes and Jickells 2005; Seinfeld and Pandis 2006; Zhu et al. 2013). The size-resolved measurements of Na+, NH4
+, and NO3− from coastal stations and offshore islands would be of high value
in validating the impacts of sea-salt particles on atmospheric N deposition (Neumann et al. 2016). In East Asian oceans, the coarse-mode nitrate produced via sea-salt surface het-erogeneous reactions increased the total dry deposition amounts of reactive oxygenated nitrogen by a factor of two (Itahashi et al. 2016). In the western Taiwan Strait region, the contribution of nitrate associated with sea-salt to particulate inorganic N deposition was estimated to be 20.3–36.9% (Wu et al. 2019).
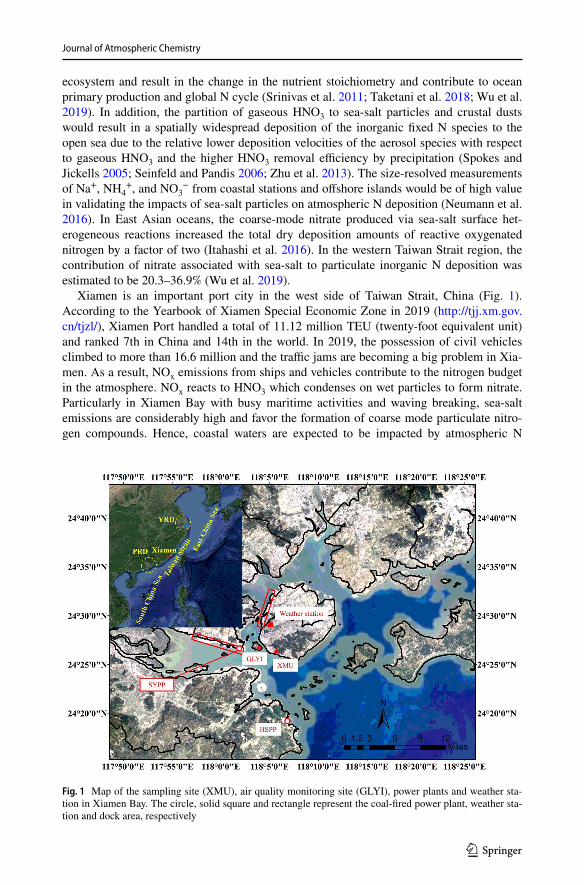
Xiamen is an important port city in the west side of Taiwan Strait, China (Fig. 1). According to the Yearbook of Xiamen Special Economic Zone in 2019 (http:// tjj. xm. gov. cn/ tjzl/), Xiamen Port handled a total of 11.12 million TEU (twenty-foot equivalent unit) and ranked 7th in China and 14th in the world. In 2019, the possession of civil vehicles climbed to more than 16.6 million and the traffic jams are becoming a big problem in Xia-men. As a result, NOx emissions from ships and vehicles contribute to the nitrogen budget in the atmosphere. NOx reacts to HNO3 which condenses on wet particles to form nitrate. Particularly in Xiamen Bay with busy maritime activities and waving breaking, sea-salt emissions are considerably high and favor the formation of coarse mode particulate nitro-gen compounds. Hence, coastal waters are expected to be impacted by atmospheric N
Fig. 1 Map of the sampling site (XMU), air quality monitoring site (GLYI), power plants and weather sta-tion in Xiamen Bay. The circle, solid square and rectangle represent the coal-fired power plant, weather sta-tion and dock area, respectively
Journal of Atmospheric Chemistry
1 3
deposition (Wu et al. 2018, 2019). To better understand the development process of parti-cle pollution and the effects of sea-salt on the dry deposition of particulate inorganic N, the size-segregated aerosols were collected from March 2018 to June 2020 at an urban coastal site in Xiamen Bay. Seasonal variations and size distributions of WSIIs (Cl−, NO3
−, SO42−,
Na+, NH4+, Mg2+, Ca2+ and K+) as well as influencing factors and particulate N deposition
were investigated in this study. This site is an ideal area to study the impact of sea-salt on air pollution and atmospheric N deposition into Xiamen Bay.
2 Materials and methods
2.1 Collection of size‑segregated particles
A Micro-Orifice Uniform Deposition Impactor (MOUDI) sampler (Model M131, MSP Co., USA) with nominal cut sizes of 0.25, 0.44, 1.0, 1.4, 2.5, 10, and 16 μm (inlet) was used to collect size-segregated samples. The sampler was located on the rooftop of a six-story labs building on the campus of Xiamen University (24.45°N, 118.08°E) and oper-ated at a flow rate of 100 L min−1. The site is situated between two busy roads and about 2 km from the main shipping channel of Xiamen Port (Fig. 1). In addition, the site may also be affected two power plants, Songyu Power Plant (SYPP, 6.6 km to the west of XMU) and Houshi Power Plant (HSPP, 14.8 km to the south of XMU). Polycarbonate membrane (75 mm, PCTE-2.0, Tisch) and quartz filters (90 mm, Tissuquartz-2500QAT-UP, Pallflex) were used to collect particles > 0.25 μm and < 0.25 μm, respectively. The quartz filters were pre-combustion at 600 °C for at least 4 h in a muffle furnace to remove organic impurities. All filters were individually kept in plastic Petri dishes and equili-brated in a desiccator for 48 h at a temperature of 20 ± 5 °C and a relative humidity of 30 ± 5% before and after sampling. Mass concentrations of size-segregated particles were obtained by gravimetry method with a microbalance (Sartorius BT 125D, ± 0.01 mg). Sampling was performed from March 2018 to June 2020 excluding February 2019 due to the Spring Festival holiday. The sampling duration of individual samples was around 48 h at a frequency of 3–5 times a month. A total of 122 sets of MOUDI samples were routinely collected for water-soluble inorganic ions analysis: 36 for spring (March–May), 39 for summer (June–September), 20 for fall (October–November) and 27 for winter (December-February). The climate of Xiamen is sub-tropical and strongly influenced by the East Asian monsoon. The prevailing wind blows from the northeast in fall and winter and the southwest in summer. The highest average monthly temperature in Xiamen Island occurs in July (28.6 °C) and the lowest average monthly temperature occurs in February (14.1 °C). Precipitation is mainly concentrated in summer due to the typhoon. The aver-age wind speed is higher in fall and winter than in summer and spring.
The daily average values of criteria air pollutants (CO, SO2, NO2, O3, PM2.5 and PM10) from an air quality monitoring site located in Gulangyu Island (GLYI, 2.5 km to the northwest of XMU) were obtained from the China National Urban Air Quality real-time Publishing Platform (http:// 106. 37. 208. 233: 20035/). Meteorological parame-ters including wind speed/direction (WS/WD), relative humidity (RH), temperature (T), pressure (P), visibility (Vis) and rainfall (RF) were from a weather station located in Xiamen Island (http:// rp5. ru/ archi ve. php? wmo_ id= 59134 & lang= cn), about 5.4 km to the north of XMU. The PM2.5 and PM10 concentrations derived from the MOUDI sam-pling system at XMU were comparable to the average values at GLYI using TEOM
Journal of Atmospheric Chemistry
1 3
monitors during the same sampling period (Sect. S1 and Fig. S1). Both the local emis-sion sources and different monitoring methods might contribute to the differences between the two sites.
2.2 Chemical analysis
A half of each filter was cut into a polypropylene centrifuge tube and ultrasonically extracted using 20 mL ultra-pure water for 30 min. In order to prevent the loss of ammo-nium, ice was placed into the water tank to maintain a constant temperature. The extract was filtered through a hydrophilic PTFE syringe filter (13 mm × 0.22 μm). Then 5 mL ultra-pure water was added to the tube to rinse and filter again. The two extracts were then combined, resulting in a 25 mL solution. The cations (Na+, NH4
+, Mg2+, Ca2+ and K+) and anions (Cl−, NO3
− and SO42−) were determined using an ion-chromatography system (PIC-
10, Qiangdao Puren Instruments Co., China) equipped with a conductivity detector. The details of the method and quality control data such as detection limits, recovery rates and analytical precision were previously reported (Wu et al. 2019).
2.3 Dry deposition flux of particulate inorganic nitrogen
The dry deposition flux Fd (µg N m−2 d−1) of inorganic nitrogen in size-segregated parti-cles was calculated using the inferential method:
Here, Vdi and Ci represent the dry deposition velocity (cm s−1) and concentration (μg N m−3) of particulate inorganic nitrogen in size range i. The Vdi is the size-dependent deposi-tion velocity depending on weather conditions such as wind speed, humidity (hygroscopic growth) and air temperature as well as particle density and sea-surface roughness and was calculated by using the formula of Slinn (1982):
where Ra is the aerodynamic resistance; Rsi and Vgi are the surface resistance and the gravi-tational settling velocity for an individual interval i, respectively. More details regarding the parameterization of Ra , are shown in Sect. S2 and the calculation methods of Rsi and Vgi can be found in Zhang et al. (2001). Size-dependent particle dry deposition velocities (80% RH and 25 °C) varied wind speed of 1–10 m s−1 (Fig. S2).
In previous studies, dry deposition fluxes on the surface ocean were estimated based on TSP, PM2.5 or PM10 measurements due to the lack of size distribution. The average deposi-tion velocities of 0.1 cm s−1 for fine and 2 cm s−1 for coarse aerosols (Yeatman et al. 2001; Baker et al. 2003; Nakamura et al. 2005), 0.1–0.6 cm s−1 for NH4
+ and 1.15–2 cm s−1 for NO3
− (Zhu et al. 2013; Qi et al. 2020) were assumed. Therefore, substantial errors would be associated with the estimation of deposition flux using a constant deposition velocity. In this study, we calculated the mass weighted dry deposition velocity of inorganic nitrogen species using the dry deposition velocities in the different size ranges and compared the values to the constant dry deposition velocities in the literatures.
(1)Fd =
∑
Fdi =
∑
Ci ∙ Vdi
(2)Vdi =1
Ra + Rsi
+ Vgi
Journal of Atmospheric Chemistry
1 3
3 Results and discussion
3.1 Mass size distribution of airborne particles
The concentrations of total suspended particle (TSP) were calculated as the sum of the eight size classes of particles. The monthly mean values of TSP were rather variable during the study period and varied from 24.4 μg m−3 in June 2020 to 75.4 μg m−3 in April 2018 with an average of 45.2 ± 21.3 μg m−3 (Fig. S3). The average concentration of PM10, PM2.5, and PM1 was 35.4 ± 14.2 μg m−3, 21.1 ± 9.0 μg m−3, and 14.8 ± 5.6 μg m−3, respectively. The variations of TSP concentrations were highly related to the cycle of the East Asian monsoon. The lowest mean values of TSP were typically found in summer when the clean air masses mainly came from the South China Sea and Taiwan Strait (Fig. S4). However, the northeasterly and northerly winds in spring, fall and winter were likely to bring air pol-lutants from upwind areas along the east coast and increase particle concentration.
The size distribution of particles can provide information about the origins of par-ticles and the physical and chemical processes affecting particles as they are transported in the atmosphere (Huang et al. 2016). The measured size distributions of particles were bimodal during all seasons (Fig. S3b), with the dominant peak in the size range of 2.5—10 μm (PM2.5–10) accounting for 33.5±4.7% of TSP and a minor peak in the range of 0.44—1 μm (PM0.44–1) accounting of 16.1±4.2% of TSP in general. The size spectra of mass concentration were different from those observed in YRD urban agglomeration with peaks at 0.43—0.65 μm (Wang et al. 2015) and Po Valley in Northern Italy with peaks at 1.0–1.8 μm in winter and main peaks at 3.2–5.6 μm and sub-peaks at 0.32–0.56 in sum-mer (Canepari et al. 2019). Moreover, the concentration of PM2.5–10 displayed the order of fall > spring > winter > summer, which was different from that of PM0.44–1 with a sequence of winter > spring > fall > summer. Typically, coarse particles (> 2.5 μm) originate from natural and/or anthropogenic mechanical sources, while the fine particles (< 2.5 μm) are derived mainly from anthropogenic sources (Seinfeld and Pandis 2006). In Xiamen, there is little precipitation in fall and the weather is dry and windy and the average temperature is more than 20 °C (Fig. S5). Increase in wind speed enhances sea-salt production and the wind-driven resuspension of fugitive dust (Prijith et al. 2014), of which a great part was coarse mode. However, there was no positive correlation between size-segregated PM and WS but significant negative correlations were found between RH and PM in the size range of 1.4–16 μm (Table S1).
It is evident from Table S1 that, the relationship between gaseous pollutants (SO2, NO2 and CO) and PM with a diameter of less than 10 μm were stronger than with PM>16 and PM10-16, indicating that a large part of PM10 and gaseous pollutants might come from the same sources such as fossil fuel combustion. In summer, the concentrations of SO2 and NO2 were lower than in winter due to the relatively rapid dispersion (Fig. S6), which could further limit the formation of secondary inorganic aerosols. In addition, their higher concentrations in winter in combination with lower T and WS (Fig. S5) might favor the gas-to-particle conversation and the accumulation of secondary aerosol. The correlations between O3 and size-segregated particles were not consistent, and there was no correlation between PM and RF. It seemed that the fine particles showed better correlations with T, P and Vis, while there was no consistent relationship between size-segregated PM and WS. Since atmospheric sulfate mainly exists in the condensation mode and droplet mode (Liu et al. 2017; Behera et al. 2015) and plays the most important role in decreasing visibility, PM0.44–1 and PM1-1.4 had the strongest correlations with visibility (r = -0.663 and -0.575,
Journal of Atmospheric Chemistry
1 3
p < 0.001). Although PM0.44–1 was significantly negatively correlated with WS (r = -0.275, p < 0.01), there was no correlation between PM2.5–10 and WS. Therefore, the relative high concentrations of PM2.5–10 in fall were more related to low RH and air masses over the coastal region than with high wind speed. The seasonal characteristics of PM loading in the study area can be explained by the combined effects of natural and anthropogenic sources, meteorological parameters, and regional transboundary transport.
3.2 Mass concentrations of water‑soluble inorganic ions
Our measurements of WSIIs over the study period varied between 5.1 and 35.0 μg m−3, with an average value of 13.2 ± 6.1 μg m−3. The mass concentrations of WSIIs accounted for 16.9 – 49.9% of TSP mass with an average mean of 30.4 ± 6.1%. Among the eight species, sulfate, nitrate and ammonium were the most abundant ions, accounting for 30.7±6.8%, 29.1±8.6, and 12.9±4.0% of the TWSIs, respectively. The concentrations of other ionic species followed the order of Na+ > Ca2+ > Cl− > K+ > Mg2+ (Fig. S7a). However, the equivalent concentrations of NH4
+ were higher than that of NO3− and SO4
− (Fig. S7b), suggesting that NH4
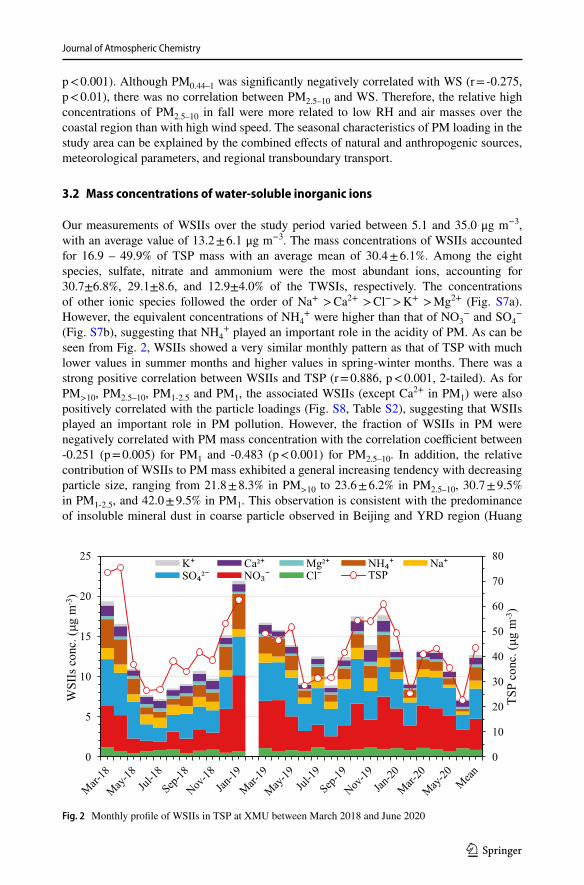
+ played an important role in the acidity of PM. As can be seen from Fig. 2, WSIIs showed a very similar monthly pattern as that of TSP with much lower values in summer months and higher values in spring-winter months. There was a strong positive correlation between WSIIs and TSP (r = 0.886, p < 0.001, 2-tailed). As for PM>10, PM2.5–10, PM1-2.5 and PM1, the associated WSIIs (except Ca2+ in PM1) were also positively correlated with the particle loadings (Fig. S8, Table S2), suggesting that WSIIs played an important role in PM pollution. However, the fraction of WSIIs in PM were negatively correlated with PM mass concentration with the correlation coefficient between -0.251 (p = 0.005) for PM1 and -0.483 (p < 0.001) for PM2.5–10. In addition, the relative contribution of WSIIs to PM mass exhibited a general increasing tendency with decreasing particle size, ranging from 21.8 ± 8.3% in PM>10 to 23.6 ± 6.2% in PM2.5–10, 30.7 ± 9.5% in PM1-2.5, and 42.0 ± 9.5% in PM1. This observation is consistent with the predominance of insoluble mineral dust in coarse particle observed in Beijing and YRD region (Huang
Fig. 2 Monthly profile of WSIIs in TSP at XMU between March 2018 and June 2020
Journal of Atmospheric Chemistry
1 3
et al. 2016; Wang et al. 2015). The highest contribution of WSIIs to particle population was found in PM1 − likely related to the fact that secondary sulfate, nitrate and ammonium formation via homogeneous and heterogeneous transformation tend to accumulate in fine particles (Seinfeld and Pandis 2006).
From the monthly variations of WSIIs in Fig. 2, the temporal variations of NH4+, NO3
−, Ca2+ and K+ were more obvious than other ions, being higher in winter (NH4
+ and NO3−)
and fall (Ca2+ and K+) and lower in summer. The significant negative correlations between the above ionic species and T were detected while SO4
2−, Cl−, Na+ and Mg2+ were uncor-related with T (Table S3), suggesting their different thermal stability and/or different emis-sion sources. High temperature in summer (more than 28 °C) (Fig. S5) was unfavorable for the formation of NH4NO3 through the homogeneous reaction between NH3 and HNO3; meanwhile more K+ from biomass burning in fall and winter from north and east China could be transported to this site. The seasonality of NH4
+ and NO3− was similar to those
reported in PRD and YRD (Yue et al. 2015; Wang et al. 2015), but different from the sea-sonal pattern in Beijing, which showed obvious high levels in summer (Huang et al. 2016; Li et al. 2013; Liu et al. 2017). In summer, Beijing is frequently influenced by the more polluted air masses from Heibei and Shandong provinces, and the humid climate is also favorable for the rapid formation of secondary inorganic aerosol. Na+, Mg2+, Ca2+ and K+ showed negative correlations with RH and RF, indicating that their fugitive dust sources might be subjected to the wash-out by rain and the reduced resuspension by wet weather. The significant positive correlation between Ca2+ and WS (r = 0.289, p < 0.001) reinforced the contribution of wind-driven resuspension of fugitive dust to coarse Ca2+. Obvious sea-sonal changes of Cl− and Na+ were not observed and both showed no correlation with wind speed. Thus, the variations of sea-salt was more influenced by the local waves breaking on the shore as the investigated site is very close to the seashore. However, SO4
2− and NO3
− were more likely to accumulate in the atmosphere under low wind speed. It is noted that only SNA showed significant negative correlations with visibility, confirming the important role of ammonium sulfate and ammonium nitrate in visibility impairment (Wu et al. 2020; Cao et al. 2012). The three secondary ionic species were also often observed to increase rapidly under adverse weather conditions (Huang et al. 2014; Dai et al. 2018). The statistically significant correlations between WSIIs (except Cl− and Na+) and gaseous pollutants (NO2 and SO2) were similar to those observed for PM in Table S1 because they were all strongly controlled by the seasonal shift in the temperature, the prevailing wind direction and the mixing layer height. These findings indicate that the formation of second-ary water-soluble ions in fine particles might speed up under low T and WS and high gase-ous precursors and particle loading. In fact, winter-spring witnessed the higher concentra-tions of SO2 and NO2 with respect to that in summer (Fig. S6). In this study, both PM and WSIIs concentrations in February 2020 were significant lower than in January and March 2020 due to the dramatic decrease in anthropogenic emissions during the Lunar New Year holiday and the COVID-19 pandemic lockdown.
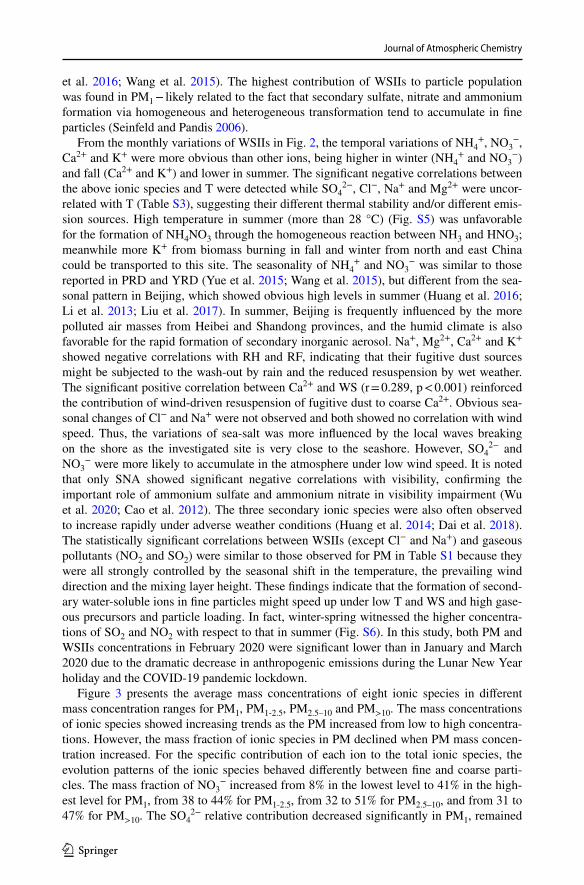
Figure 3 presents the average mass concentrations of eight ionic species in different mass concentration ranges for PM1, PM1-2.5, PM2.5–10 and PM>10. The mass concentrations of ionic species showed increasing trends as the PM increased from low to high concentra-tions. However, the mass fraction of ionic species in PM declined when PM mass concen-tration increased. For the specific contribution of each ion to the total ionic species, the evolution patterns of the ionic species behaved differently between fine and coarse parti-cles. The mass fraction of NO3
− increased from 8% in the lowest level to 41% in the high-est level for PM1, from 38 to 44% for PM1-2.5, from 32 to 51% for PM2.5–10, and from 31 to 47% for PM>10. The SO4
2− relative contribution decreased significantly in PM1, remained
Journal of Atmospheric Chemistry
1 3
constant in PM1-2.5 and PM2.5–10, and increased slightly in PM>10 as the PM mass con-centration increased. For NH4
+, the mass fraction increased slightly in PM1 and PM1-2.5 but remained constant in PM2.5–10 and PM>10 with PM mass concentration. This indicated that NO3
− and NH4+ formation seemed to be more sensitive to fine particle pollution than
SO42− at the investigated site. Similar variations were also found in Xi’an and Beijing
where annual PM2.5 levels have never attained the air environment quality level-2 standard in China (Dai et al. 2018; Tan et al. 2018). In coarse particles, the mass fractions of Cl− and Na+ displayed a trend of slight decrease with PM mass concentration, indicating that sea-salt might play a less decisive role at the coastal site on the incremental PM. For Ca2+, the mass fraction showed different evolution between fine and coarse mode particles, prob-ably because it is mainly concentrated in the coarse mode.
3.3 Size distribution of water‑soluble inorganic nitrogen
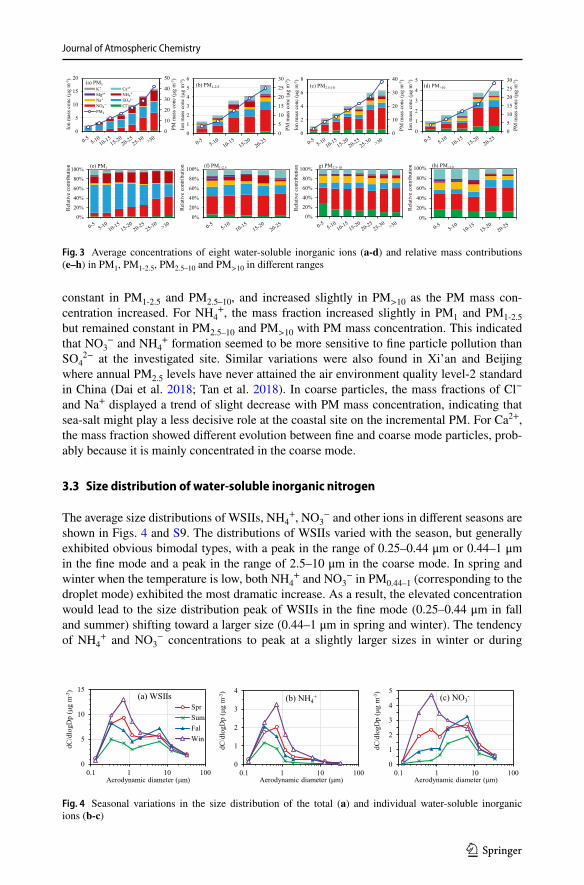
The average size distributions of WSIIs, NH4+, NO3
− and other ions in different seasons are shown in Figs. 4 and S9. The distributions of WSIIs varied with the season, but generally exhibited obvious bimodal types, with a peak in the range of 0.25–0.44 μm or 0.44–1 μm in the fine mode and a peak in the range of 2.5–10 μm in the coarse mode. In spring and winter when the temperature is low, both NH4
+ and NO3− in PM0.44–1 (corresponding to the
droplet mode) exhibited the most dramatic increase. As a result, the elevated concentration would lead to the size distribution peak of WSIIs in the fine mode (0.25–0.44 μm in fall and summer) shifting toward a larger size (0.44–1 μm in spring and winter). The tendency of NH4
+ and NO3− concentrations to peak at a slightly larger sizes in winter or during
Fig. 3 Average concentrations of eight water-soluble inorganic ions (a-d) and relative mass contributions (e–h) in PM1, PM1-2.5, PM2.5–10 and PM>10 in different ranges
Fig. 4 Seasonal variations in the size distribution of the total (a) and individual water-soluble inorganic ions (b-c)
Journal of Atmospheric Chemistry
1 3
pollution periods was also reported in Beijing, Shanghai and Canadian rural area (Huang et al. 2016; Tian et al. 2014; Zhang et al. 2008). Enhanced heterogeneous aqueous reaction and the hygroscopic growth of smaller particles at the high RH were suggested to be the main reasons. However, the values of RH in summer in Xiamen were not significantly dif-ferent from those in spring (Fig. S5). Therefore, the formation of high droplet-mode NH4
+ and NO3
− might be favored under the combined effect of high RH and low T.It was clear that Na+ and Cl− were mainly associated with coarse particle, with a peak at
2.5–10 μm (Fig. S9a and b). One major source of Na+ and Cl− in atmospheric coarse aero-sol is sea-salt, in which Na+ is closely related to Cl− (Table S2). In this study, the molar ratio of Na+ to Cl− in PM2.5–10 varied from 0.85 to 2.31 with a median of 1.60, which did not coincide with the characteristic seawater ratio for Na+/Cl− (approximately 0.89). More-over, the level of Cl− observed in PM2.5–10 gave higher molar ratios in summer and fall than in spring and winter. This is thought to be due to the condensation of HNO3 and/or N2O5 oxidation on the surface of sea-salt aerosol to form NaNO3 (NaCl + HNO3 = NaNO3 + HCl, N2O5 + NaCl = ClNO2 + NaNO3) (Yao and Zhang 2012). It is notable that a minor peak of Cl− was observed in the size range of 0.44–1 μm in winter and spring, when T was low and strong northeasterly winds prevailed (Figs. S4 and S5). In urban Beijing, the size dis-tributions of Na+ and Cl− were both bimodal in the four seasons, peaking at 0.43–0.65 μm and 4.7–5.8 μm, probably due to the contribution of biomass burning and coal combustion (Li et al. 2013; Huang et al. 2016). Measurements of Cl− and Na+ in PRD showed domi-nant peaks at 0.43–0.65 μm in all seasons, with the highest level was found in winter for Cl− and in summer for Na+, indicating the important impact of anthropogenic sources and biomass burning (Wang et al. 2015). In this study, the correlation between Na+ and Cl− in PM2.5–10 (r = 0.707, p < 0.001) was much stronger than that in PM1 (r = 0.413, p < 0.001) (Table S2). However, the concentrations of Cl− in the coarse mode were far higher than those in the fine mode. Thus, coal combustion emissions from the two nearby power plants to the south and west of the sampling site were not likely the source of Cl− in the fine mode. Other emissions from biomass burning and coal combustion to the north/northeast of the location as well as the reduction of NH4Cl volatilization loss at low temperature might contribute to the fine model Cl− in spring and winter. The significant correlation (at the 99.9% confidence level) between Cl− and NH4
+ was only found in PM1 (r = 0.365), indicating an important occurrence of NH4Cl in winter and spring. Nevertheless, the corre-lation between Cl− and NO3
− was significant and positive in the four particle populations, with a stronger correlation in PM1 (r = 0.660, p < 0.001) than in other three particle popula-tions (r = 0.422—0.461, p < 0.001), suggesting that NH4NO3 was less volatile than NH4Cl, as HCl is more volatile than HNO3.
The seasonal variations of the SO42− mass concentrations were similar to the sea-
sonal patterns of NH4+ and K+ (Figs. 4 and S9). Furthermore, the three species showed
similar unimodal distributions with a dominant peak at 0.25–0.44 μm in summer and fall or 0.44–1 μm in spring and winter, which was consistent with previous observation in YRD and PRD (Huang et al. 2016; Wang et al. 2015) but different from the bimodal distributions in the Jing-Jin-Ji urban areas (Li et al. 2013). In general, fine mode SO4
2− is formed by the oxidation of SO2 through a slow homogeneous gas-phase oxida-tion and/or gas-to-particle (heterogeneous) oxidation. Thus, the main peak of sulfate falls in the fine mode. The fine mode SO4
2−, NH4+ and K+ accounted for 85.2±7.0%,
90.8±6.3% and 70.1±7.8% of their total mass, respectively, indicating the formation of SO4
2− and NH4+ through in-cloud processes (Zhuang et al. 1999) and the potential abil-
ity of biomass burning aerosols serving as cloud condensation nuclei (Kaufman and Fraser 1997). In the present work, NH4
+ equivalent concentration in fine mode (89 ± 65
Journal of Atmospheric Chemistry
1 3
neq m−3) was more than sufficient to neutralize SO42− (70 ± 26 neq m−3). Moreover,
the excess NH4+ concentration in unit of μmol m−3, calculated as [NH4
+]—1.5×[SO42−]
according to Pathak et al. (2009), showed significant correlation with nitrate concen-tration (r = 0.828, p < 0.001), implying that NH4HSO4, (NH4)2SO4 and NH4NO3 might coexist in fine particles. Sulfate in coarse particles could be partly from the sea-salt and/or the reactions of SO2 on the surface of sea-salt or soil particles (Zhuang et al. 1999). As shown in Table S2, for SO4
2− and Na+ the correlation was statistical significant in coarse particles (r = 0.329, p < 0.001 in PM2.5–10 and r = 0.265, p = 0.003 in PM>10) but the correlation between SO4
2− and Ca2+ was significant only in PM2.5–10 (r = 0.365, p < 0.001) which supported the above speculation.
Different from SO42−, the size distributions of NO3
− were either bimodal with two peaks located in 2.5–10 μm and 0.44–1 μm in spring and winter or unimodal at 2.5–10 μm in summer and fall (Fig. 4c). The coarse mode NO3
− accounted for 18.8%—89.1% of the total nitrate with an average mean of 54.6 ± 18.0%. A dramatic decrease of fine mode NO3
− was found in summer due to the high temperature (28.0±1.3 °C) which are known to prevent formation of particulate NH4NO3 (Seinfeld and Pandis 2006). Similar bimodal distributions were also reported in Beijing for the four seasons, with a dominant peak in the size range of 0.43–1.1 μm and a minor peak in the size range of 4.7–5.8 μm (Huang et al. 2016). In the urban area of Sheffield, UK, NO3
− exhib-ited a bimodal distribution when the air masses traveled long distances over the land but the fine mode NO3
− was almost indiscernible when the air masses moved mostly over the sea (Xie et al. 2009). At a suburban area of Hong Kong in winter, NO3
− was found mainly distributed in the coarse particles (3.95±0.69 μm) attributing to the sur-face reactions of HNO3 gas with sea-salt or soil particles (Zhuang et al. 1999). How-ever, at an inland site in the PRD region, NO3
− displayed unimodal distributions (peaks at 0.56–1.0 μm) in winter but bimodal ones in summer (peaks at 3.2–5.6 μm and 0.56–1 μm) (Huang et al. 2020). In this study, the size distributions of NO3
− varied with the season indicating that NO3
− might exist in different forms between the fine and coarse mode particles. NO3
− in the fine mode could be neutralized by the excess NH4+
and were prone to exist in the form of NH4NO3, which is thermodynamically unsta-ble. The average NH4
+/SO42− molar ratio in PM1 during the warm (summer and fall)
and cold (winter and spring) times were 1.51±0.42 and 3.31±0.89, respectively, indi-cating there was no extra NH4
+ to neutralize nitrate in the submicron mode particles in warm times. We can therefore assume that the residucal nitrate in PM1 in warm times may be combined with other cation ions instead of NH4
+. However, no significant posi-tive correlation among the concentrations of NO3
−, Na+, Ca2+, K+, and Mg2+ in sub-micron mode particles was found in the warm seasons, indicating multiple chemical forms of nitrate in the submicron mode particles. In addition, the ratio of NO3
− mass in PM0.44–1 to that in PM2.5–10 also exhibited an apparent negative correlation with tem-perature (r = -0.596, p < 0.001), but a positive correlation with excess NH4
+ in fine mode (r = 0.622, p < 0.001). The negative correlation between the fraction of nitrate associated with submicron particles and temperature was also reported over the Atlantic Ocean (Morin et al. 2009). In the Jing-Jin-Ji urban agglomeration (China), significant higher concentrations of fine mode NO3
− were also found in summer due to the humid condi-tion and polluted air masses (Li et al. 2013). In the urban Madrid (Spain), NO3
− con-centrations in PM2.5–10 in summer were higher than in winter due to various African dust outbreaks observed in summer while higher values of NO3
− associated with fine particles (PM0.5, PM0.5–1 and PM1-2.5) were found in winter as NH4NO3 was exclusively detected in winter (Mirante et al. 2014). Park et al. (2004) suggested that coarse-mode
Journal of Atmospheric Chemistry
1 3
nitrates at Jeju Island (Korea) during the Asian dust periods were mainly produced by the reaction of HNO3 gas with basic soil particles. To sum up, the size distribution of NO3
− strongly depends on aerosol composition and relevant ambient conditions (e.g. T and RH).
The significant seasonal variations of fine mode NO3− were mainly controlled by
the formation of NH4NO3. The NH4NO3 formation routes might involve either the gas-phase reaction NH3 + HNO3 ↔ NH4NO3 or the heterogeneous reaction between NH3 and the aqueous-phase reaction products formed upon hydrolysis of N2O5 that could be pre-sent on the surface of the pre-existing moist particle under moist condition (Pathak et al. 2011). Despite high gas-phase NH3 and HNO3 are expected to occur in summer due to high NH3 volatilization and enhanced gas-phase oxidation of NO2 (Wu et al. 2018; Zhang et al. 2008), the formation routes of NH4NO3 are strongly limited under high temperature and low particle loading. However, both the homogeneous and heterogene-ous reactions would become significant in spring and winter due to the low temperature, high humidity, and high particle loading. For coarse mode NO3
−, NaNO3 and Ca(NO3)2 are more likely to occur via the reactive uptake of HNO3 vapor on pre-existing alka-line sea-salt or mineral dust in NH3-limited environments. As shown in Table S2, NO3
− showed significant correlation (at the 99.9% confidence level) with Na+ in PM2.5–10 and PM>10 (r = 0.367–0.448) and Ca2+ only in PM2.5–10 (r = 0.614), which confirmed the speculation that HNO3 could react with CaCO3 in the coarse particles. Nevertheless, no correlation was found between NO3
− and Ca2+ in PM>10, which could be due to the fast removal rate by dry deposition and by precipitation scavenging for particles in this size range.
Mg2+ and Ca2+ are generally from soil particles with a small component from sea-salt. Their size distribution types were different from those of K+ that was mainly from biomass burning and Na+ that originated from sea-salt particles (Fig. S9). Moreover, Ca2+, Mg2+ and K+ were all strongly correlated with Na+ in PM1, PM1-2.5, PM2.5–10 and PM>10 (Table S2). The correlation between Mg2+ and Na+ seemed to be stronger than those between Ca2+ or K+ and Na+, especially in the coarse particles. Therefore, the size distri-butions of Mg2+ and Ca2+ could be influenced by a mix of fugitive dust and sea-salt parti-cles. The heterogeneous chemistry on dust and sea-salt particles might act as a source for some particulate species (Yao and Zhang 2012).
The mass concentration ratios of SO42−/Na+, Ca2+/Na+, and K+/Na+ in seawater were
0.252, 0.037 and 0.038, respectively. If assuming all Na+ was generated from sea-salt, the sea-salt contribution to SO4
2−, Ca2+ and K+ can be estimated. Thus, the mass of non- sea-salt (nss-) SO4
2−, Ca2+ and K+ were calculated using the following formulas (Nakamura et al. 2005):
Figure S10 shows the average size distributions of the relative contribution of non- sea-salt component to the total measured mass. On average, the non-sea-salt contribution of SO4
2−, Ca2+ and K+ were 78.8%, 95.5, and 84.4%, respectively. In addition, the relative contribution of nss- SO4
2− and K+ obviously decreased with particle size while nss-Ca2+ remained relatively stable.
(3)nss − SO4
2−= SO
4
2−− 0.252 × Na+
(4)nss − Ca2+ = Ca2+ − 0.037 × Na+
(5)nss − K+= K2+
− 0.038 × Na+
Journal of Atmospheric Chemistry
1 3
3.4 Dry deposition flux
The calculated size-dependant particle Vd values in Fig. S2 were strongly influenced by particle size and wind speed. The values of Vd for particles around 10 μm were more than two orders of magnitude greater than the ones calculated for particles in the size range of 0.44–1 μm. The large particles are expected to be rapidly removed from the atmosphere by dry deposition, which means that they mainly deposit in the coastal regions. On the other hand, fine particles have a longer atmospheric lifetime and can be transported to the remote ocean. Therefore, there must exist a gradient of inorganic nitrogen deposition flux from land to sea. For particles of submicrometer size, the higher the wind speed, the smaller aerodynamic resistance and the more roughness to the sea surface and therefore the greater Vd. For particles with diameter larger than 2 μm where gravitational settling plays a predominant role, the dry deposition velocity remained almost entirely unaffected by wind speed.
Based on the size-segregated Vd for particles and the size distributions of NH4+ and
NO3− mass concentrations, the mass-weighted dry deposition velocities for these two
inorganic N species in Xiamen Bay were calculated. The averaged mass-weighted Vd of NH4
+ and NO3− during the study period were 0.14 ± 0.12 and 0.67 ± 0.29 cm s−1,
respectively. The differences in weighted Vd between NH4+ and NO3
− were mainly caused by their size distributions. As shown in Fig. 4, NH4
+ was mainly observed in fine particles with an average percentage of 90.8%, while NO3
− showed a double peak size distribution, with 55.9% in the coarse mode and 44.1% in the fine mode. The higher distribution ratio of coarse mode NO3
− leaded to higher Vd than that of NH4+. Table S4
summarizes the Vd values used for the dry deposition flux calculation over the marginal seas in the northwestern Pacific Ocean. The average weighted Vd for NH4
+ in this study was comparable with most available values in the literature. For NO3
−, it exhibited a greater annual Vd value, which was lower than most of Vd values in the literature. Based on the size distributions of inorganic N species, the overall weighted Vd values of NH4
+ and NO3
− were calculated to be 0.21 and 0.43 cm s−1, respectively, during the dust storm periods, and 0.02 and 0.28 cm s−1 during the normal days over the Yellow Sea (Shi et al. 2013). The Vd calculated indirectly using the ratio of the total dry deposition and the corresponding particulate N species concentrations was 0.17 ± 0.11 cm s−1 for NH4
+ and 0.35 ± 0.20 cm s−1 for NO3− in Jiaozhou Bay, North China (Xing et al. 2018).
The constant Vd values of NO3− in the literature were between 1–2 cm s−1 which would
overestimate the dry deposition flux of NO3–N. For example, the dry deposition flux of NO3–N using constant Vd was around 6–7 times of that using size dependent dry depo-sition velocity over sea surface in Yellow Sea and East China Sea (Zhu et al. 2013; Fu et al. 2018; Luo et al. 2016). On the other hand, the dry deposition flux of NH4–N might be underestimated by assuming a low constant dry deposition velocity of 0.1 cm s−1. Based on a regional air quality model system, the dry deposition flux of nitrate in the East China Sea between 17 March and 22 April 2014 was between the calculations using constant and size dependent velocities (Li et al. 2018; Fu et al. 2018; Luo et al. 2016). Given that the Vd of inorganic N species is affected by multiple factors such as the size distribution of mass concentration, wind speed, air temperature and RH and varies from time to time even within the same area, the dry deposition fluxes of NH4–N and NO3–N were calculated using their size-dependent dry deposition velocities.
A total of 122 daily dry deposition fluxes of inorganic N species were calculated using the size-dependent Vd and the size-segregated mass concentrations during the
Journal of Atmospheric Chemistry
1 3
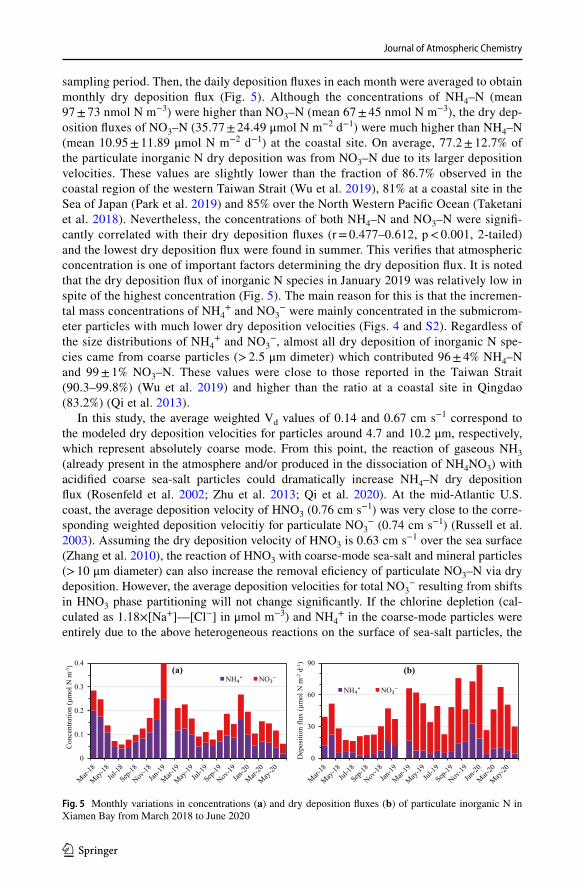
sampling period. Then, the daily deposition fluxes in each month were averaged to obtain monthly dry deposition flux (Fig. 5). Although the concentrations of NH4–N (mean 97 ± 73 nmol N m−3) were higher than NO3–N (mean 67 ± 45 nmol N m−3), the dry dep-osition fluxes of NO3–N (35.77 ± 24.49 μmol N m−2 d−1) were much higher than NH4–N (mean 10.95 ± 11.89 μmol N m−2 d−1) at the coastal site. On average, 77.2 ± 12.7% of the particulate inorganic N dry deposition was from NO3–N due to its larger deposition velocities. These values are slightly lower than the fraction of 86.7% observed in the coastal region of the western Taiwan Strait (Wu et al. 2019), 81% at a coastal site in the Sea of Japan (Park et al. 2019) and 85% over the North Western Pacific Ocean (Taketani et al. 2018). Nevertheless, the concentrations of both NH4–N and NO3–N were signifi-cantly correlated with their dry deposition fluxes (r = 0.477–0.612, p < 0.001, 2-tailed) and the lowest dry deposition flux were found in summer. This verifies that atmospheric concentration is one of important factors determining the dry deposition flux. It is noted that the dry deposition flux of inorganic N species in January 2019 was relatively low in spite of the highest concentration (Fig. 5). The main reason for this is that the incremen-tal mass concentrations of NH4
+ and NO3− were mainly concentrated in the submicrom-
eter particles with much lower dry deposition velocities (Figs. 4 and S2). Regardless of the size distributions of NH4
+ and NO3−, almost all dry deposition of inorganic N spe-
cies came from coarse particles (> 2.5 μm dimeter) which contributed 96 ± 4% NH4–N and 99 ± 1% NO3–N. These values were close to those reported in the Taiwan Strait (90.3–99.8%) (Wu et al. 2019) and higher than the ratio at a coastal site in Qingdao (83.2%) (Qi et al. 2013).
In this study, the average weighted Vd values of 0.14 and 0.67 cm s−1 correspond to the modeled dry deposition velocities for particles around 4.7 and 10.2 μm, respectively, which represent absolutely coarse mode. From this point, the reaction of gaseous NH3 (already present in the atmosphere and/or produced in the dissociation of NH4NO3) with acidified coarse sea-salt particles could dramatically increase NH4–N dry deposition flux (Rosenfeld et al. 2002; Zhu et al. 2013; Qi et al. 2020). At the mid-Atlantic U.S. coast, the average deposition velocity of HNO3 (0.76 cm s−1) was very close to the corre-sponding weighted deposition velocitiy for particulate NO3
− (0.74 cm s−1) (Russell et al. 2003). Assuming the dry deposition velocity of HNO3 is 0.63 cm s−1 over the sea surface (Zhang et al. 2010), the reaction of HNO3 with coarse-mode sea-salt and mineral particles (> 10 μm diameter) can also increase the removal eficiency of particulate NO3–N via dry deposition. However, the average deposition velocities for total NO3
− resulting from shifts in HNO3 phase partitioning will not change significantly. If the chlorine depletion (cal-culated as 1.18×[Na+]—[Cl−] in μmol m−3) and NH4
+ in the coarse-mode particles were entirely due to the above heterogeneous reactions on the surface of sea-salt particles, the
(a) (b)
Fig. 5 Monthly variations in concentrations (a) and dry deposition fluxes (b) of particulate inorganic N in Xiamen Bay from March 2018 to June 2020
Journal of Atmospheric Chemistry
1 3
contributions of sea-salt particles to the atmospheric N dry deposition were estimated to be 23.9—52.8% with an average of 34.0 ± 10.2%. Based on an air quality model system, the sea-salt related NO3
− contributed 9% on average to the total particulate inorganic N deposition in the western Pacific Ocean with maximum contribution of 20% in the North Pacific (Li et al. 2018). By using the CMAQ model containing the heterogeneous reac-tions between nitrogen-containing gases (NO2, N2O5 and HNO3) and sea-salt, the dry deposition flux of coarse-mode NO3
− increased by 27.6–52.4% over the China seas (Xue et al. 2020), and the contribution of sea-salt particles to the atmospheric N deposition into the North Sea was approximately 3–7% (Neumann et al. 2016). During 2002–2004, the reaction between HNO3 and sea-salt particles accounted for 31.8% and 51.2% of the total reactive oxygenated nitrogen deposition flux into Yellow Sea and East China Sea, respectively (Itahashi et al. 2016). These results suggest that the heterogeneous reactions between nitrogen-containing gases and sea-salt particles can significantly increase par-ticulate N dry deposition over the ocean surface.
Compared to other coastal regions, the annual dry deposition fluxes of NH4–N (4.00 ± 4.34 mmol N m−2 yr−1) and NO3–N (13.05 ± 8.94 mmol N m−2 yr−1) at our moni-toring site were comparable to the calculations at the five coastal sites of the western Tai-wan Strait (Wu et al. 2019), a coastal site of the Yellow Sea (Qi et al. 2013), margina catch-ment area in Singapore (He et al. 2011) and islands in the East China Sea (Zhu et al. 2013), but lower than the calculations at the coastal sites of the Sea of Japan (Kang et al. 2010; Park et al. 2019) and the actual measurements using settling buckets at a coastal site of the Yellow Sea (Xing et al. 2018) and a background site in the Pearl River estuary of the South China Sea (Yu et al. 2020) (Table S4). Also note that several studies in Table S4 showed comparative or higher NH4-N dry deposition fluxes than NO3-N, probably due to the much higher concentrations of NH4
+ (Xing et al. 2018; Yu et al. 2019; Shi et al. 2013; Qi et al. 2020). This suggests that the direct comparison between our estimates with other regions is a very complex process because of the differences in study period/season, region, sampling method (TSP or size-segregated samples) and flux calculation method.
3.5 Impact of atmospheric deposition on marine productivity
Many studies have shown that the atmospheric deposition of nutrients to the sea sur-face have the potential to influence the marine ecosystem. For example, the nutrients and Asian dust addition incubation experiments carried out during a marine research R/V cruise in Yellow Sea and East China Sea confirmed that both the concentration of chlorophyll-a (Chl-a) and the conversion efficiency index of N into Chl-a showed a greater increase in contrast to the control (Liu et al. 2013). In the South China Sea, the enhancement of seawater Chl-a was proven to be associated with the atmospheric N deposition (Kim et al. 2014). In the North Western Pacific Ocean, the annual aver-age concentration of Chl-a at the surface seawater increased from 0.04 to 0.10 mg m−3 and the gross primary productivity (interegated over sea depths of 0–200 m) increased from 85 to 147 mgC m−2 d−1 due to the input of the atmospheric inorganc N species by using an ecosystem model combined with a WRF-CMAQ model (Taketani et al. 2018). In the present study, the dry deposition of particulate inorganic N into Xiamen Bay is compared with other inputs of nitrogen. In 2017, the direct terrestrial influx of inorganic N to Xiamen Bay was 41,531 tons, including 38,400 tons from Jiulong River, 2362 tons from streamlet and 769 tons from sewage drain-off according to the 2017 Bulle-tin of Xiamen Marine Environmental Status (http:// hyj. xm. gov. cn/ lszt/ hyhjxx/ 201806/
Journal of Atmospheric Chemistry
1 3
P0201 80621 58565 45079 79. pdf). Assuming that the composition of near-surface air at the coastal site was the same as that over nearshore waters (Russell et al. 2003), the annual dry deposition of NO3-N plus NH4-N into the Xiamen Bay was estimated to be 396.07 tons based on the water surface area (1659 km2) and the daily dry deposition flux. This value is approximately 0.95% of the terrestrial inorganic N inputs. It is noted that this value might be overestimated due to the decline trend from the sampling site to the inner bay. Further research must be conducted to set up more sampling sites in and around Xiamen Bay to reduce the uncertainity in atmospheric inorganic N deposition flux estimates.
The potential impact of atmospheric deposition of particulate inorganic N on the marine ecosystem in Xiamen Bay can be assessed by estimating the potential new primary produc-tion. Assuming that all of the particulate inorganic N deposited into Xiamen Bay are bio-available to phytoplanton, the atmospheric input can be converted to carbon uptake based on the C:N ratio of 6.625 in the Redfield ratio in the ocean (De Leeuw et al. 2003; Zhang et al. 2010; Xing et al. 2018; Park et al. 2019). This ratio indicates that for every mole of nitrogen used, 6.625 mol of carbon is assimilated. By using dry deposition flux for inor-ganic N and the Redfield C:N ratio, the dry deposition of particulate inorganic N would then create a new productivity of 3.55 mgC m−2 d−1 on average with the highest in winter (4.10 mgC m−2 d−1) and the lowest in summer (2.31 mgC m−2 d−1) in the surface waters. According to the previous study in Xiamen Bay, the primary productivity was measured to be 92.1–233.1 mgC m−2 d−1 (Li et al. 1999). Based on this figure, the input of the exter-nal nitrogen supply contributes 1.3–4.7% (mean 2.2%) of the primary productivity in Xia-men Bay. These ratios are close to 1.1–3.9% in the eastern China seas and 0.3–6.7% (mean 2.3%) in the coastal region of Yellow Sea due to dry and wet deposition of inorganic N (Zhang et al. 2010; Qi et al. 2013) and higher than 0.08–1.6% (mean 0.4%) in the coastal region of the Sea of Japan due to dry deposition of particulate inorganic and organic N (Park et al. 2019).
It should be kept in mind that NH3 and HNO3 as well as particulate organic N, which can form a substantial contribution to the N deposition (Zhang et al. 2010; Xing et al. 2018; Wu et al. 2018; Park et al. 2019), were not measured in this study. The dry deposition flux of particulate inorganic N reported in this study should be considered as a lower limit on the total dry deposition flux to Xiamen Bay. Hence, the real deposition flux of N to the sur-face waters would have a greater impact on marine biogeochemistry. In the western Baltic Sea, the contribution of shipping sector to the total N concentration in the sea water was up to 5% and the absolute shipping-related total N concentrations were found to be gener-ally higher in the coastal regions by applying a coupled marine physical biogeochemical model (Neumann et al. 2020). Based on the simulation results using WRF-CMAQ in China seas, Chen et al. (2020) reported that the largest ship contribution to dry N deposition was generally along the shoreline and the western Taiwan Strait, which correspond to the ship-ping routes. Given that atmospheric emissions of nitrogen compounds from vehicles and marine vessels are continuing to increase in and around the Xiamen Bay as well as other port cities in China, an increasing importance of atmospheric nitrogen deposition on the coastal marine ecosystem can be expected. In addition, sea-salt emissions in the vicinity of the shoreline can help produce coarse-mode nitrate and then enhance shipping and vehicle related nitrogen deposition in the coastal regions. Therefore, careful considerations of the contributions of these gas-phase N species to the dry deposition, as well as organic N, must be incorporated into future atmospheric N measurements. Besides, further studies such as stable N isotopic measurement for source partitioning and emission inventory compilation are needed to set emissions reduction policy.
Journal of Atmospheric Chemistry
1 3
4 Conclusions
In this study, the size distributions of water-soluble inorganic ions in aerosol parti-cles were measured to characterize the seasonal variations and the dry deposition of inorganic N in Xiamen Bay from March 2018 to June 2020. The results showed that the mass size distributions of aerosol were bimodal, peaking at 0.44–1.0 μm and 2.5–10 μm, and displayed obvious seasonal fluctuation due to changes in source emis-sions and local meteorological conditions. In addition, fine particles showed better cor-relations with temperature, pressure, and visibility than wind speed. Secondary ions (SO4
2−, NO3− and NH4
+) accounted for the major part of WSIIs, with a slightly higher fraction in the cold seasons (78.7%) than in the warm seasons (65.3%), while other ionic species followed the order of Na+ > Ca2+ > Cl− > K+ > Mg2+. The average ratio of NO3
− to SO42− exceeded 1.0, suggesting that emissions from mobile sources in Xia-
men play a more important role in aerosol pollution than stationary source emissions. The mass concentrations of WSIIs in particle populations (PM1, PM1-2.5, PM2.5–10, and PM>10) were all significantly correlated with PM mass but its contribution to PM mass displayed a decreasing trend with particle size, accounting for more than 40% in PM1, approximately twice that in PM>10.
The size distributions of WSIIs varied with the season, but generally exhibited simi-lar bimodal types as that of aerosol particles. Both Na+ and Cl− had a main peak at 2.5–10 μm, which correspond well to the peak of NO3
− in the coarse mode. Moreover, the average ratio of Na+/Cl− in PM2.5–10 was much higher than that in seawater, clearly confirming the heterogeneous reaction on the surface of sea-salt particles. The size dis-tributions of NH4
+ and SO42− were very similar and their dominant peak moved from
0.25–0.44 μm in summer and fall to 0.44-1 μm in spring and winter due to the enhanced gas-phase oxidation and/or gas-to-particle oxidation. The fine mode peak of NO3
− at 0.44–1 μm became progressively less obvious with increasing temperature mainly due to the evaporation of NH4NO3 while the coarse mode peak at 2.5–10 μm remained sta-ble because NO3
− combined with Na+ and Ca2+.Although the average concentration of NH4-N was about 1.5 times of NO3-N, the
dry deposition flux of NO3-N was 3.3 times of NH4-N due to their very different size distribution. The contribution of sea-salt particles to atmospheric N dry deposition was estimated to be 24–53%, assuming the chlorine depletion and NH4
+ in the coarse-mode particles were entirely associated with the heterogeneous reactions on the surface of sea-salt particles. The assumption may overestimate the impact of sea-salt particles because part of NH3 and HNO3 could also condense on the surface of acidified mineral dust. The mass weighted dry deposition velocities of NH4-N and NO3-N in Xiamen Bay were 0.14 ± 0.12 and 0.67 ± 0.29 cm s−1, respectively, which were different from the literature values of Vd over the marginal seas in northwestern Pacific Ocean. These dif-ferences indicate that it is hard to directly compare our results with other regions due to the different calculation method.
The dry deposition of particulate inorganic N accounted for less than 1% of other ter-restrial N influxes into Xiamen Bay and could support 1.3–4.7% of the primary produc-tivity. Taking into account other reactive N in the atmosphere and increasing anthropo-genic emissions of NOx, the atmospheric N input is a non-negligible external source to the ocean surface layer and could have a significant influence on biogeochemical cycles. To improve our understanding of the air-sea deposition fluxes of nutrients, further stud-ies are required to include dry and wet deposition as well as NOx source apportionment.
Journal of Atmospheric Chemistry
1 3
It is therefore necessary to take the air-sea deposition fluxes of nutrients into account in the integrated nutrient management scheme in coastal and offshore waters.
Supplementary Information The online version contains supplementary material available at https:// doi. org/ 10. 1007/ s10874- 021- 09427-8.
Authors’ contributions Shui-Ping Wu: Conceptualization, methodology, original draft preparation. Xiang Li: Original draft preparation. Yang Gao: Methodology, formal analysis and investigation. Mei-Jun Cai: Methodology, formal analysis and investigation. Chao Xu: Methodology, formal analysis and investigation. James J Schwab: Review and editing. Chung-Shin Yuan: Review and editing.
Funding This work was supported by the National Key Research and Development Program of China (2016YFC0502901), the National Natural Science Foundation of China (No. 41471390), and the Natural Science Foundation of Fujian Province of China (No.2017J01079).
Data availability The dataset used and/or analyzed in this study are available from the corresponding author on reasonable request.
Declarations
Ethics approval and consent to participate Not applicable.
Consent for publication Not applicable.
Competing interests The authors have no conflicts of interest to declare that are relevant to the content of this article.
References
Baker, A.R., Kelly, S.D., Biswas, K.F., Witt, M., Jickells, T.D.: Atmospheric deposition of nutrients to the Atlantic Ocean. Geophys. Res. Lett. 30, 2296–2299 (2003). https:// doi. org/ 10. 1029/ 2003G L0185 18
Behera, S., Cheng, J., Huang, X., Zhu, Q., Liu, P., Balasubramanian, R.: Chemical composition and acidity of size-fractionated inorganic aerosols of 2013–14 winter haze in Shanghai and associated health risk of toxic elements. Atmos. Environ. 122, 259–271 (2015). https:// doi. org/ 10. 1016/j. atmos env. 2015. 09. 053
Canepari, S., Astolfi, M.L., Catrambone, M., Frasca, D., Marcoccia, M., Marcovecchio, F., Massimi, L., Rantica, E., Perrino, C.: A combined chemical/size fractionation approach to study winter/summer variations, ageing and source strngth of atmospheric particles. Environ. Pollut. 253, 19–28 (2019). https:// doi. org/ 10. 1016/j. envpol. 2019. 06. 116
Cao, J.J., Wang, Q.Y., Chow, J.C., Watson, J.G., Tie, X.X., Shen, Z.X., Wang, P., An, Z.S.: Impacts of aerosol compositions on visibility impairment in Xi’an, China. Atmos. Environ. 59, 559–566 (2012). https:// doi. org/ 10. 1016/j. atmos env. 2012. 05. 036
Chen, D., Fu, X., Guo, X., Lang, J., Zhou, Y., Li, Y., Liu, B., Wang, W.: The impact of ship emissions on nitrogen and sulfur deposition in China. Sci. Total Environ. 708, 134636 (2020). https:// doi. org/ 10. 1016/j. scito tenv. 2019. 134636
Dai, Q., Bi, X., Liu, B., Li, L., Ding, J., Song, W., Bi, S., Schulze, B.C., Song, C., Wu, J., Zhang, Y., Feng, Y., Hopke, P.K.: Chemical nature of PM2.5 and PM10 in Xi’an, China: insight into primary emissions and secondary particle formation. Environ. Pollut. 240, 155–166 (2018). https:// doi. org/ 10. 1016/j. envpol. 2018. 04. 111
De Leeuw, G., Spokes, L., Jickells, T., Skjøth, C.A., Hertel, O., Vignati, E., Tamm, S., Schulz, M., Sørensen, L.-L., Pedersen, B., Klein, L., Schlunzen, K.H.: Atmospheric nitrogen inputs into the North Sea: effects on producitivity. Cont. Shelf Res. 23, 1743–1755 (2003). https:// doi. org/ 10. 1016/j. csr. 2003. 06. 011
Fu, J., Wang, B., Chen, Y., Ma, Q.: The influence of continental air masses on the aerosols and nutrients deposition over the western North Pacific. Atmos. Environ. 172, 1–11 (2018). https:// doi. org/ 10. 1016/j. atmos env. 2017. 10. 041
Journal of Atmospheric Chemistry
1 3
He, J., Balasubramanian, B., Burger, D.F., Hicks, K., Kuylenstierna, J.C.I., Palani, S.: Dry and wet atmos-pheric deposition of nitrogen and phosphorus in Singapore. Atmos. Environ. 45, 2760–2768 (2011). https:// doi. org/ 10. 1016/j. atmos env. 2011. 02. 036
Huang, B., Gan, T., Pei, C., Li, M., Cheng, P., Chen, D., Cai, R., Wang, Y., Li, L., Huang, Z., Gao, W., Fu, Z., Zhou, Z.: Size-segregated characteristics and formation mechanisms of water-soluble inorganic ions during different seasons in Heshan of Guangdong. China. Aerosol Air Qual. Res. 20, 1961–1973 (2020). https:// doi. org/ 10. 4209/ aaqr. 2019. 11. 0582
Huang, X., Liu, Z., Zhang, J., Wen, T., Ji, D., Wang, Y.: Seasonal variation and secondary formation of size-segregated aerosol water-soluble inorganic ions during pollution episodes in Beijing. Atmos. Res. 168, 70–79 (2016). https:// doi. org/ 10. 1016/j. atmos res. 2015. 08. 021
Huang, R.J., Zhang, Y., Bozzetti, C., Ho, K.F., Cao, J.J., Han, Y., Daellenbach, K.R., Slowik, J.G., Platt, S.M., Canonaco, F., Zotter, P., Wolf, R., Pieber, S.M., Bruns, E.A., Crippa, M., Ciarelli, G., Piazzalunga, A., Schwikowski, M., Abbaszade, G., Schnelle-Kreis, J., Zimmermann, R., Am, Z., Szidat, S., Baltensperger, U., Haddad, I.E., Prévôvt, A.S.: High secondary aerosol contribution to particulate pollution during haze events in China. Nature 514, 218–222 (2014). https:// doi. org/ 10. 1038/ natur e13774
Itahashi, S., Hayami, H., Uno, I., Pan, X., Uematsu, M.: Importance of coarse-mode nitrate produced via sea-salt as atmospheric input to East Asian oceans. Geophys. Res. Lett. 43, 5483–5491 (2016). https:// doi. org/ 10. 1002/ 2016G L0687 22
Kang, J., Cho, B.C., Lee, C.B.: Atmospheric transport of water-soluble ions (NO3-, NH4
+ and nss-SO42-) to
the southern East Sea (Sea of Japan). Sci. Total Environ. 408, 2369–2377 (2010). https:// doi. org/ 10. 1016/j. scito tenv. 2010. 02. 022
Kaufman, Y.J., Fraser, R.S.: The effect of smoke particles on clouds and climate forcing. Science 277, 1636–1639 (1997). https:// doi. org/ 10. 1126/ scien ce. 277. 5332. 1636
Kim, T.-W., Lee, K., Duce, R., Liss, P.: Impact of atmospheric nitrogen deposition on phytoplankton pro-ductivity in the South China Sea. Geophys. Res. Lett. 41, 3156–3162 (2014). https:// doi. org/ 10. 1002/ 2014G L0596 65
Li, J., Han, Z., Yao, X.: A modeling study of the influence of sea salt on inorganic aerosol: concentration, size distribution, and deposition in the western Pacific Ocean. Atmos. Enviorn. 188, 157–173 (2018). https:// doi. org/ 10. 1016/j. atmos env. 2018. 06. 030
Li, W., Huang, X., Chen, Q., Wang, X., Cai, A., Zheng, A.: Primary productivity and its relationship with environmental factors in coastal waters off Haicang, Xiamen. Trop. Oceanogr. 18(3), 51–57 (1999) (in Chinese with English abstract).
Li, X., Wang, L., Ji, D., Wen, T., Pan, Y., Sun, Y., Wang, Y.: Characterization of the size-segregated water-soluble inorganic ions in the Jing-Jin-Ji urban agglomeration: spatial/temporal variability size distribu-tion and sources. Atmos. Environ. 77, 250–259 (2013). https:// doi. org/ 10. 1016/j. atmos env. 2013. 03. 042
Liu, Z., Xie, Y., Hu, B., Wen, T., Xin, J., Li, X.: Size-resolved aerosol water-soluble ions during the summer and winter seasons in Beijing: formation mechanisms of secondary inorganic aerosols. Chemosphere 183, 119–131 (2017). https:// doi. org/ 10. 1016/j. chemo sphere. 2017. 05. 095
Liu, Y., Zhang, S., Fan, Q., Wu, D., Chan, P., Wang, X., Fan, S., Feng, Y., Hong, Y.: Accessing the impact of sea-salt emissions on aerosol chemical formation and deposition over Pearl River Delta. China. Aer-osol Air Qual. Res. 15, 2232–2245 (2015). https:// doi. org/ 10. 4209/ aaqr. 2015. 02. 0127
Liu, Y., Zhang, T.R., Shi, J.H., Gao, H.W., Yao, X.H.: Responses of chlorophyll a to added nutrients, Asian dust, and rainwater in an oligotrophic zone of the Yellow Sea: implications for promotion and inhibi-tion effects in an incubation experiment. J. Geophys. Res. – Biogeosci. 118(4), 1763–1772 (2013). https:// doi. org/ 10. 1002/ 2013J G0023 29
Luo, L., Yao, H., Gao, H.W., Hsu, S.C., Li, J.W., Kao, S.J.: Nitrogen speciation in various types of aerosols in spring over the northwestern Pacific Ocean. Atmos. Chem. Phys. 16, 325–341 (2016). https:// doi. org/ 10. 5194/ acp- 16- 325- 2016
Mirante, F., Salvador, P., Pio, C., Alves, C., Artiñano, B., Caseiro, A., Revuelta, M.A.: Size fractionated aer-osol composition at roadside and background environments in the Madrid urban atmosphere. Atmos. Res. 138, 278–292 (2014). https:// doi. org/ 10. 1016/j. atmos res. 2013. 11. 024
Morin, S., Savarino, J., Frey, M.M., Domine, F., Jacobi, H.-W., Kaleschke, L., Martins, J.M.F.: Comprehen-sive isotopic composition of atmospheric nitrate in the Atlantic Ocean boundary layer from 65°S to 79°N. J. Geophys. Res. 114, D05303 (2009). https:// doi. org/ 10. 1029/ 2008J D0106 96
Nakamura, T., Matsumoto, K., Uematsu, M.: Chemical characteristics of aerosols transported from Asia to the East China Sea: an evaluation of anthropogenic combined nitrogen deposition in autumn. Atmos. Environ. 39, 1749–1758 (2005). https:// doi. org/ 10. 1016/j. atmos env. 2004. 11. 037
Neumann, D., Karl, M., Radtke, H., Matthias, V., Friedland, R., Neumann, T.: Quantifying the contribution of shipping NOx emissions to the marine nitrogen inventory- a case study for the western Baltic Sea. Ocean Sci. 16, 115–134 (2020). https:// doi. org/ 10. 5194/ os- 16- 115- 2020

Journal of Atmospheric Chemistry
1 3
Neumann, D., Matthias, V., Bieser, J., Aulinger, A., Quante, M.: Sensitivity of modeled atmospheric nitro-gen species and nitrogen deposition to variations in sea salt emissions in the North Sea and Baltic Sea regions. Atmos. Chem. Phys. 16, 2921–2942 (2016). https:// doi. org/ 10. 5194/ acp- 16- 2921- 2016
Park, G.-H., Lee, S.-E., Kim, Y., Kim, D., Lee, K., Kang, J., Kim, Y.-H., Kim, H., Park, S., Kim, T.-W.: Atmospheric deposition of anthropogenic inorganic nitrogen in airborne particles and precipitation in the East Sea in the northwestern Pacific Ocean. Sci. Total Environ. 681, 400–412 (2019). https:// doi. org/ 10. 1016/j. scito tenv. 2019. 05. 135
Park, S.H., Song, C.B., Kim, M.C., Kwon, S.B., Lee, K.W.: Study on size distribution of total aerosol and water-soluble ions during an Asian dust storm event at Jeju Island. Korea. Environ. Monit. Assess. 93, 157–183 (2004). https:// doi. org/ 10. 1023/B: EMAS. 00000 16805. 04194. 56
Pathak, R.K., Wang, T., Wu, W.S.: Nighttime enhancement of PM2.5 nitrate in ammonia-poor atmospheric conditions in Beijing and Shanghai: plausible contributions of heterogeneous hydrolysis of N2O5 and HNO3 partitioning. Atmos. Environ. 45, 1183–1191 (2011). https:// doi. org/ 10. 1016/j. atmos env. 2010. 09. 003
Pathak, R.K., Wu, W.S., Wang, T.: Summertime PM2.5 ionic species in four major cities of China: nitrate formation in an ammonia-deficient atmosphere. Atmos. Chem. Phys. 9, 1711–1722 (2009). https:// doi. org/ 10. 5194/ acp-9- 1711- 2009
Prijith, S.S., Aloysius, M., Mohan, M.: Relationship between wind speed and sea salt aerosol production: A new approach. J. Atmos. Solar.-Terr. Phys. 108, 34–40 (2014). https:// doi. org/ 10. 1016/j. jastp. 2013. 12. 009
Qi, J.H., Shi, J.H., Gao, H.W., Sun, Z.: Atmospheric dry and wet deposition of nitrogen species and its implication for primary productivity in coastal region of the Yellow Sea. China. Atmos. Environ. 81, 600–608 (2013). https:// doi. org/ 10. 1016/j. atmos env. 2013. 08. 022
Qi, J., Yu, Y., Yao, X., Gang, Y., Gao, H.: Dry deposition fluxes of inorganic nitrogen and phosphorus in atmospheric aerosols over the Marginal Seas and Northwest Pacific. Atmos. Res. 245, 105076 (2020). https:// doi. org/ 10. 1016/j. atmos res. 2020. 105076
Rosenfeld, D., Lahav, R., Khain, A., Pinsky, M.: The role of sea spray in cleansing air pollution over ocean via cloud processes. Science 297, 1667–1670 (2002). https:// doi. org/ 10. 1126/ scien ce. 10738 69
Russell, K. M., Keene, W. C., Maben, J. R., Galloway, J. N.: Phase partitioning and dry deposition of atmos-pheric nitrogen at the mis-Atlantic U.S. coast. J. Geophys. Res. 108 (D21), 4656 (2003). https:// doi. org/ 10. 1029/ 2003J D0037 36
Seinfeld, J.H., Pandis, S.N.: Atmospheric chemistry and physics: from air pollution to climate change, -2nd ed. John Wiley & Sons, Inc., Hoboken, New Jersey. (2006)
Shi, J.H., Zhang, J., Gao, H.W., Tan, S.C., Yao, X.H., Ren, J.L.: Concentration, solubility and deposi-tion flux of atmospheric particulate nutrients over the Yellow Sea. Deep Sea Res. Part II(97), 43–50 (2013). https:// doi. org/ 10. 1016/j. dsr2. 2013. 05. 004
Slinn, W.G.N.: Predictions for particle deposition to vegetative surfaces canopies. Atmos. Environ. 16, 1785–1794 (1982). https:// doi. org/ 10. 1016/ 0004- 6981(82) 90271-2
Spokes, L.J., Jickells, T.D.: Is the atmosphere really an important source of reactive nitrogen to coastal waters? Continent Shelf Res. 25, 2022–2035 (2005). https:// doi. org/ 10. 1016/j. csr. 2005. 07. 004
Srinivas, B., Sarin, M.M., Sarma, V.V.S.S.: Atmospheric dry deposition of inorganic and organic nitrogen to the Bay of Bengal: impact of continental outflow. Mar. Chem. 127, 170–179 (2011). https:// doi. org/ 10. 1016/j. march em. 2011. 09. 002
Taketani, F., Aita, M.N., Yamaji, K., Sekiya, T., Ikeda, K., Sasaoka, K., Hashioka, T., Honda, M.C., Matsumoto, K., Kanaya, Y.: Seasonal response of North Western Pacific marine ecosystems to deposition of atmos-pheric inorganic nitrogen compounds from East Asia. Sci. Rep. 8, 9324 (2018). https:// doi. org/ 10. 1038/ s41598- 018- 27523-w
Tan, T., Hu, M., Li, M., Guo, Q., Wu, Y., Fang, X., Gu, F., Wang, Y., Wu, Z.: New insight into PM2.5 pollu-tion patterns in Beijing based on one-year measurement of chemical compositions. Sci. Total Environ. 621, 734–743 (2018). https:// doi. org/ 10. 1016/j. scito tenv. 2017. 11. 208
Tian, S.L., Pan, Y.P., Liu, Z.R., Wen, T.X., Wang, Y.S.: Size-resolved aerosol chemical analysis of extreme haze pollution events during early 2013 in urban Beijing. China. J. Hazard. Mater. 279, 452–460 (2014). https:// doi. org/ 10. 1016/j. jhazm at. 2014. 07. 023
Wang, H., Zhu, B., Shen, L., Xu, H., An, J., Xue, G., Cao, J.: Water-soluble ions in atmospheric aerosols measured in five sites in the Yangtze River Delta, China: size-fractionated, seasonal variations and sources. Atmos. Environ. 123, 370–379 (2015). https:// doi. org/ 10. 1016/j. atmos env. 2015. 05. 070
Wu, S.-P., Dai, L.-H., Wei, Y., Zhu, H., Zhang, Y.-J., Schwab, J.J., Yuan, C.-S.: Atmospheric ammonia measurements along the coastal lines of Southeastern China: Implications for inorganic nitrogen depo-sition to coastal waters. Atmos. Environ. 177, 1–11 (2018). https:// doi. org/ 10. 1016/j. atmos env. 2017. 12. 040
Journal of Atmospheric Chemistry
1 3
Wu, S.-P., Cai, M.-J., Xu, C., Zhang, N., Zhou, J.-B., Yan, J.-P., Schwab, J.J., Yuan, C.-S.: Chemical nature of PM2.5 and PM10 in the coastal urban Xiamen, China: insights into the impacts of shipping emissions and health risk. Atmos. Environ. 227, 117383 (2020). https:// doi. org/ 10. 1016/j. atmos env. 2020. 117383
Wu, S.-P., Dai, L.-H., Zhu, H., Zhang, N., Yan, J.-P., Schwab, J.J., Yuan, C.-S.: The impact of sea-salt aero-sols on particulate inorganic nitrogen deposition in the western Taiwan Strait region. China. Atmos. Res. 228, 68–76 (2019). https:// doi. org/ 10. 1016/j. atmos res. 2019. 05. 015
Xie, R.K., Jackson, K.A., Seip, H.M., McLeod, C.W., Wibetoe, G., Schofield, M.J., Anderson, D., Hanssen, J.E.: Characteristics of water soluble inorganic chemical components in size-resolved airborne particu-late matters-Sheffield. U. k. J. Environ. Monit. 11, 336–343 (2009). https:// doi. org/ 10. 1039/ B8052 85A
Xing, J., Song, J., Yuan, H., Wang, Q., Li, X., Li, N., Duan, L., Qu, B.: Water-soluble nitrogen and phospho-rous in aerosols and dry deposition in Jianzhou Bay, North China: deposition velocities, origins and biogeochemical implications. Atmos. Res. 207, 90–99 (2018). https:// doi. org/ 10. 1016/j. atmos res. 2018. 03. 001
Xue, D., Chen, C.-Q., Huang, L., Gao, H.-W., Liu, X.-H.: Impacts of heterogeneous reactions of nitrogen- containing gases on sea salts on nitrogen dry deposition fluxes over the China Sea. Period. Ocean Univ. China 50(5), 19–30 (2020). https:// doi. org/ 10. 16441/j. cnki. hdxb. 20190 143(inChi nesew ithEn glish abstr act)
Yao, X., Zhang, L.: Chemical processes in sea-salt chloride depletion observed at a Canadian rural coastal site. Atmos. Environ. 46, 189–194 (2012). https:// doi. org/ 10. 1016/j. atmos env. 2011. 09. 081
Yeatman, S.G., Spokes, L.J., Jickells, T.D.: Compositions of coarse-mode aerosol nitrate and ammonium at two polluted coastal sites. Atmos. Environ. 35, 1321–1335 (2001). https:// doi. org/ 10. 1016/ S1352- 2310(00) 00452-0
Yu, X., Pan, Y., Song, W., Li, S., Li, D., Zhu, M., Zhou, H., Zhang, Y., Li, D., Yu, J., Wang, X., Wang, X.: Wet and dry nitrogen depositions in the Pearl River Delta, South China: observations at three typical sites with an emphasison water soluble organic nitrogen. J. Geophys. Res. Atmos. 125, e2019JD030983 (2020). https:// doi. org/ 10. 1029/ 2019J D0309 83
Yue, D., Zhong, L., Zhang, T., Shen, J., Zhou, Y., Zeng, L., Dong, H., Ye, S.: Pollution properties of water-soluble secondary inorganic ions in atmospheric PM2.5 in the Pearl River Delta region. Aerosol Air Qual. Res. 15, 1737–1747 (2015). doi:https:// doi. org/ 10. 4209/ aaqr. 2014. 12. 0333
Zhang, J., Tong, L., Huang, Z., Zhang, H., He, M., Dai, X., Zheng, J., Xiao, H.: Seasonal variation and size distributions of water-soluble inorganic ions and carbonaceous aerosols at a coastal site in Ningbo. China. Sci. Total Environ. 639, 793–803 (2018). https:// doi. org/ 10. 1016/j. scito tenv. 2018. 05. 183
Zhang, L., Vet, R., Wiebe, A., Mihele, C., Sukloff, B., Chan, E., Moran, M.D., Iqbal, S.: Characterization of the size-segregated water-soluble inorganic ions at eight Canadian rural sites. Atmos. Chem. Phys. 8, 7133–7151 (2008). https:// doi. org/ 10. 5194/ acp-8- 7133- 2008
Zhang, Y., Yu, Q., Ma, W., Chen, L.: Atmospheric deposition of inorganic nitrogen to the eastern China seas and its implications to marine biogeochemistry. J. Geophys. Res. 115, D00k10 (2010). https:// doi. org/ 10. 1029/ 2009J D0128 14
Zhang, L., Gong, S., Padro, J., Barrie, L.: A size-segregated particle dry deposition scheme for an atmos-pheric aerosol module. Atmos. Environ. 35, 549–560 (2001). https:// doi. org/ 10. 1016/ S1352- 2310(00) 00326-5
Zhu, L., Chen, Y., Guo, L., Wang, F.: Estimate of dry deposition fluxes of nutrients over the East China Sea: the implication of aerosol ammonium to non-sea-salt sulfate ratio to nutrient deposition of coastal oceans. Atmos. Environ. 69, 131–138 (2013). https:// doi. org/ 10. 1016/j. atmos env. 2012. 12. 028
Zhuang, H., Chan, C.K., Fang, M., Wexler, A.S.: Size distributions of particulate sulfate, nitrate, and ammo-nium at a coastal site in Hong Kong. Atmos. Environ. 33, 843–853 (1999). https:// doi. org/ 10. 1016/ S1352- 2310(98) 00305-7
Publisher’s Note Springer Nature remains neutral with regard to jurisdictional claims in published maps and institutional affiliations.
Journal of Atmospheric Chemistry
1 3
Authors and Affiliations
Shui‑Ping Wu1,2 · Xiang Li2 · Yang Gao2 · Mei‑Jun Cai2 · Chao Xu2 · James J. Schwab3 · Chung‑Shin Yuan4
* Shui-Ping Wu [email protected]
1 Fujian Provincial Key Laboratory for Coastal Ecology and Environmental Studies, Xiamen University, Xiamen 361102, China
2 Center for Marine Environmental Chemistry and Toxicology, College of Environment and Ecology, Xiamen University, Xiamen 361102, China
3 Atmospheric Sciences Research Center, University at Albany, SUNY, Albany 12203, USA4 Institute of Environmental Engineering, Sun Yat-Sen University, Kaohsiung 80424, China
Related Documents