Honors Project Six Sigma DMAIC “Letter of Credit Process Improvement ” By Ezequiel Halac Research Advisor: Dr. Suleyman Tufekci Summa Cum Laude May 2011 University of Florida Industrial and Systems Engineering

Welcome message from author
This document is posted to help you gain knowledge. Please leave a comment to let me know what you think about it! Share it to your friends and learn new things together.
Transcript
Honors Project
Six Sigma DMAIC “Letter of Credit Process Improvement”
By
Ezequiel Halac Research Advisor: Dr. Suleyman Tufekci
Summa Cum Laude May 2011
University of Florida Industrial and Systems Engineering
2
Table of Contents
SIX SIGMA AND DMAIC......................................................................................................................... 3
ABSTRACT................................................................................................................................................ 5
FOCUSED PROBLEM DEFINITION ..................................................................................................... 6
CRITICAL TO QUALITY (CTQS):......................................................................................................... 7
PROBLEM DEFINITION TREE............................................................................................................. 9
MEASUREMENT SYSTEM VALIDATION.........................................................................................11
BEFORE PROCESS CAPABILITY ANALYSIS...................................................................................13
SOLUTION TREE ...................................................................................................................................14
VITAL X IDENTIFICATION.................................................................................................................16
“BEFORE” PROCESS FLOW DIAGRAM............................................................................................18
AFTER PROCESS FLOW DIAGRAM..................................................................................................20
PROCESS IMPROVEMENTS: ..............................................................................................................21
AFTER PROCESS CAPABILITY ANALYSIS .....................................................................................22
STATISTICAL PROCESS IMPROVEMENT.......................................................................................23
SUMMARY OF PROJECT IMPROVEMENTS....................................................................................24
APPENDIX...............................................................................................................................................25
3
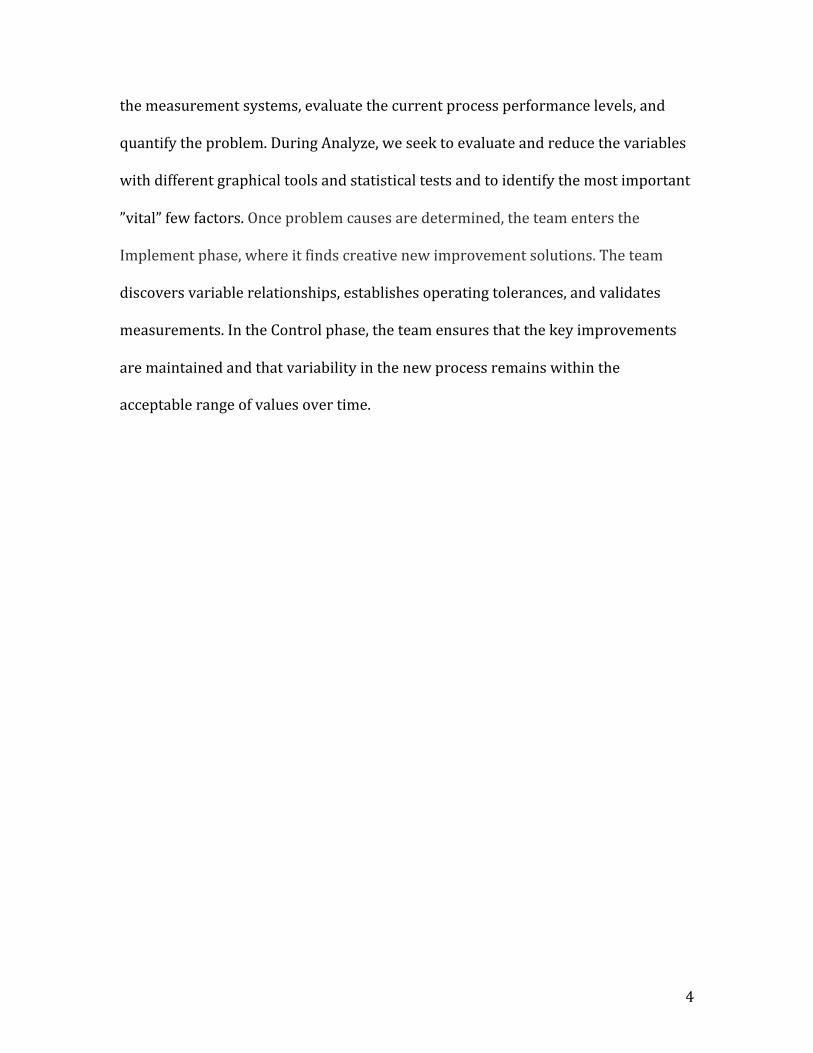
Six Sigma and DMAIC
What is Six Sigma? Six Sigma is all about quality. Sigma is a statistical measure of
variation. When a process reaches a six-‐sigma level of quality, it means that
processes are producing only 3.4 defects per million opportunities (DPMO). This
means that the process is nearly perfect. In addition, Six Sigma is a problem-‐solving
methodology developed to eliminate the root causes of defects. Finally, Six Sigma is
a management philosophy. It recognizes that defects decrease satisfaction and
customer loyalty and increase costs.
In Six Sigma methodology projects, a team collects data on variations in outputs
associated with each process so that the process can be improved and variations can
be reduced.
The first step is identifying the attributes most important to the customers. These
are the critical-‐to-‐quality (CTQ) elements of a process. The next step is reducing
variations on the most important “vital” factors stabilizes the process. Six Sigma
methodologies is a funneling process of narrowing down the factors of a problem to
the vital few.
The Six Sigma methodology generally consists of five phases: Define, Measure,
Analyze, Improve, and Control (DMAIC). In the Define phase, the Six Sigma project
team identifies a project. The team identifies CTQs that have the most impact on
quality. During Measure the team identifies one or more product or service
characteristics, map the process, identifies the potential predictor variables, validate
4
the measurement systems, evaluate the current process performance levels, and
quantify the problem. During Analyze, we seek to evaluate and reduce the variables
with different graphical tools and statistical tests and to identify the most important
”vital” few factors. Once problem causes are determined, the team enters the
Implement phase, where it finds creative new improvement solutions. The team
discovers variable relationships, establishes operating tolerances, and validates
measurements. In the Control phase, the team ensures that the key improvements
are maintained and that variability in the new process remains within the
acceptable range of values over time.
5
Abstract
Various International customers remit payment for fulfilled orders through a Letter
of Credit, or LC. A LC is a financial mechanism to pay for goods or services rendered.
The value of the LCs is equal to the value of the customer’s purchase order. Each
purchase order has a unique LC.
LCs are managed and maintained within the Export Services Group by LC
Specialists. The majority of LCs are amended at least once during the fulfillment
process. Proper management of the LC is essential to reduce rework and delays
during the LC amendment process. LC amendments take approximately 14 days.
Currently, there is no standard work for LC Specialist to document information
needed to amend an LC.
About 55% of the LCs captured in the data collection phase were expired. The value
of the orders with expired LCs was over $11M. If material is shipped when the LC is
expired, delays occur within the collection process.
The value of the material that does not ship because of expired LCs at the end of
each quarter ranges from $500k to $1M dollars.
Recording all data in Oracle is an essential step with managing the LC. Proper
management and maintenance of the LCs by the LC Specialist will ensure that the
rework to get amendments will be reduced. In addition, material will not ship
without a valid LC, and the amount of inventory at quarter end will be small as
possible.
6
Focused Problem Definition
Problem Statement: LC Specialists do not have a standard way to manage Letters
of Credit. Currently, each LC specialist manages the LC using a spreadsheet and
occasionally enters the same data into Oracle. Data contained in the spreadsheet is
only accessible to the LC Specialist (to others by request). Entering data into Oracle
will ensure that all necessary parties will have access to the same information. Data
entry into Oracle will provide a mechanism to measure progress.
Project Benefits:
•Consistent process for Letter of Credit Specialist for managing letters of credits
•Pro-‐active reviews of the LC before expiry
•Weekly metric distributed to critical stakeholders to assist with LC management
•Reduce rework due to material being packaged and then held because the LC is not valid.
Team Members:
Master Black Belt: Reinaldo Arreaza
Salana Oliver
Karen Wykoff
Lisa Tisdale
Natalie Lee
Dean Warnken
Shelly Barnes
Diane Vrable
Ezequiel Halac
7
Critical To Quality (CTQs):
•The LC specialist logs LC information into Oracle
•Ability to track LC status (using Oracle information, once the order is entered into Oracle)
Defect: LC Data not entered into Oracle by the LC Specialist for each respective customer order
Baseline DPMO: 86,457
Current DPMO: 34,734
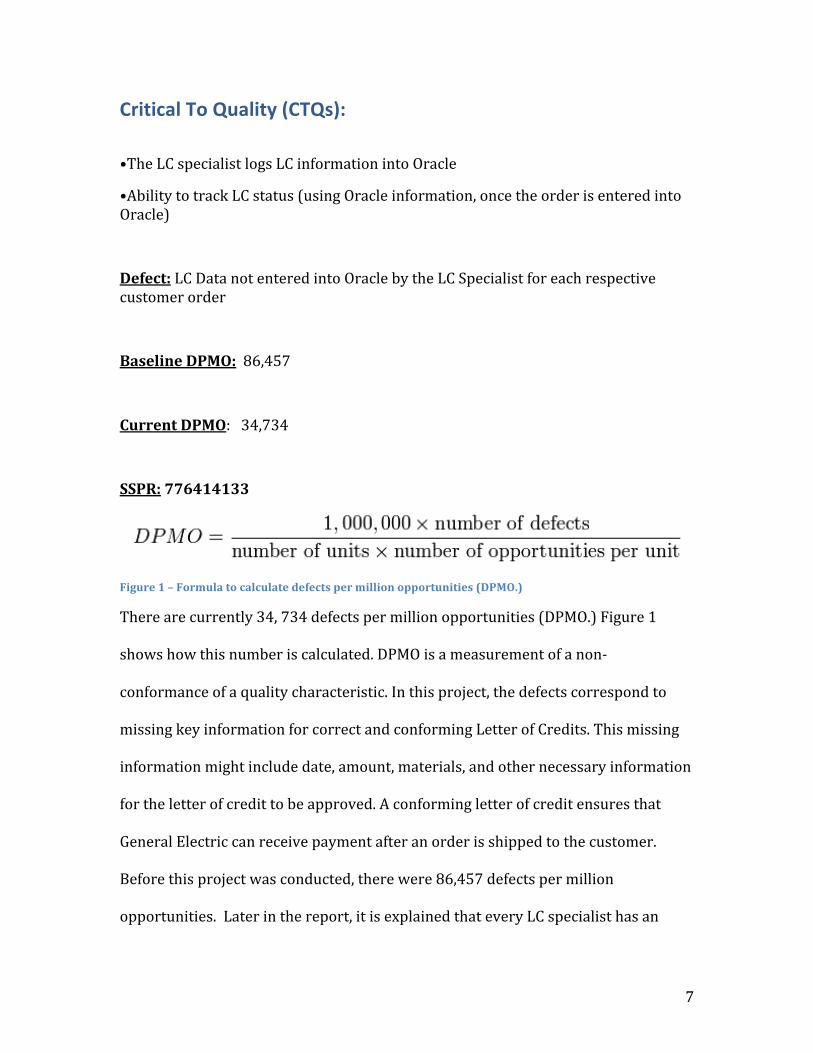
SSPR: 776414133
Figure 1 – Formula to calculate defects per million opportunities (DPMO.)
There are currently 34, 734 defects per million opportunities (DPMO.) Figure 1
shows how this number is calculated. DPMO is a measurement of a non-‐
conformance of a quality characteristic. In this project, the defects correspond to
missing key information for correct and conforming Letter of Credits. This missing
information might include date, amount, materials, and other necessary information
for the letter of credit to be approved. A conforming letter of credit ensures that
General Electric can receive payment after an order is shipped to the customer.
Before this project was conducted, there were 86,457 defects per million
opportunities. Later in the report, it is explained that every LC specialist has an
8
opportunity to load information about letter of credits into Oracle. The drive of this
project is to have Oracle be the focal point to report if all information is complete
and accurate. Missing information would appear during the weekly tracking
procedure.
9
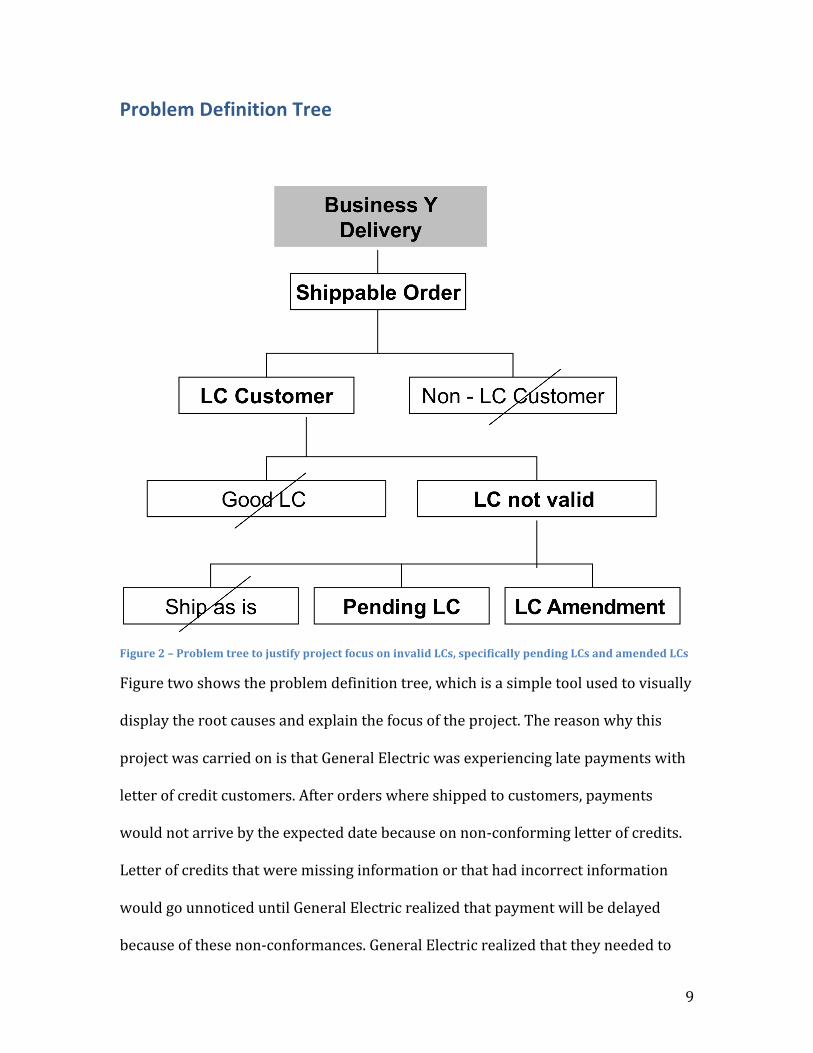
Problem Definition Tree
Figure 2 – Problem tree to justify project focus on invalid LCs, specifically pending LCs and amended LCs
Figure two shows the problem definition tree, which is a simple tool used to visually
display the root causes and explain the focus of the project. The reason why this
project was carried on is that General Electric was experiencing late payments with
letter of credit customers. After orders where shipped to customers, payments
would not arrive by the expected date because on non-‐conforming letter of credits.
Letter of credits that were missing information or that had incorrect information
would go unnoticed until General Electric realized that payment will be delayed
because of these non-‐conformances. General Electric realized that they needed to
10
become better at collecting letter of credit information and continuously monitor
these documents in order to avoid further delays in payment by customers. The
problem definition tree shows that there were problems collecting payments from
LC customers. This is due to LCs being not valid. In some cases, missing information
in invalid LCs can be overlooked if the order is an emergency order or if the
customer has been doing business with GE for an extended period of time and there
is ample trust within the two parties. However, LCs are amended and managed over
the life of the contract. Timely management of the LC is essential to ensure rework
is limited. Orders pending an LC or with pending LC account for 71 % of the
baseline data. About 55% of LCs are expired, with an order value for these POs of
over $11m . There is no standard work between LC specialists and the use of Oracle
to manage the LC. LCs which are ending or need to be amended go unnoticed until it
is time to receive payment. The focus of this project is to develop a methodology to
better capture and monitor LCs to avoid late payments and unnecessary rework.
11
Measurement System Validation
Gauge R & R is a concept to insure that there are stabile measurements where a
single person gets the same results every time they measure and collect data
measurements. This is a necessary step to ensure data is consistent and stable.
Conducted Attribute Gage RR using 3 operators. The data is a direct output from
Oracle tables. Assumption -‐ data in the warehouse tables are accurate and
reflective of what is entered into ORACLE.
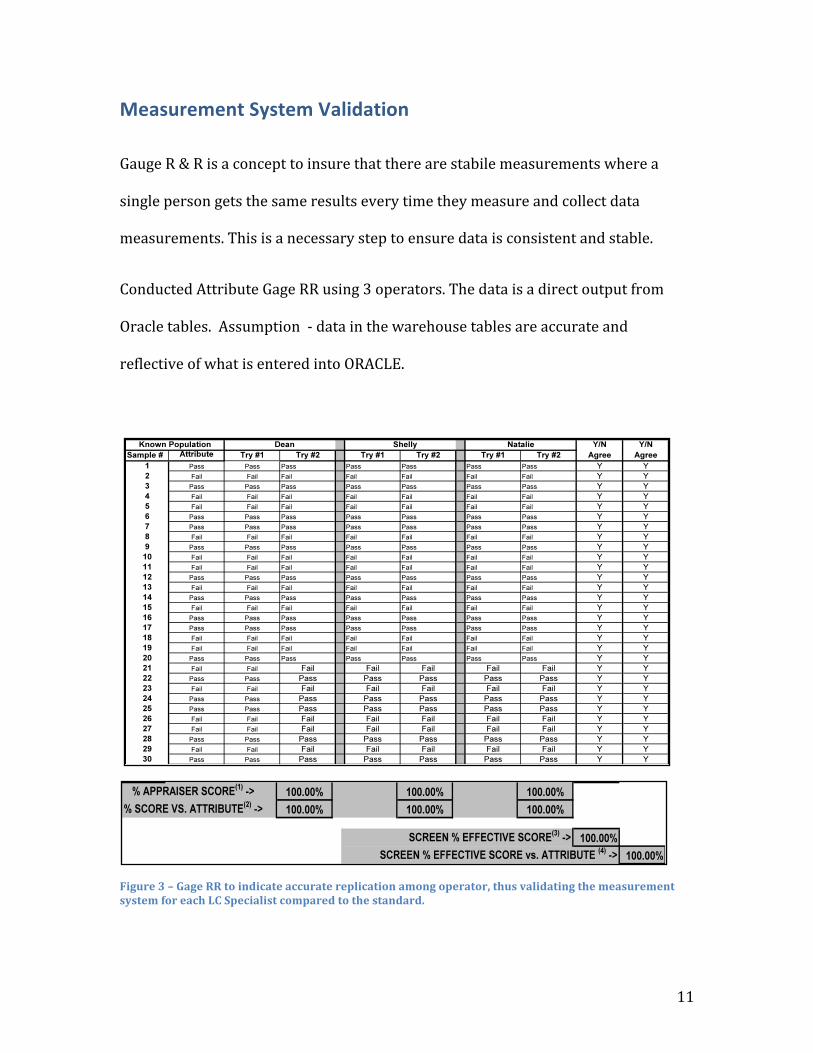
Figure 3 – Gage RR to indicate accurate replication among operator, thus validating the measurement system for each LC Specialist compared to the standard.
12
Figure 3 shows the result of the Gage R&R. Three operators went through a sample
of 30 letters of credit to find out if replication can be obtained over time. Each
operator had to go through the LC to see if they pass or fail. They would look at each
LC and check that all necessary information required in a conforming LC was
complete and accurate. The operators would go through the weekly report for these
LCs and make sure all information was entered correctly. The purpose of this
analysis is to prove that the information being analyzed is correct and that there is
no problem with the measurement system. Later in the report, it will be shown that
this step is necessary in order to prove that the problems with LCs is not due to the
way the operators examine LCs due to lack of experience or training but rather
because of problems with the actual process itself. A Score of 100% shows
agreement across the board for each operator and each try.
The results indicate that the three operators are 100% consistent in the way they
analyze data since their results were identical for the two tries. In addition, all three
operators are 100% consistent with the standard (or the attribute) in both tries.
This indicates that there is no need to further train the operators and that there is
not proven issues with the ability of operators to spot deficiencies in the LCs
compared to the attribute (standard.)
13
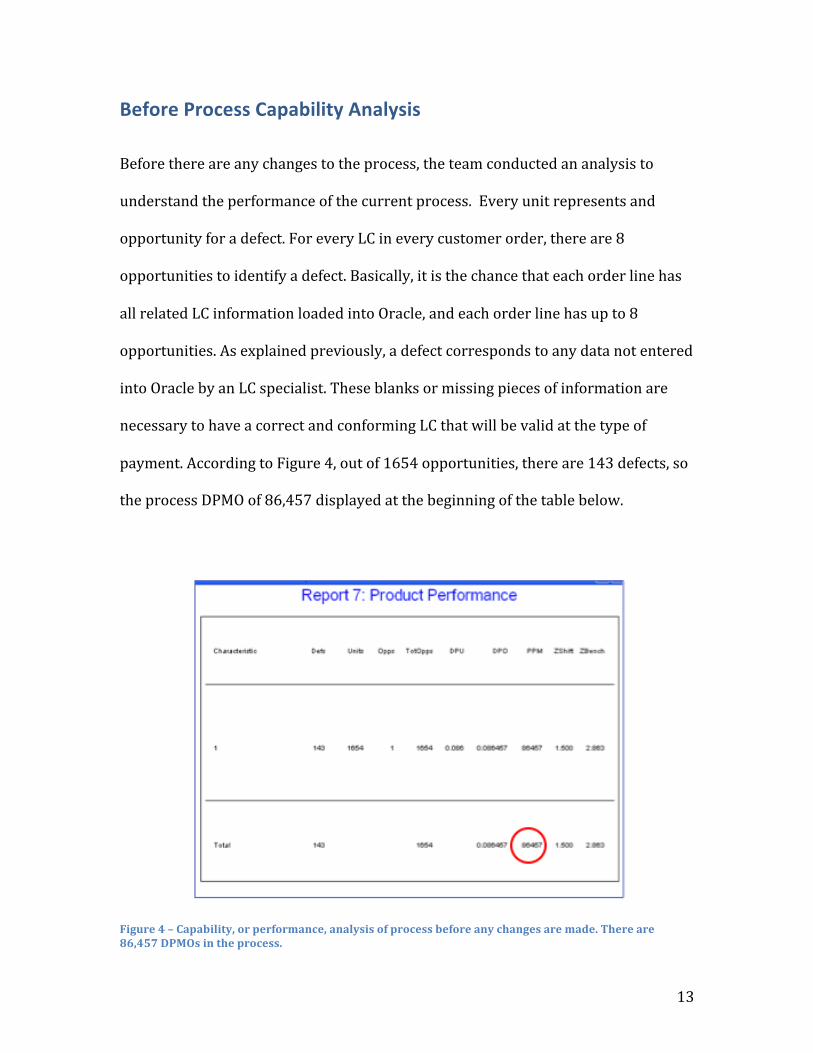
Before Process Capability Analysis
Before there are any changes to the process, the team conducted an analysis to
understand the performance of the current process. Every unit represents and
opportunity for a defect. For every LC in every customer order, there are 8
opportunities to identify a defect. Basically, it is the chance that each order line has
all related LC information loaded into Oracle, and each order line has up to 8
opportunities. As explained previously, a defect corresponds to any data not entered
into Oracle by an LC specialist. These blanks or missing pieces of information are
necessary to have a correct and conforming LC that will be valid at the type of
payment. According to Figure 4, out of 1654 opportunities, there are 143 defects, so
the process DPMO of 86,457 displayed at the beginning of the table below.
Figure 4 – Capability, or performance, analysis of process before any changes are made. There are 86,457 DPMOs in the process.
14
Solution Tree
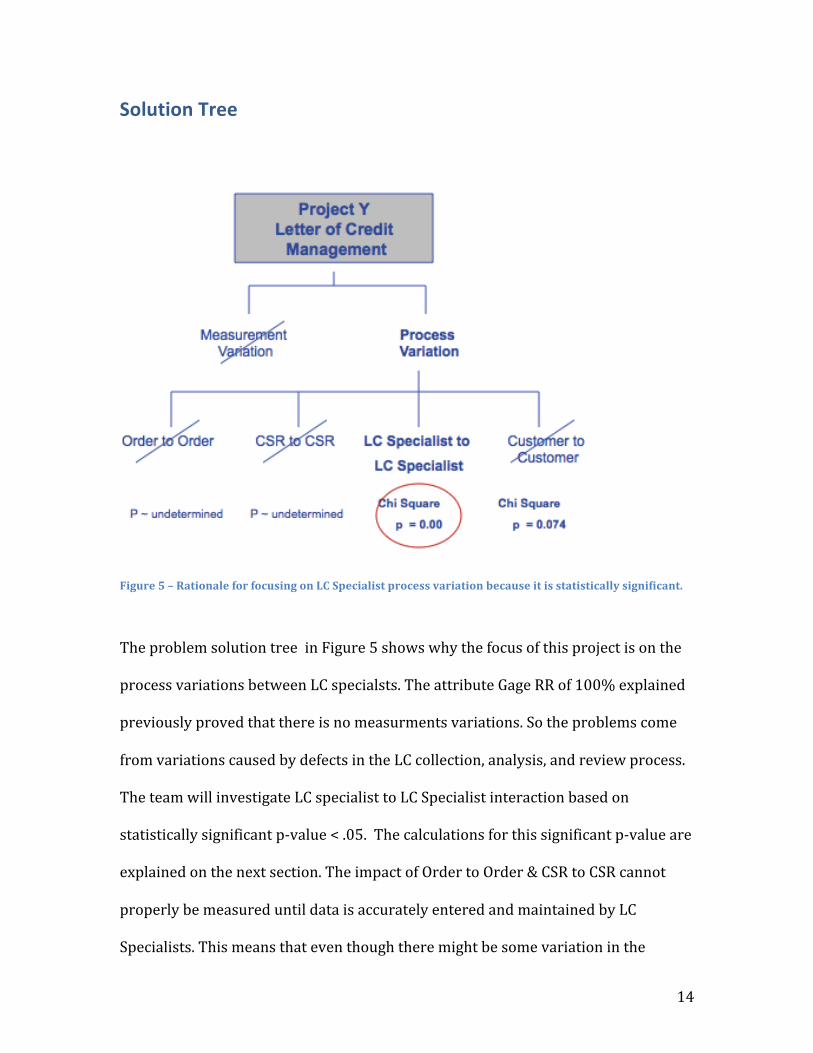
Figure 5 – Rationale for focusing on LC Specialist process variation because it is statistically significant.
The problem solution tree in Figure 5 shows why the focus of this project is on the
process variations between LC specialsts. The attribute Gage RR of 100% explained
previously proved that there is no measurments variations. So the problems come
from variations caused by defects in the LC collection, analysis, and review process.
The team will investigate LC specialist to LC Specialist interaction based on
statistically significant p-‐value < .05. The calculations for this significant p-‐value are
explained on the next section. The impact of Order to Order & CSR to CSR cannot
properly be measured until data is accurately entered and maintained by LC
Specialists. This means that even though there might be some variation in the
15
process due to variations between different orders placed by the same customer or
by the order entry process owned by the Customer Service Representatives, there is
not enough data to identify these variations. Variations between customers were
analyzed and a p-‐value of .074 was calculated. This might seem significant. However,
using a tolerance of .05, this is not statistically significant and ignored in this project.
16
Vital X Identification
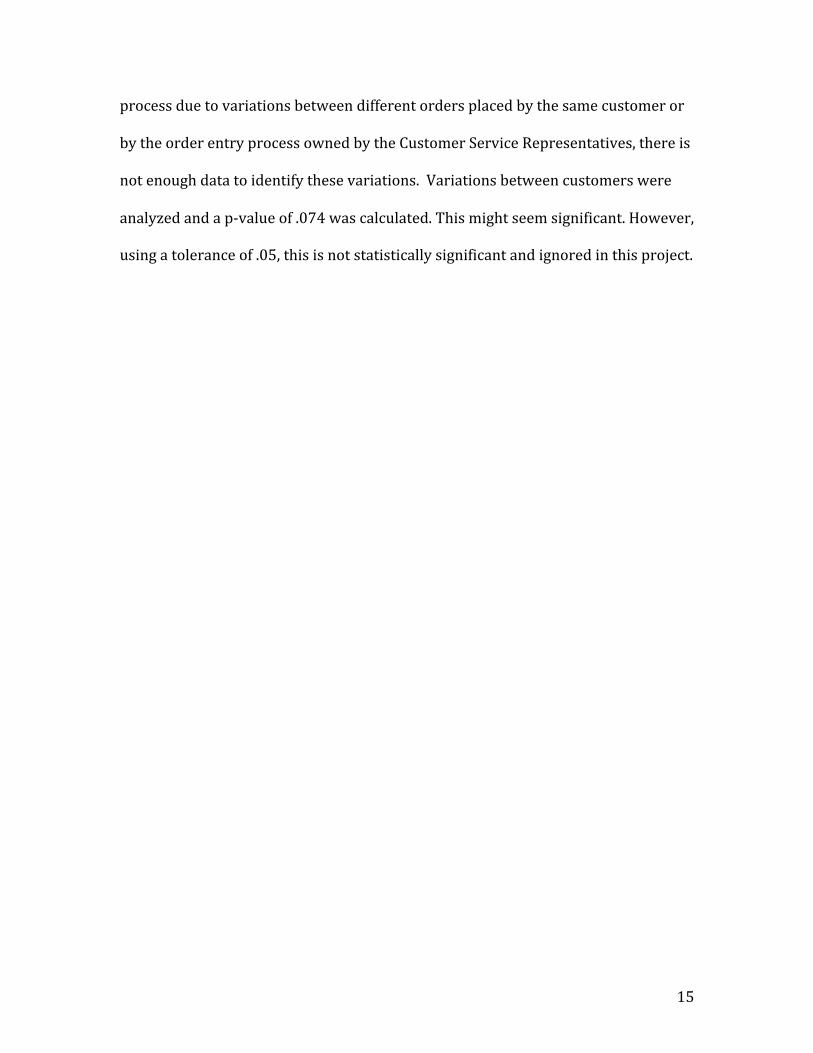
The team ran a Chi-‐square test to analyze if there is a statistically significant difference between operators’ performance on LC specialist sample. Found that there is a significant difference between LC Specialists.
Figure 6 – Chi-Squared test to determine if performance between the three LC Specialists is statistically significant. A test statistic of 24.683 with 2 degrees of freedom results in a significant p-value of 0.000.
Findings:
LC Specialist # 1 Performed worst with a pass rate of 3.8% (1/26)
LC Specialist # 3 had a better pass rate at 55.6% (45/81)
LC Specialist contains the Vital X P–Value = 0.00 with 2 degrees of freedom.
Figure 6 shows the steps in calculating the small p-‐value, which indicates that the
performance of different LC Specialist is statistically significantly different.
17
Operators 1, 2 and 3 were responsible for a certain number of LCs (26 for operator
1, 27 for operator 2, and 81 for operator 3.) Eight fields need to be completed to
ensure the LC is conforming or “Good.” If any of these key fields was not entered
into Oracle, the LC is considered invalid or “Bad.” This does not indicate a flaw in
the ability of the LC specialist to spot a mistake. Instead, it indicates a flaw in the
process carried out LC Specialists where they are not entering key information into
Oracle. This missing information required for a conforming LC will go unnoticed
until it is too late to receive payment on time. After the number of “Good” and “Bad”
LCs were entered into Minitab, the Chi-‐Squared test indicated that there is
statistically significant difference in the performance of the three LC specialists due
to flaws in the process.
Another Chi-‐Squared analysis was carried out to identify if there is significant
variation between customers. The p-‐value for the Chi-‐Squared test was .074. At a
tolerance of .05, it cannot be said with confidence that there is a significant
difference among orders between customers.
18
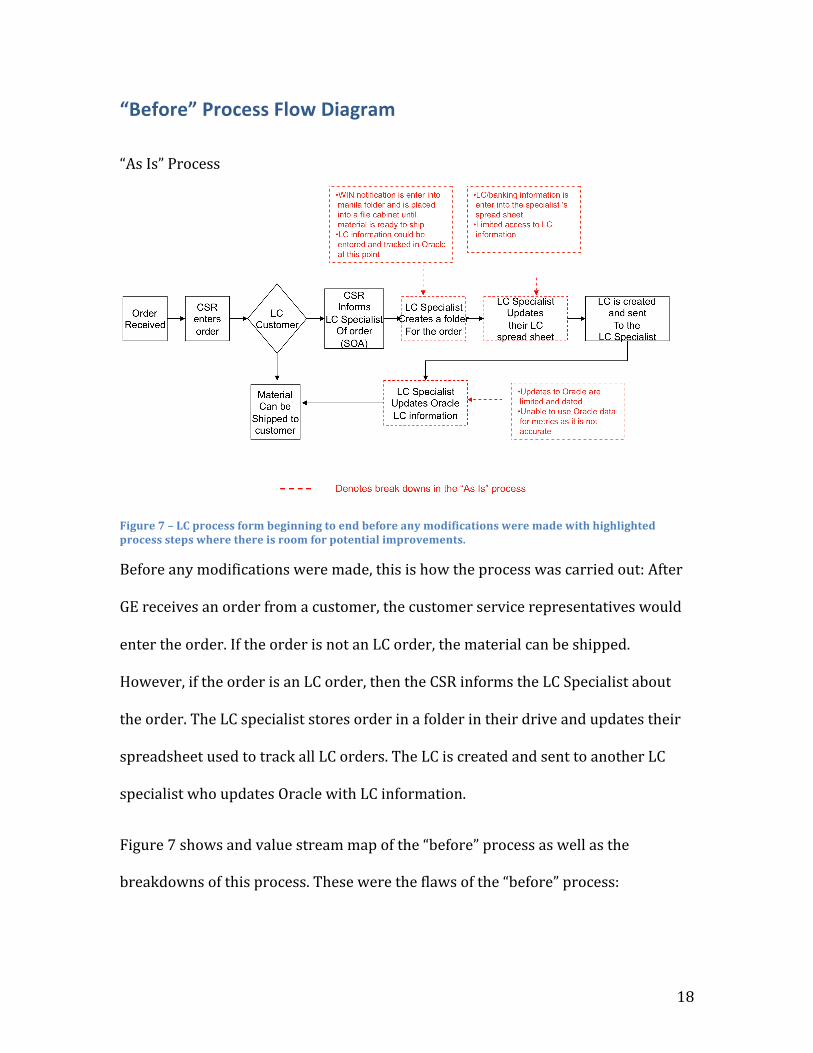
“Before” Process Flow Diagram
“As Is” Process
Figure 7 – LC process form beginning to end before any modifications were made with highlighted process steps where there is room for potential improvements.
Before any modifications were made, this is how the process was carried out: After
GE receives an order from a customer, the customer service representatives would
enter the order. If the order is not an LC order, the material can be shipped.
However, if the order is an LC order, then the CSR informs the LC Specialist about
the order. The LC specialist stores order in a folder in their drive and updates their
spreadsheet used to track all LC orders. The LC is created and sent to another LC
specialist who updates Oracle with LC information.
Figure 7 shows and value stream map of the “before” process as well as the
breakdowns of this process. These were the flaws of the “before” process:
19
• LC data is saved in and entered into Oracle at the beginning of the process as
opposed to toward the end when it is almost guaranteed that payment will
be late.
• All LC data and banking information is entered into a tracking spreadsheet,
which only the LC specialist has access to. There is no visibility to these LC’s
so it is impossible to identify any error and to make any amendments.
• Data is entered into Oracle very late in the process when LC details are
outdated and amended. This data is no longer valid and not useful for
developing metrics.
• If nothing is entered into the database no one knows there is an LC pending.
There can be up to a six-‐month gap between order entry and material
shipment and thus, nobody would know if there is something missing on the
LC or if the LC is missing.
From these process breakdowns the team was able to identify several opportunities.
For example, by entering information into Oracle you can track all LC information as
well as the banking information. A report generated weekly would communicate if
all information was entered into the spreadsheet. It is necessary to look at info in
continues way as opposed to wait for LCs to be rejected at the last moment.
20
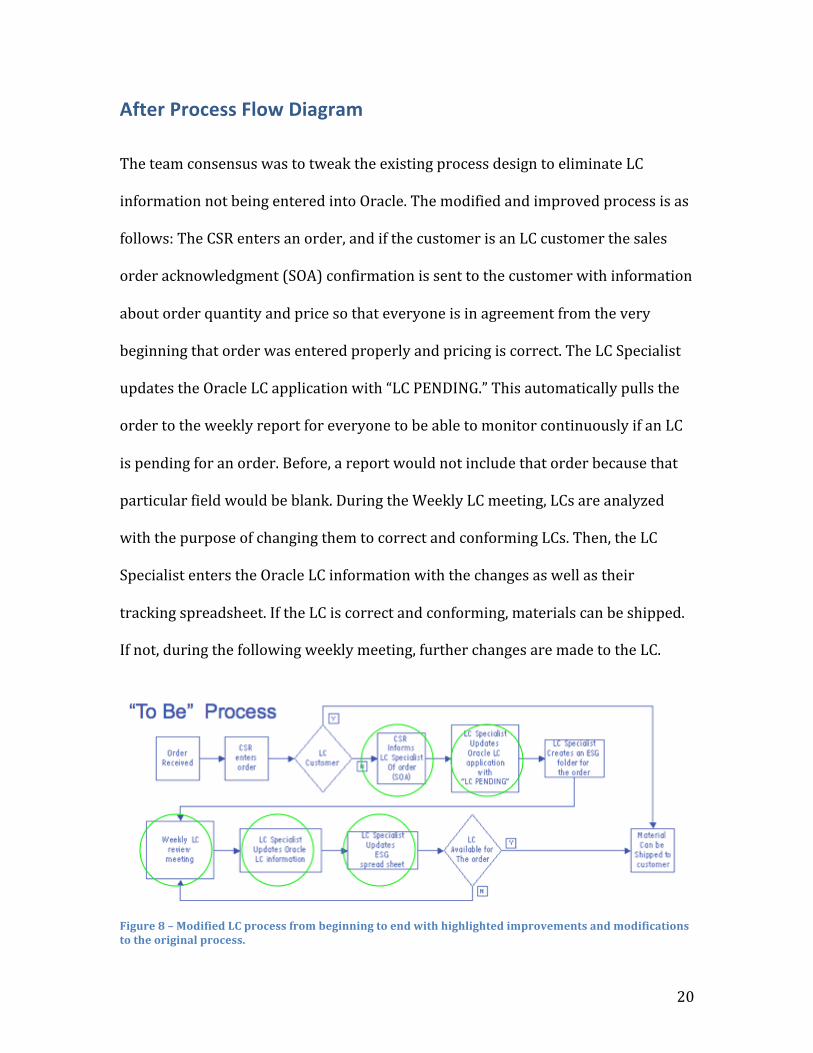
After Process Flow Diagram
The team consensus was to tweak the existing process design to eliminate LC
information not being entered into Oracle. The modified and improved process is as
follows: The CSR enters an order, and if the customer is an LC customer the sales
order acknowledgment (SOA) confirmation is sent to the customer with information
about order quantity and price so that everyone is in agreement from the very
beginning that order was entered properly and pricing is correct. The LC Specialist
updates the Oracle LC application with “LC PENDING.” This automatically pulls the
order to the weekly report for everyone to be able to monitor continuously if an LC
is pending for an order. Before, a report would not include that order because that
particular field would be blank. During the Weekly LC meeting, LCs are analyzed
with the purpose of changing them to correct and conforming LCs. Then, the LC
Specialist enters the Oracle LC information with the changes as well as their
tracking spreadsheet. If the LC is correct and conforming, materials can be shipped.
If not, during the following weekly meeting, further changes are made to the LC.
Figure 8 – Modified LC process from beginning to end with highlighted improvements and modifications to the original process.
21
Process Improvements:
Below is the summary of the process improvements indicated by green circles in
figure 8:
•Clearer ITO-‐OTR handoff between CRS and LC Specialist ensuring that the need for
an LC is communicated so LC data entry can begin
•“LC PENDING” Allows the PO to be pulled up
In a report for weekly tracking and maintenance of Order/LC even if the customer
has not provided LC
•Weekly meeting are used to monitor LC “health”. Issues can be identified before
the negatively impact shipments
•LC specialists now regularly update Oracle. Updates are reviewed during weekly
review
•LC specialist continue to maintain ESG spread sheet as it contains information not
currently being tracked in Oracle
22
After Process Capability Analysis
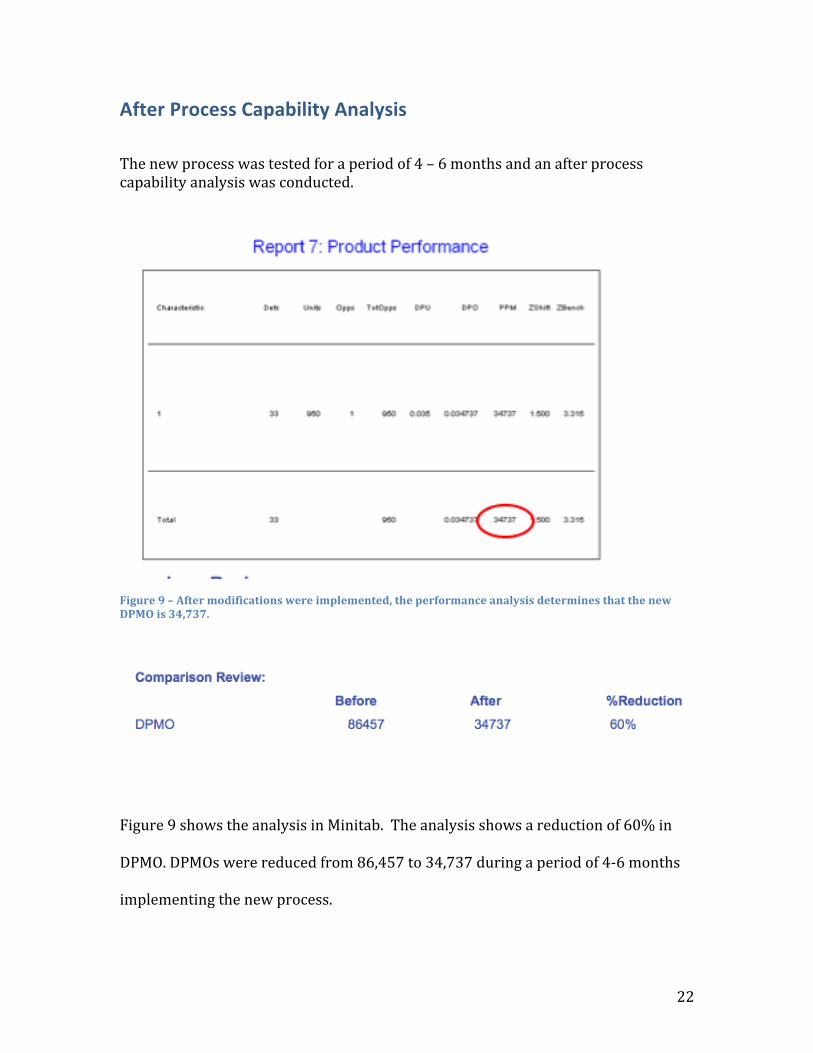
The new process was tested for a period of 4 – 6 months and an after process capability analysis was conducted.
Figure 9 – After modifications were implemented, the performance analysis determines that the new DPMO is 34,737.
Figure 9 shows the analysis in Minitab. The analysis shows a reduction of 60% in
DPMO. DPMOs were reduced from 86,457 to 34,737 during a period of 4-‐6 months
implementing the new process.
23
Statistical Process Improvement
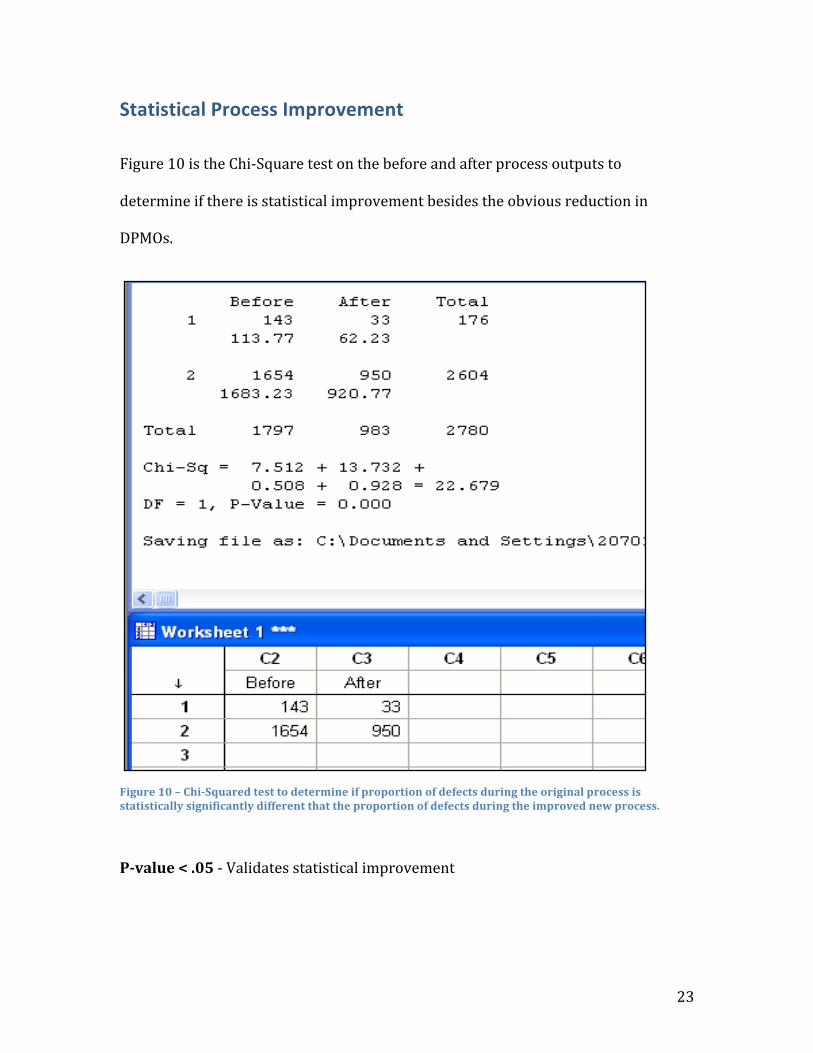
Figure 10 is the Chi-‐Square test on the before and after process outputs to
determine if there is statistical improvement besides the obvious reduction in
DPMOs.
Figure 10 – Chi-Squared test to determine if proportion of defects during the original process is statistically significantly different that the proportion of defects during the improved new process.
P-value < .05 -‐ Validates statistical improvement
24
The test is ran by inputting the number of defects and opportunities for the “before”
and “after” processes. Then Minitab calculates the Chi-‐Squared test statistics and
comes up with a p-‐value. Figure 10 shows the p-‐value of 0.00. At a 0.05 tolerance,
this small p-‐value indicates that there is a statistically significant difference between
the “before” and the “after” process.
Summary of Project Improvements
•Process consistency across LC Specialists tor LC management and data entry into
Oracle
•Data entry allows for LC metrics to be generated on a weekly basis
•Metrics and weekly reviews allow for a proactive review of LCs to ensure
amendments are requested in a timely fashion limiting negative impacts to
shipments.
•36% reduction in defects based on post-‐implementation data.
•Number of expired LCs reduced from 55 % to 13% post project changes
•LC reports are located at a central site for user access anytime.
25
APPENDIX
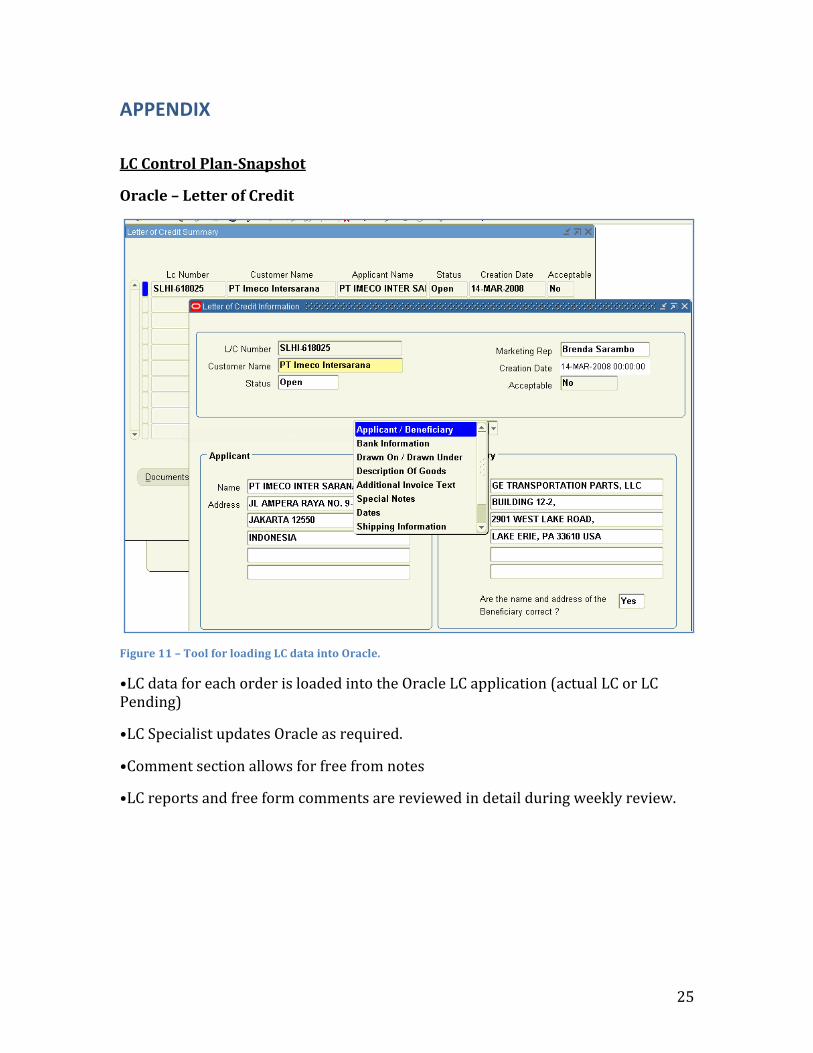
LC Control Plan-Snapshot
Oracle – Letter of Credit
Figure 11 – Tool for loading LC data into Oracle.
•LC data for each order is loaded into the Oracle LC application (actual LC or LC Pending)
•LC Specialist updates Oracle as required.
•Comment section allows for free from notes
•LC reports and free form comments are reviewed in detail during weekly review.
26
Support Central Escalation Process
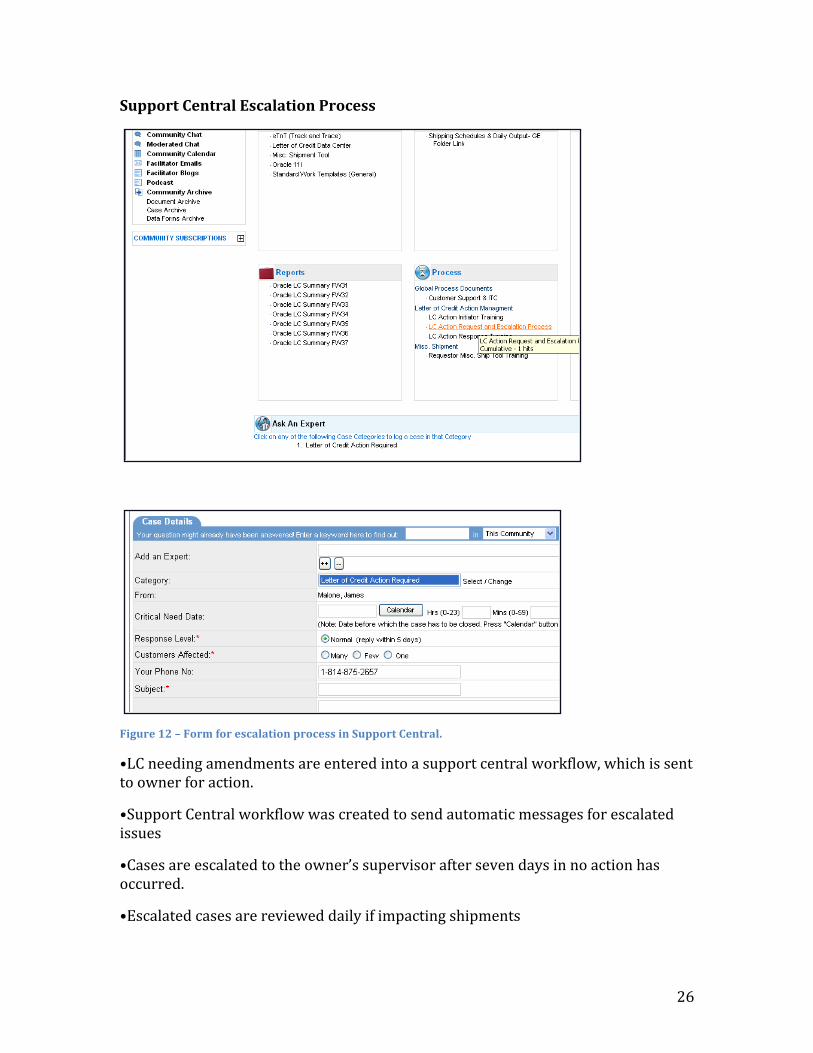
Figure 12 – Form for escalation process in Support Central.
•LC needing amendments are entered into a support central workflow, which is sent to owner for action.
•Support Central workflow was created to send automatic messages for escalated issues
•Cases are escalated to the owner’s supervisor after seven days in no action has occurred.
•Escalated cases are reviewed daily if impacting shipments
27
LC – Meeting and Metrics
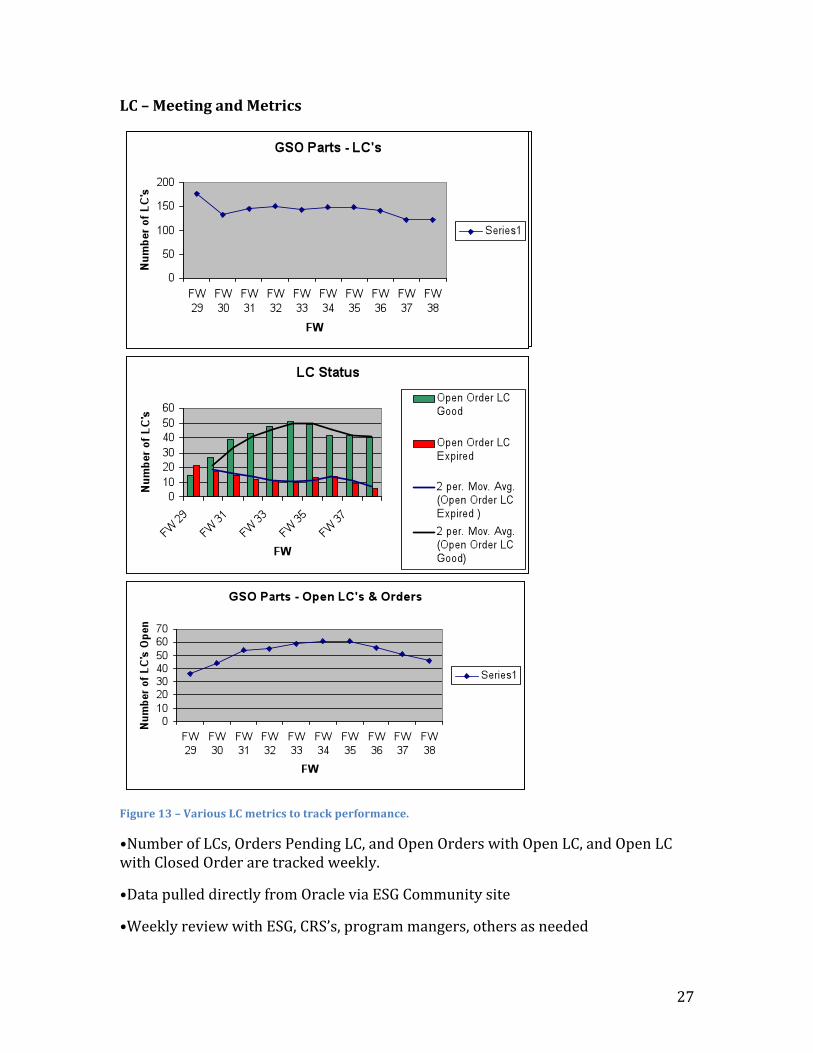
Figure 13 – Various LC metrics to track performance.
•Number of LCs, Orders Pending LC, and Open Orders with Open LC, and Open LC with Closed Order are tracked weekly.
•Data pulled directly from Oracle via ESG Community site
•Weekly review with ESG, CRS’s, program mangers, others as needed
28
•Metrics distributed weekly
Summary of Control Plan
LC Meeting and Metrics
Owner: Malone Frequency: Weekly
•Weekly meeting is limited to the discussion of the status of LCs. Status includes expired LCs, pending LCs, LC amendments needed, escalation cases and plans to ensure shippable material is not impacted by an invalid LC. Meeting minutes are recorded and distributed to the team. Metrics are created and distributed.
Shipping Schedule Review
Owner: Higby Frequency: Daily
•Daily shipment schedules are reviewed with ELK, program managers, CRS’s, others as needed. LC issues with the potential to impact shipments are discussed. Emphasis is given to shipping material before the LC expires during these meetings.
Program Manager Review
Owner: Woodman/Malone Frequency: Weekly
•Weekly, the GSO program managers review projects they are tracking with a cross functional team. Status and issues are discussed including LC issues potentially impacting shipments. Format reviewed is the program manager’s excel matrix/shipping schedule.
FCR Review
Owner: Jones/Higby Frequency: Weekly
•GSO program mangers review their shipping schedule at Forecast Change Review weekly. Material in jeopardy of not shipping is reviewed in detail including shipments with invalid LCs.
LC Escalation Review
Owner: Malone Frequency: Weekly/As Needed
•Cases escalated through the Support Central site are reviewed weekly at the LC meeting and if needed daily by management team.
Related Documents