Predicting Jet Engine Component Wear to Enable Proactive Fleet Maintenance by Eamonn Samuel Shirey B.S.E., University of Michigan, Ann Arbor, 2013 Submitted to the Department of Mechanical Engineering and the MIT Sloan School of Management in partial fulfillment of the requirements for the degrees of Master of Science in Mechanical Engineering and Master of Business Administration in conjunction with the Leaders for Global Operations Program at the MASSACHUSETTS INSTITUTE OF TECHNOLOGY June 2019 @ Eamonn Samuel Shirey, MMXIX. All rights reserved. The author hereby grants to MIT permission to reproduce and to distribute publicly paper and electronic copies of this thesis document in whole or in part in any medium now known or hereafter created. Author ...................................... Signature redacted Department of Mechanical Engineering and the MIT Sloan School of Management May 10, 2019 Signature redacted C ertified by ....................... ................... David Hardt, Thesis Supervisor Ralph E. and Eloise F. Cross Professor in Manufacturing Department of Mechanical Engineering Signature redacted C ertified by ......................... ........ Rahul Aazumder, Thesis Supervisor Assistant Profess ations Research and Statistics an School of Management Signature redacted- A pproved by ....................... ................... I Nicolas Hadjiconstantinou Chair, Mechanical Engineering Committee on Graduate Students Signature redacted Approved by.................................... aura Herso Maura Herson MASSACH S STITUTE Director, MBA Program, MIT Sloan School of Management OF T 4HNOAGY JUN0 4 2019 1 AMCHIVES LIBRARIES

Welcome message from author
This document is posted to help you gain knowledge. Please leave a comment to let me know what you think about it! Share it to your friends and learn new things together.
Transcript
Predicting Jet Engine Component Wear to Enable
Proactive Fleet Maintenanceby
Eamonn Samuel ShireyB.S.E., University of Michigan, Ann Arbor, 2013
Submitted to the Department of Mechanical Engineering and the MIT Sloan School ofManagement in partial fulfillment of the requirements for the degrees of
Master of Science in Mechanical Engineering
and
Master of Business Administration
in conjunction with the Leaders for Global Operations Program at the
MASSACHUSETTS INSTITUTE OF TECHNOLOGY
June 2019@ Eamonn Samuel Shirey, MMXIX. All rights reserved.
The author hereby grants to MIT permission to reproduce and to distribute publicly paper and electroniccopies of this thesis document in whole or in part in any medium now known or hereafter created.
Author ...................................... Signature redactedDepartment of Mechanical Engineering and the MIT Sloan School of Management
May 10, 2019
Signature redactedC ertified by ....................... ...................
David Hardt, Thesis SupervisorRalph E. and Eloise F. Cross Professor in Manufacturing
Department of Mechanical Engineering
Signature redactedC ertified by ......................... ........
Rahul Aazumder, Thesis SupervisorAssistant Profess ations Research and Statistics
an School of Management
Signature redacted-A pproved by ....................... ...................
I Nicolas HadjiconstantinouChair, Mechanical Engineering Committee on Graduate Students
Signature redactedApproved by.................................... aura Herso
Maura HersonMASSACH S STITUTE Director, MBA Program, MIT Sloan School of ManagementOF T 4HNOAGY
JUN0 4 2019 1 AMCHIVES
LIBRARIES

THIS PAGE INTENTIONALLY LEFT BLANK
2
Predicting Jet Engine Component Wear to Enable Proactive
Fleet Maintenance
by
Eamonn Samuel Shirey
Submitted to the Department of Mechanical Engineering and the MIT Sloan School ofManagement on May 10, 2019, in partial fulfillment of the requirements for the degrees of
Master of Science in Mechanical Engineeringand
Master of Business Administration
Abstract
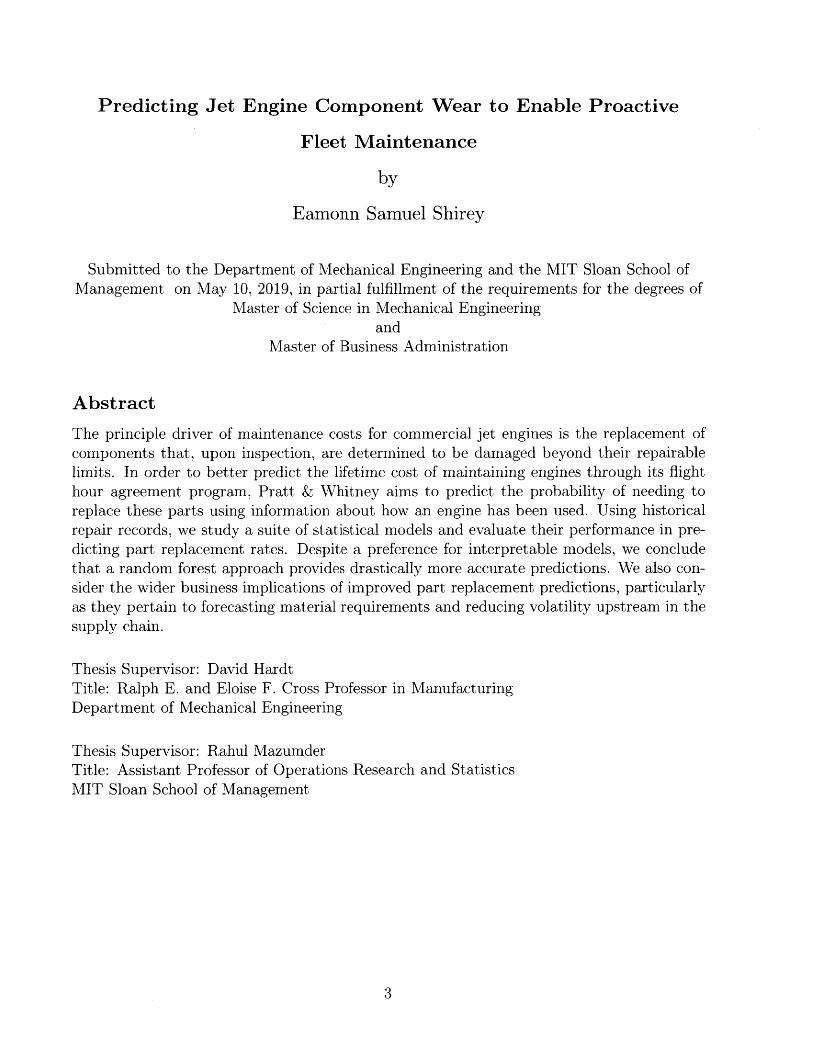
The principle driver of maintenance costs for commercial jet engines is the replacement ofcomponents that, upon inspection, are determined to be damaged beyond their repairablelimits. In order to better predict the lifetime cost of maintaining engines through its flighthour agreement program, Pratt & Whitney aims to predict the probability of needing toreplace these parts using information about how an engine has been used. Using historicalrepair records, we study a suite of statistical models and evaluate their performance in pre-dicting part replacement rates. Despite a preference for interpretable models, we concludethat a random forest approach provides drastically more accurate predictions. We also con-sider the wider business implications of improved part replacement predictions, particularlyas they pertain to forecasting material requirements and reducing volatility upstream in thesupply chain.
Thesis Supervisor: David HardtTitle: Ralph E. and Eloise F. Cross Professor in ManufacturingDepartment of Mechanical Engineering
Thesis Supervisor: Rahul MazumderTitle: Assistant Professor of Operations Research and StatisticsMIT Sloan School of Management
3

THIS PAGE INTENTIONALLY LEFT BLANK
4

Acknowledgments
This thesis would not have been possible without the support of a myriad of people, all of
whom deserve more recognition than a single acknowledgments section can provide.
Thank you to my Pratt & Whitney colleagues, without whom this project would not have
gotten off of the ground. To Travis Gracewski and Kevin Thomas, thank you for showing
me what life for an LGO in East Hartford is like, and for showing me the broader scope of
Pratt & Whitney's operations. To Rohan Mehta and Jason Rhodes, my project supervisors,
thank you for the guidance and giving me the opportunity to experience life in the world of
Engine Services. To John Harrington and Gene Holtsinger, thank you for showing me how
this project could be put to use. To Scott Kolb and Nikki Gonzalez, thank you for sharing
your space and making sure I landed feet first while the project was in its infancy.
To my thesis advisors, Professors Dave Hardt and Rahul Mazumder, whose advice was
crucial to the completion of this project. Thank you for lending me your wisdom, support,
and credibility. I would have gotten nowhere without you.
To my Aunt Jo and Uncle James, who opened their home and lent me moral support
during my time in Connecticut. I can't imagine having done this project without you. Thank
you for helping me explore our roots and trusting me not to kill your plants while you were
away.
To my family, without whom I would not be where I am today. You guys are the best,
and you know it. Thank you for the constant support.
And finally, to Liz Asai. You are an inspiration, constantly exhibiting the intelligence
and drive that I aspire to every day. Keep crushing it.
5
Contents
1 Introduction 13
1.1 Project Motivation . . . . . . . . . . . . . . . . . . . . . . . . . . . . . . . . 131.2 P roject G oals . . . . . . . . . . . . . . . . . . . . . . . . . . . . . . . . . . . 14
1.3 Background on Pratt & Whitney . . . . . . . . . . . . . . . . . . . . . . . . 15
1.4 Background on the V2500 Engine . . . . . . . . . . . . . . . . . . . . . . . . 16
2 Background 182.1 Jet Engine Propulsion . . . . . . . . . . . . . . . . . . . . . . . . . . . . . . 18
2.2 V 2500 M odules . . . . . . . . . . . . . . . . . . . . . . . . . . . . . . . . . . 21
2.3 Managing Flight Hour Agreements . . . . . . . . . . . . . . . . . . . . . . . 21
2.3.1 A nalytics . . . . . . . . . . . . . . . . . . . . . . . . . . . . . . . . . 22
2.3.2 Fleet Management . . . . . . . . . . . . . . . . . . . . . . . . . . . . 22
2.3.3 Power Plant Engineering . . . . . . . . . . . . . . . . . . . . . . . . . 23
2.3.4 F inance . . . . . . . . . . . . . . . . . . . . . . . . . . . . . . . . . . 23
3 Data Sources and Exploratory Analysis 24
3.1 Historical Repair Invoice Data . . . . . . . . . . . . . . . . . . . . . . . . . . 24
3.2 Advanced Diagnostics and Engine Maintenance Data . . . . . . . . . . . . . 25
3.3 Atmospheric Contamination data . . . . . . . . . . . . . . . . . . . . . . . . 26
3.4 The Impact of Interim Shop Visits . . . . . . . . . . . . . . . . . . . . . . . 27
3.5 Accounting for Policy Changes . . . . . . . . . . . . . . . . . . . . . . . . . . 28
3.6 Impact of Data Cleaning Choices . . . . . . . . . . . . . . . . . . . . . . . . 29
4 Current Shop Visit Cost Prediction Approach 31
4.1 Current Method for Predicting Shop Visit Costs . . . . . . . . . . . . . . . . 31
4.2 The argument for Part-based Cost Predictions . . . . . . . . . . . . . . . . . 32
4.3 Component Replacement as a Proxy for Cost . . . . . . . . . . . . . . . . . . 33
4.4 Implications of a Component-Based Model . . . . . . . . . . . . . . . . . . . 34
6
5 Analysis
5.1 Part Selection . . . . . . . . . . .
5.2 Modeling approach . . . . . . . .
5.3 Base Case . . . . . . . . . . . . .
5.4 Logistic Regressions . . . . . . . .
5.5 Variable Selection Models .
5.6 Mixture Models . . . . . . . . . .
5.7 Random Forest Models . . . . . .
6 Results
6.1 Modeling for Trial Parts.....
6.2 A note on Mixture Models .
6.3 Modeling for All Parts . . . . . .
6.4 Partial Dependence Plot Analysis
7 Business Implications
7.1 Uninterpretable Models . . . . . .
7.1.1 Management Buy-in
7.1.2 Directing Cost Reduction Programs
7.2 Improved Part Replacement Forecasts . . .
8 Recommendations and Future Work
8.1 Recommendations . . . . . . . . . . . . . . . . .
8.2 Future W ork . . . . . . . . . . . . . . . . . . . .
8.2.1 Expansion into Other Engine Programs .
8.2.2 Fleet Capacity Studies . . . . . . . . . .
8.2.3 Studies of Replacement vs. Scrap Rates
8.2.4 Studies of Repaired Component Wear . .
A Behavior of Random Forest Models
7
36
36
37
37
39
39
40
43
44
44
46
46
48
51
51
52
52
53
54
. . . . . . . . . . . . . . . . 5 4
. . . . . . . . . . . . . . . . 5 5
. . . . . . . . . . . . . . . . 5 5
. . . . . . . . . . . . . . . . 5 5
. . . . . . . . . . . . . . . . 5 5
. . . . . . . . . . . . . . . . 5 6
57
.
.
. . . . . .
List of Figures
1-1 Flow Chart Showing Model Inputs and Output
1-2 A cutaway drawing of the V2500 engine [1] . . . .
2-1
2-2
2-3
Gas flow through a turbofan engine . . . . . . . .
Brayton Cycle T-s Diagram . . . . . . . . . ...
V2500 Engine Modules . . . . . . . . . . . . . . .
3-1 Clean Interval Part Replacement Rates . . . . . . . . . . . . . . . . . .
3-2 Regular Interval Part Replacement Rates . . . . . . . . . . . . . . . . .
3-3 Historical Repair Costs for High Pressure Turbine . . . . . . . . . . . .
3-4 Implications of Data Selection on Data Availability . . . . . . . . . . .
4-1 Variability in HPT Module Repair Costs . . . . . . . . . . . . . . . . .
6-1 Model Performance on 13 Trial Parts . . . . . . . . . . . . . . . . . . .
6-2 Performance Improvement of Random Forests over Logistic Regressions
6-3 Performance Improvement of Random Forest Models over Base Case. .
6-4 Marginal Impact of Key Factors on Trial Part Replacement . . . . . . .
A-1
A-2
A-3
A-4
A-5
A-6
Partial Dependence Plot of Trial Part 1
Partial Dependence Plot of Trial Part 2
Partial Dependence Plot of Trial Part 3
Partial Dependence Plot of Trial Part 4
Partial Dependence Plot of Trial Part 5
Partial Dependence Plot of Trial Part 6
8
14
16
19
20
21
27
28
29
30
33
45
47
48
50
. . . . . 58
. . . . . 58
. . . . . 59
. . . . . 59
. . . . . 60
. . . . . 60
A-7 Partial Dependence Plot of Trial Part 7 . . . . . . . . . . . . . . . . . . . . . 61
A-8 Partial Dependence Plot of Trial Part 8 . . . . . . . . . . . . . . . . . . . . . 61
A-9 Partial Dependence Plot of Trial Part 9 . . . . . . . . . . . . . . . . . . . . . 62
A-10 Partial Dependence Plot of Trial Part 10 . . . . . . . . . . . . . . . . . . . . 62
A-11 Partial Dependence Plot of Trial Part 11 . . . . . . . . . . . . . . . . . . . . 63
A-12 Partial Dependence Plot of Trial Part 12 . . . . . . . . . . . . . . . . . . . . 63
A-13 Partial Dependence Plot of Trial Part 13 . . . . . . . . . . . . . . . . . . . . 64
9

Glossary
Clean Interval Intervals during which an engine has no interim shop visits.
Derate The percent reduction in maximum thrust an engine uses during flight.
Interval The period of time between major shop visits during which an engine is in use.
Regular Interval Intervals during which an engine has at least one interim shop visit.
Replacement Rate The number of a certain part that is replaced during a shop visit,
proportional to the total instances of that part on an engine.
Workscope A categorization of the expected extent of repairs an engine module will require
during a shop visit.
10
Acronyms
COMB Combustor Module.
CSO Cycles Since Overhaul.
DIFF Diffuser Module.
EAC Estimate at Completion.
EGT Exhaust Gas Temperature.
EM Expectation Maximization Algorithm.
FAN Fan Module.
FANCASE Fan Case Module.
FBC Front Bearing Compartment Module.
GBX External Gearbox Module.
HPC High Pressure Compressor Module.
HPT High Pressure Turbine Module.
HSR Hot Section Restoration.
LCCO Lifetime Contract Cost Optimization.
LPC Low Pressure Compressor Module.
11
LPT Low Pressure Turbine Module.
MAE Mean Absolute Error.
MRO Maintenance, Repair, and Operations.
MSE Mean Squared Error.
NGV Stage 1 Turbine Nozzle Module.
NO4BRG Number 4 Bearing Compartment Module.
TEC Turbine Exhaust Case Module.
TOW Time on Wing.
TSO Time Since Overhaul.
UPE Units per Engine.
12
-rpm,- -

Chapter 1
Introduction
1.1 Project Motivation
The success of Pratt & Whitney's Commercial Engine business hinges on its ability to
capture the aftermarket parts, maintenance, repair, and overhaul markets for its engines.
One of the company's strategies to capitalize on these markets is through the use of flight
hour agreements (FHAs). These contracts, which Pratt & Whitney signs with the operators
of its engines, act similarly to extended warranties for the engines they cover. In exchange
for regular payments determined by the use of the engines, Pratt & Whitney agrees to help
customers manage their engine fleets and provides regular maintenance and overhaul work.
These agreements allow engine operators to reduce uncertainty in their maintenance expense
forecasts as well as leverage Pratt & Whitney's extensive knowledge of engine maintenance.
In exchange, Pratt & Whitney receives a consistent revenue stream for the duration of the
contract, which last on the order of a decade.
In order to ensure that Pratt & Whitney profits from these contracts, however, the
organization needs to be able to anticipate fleet maintenance needs, minimize the cost of
those repairs, and ensure that customers have a sufficient number of engines in service at any
given time. To accomplish this, Pratt & Whitney employs a variety of statistical methods,
as well as engineering judgments, to manage the execution of its FHAs. This project aims
to evaluate methods that could improve this cost-prediction and maintenance process.
We will examine historical engine repair records to evaluate statistical models that predict
13
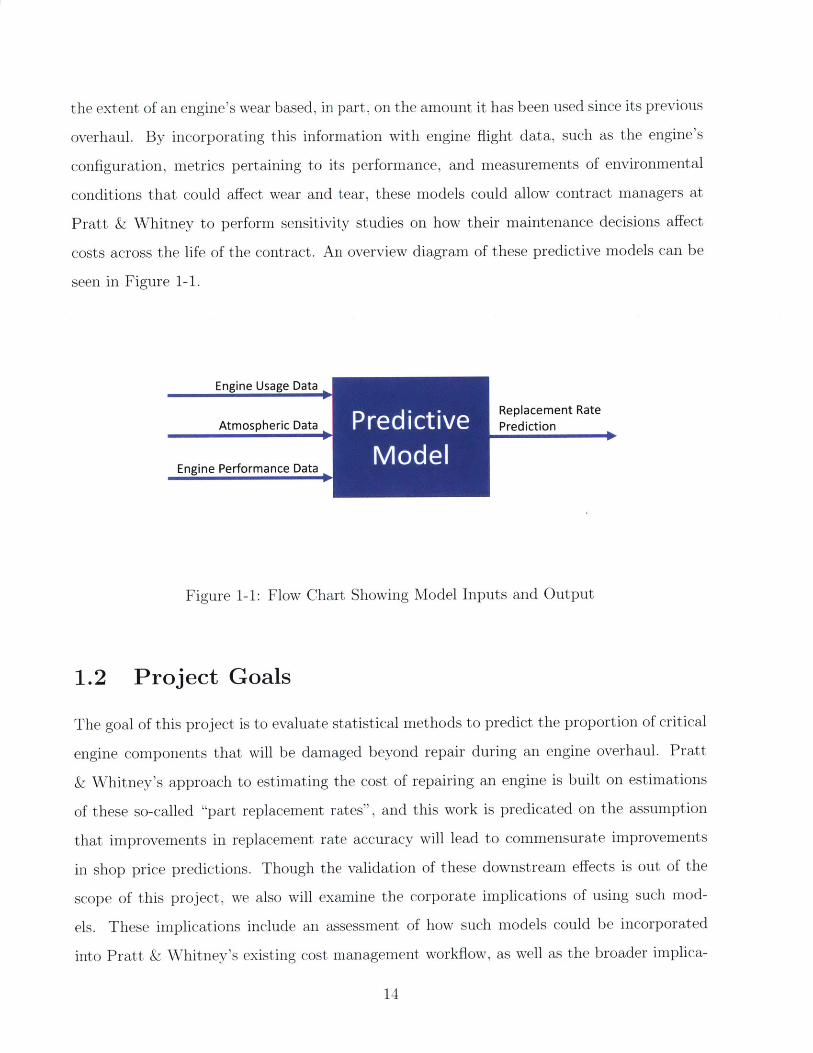
the extent of an engine's wear based, in part, on the amount it has been used since its previous
overhaul. By incorporating this information with engine flight data, such as the engine's
configuration, metrics pertaining to its performance, and measurements of environmental
conditions that could affect wear and tear, these models could allow contract managers at
Pratt & Whitney to perform sensitivity studies on how their maintenance decisions affect
costs across the life of the contract. An overview diagram of these predictive models can be
seen in Figure 1-1.
Engine Usage Data -Atmospheric Data
Engine Performance Data
Replacement RatePrediction
Figure 1-1: Flow Chart Showing Model Inputs and Output
1.2 Project Goals
The goal of this project is to evaluate statistical methods to predict the proportion of critical
engine components that will be damaged beyond repair during an engine overhaul. Pratt
& Whitney's approach to estimating the cost of repairing an engine is built on estimations
of these so-called "part replacement rates", and this work is predicated on the assumption
that improvements in replacement rate accuracy will lead to commensurate improvements
in shop price predictions. Though the validation of these downstream effects is out of the
scope of this project, we also will examine the corporate implications of using such mod-
els. These implications include an assessment of how such models could be incorporated
into Pratt & Whitney's existing cost management workflow, as well as the broader implica-
14
tions of improved insights on material needs on Pratt & Whitney's supply chain planning
organization.
This project is scoped to consider only Pratt & Whitney's V2500 family of engines. Of
Pratt & Whitney's commercial offerings, the V2500 is sufficiently mature and widely used to
allow for the data-driven analysis of this project. Looking forward, Pratt & Whitney intends
to extend this work to other families of engines - such as the PW6000 and Geared Turbofan
engines - but those explicit extensions were left for future projects. In our analysis, we
made all reasonable efforts to consider how the approach could be applied to other products
in Pratt & Whitney's portfolio, avoiding a reliance on methods that would be exclusively
relevant for the V2500.
1.3 Background on Pratt & Whitney
Pratt & Whitney is a leading player in the jet engine industry, with a long history of inno-
vation in aviation propulsion technology. The organization traces its roots to the early 20th
century, when the Pratt & Whitney Machine Tool company set aside funding, facility space,
and the use of their name to the development of a new piston-powered aircraft engine.[2]
Completed in 1925 and named the "WASP", the engine became one of the most successful
piston-powered aviation engine of all time. Nearly 100 years later, Pratt & Whitney is now a
subsidiary of the United Technologies Corporation, an industrial conglomerate focused pri-
marily in the aviation market. [3] In addition to supporting a variety of legacy products, Pratt
& Whitney produces the V2500 family of engines, the PW1000 geared turbofan engine, and
is the primary contractor for the engines on the F-22 and F-35 fighter jet programs. Pratt
& Whitney is headquartered in East Hartford, CT.
In 1983, Pratt & Whitney launched a joint venture with Rolls Royce, the Japanese Aero
Engine Corporation, and MTU Aero Engines called "International Aero Engines" (IAE).
The purpose of IAE was to develop a new jet engine that could economically serve the 150-
seat, single aisle commercial airliner market. [4] IAE developed and began sales of the V2500
engines, which are the focus of this project. In 2012, Pratt & Whitney purchased Rolls
Royce's share in IAE to take a controlling interest in the joint venture. [5]
15
1.4 Background on the V2500 Engine
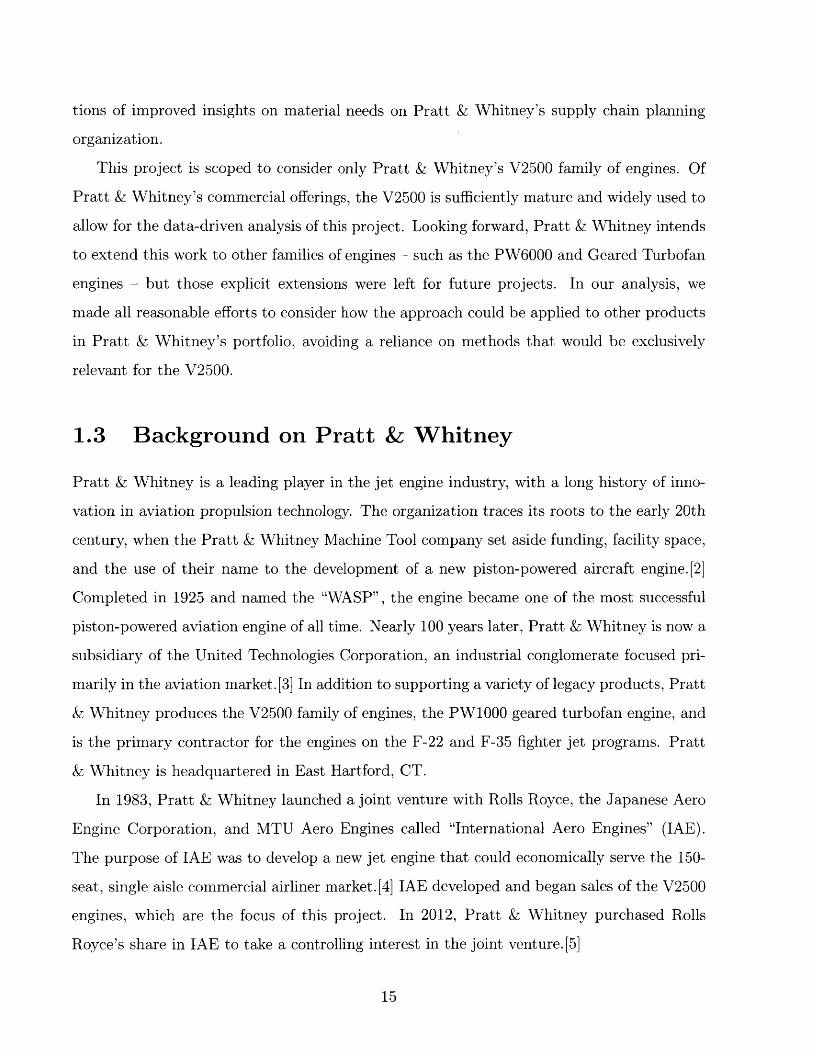
This project focuses on the V2500 family of commercial jet engines. These engines were de-
veloped by IAE and first entered commercial service in May of 1989. [1] The V2500 primarily
powers the Airbus A320 family of aircraft, have a fan diameter of approximately 63 inches,
and provide between 25,000 and 33,000 pounds of takeoff thrust. Over the 35 years since
they first entered service, V2500 engines have seen worldwide adoption and accumulated over
100 million total flight hours. IAE delivered its 5000th V2500 engine in 2004. A cutaway
depiction of the V2500 engine is shown in Figure 1-2.
@2014 INTERNATIONAL AERo ENGINES A.G.
Figure 1-2: A cutaway drawing of the V2500 engine [1]
In the 30 years since its first commercial flight, the V2500 engine has undergone multiple
design updates to maintain a technological edge in the aerospace engine market. The original
V2500 engines were dubbed enquoteV2500 Al engines, but have largely been retired. The
oldest V2500 engines currently in service are the updated A5 variant.
16

However, the most significant update the design of the V2500 occurred in 2008 with the
release of the enquoteV2500-A5 SelectOneTM (Si) variant. The S1 engines boast redesigned
airfoil geometries and novel, temperature and corrosion resistant coatings in the high pressure
sections of the engine.[6] These updates were made to improve the durability and longevity
of the V2500 engines. IAE released an updated variant to the Si engine in 2015, called the
enquoteSelectTwo model, but is comprised primarily of software updates and the differences
are neglected in this research.[7] IAE offers upgrade kits to convert A5 engines into Si
engines; for our purposes we treat A5 conversions as true Si engines.
17
Chapter 2
Background
This section provides background information about Pratt & Whitney, the V2500 family of
engines, and the aftermarket business for commercial engines. In addition, we consider the
implications of FHA contracts on securing this business and mitigating risk across a portfolio
of engine fleets.
2.1 Jet Engine Propulsion
In order to effectively model jet engine component wear, we first need to consider the engi-
neering behind jet engines. By understanding the functionality of these propulsive systems,
we can build an appreciation for what factors may damage - and therefore force the replace-
ment of - components. In this section, we present an overview of how jet engines work.
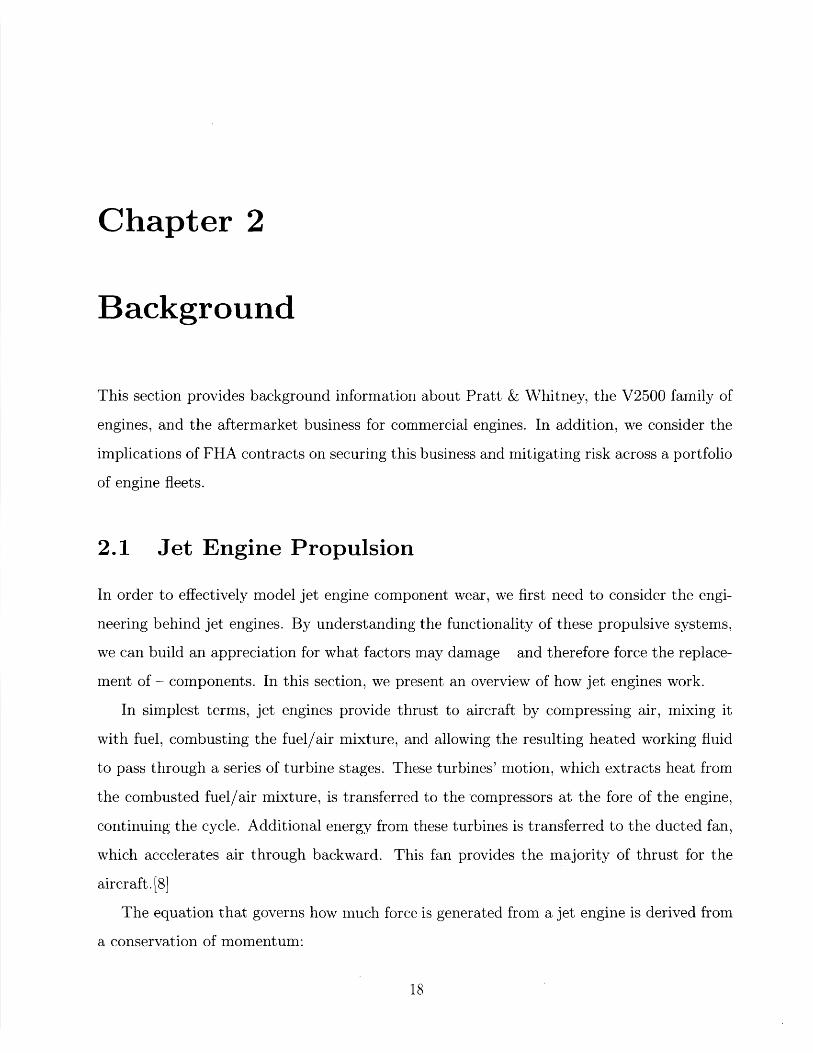
In simplest terms, jet engines provide thrust to aircraft by compressing air, mixing it
with fuel, combusting the fuel/air mixture, and allowing the resulting heated working fluid
to pass through a series of turbine stages. These turbines' motion, which extracts heat from
the combusted fuel/air mixture, is transferred to the compressors at the fore of the engine,
continuing the cycle. Additional energy from these turbines is transferred to the ducted fan,
which accelerates air through backward. This fan provides the majority of thrust for the
aircraft. [8]
The equation that governs how much force is generated from a jet engine is derived from
a conservation of momentum:
18
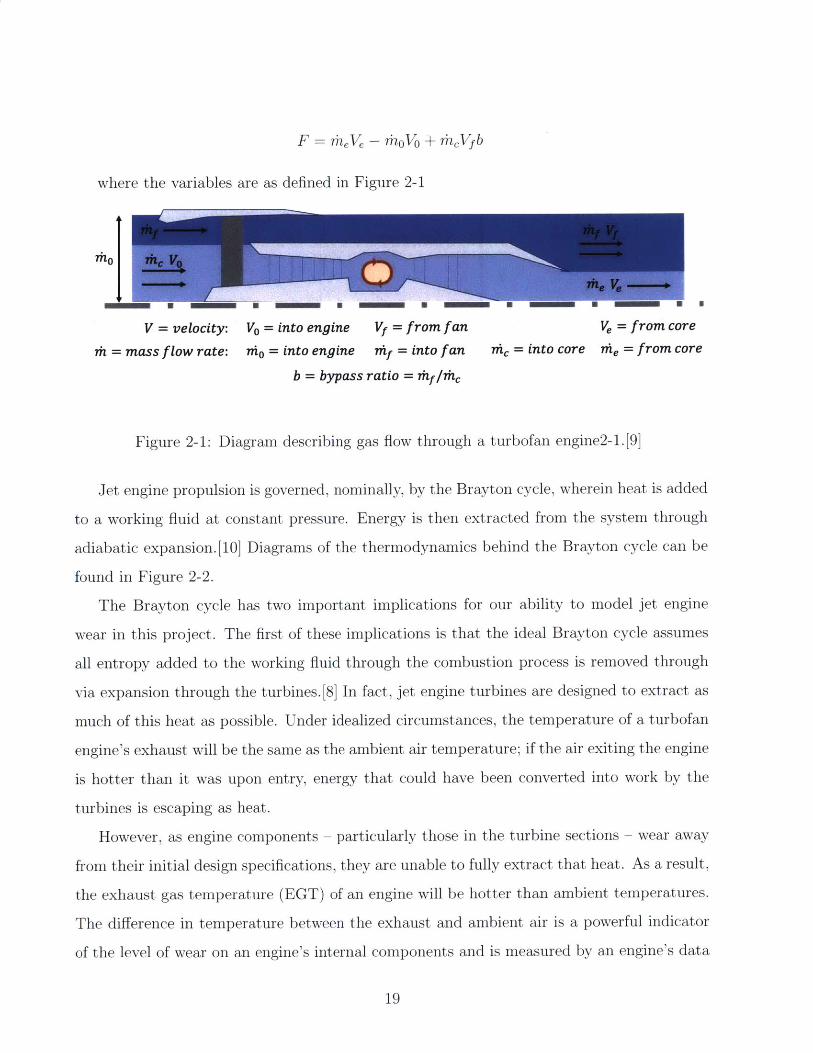
F = eVe -oVo + TcVb
where the variables are as defined in Figure 2-1
Me Ve-+=L M a nnn unn
V = velocity: VO = into engine Vf = from fan Ve = from core
7 = mass flow rate: nio = into engine i-i = into fan ?lc = into core ?Ae = from core
b = bypass ratio = mt/ic
Figure 2-1: Diagram describing gas flow through a turbofan engine2-1.[91
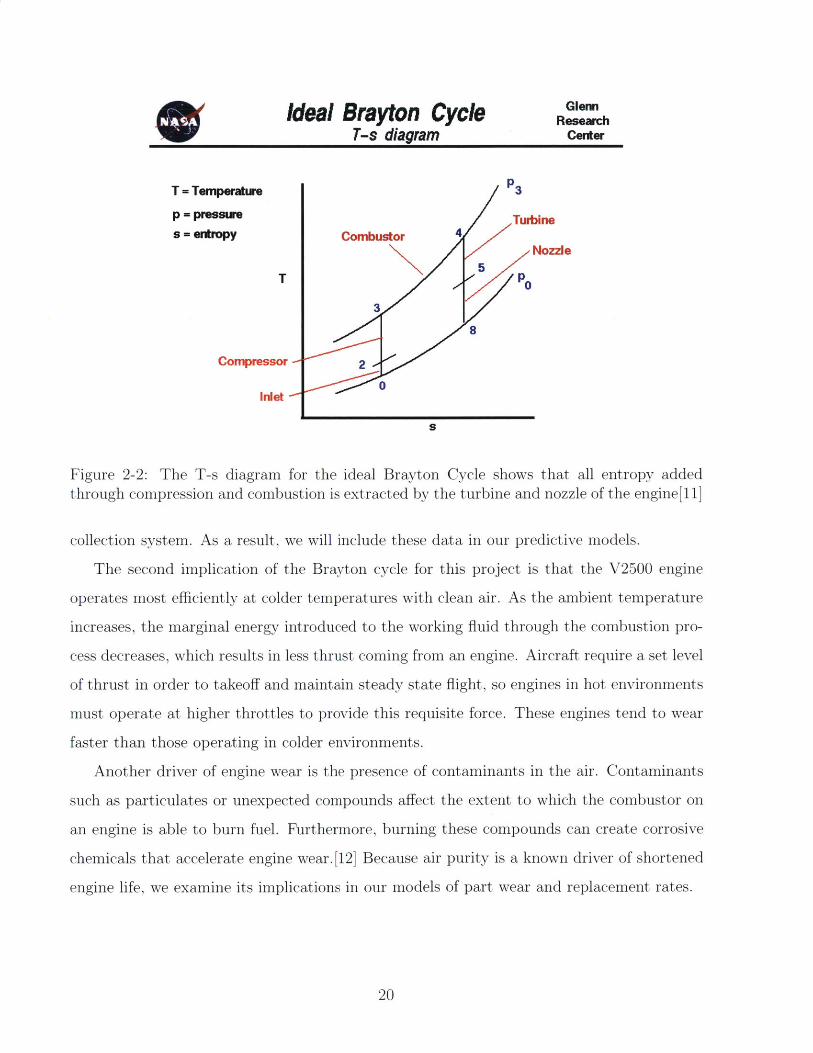
Jet engine propulsion is governed, nominally, by the Brayton cycle, wherein heat is added
to a working fluid at constant pressure. Energy is then extracted from the system through
adiabatic expansion.[10] Diagrams of the thermodynamics behind the Brayton cycle can be
found in Figure 2-2.
The Brayton cycle has two important implications for our ability to model jet engine
wear in this project. The first of these implications is that the ideal Brayton cycle assumes
all entropy added to the working fluid through the combustion process is removed through
via expansion through the turbines.[8] In fact, jet engine turbines are designed to extract as
much of this heat as possible. Under idealized circumstances, the temperature of a turbofan
engine's exhaust will be the same as the ambient air temperature; if the air exiting the engine
is hotter than it was upon entry, energy that could have been converted into work by the
turbines is escaping as heat.
However, as engine components - particularly those in the turbine sections - wear away
from their initial design specifications, they are unable to fully extract that heat. As a result,
the exhaust gas temperature (EGT) of an engine will be hotter than ambient temperatures.
The difference in temperature between the exhaust and ambient air is a powerful indicator
of the level of wear on an engine's internal components and is measured by an engine's data
19
Ideal Brayton Cycle Gen
T-s diagram Center
T = Temperature 3
p = pressure Turbine9 - entropy Combustor
5 Nozzle
3
8
Compressor 2
Inlet
s
Figure 2-2: The T-s diagram for the ideal Brayton Cycle shows that all entropy addedthrough compression and combustion is extracted by the turbine and nozzle of the engine[1 1]
collection system. As a result, we will include these data in our predictive models.
The second implication of the Brayton cycle for this project is that the V2500 engine
operates most efficiently at colder temperatures with clean air. As the ambient temperature
increases, the marginal energy introduced to the working fluid through the combustion pro-
cess decreases, which results in less thrust coming from an engine. Aircraft require a set level
of thrust in order to takeoff and maintain steady state flight, so engines in hot environments
must operate at higher throttles to provide this requisite force. These engines tend to wear
faster than those operating in colder environments.
Another driver of engine wear is the presence of contaminants in the air. Contaminants
such as particulates or unexpected compounds affect the extent to which the combustor on
an engine is able to burn fuel. Furthermore, burning these compounds can create corrosive
chemicals that accelerate engine wear. [12] Because air purity is a known driver of shortened
engine life, we examine its implications in our models of part wear and replacement rates.
20
2.2 V2500 Modules
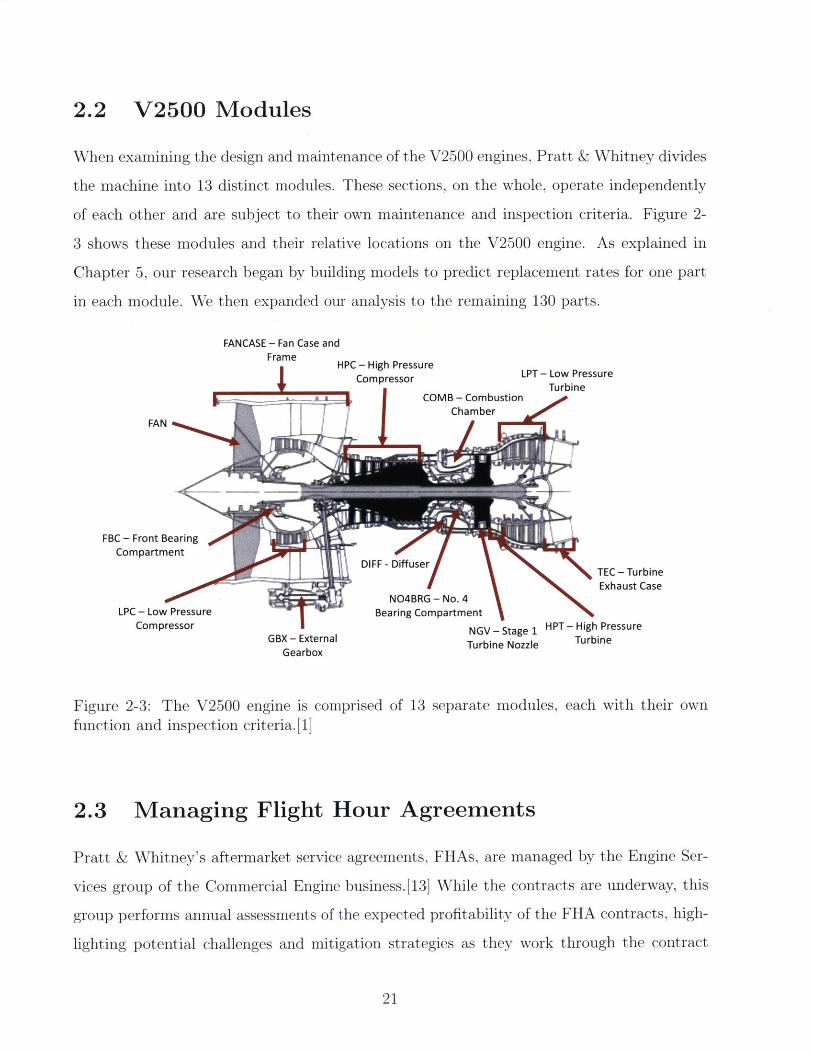
When examining the design and maintenance of the V2500 engines, Pratt & Whitney divides
the machine into 13 distinct modules. These sections, on the whole, operate independently
of each other and are subject to their own maintenance and inspection criteria. Figure 2-
3 shows these modules and their relative locations on the V2500 engine. As explained in
Chapter 5, our research began by building models to predict replacement rates for one part
in each module. We then expanded our analysis to the remaining 130 parts.
FANCASE - Fan Case andFrame HPC - High Pressure
Compressor TurbineCOMB - Combustion
ChamberFAN
FBC - Front BearingCompartment
DIFF - DiffuserTE-Trbn TEC - TurbineExhaust Case
NO4BRG - No. 4LPC - Low Pressure Bearing Compartment
Compressor NGV -Stage 1 HPT - High PressureGBX - External Turbine Nozzle Turbine
Gearbox
Figure 2-3: The V2500 engine is comprised of 13 separate modules, each with their ownfunction and inspection criteria. [1]
2.3 Managing Flight Hour Agreements
Pratt & Whitney's aftermarket service agreements, FHAs, are managed by the Engine Ser-
vices group of the Commercial Engine business. [13] While the contracts are underway, this
group performs annual assessments of the expected profitability of the FHA contracts, high-
lighting potential challenges and mitigation strategies as they work through the contract
21
term.
A key element of this management process is called the "Estimate at Completion" (EAC),
which refers to an estimate of the profitability of a contract upon the completion of its terms.
Is updated through a standardized process on at least an annual basis, and is the basis for
updating the affect FHAs have on Pratt & Whitney's yearly financial statements. Four sets
of stakeholders are involved in the EAC process, as well as the creation and management of
FHAs as a whole.
2.3.1 Analytics
The mathematical assessments of the costs of fulfilling FHA obligations are performed by
the Engine Services analytical staff. This cadre is divided into the Development Analytics
and Operational Analytics Teams.
The Development Analytics team is responsible for designing, validating, and produc-
tizing the methods for predicting how frequently FHA engines will require service under
different circumstances and how extensive those repairs will need to be. This group is com-
prised nearly entirely of statisticians who look to historical repair data to improve their
predictive models.
The Operational Analytics team is responsible for the actual implementation and pro-
duction use of the models presented by the Development Analytics team. Their primary
function is to examine the previous year's engine maintenance needs - often with a less-
than-one-year horizon - to identify major cost drivers while undergoing the annual process
of evaluating contracts.
2.3.2 Fleet Management
The Fleet Management Teams within Engine Services are the customer-facing entity of the
FHA and EAC process. These stakeholders often do not have an engineeering or statistics
background, and are focused on ensuring that the engines under their care are being re-
moved and repaired in a timely fashion while maintaining a usable fleet of engines for the
customers. Fleet managers are responsible for making the judgment call of when to bring
22
engines into repair shops, and they rely on their experience, conversations with the customer,
and operational analytics support to inform these decisions. Ultimately, a fleet manager's
responsibility is to manage the execution of an FHA contract to maximize Pratt & Whitney's
profitability while maintaining customer happiness.
2.3.3 Power Plant Engineering
The Powerplant Engineering (PPE) team is the group within Engine Services that oversees
the maintenance needs of the FHA engines. When a fleet manager decides to remove an
engine from service for repair, that engine's information is transferred to the relevant PPE
representative who considers the duration of the engine's use since its last shop visit, its
characteristics, and its repair history to make an informed decision about which Mainte-
nance, Repair, and Operations (MRO) facility should perform the maintenance and how
extensive that maintenance should be. The PPE staff, comprising people with engineer-
ing backgrounds, provides an initial "workscope" for the engine that dictates the extent of
inspection and repair services that an MRO facility will perform. The workscope is an es-
timate of the types of repairs that an engine will require, and often changes as the engine
goes through the repair process. This decision plays into the time an engine will be out of
service, as well as into the total cost of the visit.
2.3.4 Finance
The Finance group is the fourth element of the EAC process. They take the estimates from
fleet management, analytics, and PPE, to update the expected financial performance of an
FHA contract and make the final determination of when and how revenues from contracts
should be recognized. The financial estimation process for EACs is complicated, but plays a
large role in the annual financial reporting metrics for Pratt & Whitney's Commercial Engine
business and is given a lot of attention from outside management. Before any changes can
be made to the EAC process, the financial implications of those changes must be considered.
23
Chapter 3
Data Sources and Exploratory
Analysis
This chapter provides an overview of the data used in this research to create part replacement
prediction models. It outlines how historical repair data are collected from the maintenance,
repair, and operations (MRO) facilities and what aspects of that information were deemed
relevant for this work. We also outline the atmospheric quality data and engine usage
parameters that are included in our analysis. We then discuss our data cleaning approach
and the impact it had on the size of our data set.
3.1 Historical Repair Invoice Data
The primary data source for Pratt & Whitney's FHA cost modeling, including this project,
is historical repair invoices for the V2500 engines. When engines are serviced in the Pratt &
Whitney MRO network as part of a contract, Pratt & Whitney's Engine Services Division
receives a copy of the invoice from the organization that did the repair. These invoices outline
which components of the engine required replacement, which could be repaired, and which
required no work. Studies of the maintenance cost of repairing Pratt & Whitney's V2500
engines suggest that the majority of costs stem from replacement parts. Relevant information
about the part replacements are scraped from these invoices, which vary in format depending
on which MRO shop did the repairs, and ingested into a common database for the use of
24
Pratt & Whitney's analytics organization.
Of the thousands of components on a V2500 engine, invoice studies have shown that
143 parts comprise the majority of replacement part costs. Using shop visit invoices, the
"replacement rate", of these 143 parts are calculated and recorded in a database. This
replacement rate is represented as a decimal value between zero and one, according to the
following formula:
# Parts ReplacedReplacement Rate - Fe
U PE
where "UPE" refers to the "units per engine" for the part in question.1 While superfi-
cially simple, the lack of standardization in invoice formatting and inconsistency in reporting
standards for what constitutes a "part" in question, the actual calculation of these replace-
ment rates is non-trivial. For example, some engine components in our models may comprise
several subcomponents that may or may not require replacement in a given shop visit. The
method for associating these partial replacements and extracting that information from in-
voices is a matter of ongoing debate. For our analysis, we used the same text scraping
methodology as that currently used in Pratt & Whitney's cost modeling to ensure consis-
tency in our comparisons. Per this methodology, -we also removed from our data set engine
repair events that were the result of rare events, such as instances where bird strikes or the
ingestion of foreign objects necessitated an engine's repair.
3.2 Advanced Diagnostics and Engine Maintenance Data
Another data set used in our analysis is extracted from Pratt & Whitney's Advanced Di-
agnostics and Engine Maintenance (ADEMT M) tool. Pratt & Whitney's ADEM system is
primarily designed to collect diagnostic information about Pratt & Whitney's engines during
operation to head off unexpected issues in the engine's performance. It collects one snapshot
during each phase of a flight - takeoff, cruise, and landing - to build a picture of an engine's
performance between shop visits. By examining trends in these data, Pratt & Whitney is
'Although called a "rate", replacement rates do not reflect a value changing over time. Rather, theyreflect the proportion of a total number of a specific component are replaced in a single shop visit.
25

able to observe degradations in performance that could stem from damaged components.
Data collected by the ADEM system include:
* Derate - The percent reduction in maximum thrust an engine can use during flight
" Takeoff Humidity - The ambient humidity during takeoff
" Runway Elevation - The Altitude above Sea Level of the takeoff runway
" Runway Length - The length of the takeoff runway
" Takeoff Ambient Pressure - The atmospheric pressure during takeoff
" Cruise Altitude - The altitude measured during the cruise snapshot
" Exhaust Gas Temperature - Temperature of working fluid after low pressure turbine
" Exhaust Gas Temperature Margin - Difference between Exhaust Gas Temperature and
allowable maximum temperature
This information is aggregated for each engine in an FHA fleet and presented through
summary statistics such as mean, standard deviation, and percentile measurements. In our
analysis, we considered the mean values of these measurements across an engine's time in
service and disregarded the other summary statistics.
3.3 Atmospheric Contamination data
Also included in our analysis is atmospheric aerosol concentration data collected from NASA's
TERRA satellites. These satellites use a Multiangle Imaging SpectroRadiometer (MISR) sys-
tem to study the concentration of airborne particulates across the globe.[14][15] We collect
this aerosol information for the airports out of which FHA engines operate and aggregate
those levels on a monthly basis. Although these air-quality measurements are presented with
multiple summary statistics, we only consider the mean in our analysis.
Previous research has shown the benefits of including this data in predicting engine service
lifecycles, so we expect it to add power to our part replacement predictions. [12]
26
. . . . ... ... . ... .. -- .s . 1 -.nmienim!!Wailm--el'meli s's.smilssiillNF1'ilmma..liami... ,. .. s .,..,n
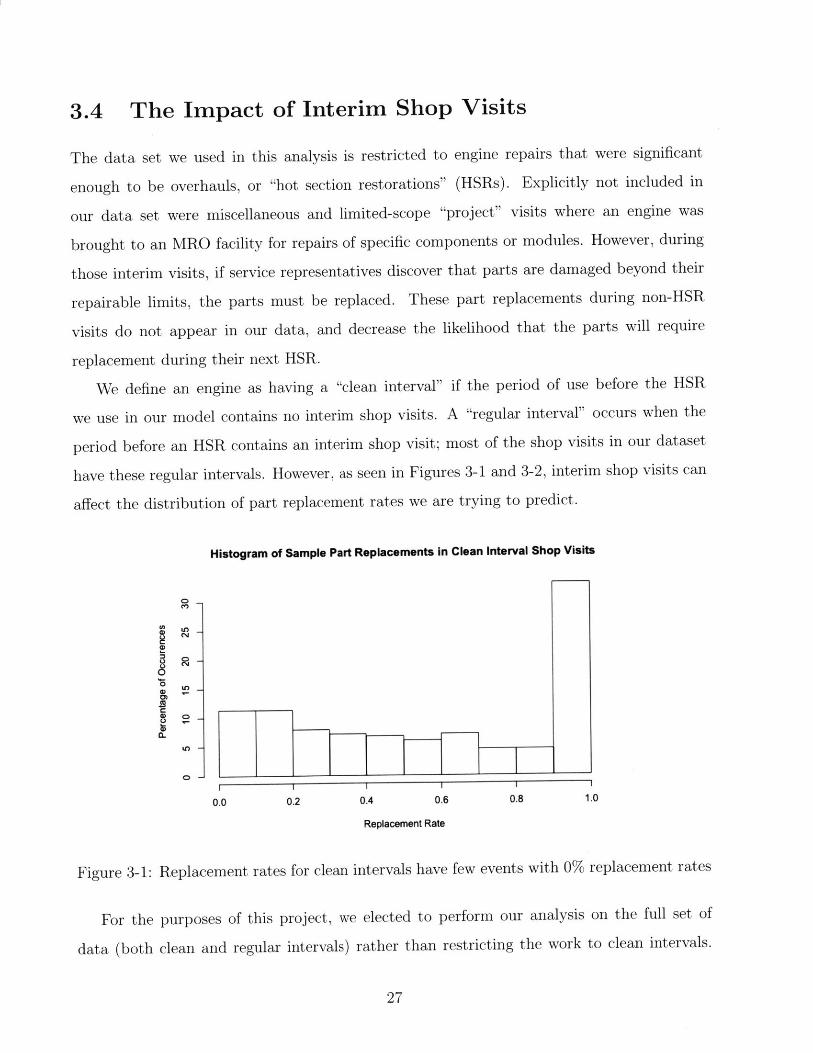
3.4 The Impact of Interim Shop Visits
The data set we used in this analysis is restricted to engine repairs that were significant
enough to be overhauls, or "hot section restorations" (HSRs). Explicitly not included in
our data set were miscellaneous and limited-scope "project" visits where an engine was
brought to an MRO facility for repairs of specific components or modules. However, during
those interim visits, if service representatives discover that parts are damaged beyond their
repairable limits, the parts must be replaced. These part replacements during non-HSR
visits do not appear in our data, and decrease the likelihood that the parts will require
replacement during their next HSR.
We define an engine as having a "clean interval" if the period of use before the HSR
we use in our model contains no interim shop visits. A "regular interval" occurs when the
period before an HSR contains an interim shop visit; most of the shop visits in our dataset
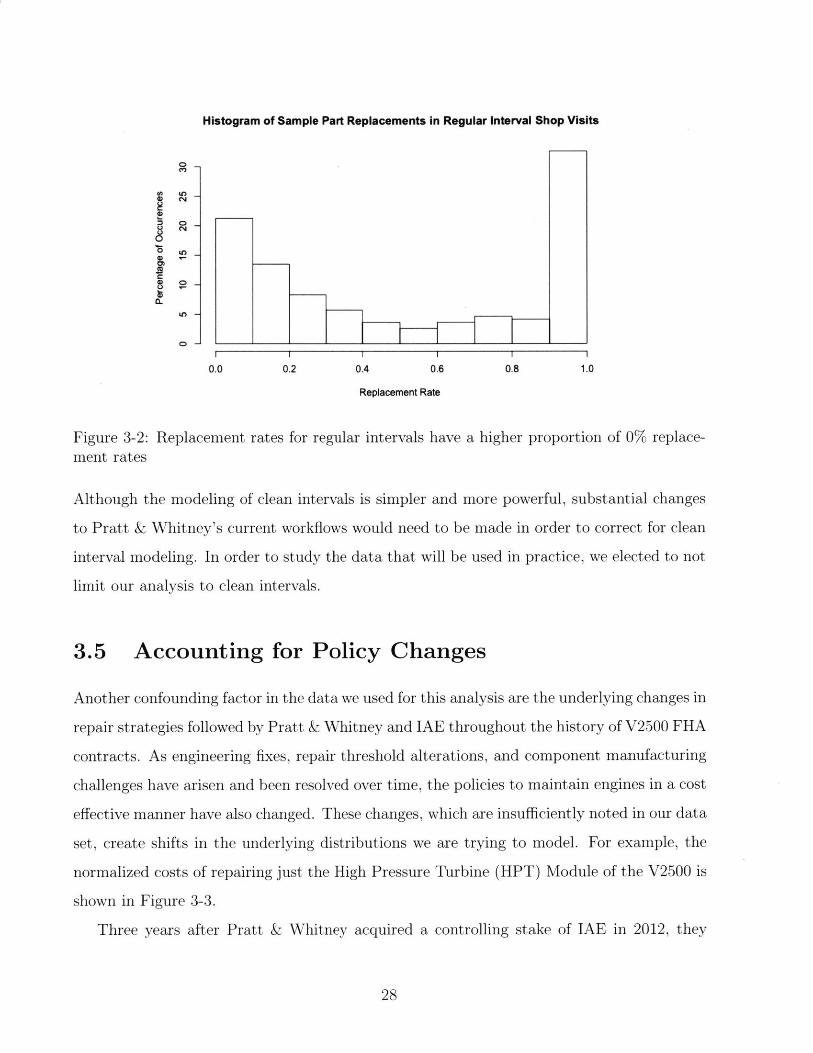
have these regular intervals. However, as seen in Figures 3-1 and 3-2, interim shop visits can
affect the distribution of part replacement rates we are trying to predict.
Histogram of Sample Part Replacements in Clean Interval Shop Visits
CD
ti
Ln
I I I I
0.0 0.2 0.4 0.6 0.8 1.0
Replacement Rate
Figure 3-1: Replacement rates for clean intervals have few events with 0% replacement rates
For the purposes of this project, we elected to perform our analysis on the full set of
data (both clean and regular intervals) rather than restricting the work to clean intervals.
27
Histogram of Sample Part Replacements in Regular Interval Shop Visits
0 l
I I I I I I
0.0 0.2 0.4 0.6 0.8 1.0
Replacement Rate
Figure 3-2: Replacement rates for regular intervals have a higher proportion of 0% replace-ment rates
Although the modeling of clean intervals is simpler and more powerful, substantial changes
to Pratt & Whitney's current workflows would need to be made in order to correct for clean
interval modeling. In order to study the data that will be used in practice, we elected to not
limit our analysis to clean intervals.
3.5 Accounting for Policy Changes
Another confounding factor in the data we used for this analysis are the underlying changes in
repair strategies followed by Pratt & Whitney and IAE throughout the history of V2500 FHA
contracts. As engineering fixes, repair threshold alterations, and component manufacturing
challenges have arisen and been resolved over time, the policies to maintain engines in a cost
effective manner have also changed. These changes, which are insufficiently noted in our data
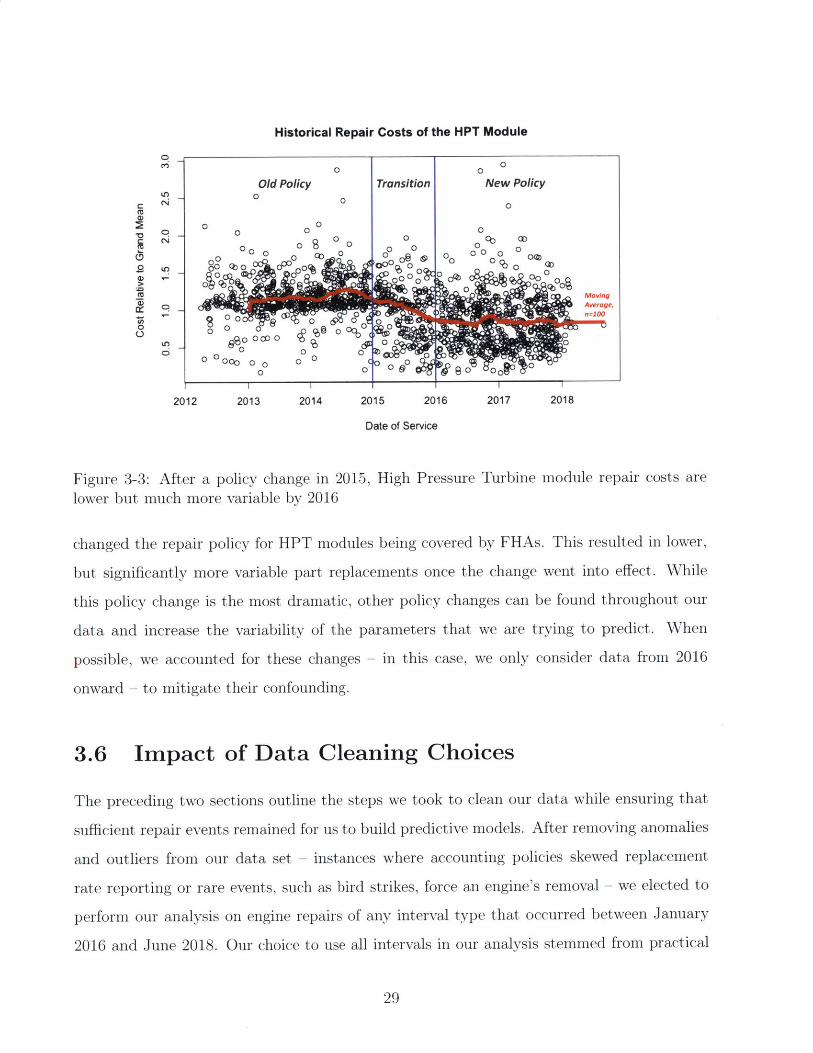
set, create shifts in the underlying distributions we are trying to model. For example, the
normalized costs of repairing just the High Pressure Turbine (HPT) Module of the V2500 is
shown in Figure 3-3.
Three years after Pratt & Whitney acquired a controlling stake of IAE in 2012, they
28
Historical Repair Costs of the HPT Module
0 00Old Policy Transition New Policy
o 0 0 0
0 C0 o0 aD0 0 000 00 0 0 0 0 Q
0 00 00 0 0 D0
0 Cbo 00 6 0 0 0 00 CI1: A0 ~ 0000 oq 0 n
0)4
DMt Movirvng
&! Average,
0 0 00
000 0 0 00 C(
2012 2013 2014 2015 2016 2017 2018
Date of Service
Figure 3-3: After a policy change in 2015, High Pressure Turbine module repair costs are
lower but much more variable by 2016
changed the repair policy for HPT modules being covered by FHAs. This resulted in lower,
but significantly more variable part replacements once the change went into effect. While
this policy change is the most dramatic, other policy changes can be found throughout our
data and increase the variability of the parameters that we are trying to predict. When
possible, we accounted for these changes - in this case, we only consider data from 2016
onward - to mitigate their confounding.
3.6 Impact of Data Cleaning Choices
The preceding two sections outline the steps we took to clean our data while ensuring that
sufficient repair events remained for us to build predictive models. After removing anomalies
and outliers from our data set - instances where accounting policies skewed replacement
rate reporting or rare events, such as bird strikes, force an engine's removal - we elected to
perform our analysis on engine repairs of any interval type that occurred between January
2016 and June 2018. Our choice to use all intervals in our analysis stemmed from practical
29
concerns regarding the implementation of our models. The timeframe of our data selection
is the result of a consideration of engine repair policies; internal discussions with PowerPlant
Engineering staff indicated that this timeframe most accurately reflected current practices.
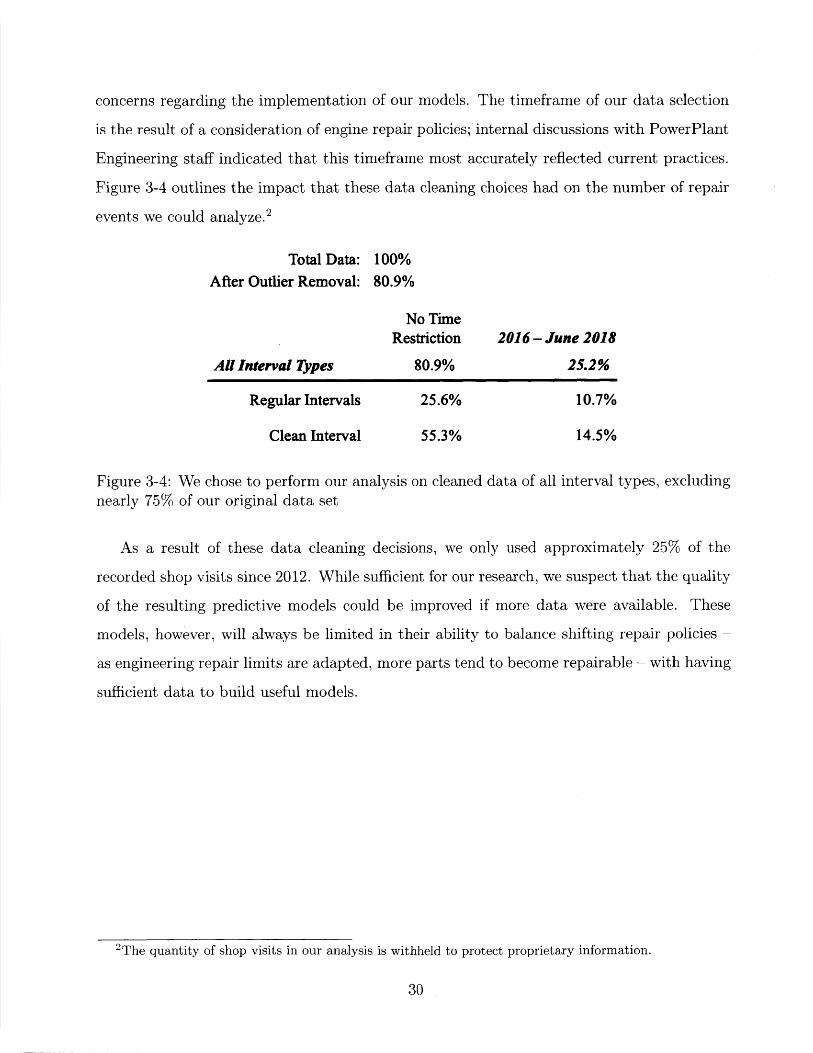
Figure 3-4 outlines the impact that these data cleaning choices had on the number of repair
events we could analyze. 2
Total Data: 100%After Outlier Removal: 80.9%
All Interval Types
Regular Intervals
Clean Interval
No TimeRestriction
80.9%
25.6%
55.3%
2016 - June 2018
25.2%
10.7%
14.5%
Figure 3-4: We chose to perform our analysis on cleaned data of all interval types, excludingnearly 75% of our original data set
As a result of these data cleaning decisions, we only used approximately 25% of the
recorded shop visits since 2012. While sufficient for our research, we suspect that the quality
of the resulting predictive models could be improved if more data were available. These
models, however, will always be limited in their ability to balance shifting repair policies -
as engineering repair limits are adapted, more parts tend to become repairable - with having
sufficient data to build useful models.
2 The quantity of shop visits in our analysis is withheld to protect proprietary information.
30
Chapter 4
Current Shop Visit Cost Prediction
Approach
Pratt & Whitney's current method for predicting shop visit costs as it pertains to the EAC
process is focused on maintaining a predictable level of profitability upon the contract's
termination. The method involves using an engine's workscope predictions and the region
in which it was flown - which serves as a proxy for environmental hazards it may have
been exposed to - to estimate the replacement rates of 143 critical parts. These predictions
are then fed into a statistical model that converts part replacements and other factors into
expected visit costs. A detailed explanation of that process can be found below. This thesis
is focused on improving this statistical model with minimal disruptions to the subsequent
steps.
4.1 Current Method for Predicting Shop Visit Costs
To predict the part replacement rates for any given shop visit, Engine Services models the
historical replacement rates for engines of each combination of model type, flight region, and
module-level workscope. Using a Bayesian prior to account for combinations with limited
historical data, this model is then used to predict the replacement rate of each part relevant
31
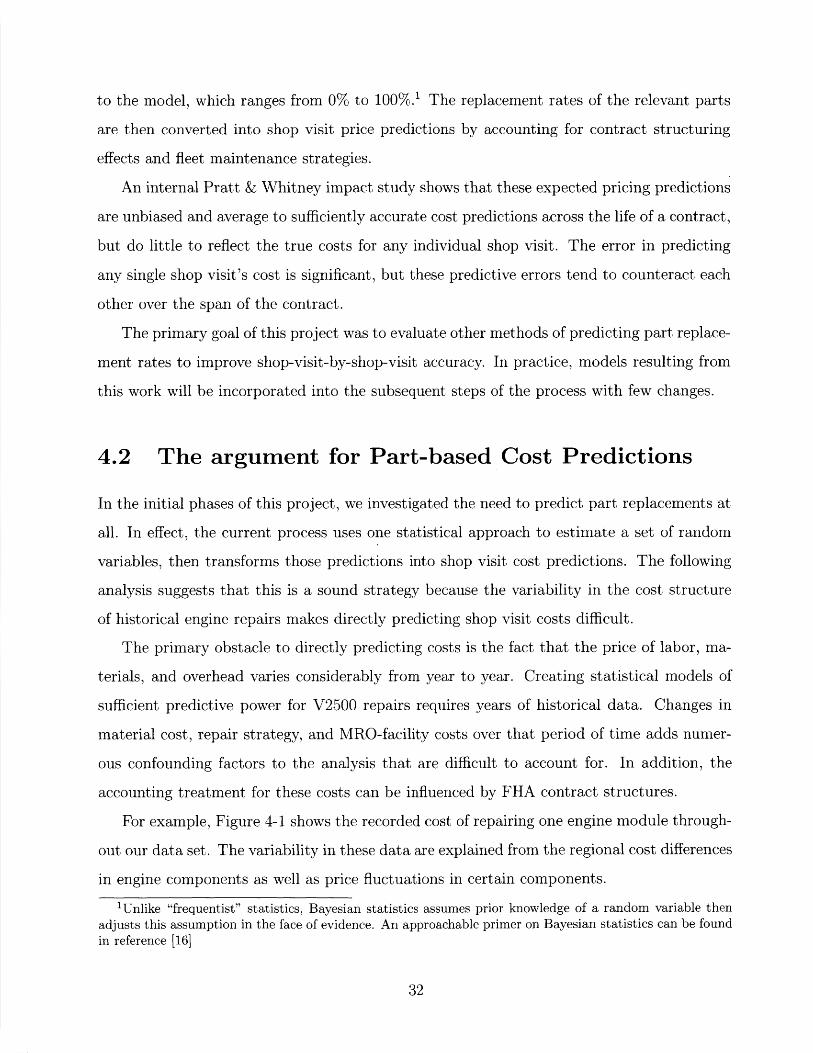
to the model, which ranges from 0% to 100%.1 The replacement rates of the relevant parts
are then converted into shop visit price predictions by accounting for contract structuring
effects and fleet maintenance strategies.
An internal Pratt & Whitney impact study shows that these expected pricing predictions
are unbiased and average to sufficiently accurate cost predictions across the life of a contract,
but do little to reflect the true costs for any individual shop visit. The error in predicting
any single shop visit's cost is significant, but these predictive errors tend to counteract each
other over the span of the contract.
The primary goal of this project was to evaluate other methods of predicting part replace-
ment rates to improve shop-visit-by-shop-visit accuracy. In practice, models resulting from
this work will be incorporated into the subsequent steps of the process with few changes.
4.2 The argument for Part-based Cost Predictions
In the initial phases of this project, we investigated the need to predict part replacements at
all. In effect, the current process uses one statistical approach to estimate a set of random
variables, then transforms those predictions into shop visit cost predictions. The following
analysis suggests that this is a sound strategy because the variability in the cost structure
of historical engine repairs makes directly predicting shop visit costs difficult.
The primary obstacle to directly predicting costs is the fact that the price of labor, ma-
terials, and overhead varies considerably from year to year. Creating statistical models of
sufficient predictive power for V2500 repairs requires years of historical data. Changes in
material cost, repair strategy, and MRO-facility costs over that period of time adds numer-
ous confounding factors to the analysis that are difficult to account for. In addition, the
accounting treatment for these costs can be influenced by FHA contract structures.
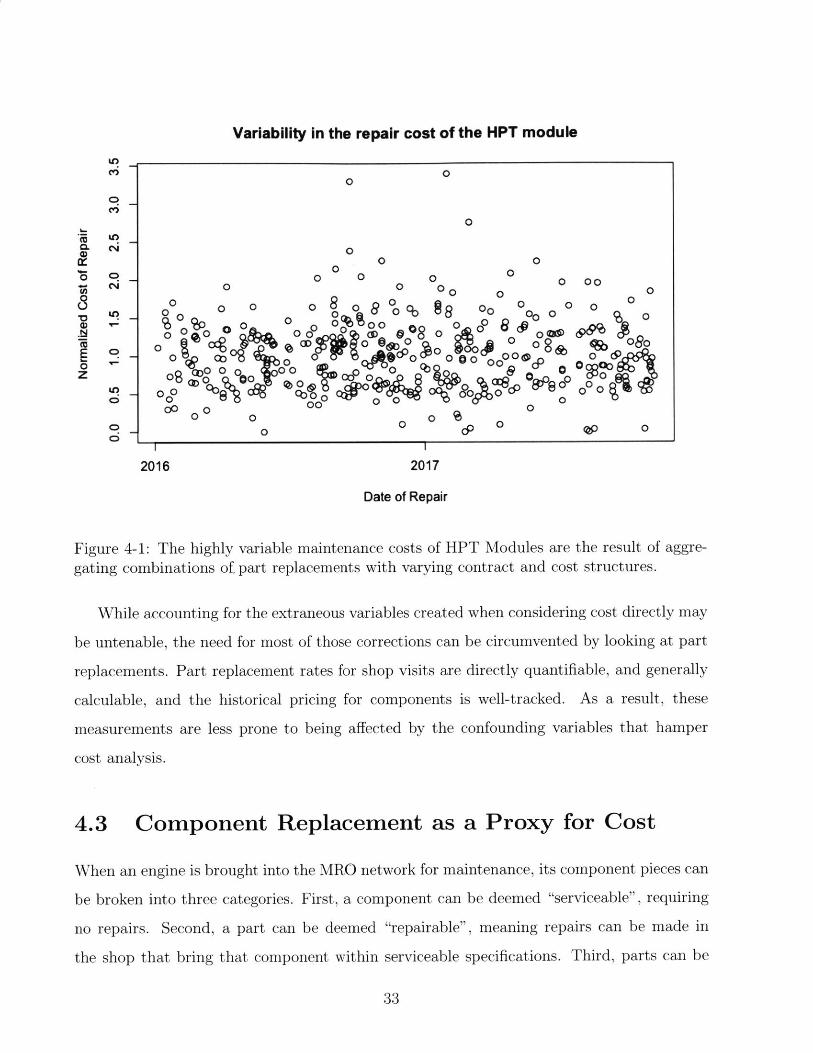
For example, Figure 4-1 shows the recorded cost of repairing one engine module through-
out our data set. The variability in these data are explained from the regional cost differences
in engine components as well as price fluctuations in certain components.
'Unlike "frequentist" statistics, Bayesian statistics assumes prior knowledge of a random variable thenadjusts this assumption in the face of evidence. An approachable primer on Bayesian statistics can be foundin reference [16]
32
Variability in the repair cost of the HPT module
00
00
0 0
0 0
04 U) R 000 0000 0 00 0 0 0 o 0 0
00 00 0800 o
Z i 0cgo 0 00 0 C6. 0o 0 0 %%0 0 08c~ 0 0 0 &"
0 0 " 00, 0 0 0o 0 i'
2016 2017
Date of Repair
Figure 4-1: The highly variable maintenance costs of HPT Modules are the result of aggre-gating combinations of. part replacements with varying contract and cost structures.
While accounting for the extraneous variables created when considering cost directly may
be untenable, the need for most of those corrections can be circumvented by looking at part
replacements. Part replacement rates for shop visits are directly quantifiable, and generally
calculable, and the historical pricing for components is well-tracked. As a result, these
measurements are less prone to being affected by the confounding variables that hamper
cost analysis.
4.3 Component Replacement as a Proxy for Cost
When an engine is brought into the MRO network for maintenance, its component pieces can
be broken into three categories. First, a component can be deemed "serviceable", requiring
no repairs. Second, a part can be deemed "repairable", meaning repairs can be made in
the shop that bring that component within serviceable specifications. Third, parts can be
33
deemed "unserviceable", meaning they need to be replaced before the engine can be reentered
into service.
If a part is deemed unserviceable, a replacement is installed on the engine and the dam-
aged component is sent to a shop that specializes in repairing those components. These
parts, which the Engine Services organization often refers to as "scrapped", can in some
cases be repaired and used as "used material" parts for further repairs. In these cases, used
material parts are salvaged and used to replace unserviceable parts during future engine
overhauls. The maintenance organization only refers to parts that cannot be converted into
used material inventory as "scrap".
This issue of "scrapped parts" versus "replaced parts" has implications in the broader
scope of this analysis because it reflects a disconnect in the lexicons of different groups within
Pratt & Whitney. Bridging this divide will be critical in creating an integrated work stream
for the organization in the future, and is discussed in Chapter 7 of this report.
An internal cost study of historical repairs shows that the majority of the cost to repair
an engine stems from the purchasing of new parts. Repairing parts in situ costs a fraction of
the purchase price of a new part. Furthermore, of the thousands of components on an engine,
143 have been identified by Pratt & Whitney as being sufficiently expensive and prone to
replacement that they constitute the majority of part replacement costs. The replacement
rates of these parts are tracked for each engine shop visit, and are the quantities this research
is concerned with predicting.
4.4 Implications of a Component-Based Model
An additional benefit of predicting part replacements rather than direct costs of engine
maintenance is the added granular of knowing how many replacement parts are being used
to maintain the engines. This information can, in theory, be rolled up to a prediction of
the new part needs for Pratt & Whitney's entire portfolio of V2500 engines under FHA
contracts.
By using these predictions in conjunction with current forecasting methods, Pratt &
Whitney hopes to be able to decrease the volatility in the orders for parts that it places on
34

its supply chain. If successfully implemented, Pratt & Whitney also has plans to use lessons
learned from the FHA V2500s to extend this approach to engines not under contract as well
as additional engine families.
35
Chapter 5
Analysis
This chapter outlines the approach we took in building a variety of models to predict part
replacement rates given engien usage data. We first selected 13 "trial" parts as initial test
subjects, then fit six different types of statistical models to their historical data. We tested
the out-of-sample predictive power of each type of model against all 13 parts, then selected
the most accurate models for testing against all 143 parts.
5.1 Part Selection
In order to fit into Pratt & Whitney's established workstream, this project needed to result
in part replacement models for 143 individual engine components. In order to make the
problem more tractable, we decided to down select to a set of 13 components - one from each
of the engine modules - when testing model structures, then applying the most-promising
approaches across the entire set of critical components. This reduced the time required to
study potential models by a factor of approximately ten. We selected these parts based on
those that had the most variety in replacement rates in the historical data, with one part
from each module to capture any affects that may be module-dependent. These "trial parts"
consisted of a mixture of bearings, blades, vanes, and support structures.
36
5.2 Modeling approach
For each of the aforementioned trial parts, we segmented the available data into training and
testing sets, which remained consistent for across parts and models. We elected to segment
two-thirds of our data into the training set while leaving the remaining third for out-of-
set verification of the models' performance. This data segmentation was random, with the
caveat that parts with limited instances of some replacement rates were represented in both
the training and testing sets. We used this methodology to ensure that our tests of model
effectiveness accurately reflected the underlying variability of the data.
After training each of the models against the training set for our trial parts, we calculated
the R2 value and mean absolute error (MAE) for the models' predictions against the test
data.1 The decision to evaluate our models' performance using these metrics was entirely
one of practicality. The standard of comparison for models among the majority of our
stakeholders were these two factors; MAE is particularly useful for the corporate acceptance
of our approach because it succinctly summarizes model performance in the metric in terms
of replacement rate error. Replacement rates can be readily translated by stakeholders
to the number of a given parts requiring replacement during an overhaul, and most of
our stakeholders were able to estimate costs based on the number and type of parts being
replaced.
The models that performed best for the trial parts were then constructed and tested for
the remaining 130 parts. We used the same data segmentation and performance metrics for
the "all parts" phase of the research, and found consistent results. We discuss these results
in Chapter 6
5.3 Base Case
In order to quantify any improvements derived from this research, we first needed to establish
the part replacement prediction error resulting from the current methodology. The current
'The mean absolute error of a set of predictions is the average magnitude of discrepancy between thepredictions and true data. While less common than mean squared error, we use MAE because the it is moreeasily compared directly to replacement rate predictions.
37

method was still in the early implementation phase by the conclusion of this project, so part
replacement errors validated from historical analysis were not available to us. Furthermore,
the bulk of the analysis on the efficacy of this approach was focused on improving the
accuracy of the final cost predictions, and few quantitative insights were known about the
visit-by-visit, part level accuracy of predictions coming from this model. The production
model of this approach was also created and tested using a different data set from that being
used in this project.
To establish the accuracy of the current approach, we created a proxy for using our data.
The base case methodology uses a Bayesian prior to predict part replacement rates based
on historical repair data. These models were created using the brms package of R, which
uses an R-compatible plug in of the STAN modeling language.[17][18] Most of the analytical
heavy-lifting is performed under-the-hood, so to speak, with these packages.
While recreating the current replacement rate prediction models, we examined the un-
derlying assumptions behind this approach and its relevance to the application in question.
The software packages use a bootstrapped, Markov Chain Monte Carlo approach to arrive
at a probability distribution for each part's replacement rate. Given a predetermined prior,
which we discuss below, the brms package samples data with replacement from our training
set to repeatedly update a posterior distribution. Because a majority of the parts we are
modeling are either replaced in their entirety (a 100% value) or not at all (a 0% value), the
posterior distribution coming out of the sampling has inflation elements for those scenarios.
In short, the algorithm works as follows. After sampling a data point, the algorithm
first attempts to predict whether the part in question had a replacement rate of 0%. This
prediction arises from a logistic classifier trained on the previously sampled data. If the
classifier predicts that the replacement rate will be higher than 0%, it then predicts whether
the datum will have a replacement rate of 100%, using a separate classifier. If that classi-
fier predicts a value other than 100%, the sample is then used to update the distribution
representing the part in question. The brms package continues to randomly sample data
from the training set until the resulting model has converged, as measured by changes in the
parameters of the final distribution, or until a pre-specified number of samples have been
taken.
38
Upon convergence, we predict the expected value of the resulting probability distribution
as our replacement rate for that part during that shop visit. Because of the heavy role the
choice of prior can play in a Bayesian analysis and because the approach requires you to
select an average, we also consider choosing the average value of the training set as a base
case for future comparisons.
5.4 Logistic Regressions
Logistic regressions are a natural choice for a model structure in this project because the
scrap rates for all of our engine components, like the output of a logistic regression, range
between zero and one. Each part requires a full replacement with probability p or, conversely,
no replacement with probability 1 -p. A classical way to model this behavior is with logistic
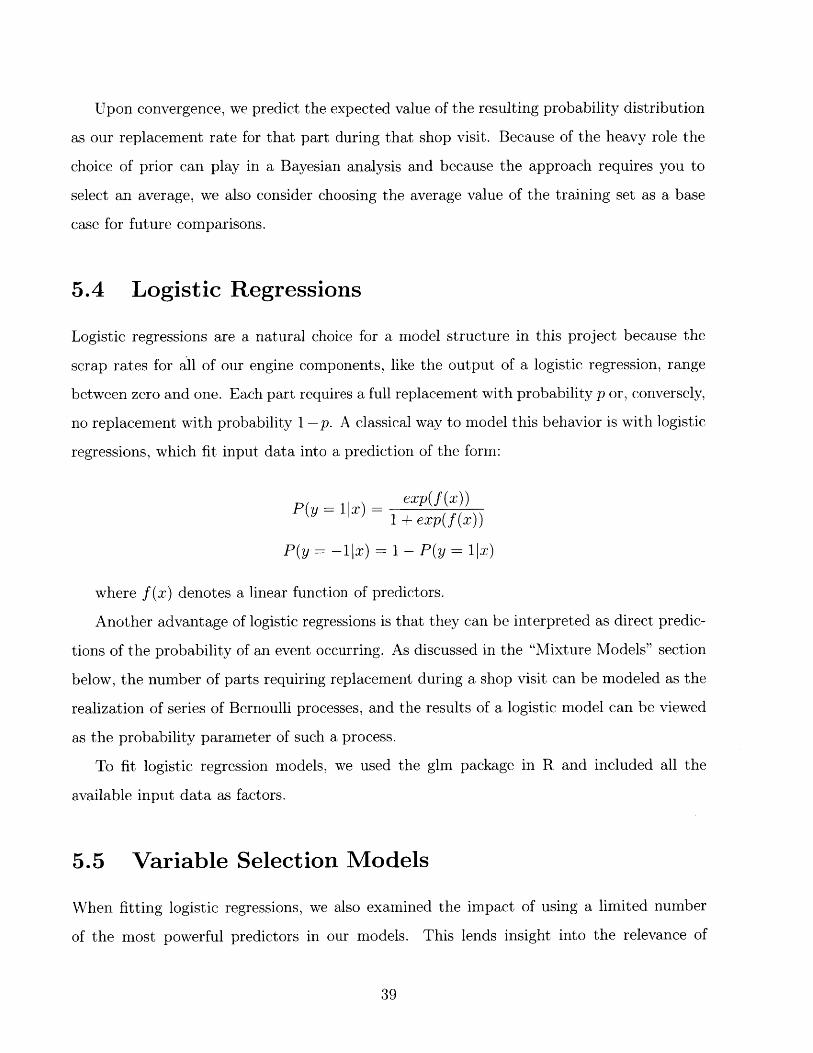
regressions, which fit input data into a prediction of the form:
P~y 1 x) exp~f(x))P(y = 1|X) = P ()1 + exp(f (X))
P(y = --1x) 1 - P(y = 1 x)
where f(x) denotes a linear function of predictors.
Another advantage of logistic regressions is that they can be interpreted as direct predic-
tions of the probability of an event occurring. As discussed in the "Mixture Models" section
below, the number of parts requiring replacement during a shop visit can be modeled as the
realization of series of Bernoulli processes, and the results of a logistic model can be viewed
as the probability parameter of such a process.
To fit logistic regression models, we used the glm package in R and included all the
available input data as factors.
5.5 Variable Selection Models
When fitting logistic regressions, we also examined the impact of using a limited number
of the most powerful predictors in our models. This lends insight into the relevance of
39
the majority of or regressors and helps, in addition to our out-of-sample testing, to avoid
overfitting our model.
We used a brute force approach when studying the impact of variable selection on our
models. After eliminating variables that were highly correlated and grouping some terms
(such as time flown since last overhaul and flights since last overhaul), we used the glm
package in R to build a logistic regression on a limited number of input factors. We tested
the accuracy of this model against our out-of-sample data and recorded the MAE and R2
values.
We then followed the same procedure to build new logistic regressions for every subset
of input factors, and compared the recorded accuracy statistics.2 The model with the best
predictive performance was then chosen as the optimal variable selection model for the part
in question.
5.6 Mixture Models
Upon initial inspection of the historical engine repair data and through our discussions with
the PowerPlant Engineers, we learned that engines typically fall into one of two categories
when being inducted for overhaul service. Either the engines have flown through the ex-
pected, benign conditions and have a predictable maintenance cost, or they return to the
shop and are worn well beyond anyone's expectations. This suggests that the part replace-
ment predictions may actually fall into two distinct distributions that were combined in our
training data.
To incorporate these insights, we built a mixture model algorithm to split the train-
ing data into our best approximations of those "harsh" and "benign" subsets before fitting
models to them. While mixture models are a common practice in literature[21], our imple-
mentation was tailored to this project's circumstances and is outlined in the list below, then
detailed in the subsequent paragraphs. 3
2 While more efficient methods are available for this type of analysis, see [19][20], the simplicity of thisapproach merited its use in our work.
3 Mixture modeling is a method of grouping data into multiple sub-populations. We use an ExpectationMaximization approach to do this, wherein we iteratively predict the most likely subgroup for each datapoint. An approachable primer to this approach can be found here [22]
40
1. Separate training data randomly into two groups
2. Fit a logistic regression to each group
3. Use regression from each group to find two replacement rate predictions for each data
point
4. Using replacement rate predictions, calculate the likelihood of realizing each datum's
number of part replacements, given each prediction
5. Create new groups for data based on each likelihood
6. Iterate steps 2-5 until groups converge
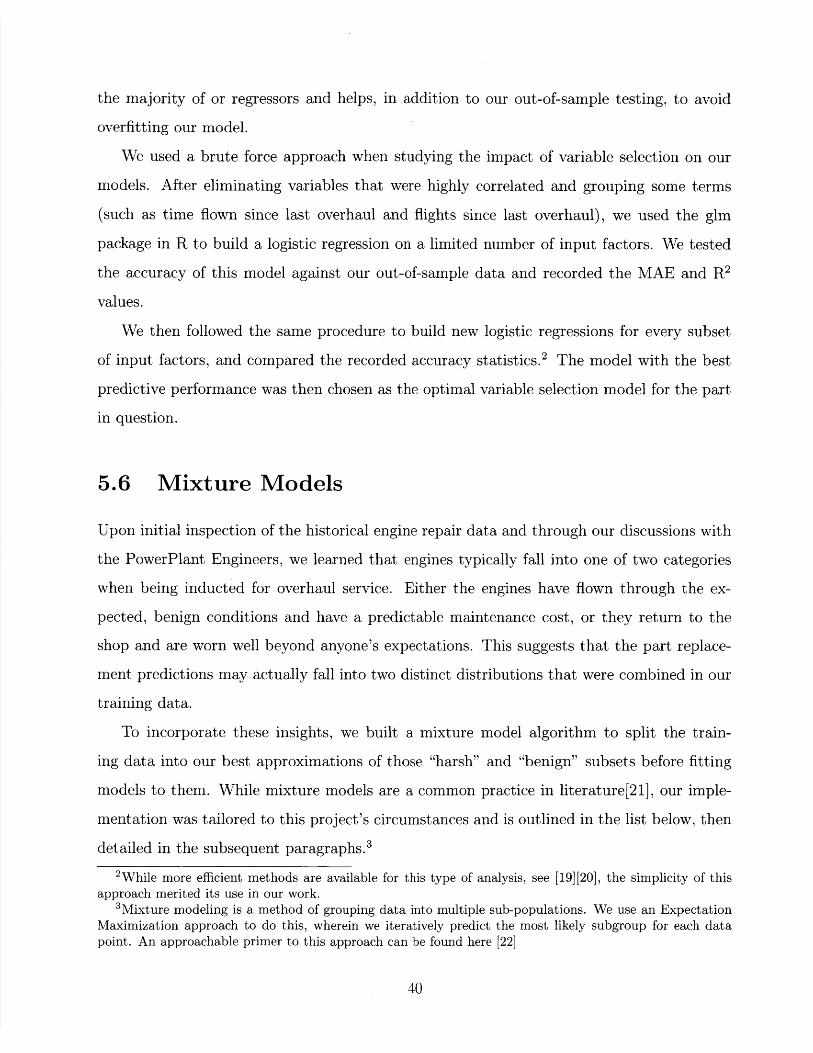
The first step in the mixture model process is to arbitrarily assign a priori definitions
of the underlying distributions. In our case, we did this by randomly splitting the training
data into two equal groups. Multiple iterations of the initial groupings were tested to ensure
that they did not influence the models' final results. Mathematically, we say the probability
of a component, ci, with replacement rate ri falling into a group, A or B, is binary:
P(ci G A) - 1, P(ci c B) = 0
After separating the data into two groups, we applied a logistic regression (as described
above) separately against each group to predict the part replacement rates against the train-
ing data. For each element of the training data, the predicted replacement rate resulting
from these models was then assumed to be the true probability of a part requiring replace-
ment under each datum's conditions. If Xi represents the input data for ci, we build logistic
regressions, LA and LB, on each group of data to predict part replacement rates, ij for each
data point:
ri,A = LA(Xi), ri,B = LB(Xi)
For each of the critical parts in our analysis, the replacement rate can simply be converted
into a binomial distribution. Each part in our models has a "units per engine" (UPE) value,
41
which describes how many of that part can be found on a V2500. When the engine undergoes
repair, the mechanics are effectively realizing how many of those parts require replacement;
this is a series of n tests (the number of parts) wherein m are successful (the number of
replacements), which is the definition of a binomial distribution. The probability density
function of a binomial distribution is:
P(x = m) ( "(l -- p)(n-m)
where p is the probability of success on any given trial.[23]
By assuming that the true replacement rate, p, is given by the initial logistic models we
built from the arbitrary subgroups, we can calculate the likelihood of realizing our training
data with either subgroup's prediction model using the binomial formula:
P(r, = fi) = )n r(l - fi)(n-nrr)
(nri)
where n is the UPE of part pi.
This provides a probability that each service event would have its replacement rate, given
that it truly belonged in either subgroup. We can then normalize the two probabilities for
each point to find a likelihood that each point falls into either group:
P(ci e A) = P(ri = ri,A), P(ci E B) = P(ri = iB)
Based on the likelihood that each point will fall into either subgroup, we can then use a
bootstrap approach to generate data sets that represent each subgroup.
After creating two new subgroups based on the proportional likelihood that each datum
belongs within it, we can then create new logistic models and repeat the process. Through
repeated iterations, we converge on a best approximation of which of the subgroups each
point in our training set belongs to. With these subgroups, we can build a classifier - another
logistic regression - to sort additional data into the subgroups based on their input factors.
To test the mixture model against the testing data, we first classify each element of the
training data into one of the subgroups, then apply that subgroup's regression model.
One challenge we faced with the mixture modeling approach was our inability to enforce
42
a clear division into two subgroups. As will be seen in the next chapter, this inability to
sort test data into an appropriate subgroup severely limits the effectiveness of our models.
To alleviate this, we also tested applying the "sortability" of our subgroups before resorting.
data in the above approach. In effect, we penalized the likelihood of a point falling into a
subgroup based on our ability to predict that the point should belong in that group. This
method slowed convergence of our algorithm and led to different predictive models, but the
results were no better than the standard mixture model.
5.7 Random Forest Models
The final predictive tool we used in our tests was random forest modeling. These models,
which we fit with the randomForest toolkit in R, begin by creating a regression tree. Given
training data, the algorithm creates a decision tree that optimally bins points based on
random selections of input features. It then repeats the process to create a "forest" of
regression trees, each s different realization of the random feature selection process. To
generate predictions, a random forest model takes the average prediction of all the component
trees.
The advantage of random forest models, as we note in Chapter 7 is that they do not rely
on a least-squares regression on linear combinations of input factors. As a result, random
forest models are adept at capturing non-linear output responses and input interaction effects
that are challenging to model with more traditional regression approaches. The primary
disadvantage of random forest models is that they do not result in a clearly-defined regression
equation that can be compared to known physical relationships between input factors and
output predictions.
43
i
Chapter 6
Results
This chapter presents the results of the models described in the previous chapter. We
explain which models were fit to the 13 trial parts and their relative performance. We then
explain how the random forest models outperform the base case and all the linear models
we tested across nearly all 143 parts under our consideration. We conclude with an analysis
of the behavior of those random forest models and assert that their predictions mirror our
expectations of how engine part replacements should relate to our model inputs.
6.1 Modeling for Trial Parts
For each of the initial, trial parts, we constructed the following models as described in 5 and
tested their predictive power:
" Mean Prediction
" Base Case Distributions
" Simple Logistic Regression
" Variable-Selection Logistic Regressions
" Two-group Mixture Model Logistic Regressions
" Random Forests
44
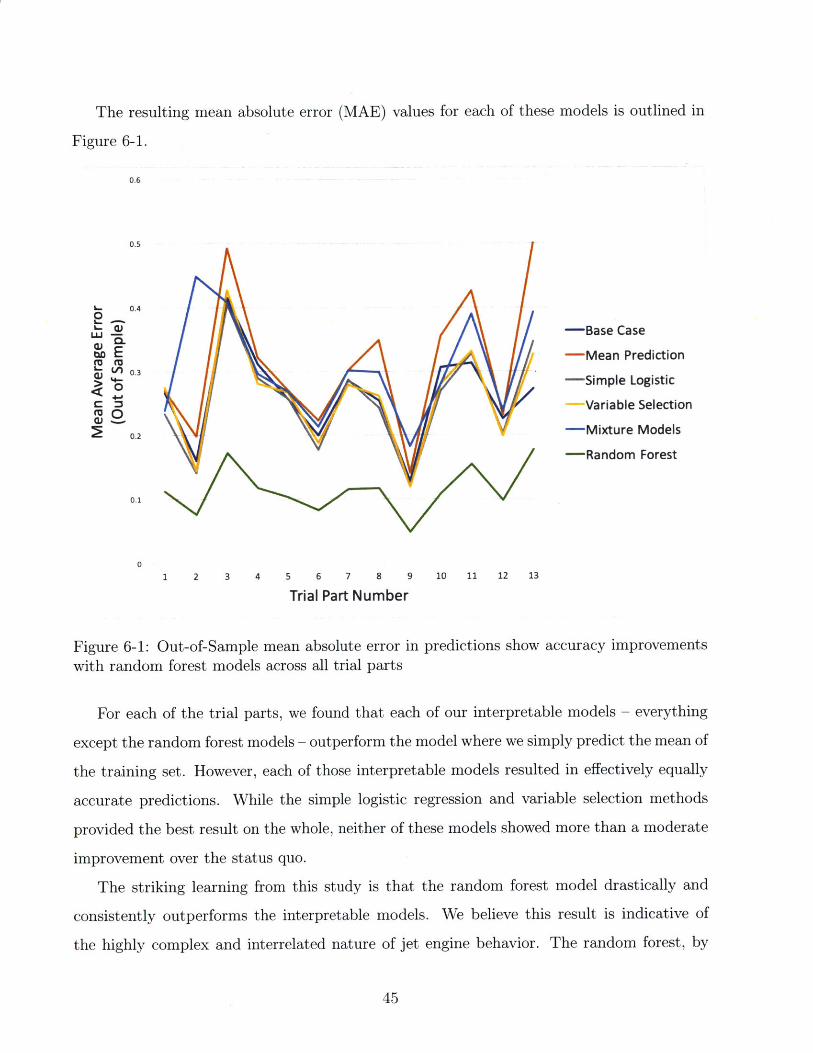
The resulting mean absolute error (MAE) values for each of these models is outlined in
Figure 6-1.
0.6
0.5
0.4
0.3
0.2
0.1
0
1 2 3 4 5 6 7 8 9 10 11 12 13
Trial Part Number
-Base Case
-Mean Prediction
-Simple Logistic
-Variable Selection
-Mixture Models
-Random Forest
Figure 6-1: Out-of-Sample mean absolute error in predictions show accuracy improvementswith random forest models across all trial parts
For each of the trial parts, we found that each of our interpretable models - everything
except the random forest models - outperform the model where we simply predict the mean of
the training set. However, each of those interpretable models resulted in effectively equally
accurate predictions. While the simple logistic regression and variable selection methods
provided the best result on the whole, neither of these models showed more than a moderate
improvement over the status quo.
The striking learning from this study is that the random forest model drastically and
consistently outperforms the interpretable models. We believe this result is indicative of
the highly complex and interrelated nature of jet engine behavior. The random forest, by
45
L.
L- e
ab E0
0)
its very nature, captures the nonlinear and interaction effects that best predict replacement
rates, and its superior performance suggests that these effects greatly drive engine wear.
Pratt & Whitney, by corporate policy, strongly favors the use of interpretable methods in
its statistical models. In our project scoping, this precluded the recommendation of models
like the random forest, which we included as an estimate of a bound on the improvements
available through the incorporation of interaction effects. However, because of the consistent
and noteworthy improvement in accuracy this model provides, we elected to include it in
our trials of the full range of parts that are included in the suite of replacement models.
6.2 A note on Mixture Models
A noteworthy aspect of these trial part tests is relative underperformance of the mixture
models in predicting part replacements. Despite our initial interviews suggesting that engines
fall into multiple categories that could be used to group their repair needs, these subgroups
did not emerge through the expectation maximization algorithm.
Upon studying the groupings of the expectation maximization algorithm, we learned that
our approach failed to produce replicable groupings. The model converged on subgroups in
the training case that were sufficiently predictable - particularly when a grouping penalty
term was included - but the classification algorithm easily over fit to the training data in
doing so. As a result, applying the same grouping approach to the testing set was ineffective
and effectively random. This randomized application of a prediction algorithm to the data
led to the inferior predictions.
6.3 Modeling for All Parts
We chose to continue studying the variable selection models as well as the random forest
model against all 143 parts because those models had the lowest average MAE in their
predictions. In comparing these models against the base case, we wanted to verify that the
prediction improvements we observed for the 13 trial parts, small though they were with
logistic models, were mimicked across the full set of 143 parts.
46
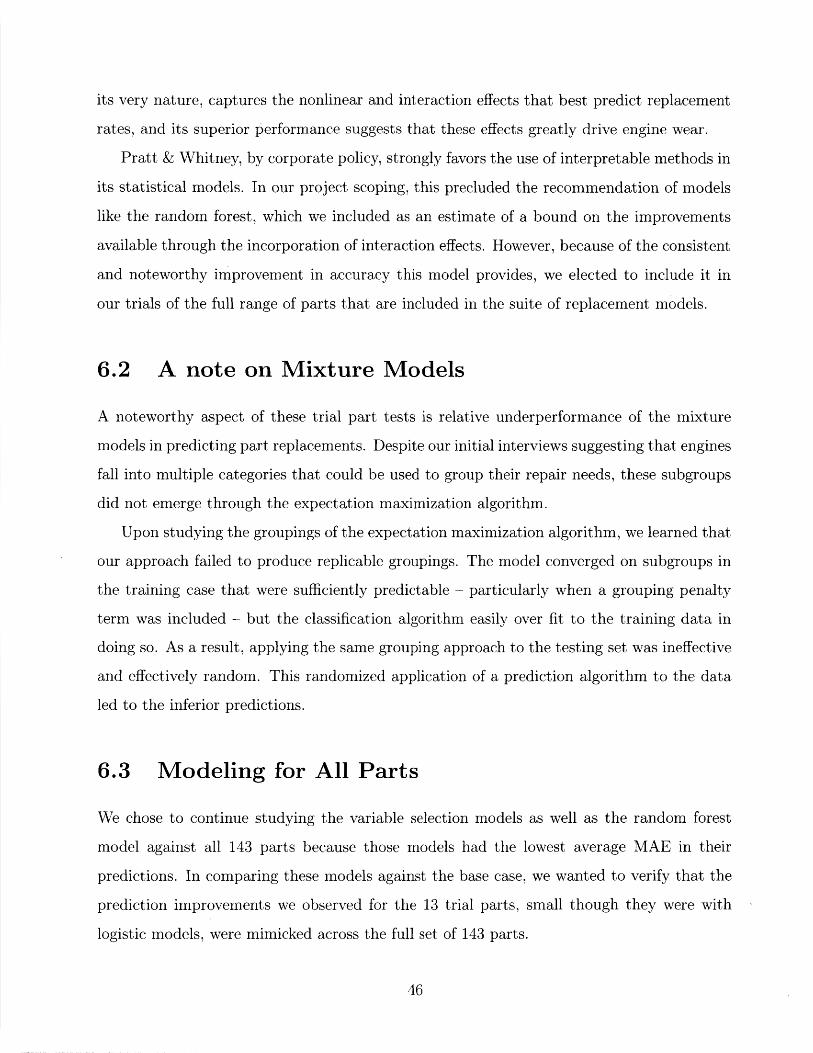
Using the same training and test data as in the trial parts, we followed the same approach
to fit predictive models to the remaining 130 parts in the Engine Services cost model. The
results from the trial case were consistent across the full set of parts, as seen in Figures 6-2,
6-3.1
MAE Improvements of Random Forest Model over Logistic Models
In
I II I
0 20 40 60 80 100
Percent Improvement
Figure 6-2: Percent improvement of Random Forest Models over Logistic Regressions across
all 143 parts
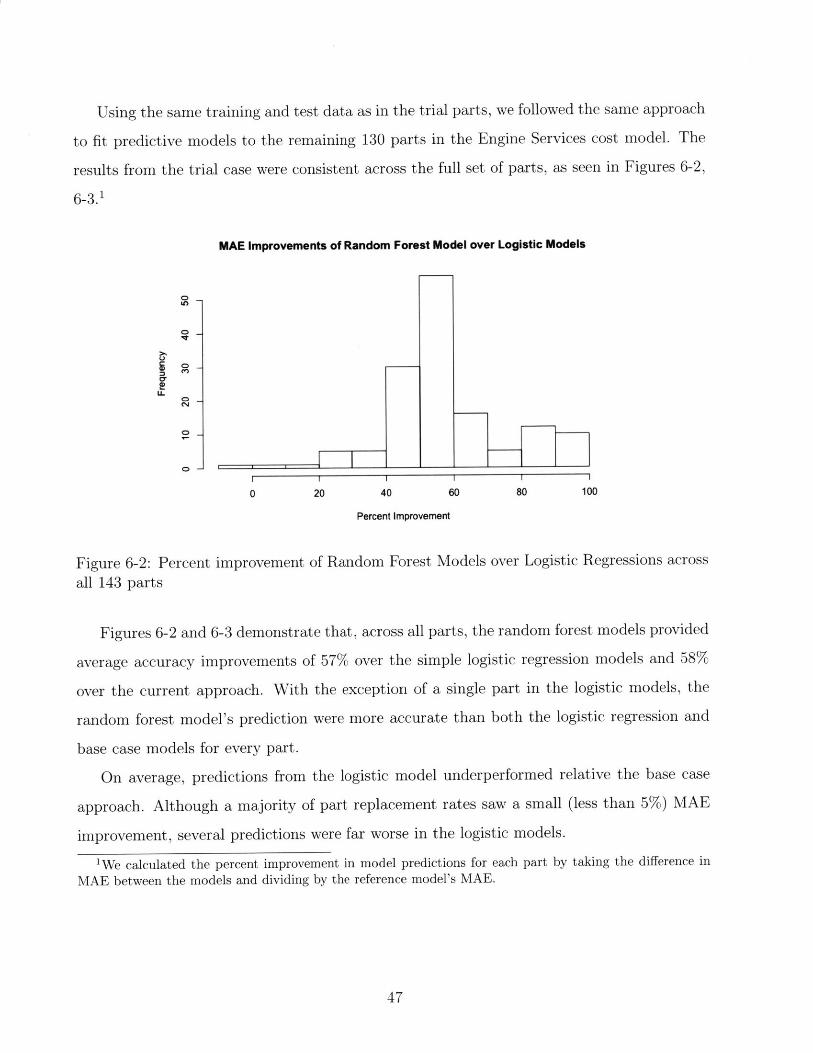
Figures 6-2 and 6-3 demonstrate that, across all parts, the random forest models provided
average accuracy improvements of 57% over the simple logistic regression models and 58%
over the current approach. With the exception of a single part in the logistic models, the
random forest model's prediction were more accurate than both the logistic regression and
base case models for every part.
On average, predictions from the logistic model underperformed relative the base case
approach. Although a majority of part replacement rates saw a small (less than 5%) MAE
improvement, several predictions were far worse in the logistic models.
'We calculated the percent improvement in model predictions for each part by taking the difference in
MAE between the models and dividing by the reference model's MAE.
47
MAE Improvements of Random Forest Model over Base Case Models
0-
0
U
I I I I I I I I
30 40 50 60 70 80 90 100
Percent Improvement
Figure 6-3: Percent improvement of Random Forest Model over Base Case Models across all143 parts
6.4 Partial Dependence Plot Analysis
We suspect that the primary reason the random forest models outperformed all other tests
for these scrap rate predictions is that they capture the inherent complexity and interplay
between engine components. This interplay challenges our assumption of independence in
examining the part wear, which is counteracted by the nonlinear nature of random forest
models.
However, the fact that random forests are, by their very nature, uninterpretable - or at
least less so than the other models we considered - our stakeholders at Pratt & Whitney
place a higher threshold on ensuring that the models are not overfit to the training data. To
further study this phenomenon, we considered partial dependence plots for our trial parts.
Partial dependence plots allow us to approximately isolate the effect of changing regres-
sors in our models. After selecting a factor to study, the average regression response for each
point in that factor's domain can be found and plotted. This produces an approximation of
the marginal impact that the chosen factor has on a model's output.[24]
When studying the partial dependence plots, we considered three factors that affect our
part replacement predictions for which we have clear expectations on how they drive part
48

replacement rates.
The first of these factors is the cycles since previous overhaul of the engine. With the
understanding that, under otherwise constant conditions, the wear of engine components do
not reverse over time, we can expect that increasing the number of cycles will also increase
the part replacement rates.
However, we must also take into account the fact that some parts wear slowly over time,
and only exhibit high replacement rates when extraneous factors or unlikely events cause
them to fail. For these parts, which we expect to be stationary on the engine, most likely
outside of the gas path, increasing cycles since previous overhaul is likely to decrease the
probability that the part needs to be replaced. This would occur because in those long-run
shop visits, some other part reached the end of its serviceable life and forced the engine to
undergo repairs.
The second driver of engine repair that we considered for this partial dependence analysis
is the average exhaust gas temperature of the engine. As an engine is used, we expect the
exhaust gas temperature (EGT) to increase, which suggests that engines with higher EGT
have been in service longer. Similar to cycles since the last overhaul, we expect increases in
EGT to cause commensurate increases in part replacements.
The third driver we examined was the presence of aerosols in the region where the engines
were in use. In our considerations, we approximated overall aerosol presence as the Al
measurement from the NASA dataset. As discussed in the background section of this thesis,
higher aerosols - and airborne particulate matter, by proxy - drive more wear on the engine's
components, particularly those within the engine's gas path.
Our study of how these factors affect part replacements for these parts surfaced no serious
concerns about the behavior of the random forest models mirroring physics-based behavior.
When considered in the light of the marked improvements in out-of-sample prediction accu-
racy that these models provide, we deem the random forest models the most appropriate for
further study. We show an example of this analysis for one trial part below, and the partial
dependence behavior for these factors on all trial parts can be found in Appendix A
Figure 6-4 shows partial dependence plots for our ninth trial part, which is located in the
high pressure turbine (HPT) module of the engine.
49
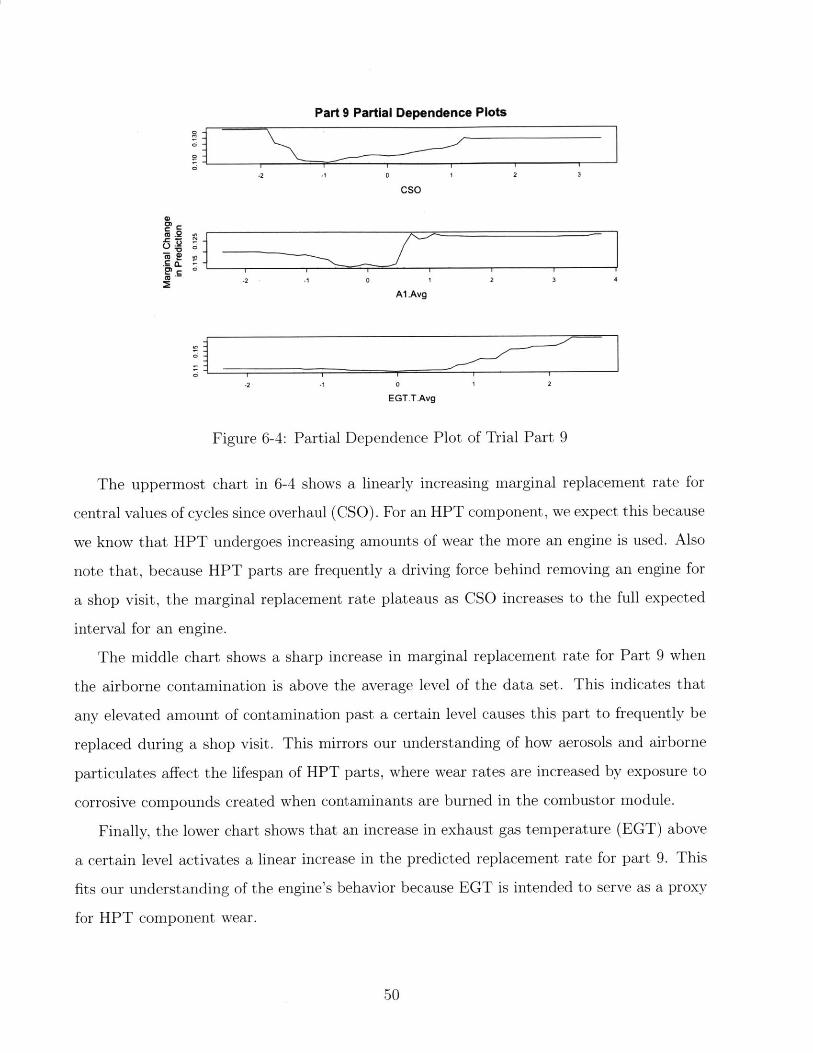
CM
2ccL) a C
Part 9 Partial Dependence Plots
-2 -I 0 1 2 3
CSO
-2 -1 o 1 2 3 4
Al.Avg
-2 -1 0 1 2
EGT.T.Avg
Figure 6-4: Partial Dependence Plot of Trial Part 9
The uppermost chart in 6-4 shows a linearly increasing marginal replacement rate for
central values of cycles since overhaul (CSO). For an HPT component, we expect this because
we know that HPT undergoes increasing amounts of wear the more an engine is used. Also
note that, because HPT parts are frequently a driving force behind removing an engine for
a shop visit, the marginal replacement rate plateaus as CSO increases to the full expected
interval for an engine.
The middle chart shows a sharp increase in marginal replacement rate for Part 9 when
the airborne contamination is above the average level of the data set. This indicates that
any elevated amount of contamination past a certain level causes this part to frequently be
replaced during a shop visit. This mirrors our understanding of how aerosols and airborne
particulates affect the lifespan of HPT parts, where wear rates are increased by exposure to
corrosive compounds created when contaminants are burned in the combustor module.
Finally, the lower chart shows that an increase in exhaust gas temperature (EGT) above
a certain level activates a linear increase in the predicted replacement rate for part 9. This
fits our understanding of the engine's behavior because EGT is intended to serve as a proxy
for HPT component wear.
50
Chapter 7
Business Implications
This chapter presents the business implications of implementing random forest models in
Pratt & Whitney's part replacement rate prediction workflow. We expand upon the previous
chapter's discussion on the uninterpretability of random forest models to address Pratt &
Whitney's primary arguments against nonlinear models. We also discuss the implications
that improved part replacement predictions could have on other areas of Pratt & Whitney's
supply chain.
7.1 Uninterpretable Models
Owing to the direct role these part replacement models play in the financial reporting of
Pratt & Whitney's contract performance, the organization understandably has an established
practice of only using interpretable models. However, our results suggest that the benefits
of a more sophisticated, yet uninterpretable, model may be sufficient to merit a relaxation
of this policy.
In our conversations with data analysts at Pratt & Whitney, two themes emerged in the
description of why interpretable models were a necessity. We discuss these themes below.
51
7.1.1 Management Buy-in
The first of these themes is that interpretable models encourage management buy-in to
implementing new models because the observable coefficients of known cost drivers can be
easily confirmed as consistent with the physical drivers of engine wear. For example, if Pratt
& Whitney's engineers are aware that increased time on wing (TOW) and hotter flight
conditions accelerate the deterioration of engine components, it is reassuring to see that the
coefficients in a regression model are consistent with that background knowledge.
However, as we saw in the previous section, partial dependence plots show that the
behavior of our random forest models are consistent with the anticipated physical interpre-
tations. This consistency, when explained carefully to upper level stakeholders in the light of
the drastic improvements in accuracy, can make a powerful argument for at least furthering
tests of the random forest models.
7.1.2 Directing Cost Reduction Programs
The second reason cited for Pratt & Whitney's widespread use of interpretable models is
the notion that the relative magnitude of coefficients in the regression models can be used
to direct cost reduction strategies. When Pratt & Whitney's fleet managers and powerplant
engineers observe trends in maintenance needs among certain fleets of engines, or across fleets
operating under similar conditions, they initiate cost reduction programs, called "Lifetime
Contract Cost Optimizations" (LCCOs), to adjust maintenance policies and mitigate those
costs.
One method stakeholders cite for identifying the potential benefits of these LCCOs is
through an examination of the observable factors in the current cost models. However, we
argue that this analysis is secondary to the primary driver of LCCO efforts, namely the first
hand experience of powerplant managers studying a fleet's maintenance needs. It seems more
likely, and is confirmed from our discussions with stakeholders, that correlated issues with
fleets are primarily observed anecdotally first. We argue that these ex post quantifications
and validations of the potential benefits from LCCO efforts are still achievable, if less directly,
through the use of random forest models.
52
7.2 Improved Part Replacement Forecasts
As mentioned in Chapter 4, an additional benefit of improving part replacement predictions
for the V2500 engines is that these improvements could lead into a more streamlined supply
chain for the creation and acquisition of these parts. By directly predicting how many
parts will be needed to maintain the serviceability of all fleets under V2500 FHAs, Pratt &
Whitney can feed those component requirements to the supply chain organization.
Furthermore, as these models are refined, they may be applicable to engines outside of
FHA contracts, the aftermarket component business for which Pratt & Whitney regularly
competes. Although there is less visibility into the usage statistics, conditions, and repair
needs of these engines, we believe that the models proposed here could be used to produce
bounds on the total, worldwide replacement part market for V2500 engines. If incorporated
into the forecasting models already in use for these component requirements, Pratt & Whit-
ney could improve its ability to maintain sufficient, but not excessive, levels of inventory to
service these engines through the remainder of their useful life.
53
Chapter 8
Recommendations and Future Work
8.1 Recommendations
We recommend that Pratt & Whitney's Engine Services group seriously consider the re-
laxation of its longstanding requirements to use interpretable models in its estimate at
completion (EAC) forecasting. Our results show that the potential improvements in pre-
dictive ability enabled by more sophisticated models, such as random forests, far outweigh
the organizational challenges of implementing such a model.
This consideration should consist of two parallel tracks. The first is a study of the impact
these models could have on the EAC process, which is a standard step in the implementation
of a new organization at Pratt & Whitney. Because of the the time-intensive nature of these
studies, both in man-hours and in allowing enough time to collect a sufficient fresh dataset,
this inquiry should begin as soon as is feasible, lest it not be validated in time for the next
year's financial reporting.
The second track of the implementation plan for these algorithms is the consideration of
how best to incorporate them in existing workflows. Pratt & Whitney's analytical infras-
tructure is a complex web of algorithms and interfaces, and the challenge of implementing
such a fundamental change in modeling strategy should not be overlooked.
54
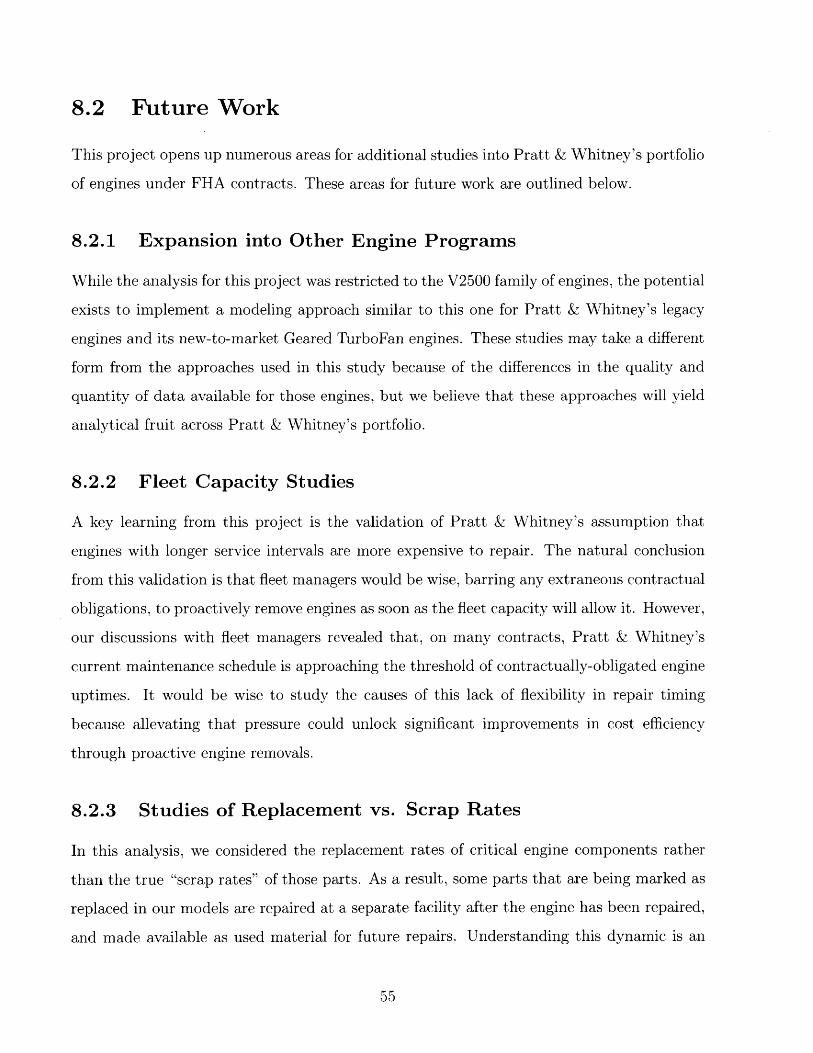
8.2 Future Work
This project opens up numerous areas for additional studies into Pratt & Whitney's portfolio
of engines under FHA contracts. These areas for future work are outlined below.
8.2.1 Expansion into Other Engine Programs
While the analysis for this project was restricted to the V2500 family of engines, the potential
exists to implement a modeling approach similar to this one for Pratt & Whitney's legacy
engines and its new-to-market Geared TurboFan engines. These studies may take a different
form from the approaches used in this study because of the differences in the quality and
quantity of data available for those engines, but we believe that these approaches will yield
analytical fruit across Pratt & Whitney's portfolio.
8.2.2 Fleet Capacity Studies
A key learning from this project is the validation of Pratt & Whitney's assumption that
engines with longer service intervals are more expensive to repair. The natural conclusion
from this validation is that fleet managers would be wise, barring any extraneous contractual
obligations, to proactively remove engines as soon as the fleet capacity will allow it. However,
our discussions with fleet managers revealed that, on many contracts, Pratt & Whitney's
current maintenance schedule is approaching the threshold of contractually-obligated engine
uptimes. It would be wise to study the causes of this lack of flexibility in repair timing
because allevating that pressure could unlock significant improvements in cost efficiency
through proactive engine removals.
8.2.3 Studies of Replacement vs. Scrap Rates
In this analysis, we considered the replacement rates of critical engine components rather
than the true "scrap rates" of those parts. As a result, some parts that are being marked as
replaced in our models are repaired at a separate facility after the engine has been repaired,
and made available as used material for future repairs. Understanding this dynamic is an
55
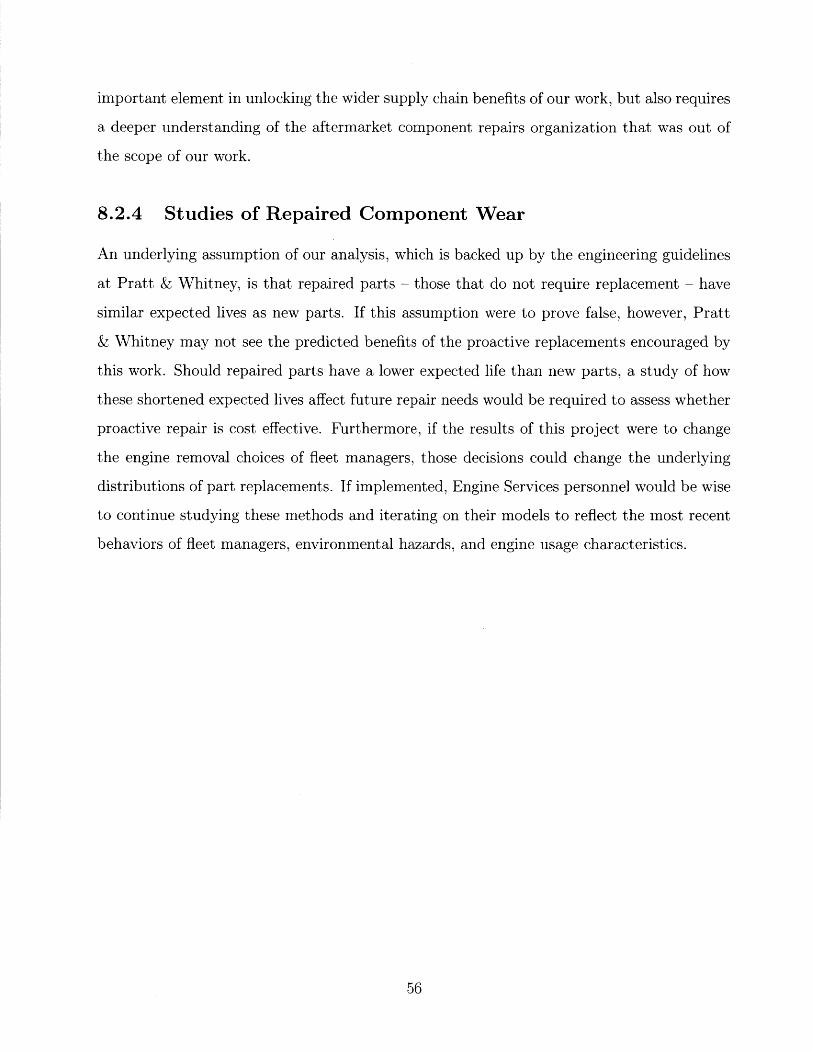
important element in unlocking the wider supply chain benefits of our work, but also requires
a deeper understanding of the aftermarket component repairs organization that was out of
the scope of our work.
8.2.4 Studies of Repaired Component Wear
An underlying assumption of our analysis, which is backed up by the engineering guidelines
at Pratt & Whitney, is that repaired parts - those that do not require replacement - have
similar expected lives as new parts. If this assumption were to prove false, however, Pratt
& Whitney may not see the predicted benefits of the proactive replacements encouraged by
this work. Should repaired parts have a lower expected life than new parts, a study of how
these shortened expected lives affect future repair needs would be required to assess whether
proactive repair is cost effective. Furthermore, if the results of this project were to change
the engine removal choices of fleet managers, those decisions could change the underlying
distributions of part replacements. If implemented, Engine Services personnel would be wise
to continue studying these methods and iterating on their models to reflect the most recent
behaviors of fleet managers, environmental hazards, and engine usage characteristics.
56

Appendix A
Behavior of Random Forest Models
We examined partial dependence plots to verify the behavior of our random forest models
with respect to key drivers of engine component wear. If these model inputs affect the
predicted values of part replacement rates as we expect they would, stakeholders at Pratt &
Whitney can apply these models with confidence, despite their inherent uninterpretability.
It should be noted that a key advantage of the random forest models is that they capture
nonlinearities that would be difficult to capture in a more interpretable model. As a result,
we do not expect these partial dependence plots to be entirely explicable. This analysis is
intended as a qualitative exercise, wherein the primary motivator for the implementation of
the random forest models is their superior performance over the other approaches we studied.
57
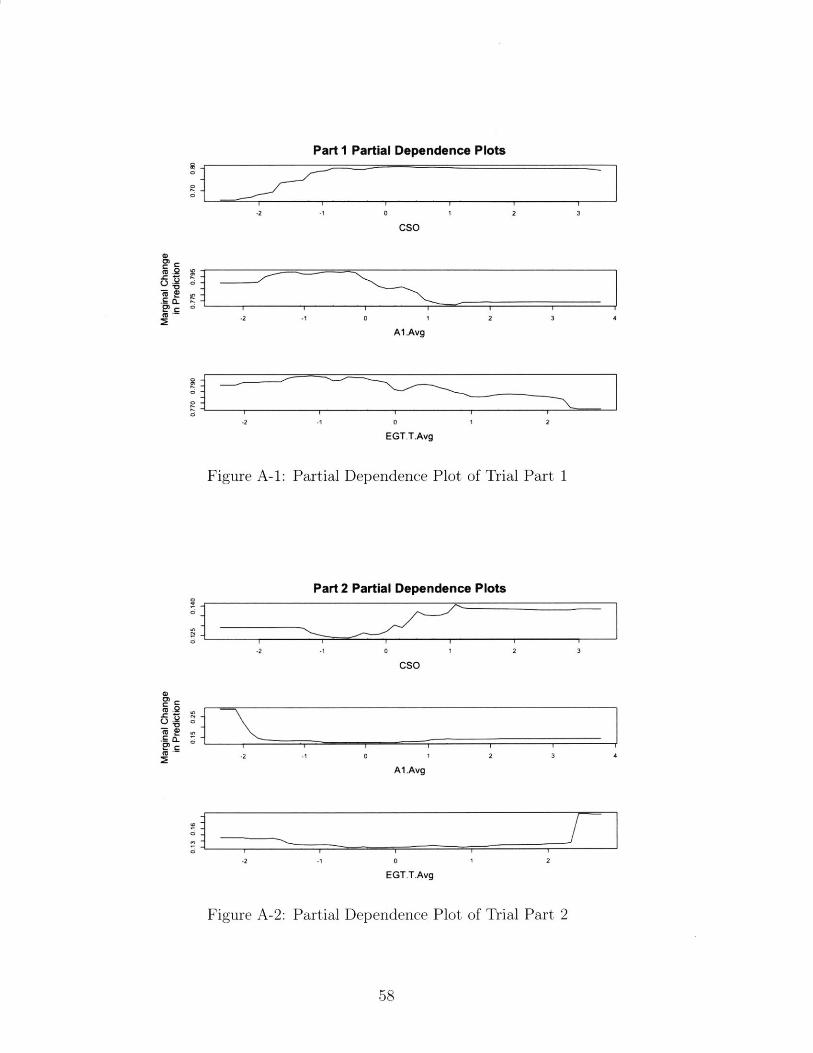
C
-2 -1 0 1 2 3
cso
-2 -1 0 1 2 3 4
Al.Avg
-2 -1 0 1 2
EGT.T.Avg
Figure A-2: Partial Dependence Plot of Trial Part 2
58
Part I Partial Dependence Plots
-2 -1 0 1 2 3
CSO
-2 -1 0 1 2 3 4
A1.Avg
-2 -1 0 1 2
EGT.T.Avg
Figure A-1: Partial Dependence Plot of Trial Part 1
Part 2 Partial Dependence Plots
10IC
V0C
C
I40
euCi
w
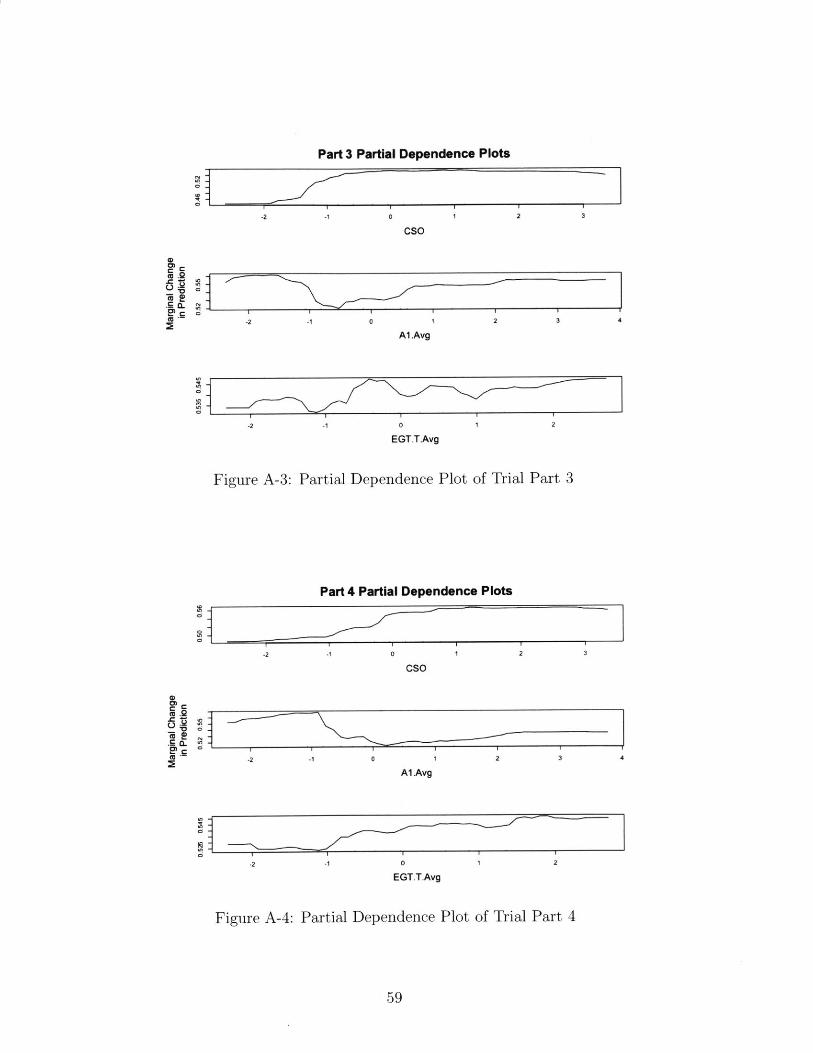
Part 3 Partial Dependence Plots
I I II11
-2 -1 0 1 2 3
CSO
-2 -1 0 1 2 3 4
Al.Avg
-2 -1 1 2
EGT.TAvg
Figure A-3: Partial Dependence Plot of Trial Part 3
Part 4 Partial Dependence Plots
-2 -I 0 1 2 3
CSO
-2 -1 0 1 2 3 4
A1.Avg
-2 -1 2
EGT.T.Avg
Figure A-4: Partial Dependence Plot of Trial Part 4
59
0-i
2
Lva
cc-
C
C
C
0
0
0o. u-3
1~
Ci
S
0
I
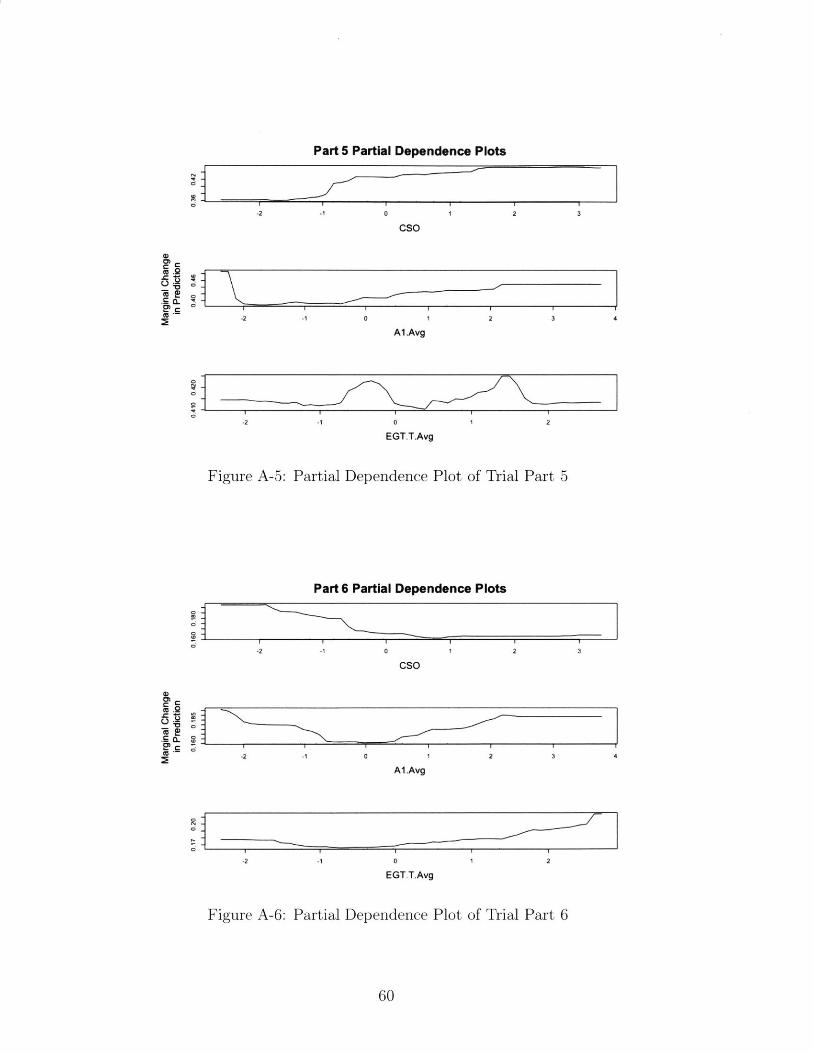
Part 5 Partial Dependence Plots
0-I
I0
0.Cjb.;a.
-2 -l 0 1 2 3
CSO
-2 -1 0 1 2 3 4
A1.Avg
II-2 -1 0 1 2
EGT.T.Avg
Figure A-5: Partial Dependence Plot of Trial Part 5
Part 6 Partial Dependence Plots
0]
-46
-2 -1 0 1 2 3
CSO
-2 -1 0 I 2 3 4
A1.Avg
-2 -1
EGT.T.Avg
Figure A-6: Partial Dependence Plot of Trial Part 6
60
4)
r .C
V;oe1
(U
C
I
0
2
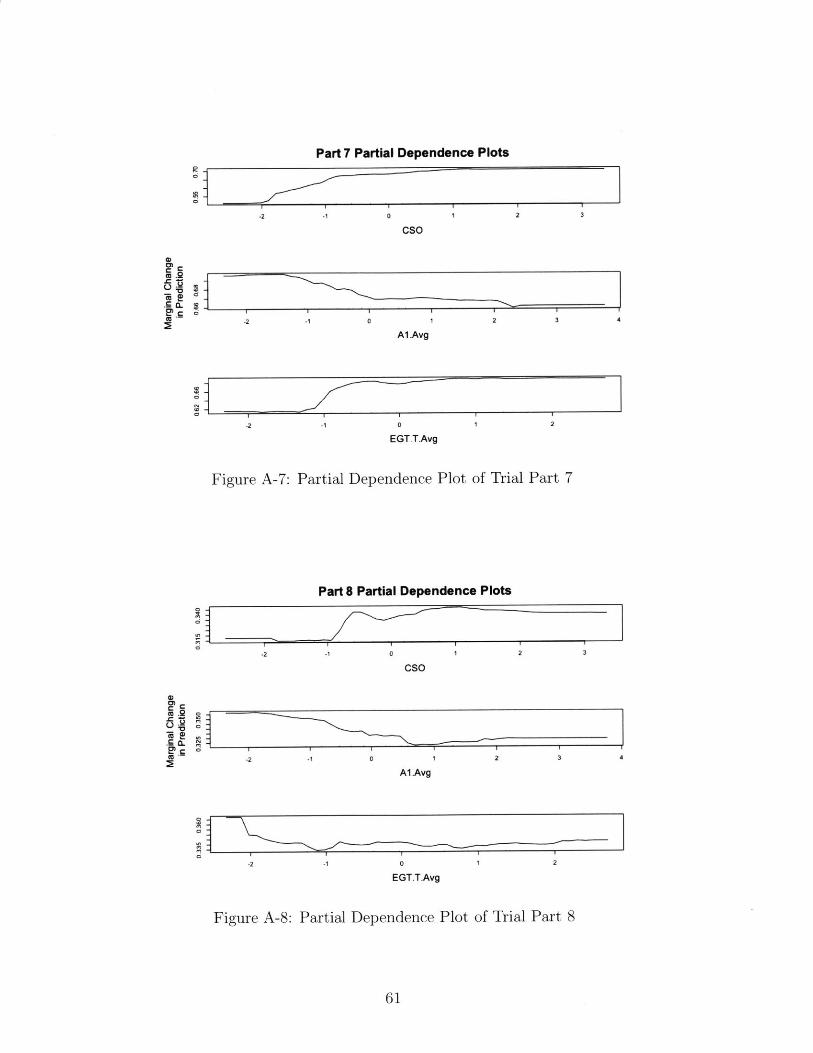
-2 -1 0 1 2 3
cso
-2 -1 0 1 2 3 4
Al.Avg
-2 2
EGT.T.Avg
Figure A-8: Partial Dependence Plot of Trial Part 8
61
0
Cu
a
I
0
0
*2
0
Part 7 Partial Dependence Plots
-2 -1 0 1 2 3
cso
Al.Avg
-2 -1 0 1 2
EGT.T.Avg
Figure A-7: Partial Dependence Plot of Trial Part 7
Part 8 Partial Dependence Plots
Ci
InM
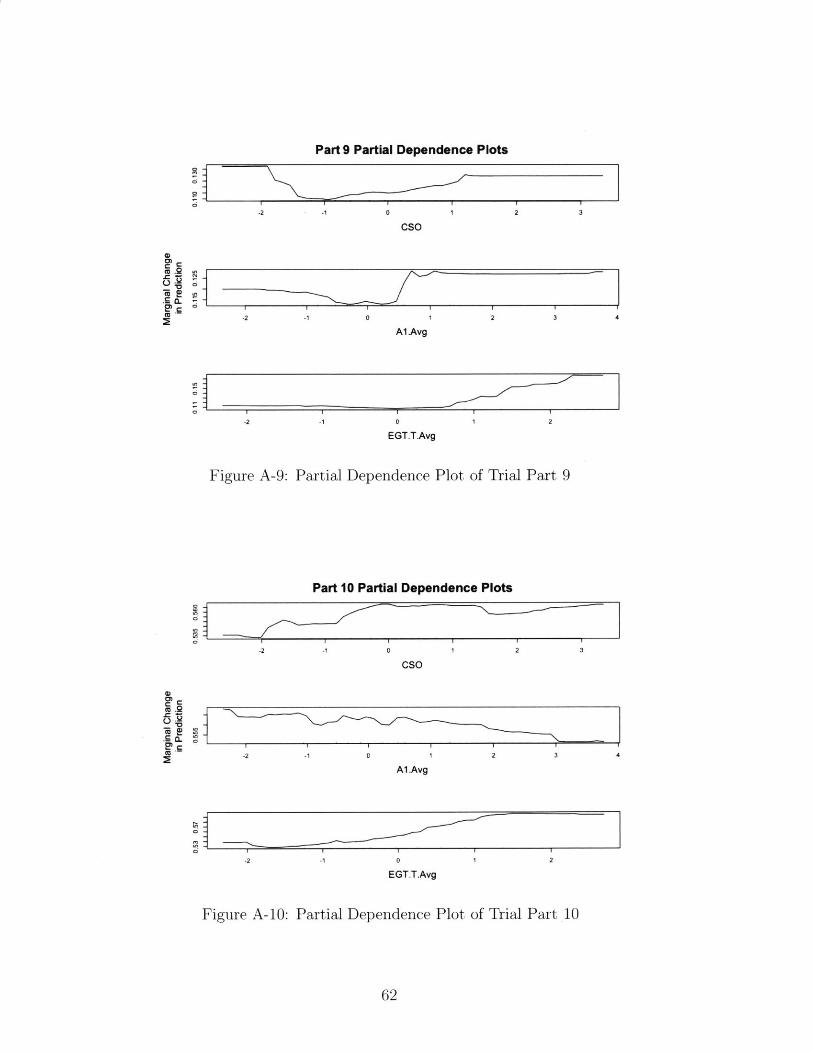
9
-2 -1 0 I 2 3
CSO
-2 -1 0 1 2 3 4
Al.Avg
-2 -1 0 1 2
EGT.T.Avg
Figure A-10: Partial Dependence Plot of Trial Part 10
62
Part 9 Partial Dependence Plots
-2 - -1 0 1 2 3
CSO
A1.Avg
-2 -1 0 1 2
EGT.T.Avg
Figure A-9: Partial Dependence Plot of Trial Part 9
Part 10 Partial Dependence Plots
CD01
32a
e
Ic
2
C
C
C
13C
C
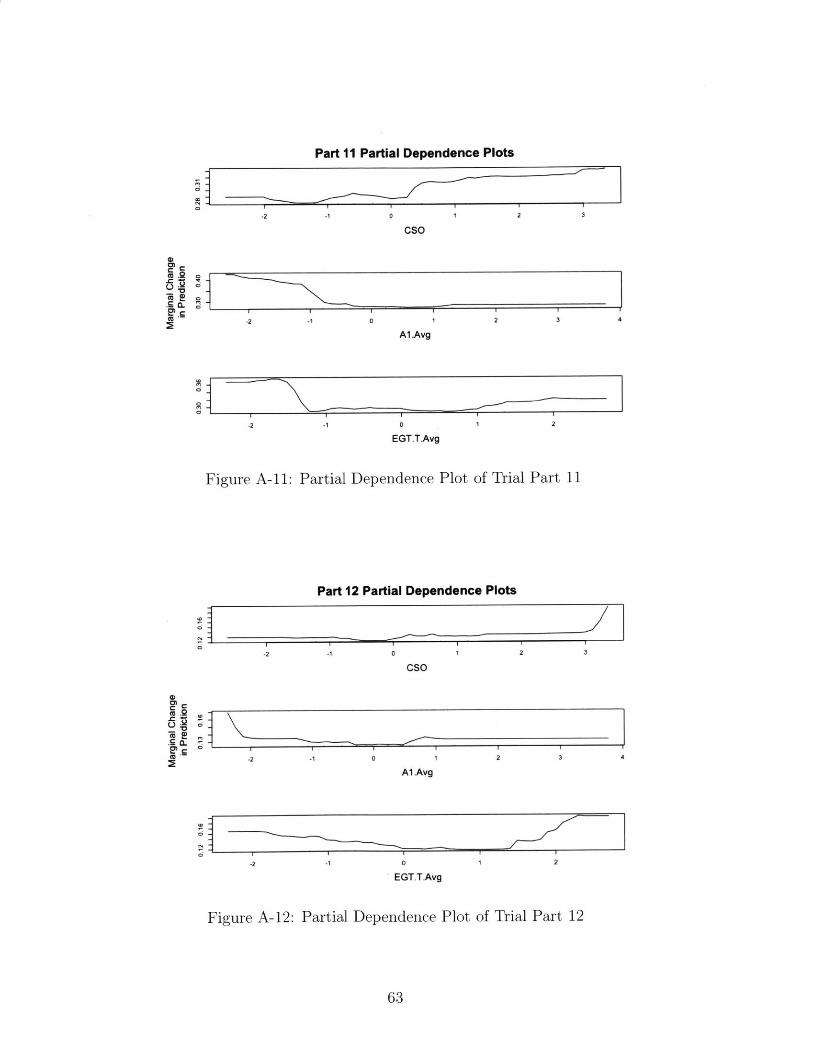
Part 11 Partial Dependence Plots
r
0.2
0.
0
o C~L)
C
-2 -1 0 I 2 3
cso
A1.Avg
C I 1
-2 -1 0 1 2
EGT.T.Avg
Figure A-11: Partial Dependence Plot of Trial Part 11
Part 12 Partial Dependence Plots
cso
Ci
-2 -1 0 1 2 3 4
A1.Avg
C
-2 -1 0 1 2
EGT.T.Avg
Figure A-12: Partial Dependence Plot of Trial Part 12
63
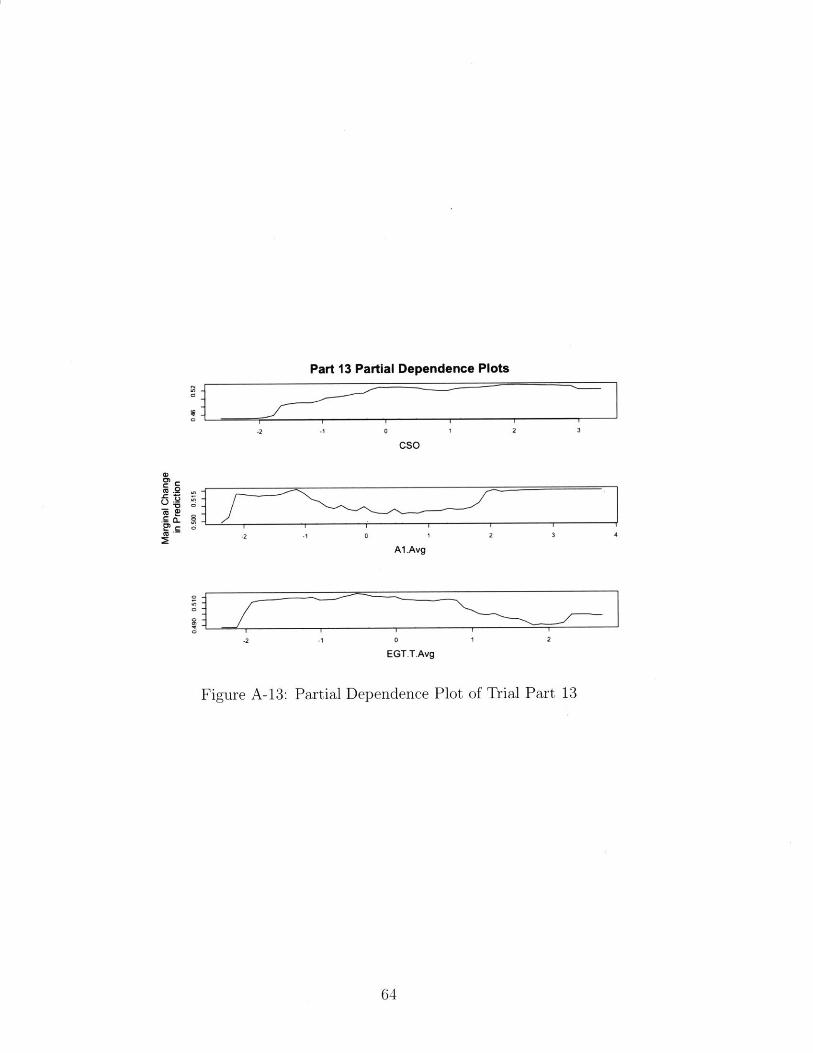
Part 13 Partial Dependence Plots
-2 -1 0 1 2 3
CSO
AA
.-
Al Avg
0
-2 -1 0
EGT.T.Avg
Figure A-13: Partial Dependence Plot of Trial Part 13
64
Bibliography
[1] International Aero Engines. V2500 - Engine of Choice, June 2016. Product Card forthe V2500 Engine Family.
[2] Richard Deluca. The Early Years of the Pratt and Whitney Aircraft Company, Dec2016. https://connecticuthistory.org/the-early-years-of-the-pratt-and-whitney-aircraft-company/.
[3] United Technologies Corporation. United Technologies 2018 Annual Report, January2019.
[4] International Aero Engines. IAE Celebrates 30 Years of Superior Technology, March2013. http://i-a-e.com/news47.html.
[5] Pratt and Whitney Corp. Pratt & Whitney Becomes Majority Program Shareholder inIAE: Closes on Deal to Purchase Rolls-Royce Program Share in the JAE Collaboration,July 2012. https://www.prnewswire.com/news-releases/pratt-whitney-becomes-majority-program-shareholder-in-iae-closes-on-deal-to-purchase-rolls-royce-program-share-in-the-iae-collaboration- 161779825.html.
[6] International Aero Engines. V2500A5 SelectOne Engine, 2019. http://i-a-e.com/productsv2500.html.
[7] International Aero Engines. V2500A5 Select Two Engine, 2019. http://i-a-e.com/selecttwo.html.
[8] A.F. El-Sayed. Aircraft Propulsion and Gas Turbine Engines. CRC Press, Boca Raton,Florida, 2017.
[9] NASA Glenn Research Center. Turbofan Thrust, 2015.https://www.grc.nasa.gov/www/k-12/airplane/turbfan.html.
[10] P. M. Sforza. Theory of Aerospace Propulsion. Butterworth-Heinemann, Waltham,Massachusetts, 2012. Chapter 3.
[11] NASA Glenn Research Center. Ideal Brayton Cycle, 2015.https://www.grc.nasa.gov/www/k-12/airplane/brayton.html.
[12] D. Roberson. Application of multiple information sources to prediction of engine timeon-wing. Master's project, Massachusetts Institute of Technology, Leaders for GlobalOperations, June 2015.
65
[13] H. Canaday. Flight-Hour Support For Leasing?, December 2015. https://www.mro-network.com/maintenance-repair-overhaul/flight-hour-support-leasing.
[14] NASA Jet Propulsion Laboratory. MISR: Multi-angle Imaging SpectroRadiometer, 2018.https://www-misr.jpl.nasa.gov/Mission/missionlntroduction/.
[15] NASA Deep Blue Team. How Aerosols are Measured: The Science of Deep Blue, 2019.https://deepblue.gsfc.nasa.gov/science#deepblue.
[16] Sean R. Eddy. What is bayesian statistics? Nature Biotechnology, 22(9):1177-178, 092004.
[17] P. Burkner. Bayesian Regression Models using Stan, March 2019. https://cran.r-project.org/web/packages/brms/brms.pdf.
[18] STAN Development Team. Stan Reference Manual, 2019. https://mc-stan.org/docs/2_19/reference-manual-2_19.pdf.
[19] Martin Wainwright Tibshirani, Robert and Trevor Hastie. Statistical learning withsparsity: the lasso and generalizations. Chapman and Hall/CRC, 2015.
[20] Hussein Hazimeh and Rahul Mazumder. Fast best subset selection: Coordinate de-scent and local combinatorial optimization algorithms. 05 2018. arXiv preprintarXiv: 1803.01454.
[21] Qingqing Huang. Efficient algorithms for learning mixture models. PhD thesis, Mas-sachusetts Institute of Technology, 2004.
[22] Jeff A. Blimes. A Gentle Tutorial of the EM Algorithm and its Application to Param-eter Estimation for Gaussian Mixture and Hidden Markov Models, 1998. http://www-prima.imag.fr/jlc/Courses/2005/ENSI2. SIRR/EM-tutorial.pdf.
[23] Runger G Montgomery, D and N. Hubele. Engineering Statistics. Wiley, Danvers,Massachusetts, 2011. Chapter 3.
[24] Christoph Molnar. Interpretable Machine Learning, 2019.https://christophm.github.io/interpretable-ml-book/pdp.html.
66
Related Documents